about community action assessment book march... · about community action the economic opportunity...
TRANSCRIPT
About Community Action The Economic Opportunity Act of 1964 (EOA) established over 1,000 Community Action Agencies (CAAs) at
the local level to implement EOA programs. EOA programs included: VISTA (Volunteers In Service To
America); Job Corps; Neighborhood Youth Corps; Head Start; Adult Basic Education; Family Planning;
Community Health Centers; Congregate Meal Preparation; Economic Development; Foster Grandparents;
Legal Services; Neighborhood Centers; Summer Youth Programs; Senior Centers; and others.
CAAs vary widely, with some being non-profit groups, others being city agencies, and some being
community-controlled groups. Many CAAs vary greatly in how their agencies are organized and in the type
of services they provide to their local communities. In fact, the number of CAAs has increased and it is now
estimated that CAAs serve over 80 percent of all U.S. counties. Although CAAs were established over 40
years ago, they have a rich history of advocacy for and service to low-income people and remain important
in domestic social policy to the present day.
About the Indiana Community Action Network In Indiana, there are 23 Community Action Agencies (CAAs) that serve all 92 counties of Indiana and
comprise the Indiana Community Action Network. CAAs periodically analyzes community needs to identify
strategies that will work best in attacking poverty. Each CAA is distinct because its programs reflect the
needs of their local communities. These agencies are unique in their ability to deploy diverse program
activities and services in meeting their mission.
CAAs operate an array of programs which include, but are not limited to: Head Start, Energy Assistance
Program, Weatherization Assistance Program, Homeownership Counseling, Owner Occupied Rehabilitation,
Housing Development, Foster Grandparents, Child Care, Individual Development Accounts, and many more
programs and services. To find your local CAA or to learn more about the Indiana Community Action
Network, please visit www.incap.org.
About the Indiana Community Action Association The Indiana Community Action Association, Inc. (IN-CAA) is a statewide not-for-profit membership
corporation, incorporated in the State of Indiana in 1970. IN-CAA’s members are comprised of Indiana’s 23
Community Action Agencies (CAAs), which serve all of Indiana’s 92 counties. IN-CAA envisions a state with
limited or no poverty, where its residents have decent, safe, and sanitary living conditions, and where
resources are available to help low-income individuals attain self-sufficiency.
IN-CAA serves as an advocate and facilitator of policy, planning and programs to create solutions and share
responsibility as leaders in the war against poverty. Therefore, it is IN-CAA’s mission to help the state’s
CAAs address the conditions of poverty through: training and technical assistance; developing models for
service delivery; and providing resources to help increase Network capacity. The functions of IN-CAA
include dissemination of information throughout the Indiana Community Action Network, the delivery of
services in areas where local operators have not been available, the development of training programs that
are seen as viable, implementation of practices that are best delivered by a central agency, and other
functions that are agreed upon by the Board of Directors. To learn more about IN-CAA, please visit
www.incap.org.

Acknowledgements The Indiana Community Action Association, Inc. (IN-CAA) would like to thank the following groups and individuals for their support and participation with the 2011 Community Needs Assessment:
Each of Indiana’s 23 Community Action Agencies, without their participation and resources, success on this project could not be achieved;
The Indiana Housing and Community Development Authority, who funded these Community Needs Assessments in whole or in part with CSBG-D funds;
The 2011 Community Needs Assessment working group, who has provided valuable feedback and support on this project. Working group members include: Pam Vicars and Carole Barr with Western Indiana Community Action Agency, Justine Currie with Area IV Agency on Aging and Community Action Programs, Anna Schoon with Northwestern Indiana Community Action Corporation, Beth Pankoski with South Central Community Action Program, Michael Smith with Community Action of East Central Indiana, and Greg Mahuron with Hoosier Uplands Economic Development Corporation;
IN-CAA’s Board of Directors and Program Committee who also provided feedback and support on this project; and
Special thanks are extended to Lora Olive, Jessica Fraser, and Derek Thomas with the Indiana Community Action Association and our interns Jasmine Ivy and Shelby Sawyers for their dedication to making these Community Needs Assessments a success.
PAGE
Introduction 1
Service Area Overview 2
Service Area 2
State and County Level Census Data 3
Population 3
Gender 3
Age 3
Race 4
Ethnicity 5
Household Type 5
Income and Self-Sufficiency 6
Median Household Income 6
Poverty 7
Educational Attainment and Labor Force 10
Housing 12
Clients Served By Indiana’s Community Action Agencies 14
(Data from Indiana Community Service Block Grant Reports)
Client Demographics 14
Population 14
Gender 14
Age 16
Race 18
Ethnicity 19
PAGE
Clients Served By Indiana’s Community Action Agencies 14
(Data from Indiana Community Service Block Grant Reports)
Client Demographics 14
Family Size 20
Household Type 22
Educational Attainment 22
Income 24
Locally Identified Causes of Poverty and Community Needs 25
(Data from Client and Stakeholder Surveys)
Survey Information 25
Client Survey Data 25
Employment 25
Health Insurance 28
Child Care 30
Child Support 32
Housing 33
Transportation 36
Food Security 36
Technology 38
Banking Services 39
Domestic Violence 40
Community Needs 41
CANI’s Strategies to Address the Causes of Poverty 42
Agency Utilization 44
Appendix A: Client and Stakeholder Survey Instruments 45
1 | P a g e 2 0 1 1 C A N I C o m m u n i t y N e e d s A s s e s s m e n t
The Community Services Block Grant Act (CSBG) states that “the State will secure from each
eligible entity in the State… a community action plan … that includes a community assessment
for the community served.” As a result, Community Action Agencies (CAAs) across the state
assess the needs of their communities every three years. This is done through the analysis of
state and county level data (i.e. Census Bureau and Bureau of Labor Statistics data), client data
as reported to CSBG Results Oriented Management Accountability (ROMA) system, and
surveying a sampling of both CAA clients and stakeholders (community partners).
The purpose of the needs assessment is to provide a complete body of information regarding
the specific area to determine if needs are being met and what gaps remain in the community
between programs/services and continuing community needs. This allows CAAs to:
Develop new programs;
Helps to justify the funding of new programs;
Evaluate the success of programs; and
Helps to sustain funding for successful programs.
The 2011 Community Needs Assessments are the third full-scale needs assessments to be
completed for the Indiana Community Action Network. The 2011 Statewide Community Needs
Assessment report looks at the Network comprehensively and evaluates how Community
Action is meeting community needs statewide. It is our hope that the Statewide Community
Needs Assessment will provide valuable data to the Network and will help the Network to
target programs and services to address those with the greatest need in their communities.
2 | P a g e 2 0 1 1 C A N I C o m m u n i t y N e e d s A s s e s s m e n t
In order to put the needs of Indiana’s local communities and low-income Hoosiers in
perspective, it is helpful to get a brief overview of what national, state, and county level data
can tell us about Indiana. In this section, information from the U.S. Census Bureau was
analyzed, to get a better understanding of our service area (State of Indiana) and to identify
important trends Community Action Agencies (CAAs) may need to be responsive to in order to
meet low-income Hoosiers needs.
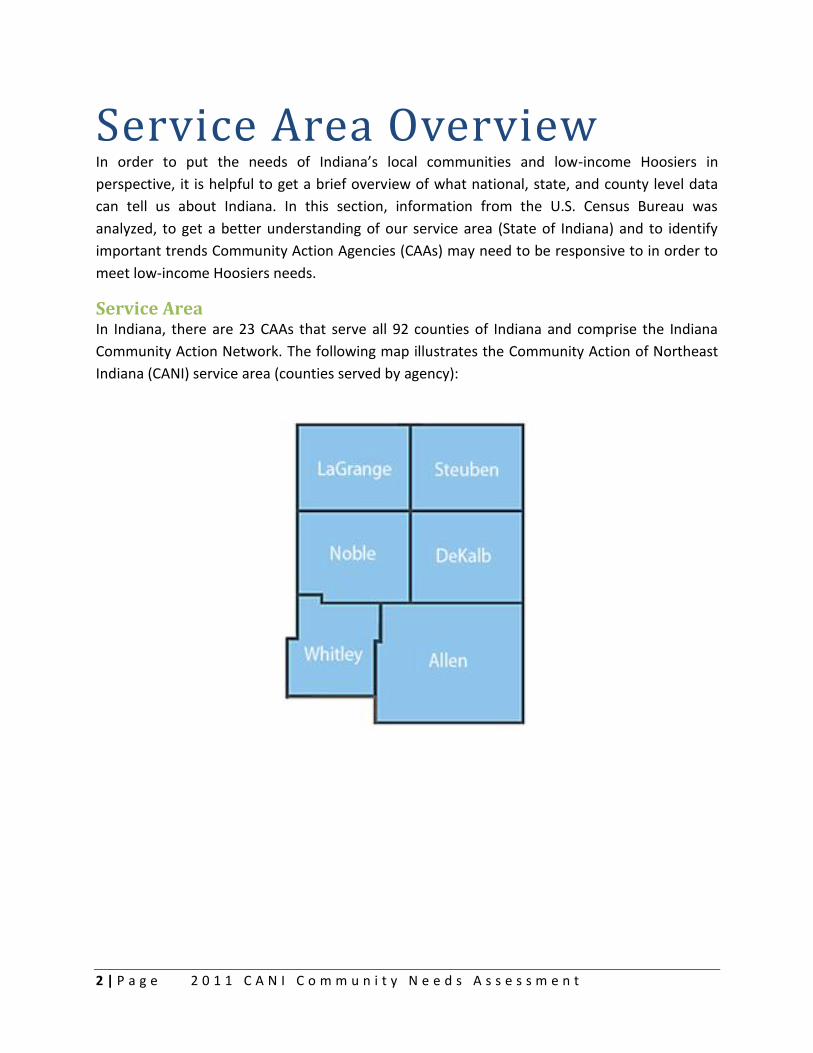
Service Area In Indiana, there are 23 CAAs that serve all 92 counties of Indiana and comprise the Indiana
Community Action Network. The following map illustrates the Community Action of Northeast
Indiana (CANI) service area (counties served by agency):
3 | P a g e 2 0 1 1 C A N I C o m m u n i t y N e e d s A s s e s s m e n t
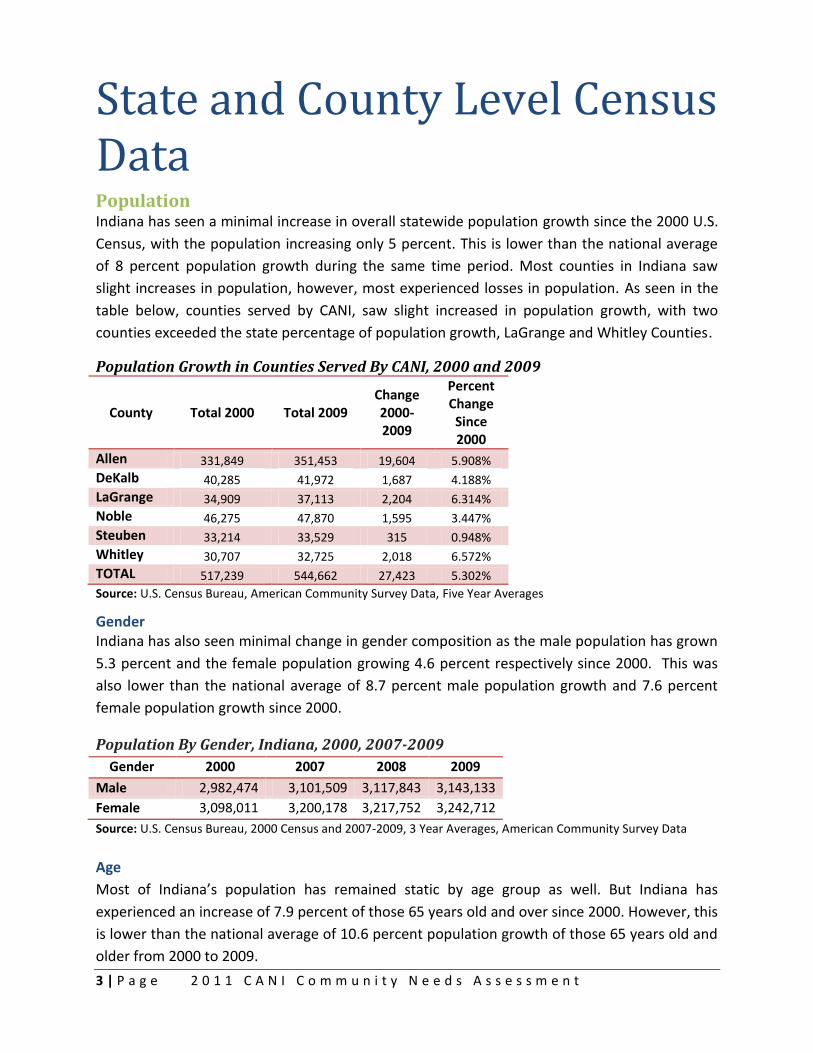
State and County Level Census Data Population Indiana has seen a minimal increase in overall statewide population growth since the 2000 U.S.
Census, with the population increasing only 5 percent. This is lower than the national average
of 8 percent population growth during the same time period. Most counties in Indiana saw
slight increases in population, however, most experienced losses in population. As seen in the
table below, counties served by CANI, saw slight increased in population growth, with two
counties exceeded the state percentage of population growth, LaGrange and Whitley Counties.
Population Growth in Counties Served By CANI, 2000 and 2009
County Total 2000 Total 2009 Change 2000-2009
Percent Change Since 2000
Allen 331,849 351,453 19,604 5.908%
DeKalb 40,285 41,972 1,687 4.188%
LaGrange 34,909 37,113 2,204 6.314%
Noble 46,275 47,870 1,595 3.447%
Steuben 33,214 33,529 315 0.948%
Whitley 30,707 32,725 2,018 6.572%
TOTAL 517,239 544,662 27,423 5.302%
Source: U.S. Census Bureau, American Community Survey Data, Five Year Averages
Gender Indiana has also seen minimal change in gender composition as the male population has grown
5.3 percent and the female population growing 4.6 percent respectively since 2000. This was
also lower than the national average of 8.7 percent male population growth and 7.6 percent
female population growth since 2000.
Population By Gender, Indiana, 2000, 2007-2009
Gender 2000 2007 2008 2009
Male 2,982,474 3,101,509 3,117,843 3,143,133
Female 3,098,011 3,200,178 3,217,752 3,242,712
Source: U.S. Census Bureau, 2000 Census and 2007-2009, 3 Year Averages, American Community Survey Data
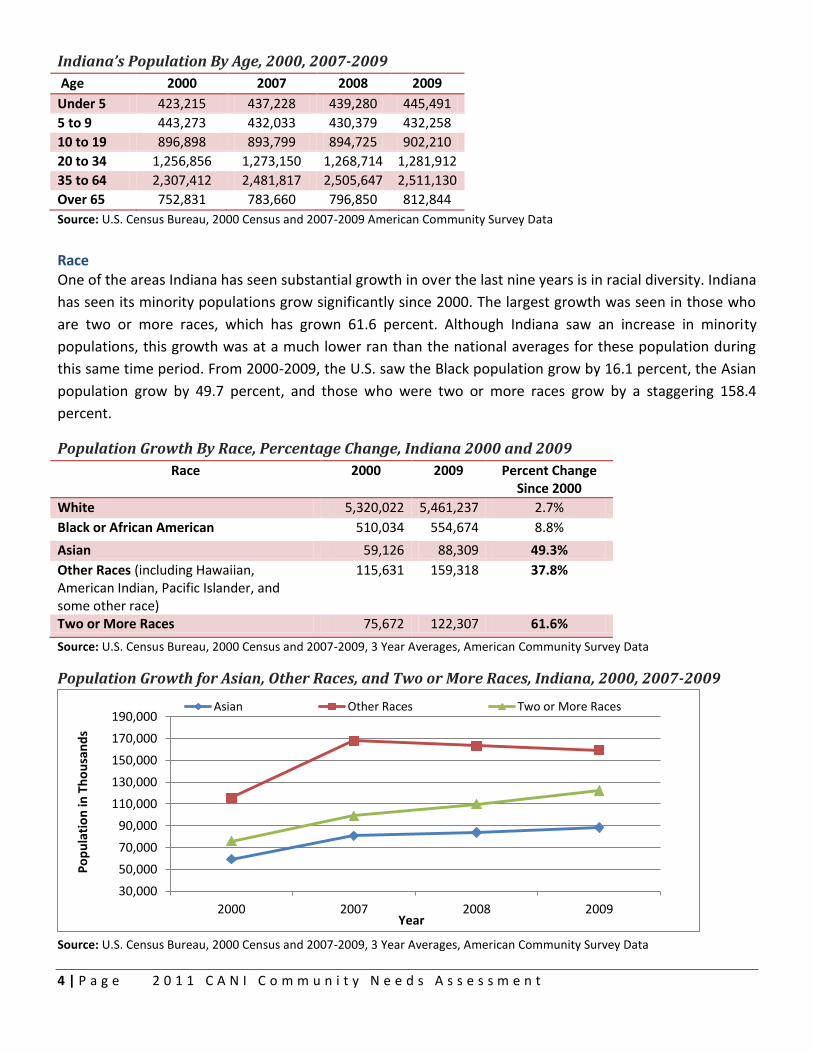
Age
Most of Indiana’s population has remained static by age group as well. But Indiana has
experienced an increase of 7.9 percent of those 65 years old and over since 2000. However, this
is lower than the national average of 10.6 percent population growth of those 65 years old and
older from 2000 to 2009.
4 | P a g e 2 0 1 1 C A N I C o m m u n i t y N e e d s A s s e s s m e n t
Indiana’s Population By Age, 2000, 2007-2009
Age 2000 2007 2008 2009
Under 5 423,215 437,228 439,280 445,491
5 to 9 443,273 432,033 430,379 432,258
10 to 19 896,898 893,799 894,725 902,210
20 to 34 1,256,856 1,273,150 1,268,714 1,281,912
35 to 64 2,307,412 2,481,817 2,505,647 2,511,130
Over 65 752,831 783,660 796,850 812,844
Source: U.S. Census Bureau, 2000 Census and 2007-2009 American Community Survey Data
Race One of the areas Indiana has seen substantial growth in over the last nine years is in racial diversity. Indiana
has seen its minority populations grow significantly since 2000. The largest growth was seen in those who
are two or more races, which has grown 61.6 percent. Although Indiana saw an increase in minority
populations, this growth was at a much lower ran than the national averages for these population during
this same time period. From 2000-2009, the U.S. saw the Black population grow by 16.1 percent, the Asian
population grow by 49.7 percent, and those who were two or more races grow by a staggering 158.4
percent.
Population Growth By Race, Percentage Change, Indiana 2000 and 2009
Race 2000 2009 Percent Change Since 2000
White 5,320,022 5,461,237 2.7%
Black or African American 510,034 554,674 8.8%
Asian 59,126 88,309 49.3%
Other Races (including Hawaiian, American Indian, Pacific Islander, and some other race)
115,631 159,318 37.8%
Two or More Races 75,672 122,307 61.6%
Source: U.S. Census Bureau, 2000 Census and 2007-2009, 3 Year Averages, American Community Survey Data
Population Growth for Asian, Other Races, and Two or More Races, Indiana, 2000, 2007-2009
Source: U.S. Census Bureau, 2000 Census and 2007-2009, 3 Year Averages, American Community Survey Data
30,000
50,000
70,000
90,000
110,000
130,000
150,000
170,000
190,000
2000 2007 2008 2009
Po
pu
lati
on
in T
ho
usa
nd
s
Year
Asian Other Races Two or More Races
5 | P a g e 2 0 1 1 C A N I C o m m u n i t y N e e d s A s s e s s m e n t
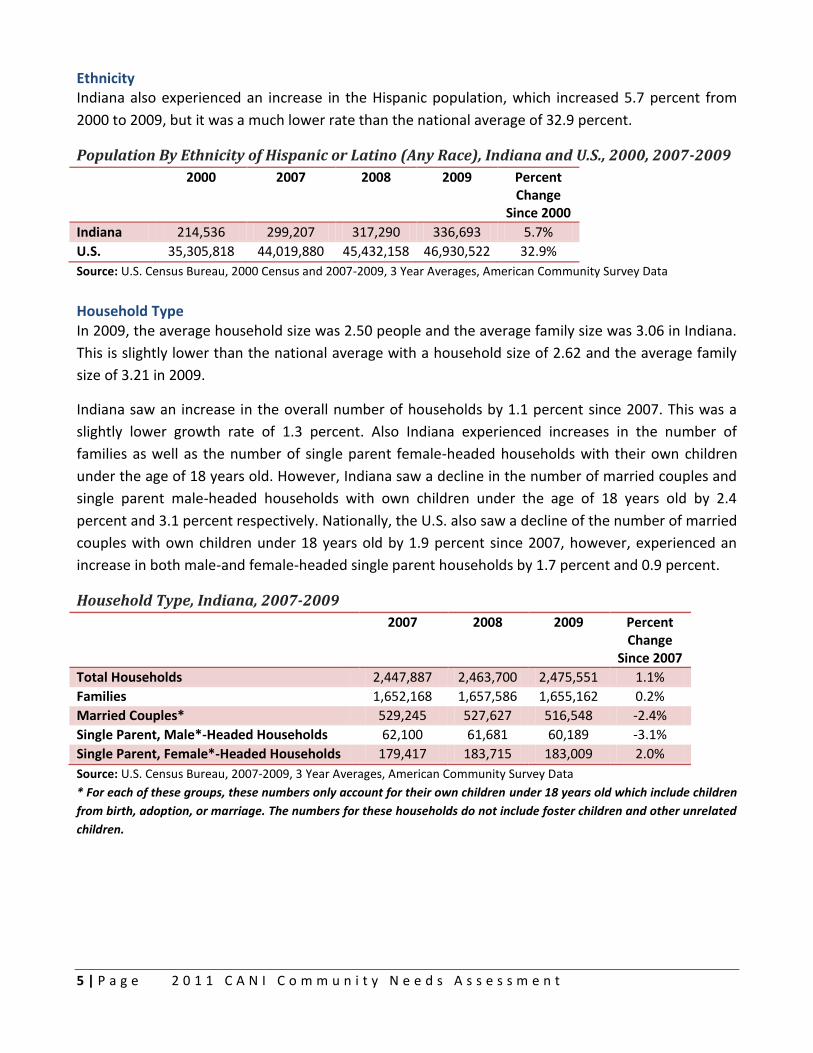
Ethnicity Indiana also experienced an increase in the Hispanic population, which increased 5.7 percent from
2000 to 2009, but it was a much lower rate than the national average of 32.9 percent.
Population By Ethnicity of Hispanic or Latino (Any Race), Indiana and U.S., 2000, 2007-2009
2000 2007 2008 2009 Percent Change
Since 2000
Indiana 214,536 299,207 317,290 336,693 5.7%
U.S. 35,305,818 44,019,880 45,432,158 46,930,522 32.9%
Source: U.S. Census Bureau, 2000 Census and 2007-2009, 3 Year Averages, American Community Survey Data
Household Type In 2009, the average household size was 2.50 people and the average family size was 3.06 in Indiana.
This is slightly lower than the national average with a household size of 2.62 and the average family
size of 3.21 in 2009.
Indiana saw an increase in the overall number of households by 1.1 percent since 2007. This was a
slightly lower growth rate of 1.3 percent. Also Indiana experienced increases in the number of
families as well as the number of single parent female-headed households with their own children
under the age of 18 years old. However, Indiana saw a decline in the number of married couples and
single parent male-headed households with own children under the age of 18 years old by 2.4
percent and 3.1 percent respectively. Nationally, the U.S. also saw a decline of the number of married
couples with own children under 18 years old by 1.9 percent since 2007, however, experienced an
increase in both male-and female-headed single parent households by 1.7 percent and 0.9 percent.
Household Type, Indiana, 2007-2009
2007 2008 2009 Percent Change
Since 2007
Total Households 2,447,887 2,463,700 2,475,551 1.1%
Families 1,652,168 1,657,586 1,655,162 0.2%
Married Couples* 529,245 527,627 516,548 -2.4%
Single Parent, Male*-Headed Households 62,100 61,681 60,189 -3.1%
Single Parent, Female*-Headed Households 179,417 183,715 183,009 2.0%
Source: U.S. Census Bureau, 2007-2009, 3 Year Averages, American Community Survey Data
* For each of these groups, these numbers only account for their own children under 18 years old which include children
from birth, adoption, or marriage. The numbers for these households do not include foster children and other unrelated
children.
6 | P a g e 2 0 1 1 C A N I C o m m u n i t y N e e d s A s s e s s m e n t
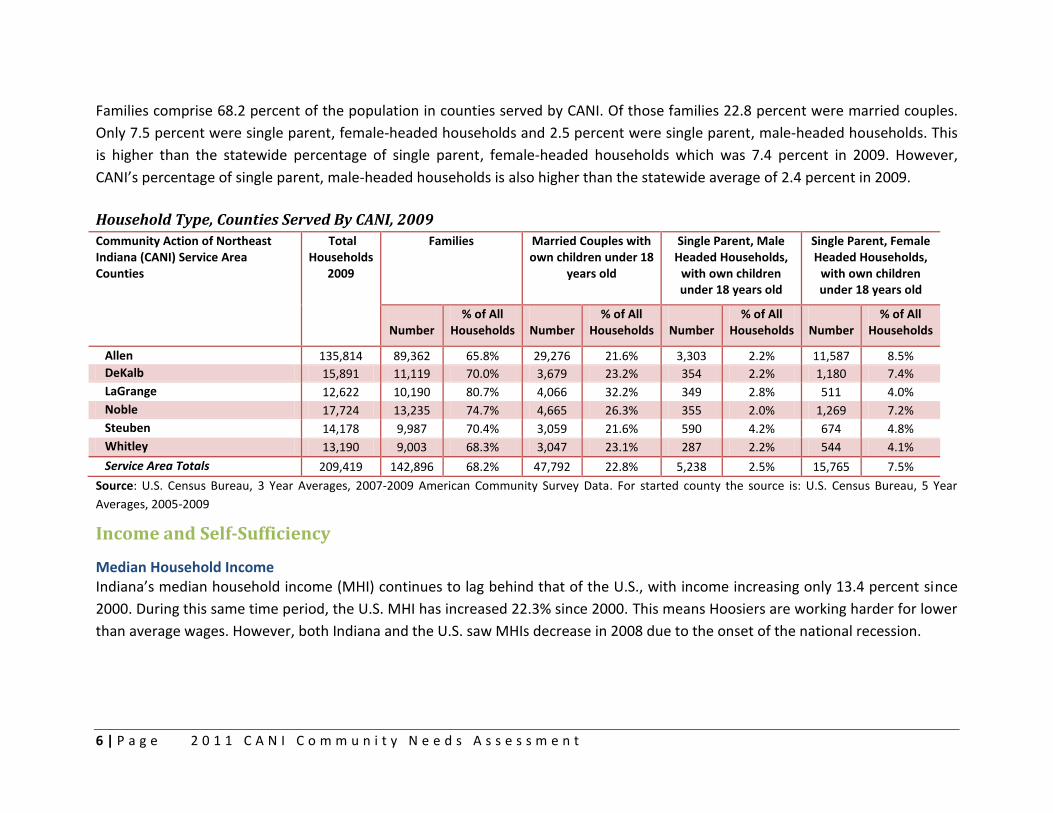
Families comprise 68.2 percent of the population in counties served by CANI. Of those families 22.8 percent were married couples.
Only 7.5 percent were single parent, female-headed households and 2.5 percent were single parent, male-headed households. This
is higher than the statewide percentage of single parent, female-headed households which was 7.4 percent in 2009. However,
CANI’s percentage of single parent, male-headed households is also higher than the statewide average of 2.4 percent in 2009.
Household Type, Counties Served By CANI, 2009
Community Action of Northeast Indiana (CANI) Service Area Counties
Total Households
2009
Families Married Couples with own children under 18
years old
Single Parent, Male Headed Households,
with own children under 18 years old
Single Parent, Female Headed Households,
with own children under 18 years old
Number
% of All Households
Number
% of All Households
Number
% of All Households
Number
% of All Households
Allen 135,814 89,362 65.8% 29,276 21.6% 3,303 2.2% 11,587 8.5%
DeKalb 15,891 11,119 70.0% 3,679 23.2% 354 2.2% 1,180 7.4%
LaGrange 12,622 10,190 80.7% 4,066 32.2% 349 2.8% 511 4.0%
Noble 17,724 13,235 74.7% 4,665 26.3% 355 2.0% 1,269 7.2%
Steuben 14,178 9,987 70.4% 3,059 21.6% 590 4.2% 674 4.8%
Whitley 13,190 9,003 68.3% 3,047 23.1% 287 2.2% 544 4.1%
Service Area Totals 209,419 142,896 68.2% 47,792 22.8% 5,238 2.5% 15,765 7.5%
Source: U.S. Census Bureau, 3 Year Averages, 2007-2009 American Community Survey Data. For started county the source is: U.S. Census Bureau, 5 Year
Averages, 2005-2009
Income and Self-Sufficiency
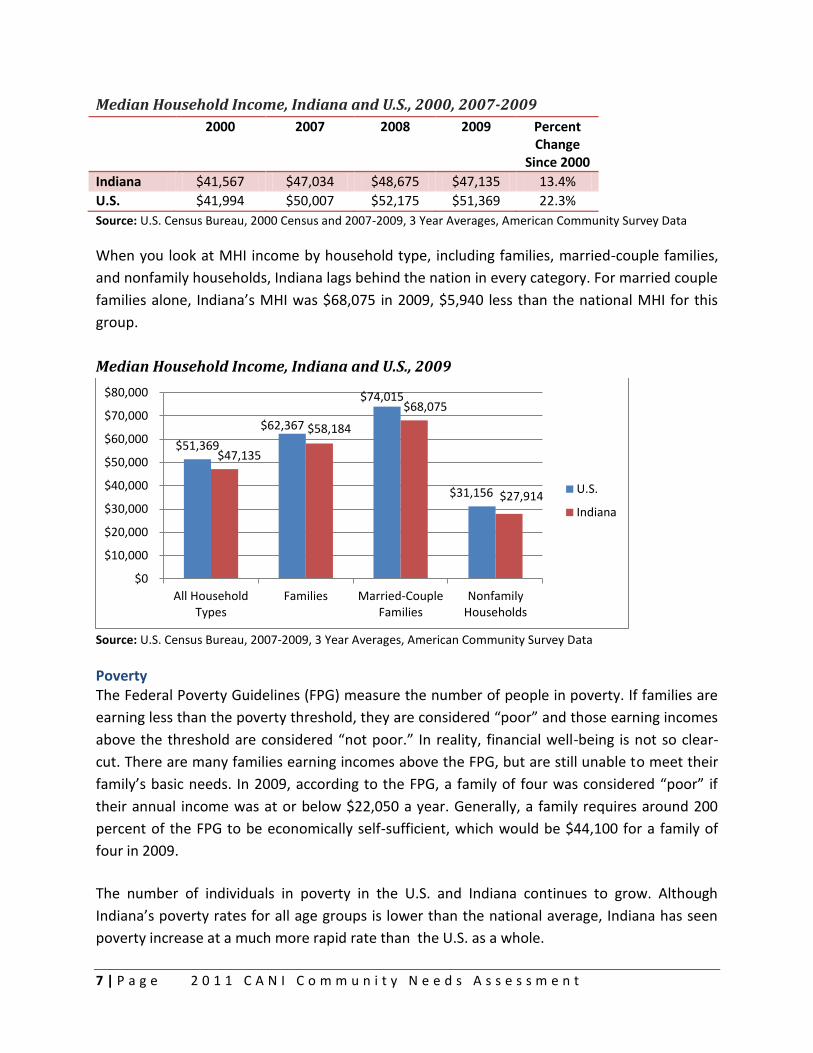
Median Household Income Indiana’s median household income (MHI) continues to lag behind that of the U.S., with income increasing only 13.4 percent since
2000. During this same time period, the U.S. MHI has increased 22.3% since 2000. This means Hoosiers are working harder for lower
than average wages. However, both Indiana and the U.S. saw MHIs decrease in 2008 due to the onset of the national recession.
7 | P a g e 2 0 1 1 C A N I C o m m u n i t y N e e d s A s s e s s m e n t
Median Household Income, Indiana and U.S., 2000, 2007-2009
2000 2007 2008 2009 Percent Change
Since 2000
Indiana $41,567 $47,034 $48,675 $47,135 13.4%
U.S. $41,994 $50,007 $52,175 $51,369 22.3%
Source: U.S. Census Bureau, 2000 Census and 2007-2009, 3 Year Averages, American Community Survey Data
When you look at MHI income by household type, including families, married-couple families,
and nonfamily households, Indiana lags behind the nation in every category. For married couple
families alone, Indiana’s MHI was $68,075 in 2009, $5,940 less than the national MHI for this
group.
Median Household Income, Indiana and U.S., 2009
Source: U.S. Census Bureau, 2007-2009, 3 Year Averages, American Community Survey Data
Poverty The Federal Poverty Guidelines (FPG) measure the number of people in poverty. If families are
earning less than the poverty threshold, they are considered “poor” and those earning incomes
above the threshold are considered “not poor.” In reality, financial well-being is not so clear-
cut. There are many families earning incomes above the FPG, but are still unable to meet their
family’s basic needs. In 2009, according to the FPG, a family of four was considered “poor” if
their annual income was at or below $22,050 a year. Generally, a family requires around 200
percent of the FPG to be economically self-sufficient, which would be $44,100 for a family of
four in 2009.
The number of individuals in poverty in the U.S. and Indiana continues to grow. Although
Indiana’s poverty rates for all age groups is lower than the national average, Indiana has seen
poverty increase at a much more rapid rate than the U.S. as a whole.
$51,369
$62,367
$74,015
$31,156
$47,135
$58,184
$68,075
$27,914
$0
$10,000
$20,000
$30,000
$40,000
$50,000
$60,000
$70,000
$80,000
All HouseholdTypes
Families Married-CoupleFamilies
NonfamilyHouseholds
U.S.
Indiana
8 | P a g e 2 0 1 1 C A N I C o m m u n i t y N e e d s A s s e s s m e n t
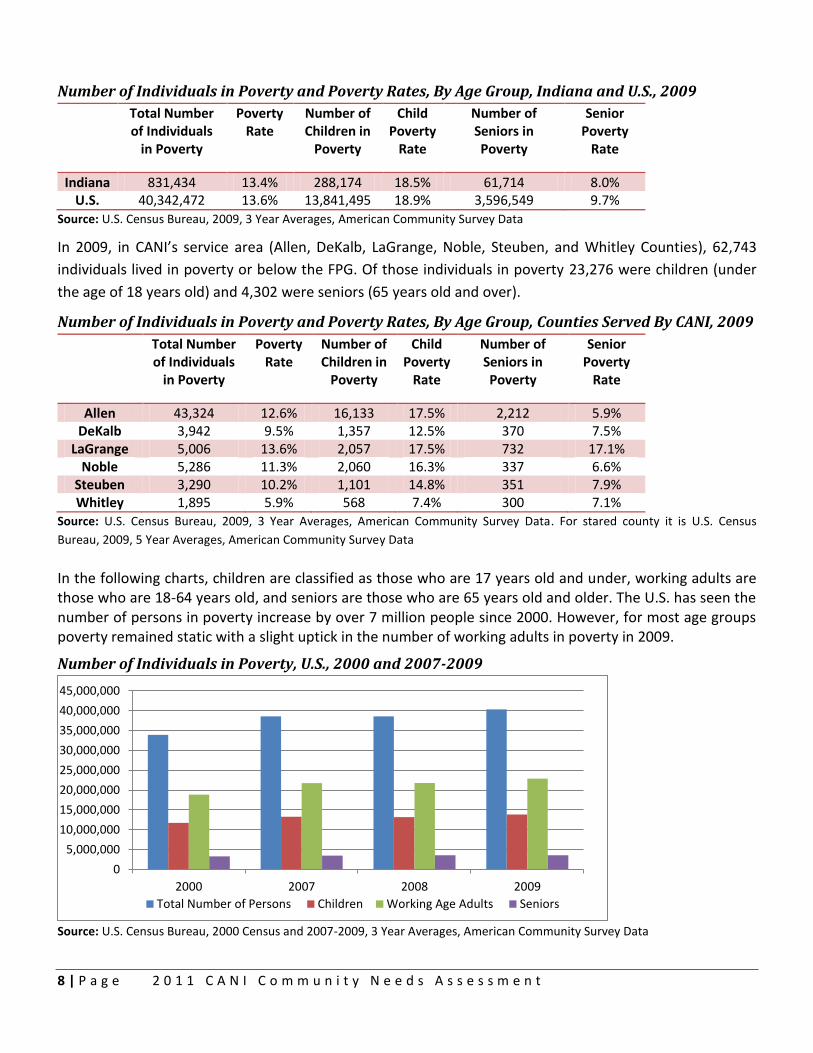
Number of Individuals in Poverty and Poverty Rates, By Age Group, Indiana and U.S., 2009
Total Number of Individuals
in Poverty
Poverty Rate
Number of Children in
Poverty
Child Poverty
Rate
Number of Seniors in Poverty
Senior Poverty
Rate
Indiana 831,434 13.4% 288,174 18.5% 61,714 8.0% U.S. 40,342,472 13.6% 13,841,495 18.9% 3,596,549 9.7%
Source: U.S. Census Bureau, 2009, 3 Year Averages, American Community Survey Data
In 2009, in CANI’s service area (Allen, DeKalb, LaGrange, Noble, Steuben, and Whitley Counties), 62,743
individuals lived in poverty or below the FPG. Of those individuals in poverty 23,276 were children (under
the age of 18 years old) and 4,302 were seniors (65 years old and over).
Number of Individuals in Poverty and Poverty Rates, By Age Group, Counties Served By CANI, 2009
Total Number of Individuals
in Poverty
Poverty Rate
Number of Children in
Poverty
Child Poverty
Rate
Number of Seniors in Poverty
Senior Poverty
Rate
Allen 43,324 12.6% 16,133 17.5% 2,212 5.9% DeKalb 3,942 9.5% 1,357 12.5% 370 7.5%
LaGrange 5,006 13.6% 2,057 17.5% 732 17.1% Noble 5,286 11.3% 2,060 16.3% 337 6.6%
Steuben 3,290 10.2% 1,101 14.8% 351 7.9% Whitley 1,895 5.9% 568 7.4% 300 7.1%
Source: U.S. Census Bureau, 2009, 3 Year Averages, American Community Survey Data. For stared county it is U.S. Census
Bureau, 2009, 5 Year Averages, American Community Survey Data
In the following charts, children are classified as those who are 17 years old and under, working adults are those who are 18-64 years old, and seniors are those who are 65 years old and older. The U.S. has seen the number of persons in poverty increase by over 7 million people since 2000. However, for most age groups poverty remained static with a slight uptick in the number of working adults in poverty in 2009.
Number of Individuals in Poverty, U.S., 2000 and 2007-2009
Source: U.S. Census Bureau, 2000 Census and 2007-2009, 3 Year Averages, American Community Survey Data
0
5,000,000
10,000,000
15,000,000
20,000,000
25,000,000
30,000,000
35,000,000
40,000,000
45,000,000
2000 2007 2008 2009
Total Number of Persons Children Working Age Adults Seniors
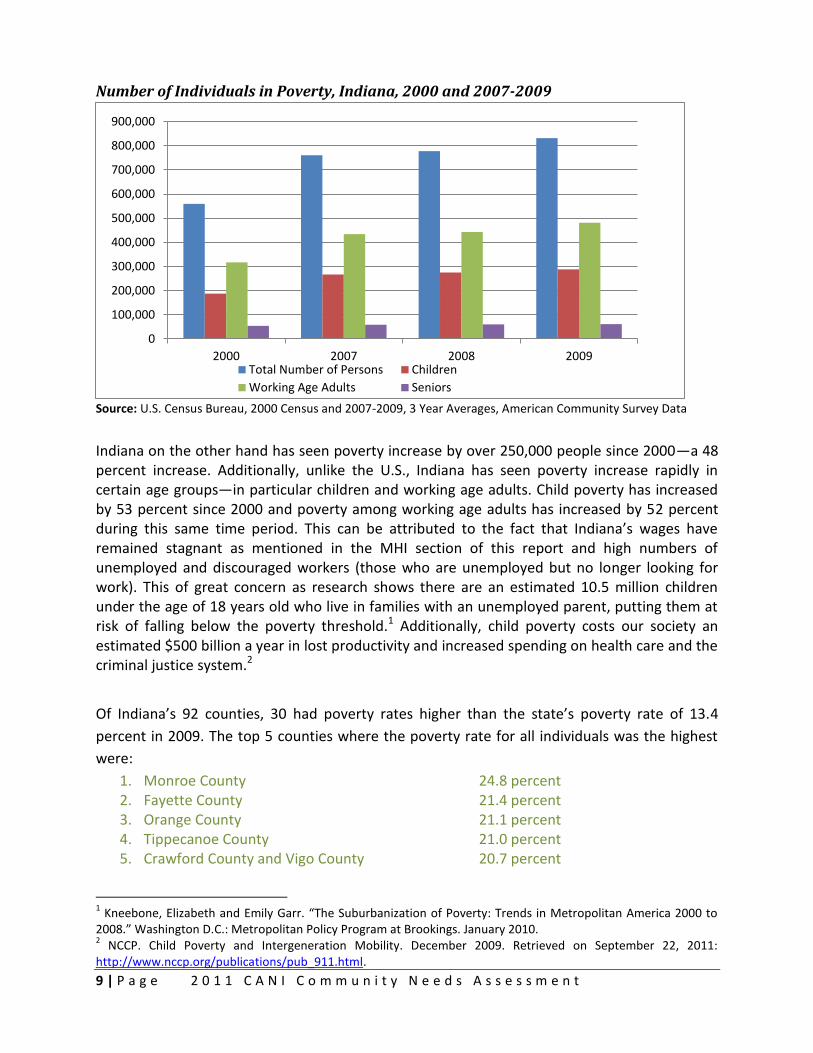
9 | P a g e 2 0 1 1 C A N I C o m m u n i t y N e e d s A s s e s s m e n t
Number of Individuals in Poverty, Indiana, 2000 and 2007-2009
Source: U.S. Census Bureau, 2000 Census and 2007-2009, 3 Year Averages, American Community Survey Data
Indiana on the other hand has seen poverty increase by over 250,000 people since 2000—a 48 percent increase. Additionally, unlike the U.S., Indiana has seen poverty increase rapidly in certain age groups—in particular children and working age adults. Child poverty has increased by 53 percent since 2000 and poverty among working age adults has increased by 52 percent during this same time period. This can be attributed to the fact that Indiana’s wages have
remained stagnant as mentioned in the MHI section of this report and high numbers of unemployed and discouraged workers (those who are unemployed but no longer looking for work). This of great concern as research shows there are an estimated 10.5 million children under the age of 18 years old who live in families with an unemployed parent, putting them at risk of falling below the poverty threshold.1 Additionally, child poverty costs our society an estimated $500 billion a year in lost productivity and increased spending on health care and the criminal justice system.2
Of Indiana’s 92 counties, 30 had poverty rates higher than the state’s poverty rate of 13.4
percent in 2009. The top 5 counties where the poverty rate for all individuals was the highest
were:
1. Monroe County 24.8 percent 2. Fayette County 21.4 percent 3. Orange County 21.1 percent 4. Tippecanoe County 21.0 percent 5. Crawford County and Vigo County 20.7 percent
1 Kneebone, Elizabeth and Emily Garr. “The Suburbanization of Poverty: Trends in Metropolitan America 2000 to
2008.” Washington D.C.: Metropolitan Policy Program at Brookings. January 2010. 2 NCCP. Child Poverty and Intergeneration Mobility. December 2009. Retrieved on September 22, 2011:
http://www.nccp.org/publications/pub_911.html.
0
100,000
200,000
300,000
400,000
500,000
600,000
700,000
800,000
900,000
2000 2007 2008 2009Total Number of Persons Children
Working Age Adults Seniors
10 | P a g e 2 0 1 1 C A N I C o m m u n i t y N e e d s A s s e s s m e n t
One of the counties served by CANI, LaGrange County, had a poverty rate that was higher than the
state’s poverty rate in 2009.
Additionally, 34 counties had child poverty rates higher than the state average of 18.5 percent in
2009. The top 5 counties where the child poverty rate was the highest and nearly double the state
average were:
1. Parke Country 32.4 percent 2. Crawford County 31.2 percent 3. Jay County 29.1 percent 4. Vigo County 28.2 percent 5. Orange County 28.1 percent
None of CANI’s service area counties saw child poverty rates higher than the state average in 2009.
Lastly, 46 counties had senior poverty rates higher than the state average of 8.0 percent in 2009. The
5 counties with the highest percent of senior poverty, nearly 2.5 times higher than the state average,
were:
1. Scott County 18.9 percent 2. Washington County 18.8 percent 3. LaGrange County 17.1 percent 4. Orange County and Spencer County 16.2 percent 5. Parke County 14.4 percent
One of CANI’s service area counties, LaGrange County, had a senior poverty rate higher than the state
average in 2009, and had the third highest rate in the state.
Education Attainment and the Labor Force Indiana has seen incredible progress in the educational attainment of the population 25 years old and
older since 2000. Those who have no high school diploma have decreased by 17 percent. Conversely
those who have a high school diploma (or equivalency), associate’s degree, and bachelor’s degree
have increased. Those who have earned an associate’s degree saw the most growth with an increase
of 34.7 percent since 2000.
Educational Attainment, For Population 25 Years Old and Older, Indiana, 2000 and 2007-
2009
2000 2007 2008 2009 Percent Change
Since 2000
No High School Diploma* 695,540 607,356 591,096 577,156 -17.0%
High School Graduate (includes equivalency) 1,447,734 1,523,495 1,507,513 1,497,587 3.4%
Associate’s Degree 225,535 288,175 300,843 303,736 34.7%
Bachelor’s Degree 475,247 564,166 590,702 599,147 26.1%
Source: U.S. Census Bureau, 2000 Census Data and 2007-2009, 3 Year Averages, American Community Survey Data
11 | P a g e 2 0 1 1 C A N I C o m m u n i t y N e e d s A s s e s s m e n t
Indiana is also performing better than the U.S. in many of these categories including having a lower
rate of those with no high school diploma and higher numbers of those with a high school diploma.
However, Indiana is slightly lower than the U.S. in the attainment of bachelor’s degree attainment.
Educational Attainment, For Population 25 Years Old and Older, Indiana and U.S., 2009
Indiana U.S.
Number Percent Number Percent
No High School Diploma 577,156 13.9% 30,117,162 15.1%
High School Graduate (includes equivalency) 1,497,587 36.0% 57,957,308 29.0%
Some College, No Degree 848,237 20.4% 41,311,230 20.7%
Associate’s Degree 303,736 7.3% 14,935,736 7.5%
Bachelor’s Degree 599,147 14.4% 35,068,697 17.6%
Source: U.S. Census Bureau, 2009, 3 Year Averages, American Community Survey Data
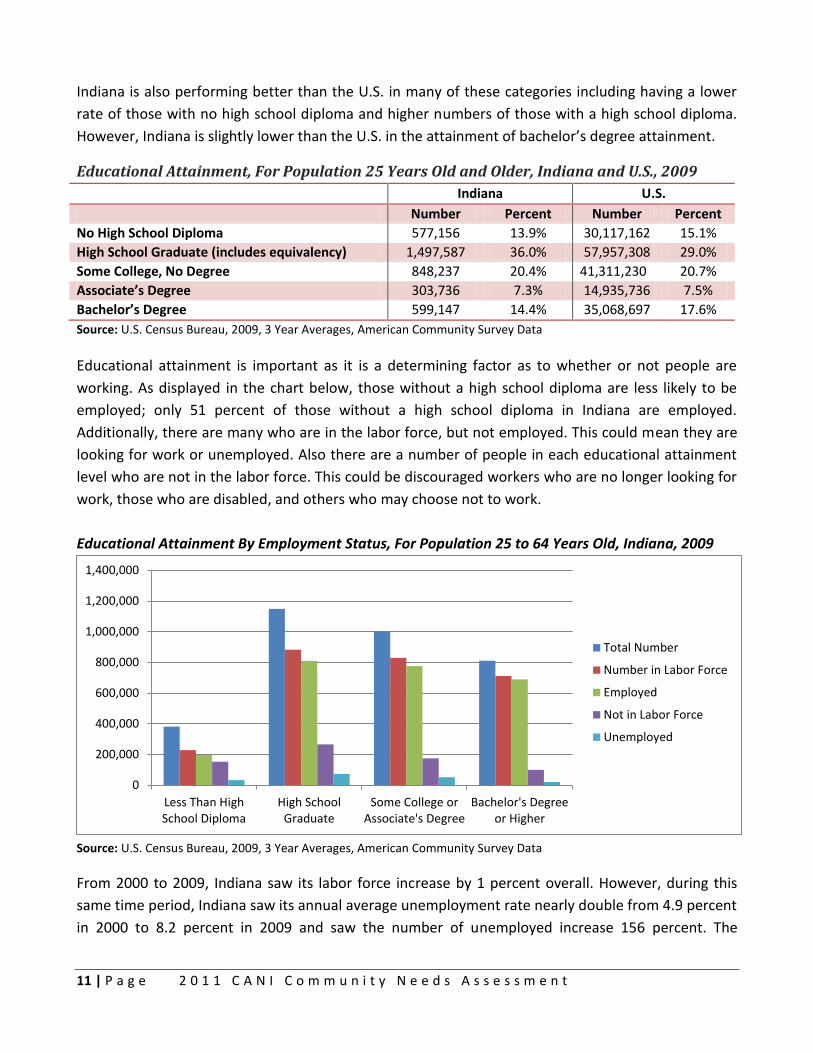
Educational attainment is important as it is a determining factor as to whether or not people are
working. As displayed in the chart below, those without a high school diploma are less likely to be
employed; only 51 percent of those without a high school diploma in Indiana are employed.
Additionally, there are many who are in the labor force, but not employed. This could mean they are
looking for work or unemployed. Also there are a number of people in each educational attainment
level who are not in the labor force. This could be discouraged workers who are no longer looking for
work, those who are disabled, and others who may choose not to work.
Educational Attainment By Employment Status, For Population 25 to 64 Years Old, Indiana, 2009
Source: U.S. Census Bureau, 2009, 3 Year Averages, American Community Survey Data
From 2000 to 2009, Indiana saw its labor force increase by 1 percent overall. However, during this
same time period, Indiana saw its annual average unemployment rate nearly double from 4.9 percent
in 2000 to 8.2 percent in 2009 and saw the number of unemployed increase 156 percent. The
0
200,000
400,000
600,000
800,000
1,000,000
1,200,000
1,400,000
Less Than HighSchool Diploma
High SchoolGraduate
Some College orAssociate's Degree
Bachelor's Degreeor Higher
Total Number
Number in Labor Force
Employed
Not in Labor Force
Unemployed
12 | P a g e 2 0 1 1 C A N I C o m m u n i t y N e e d s A s s e s s m e n t
5 counties that saw the greatest increase in the number of unemployed from 2000-2009 were:
1. Jennings County 386 percent 2. Elkhart County 340 percent 3. Whitley County 339 percent 4. Kosciusko County 311 percent 5. LaGrange County 301 percent
Two of the counties served by CANI saw rates below this average, Whitley and LaGrange Counties, and ranked among the top five counties that experienced the highest unemployment during this time period. The remainder of the counties served by CANI had rates below these averages: Allen County 236 percent; DeKalb County 262 percent; Noble County 286 percent; and Steuben County 205 percent. The average unemployment rate for CANI’s service area was 272 percent.
Housing The U.S. Department of Housing and Urban Development recommends that people pay 30
percent or less of their gross monthly income (income before taxes) on housing. However,
Census data shows many Hoosiers who rent are paying 30 percent or higher in rent in 2009. The
median rental rate in Indiana for 2009 was $670, yet many are paying much higher rental rates.
See tables below.
Gross Rent as a Percentage of Household Income, Indiana and U.S., 2009
Indiana U.S.
Number Percent Number Percent
Less than 15% 90,904 13.8% 4,395,299 12.5%
15.0 to 19.9% 91,317 13.9% 4,421,177 12.6%
20.0-24.9% 87,601 13.3% 4,547,083 12.9%
25.0-29.9% 74,274 11.3% 4,108,512 11.7%
30.0-34.9% 56,976 8.7% 3,201,102 9.1%
35.0% or More 257,317 39.1% 14,491,598 41.2%
Source: U.S. Census Bureau, 2009, 3 Year Averages, American Community Survey Data
Gross Rent, Indiana, 2009
Indiana
Number Percent
Less than $200 22,493 3.4%
$200-$299 23,646 3.5%
$300-$499 105,859 15.8%
$500-$749 268,291 40.0%
$750-$999 164,221 24.5%
$1,000-$1,499 71,817 10.7%
$1,500 or More 14.400 2.1%
Source: U.S. Census Bureau, 2009, 3 Year Averages, American Community Survey Data
Whereas most homeowners, even with a mortgage, spend less than 20 percent of their income
on housing both in Indiana and the U.S., see table below.
13 | P a g e 2 0 1 1 C A N I C o m m u n i t y N e e d s A s s e s s m e n t
Selected Monthly Owner Costs as a Percentage of Household Income, Indiana and U.S., 2009
Indiana U.S.
Number Percent Number Percent
Less than 20% 537,683 43.4% 17,268,035 33.9%
20.0-24.9% 214,139 17.3% 8,123,193 15.9%
25.0-29.9% 146,616 11.8% 6,350,864 12.5%
30.0-34.9% 96,192 7.8% 4,578,744 9.0%
35.0% or More 243,680 19.7% 14,622,916 28.7%
Source: U.S. Census Bureau, 2009, 3 Year Averages, American Community Survey Data
Whether a person rents or owns the data shows that there are many Hoosiers and Americans
living in substandard housing. Over 8,000 Hoosiers lack complete plumping facilities and over
14,000 lacked complete kitchen facilities. Even more alarming is over 95,000 do not have
telephone service available to them.
Selected Housing Characteristics, Indiana, 2009
Number Percent
Occupied Housing Units 2,475,551 -
Lack Complete Plumbing Facilities 8,921 0.4%
Lack Complete Kitchen Facilities 14,944 0.6%
No Telephone Service Available 95,029 3.8%
Source: U.S. Census Bureau, 2009 3 Year Averages, American Community Survey Data
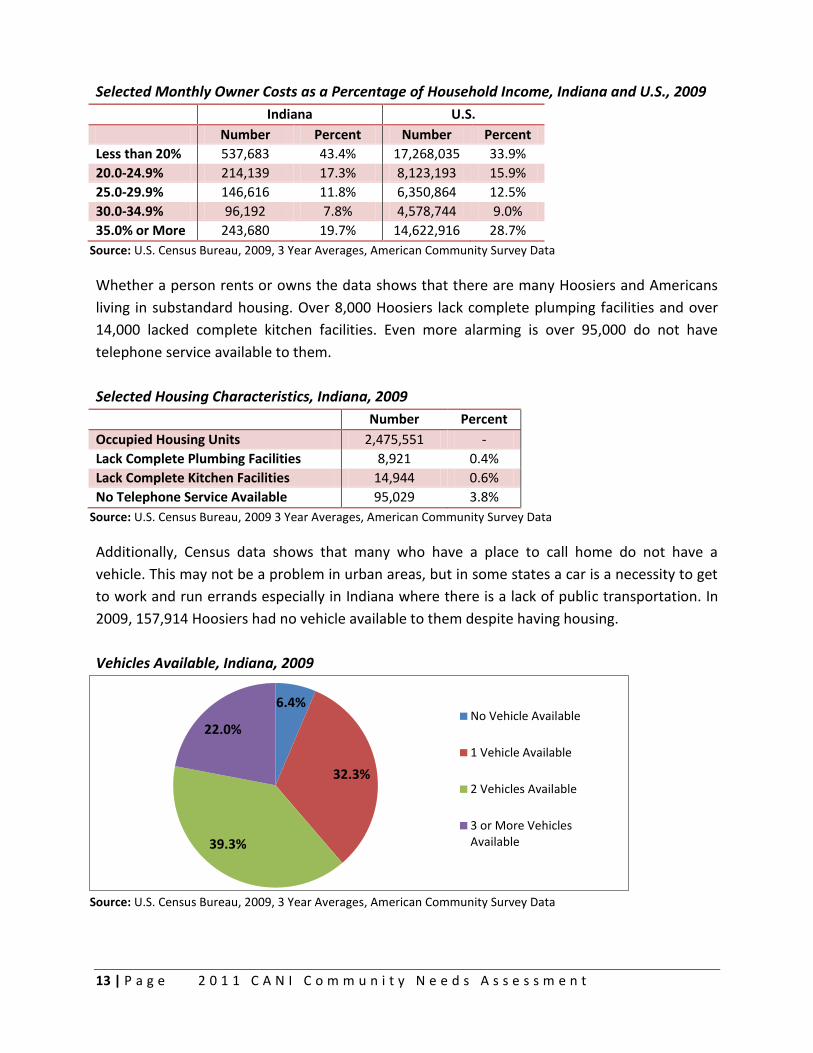
Additionally, Census data shows that many who have a place to call home do not have a
vehicle. This may not be a problem in urban areas, but in some states a car is a necessity to get
to work and run errands especially in Indiana where there is a lack of public transportation. In
2009, 157,914 Hoosiers had no vehicle available to them despite having housing.
Vehicles Available, Indiana, 2009
Source: U.S. Census Bureau, 2009, 3 Year Averages, American Community Survey Data
6.4%
32.3%
39.3%
22.0% No Vehicle Available
1 Vehicle Available
2 Vehicles Available
3 or More VehiclesAvailable
14 | P a g e 2 0 1 1 C A N I C o m m u n i t y N e e d s A s s e s s m e n t
Clients Served By CANI Data from Indiana Community Service Block Grant Reports
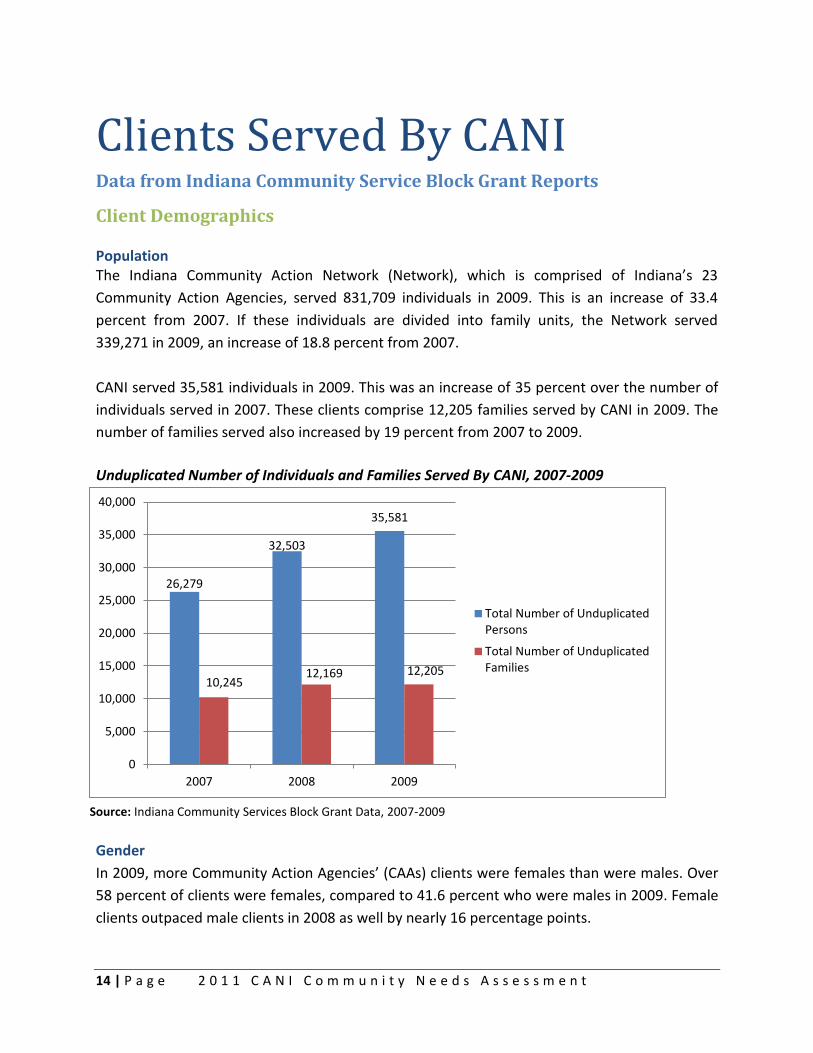
Client Demographics Population The Indiana Community Action Network (Network), which is comprised of Indiana’s 23
Community Action Agencies, served 831,709 individuals in 2009. This is an increase of 33.4
percent from 2007. If these individuals are divided into family units, the Network served
339,271 in 2009, an increase of 18.8 percent from 2007.
CANI served 35,581 individuals in 2009. This was an increase of 35 percent over the number of
individuals served in 2007. These clients comprise 12,205 families served by CANI in 2009. The
number of families served also increased by 19 percent from 2007 to 2009.
Unduplicated Number of Individuals and Families Served By CANI, 2007-2009
Source: Indiana Community Services Block Grant Data, 2007-2009
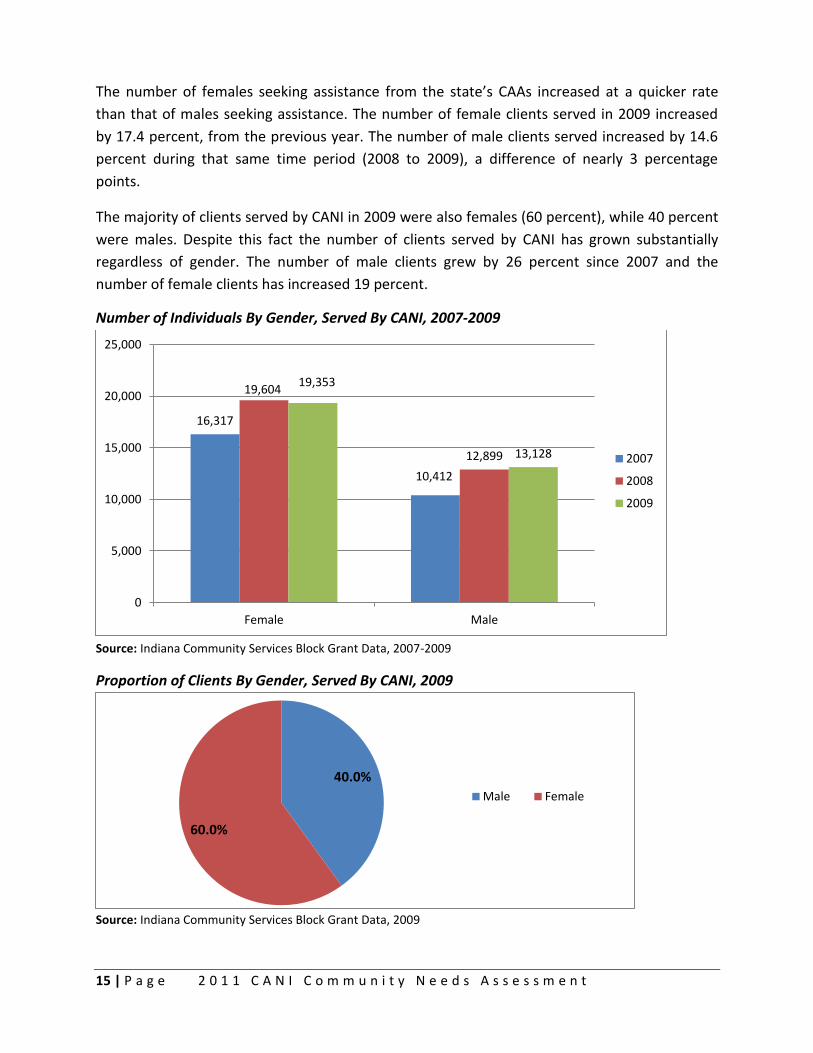
Gender
In 2009, more Community Action Agencies’ (CAAs) clients were females than were males. Over
58 percent of clients were females, compared to 41.6 percent who were males in 2009. Female
clients outpaced male clients in 2008 as well by nearly 16 percentage points.
26,279
32,503
35,581
10,245 12,169 12,205
0
5,000
10,000
15,000
20,000
25,000
30,000
35,000
40,000
2007 2008 2009
Total Number of UnduplicatedPersons
Total Number of UnduplicatedFamilies
15 | P a g e 2 0 1 1 C A N I C o m m u n i t y N e e d s A s s e s s m e n t
The number of females seeking assistance from the state’s CAAs increased at a quicker rate
than that of males seeking assistance. The number of female clients served in 2009 increased
by 17.4 percent, from the previous year. The number of male clients served increased by 14.6
percent during that same time period (2008 to 2009), a difference of nearly 3 percentage
points.
The majority of clients served by CANI in 2009 were also females (60 percent), while 40 percent
were males. Despite this fact the number of clients served by CANI has grown substantially
regardless of gender. The number of male clients grew by 26 percent since 2007 and the
number of female clients has increased 19 percent.
Number of Individuals By Gender, Served By CANI, 2007-2009
Source: Indiana Community Services Block Grant Data, 2007-2009
Proportion of Clients By Gender, Served By CANI, 2009
Source: Indiana Community Services Block Grant Data, 2009
16,317
10,412
19,604
12,899
19,353
13,128
0
5,000
10,000
15,000
20,000
25,000
Female Male
2007
2008
2009
40.0%
60.0%
Male Female
16 | P a g e 2 0 1 1 C A N I C o m m u n i t y N e e d s A s s e s s m e n t
From 2007 to 2009, the number of male clients has grown at a slightly higher pace than female
clients. From 2007 to 2008, the number of female clients actually decreased by 1.3 percent.
Number of Individuals By Gender, Served By CANI, 2007-2009
Male Female Total
2007 10,412 16,317 36,729
2008 12,899 19,604 32,503
2009 13,128 19.353 32,481
Source: Indiana Community Services Block Grant Data, 2009
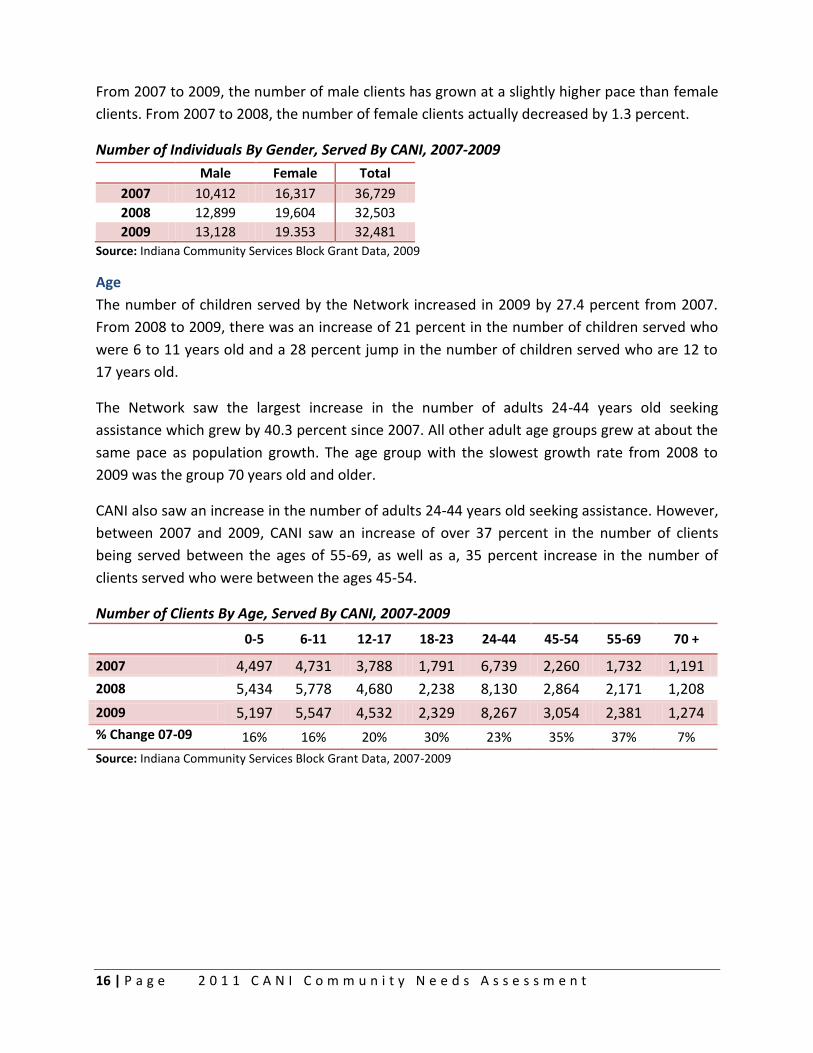
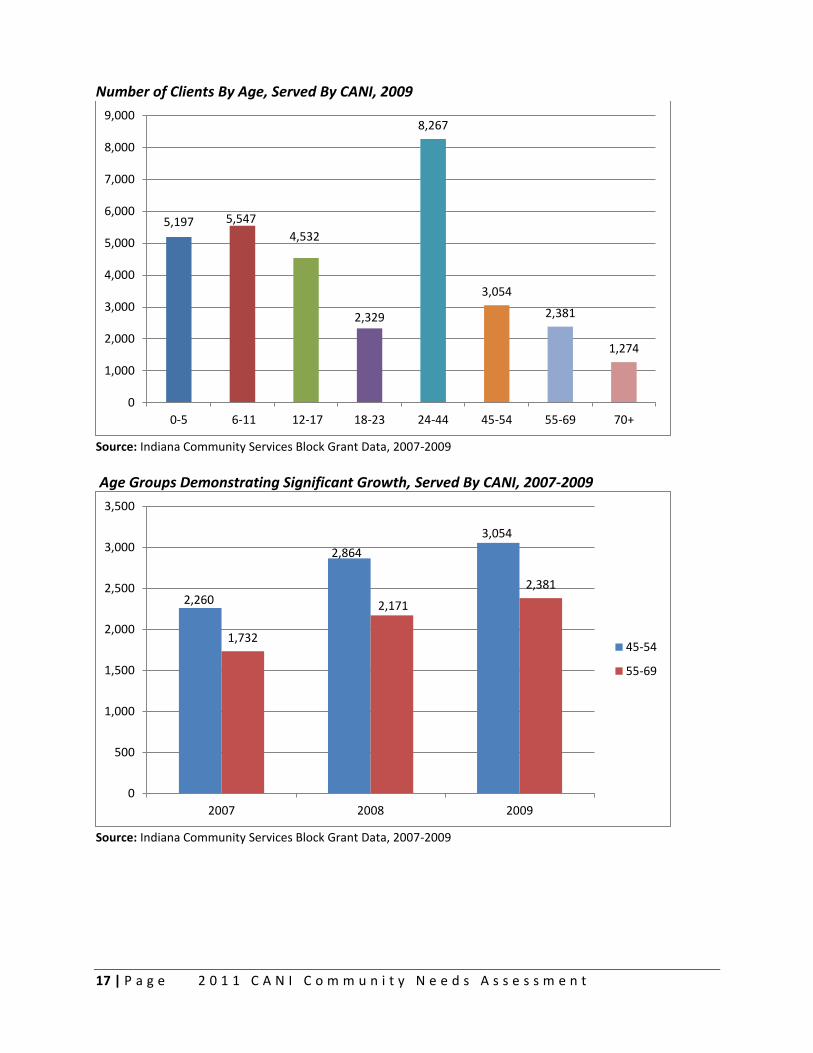
Age
The number of children served by the Network increased in 2009 by 27.4 percent from 2007.
From 2008 to 2009, there was an increase of 21 percent in the number of children served who
were 6 to 11 years old and a 28 percent jump in the number of children served who are 12 to
17 years old.
The Network saw the largest increase in the number of adults 24-44 years old seeking
assistance which grew by 40.3 percent since 2007. All other adult age groups grew at about the
same pace as population growth. The age group with the slowest growth rate from 2008 to
2009 was the group 70 years old and older.
CANI also saw an increase in the number of adults 24-44 years old seeking assistance. However,
between 2007 and 2009, CANI saw an increase of over 37 percent in the number of clients
being served between the ages of 55-69, as well as a, 35 percent increase in the number of
clients served who were between the ages 45-54.
Number of Clients By Age, Served By CANI, 2007-2009 0-5 6-11 12-17 18-23 24-44 45-54 55-69 70 +
2007 4,497 4,731 3,788 1,791 6,739 2,260 1,732 1,191
2008 5,434 5,778 4,680 2,238 8,130 2,864 2,171 1,208
2009 5,197 5,547 4,532 2,329 8,267 3,054 2,381 1,274
% Change 07-09 16% 16% 20% 30% 23% 35% 37% 7%
Source: Indiana Community Services Block Grant Data, 2007-2009
17 | P a g e 2 0 1 1 C A N I C o m m u n i t y N e e d s A s s e s s m e n t
Number of Clients By Age, Served By CANI, 2009
Source: Indiana Community Services Block Grant Data, 2007-2009
Age Groups Demonstrating Significant Growth, Served By CANI, 2007-2009
Source: Indiana Community Services Block Grant Data, 2007-2009
5,197 5,547
4,532
2,329
8,267
3,054
2,381
1,274
0
1,000
2,000
3,000
4,000
5,000
6,000
7,000
8,000
9,000
0-5 6-11 12-17 18-23 24-44 45-54 55-69 70+
2,260
2,864
3,054
1,732
2,171
2,381
0
500
1,000
1,500
2,000
2,500
3,000
3,500
2007 2008 2009
45-54
55-69

18 | P a g e 2 0 1 1 C A N I C o m m u n i t y N e e d s A s s e s s m e n t
In 2009, the Network served 305,462 children under the age of 18. These children accounted for 42
percent of the clients served by the Network.
Children were the largest population served by CANI at 47 percent followed by adults at 42 percent.
This makes sense as CANI is a Head Start and Early Head Start provider.
Proportion of Clients By Age Group, Served By CANI, 2009
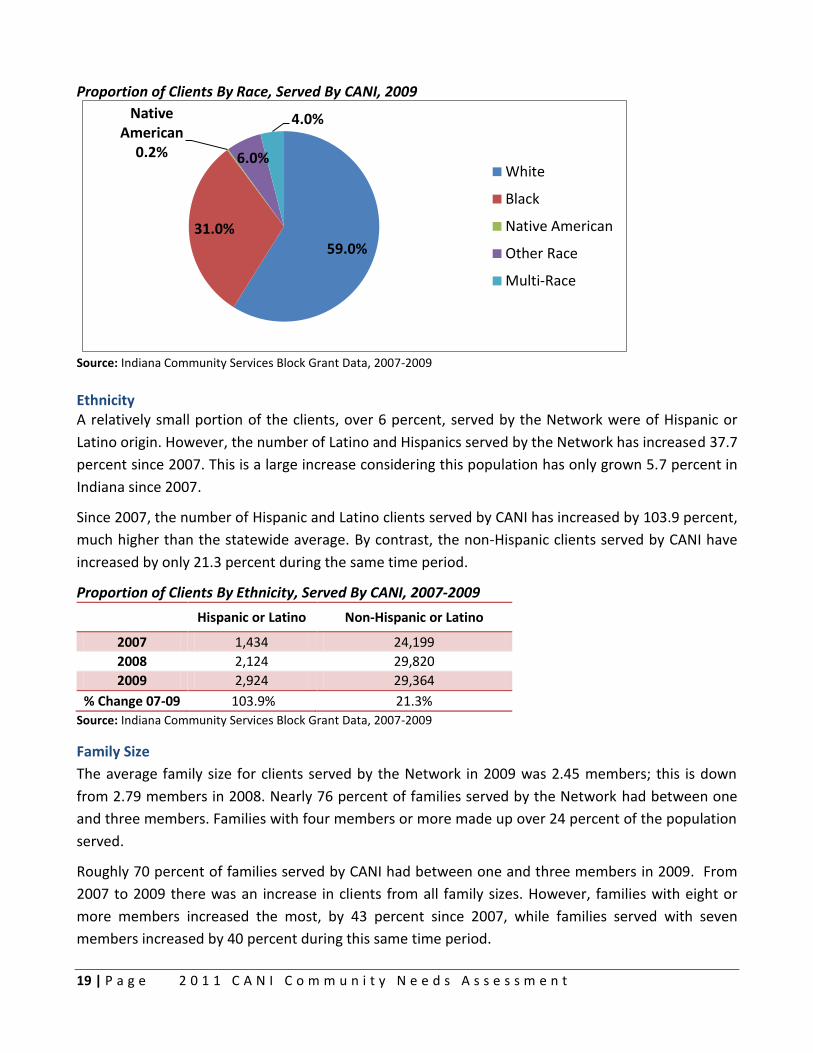
Source: Indiana Community Services Block Grant Data, 2007-2009 Race In 2009, the number of White clients served increased by 54.3 percent from 2007. There was also a
significant increase in the number of other race and multi-race clients, which increased 61.5 percent
and 42.6 percent respectively since 2007. During the same time period, the number of Asian clients
served decreased by 49.9 percent, yet this is one of the populations growing in the state (see Census
section of this report). The number of Black clients served also decreased by 23.1 percent since 2007.
The number of White clients served by CANI increased by 32 percent from 2007. Over the same time
period, other populations served that significantly increased were: other race clients by 211 percent;
and Native American clients by 50 percent.
Proportion of Clients By Race, Served By CANI, 2007-2009
White Black
Native American
Asian Other Race Multi-Race
2007 14,562 10,202 36 388 648 893 2008 17,882 11,822 78 305 1,373 1,043 2009 19,234 9,962 54 0 2,013 1,164
% Change 07-09 32% -2% 50% -100% 211% 30%
Source: Indiana Community Services Block Grant Data, 2007-2009
11%
42%
47% Seniors
Adults
Children
19 | P a g e 2 0 1 1 C A N I C o m m u n i t y N e e d s A s s e s s m e n t
Proportion of Clients By Race, Served By CANI, 2009
Source: Indiana Community Services Block Grant Data, 2007-2009 Ethnicity
A relatively small portion of the clients, over 6 percent, served by the Network were of Hispanic or
Latino origin. However, the number of Latino and Hispanics served by the Network has increased 37.7
percent since 2007. This is a large increase considering this population has only grown 5.7 percent in
Indiana since 2007.
Since 2007, the number of Hispanic and Latino clients served by CANI has increased by 103.9 percent,
much higher than the statewide average. By contrast, the non-Hispanic clients served by CANI have
increased by only 21.3 percent during the same time period.
Proportion of Clients By Ethnicity, Served By CANI, 2007-2009
Hispanic or Latino Non-Hispanic or Latino
2007 1,434 24,199
2008 2,124 29,820
2009 2,924 29,364
% Change 07-09 103.9% 21.3%
Source: Indiana Community Services Block Grant Data, 2007-2009
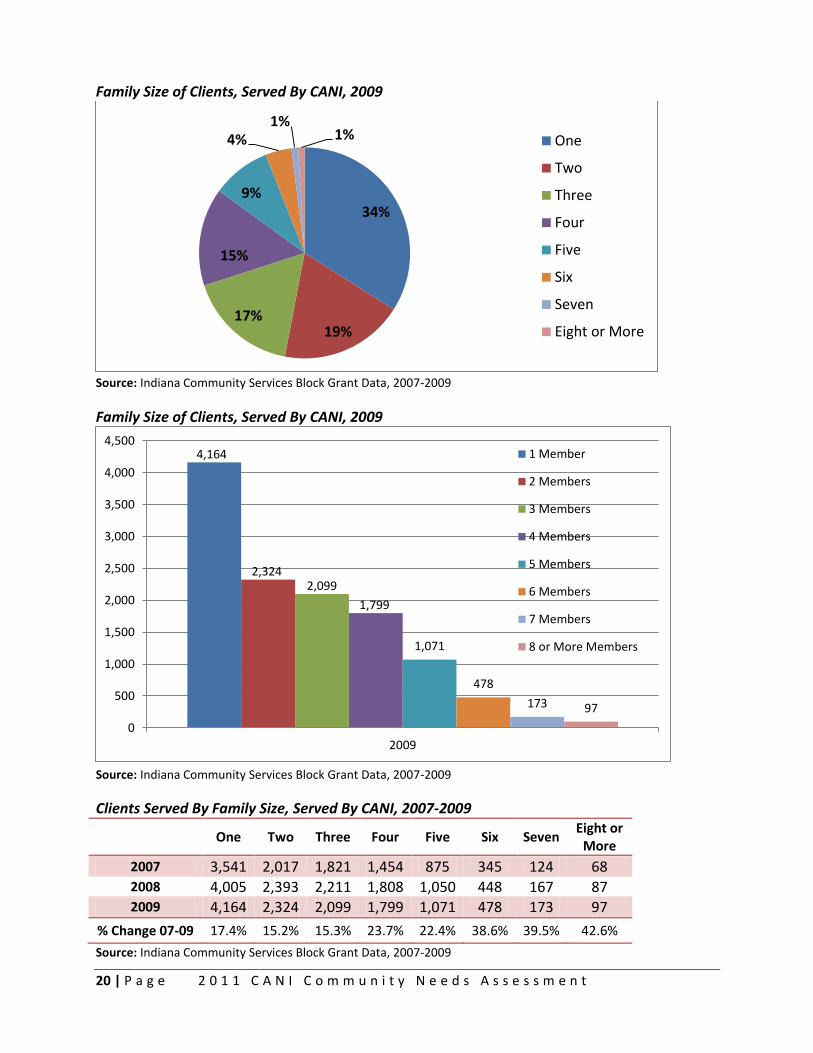
Family Size
The average family size for clients served by the Network in 2009 was 2.45 members; this is down
from 2.79 members in 2008. Nearly 76 percent of families served by the Network had between one
and three members. Families with four members or more made up over 24 percent of the population
served.
Roughly 70 percent of families served by CANI had between one and three members in 2009. From
2007 to 2009 there was an increase in clients from all family sizes. However, families with eight or
more members increased the most, by 43 percent since 2007, while families served with seven
members increased by 40 percent during this same time period.
59.0% 31.0%
Native American
0.2% 6.0%
4.0%
White
Black
Native American
Other Race
Multi-Race
20 | P a g e 2 0 1 1 C A N I C o m m u n i t y N e e d s A s s e s s m e n t
Family Size of Clients, Served By CANI, 2009
Source: Indiana Community Services Block Grant Data, 2007-2009
Family Size of Clients, Served By CANI, 2009
Source: Indiana Community Services Block Grant Data, 2007-2009
Clients Served By Family Size, Served By CANI, 2007-2009
One Two Three Four Five Six Seven
Eight or More
2007 3,541 2,017 1,821 1,454 875 345 124 68 2008 4,005 2,393 2,211 1,808 1,050 448 167 87 2009 4,164 2,324 2,099 1,799 1,071 478 173 97
% Change 07-09 17.4% 15.2% 15.3% 23.7% 22.4% 38.6% 39.5% 42.6%
Source: Indiana Community Services Block Grant Data, 2007-2009
34%
19% 17%
15%
9%
4% 1%
1% One
Two
Three
Four
Five
Six
Seven
Eight or More
4,164
2,324 2,099
1,799
1,071
478
173 97
0
500
1,000
1,500
2,000
2,500
3,000
3,500
4,000
4,500
2009
1 Member
2 Members
3 Members
4 Members
5 Members
6 Members
7 Members
8 or More Members
21 | P a g e 2 0 1 1 C A N I C o m m u n i t y N e e d s A s s e s s m e n t
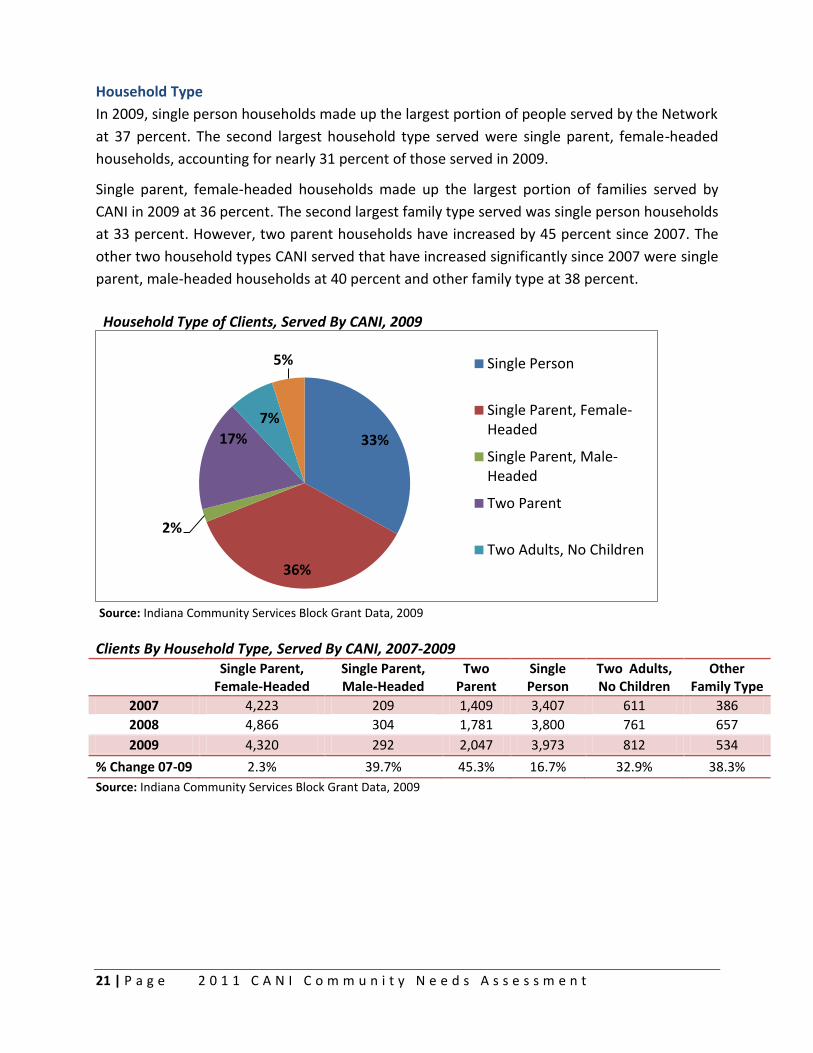
Household Type
In 2009, single person households made up the largest portion of people served by the Network
at 37 percent. The second largest household type served were single parent, female-headed
households, accounting for nearly 31 percent of those served in 2009.
Single parent, female-headed households made up the largest portion of families served by
CANI in 2009 at 36 percent. The second largest family type served was single person households
at 33 percent. However, two parent households have increased by 45 percent since 2007. The
other two household types CANI served that have increased significantly since 2007 were single
parent, male-headed households at 40 percent and other family type at 38 percent.
Household Type of Clients, Served By CANI, 2009
Source: Indiana Community Services Block Grant Data, 2009
Clients By Household Type, Served By CANI, 2007-2009
Single Parent,
Female-Headed Single Parent, Male-Headed
Two Parent
Single Person
Two Adults, No Children
Other Family Type
2007 4,223 209 1,409 3,407 611 386
2008 4,866 304 1,781 3,800 761 657
2009 4,320 292 2,047 3,973 812 534
% Change 07-09 2.3% 39.7% 45.3% 16.7% 32.9% 38.3%
Source: Indiana Community Services Block Grant Data, 2009
33%
36%
2%
17%
7%
5% Single Person
Single Parent, Female-Headed
Single Parent, Male-Headed
Two Parent
Two Adults, No Children
22 | P a g e 2 0 1 1 C A N I C o m m u n i t y N e e d s A s s e s s m e n t
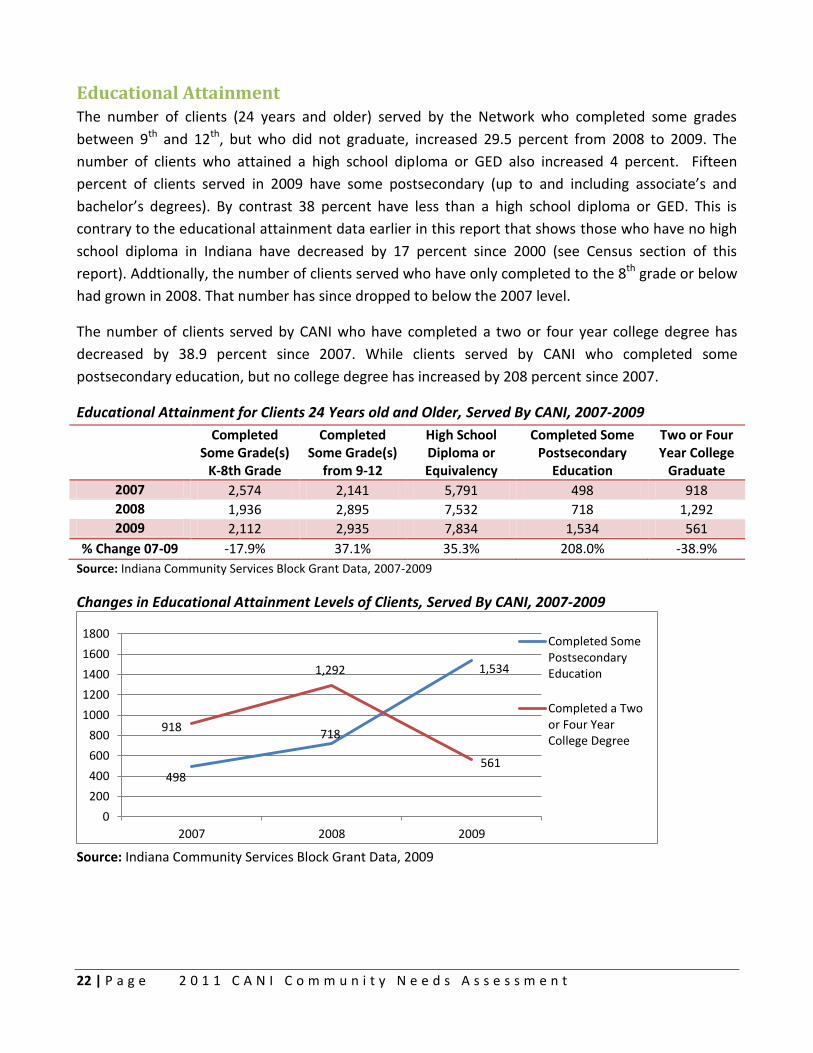
Educational Attainment The number of clients (24 years and older) served by the Network who completed some grades
between 9th and 12th, but who did not graduate, increased 29.5 percent from 2008 to 2009. The
number of clients who attained a high school diploma or GED also increased 4 percent. Fifteen
percent of clients served in 2009 have some postsecondary (up to and including associate’s and
bachelor’s degrees). By contrast 38 percent have less than a high school diploma or GED. This is
contrary to the educational attainment data earlier in this report that shows those who have no high
school diploma in Indiana have decreased by 17 percent since 2000 (see Census section of this
report). Addtionally, the number of clients served who have only completed to the 8th grade or below
had grown in 2008. That number has since dropped to below the 2007 level.
The number of clients served by CANI who have completed a two or four year college degree has
decreased by 38.9 percent since 2007. While clients served by CANI who completed some
postsecondary education, but no college degree has increased by 208 percent since 2007.
Educational Attainment for Clients 24 Years old and Older, Served By CANI, 2007-2009
Completed Some Grade(s)
K-8th Grade
Completed Some Grade(s)
from 9-12
High School Diploma or Equivalency
Completed Some Postsecondary
Education
Two or Four Year College
Graduate
2007 2,574 2,141 5,791 498 918
2008 1,936 2,895 7,532 718 1,292
2009 2,112 2,935 7,834 1,534 561
% Change 07-09 -17.9% 37.1% 35.3% 208.0% -38.9%
Source: Indiana Community Services Block Grant Data, 2007-2009
Changes in Educational Attainment Levels of Clients, Served By CANI, 2007-2009
Source: Indiana Community Services Block Grant Data, 2009
498
718
1,534
918
1,292
561
0
200
400
600
800
1000
1200
1400
1600
1800
2007 2008 2009
Completed SomePostsecondaryEducation
Completed a Twoor Four YearCollege Degree
23 | P a g e 2 0 1 1 C A N I C o m m u n i t y N e e d s A s s e s s m e n t
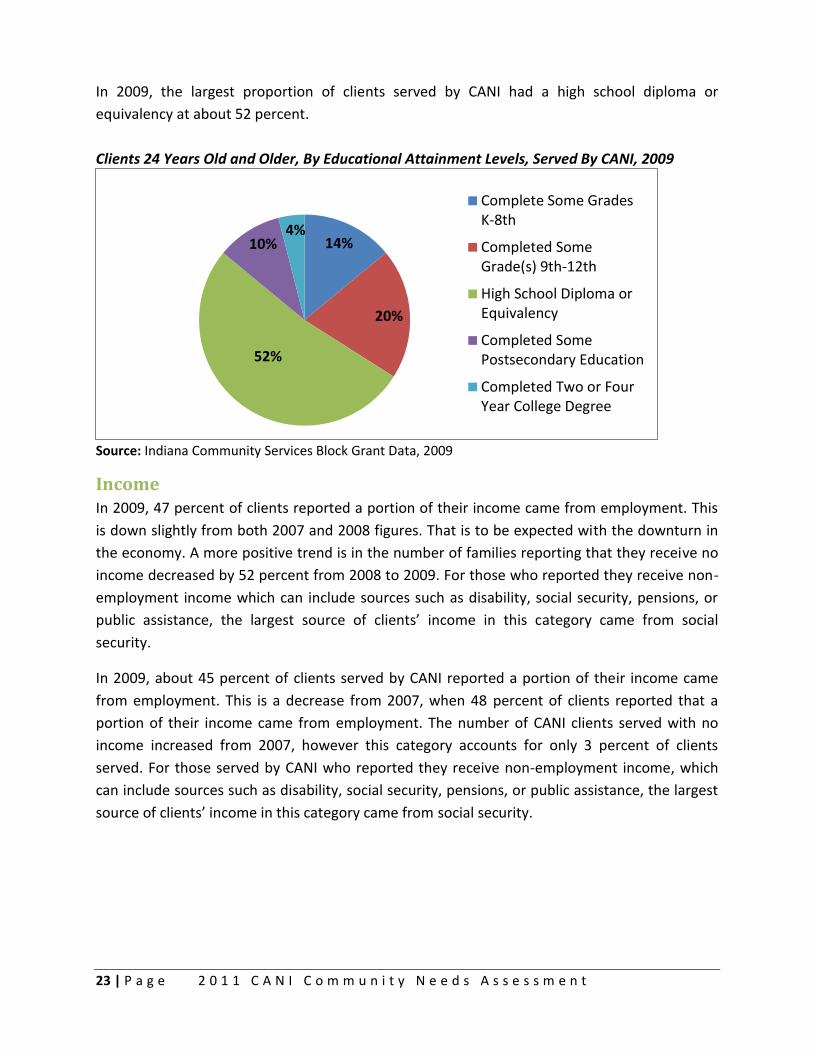
In 2009, the largest proportion of clients served by CANI had a high school diploma or
equivalency at about 52 percent.
Clients 24 Years Old and Older, By Educational Attainment Levels, Served By CANI, 2009
Source: Indiana Community Services Block Grant Data, 2009
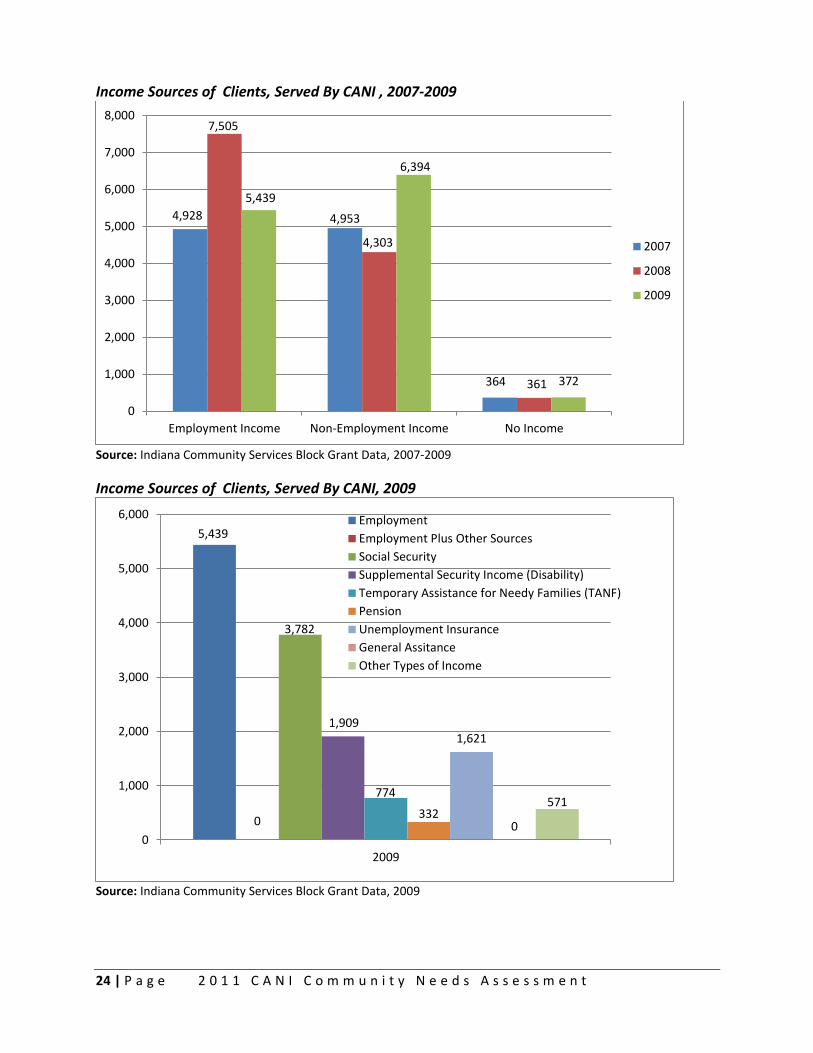
Income In 2009, 47 percent of clients reported a portion of their income came from employment. This
is down slightly from both 2007 and 2008 figures. That is to be expected with the downturn in
the economy. A more positive trend is in the number of families reporting that they receive no
income decreased by 52 percent from 2008 to 2009. For those who reported they receive non-
employment income which can include sources such as disability, social security, pensions, or
public assistance, the largest source of clients’ income in this category came from social
security.
In 2009, about 45 percent of clients served by CANI reported a portion of their income came
from employment. This is a decrease from 2007, when 48 percent of clients reported that a
portion of their income came from employment. The number of CANI clients served with no
income increased from 2007, however this category accounts for only 3 percent of clients
served. For those served by CANI who reported they receive non-employment income, which
can include sources such as disability, social security, pensions, or public assistance, the largest
source of clients’ income in this category came from social security.
14%
20%
52%
10% 4%
Complete Some GradesK-8th
Completed SomeGrade(s) 9th-12th
High School Diploma orEquivalency
Completed SomePostsecondary Education
Completed Two or FourYear College Degree
24 | P a g e 2 0 1 1 C A N I C o m m u n i t y N e e d s A s s e s s m e n t
Income Sources of Clients, Served By CANI , 2007-2009
Source: Indiana Community Services Block Grant Data, 2007-2009
Income Sources of Clients, Served By CANI, 2009
Source: Indiana Community Services Block Grant Data, 2009
4,928 4,953
364
7,505
4,303
361
5,439
6,394
372
0
1,000
2,000
3,000
4,000
5,000
6,000
7,000
8,000
Employment Income Non-Employment Income No Income
2007
2008
2009
5,439
0
3,782
1,909
774
332
1,621
0
571
0
1,000
2,000
3,000
4,000
5,000
6,000
2009
Employment
Employment Plus Other Sources
Social Security
Supplemental Security Income (Disability)
Temporary Assistance for Needy Families (TANF)
Pension
Unemployment Insurance
General Assitance
Other Types of Income
25 | P a g e 2 0 1 1 C A N I C o m m u n i t y N e e d s A s s e s s m e n t
Locally Identified Causes of Poverty and Community Needs Data from Client and Stakeholder Surveys
Survey Information In order to better serve the residents of our community, it is important that we maintain an up-to-
date picture of who they are and what they need. To do this, CANI’s board and staff participated in
the statewide Community Needs Assessment study which was conducted by the Indiana Community
Action Network.
The research was conducted in two parts:
Background research was conducted using secondary data available from federal, state, and
local sources.
Client and stakeholder surveys were designed and administered directly to Hoosiers who are
served by CANI or who partner with CANI (Both survey instruments are located in Appendix
A).
The client survey was randomly sent in September 2010 to those who had received services from
CANI in 2009. There were 13,772 surveys returned statewide, of which five hundred and seventeen
were from CANI clients. Clients who received the survey were asked what their community needs
were and what were the barriers to clients having those needs met. While the significance of each
question has not been calculated, this number of responses gives the survey an overall margin of
error of .83 at the 95 percent confidence level.
Client Survey Data
Employment
Roughly half of clients served by the Network in 2009 were employed at some level. Due to
limitations in the CSBG data it is unknown the exact number of clients who are employed full-time.
However, from 2007 to 2009, roughly 50 percent of the clients served by the Network did not receive
income from employment.
CANI’s CSBG data, shows that CANI was slightly lower than the statewide average with approximately
45 percent of clients served recieveing income from employment in 2009 and 52 percent of clients
receiving non-employment income. The client survey results can help explain some of the barriers to
emplyoment that may be leading to these statistics both on state and local levels.

26 | P a g e 2 0 1 1 C A N I C o m m u n i t y N e e d s A s s e s s m e n t
Sources of Client Income, Indiana, 2009
Source: Indiana Community Services Block Grant Data, 2009
Sources of Client Income, CANI, 2009
Source: Indiana Community Services Block Grant Data, 2009
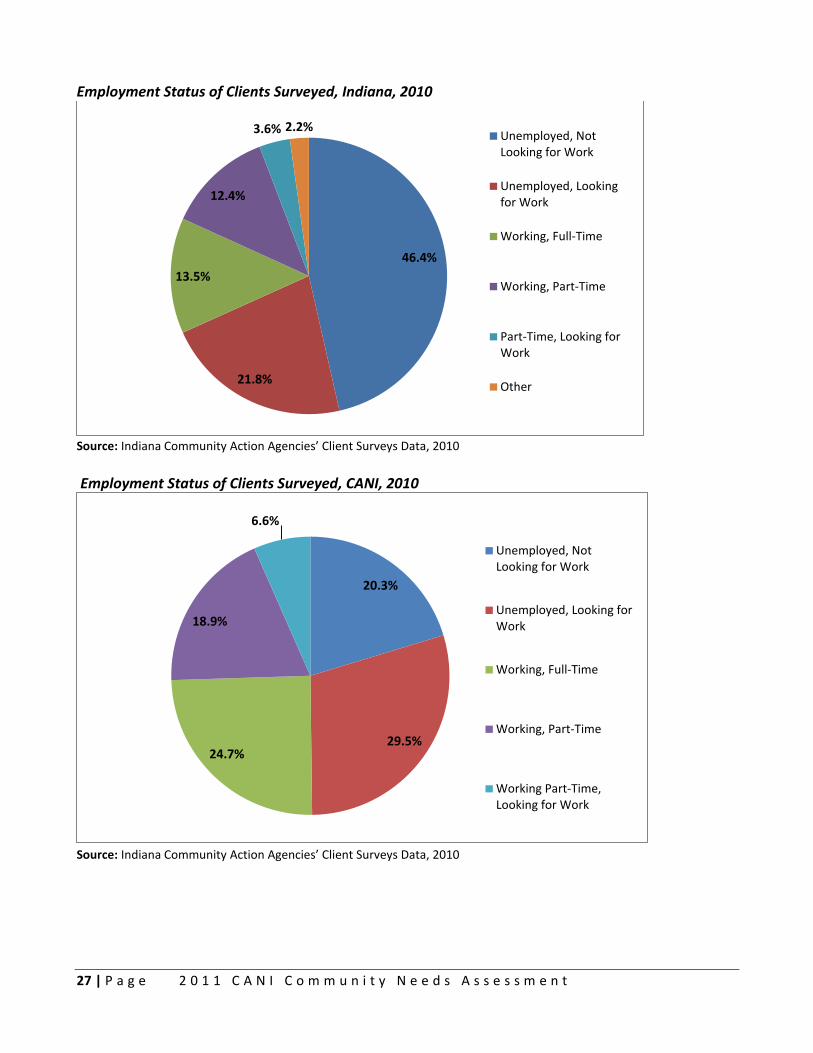
The client survey asked questions regarding employment status and barriers to employment. Of
clients surveyed statewide, 30 percent of respondents reported that they had some form of
employment. By contrast, 68 percent reported that they were unemployed.
Many of CANI’s survey respondents, 50 percent were unemployed. Fifty percent of CANI survey
respondents reported that they had some form of employment. However, 6.6 percent reported there
were working part-time, but looking for full-time employment.
These categories were broken into sub–groups and clients were also asked about specifics about
their employment status and were given the following options:
Full Time
Part-Time
Part-Time, Looking for Work
Unemployed- Looking For Work
Unemployed-Not Looking For Work
47.2%
50.2%
2.7%
All or Part of Income Comesfrom Employment
Non-Employment Income
No Income
45%
52%
3%
All or Part of Income Comesfrom Employment
Non-Employment Income
No Income
27 | P a g e 2 0 1 1 C A N I C o m m u n i t y N e e d s A s s e s s m e n t
Employment Status of Clients Surveyed, Indiana, 2010
Source: Indiana Community Action Agencies’ Client Surveys Data, 2010
Employment Status of Clients Surveyed, CANI, 2010
Source: Indiana Community Action Agencies’ Client Surveys Data, 2010
46.4%
21.8%
13.5%
12.4%
3.6% 2.2% Unemployed, NotLooking for Work
Unemployed, Lookingfor Work
Working, Full-Time
Working, Part-Time
Part-Time, Looking forWork
Other
20.3%
29.5% 24.7%
18.9%
6.6%
Unemployed, NotLooking for Work
Unemployed, Looking forWork
Working, Full-Time
Working, Part-Time
Working Part-Time,Looking for Work
28 | P a g e 2 0 1 1 C A N I C o m m u n i t y N e e d s A s s e s s m e n t
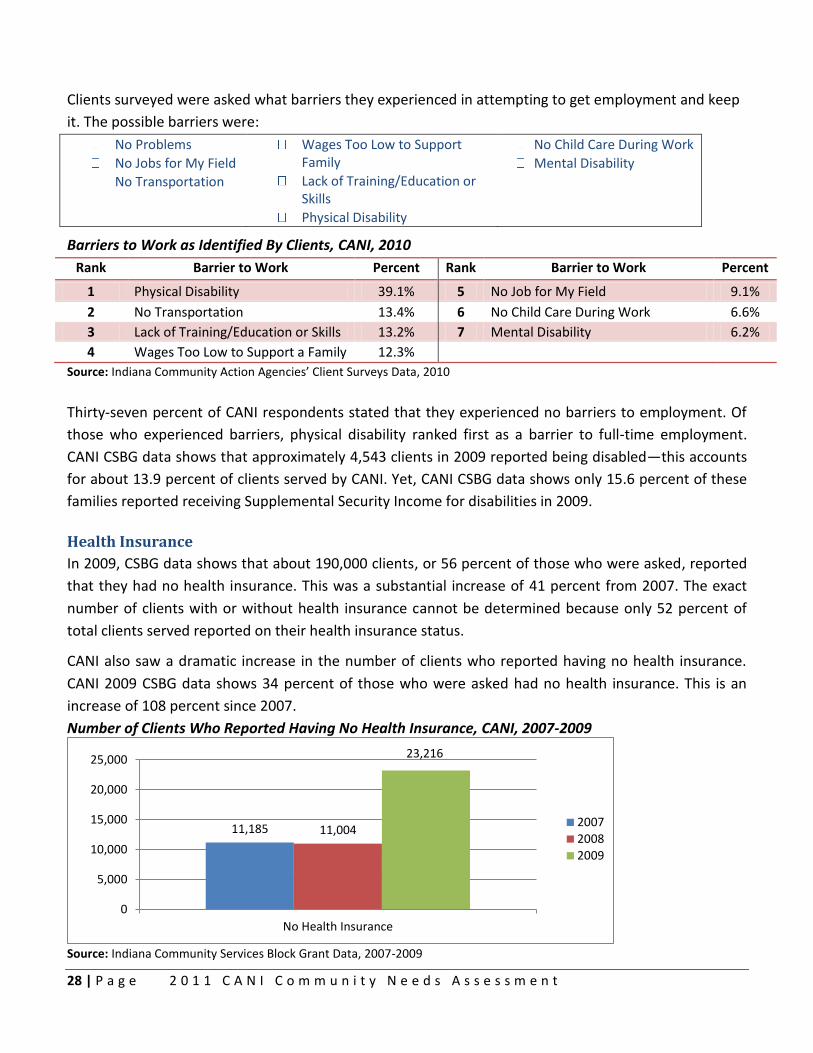
Clients surveyed were asked what barriers they experienced in attempting to get employment and keep
it. The possible barriers were:
No Problems
No Jobs for My Field
No Transportation
Wages Too Low to Support Family
Lack of Training/Education or Skills
Physical Disability
No Child Care During Work
Mental Disability
Barriers to Work as Identified By Clients, CANI, 2010
Rank Barrier to Work Percent Rank Barrier to Work Percent
1 Physical Disability 39.1% 5 No Job for My Field 9.1%
2 No Transportation 13.4% 6 No Child Care During Work 6.6%
3 Lack of Training/Education or Skills 13.2% 7 Mental Disability 6.2%
4 Wages Too Low to Support a Family 12.3%
Source: Indiana Community Action Agencies’ Client Surveys Data, 2010
Thirty-seven percent of CANI respondents stated that they experienced no barriers to employment. Of
those who experienced barriers, physical disability ranked first as a barrier to full-time employment.
CANI CSBG data shows that approximately 4,543 clients in 2009 reported being disabled—this accounts
for about 13.9 percent of clients served by CANI. Yet, CANI CSBG data shows only 15.6 percent of these
families reported receiving Supplemental Security Income for disabilities in 2009.
Health Insurance
In 2009, CSBG data shows that about 190,000 clients, or 56 percent of those who were asked, reported
that they had no health insurance. This was a substantial increase of 41 percent from 2007. The exact
number of clients with or without health insurance cannot be determined because only 52 percent of
total clients served reported on their health insurance status.
CANI also saw a dramatic increase in the number of clients who reported having no health insurance.
CANI 2009 CSBG data shows 34 percent of those who were asked had no health insurance. This is an
increase of 108 percent since 2007.
Number of Clients Who Reported Having No Health Insurance, CANI, 2007-2009
Source: Indiana Community Services Block Grant Data, 2007-2009
11,185 11,004
23,216
0
5,000
10,000
15,000
20,000
25,000
No Health Insurance
2007
2008
2009
29 | P a g e 2 0 1 1 C A N I C o m m u n i t y N e e d s A s s e s s m e n t
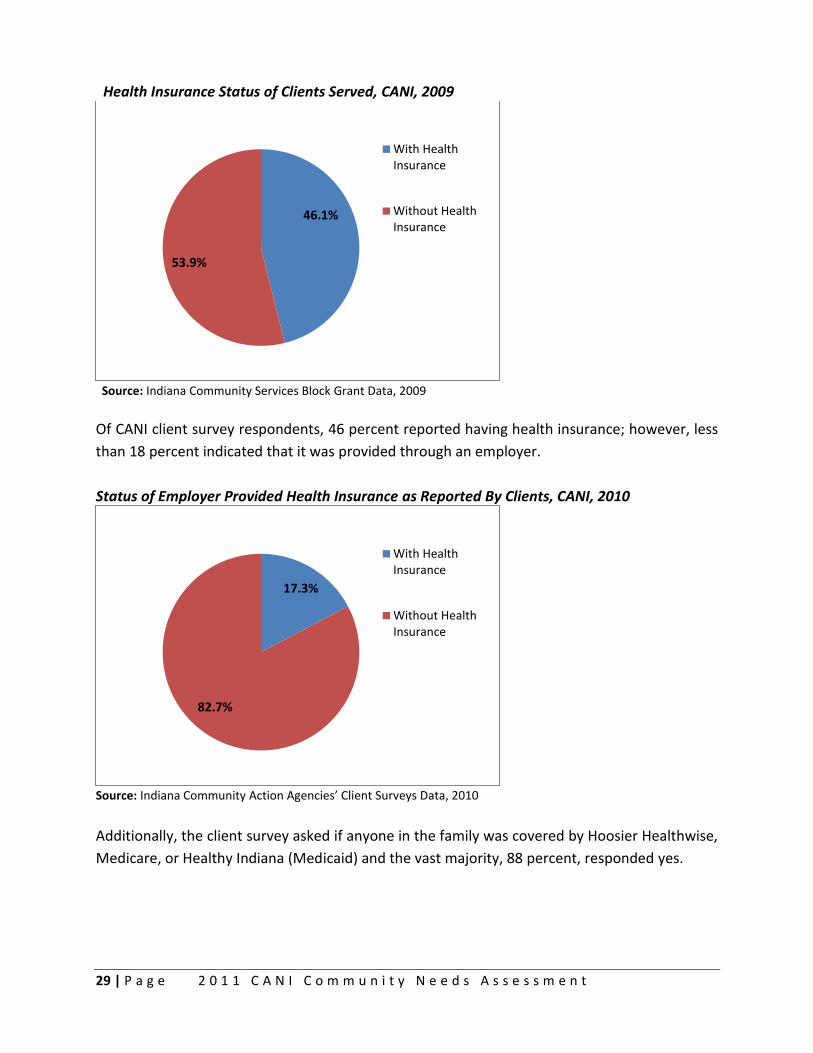
Health Insurance Status of Clients Served, CANI, 2009
Source: Indiana Community Services Block Grant Data, 2009
Of CANI client survey respondents, 46 percent reported having health insurance; however, less
than 18 percent indicated that it was provided through an employer.
Status of Employer Provided Health Insurance as Reported By Clients, CANI, 2010
Source: Indiana Community Action Agencies’ Client Surveys Data, 2010
Additionally, the client survey asked if anyone in the family was covered by Hoosier Healthwise,
Medicare, or Healthy Indiana (Medicaid) and the vast majority, 88 percent, responded yes.
46.1%
53.9%
With HealthInsurance
Without HealthInsurance
17.3%
82.7%
With HealthInsurance
Without HealthInsurance
30 | P a g e 2 0 1 1 C A N I C o m m u n i t y N e e d s A s s e s s m e n t
Public Health Insurance Coverage as Reported By Clients, CANI, 2010
Source: Indiana Community Action Agencies’ Client Surveys Data, 2010
Clients surveyed were asked what barriers they experienced related to health insurance
coverage. Thirty-six percent of clients surveyed statewide and 32 percent of CANI clients
surveyed reported no barriers to health coverage. The remainder selected from these possible
barriers:
No Problems
Cost
Not offered by employer
Lack of Knowledge of Public or Private Insurance Options
No Private Insurance Available
Poor Credit
Barriers to Health Insurance Coverage as Identified By Clients, CANI, 2010
Rank Barrier to Health Insurance Percent Rank Barrier to Health Insurance Percent
1 Cost 67.2% 4 No Private Insurance Available 1.8%
2 Not Offered by Employer 18.7% 5 Poor Credit 0.9%
3 Lack of Knowledge of Public or Private Insurance Options
11.3%
Source: Indiana Community Action Agencies’ Client Surveys Data, 2010
Child Care In 2009, according to CSBG data, there were over 214,000 children served by the Network who
were of “child care age.” This means they were younger than 12 years old and therefore have a
potential need for child care services. The number of children who are of child care age served
by the Network has increased by 38 percent since 2007.
CANI CSBG data shows that 15,726 children served by CANI in 2009 where child care age. The
number of children who are of child care age served by CANI has increased by 17 percent since
2007.
88.3%
11.7%
Covered byPublic HealthInsurance
Not Covered byPublic HealthInsurance
31 | P a g e 2 0 1 1 C A N I C o m m u n i t y N e e d s A s s e s s m e n t
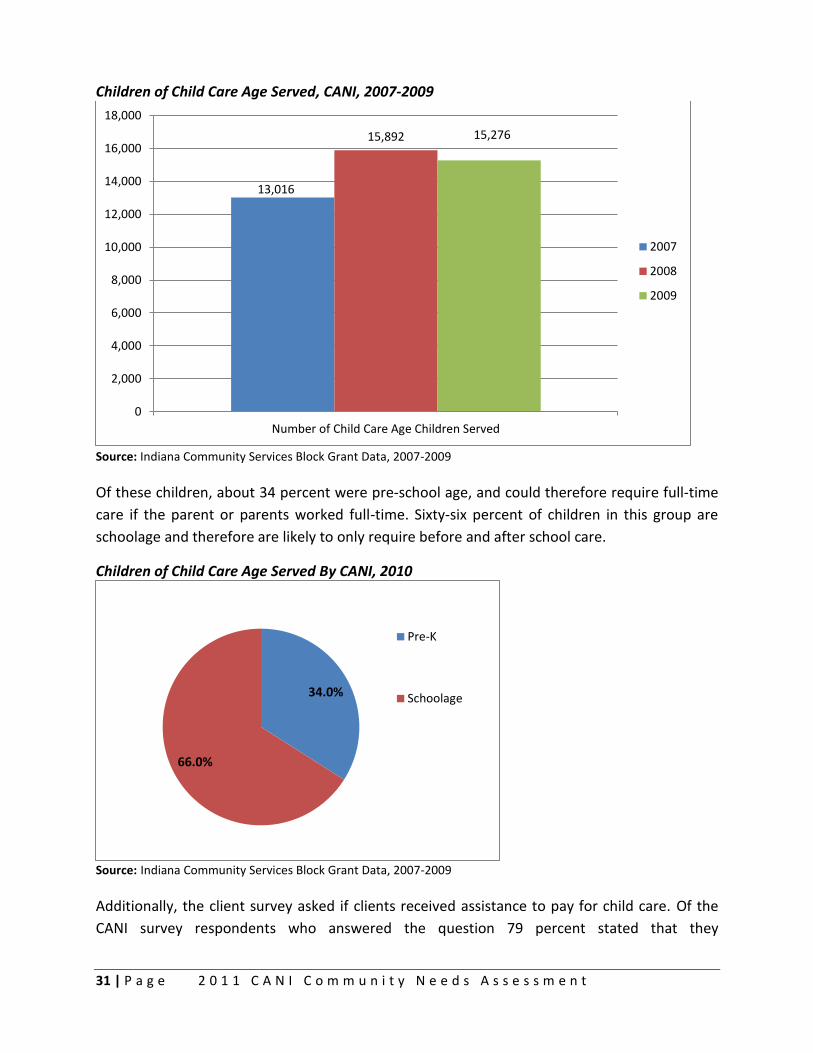
Children of Child Care Age Served, CANI, 2007-2009
Source: Indiana Community Services Block Grant Data, 2007-2009
Of these children, about 34 percent were pre-school age, and could therefore require full-time
care if the parent or parents worked full-time. Sixty-six percent of children in this group are
schoolage and therefore are likely to only require before and after school care.
Children of Child Care Age Served By CANI, 2010
Source: Indiana Community Services Block Grant Data, 2007-2009
Additionally, the client survey asked if clients received assistance to pay for child care. Of the
CANI survey respondents who answered the question 79 percent stated that they
13,016
15,892 15,276
0
2,000
4,000
6,000
8,000
10,000
12,000
14,000
16,000
18,000
Number of Child Care Age Children Served
2007
2008
2009
34.0%
66.0%
Pre-K
Schoolage
32 | P a g e 2 0 1 1 C A N I C o m m u n i t y N e e d s A s s e s s m e n t
received financial assistance to pay for child care. This was much higher than the statewide
average of 8 percent when you include all survey respondents.
Clients were also asked about the barriers they experience when trying to secure child care.
No Problems
Cost
Hours Not Sufficient
Children have Special Needs
Location of Care Providers
No Transportation
Quality of Providers
Not Enough Providers
Barriers to Child Care as Identified By Clients, CANI, 2010
Rank Barrier to Child Care Percent Rank Barrier to Child Care Percent
1 No Transportation 49.3% 5 Children Have Special Needs 2.3%
2 Cost 34.0% 6 Not Enough Providers 1.6%
3 Hours Not Sufficient 7.4% 7 Location of Providers 0.7%
4 Quality of Providers 4.7%
Source: Indiana Community Action Agencies’ Client Surveys Data, 2010
Only 3 percent of CANI’s survey respondents said they have no barrier to child care. For those
who did respond with barriers, no transportation was ranked first and cost ranked second.
Child Support
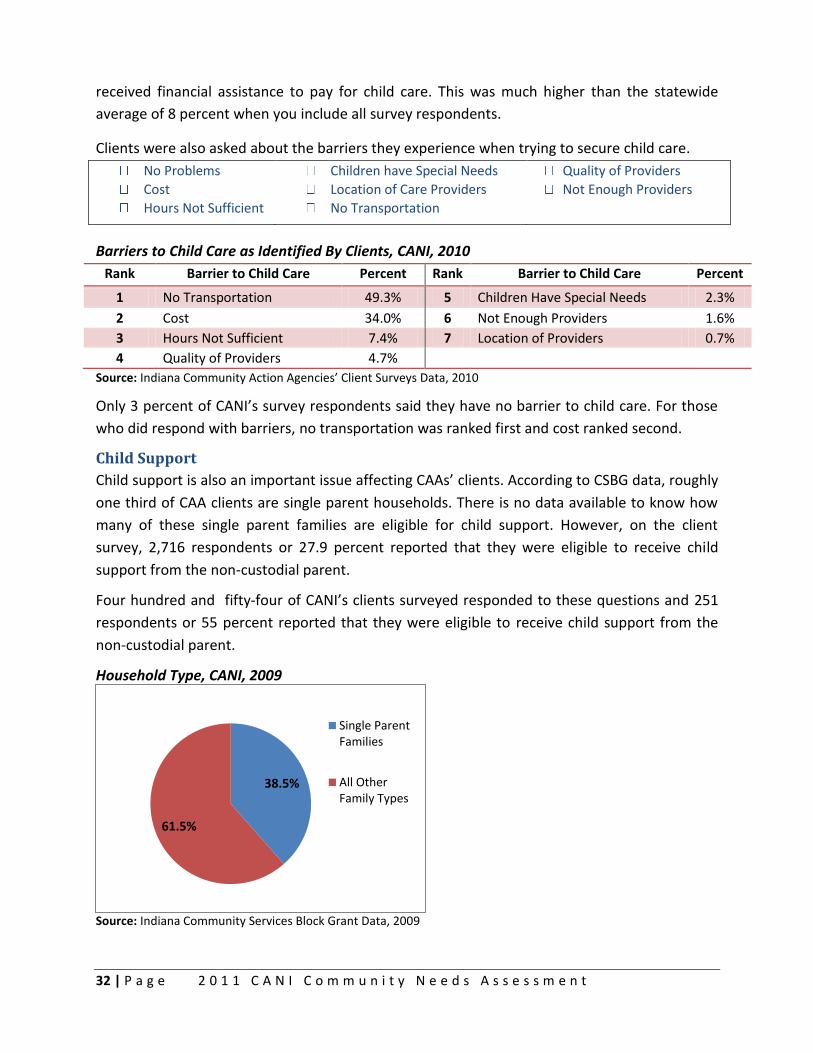
Child support is also an important issue affecting CAAs’ clients. According to CSBG data, roughly
one third of CAA clients are single parent households. There is no data available to know how
many of these single parent families are eligible for child support. However, on the client
survey, 2,716 respondents or 27.9 percent reported that they were eligible to receive child
support from the non-custodial parent.
Four hundred and fifty-four of CANI’s clients surveyed responded to these questions and 251
respondents or 55 percent reported that they were eligible to receive child support from the
non-custodial parent.
Household Type, CANI, 2009
Source: Indiana Community Services Block Grant Data, 2009
38.5%
61.5%
Single ParentFamilies
All OtherFamily Types
33 | P a g e 2 0 1 1 C A N I C o m m u n i t y N e e d s A s s e s s m e n t
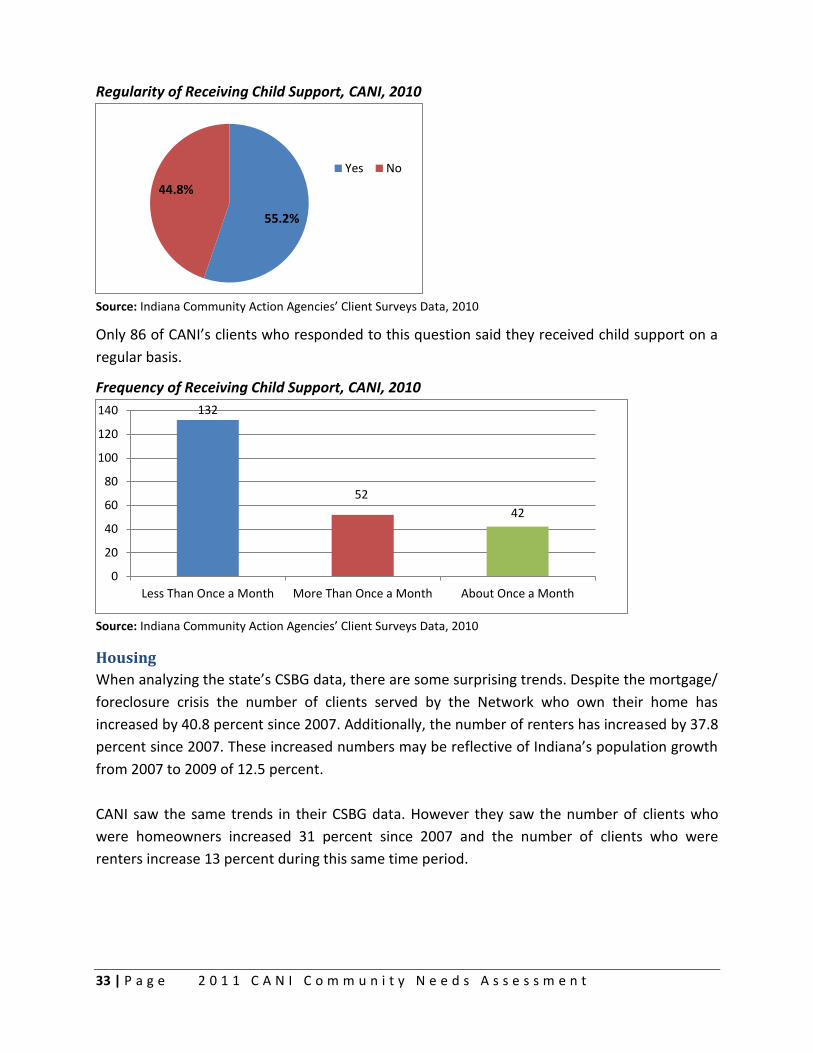
Regularity of Receiving Child Support, CANI, 2010
Source: Indiana Community Action Agencies’ Client Surveys Data, 2010
Only 86 of CANI’s clients who responded to this question said they received child support on a
regular basis.
Frequency of Receiving Child Support, CANI, 2010
Source: Indiana Community Action Agencies’ Client Surveys Data, 2010
Housing
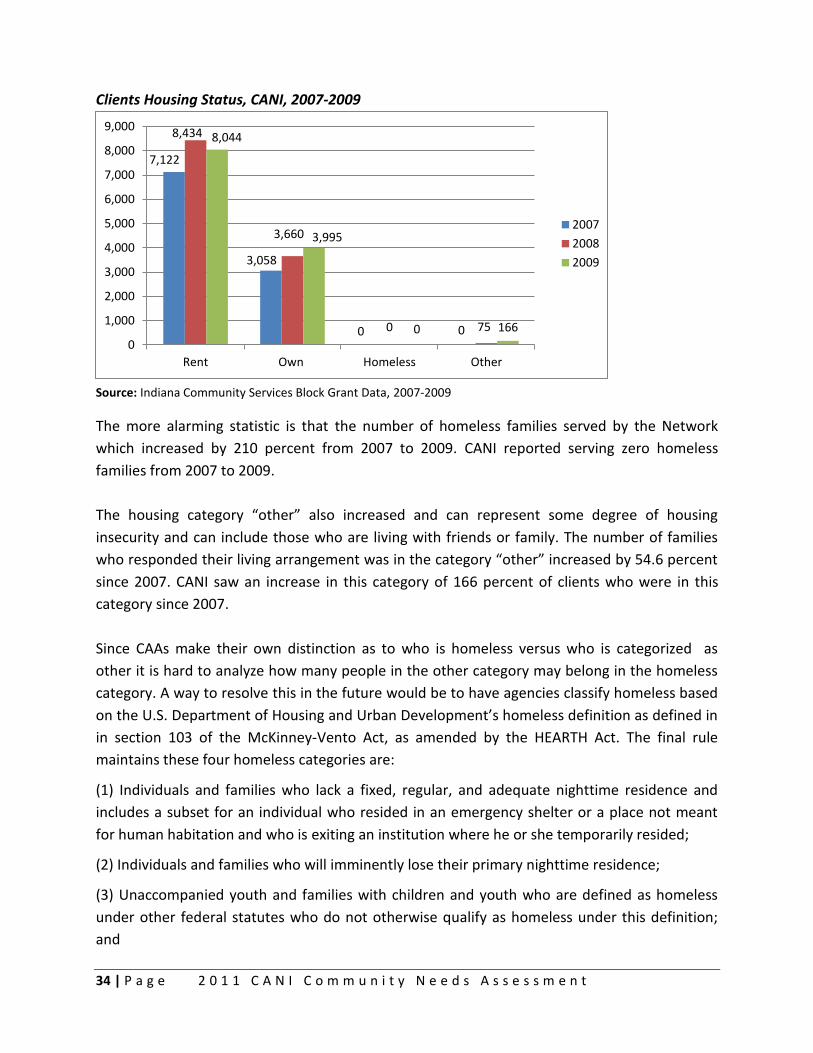
When analyzing the state’s CSBG data, there are some surprising trends. Despite the mortgage/
foreclosure crisis the number of clients served by the Network who own their home has
increased by 40.8 percent since 2007. Additionally, the number of renters has increased by 37.8
percent since 2007. These increased numbers may be reflective of Indiana’s population growth
from 2007 to 2009 of 12.5 percent.
CANI saw the same trends in their CSBG data. However they saw the number of clients who
were homeowners increased 31 percent since 2007 and the number of clients who were
renters increase 13 percent during this same time period.
55.2%
44.8%
Yes No
132
52
42
0
20
40
60
80
100
120
140
Less Than Once a Month More Than Once a Month About Once a Month
34 | P a g e 2 0 1 1 C A N I C o m m u n i t y N e e d s A s s e s s m e n t
Clients Housing Status, CANI, 2007-2009
Source: Indiana Community Services Block Grant Data, 2007-2009
The more alarming statistic is that the number of homeless families served by the Network
which increased by 210 percent from 2007 to 2009. CANI reported serving zero homeless
families from 2007 to 2009.
The housing category “other” also increased and can represent some degree of housing
insecurity and can include those who are living with friends or family. The number of families
who responded their living arrangement was in the category “other” increased by 54.6 percent
since 2007. CANI saw an increase in this category of 166 percent of clients who were in this
category since 2007.
Since CAAs make their own distinction as to who is homeless versus who is categorized as
other it is hard to analyze how many people in the other category may belong in the homeless
category. A way to resolve this in the future would be to have agencies classify homeless based
on the U.S. Department of Housing and Urban Development’s homeless definition as defined in
in section 103 of the McKinney-Vento Act, as amended by the HEARTH Act. The final rule
maintains these four homeless categories are:
(1) Individuals and families who lack a fixed, regular, and adequate nighttime residence and
includes a subset for an individual who resided in an emergency shelter or a place not meant
for human habitation and who is exiting an institution where he or she temporarily resided;
(2) Individuals and families who will imminently lose their primary nighttime residence;
(3) Unaccompanied youth and families with children and youth who are defined as homeless
under other federal statutes who do not otherwise qualify as homeless under this definition;
and
7,122
3,058
0 0
8,434
3,660
0 75
8,044
3,995
0 166
0
1,000
2,000
3,000
4,000
5,000
6,000
7,000
8,000
9,000
Rent Own Homeless Other
2007
2008
2009
35 | P a g e 2 0 1 1 C A N I C o m m u n i t y N e e d s A s s e s s m e n t
(4) Individuals and families who are fleeing, or are attempting to flee, domestic violence, dating
violence, sexual assault, stalking, or other dangerous or life-threatening conditions that relate
to violence against the individual or a family member. Throughout this preamble, all references
to a number ‘‘category of homeless.’’
Additionally, if CAAs would start to track what is included in the other category, the Network
would be better able to address clients’ housing needs. The barriers to housing identified by
clients in this section may also assist with understanding what might be part of the other
category and what clients’ needs are related to housing.
In this section, data was further analyzed from income sources of CSBG data, and on the client
survey clients were asked if their rent was more than one third of their gross income. Nearly 60
percent of CANI survey respondents answered yes.
Rent More Than One-Third of Their Gross Income as Reported By Clients, CANI, 2010
Source: Indiana Community Action Agencies’ Client Surveys Data, 2010
Survey respondents were asked if they experienced barriers to housing. Nearly 35 percent of
survey respondents statewide, and 22 percent of CANI client survey respondents, said they had
no problems with their housing. The remainder selected from the following barriers:
No Problems
Rent Too High
Utilities Too High
House Needs Major Repairs
Can’t Find Affordable Housing
House Payment Too High
Barriers to Housing as Identified By Clients, CANI, 2010
Rank Barrier to Housing Percent Rank Barrier to Housing Percent
1 Rent Too High 46.3% 4 House Needs Major Repairs 8.4%
2 Utilities Too High 29.9% 5 House Payment Too High 3.9%
3 Can’t Find Affordable Housing 11.5%
Source: Indiana Community Action Agencies’ Client Surveys Data, 2010
59.6%
40.4% Yes No
36 | P a g e 2 0 1 1 C A N I C o m m u n i t y N e e d s A s s e s s m e n t
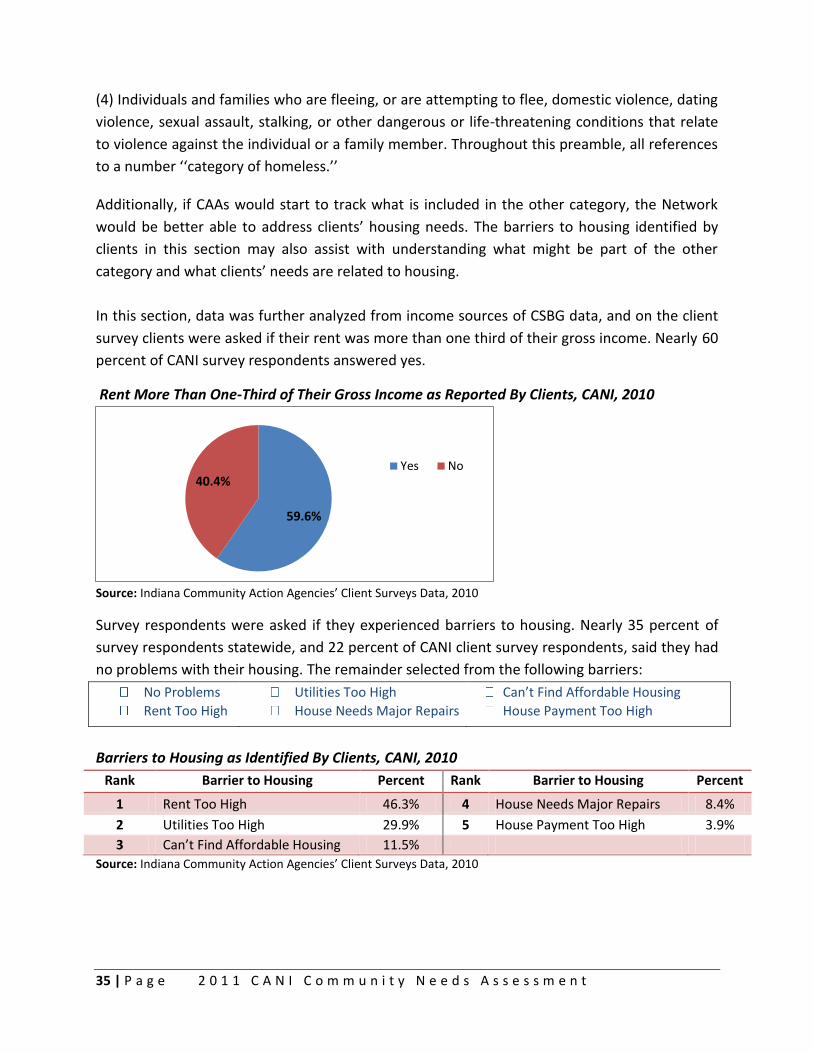
Transportation
Seventy-nine percent of CANI’s survey respondents, as opposed to seventy-six percent of client
survey respondents statewide, said they did have reliable transportation.
Transportation Reliability as Reported By Clients, CANI, 2010
Source: Indiana Community Action Agencies’ Client Surveys Data, 2010
When respondents were asked about their barriers to transportation, 30 percent stated they
had none statewide, and 48 percent of CANI clients, said they did not have barriers. Of those
that reported problems, the price of gas, ranked number one. Barriers that clients could choose
from included:
No Problems
No Car
Price of Gas
Can’t Afford a Car
Can’t Afford Car Repairs
Can’t Afford Car Insurance
No Public Transportation
No Bus Routes Near Home
No Bus Routes Near Work
Barriers to Transpiration as Identified By Clients Served By CANI, 2010
Rank Barrier to Work Percent Rank Barrier to Work Percent
1 Price of Gas 41.8% 5 Can’t Afford a Car 5.2%
2 No Car 31.9% 6 No Bus Routes Near Home 1.2%
3 Can’t Afford Car Repairs 11.2% 7 No Bus Routes Near Work 1.2%
4 Can’t Afford Car Insurance 7.2% 8 No Public Transportation 0.4%
Source: Indiana Community Action Agencies’ Client Surveys Data, 2010
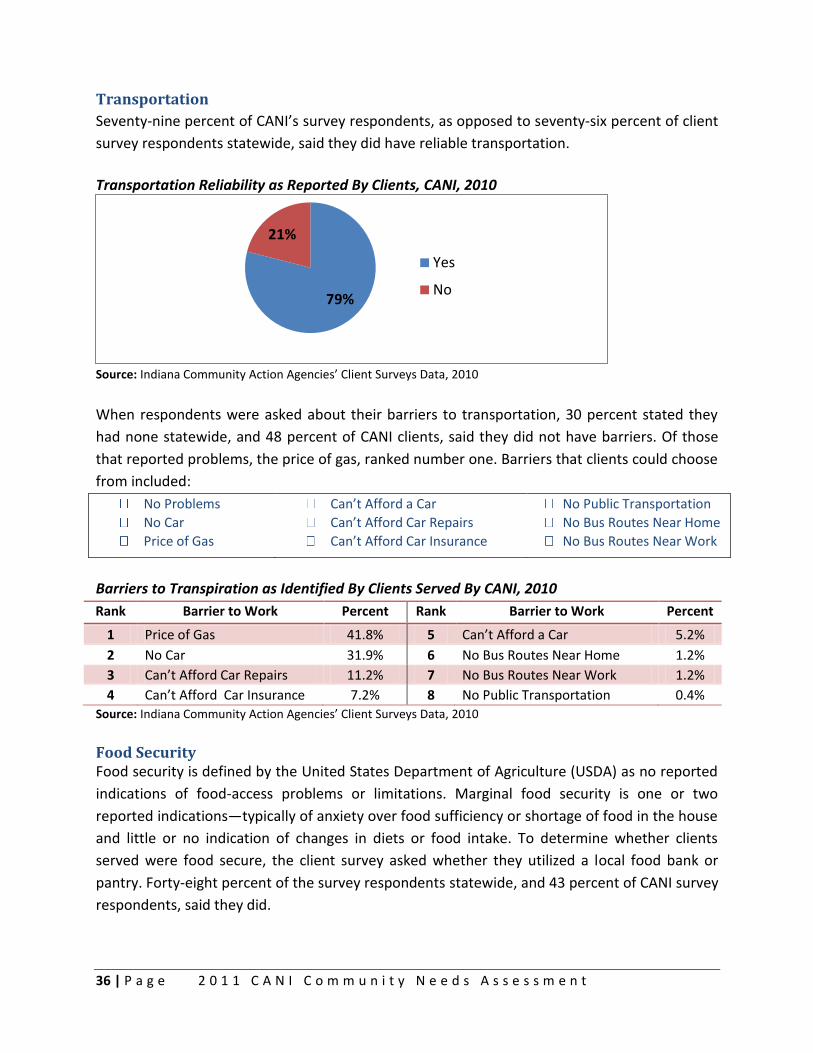
Food Security Food security is defined by the United States Department of Agriculture (USDA) as no reported
indications of food-access problems or limitations. Marginal food security is one or two
reported indications—typically of anxiety over food sufficiency or shortage of food in the house
and little or no indication of changes in diets or food intake. To determine whether clients
served were food secure, the client survey asked whether they utilized a local food bank or
pantry. Forty-eight percent of the survey respondents statewide, and 43 percent of CANI survey
respondents, said they did.
79%
21%
Yes
No
37 | P a g e 2 0 1 1 C A N I C o m m u n i t y N e e d s A s s e s s m e n t
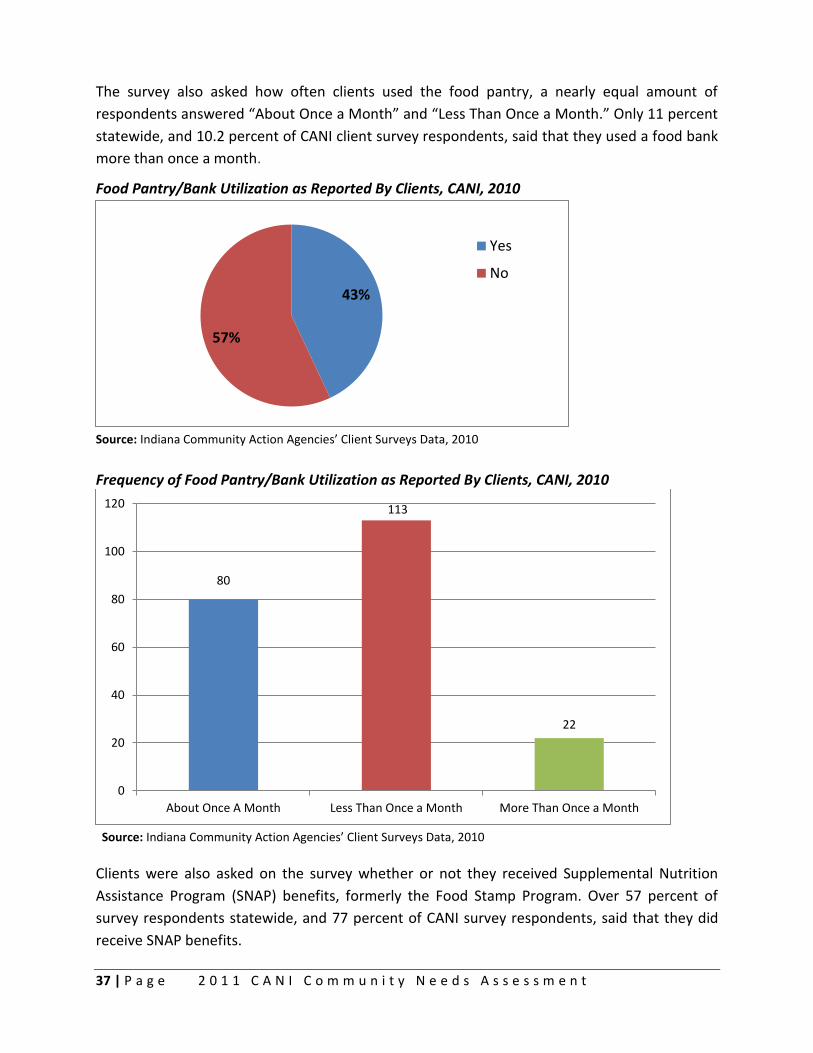
The survey also asked how often clients used the food pantry, a nearly equal amount of
respondents answered “About Once a Month” and “Less Than Once a Month.” Only 11 percent
statewide, and 10.2 percent of CANI client survey respondents, said that they used a food bank
more than once a month.
Food Pantry/Bank Utilization as Reported By Clients, CANI, 2010
Source: Indiana Community Action Agencies’ Client Surveys Data, 2010
Frequency of Food Pantry/Bank Utilization as Reported By Clients, CANI, 2010
Source: Indiana Community Action Agencies’ Client Surveys Data, 2010
Clients were also asked on the survey whether or not they received Supplemental Nutrition
Assistance Program (SNAP) benefits, formerly the Food Stamp Program. Over 57 percent of
survey respondents statewide, and 77 percent of CANI survey respondents, said that they did
receive SNAP benefits.
43%
57%
Yes
No
80
113
22
0
20
40
60
80
100
120
About Once A Month Less Than Once a Month More Than Once a Month
38 | P a g e 2 0 1 1 C A N I C o m m u n i t y N e e d s A s s e s s m e n t
SNAP Utilization as Reported By Clients, CANI, 2010
Do you receive SNAP? Percent
Yes 77.5%
No 22.5%
Source: Indiana Community Action Agencies’ Client Surveys Data, 2010
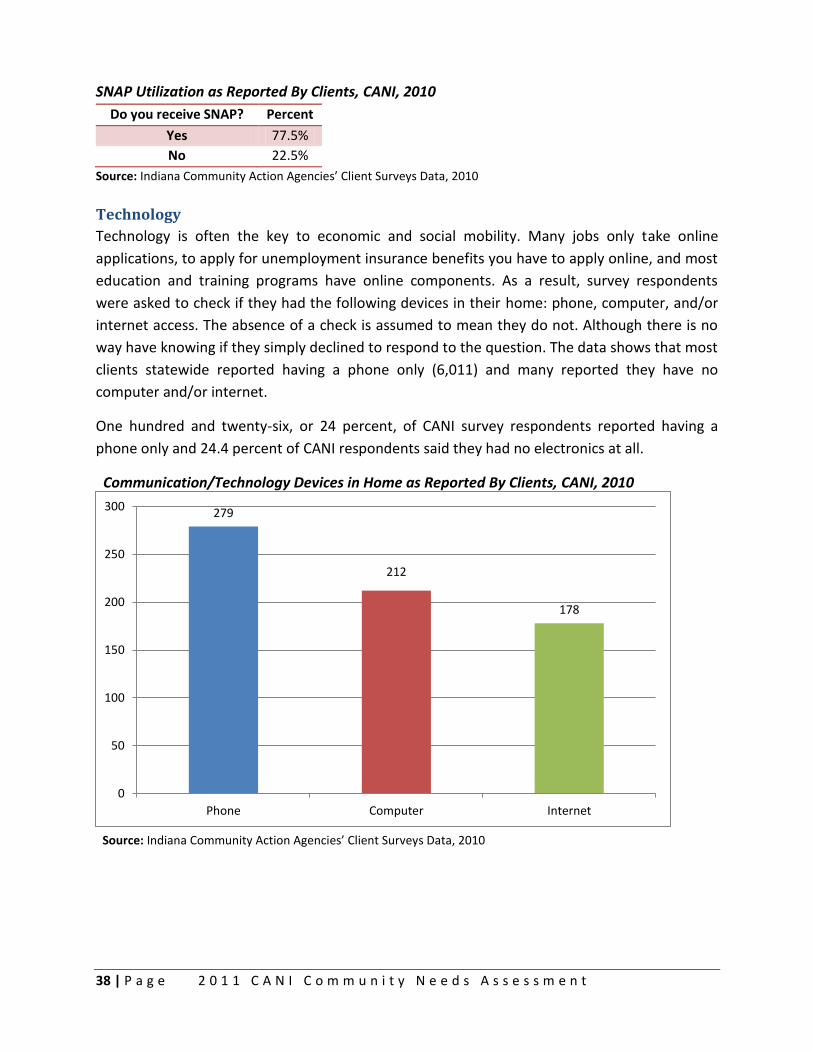
Technology
Technology is often the key to economic and social mobility. Many jobs only take online
applications, to apply for unemployment insurance benefits you have to apply online, and most
education and training programs have online components. As a result, survey respondents
were asked to check if they had the following devices in their home: phone, computer, and/or
internet access. The absence of a check is assumed to mean they do not. Although there is no
way have knowing if they simply declined to respond to the question. The data shows that most
clients statewide reported having a phone only (6,011) and many reported they have no
computer and/or internet.
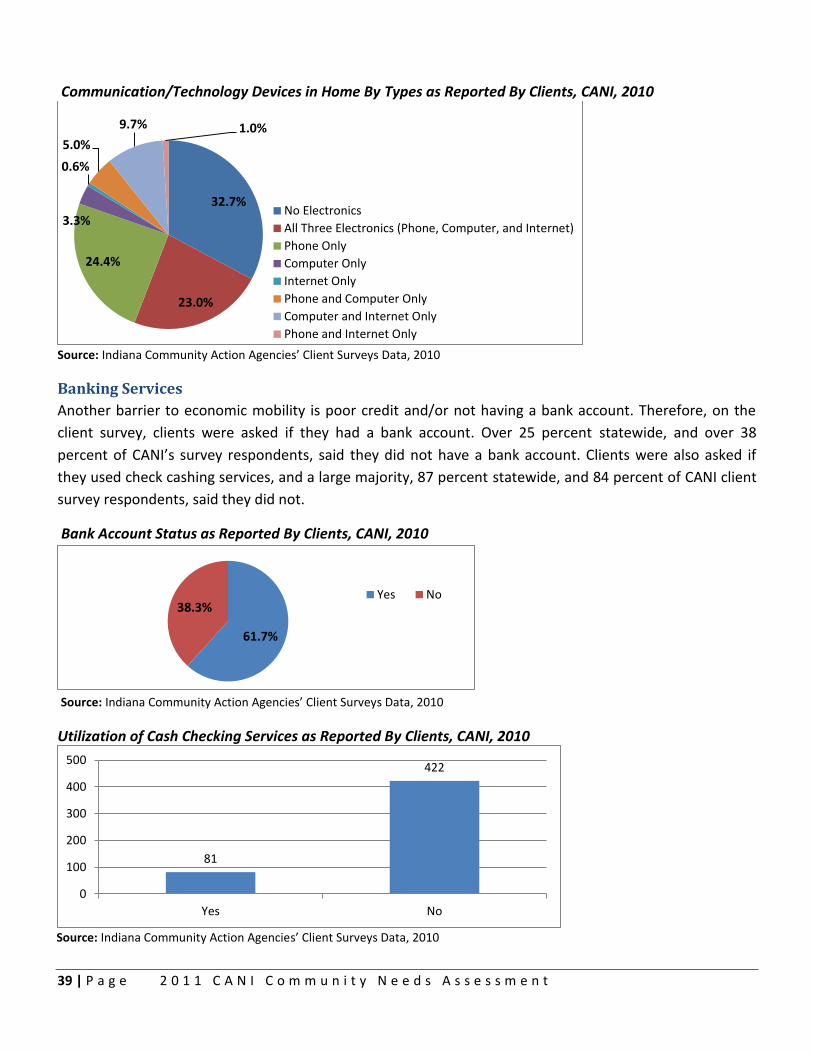
One hundred and twenty-six, or 24 percent, of CANI survey respondents reported having a
phone only and 24.4 percent of CANI respondents said they had no electronics at all.
Communication/Technology Devices in Home as Reported By Clients, CANI, 2010
Source: Indiana Community Action Agencies’ Client Surveys Data, 2010
279
212
178
0
50
100
150
200
250
300
Phone Computer Internet
39 | P a g e 2 0 1 1 C A N I C o m m u n i t y N e e d s A s s e s s m e n t
Communication/Technology Devices in Home By Types as Reported By Clients, CANI, 2010
Source: Indiana Community Action Agencies’ Client Surveys Data, 2010
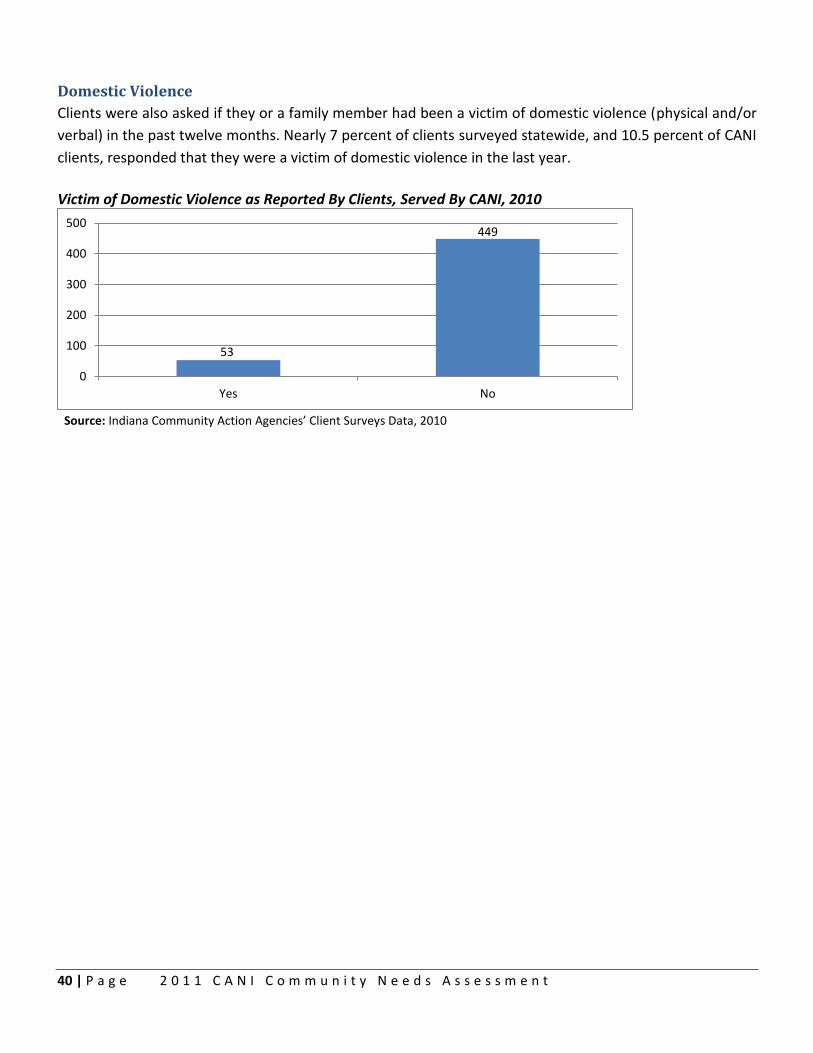
Banking Services Another barrier to economic mobility is poor credit and/or not having a bank account. Therefore, on the
client survey, clients were asked if they had a bank account. Over 25 percent statewide, and over 38
percent of CANI’s survey respondents, said they did not have a bank account. Clients were also asked if
they used check cashing services, and a large majority, 87 percent statewide, and 84 percent of CANI client
survey respondents, said they did not.
Bank Account Status as Reported By Clients, CANI, 2010
Source: Indiana Community Action Agencies’ Client Surveys Data, 2010
Utilization of Cash Checking Services as Reported By Clients, CANI, 2010
Source: Indiana Community Action Agencies’ Client Surveys Data, 2010
32.7%
23.0%
24.4%
3.3%
0.6%
5.0%
9.7% 1.0%
No Electronics
All Three Electronics (Phone, Computer, and Internet)
Phone Only
Computer Only
Internet Only
Phone and Computer Only
Computer and Internet Only
Phone and Internet Only
61.7%
38.3% Yes No
81
422
0
100
200
300
400
500
Yes No
40 | P a g e 2 0 1 1 C A N I C o m m u n i t y N e e d s A s s e s s m e n t
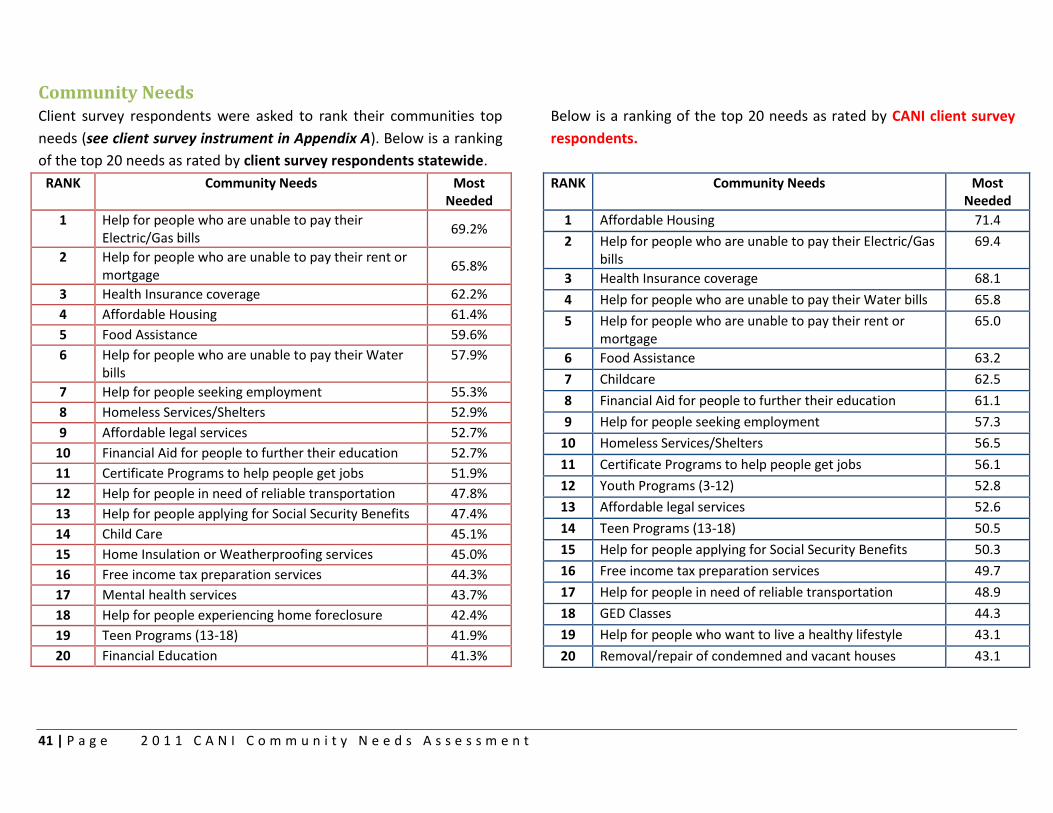
Domestic Violence
Clients were also asked if they or a family member had been a victim of domestic violence (physical and/or
verbal) in the past twelve months. Nearly 7 percent of clients surveyed statewide, and 10.5 percent of CANI
clients, responded that they were a victim of domestic violence in the last year.
Victim of Domestic Violence as Reported By Clients, Served By CANI, 2010
Source: Indiana Community Action Agencies’ Client Surveys Data, 2010
53
449
0
100
200
300
400
500
Yes No
41 | P a g e 2 0 1 1 C A N I C o m m u n i t y N e e d s A s s e s s m e n t
Community Needs Client survey respondents were asked to rank their communities top
needs (see client survey instrument in Appendix A). Below is a ranking
of the top 20 needs as rated by client survey respondents statewide.
RANK Community Needs Most Needed
1 Help for people who are unable to pay their Electric/Gas bills
69.2%
2 Help for people who are unable to pay their rent or mortgage
65.8%
3 Health Insurance coverage 62.2%
4 Affordable Housing 61.4%
5 Food Assistance 59.6%
6 Help for people who are unable to pay their Water bills
57.9%
7 Help for people seeking employment 55.3%
8 Homeless Services/Shelters 52.9%
9 Affordable legal services 52.7%
10 Financial Aid for people to further their education 52.7%
11 Certificate Programs to help people get jobs 51.9%
12 Help for people in need of reliable transportation 47.8%
13 Help for people applying for Social Security Benefits 47.4%
14 Child Care 45.1%
15 Home Insulation or Weatherproofing services 45.0%
16 Free income tax preparation services 44.3%
17 Mental health services 43.7%
18 Help for people experiencing home foreclosure 42.4%
19 Teen Programs (13-18) 41.9%
20 Financial Education 41.3%
Below is a ranking of the top 20 needs as rated by CANI client survey
respondents.
RANK Community Needs Most Needed
1 Affordable Housing 71.4
2 Help for people who are unable to pay their Electric/Gas bills
69.4
3 Health Insurance coverage 68.1
4 Help for people who are unable to pay their Water bills 65.8
5 Help for people who are unable to pay their rent or mortgage
65.0
6 Food Assistance 63.2
7 Childcare 62.5
8 Financial Aid for people to further their education 61.1
9 Help for people seeking employment 57.3
10 Homeless Services/Shelters 56.5
11 Certificate Programs to help people get jobs 56.1
12 Youth Programs (3-12) 52.8
13 Affordable legal services 52.6
14 Teen Programs (13-18) 50.5
15 Help for people applying for Social Security Benefits 50.3
16 Free income tax preparation services 49.7
17 Help for people in need of reliable transportation 48.9
18 GED Classes 44.3
19 Help for people who want to live a healthy lifestyle 43.1
20 Removal/repair of condemned and vacant houses 43.1
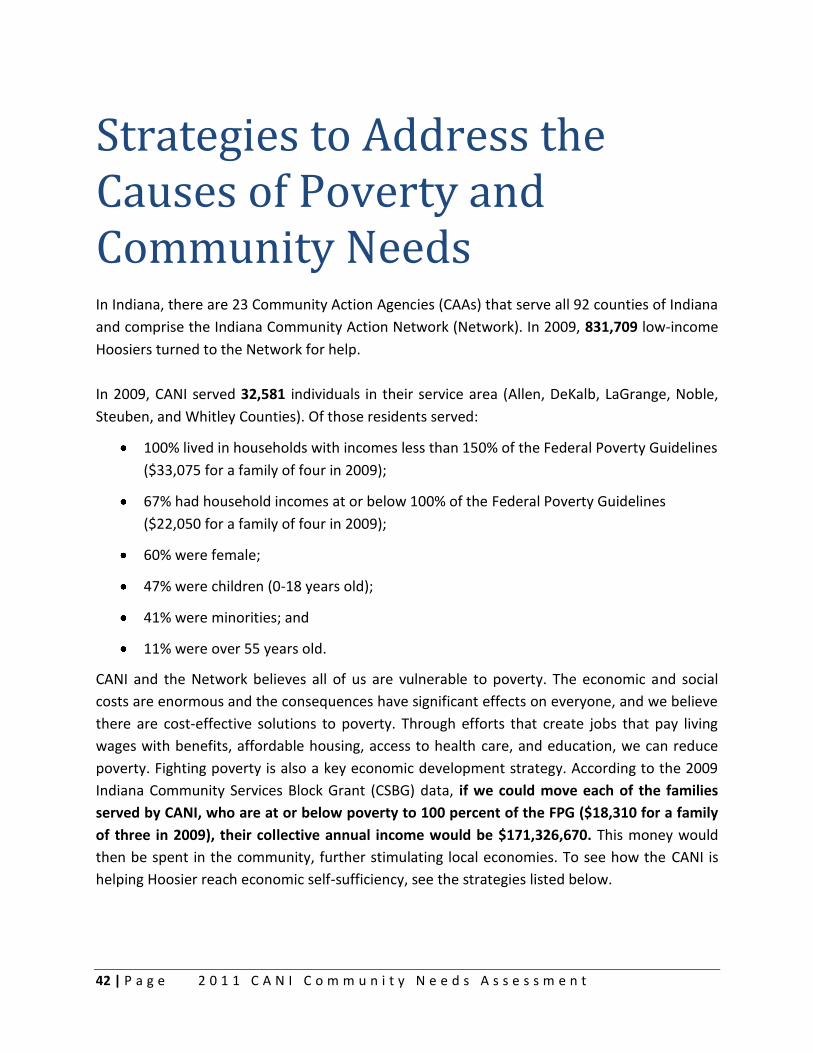
42 | P a g e 2 0 1 1 C A N I C o m m u n i t y N e e d s A s s e s s m e n t
Strategies to Address the Causes of Poverty and Community Needs
In Indiana, there are 23 Community Action Agencies (CAAs) that serve all 92 counties of Indiana
and comprise the Indiana Community Action Network (Network). In 2009, 831,709 low-income
Hoosiers turned to the Network for help.
In 2009, CANI served 32,581 individuals in their service area (Allen, DeKalb, LaGrange, Noble,
Steuben, and Whitley Counties). Of those residents served:
100% lived in households with incomes less than 150% of the Federal Poverty Guidelines
($33,075 for a family of four in 2009);
67% had household incomes at or below 100% of the Federal Poverty Guidelines
($22,050 for a family of four in 2009);
60% were female;
47% were children (0-18 years old);
41% were minorities; and
11% were over 55 years old.
CANI and the Network believes all of us are vulnerable to poverty. The economic and social
costs are enormous and the consequences have significant effects on everyone, and we believe
there are cost-effective solutions to poverty. Through efforts that create jobs that pay living
wages with benefits, affordable housing, access to health care, and education, we can reduce
poverty. Fighting poverty is also a key economic development strategy. According to the 2009
Indiana Community Services Block Grant (CSBG) data, if we could move each of the families
served by CANI, who are at or below poverty to 100 percent of the FPG ($18,310 for a family
of three in 2009), their collective annual income would be $171,326,670. This money would
then be spent in the community, further stimulating local economies. To see how the CANI is
helping Hoosier reach economic self-sufficiency, see the strategies listed below.
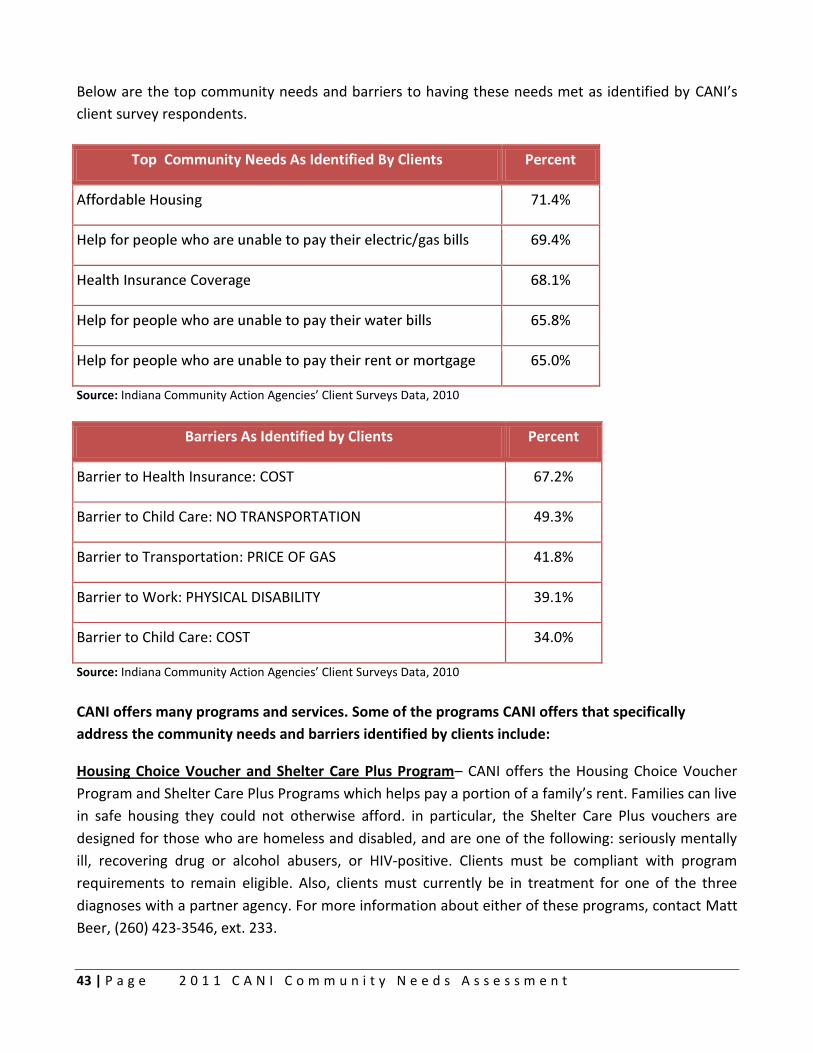
43 | P a g e 2 0 1 1 C A N I C o m m u n i t y N e e d s A s s e s s m e n t
Below are the top community needs and barriers to having these needs met as identified by CANI’s
client survey respondents.
Source: Indiana Community Action Agencies’ Client Surveys Data, 2010
Barriers As Identified by Clients Percent
Barrier to Health Insurance: COST 67.2%
Barrier to Child Care: NO TRANSPORTATION 49.3%
Barrier to Transportation: PRICE OF GAS 41.8%
Barrier to Work: PHYSICAL DISABILITY 39.1%
Barrier to Child Care: COST 34.0%
Source: Indiana Community Action Agencies’ Client Surveys Data, 2010
CANI offers many programs and services. Some of the programs CANI offers that specifically
address the community needs and barriers identified by clients include:
Housing Choice Voucher and Shelter Care Plus Program– CANI offers the Housing Choice Voucher
Program and Shelter Care Plus Programs which helps pay a portion of a family’s rent. Families can live
in safe housing they could not otherwise afford. in particular, the Shelter Care Plus vouchers are
designed for those who are homeless and disabled, and are one of the following: seriously mentally
ill, recovering drug or alcohol abusers, or HIV-positive. Clients must be compliant with program
requirements to remain eligible. Also, clients must currently be in treatment for one of the three
diagnoses with a partner agency. For more information about either of these programs, contact Matt
Beer, (260) 423-3546, ext. 233.
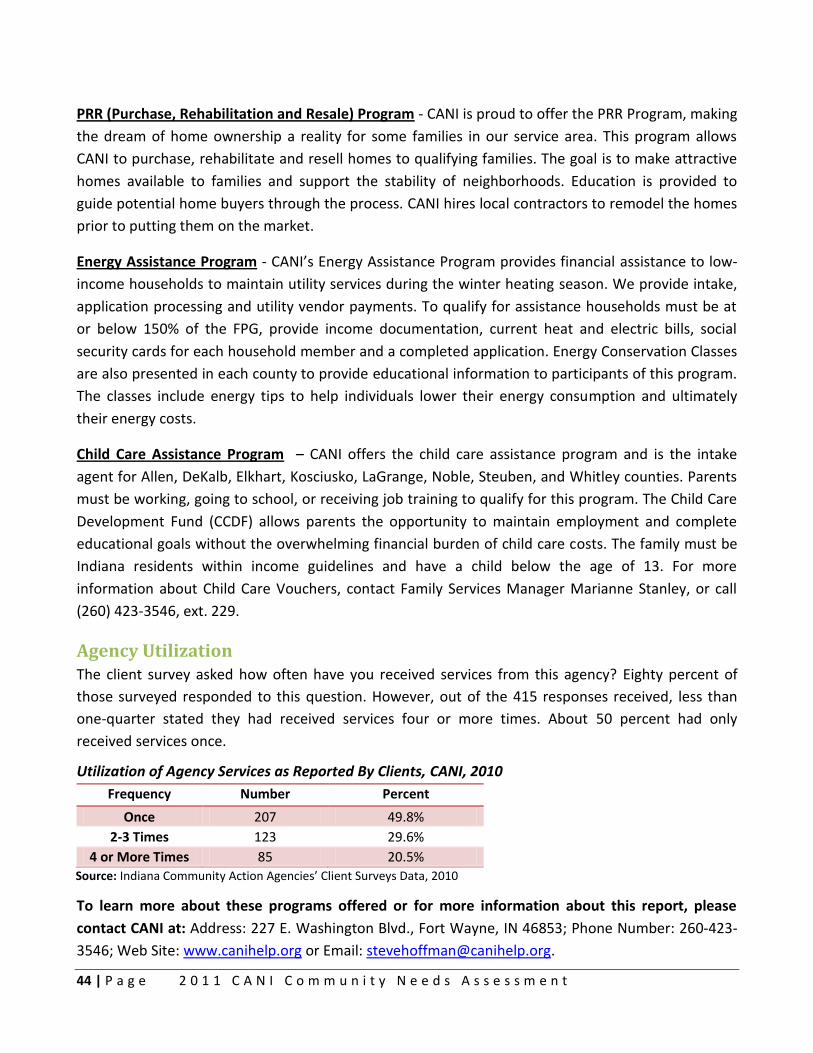
44 | P a g e 2 0 1 1 C A N I C o m m u n i t y N e e d s A s s e s s m e n t
PRR (Purchase, Rehabilitation and Resale) Program - CANI is proud to offer the PRR Program, making
the dream of home ownership a reality for some families in our service area. This program allows
CANI to purchase, rehabilitate and resell homes to qualifying families. The goal is to make attractive
homes available to families and support the stability of neighborhoods. Education is provided to
guide potential home buyers through the process. CANI hires local contractors to remodel the homes
prior to putting them on the market.
Energy Assistance Program - CANI’s Energy Assistance Program provides financial assistance to low-
income households to maintain utility services during the winter heating season. We provide intake,
application processing and utility vendor payments. To qualify for assistance households must be at
or below 150% of the FPG, provide income documentation, current heat and electric bills, social
security cards for each household member and a completed application. Energy Conservation Classes
are also presented in each county to provide educational information to participants of this program.
The classes include energy tips to help individuals lower their energy consumption and ultimately
their energy costs.
Child Care Assistance Program – CANI offers the child care assistance program and is the intake
agent for Allen, DeKalb, Elkhart, Kosciusko, LaGrange, Noble, Steuben, and Whitley counties. Parents
must be working, going to school, or receiving job training to qualify for this program. The Child Care
Development Fund (CCDF) allows parents the opportunity to maintain employment and complete
educational goals without the overwhelming financial burden of child care costs. The family must be
Indiana residents within income guidelines and have a child below the age of 13. For more
information about Child Care Vouchers, contact Family Services Manager Marianne Stanley, or call
(260) 423-3546, ext. 229.
Agency Utilization The client survey asked how often have you received services from this agency? Eighty percent of
those surveyed responded to this question. However, out of the 415 responses received, less than
one-quarter stated they had received services four or more times. About 50 percent had only
received services once.
Utilization of Agency Services as Reported By Clients, CANI, 2010
Frequency Number Percent
Once 207 49.8%
2-3 Times 123 29.6%
4 or More Times 85 20.5%
Source: Indiana Community Action Agencies’ Client Surveys Data, 2010
To learn more about these programs offered or for more information about this report, please
contact CANI at: Address: 227 E. Washington Blvd., Fort Wayne, IN 46853; Phone Number: 260-423-
3546; Web Site: www.canihelp.org or Email: [email protected].
45 | P a g e 2 0 1 1 C A N I C o m m u n i t y N e e d s A s s e s s m e n t
Appendix A: Client and Stakeholder Survey Instruments
INSERT NAME AND AGENCY LOGO HERE
September 2010
Thank you for participating in our survey. This information will assist us in helping people and meeting community needs. Your identity and answers will be confidential and we are not asking for your name. Please answer the following questions by checking the appropriate box or filling in the blank.
1. What County do you live in? ___________________
2. Is English your native language?
If it is not then which language is your native language? _____________________ 3. Are you employed?
Full Time
Part-Time
Part-Time, Looking for Work
Unemployed- Looking For Work
Unemployed-Not Looking For Work
4. What keeps you from getting work?
No Problems
No Jobs for My Field
No Transportation
Wages Too Low to Support Family
Lack of Training/Education or Skills
Physical Disability
No Childcare during work
Mental Disability
5. Do you have health insurance?
6. If yes, is it through an employer?
YES NO
7. What issues make it hard to get health insurance?
No Problems
Cost
Not offered by employer
Lack of Knowledge of Public or Private Insurance Options
No Private Insurance Available
Poor Credit
8. Does anyone in your family have Hoosier Healthwise, Medicare or Healthy Indiana Plan
(Medicaid)?
PLEASE TURN OVER, MORE QUESTIONS ON THE BACK
YES NO
YES NO
YES NO
46 | P a g e 2 0 1 1 C A N I C o m m u n i t y N e e d s A s s e s s m e n t
9. Do you use childcare services?
10. What problems make it hard to have or keep childcare?
No Problems
Cost
Hours Not Sufficient
Children have Special Needs
Location of Care Providers
No Transportation
Quality of Providers
Not Enough Providers
11. Do you receive help paying for your childcare services?
12. For what age group do you use/need childcare services?
0-2 years of age 3-5 years of age 6-13 years of age
13. Is your family supposed to receive child support?
14. If yes, do you receive it on a regular basis?
How often?
Less than once a month About once a month More than once a month
15. Do you have reliable transportation?
16. What problems make transportation hard for you?
No Problems
No Car
Price of Gas
Can’t Afford a Car
Can’t Afford Car Repairs
Can’t Afford Car Insurance
No Public Transportation
No Bus Routes Near Home
No Bus Routes Near Work
17. What problems do you have with housing?
No Problems
Rent Too High
Utilities Too High
House Needs Major Repairs
Can’t Find Affordable Housing
House Payment Too High
18. Is your rent more than one-third of your income before taxes (gross monthly income)?
19. Do you receive food stamps (SNAP)?
20. Do you ever use a local food bank or pantry?
How often?
Less than once a month About once a month More than once a month
YES NO
YES NO
YES NO
YES NO
YES NO
YES NO
YES NO
YES NO
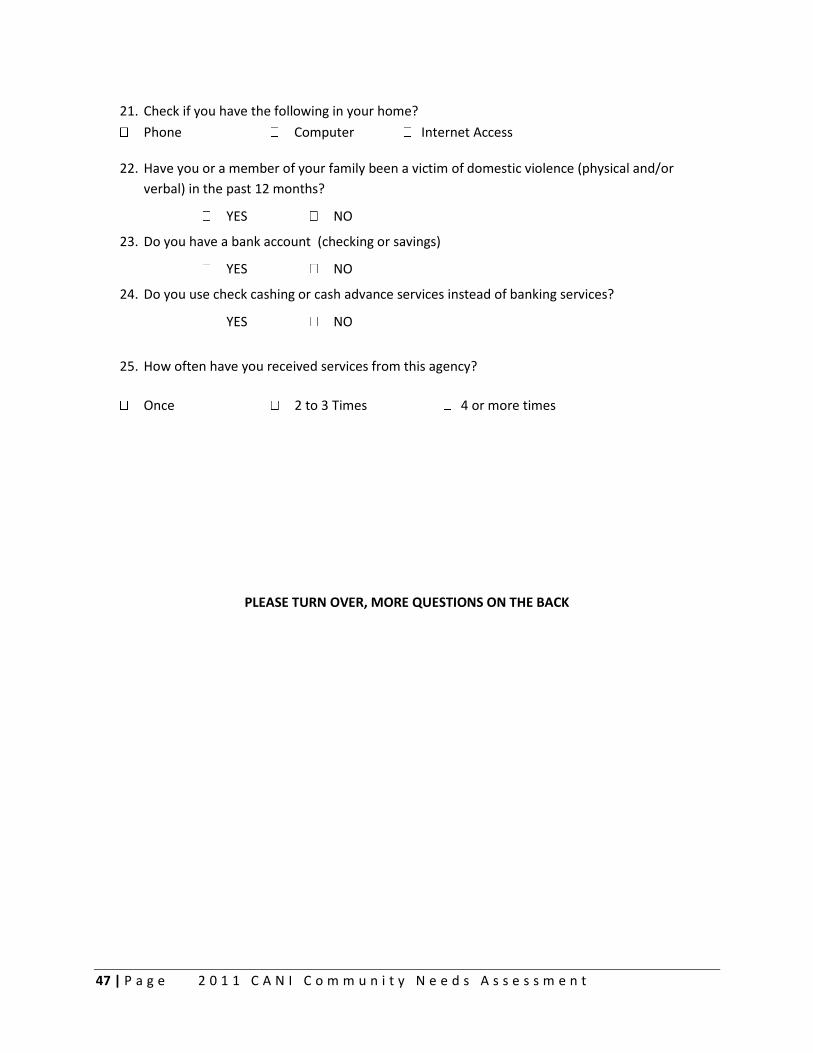
47 | P a g e 2 0 1 1 C A N I C o m m u n i t y N e e d s A s s e s s m e n t
21. Check if you have the following in your home?
Phone Computer Internet Access
22. Have you or a member of your family been a victim of domestic violence (physical and/or
verbal) in the past 12 months?
23. Do you have a bank account (checking or savings)
24. Do you use check cashing or cash advance services instead of banking services?
25. How often have you received services from this agency?
Once 2 to 3 Times 4 or more times
PLEASE TURN OVER, MORE QUESTIONS ON THE BACK
YES NO
YES NO
YES NO
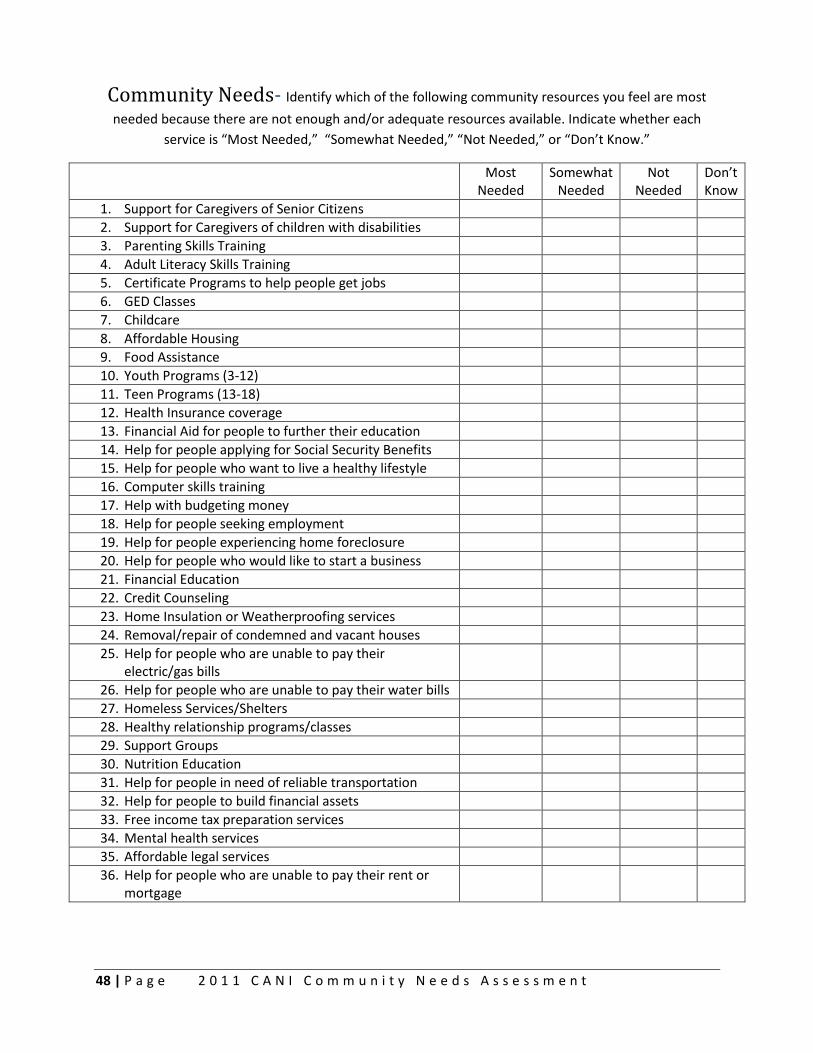
48 | P a g e 2 0 1 1 C A N I C o m m u n i t y N e e d s A s s e s s m e n t
Community Needs- Identify which of the following community resources you feel are most
needed because there are not enough and/or adequate resources available. Indicate whether each
service is “Most Needed,” “Somewhat Needed,” “Not Needed,” or “Don’t Know.”
Most
Needed Somewhat
Needed Not
Needed Don’t Know
1. Support for Caregivers of Senior Citizens
2. Support for Caregivers of children with disabilities
3. Parenting Skills Training
4. Adult Literacy Skills Training
5. Certificate Programs to help people get jobs
6. GED Classes
7. Childcare
8. Affordable Housing
9. Food Assistance
10. Youth Programs (3-12)
11. Teen Programs (13-18)
12. Health Insurance coverage
13. Financial Aid for people to further their education
14. Help for people applying for Social Security Benefits
15. Help for people who want to live a healthy lifestyle
16. Computer skills training
17. Help with budgeting money
18. Help for people seeking employment
19. Help for people experiencing home foreclosure
20. Help for people who would like to start a business
21. Financial Education
22. Credit Counseling
23. Home Insulation or Weatherproofing services
24. Removal/repair of condemned and vacant houses
25. Help for people who are unable to pay their electric/gas bills
26. Help for people who are unable to pay their water bills
27. Homeless Services/Shelters
28. Healthy relationship programs/classes
29. Support Groups
30. Nutrition Education
31. Help for people in need of reliable transportation
32. Help for people to build financial assets
33. Free income tax preparation services
34. Mental health services
35. Affordable legal services
36. Help for people who are unable to pay their rent or mortgage
49 | P a g e 2 0 1 1 C A N I C o m m u n i t y N e e d s A s s e s s m e n t
Evaluation of Services 1. Overall, how would you rate the Community Action Agency (CAA) program or services you received?
Excellent Good Fair Poor Don’t Know
2. How would you rate the way the staff in the program/agency treated you?
Excellent Good Fair Poor Don’t Know
3. How would you rate the reliability of the program staff in doing what they said they would do?
Excellent Good Fair Poor Don’t Know
4. How would you rate the timeliness of the program staff in responding to your questions or problems?
Excellent Good Fair Poor Don’t Know
5. How would you rate the program staff’s delivery of services?
Excellent Good Fair Poor Don’t Know
6. If you had a friend who was in need of the same or similar services you received how likely is it that you
would recommend the program or service to him or her?
Highly Likely
Likely Unlikely Highly Unlikely
Don’t Know
7. How likely are you to seek services from our agency again?
Highly Likely
Likely Unlikely Highly Unlikely
Don’t Know
THANK YOU FOR YOUR TIME AND PARTICIPATION IN THIS
SURVEY!
50 | P a g e 2 0 1 1 C A N I C o m m u n i t y N e e d s A s s e s s m e n t
INSERT NAME AND AGENCY LOGO HERE
September 2010
Thank you for participating in our survey. This information will assist us in helping people and meeting community needs. Your identity and answers will be confidential and we are not asking for your name. Please answer the following questions by checking the appropriate box or filling in the blank.
1. Overall how would you rate the programs and services offered by your local Community Action
Agency (CAA)?
Excellent Good Fair Poor Don’t Know
2. How would you rate our delivery of services?
Excellent Good Fair Poor Don’t Know
3. How likely are you to recommend the services from our agency?
Highly Likely
Likely Unlikely Highly Unlikely
Don’t Know
4. Do you feel the public at large is adequately aware of the services that the CAA provides?
5. Are there any services that the CAA is not providing that you think they should be?
_______________________________________________________________________
6. Do you have any recommendation to improve the CAA?
_______________________________________________________________________
PLEASE TURN OVER, MORE QUESTIONS ON THE BACK
YES NO
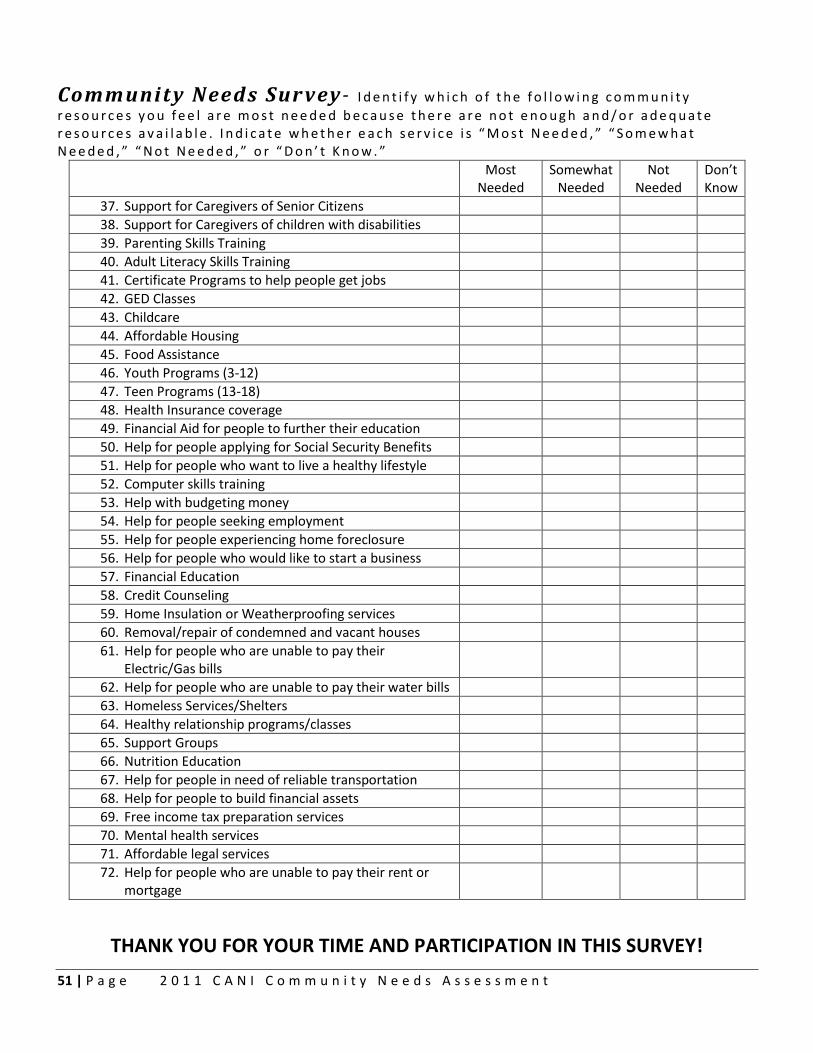
51 | P a g e 2 0 1 1 C A N I C o m m u n i t y N e e d s A s s e s s m e n t
- I d e n t i f y w h i c h o f t h e f o l l o w i n g c o m m u n i t y
r e s o u r c e s y o u f e e l a r e m o s t n e e d e d b e c a u s e t h e r e a r e n o t e n o u g h a n d / o r a d e q u a t e r e s o u r c e s a v a i l a b l e . I n d i c a t e w h e t h e r e a c h s e r v i c e i s “ M o s t N e e d e d , ” “ S o m e w h a t N e e d e d , ” “ N o t N e e d e d , ” o r “ D o n ’ t K n o w . ”
Most
Needed Somewhat
Needed Not
Needed Don’t Know
37. Support for Caregivers of Senior Citizens
38. Support for Caregivers of children with disabilities
39. Parenting Skills Training
40. Adult Literacy Skills Training
41. Certificate Programs to help people get jobs
42. GED Classes
43. Childcare
44. Affordable Housing
45. Food Assistance
46. Youth Programs (3-12)
47. Teen Programs (13-18)
48. Health Insurance coverage
49. Financial Aid for people to further their education
50. Help for people applying for Social Security Benefits
51. Help for people who want to live a healthy lifestyle
52. Computer skills training
53. Help with budgeting money
54. Help for people seeking employment
55. Help for people experiencing home foreclosure
56. Help for people who would like to start a business
57. Financial Education
58. Credit Counseling
59. Home Insulation or Weatherproofing services
60. Removal/repair of condemned and vacant houses
61. Help for people who are unable to pay their Electric/Gas bills
62. Help for people who are unable to pay their water bills
63. Homeless Services/Shelters
64. Healthy relationship programs/classes
65. Support Groups
66. Nutrition Education
67. Help for people in need of reliable transportation
68. Help for people to build financial assets
69. Free income tax preparation services
70. Mental health services
71. Affordable legal services
72. Help for people who are unable to pay their rent or mortgage
THANK YOU FOR YOUR TIME AND PARTICIPATION IN THIS SURVEY!
For More Information
About This Report,
Please Contact:
227 E. Washington Blvd.
Fort Wayne, IN 46853
Phone: 260-423-3546
Web: www.canihelp.org
Email: [email protected]
The Community Needs Assessments are funded in part by the Indiana
Housing and Community Development Authority (IHCDA) with CSBG-D funds.
For more information about IHCDA, please visit: www.in.gov/ihcda.
A SPECIAL THANKS TO: