about cover - ieee computer society · tsukuba, japan. thefilm tells the ......
TRANSCRIPT

ABOUT THE COVER
We Are Bom of StarsNelson MaxLawrence LivermoreNational Labratory
During the spring and summer of1985 a 10-minute red/ blue computer-animated stereo film, called TheUniverse: We Are Born of Stars,showed to capacity crowds at theFujitsu Pavilion at Expo 85 inTsukuba, Japan. The film tells thestory of the creation of chemicalelements inside stais, their releaseduring supernovae, and theirassembly into small molecules,crystals, meteors, planets, DNA,chromosomes, cells, animals, andfinally humans.
Because the color dimension of thefilm was used to provide stereo when Figure 1. A galaxy, which sets the scene near the beginning of the film.
Figure 2. A planetscape, showing theearth being formed by collisions withmeteorites. The surface texture wascreated by perturbing the surface
-| A Snormals during shading.
IEEE CG&A

viewed through red/ blue glasses, theimages here, which show one eyefrom the film, are in black andwhite.
Omnimax
The film was produced for theOmnimax system, which projects a70mm film through a fisheye lensonto a tilted-dome theater screen.The image extends 180° horizontally,and goes from behind the head of theaverage viewer to about 220 belowthe horizon. It thus includes all theperipheral vision, so there is no framearound the screen to destroy the 3Dillusion.The project occupied two teams of
computer animators for over a year,using two of the world's fastestcomputers. The "L team," at ToyoLinks Corporation, used the Links-l,an array of 265 microprocessorsconnected together to do parallel-processed ray tracing. (See "Aboutthe Cover," IEEE CG&A, April1985.) The "M team" used a FujitsuM-380, which has the same scalarunit as Fujitsu's VP-200 vectorprocessor, and was at the time theworld's fastest scalar general-purposecomputer. The scenes in the scriptwere assigned to the team whose hard-ware and software was most suitable.The L team built galaxies out of hazyellipsoidal "fireballs" (see Figure 1),planetscapes, seascapes, moons, andmeteors, using bump-mapped tex-tures (see Figure 2), and animals andpeople out of "metaballs" (see Figure3). The M team built solar promi-nences out of fireballs (see Figure 4),reacting nuclei out of intersectingspheres (see Figure 5), and moleculesout of semitransparent spheres joinedby vectors (see Figure 6).
The Omnimax image is magnifiedonto 2/3 of a hemisphere, 20 metersin diameter. The original frame mustbe as large and as high-resolution aspossible, so that film grain or pixelswill not become visible at this hugemagnification. To get the largest
Figure 5. Nuclear reactions inside thesun. Note the motion blur of the rapidly
moving particles.
Figure 3. A parade of animals formed from "metaballs," which are spheres orellipsoids that melt together when they overlap. The director designed theseballoonlike characters after seeing some early, blobby metaball images.
Figure 4. Ared/blue Omni-max stereo view ofprominences on
the sun, formedfrom many par-tially transparentfireballs.
November 1985 5
possible frame using existing moviefilm stocks, the film runs through theprojector horizontally, with thelongest dimension of the frameextending 15 perforations along thelength of the film. This gives morethan three times the film area of anormal five-perforation 70mm frame,and 10 times the area of a normal35mm movie frame. It requires highpixel resolution and good antialiasingto use this film area effectively. Thisis one reason we needed such a largeamount of computer power.
Another factor was the attempt touse scientifically correct simulationsfor the nuclear and moleculardynamics. About half of the pro-gramming effort and computer timeof the M team went into these simu-lations, which provided the input tothe computer graphics renderingalgorithms.The visual appearance of the film
was the responsibility of the director,Saburou Yanase, who is an experi-enced conventional animator. Prelimi-nary versions of the scenes were re-corded at video resolution onone-inch videotape. Yanase wouldlook at the videotapes and suggestchanges in camera motion, lighting,or simulation dynamics. In the firsttwo cases we could make a new video-tape by rerunning only the graphicprograms, but if we needed to changethe dynamics, we had to rerun thewhole simulation program.We had particular trouble with the
solar prominence scene. It took ayear's time for a programmer toinvent and adjust the parameters in asimulation of particles moving alongmagnetic field lines. He filled anhour-long videotape with tests to geta scene that finally comprised lessthan 15 seconds. The videotape savedthe expense of recording many ver-sions on 70mm film. The composeralso used an edited tape of the testshots to time his music before the70mm film version was available.
Handling distortion
The fisheye lens introducesdistortion when the flat film image isprojected onto the dome. In live film-ing, this distortion is exactly coun-teracted by the fisheye lens in the
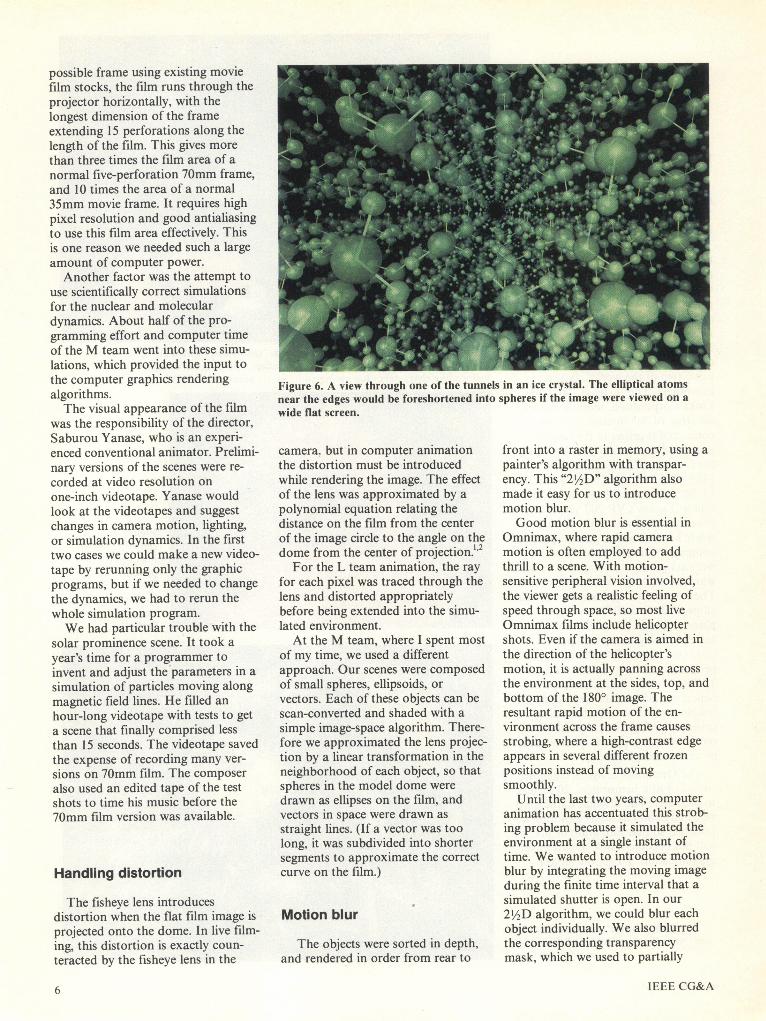
Figure 6. A view through one of the tunnels in an ice crystal. The elliptical atomsnear the edges would be foreshortened into spheres if the image were viewed on awide flat screen.
camera. but in computer animationthe distortion must be introducedwhile rendering the image. The effectof the lens was approximated by apolynomial equation relating thedistance on the film from the centerof the image circle to the angle on thedome from the center of projection.i"2
For the L team animation, the rayfor each pixel was traced through thelens and distorted appropriatelybefore being extended into the simu-lated environment.
At the M team, where I spent mostof my time, we used a differentapproach. Our scenes were composedof small spheres, ellipsoids, orvectors. Each of these objects can bescan-converted and shaded with asimple image-space algorithm. There-fore we approximated the lens projec-tion by a linear transformation in theneighborhood of each object, so thatspheres in the model dome weredrawn as ellipses on the film, andvectors in space were drawn asstraight lines. (If a vector was toolong, it was subdivided into shortersegments to approximate the correctcurve on the film.)
Motion blur
The objects were sorted in depth,and rendered in order from rear to
front into a raster in memory, using apainter's algorithm with transpar-ency. This "2'2D" algorithm alsomade it easy for us to introducemotion blur.Good motion blur is essential in
Omnimax, where rapid cameramotion is often employed to addthrill to a scene. With motion-sensitive peripheral vision involved,the viewer gets a realistic feeling ofspeed through space, so most liveOmnimax films include helicoptershots. Even if the camera is aimed inthe direction of the helicopter'smotion, it is actually panning acrossthe environment at the sides, top, andbottom of the 1800 image. Theresultant rapid motion of the en-vironment across the frame causesstrobing, where a high-contrast edgeappears in several different frozenpositions instead of movingsmoothly.
Until the last two years, computeranimation has accentuated this strob-ing problem because it simulated theenvironment at a single instant oftime. We wanted to introduce motionblur by integrating the moving imageduring the finite time interval that asimulated shutter is open. In our21/2D algorithm, we could blur eachobject individually. We also blurredthe corresponding transparencymask, which we used to partially
IEEE CG&A6

obscure the background before eachnew object was added.
For small raster images of spheresor atomic nuclei, we assumed a singledirection of motion for the wholeimage, and produced a blurred imagein three passes. We first skewed theimage so the direction of motion waseither horizontal or vertical, thenblurred the skewed image, and finallyunskewed the result.
Blurring a raster image in a hori-zontal or vertical direction isparticularly simple. The blurred valueat a pixel depends only on an integra-tion interval of contiguous inputvalues, all in the same row orcolumn. The blurred values can becomputed incrementally, since theintegration intervals for two adjacentpixels overlap, except for one pixel ateach end.
Vectors were treated differently,because vector endpoints must beable to move independently if a net-work of connected vectors is to hangtogether as it changes during theshutter-open time. We thereforewrote a separate program whichblurred arbitrarily moving variable-width vectors as it scan-convertedthem into the raster image. Thedetails of these two motion-bluralgorithms are given in the SIG-GRAPH 85 conference proceedings.3
Atoms hit audience
With these two programs we wereable to simulate a rapid, careeningflight through a vibrating ice crystal.At several points the camera turns orspins by 900, and the atoms andbonds blur instead of strobing ordoubling. This scene was one of themost exciting in the film. The viewersoften tried to touch the atoms, whichseemed to be moving just at arm'sreach. People even ducked when theywere about to be hit in the head.Ducking doesn't help; due to thegeometry of stereo viewing, you can'tmove your head out of the way. Butin fact, the hard shiny atom spheresfeel soft as they pass right throughyour face. I had objected to the ideaof allowing atoms to hit the viewer,thinking it would destroy the 3D illu-
Figure 7. Two adjacent fisheye lenses recording images ofan object in front of them. They view the object at differentangles, which produces good stereo separation.
sion. But the director insisted ondoing it, and now I know he wasright.
Making stereo work
Producing convincing stereopresented another problem, whicharises from the 180° field of view.Consider what happens when twoOmnimax cameras are placed side byside. It is physically impossible tobring the lenses of two cameras asclose as the separation between twohuman eyes. But one proposal forOmnimax stereo filming of liveaction was to put two fisheye lensesin front of adjacent frames in thesame camera, to give alternate-eyestereo. Figure 7 shows that this willgive good stereo separation for
objects in front of the lenses, butFigure 8 shows poor stereo separa-tion for objects at the side.
In the dome theater a viewershould be able to turn to the side andstill see good stereo, so we needed tosimulate different eye positions foreach part of the image. In the ray-traced images from the L team, wedetermined separate simulated eyepositions for each vertical scan line,so that the microprocessor assignedto that scan line needed to translateits data only once. For the object-projection images from the M team,we determined eye positions from ahead turned to look directly at eachobject. The object was then projectedfrom one eye onto the dome andfinally back from the dome onto thefilm.
Figure 8. Two adjacent fisheye lenses recording images of an object to the side. Theyview the object at almost the same angle, so the stereo separation is poor.
November 1985 7
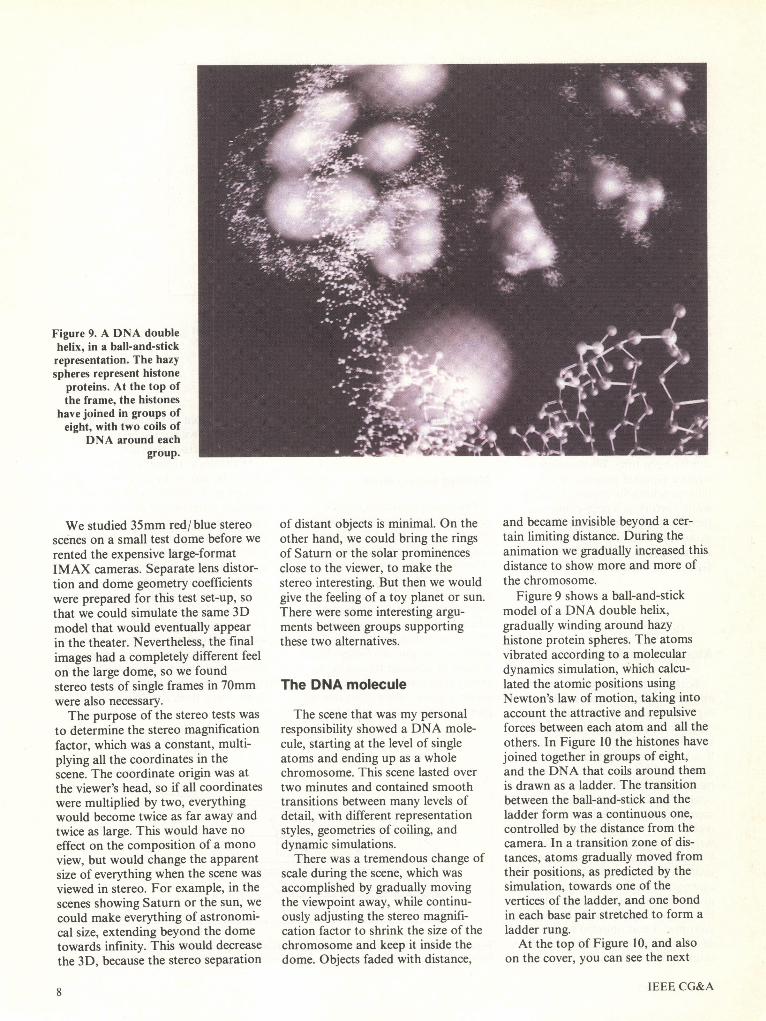
Figure 9. A DNA doublehelix, in a ball-and-stickrepresentation. The hazyspheres represent histone
proteins. At the top ofthe frame, the histones
have joined in groups ofeight, with two coils of
DNA around eachgroup.
We studied 35mm red/ blue stereoscenes on a small test dome before werented the expensive large-formatIMAX cameras. Separate lens distor-tion and dome geometry coefficientswere prepared for this test set-up, sothat we could simulate the same 3Dmodel that would eventually appearin the theater. Nevertheless, the finalimages had a completely different feelon the large dome, so we foundstereo tests of single frames in 70mmwere also necessary.The purpose of the stereo tests was
to determine the stereo magnificationfactor, which was a constant, multi-plying all the coordinates in thescene. The coordinate origin was atthe viewer's head, so if all coordinateswere multiplied by two, everythingwould become twice as far away andtwice as large. This would have noeffect on the composition of a monoview, but would change the apparentsize of everything when the scene wasviewed in stereo. For example, in thescenes showing Saturn or the sun, wecould make everything of astronomi-cal size, extending beyond the dometowards infinity. This would decreasethe 3D, because the stereo separation
of distant objects is minimal. On theother hand, we could bring the ringsof Saturn or the solar prominencesclose to the viewer, to make thestereo interesting. But then we wouldgive the feeling of a toy planet or sun.There were some interesting argu-ments between groups supportingthese two alternatives.
The DNA molecule
The scene that was my personalresponsibility showed a DNA mole-cule, starting at the level of singleatoms and ending up as a wholechromosome. This scene lasted overtwo minutes and contained smoothtransitions between many levels ofdetail, with different representationstyles, geometries of coiling, anddynamic simulations.
There was a tremendous change ofscale during the scene, which wasaccomplished by gradually movingthe viewpoint away, while continu-ously adjusting the stereo magnifi-cation factor to shrink the size of thechromosome and keep it inside thedome. Objects faded with distance,
and became invisible beyond a cer-tain limiting distance. During theanimation we gradually increased thisdistance to show more and more ofthe chromosome.
Figure 9 shows a ball-and-stickmodel of a DNA double helix,gradually winding around hazyhistone protein spheres. The atomsvibrated according to a moleculardynamics simulation, which calcu-lated the atomic positions usingNewton's law of motion, taking intoaccount the attractive and repulsiveforces between each atom and all theothers. In Figure 10 the histones havejoined together in groups of eight,and the DNA that coils around themis drawn as a ladder. The transitionbetween the ball-and-stick and theladder form was a continuous one,controlled by the distance from thecamera. In a transition zone of dis-tances, atoms gradually moved fromtheir positions, as predicted by thesimulation, towards one of thevertices of the ladder, and one bondin each base pair stretched to form aladder rung.At the top of Figure 10, and also
on the cover, you can see the next
IEEE CG&A8

Figure 10. Histone-DNA units arranging themselves into a chromatin fiber.
level of coiling, where the histone-DNA units are organized in a spiralcalled a chromatin fiber. It wouldhave been very difficult to make asimulation that formed such anordered structure naturally. Instead,we started with the ordered spiral,and pulled on the DNA at thebottom to unwind it. Then we usedthe simulation data in reverse orderto make the animation. (We used thesame trick when showing water freez-ing to the ice crystal: We simulatedice melting and then filmed it inreverse.)
In the next level of coiling, thechromatin fiber spirals outward froma central protein scaffolding, andthen bends and follows an inter-wound spiral back again. This formsa collection of horizontal prongs,shown in stereo in Figure 11. Duringthe animation I applied a twist to thechromatin fiber, which caused theprongs to spin and grow outwards,and also to rotate at different ratesabout a vertical axis. This is the samebehavior you will see if you twist astiff rope or electric cord. The axiscurve followed by the fiber wasdefined by piecewise cubic arcs, andit took some complicated differentialgeometry to figure out how muchtwist was present in a given curve.4 Atthe level of detail in Figure 11, the
DNA is represented as a single thickcurve, and the eight histone spheresin each group have been replaced bya single larger sphere.
Figure 12 shows the final level ofcoiling in progress, with motion blurevident near the top, where theprongs are rotating rapidly. One armof the chromosome is formed bywrapping the vertical axis, to whichthe prongs are attached, aroundanother spiral, while keeping theprongs horizontal. At the end of thescene, a second arm moves in fromthe side of the dome, and the camera
pulls back to reveal the familiarchromosome shape.The chromatin fiber is now repre-
sented by a single shiny tube. Insteadof using polygons or some othersurface representation, I built thetube out of many overlapping"cylinder" spheres. I shaded eachsphere as if it were part of a straightcylinder, whose axis was tangent tothe axis curve for the tube, and usedsoft-edged spheres, so that theshading and highlights melted to-gether where the spheres overlapped.But I clipped each sphere to a smallerwidth by lines parallel to the cylinderaxis, so that the tube itself would nothave a soft profile. For the transitionframes between the representations inFigures 11 and 12, I sorted thecylinder spheres for Figure 12 slightlyin front of the corresponding histonespheres and DNA vectors for Figure11, and made the transparency of thecylinder spheres a decreasing functionof distance. So as the camera pulledback, it appeared as if the chromatinstructure became covered by a trans-parent glassy sheath, which graduallygrew opaque.The different structures in Figures
9 through 12 have all been observedby electron microscopy, but no onehas seen the transitions betweenthem. Therefore, except for theatomic vibrations at the beginning, allthe dynamics in the scene are aplausible fiction. Nevertheless, thesequence is being requested for use inmedical school classes, because it ex-plains how a piece of DNA manytimes longer than a cell is packaged
Figure 11. A twisted chromatin fiber. To view this stereo pair, you must relax youreyes so that they converge near infinity, with the right eye looking at the right image,and the left eye at the left. At the same time, you must focus on the page. This isdifficult, since the focus and convergence controls are linked in your brain. You maybe able to obtain a stereo viewer with lenses to help you focus on the page. If youwear glasses for nearsightedness, it also helps to remove them.
November 1985 9

Figure 12. One arm of a chromosome.The tube representing the chromatin
fiber is formed from many overlappinghazy spheres.
into a compact chromosome duringcell division.
credits. To allow greater flexibilityfor color correction in producing thisnegative, and to provide for the
future possibility of making a black-and-white mono version of the film,we decided to record each eye's image
The hard part
I am sometimes asked what was
the most difficult aspect of the filmproduction. I answer that in myopinion it was the quality control ofcolor in the film recording, pro-cessing, and post-production opticaleffects. Because the red and bluelayers in color film respond dif-ferently, we made two differentexposure translation tables for thetwo eyes' views. We needed to main-tain consistent film-processingchemistry and temperature, and print-ing lights and exposures, to insurethat the final print was exposed in thesame way as the samples used to pre-
pare the translation tables. This was a
difficult task, because of the manysteps in the printing process.We needed a splice-free color
printing negative, containing all suchoptical effects as cuts, fades, dis-solves, and superimposed titles and
Figure 13. Members of the production team viewing a testprint in the Fujitsu Cosmos Dome. Note red-blue glasses,plastic covers on the newly-installed seats, and warm clothing.(This was January, and the theater had no heat, since it wasdesigned for only one summer's use.) In the front row are (leftto right) Nelson Max, the computing director, and KoichiOmura, who designed the Links-I computer. Above andbetween them is Kojo Ichihashi, the technical director.
IEEE CG&A10

on a separate negative in black andwhite. From these negatives, twoseparate prints were made. A spe-cially modified Omnimax-formatoptical printer exposed both theseprints through colored filters, toproduce the composite printing nega-tive. This in turn was used to makethe final "release" prints. Thus therewere a total of four generations offilm, and we tried to compensate forthe nonlinearities in all the recordingand printing steps by measuring thedensity of the final release print toprepare our translation tables. Thismeant that each iteration in ourtables took at least a week of printingand processing.We found that the dynamic range
of the blue was much smaller thanthat of the red. This meant that theblue image was darker than the red,and could show less contrast. Nowthe apparent size of a smoothlyshaded object, especially one with ahazy edge, seems to be determinedfrom a contour where the contrastchanges most rapidly. So if thecontrast were different in the red andblue images, an object would appeara different size to each eye.To further complicate matters, we
were using two different film re-corders: a recorder built specially forthe Links-I by Osaka University, anda Dicomed D48 used with the Fujitsuequipment. These two recorders haddifferent phosphors of differentcolors. There is no black-and-whitefilm stock available in 65mm or70mm, so even the black-and-whiteimages had to be recorded on colorfilm, which picked up the phosphorcolor. So wte had additional problemscolor-balancing the scenes from thetwo teams.We did not have enough disks, nor
want to handle enough tapes, to storeall our raster data, so we could noteasily change the color tables afterour scenes were recorded. We had torely on what little flexibility remainedin the printing process. Needless tosay, the color control was quite a taskfor the team at Far East Labora-tories, which did our post-productionwork.
All the hard work on The Universeseems to have paid off. Journalistsrated the Fujitsu Pavilion as the mostpopular at the World's Fair, or elseas tied with a Japanese government
pavilion where robots walked andplayed the piano. Now that Expo 85has closed, the film is being dis-
tributed internationally by IMAXSystems, and it should be possible tosee it in a theater closer to home.
References
1. Nelson Max, "SIGGRAPH 84Call for OMNIMAX Films,"Computer Graphics, Vol. 17, No.1, Jan. 1983, pp. 73-76.
2. Nelson Max, "Computer GraphicsDistortion for IMAX andOmnimax Projection," Nicograph83 Proceedings, Nihon KeizaiShimbun, Inc., Tokyo (1983), pp.137-159.
3. Nelson Max and Douglas Lerner,"A Two-and-a-Half-D Motion-
Nelson Max is acomputer scientist inthe ComputerGraphics Group atLawrence LivermoreNational Laboratory.He has taughtmathematics andcomputer graphics at
the University of California at Berkeley,the Univerversity of California at Davis,Carnegie Mellon University, and CaseWestern Reverve University. He wasalso director of the NSF-sponsoredTopology Films Project, which pro-duced computer-animated educational
Blur Algorithm," ComputerGraphics (Proc. SIGGRAPH 85)Vol. 19, No. 3, July 1985, pp.85-93.
4. Nelson Max, "DNA Animationfrom Atom to Chromosome"abstract in Molecular Graphics,Vol. 3, No. 2, 1985, pp. 69-71,with correct figures in Vol. 3,No. 3.
films. Max's research interests are inachieving realism in high-resolutionraster images and in efficientlygenerating computer animation. Hespent more than a year working on TheUniverse at Toyo Links in Japan.Max received a BA from Johns
Hopkins University and a PhD fromHarvard University, both inmathematics. He is a member of theACM and IEEE Computer Society.Nelson Max can be contacted at
Lawrence Livermore NationalLaboratory, L-301, PO Box 808,Livermore, CA 94550.
November 1985
I M..
I1I