about the tutorial - current affairs 2018, apache commons ... · in this tutorial, you will...
TRANSCRIPT

Excel PivotTables
i
About the Tutorial
PivotTable is an extremely powerful tool that you can use to slice and dice data. In this
tutorial, you will learn these PivotTable features in detail along with examples. By the time
you complete this tutorial, you will have sufficient knowledge on PivotTable features that
can get you started with exploring, analyzing, and reporting data based on the
requirements.
Audience
This guide targets professional who have to track and analyze hundreds of thousands of
data points with a compact table.
This guide targets people who want to use tables or charts in presentations and help people
understand data quickly. Whether you want to make a comparison, show a relationship,
or highlight a trend, these tables help your audience “see” what you are talking about.
Prerequisites
Before you proceed with this tutorial, we are assuming that you are already aware of the
basics of Microsoft Excel basics. If you are not well aware of these concepts, then we will
suggest you to go through our short tutorials on Excel.
Copyright & Disclaimer
Copyright 2016 by Tutorials Point (I) Pvt. Ltd.
All the content and graphics published in this e-book are the property of Tutorials Point (I)
Pvt. Ltd. The user of this e-book is prohibited to reuse, retain, copy, distribute, or republish
any contents or a part of contents of this e-book in any manner without written consent
of the publisher.
We strive to update the contents of our website and tutorials as timely and as precisely as
possible, however, the contents may contain inaccuracies or errors. Tutorials Point (I) Pvt.
Ltd. provides no guarantee regarding the accuracy, timeliness or completeness of our
website or its contents including this tutorial. If you discover any errors on our website or
in this tutorial, please notify us at [email protected]
Excel PivotTables
ii
Table of Contents
About the Tutorial ............................................................................................................................................ i Audience ........................................................................................................................................................... i Prerequisites ..................................................................................................................................................... i Copyright & Disclaimer ..................................................................................................................................... i Table of Contents ............................................................................................................................................ ii
1. PivotTable – Overview .............................................................................................................................. 1 Creating a PivotTable ....................................................................................................................................... 1 PivotTable Layout - Fields and Areas ............................................................................................................... 2 Exploring Data with PivotTable ....................................................................................................................... 2 Summarizing Values ........................................................................................................................................ 2 Updating a PivotTable ..................................................................................................................................... 2 PivotTable Reports .......................................................................................................................................... 2
2. PivotTable – Creation ................................................................................................................................ 3 Creating a PivotTable from a Data Range ........................................................................................................ 3 Adding Fields to the PivotTable ....................................................................................................................... 5 Creating a PivotTable from a Table ................................................................................................................. 6 Creating a PivotTable with Recommended PivotTables .................................................................................. 8
3. PivotTable – Fields .................................................................................................................................. 10 PivotTable Fields Task Pane ........................................................................................................................... 10 Moving PivotTable Fields Task Pane .............................................................................................................. 11 Resizing PivotTable Fields Task Pane ............................................................................................................. 12 PivotTable Fields ............................................................................................................................................ 13
4. PivotTable – Areas .................................................................................................................................. 15 ROWS ............................................................................................................................................................. 16 COLUMNS ...................................................................................................................................................... 16 ∑ VALUES ....................................................................................................................................................... 17 FILTERS .......................................................................................................................................................... 18
5. PivotTable – Exploring Data .................................................................................................................... 20 Sorting and Filtering Data .............................................................................................................................. 20 Nesting, Expanding and Collapsing Fields...................................................................................................... 20 Grouping and Ungrouping Field Values ......................................................................................................... 20
6. PivotTable – Sorting Data ........................................................................................................................ 21 Sorting on Fields ............................................................................................................................................ 22 Sorting on Subtotals ...................................................................................................................................... 23 More Sort Options ......................................................................................................................................... 26 Sorting Data Manually ................................................................................................................................... 29 Setting Sort Options ...................................................................................................................................... 32 Points to consider while sorting PivotTables ................................................................................................. 34
7. PivotTable – Filtering data ...................................................................................................................... 35 Report Filters ................................................................................................................................................. 36 Manual Filtering ............................................................................................................................................ 39 Filtering by Text ............................................................................................................................................. 44 Filtering by Values ......................................................................................................................................... 47

Excel PivotTables
iii
Filtering by Dates ........................................................................................................................................... 48 Filtering Using Top 10 Filter ........................................................................................................................... 54 Filtering Using Timeline ................................................................................................................................. 56 Clearing the Filters ......................................................................................................................................... 59
8. Filtering data using Slicers ....................................................................................................................... 61 Inserting Slicers ............................................................................................................................................. 62 Filtering with Slicers ...................................................................................................................................... 63 Clearing the Filter in a Slicer .......................................................................................................................... 64 Removing a Slicer .......................................................................................................................................... 64 Slicer Tools ..................................................................................................................................................... 65 Slicer Caption ................................................................................................................................................. 65 Slicer Settings ................................................................................................................................................ 66 Report Connections ....................................................................................................................................... 67 Selection Pane ............................................................................................................................................... 71
9. PivotTable – Nesting ............................................................................................................................... 72 Nesting Order of the Fields............................................................................................................................ 72 Changing the Nesting Order .......................................................................................................................... 73
10. PivotTable – Tools ................................................................................................................................... 75 ANALYZE Commands ..................................................................................................................................... 75 Expanding and Collapsing a Field .................................................................................................................. 75 Grouping and Ungrouping Field Values ......................................................................................................... 78 Grouping by a Date Field ............................................................................................................................... 82 Active Value Field Settings ............................................................................................................................ 84 PivotTable Options ........................................................................................................................................ 85
11. PivotTable – Summarizing Values ........................................................................................................... 87 Sum ................................................................................................................................................................ 87 Value Field Settings ....................................................................................................................................... 87 % of Grand Total ............................................................................................................................................ 89 % of Column Total ......................................................................................................................................... 91 % of Row Total ............................................................................................................................................... 92 Count ............................................................................................................................................................. 93 Average .......................................................................................................................................................... 94 Max ................................................................................................................................................................ 98 Min ................................................................................................................................................................ 99
12. PivotTable ─ Updating Data .................................................................................................................. 101 Updating PivotTable Layout ........................................................................................................................ 101 Refreshing PivotTable Data ......................................................................................................................... 102 Changing the Source Data of a PivotTable .................................................................................................. 103 Changing to External Data Source ............................................................................................................... 104 Deleting a PivotTable ................................................................................................................................... 106
13. PivotTable – Reports ............................................................................................................................. 109 Hierarchies ................................................................................................................................................... 109 Report Filter ................................................................................................................................................. 113 Slicers ........................................................................................................................................................... 115 Timeline in PivotTable ................................................................................................................................. 116 DESIGN Commands ..................................................................................................................................... 116

Excel PivotTables
iv
Grand Totals ................................................................................................................................................ 119 Report Layout .............................................................................................................................................. 119 Blank Rows .................................................................................................................................................. 122 PivotTable Style Options.............................................................................................................................. 123 PivotTable Styles.......................................................................................................................................... 125 Conditional Formatting in PivotTable .......................................................................................................... 126 PivotCharts .................................................................................................................................................. 126

Excel PivotTables
5
A PivotTable is an extremely powerful tool that you can use to slice and dice data. You can
track and analyze hundreds of thousands of data points with a compact table that can be
changed dynamically to enable you to find the different perspectives of the data. It is a simple
tool to use, yet powerful.
The major features of a PivotTable are as follows-
Creating a PivotTable is extremely simple and fast
Enabling churning of data instantly by simple dragging of fields, sorting and filtering
and different calculations on the data.
Arriving at the suitable representation for your data as you gain insights into it.
Ability to create reports on the fly.
Producing multiple reports from the same PivotTable in a matter of seconds.
Providing interactive reports to synchronize with the audience.
In this tutorial, you will understand these PivotTable features in detail along with examples.
By the time you complete this tutorial, you will have sufficient knowledge on PivotTable
features that can get you started with exploring, analyzing, and reporting data based on the
requirements.
Creating a PivotTable
You can create a PivotTable from a range of data or an Excel table. You can start with an
empty PivotTable to fill in the details, if you are aware of what you are looking for. You can
also make use of Excel Recommended PivotTables that can give you heads up on the
PivotTable layouts that are best suited for summarizing your data.
You will learn how to create a PivotTable from a data range or Excel table in the Chapter -
Creating a PivotTable from a Table or Range.
Excel gives you a more powerful way of creating a PivotTable from multiple tables, different
data sources, and external data sources. It is named as PowerPivot that works on its database
known as Data Model. You will learn these Excel power tools in other tutorials in this Tutorials
Library.
You need to first know about the normal PivotTable as explained in this tutorial, before you
venture into the power tools.
1. PivotTable – Overview

Excel PivotTables
6
PivotTable Layout - Fields and Areas
The PivotTable layout simply depends on what fields you have selected for the report and how
you have arranged them in Areas. The selection and arrangement can be done by just
dragging the fields. As you drag the fields, the PivotTable layout keeps the changing and it
happens in a matter of seconds.
You will learn about PivotTable Fields and Areas in the Chapters – PivotTable Fields and
PivotTable Areas.
Exploring Data with PivotTable
The primary goal of using a PivotTable normally is to explore the data to extract significant
and required information. You have several options to do this that include Sorting, Filtering,
Nesting, Collapsing and Expanding, Grouping and Ungrouping, etc.
You will have an overview of these options in the Chapter - Exploring Data with PivotTable.
Summarizing Values
Once you collate the data required by you by the different exploration techniques, the next
step that you would like to take is to summarize the data. Excel provides you with a variety
of calculation types that you can apply based on suitability and requirement. You can also
switch across different calculation types and view the results in a matter of seconds.
You will learn how to apply the calculation types on a PivotTable in the Chapter - Summarizing
Values by Different Calculation Types.
Updating a PivotTable
Once you have explored the data and summarized it, you need not repeat the exercise if and
when the source data gets updated. You can refresh the PivotTable so that it reflects the
changes in the source data.
You will learn the various ways of refreshing data in the Chapter – Updating a PivotTable.
PivotTable Reports
After exploring and summarizing the data with a PivotTable, you would be presenting it as a
report. PivotTable reports are interactive in nature, with the specialty that even a person not
familiar with Excel can use them intuitively. Because of their inherent dynamic nature, they
will enable you to change the perspective quickly of the report to show the required level of
detail or to focus on the specific items in which the audience expresses interest.

Excel PivotTables
7
Further, you can structure a PivotTable report for standalone presentation or as an integral
part of a broad report as the case may be. You will learn the several of reporting with
PivotTables in the Chapter – PivotTable Reports.
Excel PivotTables
8
You can create a PivotTable either from a range of data or from an Excel table. In both the
cases, the first row of the data should contain the headers for the columns.
If you are sure of the fields to be included in the PivotTable and the layout you want to have,
you can start with an empty PivotTable and construct the PivotTable.
In case you are not sure which PivotTable layout is best suitable for your data, you can make
use of Recommended PivotTables command of Excel to view the PivotTables customized to
your data and choose the one you like.
Creating a PivotTable from a Data Range
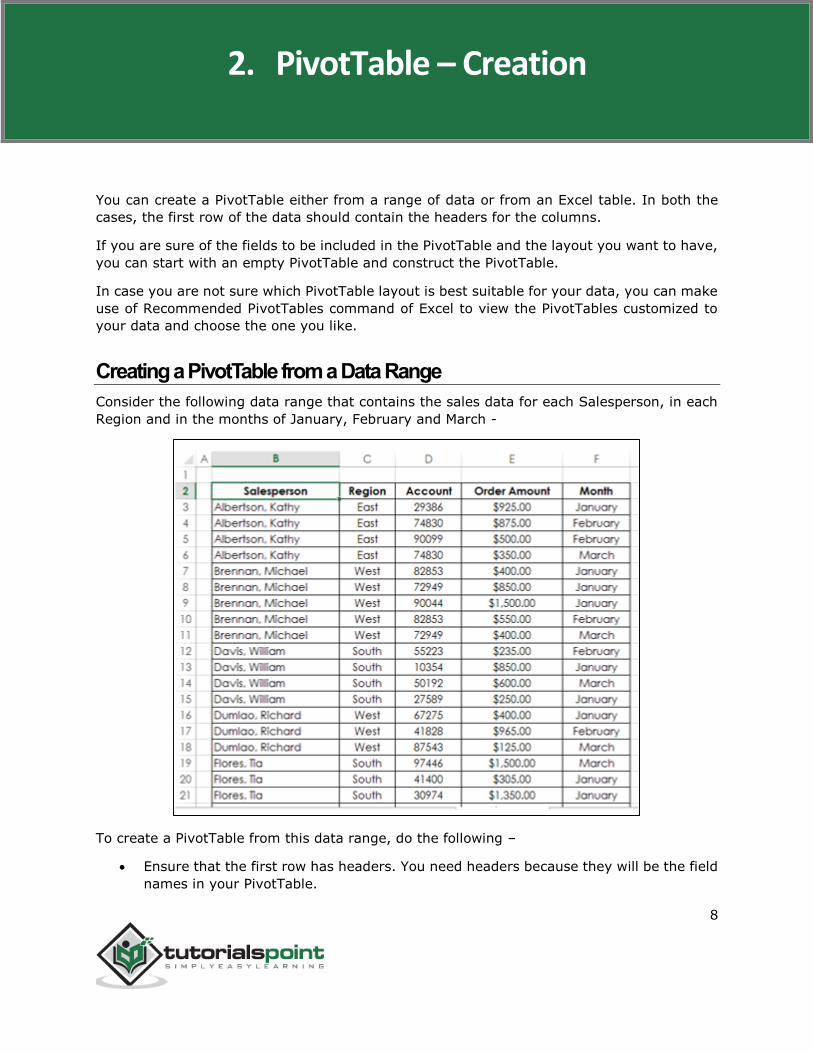
Consider the following data range that contains the sales data for each Salesperson, in each
Region and in the months of January, February and March -
To create a PivotTable from this data range, do the following –
Ensure that the first row has headers. You need headers because they will be the field
names in your PivotTable.
2. PivotTable – Creation

Excel PivotTables
9
Name the data range as SalesData_Range.
Click on the data range – SalesData_Range.
Click the INSERT tab on the Ribbon.
Click PivotTable in the Tables group. The Create PivotTable dialog box appears.
In Create PivotTable dialog box, under Choose the data that you want to analyze, you
can either select a Table or Range from the current workbook or use an external data source.
As you are creating a PivotTable from a data range, select the following from the dialog box-
Select Select a table or range.
In the Table/Range box, type the range name – SalesData_Range.
Select New Worksheet under Choose where you want the PivotTable report to be
placed and click OK.
You can choose to analyze multiple tables, by adding this data range to Data Model. You can
learn how to analyze multiple tables, use of Data Model and how to use an external data
source to create a PivotTable in the tutorial Excel PowerPivot.

Excel PivotTables
10
A new worksheet is inserted into your workbook. The new worksheet contains an empty
PivotTable. Name the worksheet – Range-PivotTable.
As you can observe, the PivotTable Fields list appears on the right side of the worksheet,
containing the header names of the columns in the data range. Further, on the Ribbon,
PivotTable Tools – ANALYZE and DESIGN appear.

Excel PivotTables
11
Adding Fields to the PivotTable
You will understand in detail about PivotTable Fields and Areas in the later chapters in this
tutorial. For now, observe the steps to add fields to the PivotTable.
Suppose you want to summarize the order amount salesperson-wise for the months January,
February, and March. You can do it in few simple steps as follows-
Click on the field Salesperson in the PivotTable Fields list and drag it to the ROWS
area.
Click the field Month in the PivotTable Fields list and drag that also to ROWS area.
Click on Order Amount and drag it to ∑ VALUES area.
Your first PivotTable is ready as shown below-
Observe that two columns appear in the PivotTable, one containing the Row Labels that you
selected, i.e. Salesperson and Month and a second one containing Sum of Order Amount. In
addition to Sum of Order Amount month wise for each Salesperson, you will also get subtotals
representing the total sales by that person. If you scroll down the worksheet, you will find the
last row as Grand Total representing total sales.
You will learn more about producing PivotTables as per the need as you progress through this
tutorial.
Creating a PivotTable from a Table
Consider the following Excel table that contains the same sales data as in the previous section-

Excel PivotTables
12
An Excel table will inherently have a name and the columns will have headers, which is a
requirement to create a PivotTable. Suppose the table name is SalesData_Table.
To create a PivotTable from this Excel table, do the following –
Click on the table – SalesData_Table.
Click the INSERT tab on the Ribbon.
Click PivotTable in the Tables group. The Create PivotTable dialog box appears.

Excel PivotTables
13
Click Select a table or range.
In the Table/Range box, type the table name – SalesData_Table.
Select New Worksheet under Choose where you want the PivotTable report to be placed. Click OK.

Excel PivotTables
14
A new worksheet is inserted into your workbook. The new worksheet contains an empty
PivotTable. Name the worksheet – Table-PivotTable. The worksheet – Table-PivotTable looks
similar to the one you have got in the data range case in the earlier section.
You can add fields to the PivotTable as you have seen in the section – Adding Fields to the
PivotTable, earlier in this chapter.
Creating a PivotTable with Recommended PivotTables
In case you are not familiar with Excel PivotTables or if you do not know which fields would
result in a meaningful report, you can use the Recommended PivotTables command in Excel.
Recommended PivotTables gives you all the possible reports with your data along with the
associated layout. In other words, the options displayed will be the PivotTables that are
customized to your data.
To create a PivotTable from the Excel table SalesData-Table using Recommended PivotTables,
proceed as follows -
Click on the table SalesData-Table.
Click the INSERT tab.
Click Recommended PivotTables in the Tables group. The Recommended PivotTables
Dialog Box appears.

Excel PivotTables
15
In the Recommended PivotTables dialog box, the possible customized PivotTables that suit
your data will be displayed.
Click on each of the PivotTable options to see the preview on the right side.
Click on the PivotTable - Sum of Order Amount by Salesperson and Month and click OK.
You will be get the preview on the right side.
The selected PivotTable appears on a new worksheet in your workbook.

Excel PivotTables
16
You can see that the PivotTable Fields - Salesperson, Region, Order Amount and Month got
selected. Of these, Region and Salesperson are in ROWS area, Month is in COLUMNS area,
and Sum of Order Amount is in ∑ VALUES area.
The PivotTable summarized the data Region-wise, Salesperson-wise and Month-wise. The
subtotals are displayed for each Region, each Salesperson, and each Month.

Excel PivotTables
17
PivotTable Fields is a Task Pane associated with a PivotTable. The PivotTable Fields Task Pane
comprises of Fields and Areas. By default, the Task Pane appears at the right side of the
window with Fields displayed above Areas.
Fields represent the columns in your data – range or Excel table, and will have check boxes.
The selected fields are displayed in the report. Areas represent the layout of the report and
the calculations included in the report.
At the bottom of the Task Pane, you will find an option – Defer Layout Update with an UPDATE
button next to it.
By default, this is not selected and whatever changes you make in the selection of
fields or in the layout options are reflected in the PivotTable instantly.
If you select this, the changes in your selections are not updated until you click on the
UPDATE button.
In this chapter, you will understand the details about Fields. In the next chapter, you will
understand the details about Areas.
PivotTable Fields Task Pane
You can find the PivotTable Fields Task Pane on the worksheet where you have a PivotTable.
To view the PivotTable Fields Task Pane, click the PivotTable. In case the PivotTable Fields
Task Pane is not displayed, check the Ribbon for the following –
Click the ANALYZE tab under PIVOTTABLE TOOLS on the Ribbon.
3. PivotTable – Fields

Excel PivotTables
18
Check if Fields List is selected (i.e. highlighted) in the Show group.
If Fields List is not selected, then click it.
The PivotTable Fields Task Pane will be displayed on the right side of the window, with the
title – PivotTable Fields.
Moving PivotTable Fields Task Pane
On the right of the title PivotTable Fields of the PivotTable Task Pane, you will find the button
. This represents Task Pane Options. Click the button . The Task Pane Options- Move,
Size and Close appear in the dropdown list.

Excel PivotTables
19
You can move the PivotTables Task Pane to anywhere you want in the window as follows-
Click Move in the dropdown list. The button appears on the Task Pane.
Click the icon and drag the pane to a position where you want to place it. You can
place the Task Pane next to the PivotTable as given below.
You can place the Task Pane on the left side of the window as given below.

Excel PivotTables
20
Resizing PivotTable Fields Task Pane
You can resize the PivotTables Task Pane – i.e. increase / decrease the Task Pane length
and/or width as follows-
Click on Task Pane Options - that is on the right side of the title - PivotTable Fields.
Click on Size in the dropdown list.
Use the symbol to increase / decrease the width of the Task Pane.
Use the symbol to increase / decrease the width of the Task Pane.
In the ∑ VALUES area, to make Sum of Order Amount visible completely, you can resize the
Task Pane as given below.

Excel PivotTables
21
PivotTable Fields
The PivotTable Fields list comprises of all the tables that are associated with your workbook
and the corresponding fields. It is by selecting the fields in the PivotTable fields list, you will
create the PivotTable.
The tables and the corresponding fields with check boxes, reflect your PivotTable data. As you
can check / uncheck the fields randomly, you can quickly change the PivotTable, highlighting
the summarized data that you want to report or present.
As you can observe, if there is only one table, the table name will not be displayed in the
PivotTable Fields list. Only the fields will be displayed with check boxes.
Above the fields list, you will find the action Choose fields to add to report. To the right,
you will find the button - that represents Tools.
Click on the Tools button.
In the dropdown list, you will find the following –
Five different layout options for Fields and Areas.
Two options for Sort order of the fields in the Fields list –
o Sort A to Z.
o Sort in Data Source Order.

Excel PivotTables
22
As you can observe in the above Fields list, the Sort order is by default – i.e. in Data Source
Order. This means, it is the order in which the columns in your data table appear.
Normally, you can retain the default order. However, at times, you might encounter many
fields in a table and might not be acquainted with them. In such a case, you can sort the
fields in alphabetical order by clicking on – Sort A to Z in the dropdown list of Tools. Then,
the PivotTable Fields list looks as follows –

Excel PivotTables
23
End of ebook preview
If you liked what you saw…
Buy it from our store @ https://store.tutorialspoint.com