about this report: this report provides robust
TRANSCRIPT
0
0
ABOUT THIS REPORT: This report provides robust surveillance data for the calendar year 2017 and summaries of core program activities and highlights for the years 2017-2018. The data reflect the most complete information available as of October 1, 2018. For additional details on the use of denominators and definitions in this report, please see the Technical Notes section.
PREPARED BY: Sarah Mollenkopf MPH, Katelynne Gardner Toren MPH, Masa Narita MD
PROGRAM CONTENT PROVIDED BY: Adriene Miller, Yoseph Sorri MPH, Kim Vuong RN, Laura Mummert, Kate Stein MSW, Paul Swenson PhD, Alfred Iqbal PhD
SUGGESTED CITATION: Public Health – Seattle & King County Prevention Division. Tuberculosis Control Program 2017 Report. Seattle, WA. 2018.
For more information please see our website: www.kingcounty.gov/health/TB
Seattle & King County Tuberculosis Control Program 2017 Report
1
ACKNOWLEDGEMENTS We acknowledge the staff of Public Health — Seattle & King County TB Control Program for their dedication to providing high-quality patient service in order to prevent transmission of tuberculosis (TB) in King County. We wish to thank the communications team in Public Health for their review and comments on this document. We also express gratitude to our community based medical colleagues for their diagnosis, reporting, and collaboration in the management of TB cases, as well as to the various institutions and agencies which support our case management and contact investigation efforts.
Seattle & King County Tuberculosis Control Program 2017 Report
2
TABLE OF CONTENTS
TUBERCULOSIS CONTROL OFFICER’S LETTER 1
TB CONTROL PROGRAM OVERVIEW 3
Mission 4 Program Focus Areas 4 How We Work 4 Local Program, Global Context 5 Our Services 7 Vital Partnerships 10 Funding 11 Quality Assurance 12
PROFILE OF TB IN KING COUNTY 13
The Epidemiology of TB in King County 14 Gender and Age 18 Race and Ethnicity 19 Birth in the United States 20 TB Risk Factors 23 TB Comorbidities 24 TB in People Experiencing Homelessness 26 Site of Disease 27 Diagnostic Testing 29 Drug Resistance 30 Genotyping and Clustering 32 Treatment Outcomes and Mortality 33 Contacts of Active TB Cases 34 Screening of Immigrants and Refugees 39
NATIONAL TB INDICATORS PROJECT: 2017 PROGRESS 41
TB CONTROL PROGRAM HIGHLIGHTS 44
Health System Modernization 45 Contributing to A Greater Understanding of TB 52 CDC Public Health Associate Program 55 King County Public Health Lab 56 2017 Noreen Harris Award for Excellence in Public Health Epidemiology 57
Seattle & King County Tuberculosis Control Program 2017 Report
3
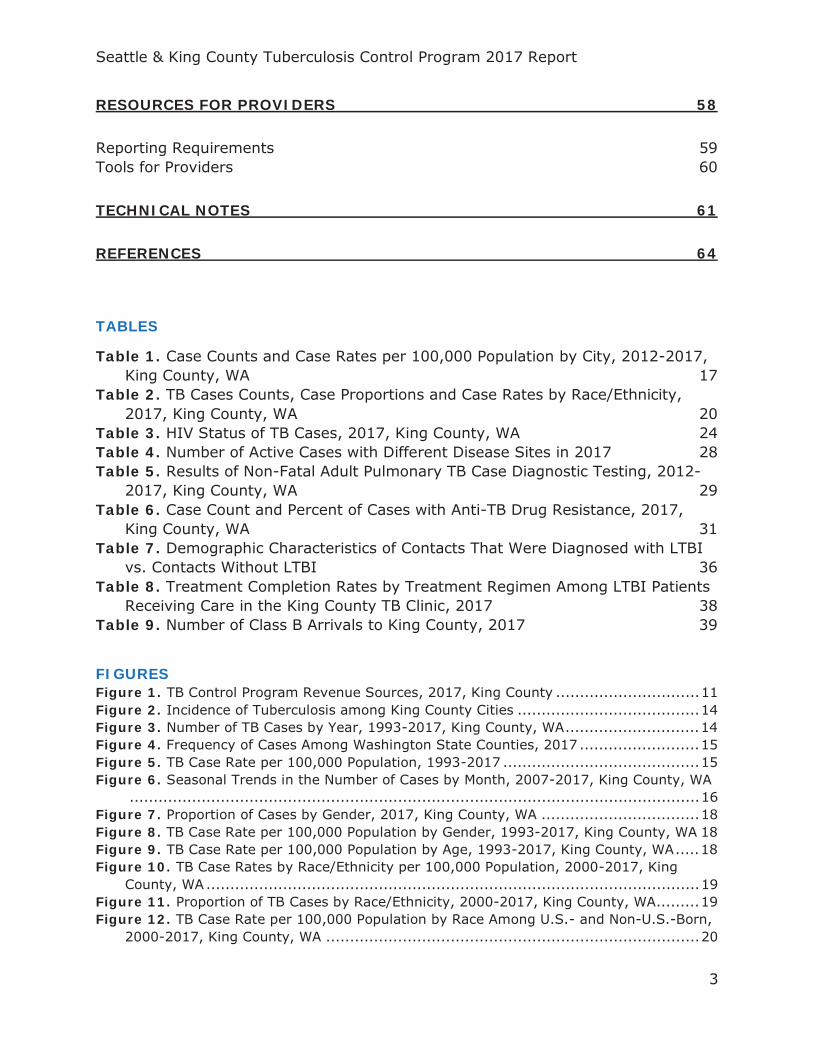
RESOURCES FOR PROVIDERS 58
Reporting Requirements 59 Tools for Providers 60
TECHNICAL NOTES 61
REFERENCES 64
TABLES
Table 1. Case Counts and Case Rates per 100,000 Population by City, 2012-2017, King County, WA 17
Table 2. TB Cases Counts, Case Proportions and Case Rates by Race/Ethnicity, 2017, King County, WA 20
Table 3. HIV Status of TB Cases, 2017, King County, WA 24 Table 4. Number of Active Cases with Different Disease Sites in 2017 28 Table 5. Results of Non-Fatal Adult Pulmonary TB Case Diagnostic Testing, 2012-
2017, King County, WA 29 Table 6. Case Count and Percent of Cases with Anti-TB Drug Resistance, 2017,
King County, WA 31 Table 7. Demographic Characteristics of Contacts That Were Diagnosed with LTBI
vs. Contacts Without LTBI 36 Table 8. Treatment Completion Rates by Treatment Regimen Among LTBI Patients
Receiving Care in the King County TB Clinic, 2017 38 Table 9. Number of Class B Arrivals to King County, 2017 39
FIGURES Figure 1. TB Control Program Revenue Sources, 2017, King County .............................. 11 Figure 2. Incidence of Tuberculosis among King County Cities ...................................... 14 Figure 3. Number of TB Cases by Year, 1993-2017, King County, WA ............................ 14 Figure 4. Frequency of Cases Among Washington State Counties, 2017 ......................... 15 Figure 5. TB Case Rate per 100,000 Population, 1993-2017 ......................................... 15 Figure 6. Seasonal Trends in the Number of Cases by Month, 2007-2017, King County, WA
....................................................................................................................... 16 Figure 7. Proportion of Cases by Gender, 2017, King County, WA ................................. 18 Figure 8. TB Case Rate per 100,000 Population by Gender, 1993-2017, King County, WA 18 Figure 9. TB Case Rate per 100,000 Population by Age, 1993-2017, King County, WA ..... 18 Figure 10. TB Case Rates by Race/Ethnicity per 100,000 Population, 2000-2017, King
County, WA ....................................................................................................... 19 Figure 11. Proportion of TB Cases by Race/Ethnicity, 2000-2017, King County, WA......... 19 Figure 12. TB Case Rate per 100,000 Population by Race Among U.S.- and Non-U.S.-Born,
2000-2017, King County, WA .............................................................................. 20

Seattle & King County Tuberculosis Control Program 2017 Report
4
Figure 13. Number of TB Cases by Race Among U.S.- and Non-U.S.-Born, 2017, King County, WA ....................................................................................................... 20
Figure 14. Percent of TB Cases that Are U.S. and Non-U.S.-Born, 1993-2017, King County, WA ................................................................................................................... 21
Figure 15. Proportion of TB Cases by Country of Birth, 1993-2017, King County, WA ...... 21 Figure 16. Time Spend in U.S. Prior to Diagnosis among Cases Born Outside the U.S.,
2017, King County, WA ....................................................................................... 22 Figure 17. Median Time Spent in the U.S. Prior to Diagnosis among TB Cases Born in
Different Regions, 1993-2017, King County, WA .................................................... 22 Figure 18. Prevalence of Risk Factors among TB Cases, 2017, King County, WA ............. 23 Figure 19. Rate of TB-HIV Coinfection per 1,000 People Living with HIV, 1993-2017, King
County, WA ....................................................................................................... 24 Figure 20. Percent of TB Cases with Diabetes at Time of Diagnosis by Year, 2012-2017,
King County, WA ................................................................................................ 25 Figure 21. Number of TB Cases among People Experiencing Homelessness in the Year Prior
to Diagnosis by Genotype and Year, 1993-2017, King County, WA ........................... 26 Figure 22. Comparison of TB Disease Sites among TB Cases, 2016-2017 ....................... 27 Figure 23. Common Sites of TB Disease .................................................................... 27 Figure 24. Comparison of Results of Non-Fatal Adult Pulmonary TB Case Diagnostic
Testing, 2012-2017, King County, WA .................................................................. 29 Figure 25. Percent of U.S. and Non-U.S.-Born TB Cases with Isoniazid Resistance, 1993-
2017, King County, WA ....................................................................................... 30 Figure 26. Percent of TB Cases with Anti-TB Drug Resistance, 1993-2017, King County, WA
....................................................................................................................... 30 Figure 27. Comparison of Estimated Time, Cost and Regimen for Treatment of Active TB,
MDR TB and XDR-TB .......................................................................................... 31 Figure 28. Number of Deaths among TB Cases, 1993-2017, King County, WA ................ 33 Figure 29. Causes of Death of TB Cases, 2012-2017 ................................................... 33 Figure 30. Frequency of Treatment Outcomes among TB Cases that Started TB Therapy,
1993-2017, King County, WA .............................................................................. 33 Figure 31. Frequency of Number of Contacts Identified for Evaluation per TB Case ......... 34 Figure 32. Proportion of Contacts with Different Relationships to an Index Case ............. 35 Figure 33. Proportion of Contacts Identified in Congregate Settings by Setting Type, 2017,
King County, WA ................................................................................................ 35 Figure 34. Care Cascade for Contacts of Active, Infectious TB Cases ............................. 37 Figure 35. Care Cascade for Immigrants and Refugees with Class B1 Status, 2017, King
County, WA ....................................................................................................... 40 Figure 36. Visa Types of Class B1 Immigrants, 2017, King County, WA ......................... 40
Seattle & King County Tuberculosis Control Program 2017 Report
5
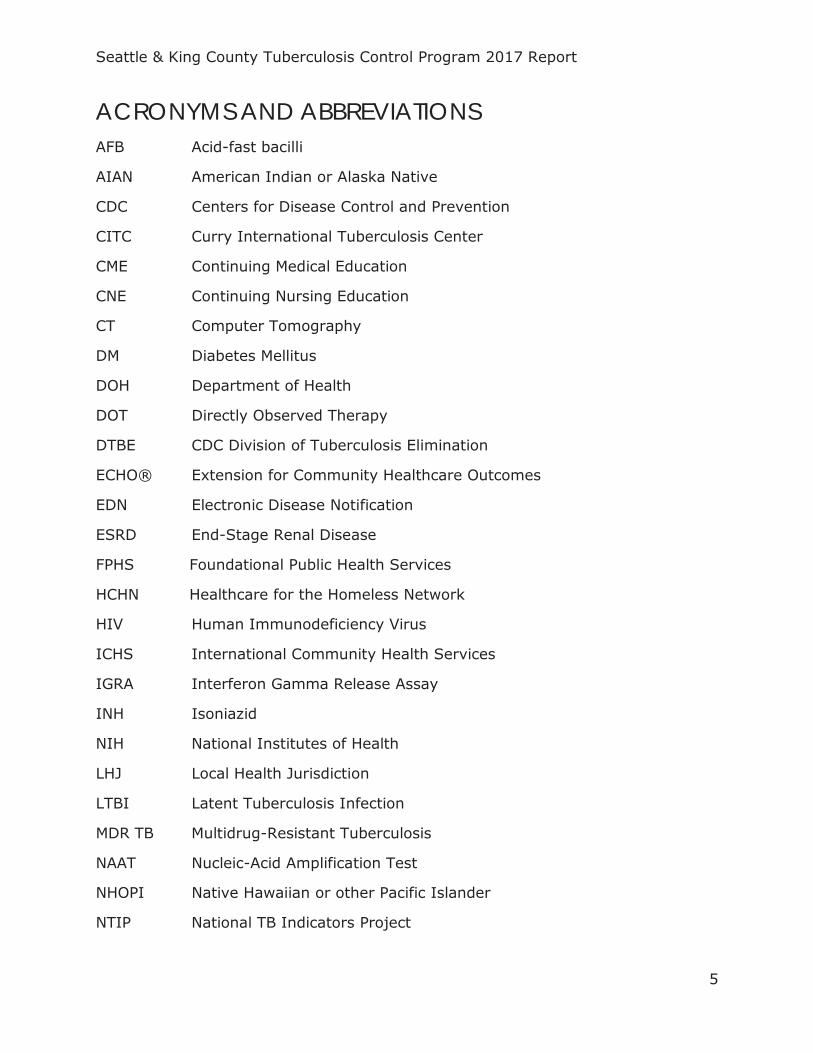
ACRONYMS AND ABBREVIATIONS AFB Acid-fast bacilli
AIAN American Indian or Alaska Native
CDC Centers for Disease Control and Prevention
CITC Curry International Tuberculosis Center
CME Continuing Medical Education
CNE Continuing Nursing Education
CT Computer Tomography
DM Diabetes Mellitus
DOH Department of Health
DOT Directly Observed Therapy
DTBE CDC Division of Tuberculosis Elimination
ECHO® Extension for Community Healthcare Outcomes
EDN Electronic Disease Notification
ESRD End-Stage Renal Disease
FPHS Foundational Public Health Services
HCHN Healthcare for the Homeless Network
HIV Human Immunodeficiency Virus
ICHS International Community Health Services
IGRA Interferon Gamma Release Assay
INH Isoniazid
NIH National Institutes of Health
LHJ Local Health Jurisdiction
LTBI Latent Tuberculosis Infection
MDR TB Multidrug-Resistant Tuberculosis
NAAT Nucleic-Acid Amplification Test
NHOPI Native Hawaiian or other Pacific Islander
NTIP National TB Indicators Project

Seattle & King County Tuberculosis Control Program 2017 Report
6
OFM Office of Financial Management
PHAP CDC Public Health Associates Program
PHI Protected Health Information
QFT QuantiFERON-Tuberculosis Gold
QFT-Plus QuantiFERON-Tuberculosis Gold Plus
RIF Rifampin
RPT Rifapentine
RVCT Report of Verified Case of Tuberculosis
TB Tuberculosis
TB GIMS Tuberculosis Genotyping Information Management System
TBCP Tuberculosis Control Program
TBESC Tuberculosis Epidemiologic Studies Consortium
TST Tuberculin Skin Test
U.S. United States
VDOT Video Directly Observed Therapy
WA Washington
WDRS Washington Disease Reporting System
WTCN Washington TB Collaborative Network
WHO World Health Organization
XDR TB Extensively Drug-Resistant TB
1
TUBERCULOSIS CONTROL OFFICER’S LETTER
Dear Colleagues,
We are pleased to provide you with the Seattle & King County Tuberculosis Control Program 2017 Report. This report highlights the program activities and priorities, and 2017 surveillance information on tuberculosis in King County. Public Health – Seattle & King County is deeply committed to protecting the health and well-being of all King County residents.
As members of a global community, residents of King County are vulnerable to tuberculosis (TB), a disease that infects one quarter of the world’s population and kills nearly two million people every year. Public Health – Seattle & King County’s TB Control Program (TBCP) ensures that people with active TB disease are diagnosed and treated, and that people who are exposed to TB are also evaluated and treated, if appropriate, to prevent further spread of TB.
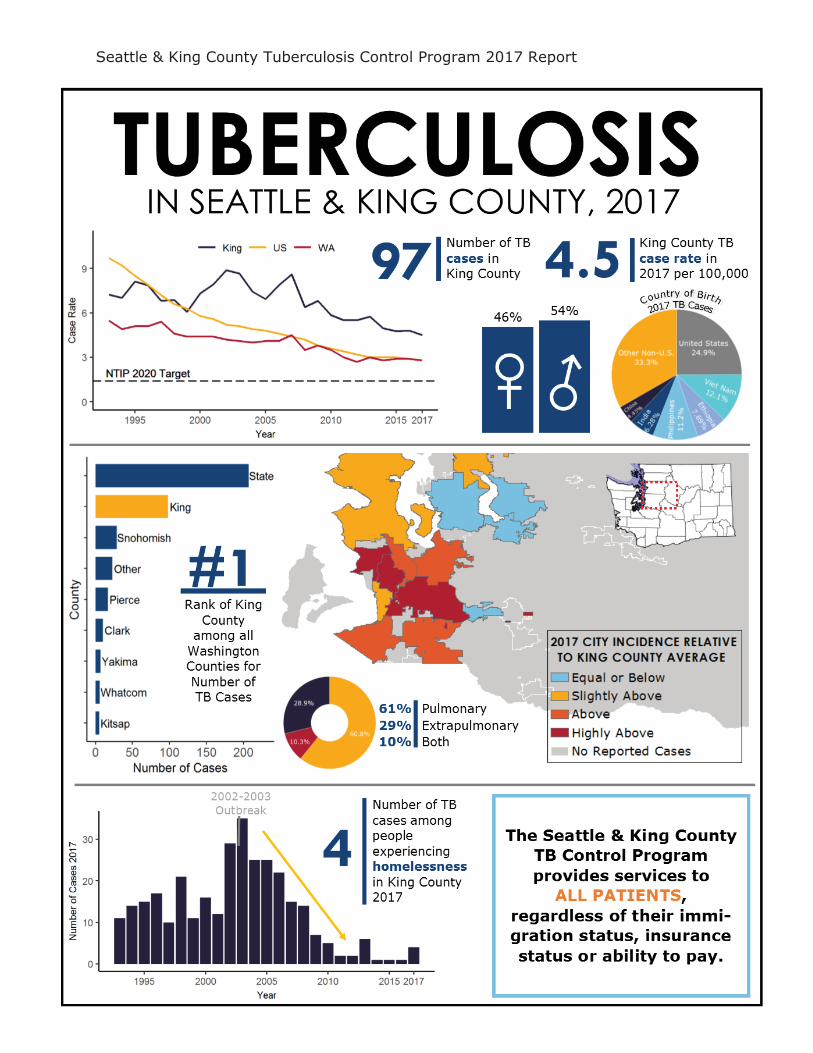
The incidence of TB is notably higher in King County than in Washington State overall or the U.S., reflecting that as an international community, King County is more vulnerable to global diseases like TB. In 2017, King County reported 97 cases of active TB. For every 100,000 residents of King County, 4.5 developed active TB disease, compared to a U.S rate of 2.8 and a Washington state rate of 2.8.
The vast majority of King County TB cases were born outside the U.S. Tuberculosis is endemic in many parts of the world, and individuals diagnosed in King County were born in 25 different countries and 1 U.S. territory. Of the 84 non-U.S.-born people diagnosed with TB (87% of all active cases), 53% came from five countries: Ethiopia, Vietnam, the Philippines, India and China.
17 patients (18% of all TB cases) treated for TB were resistant to at least one TB medication. Further, 2 cases of multi-drug resistant TB were diagnosed in King County in 2017. The treatment of multi-drug resistant TB is much more complex and expensive with an estimated cost of approximately $160,000 to cure
Creative and innovative strategies are essential components in our continued fight against tuberculosis. We hope that this Program Report will facilitate greater understanding, and promote collaboration and planning for effective use of resources in the local, regional and national effort to reduce and eventually eliminate tuberculosis.
Sincerely,
Masa Narita, MD
TB Control Officer, Public Health - Seattle & King County
Seattle & King County Tuberculosis Control Program 2017 Report
2
Seattle & King County Tuberculosis Control Program 2017 Report
3
TB CONTROL PROGRAM OVERVIEW

Seattle & King County Tuberculosis Control Program 2017 Report
4
MISSION The mission of the Public Health - Seattle & King County TB Control Program (TBCP) is to prevent the transmission of TB in Seattle & King County.
PROGRAM FOCUS AREAS 1. Expand targeted testing and treatment of latent TB infection (LTBI), with
special focus on immigrant and refugee populations
2. Bolster community engagement and education efforts to promote early detection of active TB, and targeted testing and treatment of LTBI
HOW WE WORK The Seattle & King County TBCP views local TB control as a community effort, emphasizing public-private partnerships as part of the collaboration among local, state and national organizations.
Following national and international guidelines, priorities for the TBCP include:
Ensuring persons with active TB disease, especially infectious cases, are identified in a timely manner, isolated if appropriate, and fully treated until cured.
Ensuring contacts of persons with infectious TB are evaluated and offered appropriate preventive therapy.
Evaluate individuals arriving in King County who had abnormal chest x-ray findings suspicious for inactive TB during their immigration evaluations overseas.
Partnering with health care professionals and agencies in King County to identify and treat persons who are at high risk for latent TB infection and for progression to TB disease.
Monitoring TB trends in Seattle and King County.
Seattle & King County Tuberculosis Control Program 2017 Report
5
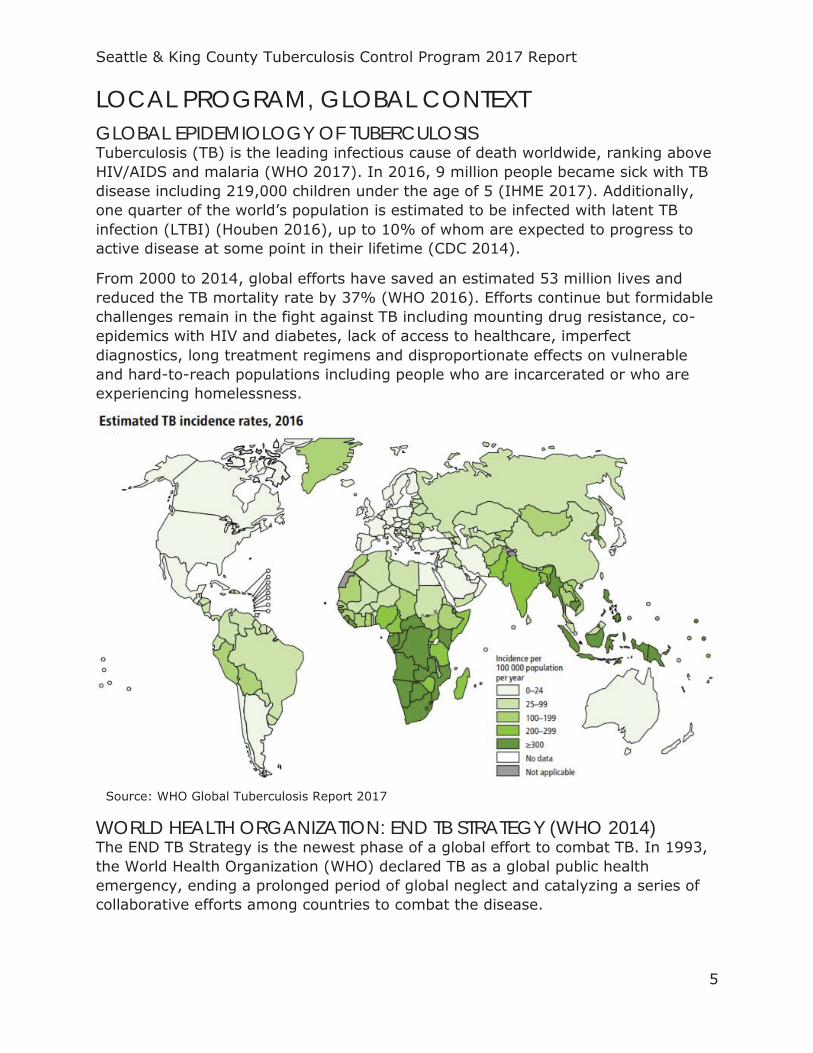
LOCAL PROGRAM, GLOBAL CONTEXT GLOBAL EPIDEMIOLOGY OF TUBERCULOSIS Tuberculosis (TB) is the leading infectious cause of death worldwide, ranking above HIV/AIDS and malaria (WHO 2017). In 2016, 9 million people became sick with TB disease including 219,000 children under the age of 5 (IHME 2017). Additionally, one quarter of the world’s population is estimated to be infected with latent TB infection (LTBI) (Houben 2016), up to 10% of whom are expected to progress to active disease at some point in their lifetime (CDC 2014).
From 2000 to 2014, global efforts have saved an estimated 53 million lives and reduced the TB mortality rate by 37% (WHO 2016). Efforts continue but formidable challenges remain in the fight against TB including mounting drug resistance, co-epidemics with HIV and diabetes, lack of access to healthcare, imperfect diagnostics, long treatment regimens and disproportionate effects on vulnerable and hard-to-reach populations including people who are incarcerated or who are experiencing homelessness.
WORLD HEALTH ORGANIZATION: END TB STRATEGY (WHO 2014) The END TB Strategy is the newest phase of a global effort to combat TB. In 1993, the World Health Organization (WHO) declared TB as a global public health emergency, ending a prolonged period of global neglect and catalyzing a series of collaborative efforts among countries to combat the disease.
Source: WHO Global Tuberculosis Report 2017
Seattle & King County Tuberculosis Control Program 2017 Report
6
The END TB Strategy, approved by the World Health Assembly in 2014, has a stated goal of ending the global TB epidemic. By 2025 there should be a 95% reduction in TB deaths globally and a 90% reduction in the TB incidence rate. Low-incidence countries (defined as fewer than 100 cases per 1 million population), should reach pre-elimination (defined as fewer than 10 cases per 1 million population) by 2035. This is to be reached by focus on three components:
1. Integrated, patient-centered care and prevention 2. Bold policies and supportive systems 3. Intensified research and innovation
CDC DIVISION FOR TUBERCULOSIS ELIMINATION In 1984, the then director of the Centers for Disease Control and Prevention (CDC), Dr. James O. Mason, first challenged the public health community in the United States (U.S.) to design a plan for eliminating TB in the U.S. A resurgence of TB in the late 1980s and 1990s coinciding with the introduction of HIV temporarily derailed progress but this challenge was re-visited in the early 2000s. A push for more federal funding and a recognition of the need for new strategies and tools resulted in the Comprehensive TB Elimination Act of 2007, authorizing up to $210 million per year for the CDC’s Division of TB Elimination (DTBE). The stated goal of the DTBE is to “reduce TB morbidity in the United States with a particular focus on reducing disparities in TB morbidity among disproportionately affected groups, including non-U.S.-born persons and racial and ethnic minorities” (Stop TB USA Tuberculosis Elimination Plan Committee 2010). Specific targets for the year 2020 are tracked through the National TB Indicators Project (NTIP) and include a reduction of national incidence to 1.4/100,000. The DTBE is one of 1500 civil society groups, non-governmental organizations and community groups worldwide supporting the Stop TB Partnership, a collective body operating through a secretariat hosted by the United Nations Office for Project Services that has adopted the mission and targets put forth by the END TB Strategy (UNOPS 2018).
WASHINGTON STATE TUBERCULOSIS CONTROL PROGRAM The Washington State TBCP program objectives are aligned with national TB program objectives defined by the CDC (WA DOH 2012).
SEATTLE & KING COUNTY TUBERCULOSIS CONTROL PROGRAM As a crossroads for global trade and migration, King County has historically had higher rates of TB disease than both state and national averages. Despite this, the Seattle & King County TB Control Program (TBCP) has successfully worked to decrease the burden of TB in King County over the last two decades. King County now meets global criteria for a “low incidence” geography with fewer than 10 cases per 100,000 people and progress continues to be made.
Seattle & King County Tuberculosis Control Program 2017 Report
7
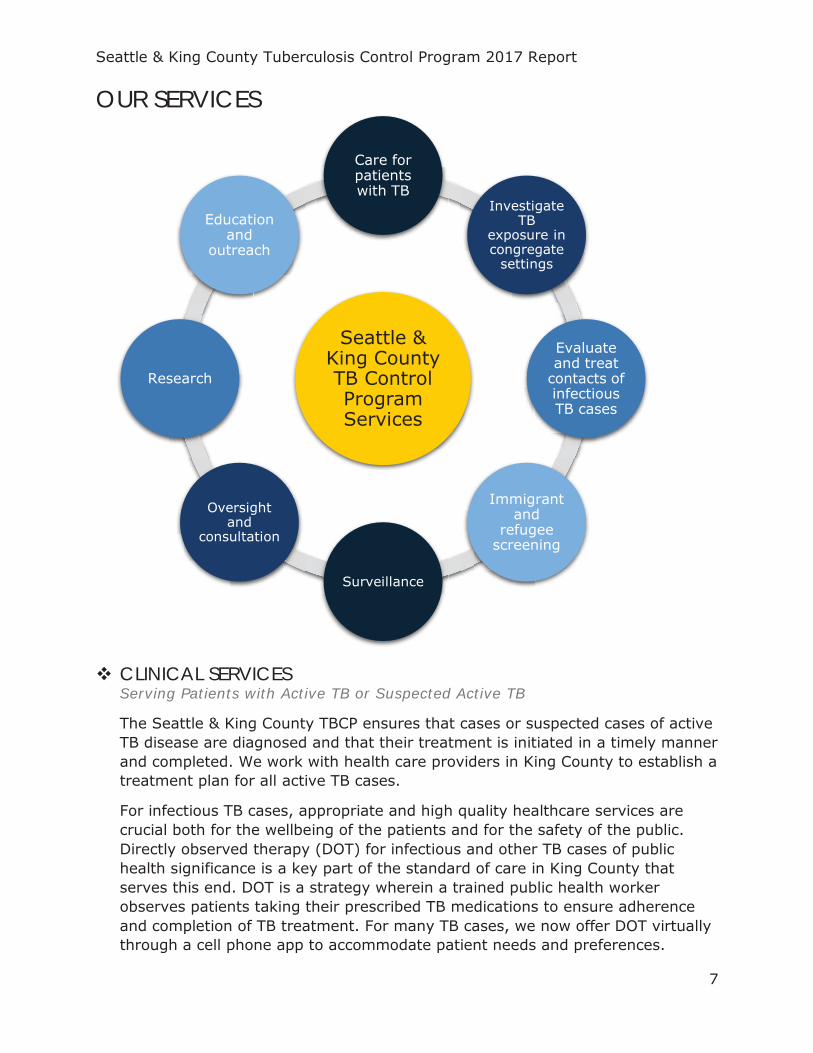
OUR SERVICES
CLINICAL SERVICES Serving Patients with Active TB or Suspected Active TB
The Seattle & King County TBCP ensures that cases or suspected cases of active TB disease are diagnosed and that their treatment is initiated in a timely manner and completed. We work with health care providers in King County to establish a treatment plan for all active TB cases.
For infectious TB cases, appropriate and high quality healthcare services are crucial both for the wellbeing of the patients and for the safety of the public. Directly observed therapy (DOT) for infectious and other TB cases of public health significance is a key part of the standard of care in King County that serves this end. DOT is a strategy wherein a trained public health worker observes patients taking their prescribed TB medications to ensure adherence and completion of TB treatment. For many TB cases, we now offer DOT virtually through a cell phone app to accommodate patient needs and preferences.
Seattle & King County TB Control Program Services
Care for patients with TB
Investigate TB
exposure in congregate
settings
Evaluate and treat
contacts of infectious TB cases
Immigrant and
refugee screening
Surveillance
Oversight and
consultation
Research
Education and
outreach
Seattle & King County Tuberculosis Control Program 2017 Report
8
While state law requires infectious TB cases to remain in isolation until their infectiousness wanes, we work with patients to minimize the social and economic burden of this stressful situation while protecting their family members, friends, co-workers or other members of the public from transmission of the disease.
Serving People Who Are Exposed to Infectious TB
For any infectious TB case, we work to identify and evaluate all people that have been in contact with the patient for a certain period of time in an environment conducive to transmission. All of these people will be offered TB testing and connected to treatment if appropriate. Special consideration is given to assessing contacts of highly infectious or multi-drug resistant TB (MDR TB) cases and contacts with risk factors for TB progression (i.e. contacts under the age of 5 or with impaired immunity). This is an effective approach to interrupting TB transmission in the community.
Serving Immigrants and Refugees
The TBCP evaluates new immigrants and refugees whose pre-emigration medical screening included abnormal radiology findings suspicious for inactive TB. They will be offered TB testing and, if they are diagnosed with LTBI, we either offer treatment in our TB clinic or refer them to community providers.
CONTACT EVALUATION OF CONGREGATE SETTINGS If someone who is diagnosed with infectious TB disease has spent significant time in a larger shared space with co-workers, co-habitants, classmates, or other community members, the TBCP will conduct an environmental assessment of the space and mobilize staff and/or volunteers to conduct large TB screening events if appropriate. This requires increased community education efforts as well as significant cooperation with any organization(s) involved. Through evaluation of contacts we identify people who have developed active TB disease in a timely manner, as well as those who could benefit from treatment for LTBI.
EPIDEMIOLOGICAL SURVEILLANCE The TBCP conducts surveillance for all confirmed cases of TB, exposed contacts of TB cases, and immigrants and refugees whose pre-emigration medical screening detected abnormal radiographic findings consistent with inactive TB. Our program examines trends and indicators of TB cases to better understand the dynamics of the development and transmission of TB in our community. By analyzing data, we develop effective and efficient strategies to improve TB control services to our community.
OVERSIGHT AND CONSULTATION The TBCP provides health care professionals with consultation regarding diagnosis, treatment and policy issues on TB disease and LTBI and participates in developing state and national TB-related guidelines.
Seattle & King County Tuberculosis Control Program 2017 Report
9
RESEARCH TBCP research projects seek to better understand TB control, as well as to improve diagnostics, treatment and management of TB and LTBI. Highlights of current research projects include a 10-year grant from the CDC to improve the diagnosis and treatment of LTBI (SEE TB Control Program Highlights).
EDUCATION AND OUTREACH Providing education to patients, community groups and health care providers is a fundamental element of our efforts to control TB. As part of our efforts, we participate in community events and facilitate educational sessions to provide information for a better understanding of TB. As the incidence of TB declines, it is crucial to update the knowledge of practicing clinicians. These efforts include:
In cooperation with the Curry International Tuberculosis Center (CITC), and the faculty of University of Washington School of Medicine, the TBCP has provided annual “TB Intensive” courses for 15 years. An LTBI-focused course was added in 2014. A special TB-specific theme is chosen each year to reflect a contemporary issue or focus (e.g. TB among the homeless). Approximately 40 health-care professionals attend each courses.
The TBCP partners with local nursing schools, pharmacist training programs and other public health departments to provide in-service training for aspiring nurses and new public health professionals. Trainees get first-hand experience in TB case management, DOT, contact investigations and other themes relevant to their curriculum and/or professional needs.
TBCP community health workers have attended the Center for Infectious Disease Research’s summer BioQuest Academy to teach high schoolers aspiring to enter careers in science about TB as a public health issue and what it is like to work in the TB field.
TBCP community health workers have facilitated educational sessions about the basics of TB transmission, screening and treatment for at-risk populations in partnership with community groups including Casa Latina and the Ventanilla de Salud.
Upon invitation, the TBCP has provided TB education for medical, administrative and other staff from various organizations and corporations where staff are likely to encounter people at-risk for TB. Topics included how to recognize TB symptoms, how to appropriately refer people for further evaluation and reporting requirements.
Seattle & King County Tuberculosis Control Program 2017 Report
10
VITAL PARTNERSHIPS In concert with national goals, the Seattle & King County TBCP has been working since 2009 to enhance partnerships with non-profit organizations, private enterprises and academic institutions to help control the spread of TB in King County. Within this there is a special focus on identifying alternative methods of service delivery and engagement of community partners in the management of LTBI. Our partnerships include, but are not limited to:
• The Firland Foundation provided funding that enabled us to renew a partnership with International Community Health Services (ICHS), which has allowed us to gain insight into the health system experience of patients with LTBI and opportunities to close gaps in evaluation and treatment of LTBI in our community.
• As one of the largest TB outbreaks in the U.S. occurred among people experiencing homelessness in King County just 15 years ago, it has been crucial to maintain relationships with organizations that have expertise and resources for working with this population. An ongoing partnership with the Healthcare for the Homeless Network (HCHN) helps us to gain insight into and develop strategies for effectively working with this vulnerable population.
• We work closely with many community medical providers, especially Harborview Medical Center, to ensure extrapulmonary TB cases receive TB treatment and follow-up care by our community partners.
• The King County Office of Emergency Preparedness is a crucial partner in helping us to secure supplies and personnel for large contact investigations.
• We have an ongoing and dynamic relationship with the University of Washington and the Washington Department of Health to conduct innovative research and provide tele-mentorship for regional TB communities through the TB Extension for Community Healthcare Outcomes (ECHO) project.
The Seattle & King County TBCP continues to explore opportunities for public-private partnerships with community health centers and other community based organizations (e.g., homeless shelters) to co-manage our patients.
Seattle & King County Tuberculosis Control Program 2017 Report
11
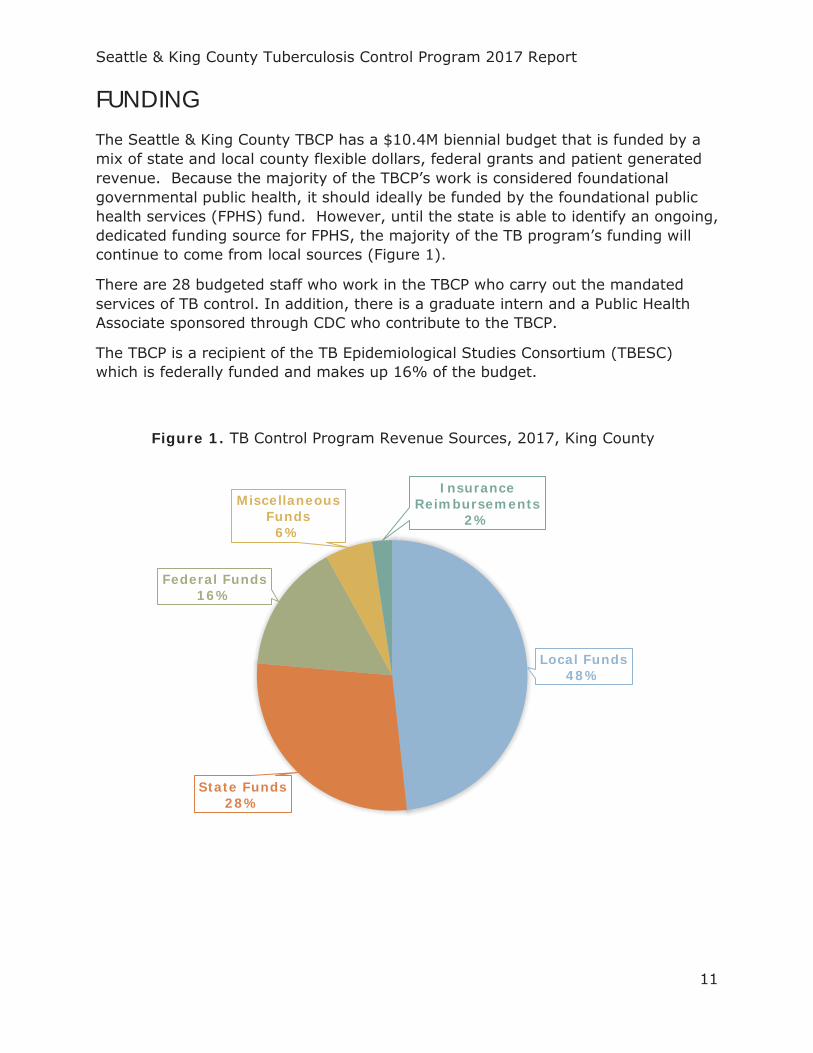
FUNDING The Seattle & King County TBCP has a $10.4M biennial budget that is funded by a mix of state and local county flexible dollars, federal grants and patient generated revenue. Because the majority of the TBCP’s work is considered foundational governmental public health, it should ideally be funded by the foundational public health services (FPHS) fund. However, until the state is able to identify an ongoing, dedicated funding source for FPHS, the majority of the TB program’s funding will continue to come from local sources (Figure 1).
There are 28 budgeted staff who work in the TBCP who carry out the mandated services of TB control. In addition, there is a graduate intern and a Public Health Associate sponsored through CDC who contribute to the TBCP.
The TBCP is a recipient of the TB Epidemiological Studies Consortium (TBESC) which is federally funded and makes up 16% of the budget.
Local Funds48%
State Funds28%
Federal Funds16%
Miscellaneous Funds
6%
Insurance Reimbursements
2%
Figure 1. TB Control Program Revenue Sources, 2017, King County
Seattle & King County Tuberculosis Control Program 2017 Report
12
QUALITY ASSURANCE The Seattle & King County TBCP conducts both clinical and programmatic evaluation of its activities to ensure maximum effectiveness and efficiency. This may take the form of routine communication, work review, development and review of procedures and protocols, training and re-training, data cleaning and indicator tracking. The specific activities include:
The TBCP tracks progress toward achieving the Washington State and national TB program objectives. The objectives include incidence rates among certain high-risk groups, outcomes of treatment for active TB cases, contact investigations, evaluation of immigrants and refugees and case data reporting.
We work closely with the Washington State TB Program and participate in the semi-annual statewide cohort review and quarterly medical case review where management of all active TB cases as well as overall program performance are systematically evaluated. The statewide cohort review enables TB programs to identify strengths and weaknesses that relate to state and national TB objectives, promotes accountability individually and as a group, and provides educational and training opportunities
All clinical staff meets weekly as a multidisciplinary team and discusses progress of TB treatment, contact investigations, and data accuracy for all active TB cases managed by the TB clinic.
Protocols and procedures for clinic and program activities (e.g. infection control, case management, DOT, contact investigations, etc.) are reviewed annually in light of new scientific advancements or new CDC recommendations and adapted for the current work environment by appropriate clinic staff. These are re-approved upon group consensus and approval by the TB Control Officer.
Refresher trainings in technical skills including phlebotomy, Tuberculin Skin Test (TST) placement/interpretation and DOT are held annually for all staff providing these services.
In concert with Washington State laws, all licensed physician and registered nurses participate in work training to fulfill Continuing Education (CME/CNE) requirements.
Data cleaning activities are ongoing and data summaries are produced regularly.
Since 2018, the TBCP conducts patient satisfaction surveys three times a year to gain feedback on the patient experience and identify areas for improvement.
Harborview Medical Center conducts annual safety rounds to identify and correct infection control and safety-related issues in patient care and business occupancy areas.
An internal audit regarding safety and security of protected health information (PHI) was conducted in 2018.
Seattle & King County Tuberculosis Control Program 2017 Report
13
PROFILE OF TB IN KING COUNTY
Seattle & King County Tuberculosis Control Program 2017 Report
14
THE EPIDEMIOLOGY OF TB IN KING COUNTY
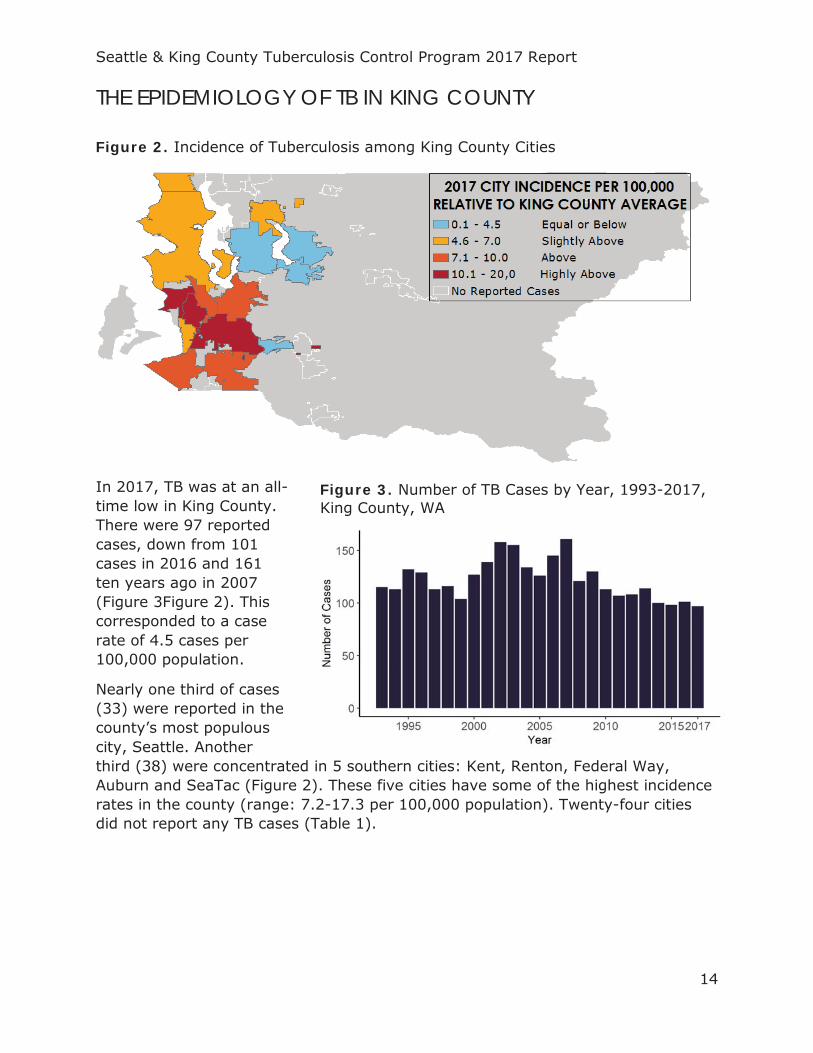
Figure 2. Incidence of Tuberculosis among King County Cities
In 2017, TB was at an all-time low in King County. There were 97 reported cases, down from 101 cases in 2016 and 161 ten years ago in 2007 (Figure 3Figure 2). This corresponded to a case rate of 4.5 cases per 100,000 population.
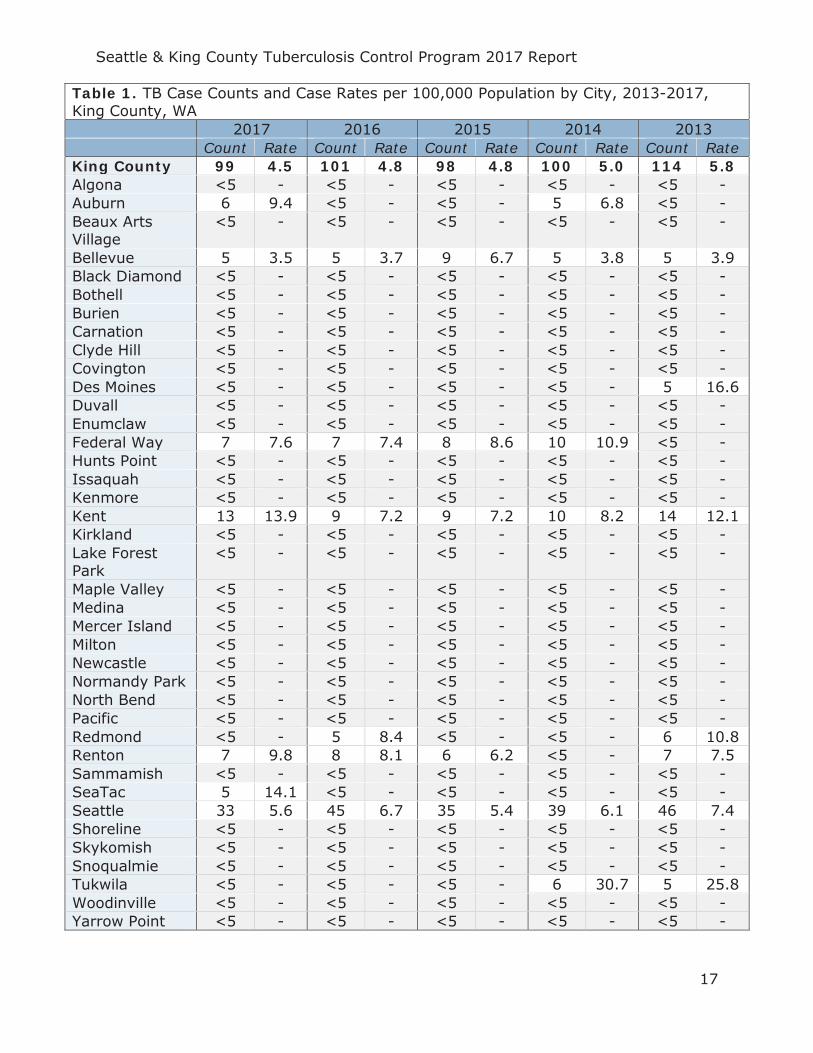
Nearly one third of cases (33) were reported in the county’s most populous city, Seattle. Another third (38) were concentrated in 5 southern cities: Kent, Renton, Federal Way, Auburn and SeaTac (Figure 2). These five cities have some of the highest incidence rates in the county (range: 7.2-17.3 per 100,000 population). Twenty-four cities did not report any TB cases (Table 1).
Figure 3. Number of TB Cases by Year, 1993-2017, King County, WA

Seattle & King County Tuberculosis Control Program 2017 Report
15
While gains are evident in King County, the case rate is still higher than the overall case rates in both Washington State and the United States (U.S.) (Figure 5). In Washington, the TB case rate has remained at or below 3.0 per 100,000 since 2011, with a case rate of 2.8 per 100,000 in 2017. Within Washington, 46.9% of all TB cases resided in King County. This is more than three times the number of cases in the second most burdened county (Snohomish County; 29 cases) (Figure 4).
According to the END TB Strategy, King County is considered a “low-incidence” geography (defined as fewer than 10 cases per 100,000 population) and
Figure 4. Frequency of Cases Among Washington State Counties, 2017
Figure 5. TB Case Rate per 100,000 Population, 1993-2017
END TB Strategy Definitions:
Low-Incidence: <10 cases per 100,000
Pre-Elimination: <1 cases per 100,000
Elimination: <0.1 cases per 100,000
Seattle & King County Tuberculosis Control Program 2017 Report
16
should have a goal of reaching pre-elimination (defined as less than 1 case per 100,000 population) by 2035 and elimination by 2050 or before (defined as less than 0.1 TB cases per 100,000 population). In King County an 8.0% annual decrease in the case rate is required to reach pre-elimination by 2035 and a 14.2% annual decrease thereafter to reach elimination by 2050. Over the past five years the average annual rate of decrease in King County has been 1.9%.
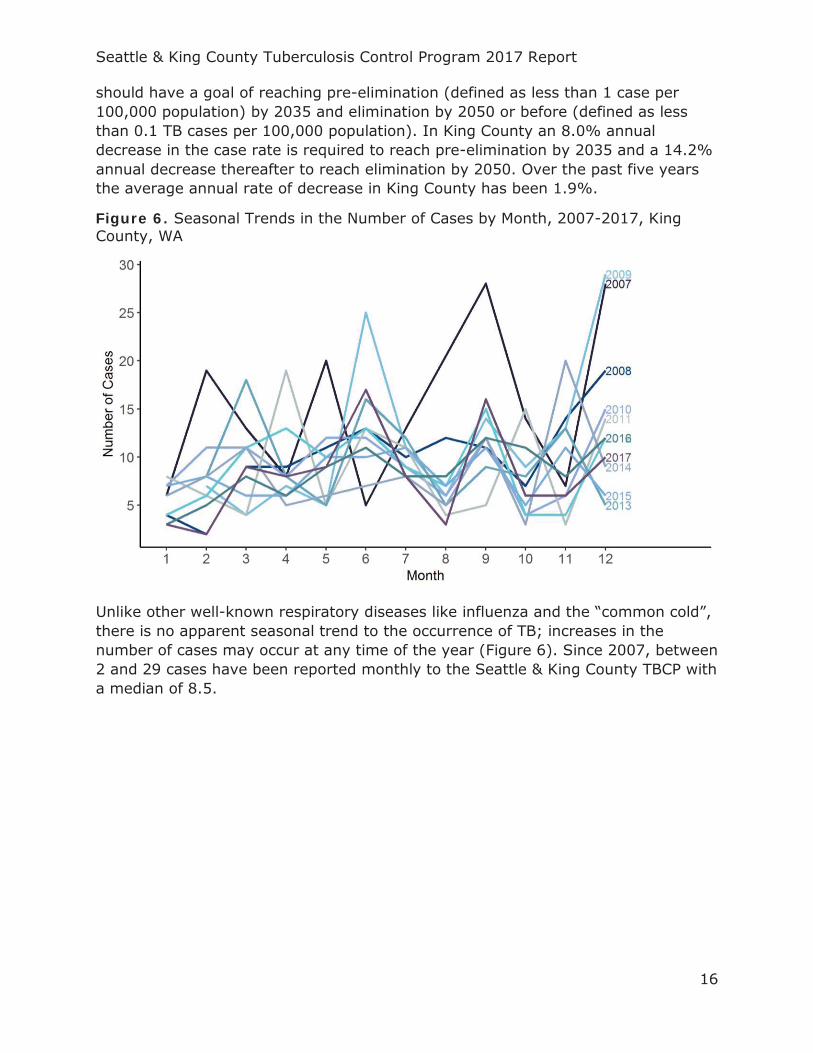
Figure 6. Seasonal Trends in the Number of Cases by Month, 2007-2017, King County, WA
Unlike other well-known respiratory diseases like influenza and the “common cold”, there is no apparent seasonal trend to the occurrence of TB; increases in the number of cases may occur at any time of the year (Figure 6). Since 2007, between 2 and 29 cases have been reported monthly to the Seattle & King County TBCP with a median of 8.5.
Seattle & King County Tuberculosis Control Program 2017 Report
17
Table 1. TB Case Counts and Case Rates per 100,000 Population by City, 2013-2017, King County, WA
2017 2016 2015 2014 2013 Count Rate Count Rate Count Rate Count Rate Count Rate
King County 99 4.5 101 4.8 98 4.8 100 5.0 114 5.8 Algona <5 - <5 - <5 - <5 - <5 - Auburn 6 9.4 <5 - <5 - 5 6.8 <5 - Beaux Arts Village
<5 - <5 - <5 - <5 - <5 -
Bellevue 5 3.5 5 3.7 9 6.7 5 3.8 5 3.9 Black Diamond <5 - <5 - <5 - <5 - <5 - Bothell <5 - <5 - <5 - <5 - <5 - Burien <5 - <5 - <5 - <5 - <5 - Carnation <5 - <5 - <5 - <5 - <5 - Clyde Hill <5 - <5 - <5 - <5 - <5 - Covington <5 - <5 - <5 - <5 - <5 - Des Moines <5 - <5 - <5 - <5 - 5 16.6 Duvall <5 - <5 - <5 - <5 - <5 - Enumclaw <5 - <5 - <5 - <5 - <5 - Federal Way 7 7.6 7 7.4 8 8.6 10 10.9 <5 - Hunts Point <5 - <5 - <5 - <5 - <5 - Issaquah <5 - <5 - <5 - <5 - <5 - Kenmore <5 - <5 - <5 - <5 - <5 - Kent 13 13.9 9 7.2 9 7.2 10 8.2 14 12.1 Kirkland <5 - <5 - <5 - <5 - <5 - Lake Forest Park
<5 - <5 - <5 - <5 - <5 -
Maple Valley <5 - <5 - <5 - <5 - <5 - Medina <5 - <5 - <5 - <5 - <5 - Mercer Island <5 - <5 - <5 - <5 - <5 - Milton <5 - <5 - <5 - <5 - <5 - Newcastle <5 - <5 - <5 - <5 - <5 - Normandy Park <5 - <5 - <5 - <5 - <5 - North Bend <5 - <5 - <5 - <5 - <5 - Pacific <5 - <5 - <5 - <5 - <5 - Redmond <5 - 5 8.4 <5 - <5 - 6 10.8 Renton 7 9.8 8 8.1 6 6.2 <5 - 7 7.5 Sammamish <5 - <5 - <5 - <5 - <5 - SeaTac 5 14.1 <5 - <5 - <5 - <5 - Seattle 33 5.6 45 6.7 35 5.4 39 6.1 46 7.4 Shoreline <5 - <5 - <5 - <5 - <5 - Skykomish <5 - <5 - <5 - <5 - <5 - Snoqualmie <5 - <5 - <5 - <5 - <5 - Tukwila <5 - <5 - <5 - 6 30.7 5 25.8 Woodinville <5 - <5 - <5 - <5 - <5 - Yarrow Point <5 - <5 - <5 - <5 - <5 -
Seattle & King County Tuberculosis Control Program 2017 Report
18
GENDER AND AGE
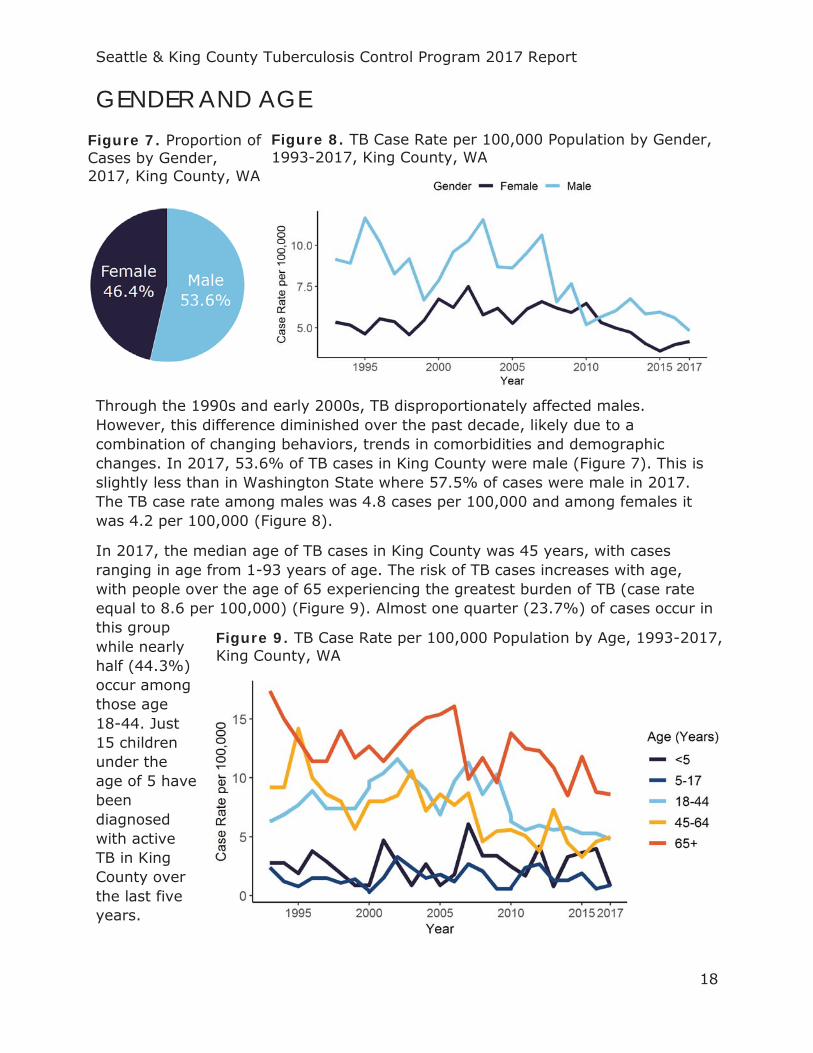
Through the 1990s and early 2000s, TB disproportionately affected males. However, this difference diminished over the past decade, likely due to a combination of changing behaviors, trends in comorbidities and demographic changes. In 2017, 53.6% of TB cases in King County were male (Figure 7). This is slightly less than in Washington State where 57.5% of cases were male in 2017. The TB case rate among males was 4.8 cases per 100,000 and among females it was 4.2 per 100,000 (Figure 8).
In 2017, the median age of TB cases in King County was 45 years, with cases ranging in age from 1-93 years of age. The risk of TB cases increases with age, with people over the age of 65 experiencing the greatest burden of TB (case rate equal to 8.6 per 100,000) (Figure 9). Almost one quarter (23.7%) of cases occur in this group while nearly half (44.3%) occur among those age 18-44. Just 15 children under the age of 5 have been diagnosed with active TB in King County over the last five years.
Figure 7. Proportion of Cases by Gender, 2017, King County, WA
Figure 8. TB Case Rate per 100,000 Population by Gender, 1993-2017, King County, WA
Figure 9. TB Case Rate per 100,000 Population by Age, 1993-2017, King County, WA
Seattle & King County Tuberculosis Control Program 2017 Report
19
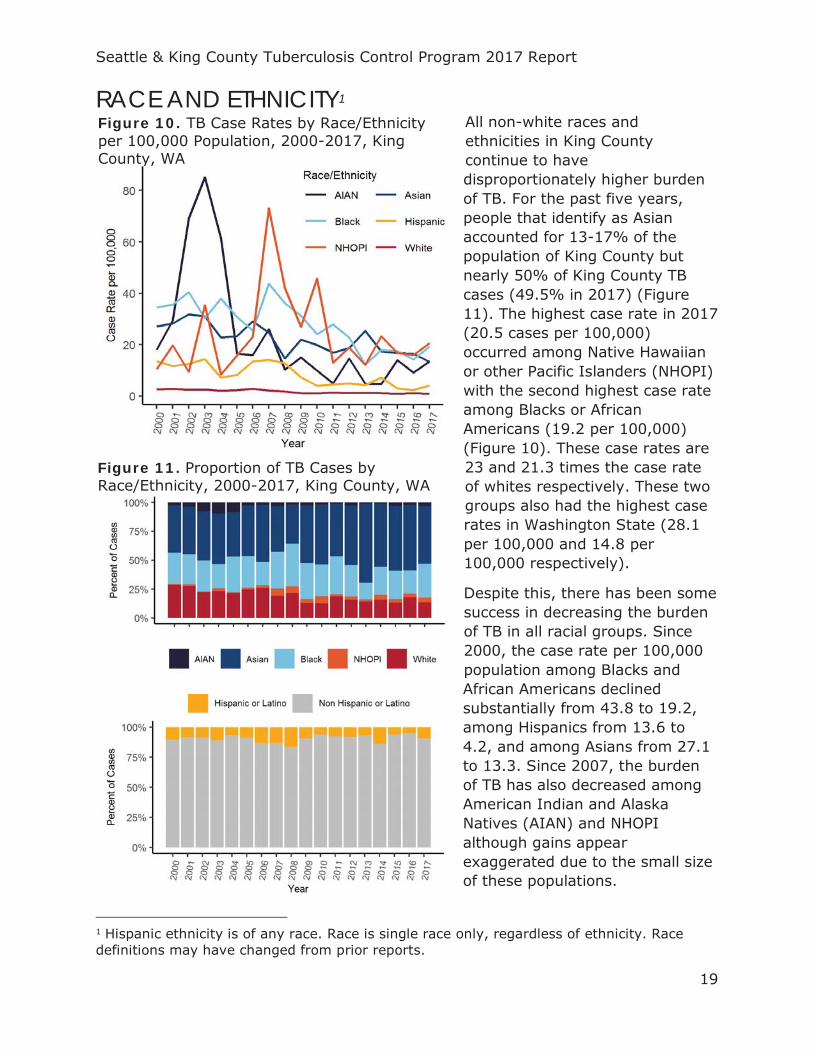
RACE AND ETHNICITY1 All non-white races and ethnicities in King County continue to have disproportionately higher burden of TB. For the past five years, people that identify as Asian accounted for 13-17% of the population of King County but nearly 50% of King County TB cases (49.5% in 2017) (Figure 11). The highest case rate in 2017 (20.5 cases per 100,000) occurred among Native Hawaiian or other Pacific Islanders (NHOPI) with the second highest case rate among Blacks or African Americans (19.2 per 100,000) (Figure 10). These case rates are 23 and 21.3 times the case rate of whites respectively. These two groups also had the highest case rates in Washington State (28.1 per 100,000 and 14.8 per 100,000 respectively).
Despite this, there has been some success in decreasing the burden of TB in all racial groups. Since 2000, the case rate per 100,000 population among Blacks and African Americans declined substantially from 43.8 to 19.2, among Hispanics from 13.6 to 4.2, and among Asians from 27.1 to 13.3. Since 2007, the burden of TB has also decreased among American Indian and Alaska Natives (AIAN) and NHOPI although gains appear exaggerated due to the small size of these populations.
1 Hispanic ethnicity is of any race. Race is single race only, regardless of ethnicity. Race definitions may have changed from prior reports.
Figure 10. TB Case Rates by Race/Ethnicity per 100,000 Population, 2000-2017, King County, WA
Figure 11. Proportion of TB Cases by Race/Ethnicity, 2000-2017, King County, WA
Seattle & King County Tuberculosis Control Program 2017 Report
20
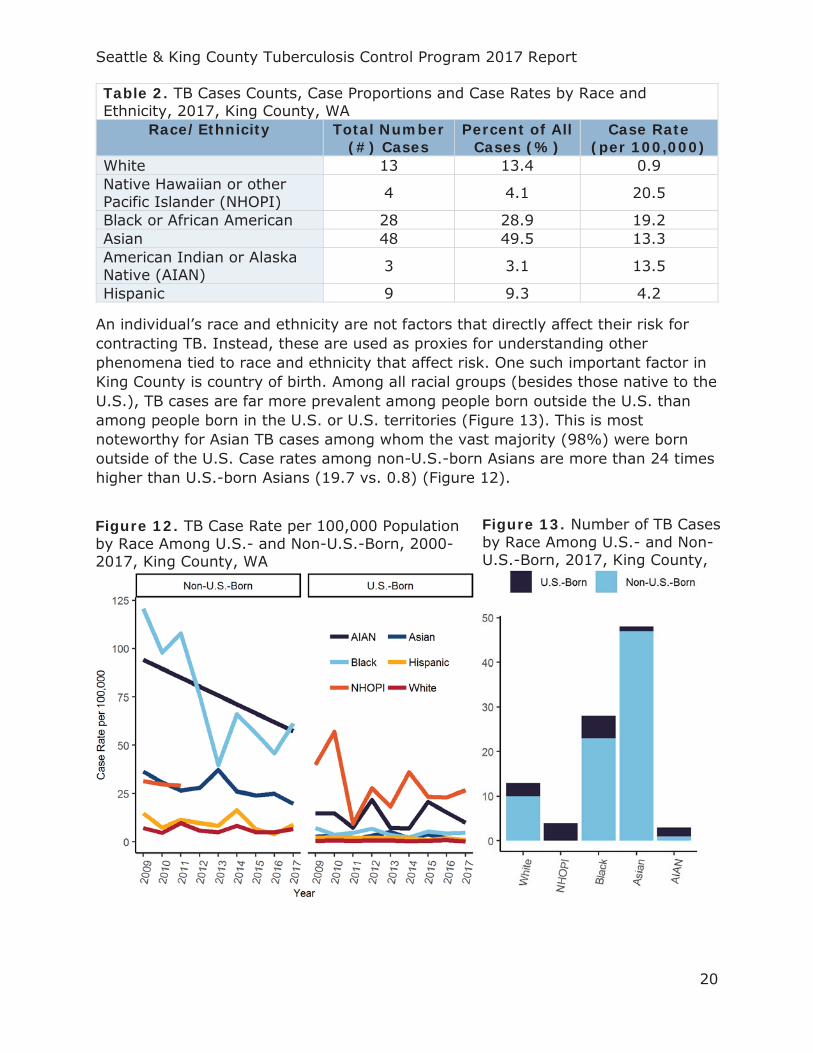
Table 2. TB Cases Counts, Case Proportions and Case Rates by Race and Ethnicity, 2017, King County, WA
Race/Ethnicity Total Number (#) Cases
Percent of All Cases (%)
Case Rate (per 100,000)
White 13 13.4 0.9 Native Hawaiian or other Pacific Islander (NHOPI) 4 4.1 20.5
Black or African American 28 28.9 19.2 Asian 48 49.5 13.3 American Indian or Alaska Native (AIAN) 3 3.1 13.5
Hispanic 9 9.3 4.2
An individual’s race and ethnicity are not factors that directly affect their risk for contracting TB. Instead, these are used as proxies for understanding other phenomena tied to race and ethnicity that affect risk. One such important factor in King County is country of birth. Among all racial groups (besides those native to the U.S.), TB cases are far more prevalent among people born outside the U.S. than among people born in the U.S. or U.S. territories (Figure 13). This is most noteworthy for Asian TB cases among whom the vast majority (98%) were born outside of the U.S. Case rates among non-U.S.-born Asians are more than 24 times higher than U.S.-born Asians (19.7 vs. 0.8) (Figure 12).
Figure 12. TB Case Rate per 100,000 Population by Race Among U.S.- and Non-U.S.-Born, 2000-2017, King County, WA
Figure 13. Number of TB Cases by Race Among U.S.- and Non-U.S.-Born, 2017, King County,
Seattle & King County Tuberculosis Control Program 2017 Report
21
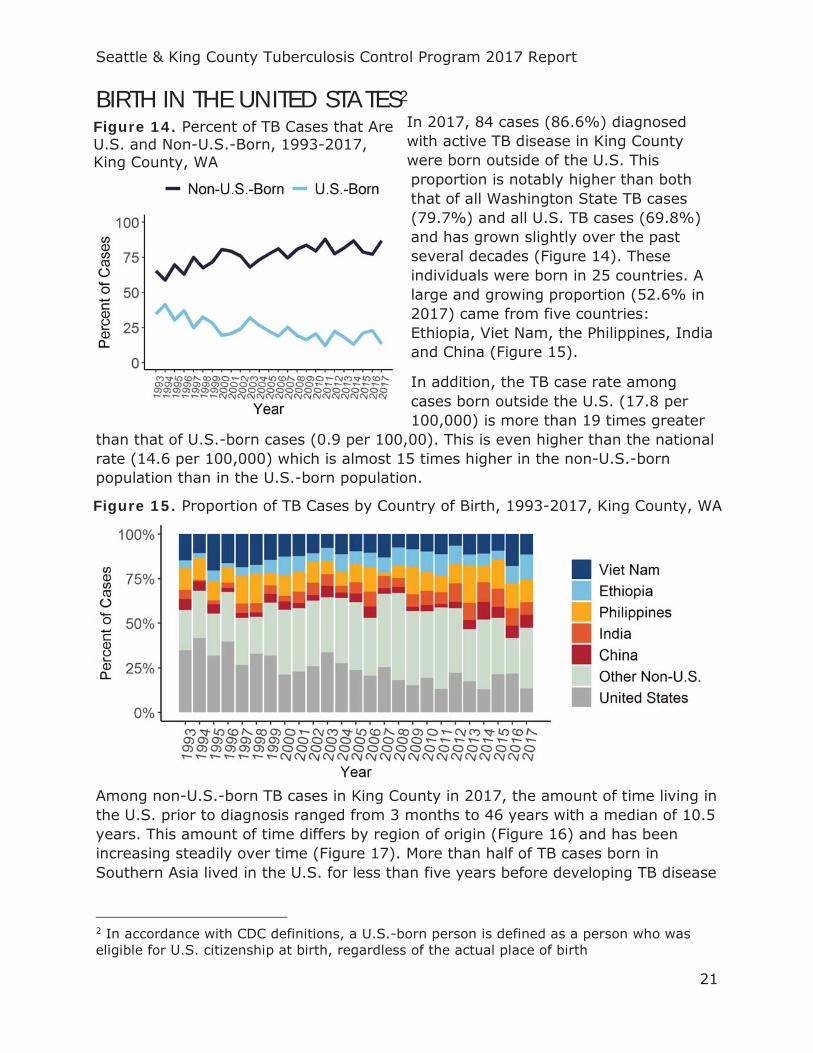
BIRTH IN THE UNITED STATES2 In 2017, 84 cases (86.6%) diagnosed with active TB disease in King County were born outside of the U.S. This proportion is notably higher than both that of all Washington State TB cases (79.7%) and all U.S. TB cases (69.8%) and has grown slightly over the past several decades (Figure 14). These individuals were born in 25 countries. A large and growing proportion (52.6% in 2017) came from five countries: Ethiopia, Viet Nam, the Philippines, India and China (Figure 15).
In addition, the TB case rate among cases born outside the U.S. (17.8 per 100,000) is more than 19 times greater
than that of U.S.-born cases (0.9 per 100,00). This is even higher than the national rate (14.6 per 100,000) which is almost 15 times higher in the non-U.S.-born population than in the U.S.-born population.
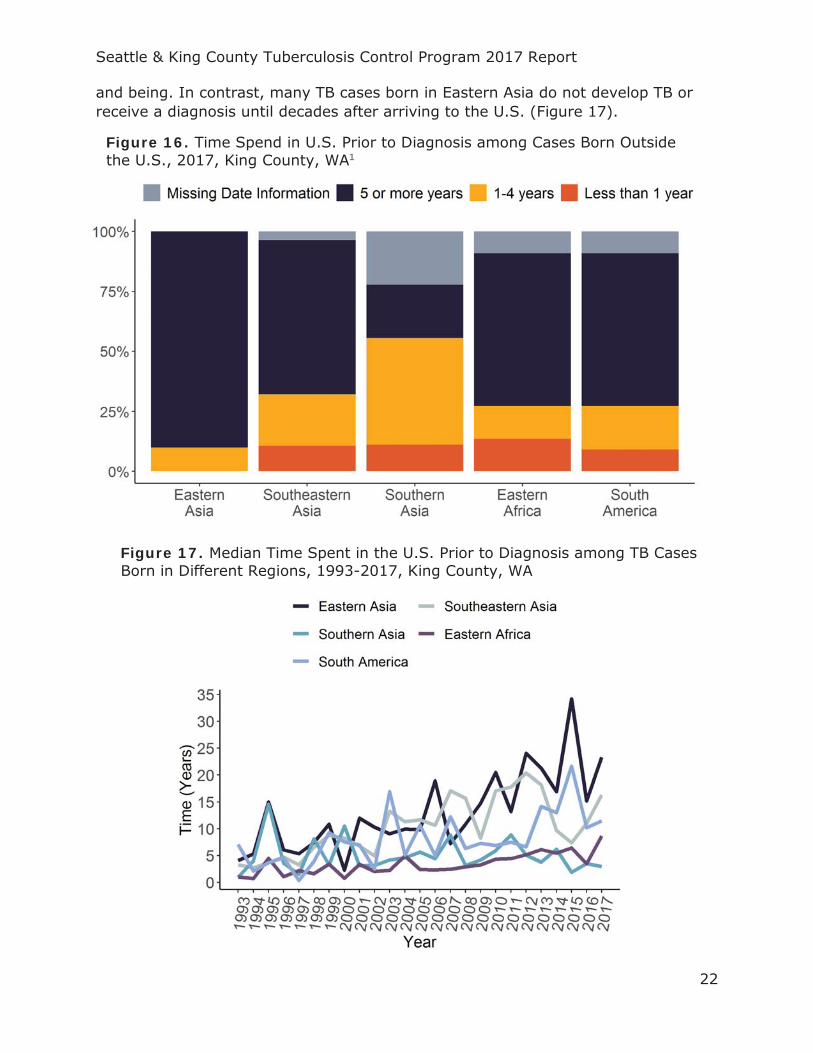
Among non-U.S.-born TB cases in King County in 2017, the amount of time living in the U.S. prior to diagnosis ranged from 3 months to 46 years with a median of 10.5 years. This amount of time differs by region of origin (Figure 16) and has been increasing steadily over time (Figure 17). More than half of TB cases born in Southern Asia lived in the U.S. for less than five years before developing TB disease
2 In accordance with CDC definitions, a U.S.-born person is defined as a person who was eligible for U.S. citizenship at birth, regardless of the actual place of birth
Figure 14. Percent of TB Cases that Are U.S. and Non-U.S.-Born, 1993-2017, King County, WA
Figure 15. Proportion of TB Cases by Country of Birth, 1993-2017, King County, WA
Seattle & King County Tuberculosis Control Program 2017 Report
22
and being. In contrast, many TB cases born in Eastern Asia do not develop TB or receive a diagnosis until decades after arriving to the U.S. (Figure 17).
Figure 16. Time Spend in U.S. Prior to Diagnosis among Cases Born Outside the U.S., 2017, King County, WA1
Figure 17. Median Time Spent in the U.S. Prior to Diagnosis among TB Cases Born in Different Regions, 1993-2017, King County, WA
Seattle & King County Tuberculosis Control Program 2017 Report
23
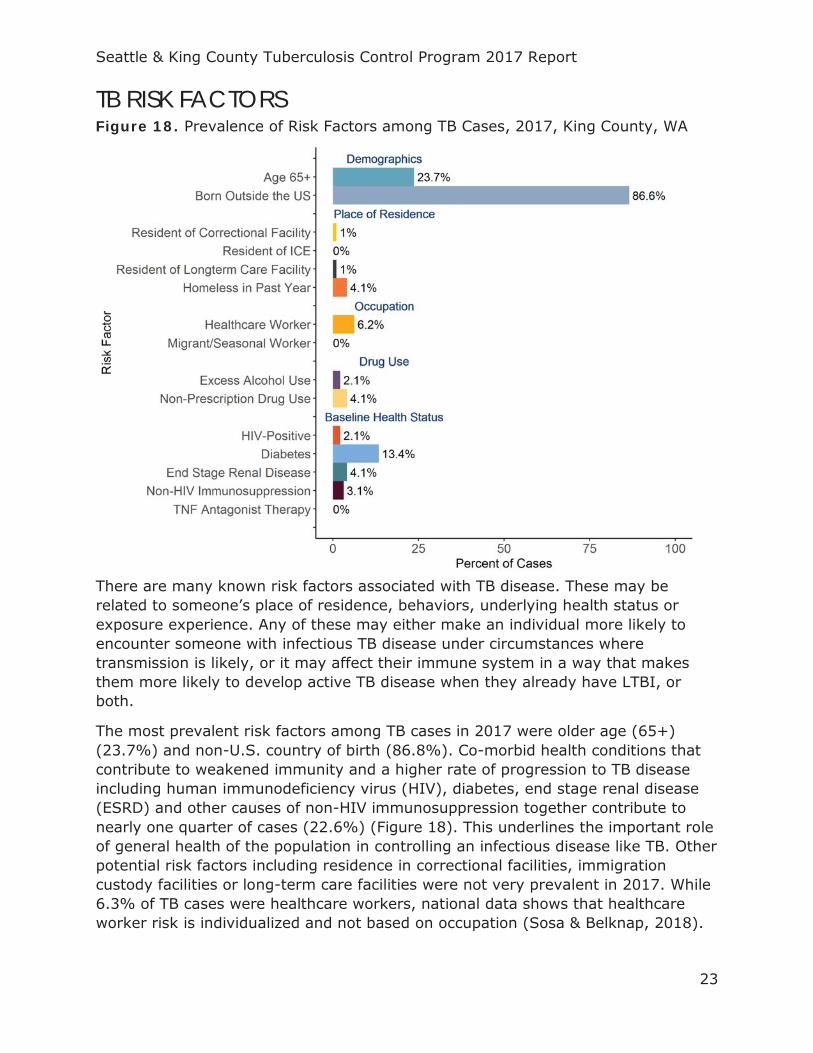
TB RISK FACTORS Figure 18. Prevalence of Risk Factors among TB Cases, 2017, King County, WA
There are many known risk factors associated with TB disease. These may be related to someone’s place of residence, behaviors, underlying health status or exposure experience. Any of these may either make an individual more likely to encounter someone with infectious TB disease under circumstances where transmission is likely, or it may affect their immune system in a way that makes them more likely to develop active TB disease when they already have LTBI, or both.
The most prevalent risk factors among TB cases in 2017 were older age (65+) (23.7%) and non-U.S. country of birth (86.8%). Co-morbid health conditions that contribute to weakened immunity and a higher rate of progression to TB disease including human immunodeficiency virus (HIV), diabetes, end stage renal disease (ESRD) and other causes of non-HIV immunosuppression together contribute to nearly one quarter of cases (22.6%) (Figure 18). This underlines the important role of general health of the population in controlling an infectious disease like TB. Other potential risk factors including residence in correctional facilities, immigration custody facilities or long-term care facilities were not very prevalent in 2017. While 6.3% of TB cases were healthcare workers, national data shows that healthcare worker risk is individualized and not based on occupation (Sosa & Belknap, 2018).
Seattle & King County Tuberculosis Control Program 2017 Report
24
TB COMORBIDITIES TB AND HIV
Table 3. HIV Status of TB Cases, 2017, King County, WA Measure 2012 2013 2014 2015 2016 2017
Negative # (%)
93 (86.1)
101 (88.6)
79 (79)
81 (82.7)
92 (91.1)
84 (866)
Positive # (%)
3 (2.8)
5 (4.4)
6 (6)
3 (3.1)
3 (3)
2 (2.1)
HIV Test Refused/Not Offered
# (%)
10 (9.3)
8 (7)
15 (15)
14 (14.3)
6 (5.9)
9 (9.3)
Unknown # (%)
2 (1.9)
NA NA NA NA 2 (2.1)
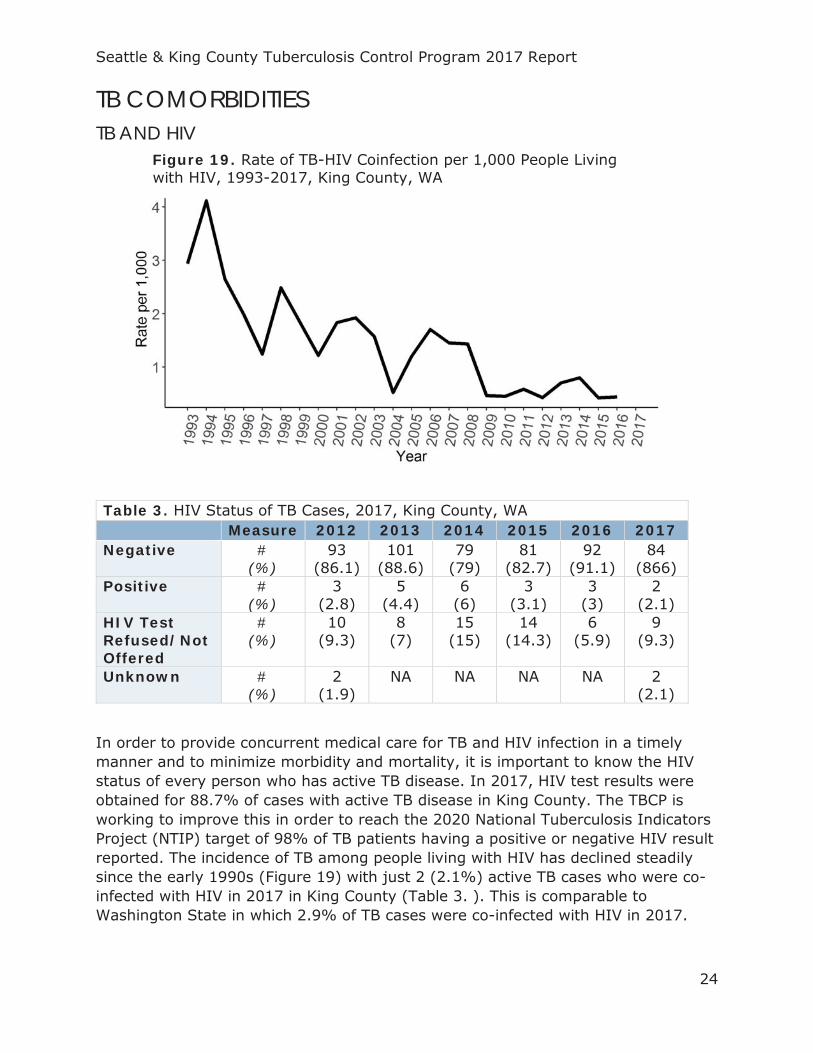
In order to provide concurrent medical care for TB and HIV infection in a timely manner and to minimize morbidity and mortality, it is important to know the HIV status of every person who has active TB disease. In 2017, HIV test results were obtained for 88.7% of cases with active TB disease in King County. The TBCP is working to improve this in order to reach the 2020 National Tuberculosis Indicators Project (NTIP) target of 98% of TB patients having a positive or negative HIV result reported. The incidence of TB among people living with HIV has declined steadily since the early 1990s (Figure 19) with just 2 (2.1%) active TB cases who were co-infected with HIV in 2017 in King County (Table 3. ). This is comparable to Washington State in which 2.9% of TB cases were co-infected with HIV in 2017.
Figure 19. Rate of TB-HIV Coinfection per 1,000 People Living with HIV, 1993-2017, King County, WA
Seattle & King County Tuberculosis Control Program 2017 Report
25
TB AND DIABETES Table 4. Diabetes Status at Time of TB Diagnosis Among TB Cases, 2017, King County, WA
Status Measure 2012 2013 2014 2015 2016 2017 Diabetes #
(%) 22
(20.4) 26
(22.8) 21
(21) 16
(16.3) 12
(11.9) 13
(13.4) No Diabetes #
(%) 86
(79.6) 88
(77.2) 79
(79) 82
(83.7) 89
(88.1) 84
(86.6)
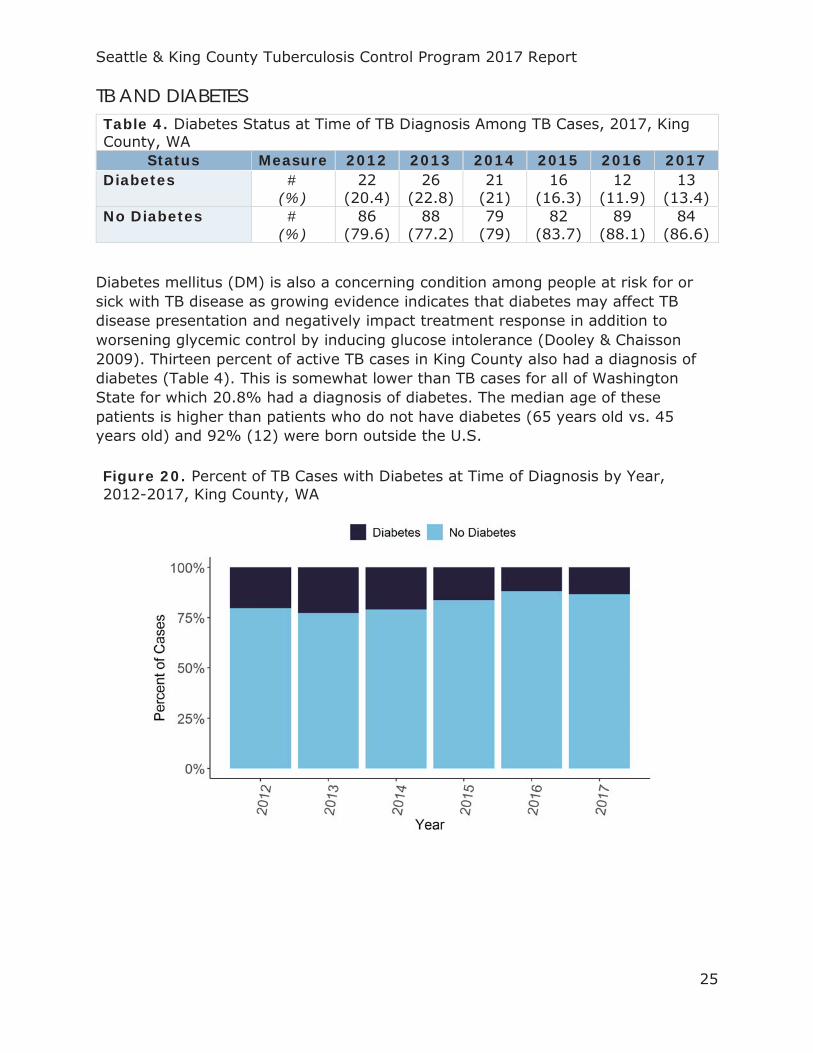
Diabetes mellitus (DM) is also a concerning condition among people at risk for or sick with TB disease as growing evidence indicates that diabetes may affect TB disease presentation and negatively impact treatment response in addition to worsening glycemic control by inducing glucose intolerance (Dooley & Chaisson 2009). Thirteen percent of active TB cases in King County also had a diagnosis of diabetes (Table 4). This is somewhat lower than TB cases for all of Washington State for which 20.8% had a diagnosis of diabetes. The median age of these patients is higher than patients who do not have diabetes (65 years old vs. 45 years old) and 92% (12) were born outside the U.S.
Figure 20. Percent of TB Cases with Diabetes at Time of Diagnosis by Year, 2012-2017, King County, WA
Seattle & King County Tuberculosis Control Program 2017 Report
26
TB IN PEOPLE EXPERIENCING HOMELESSNESS3
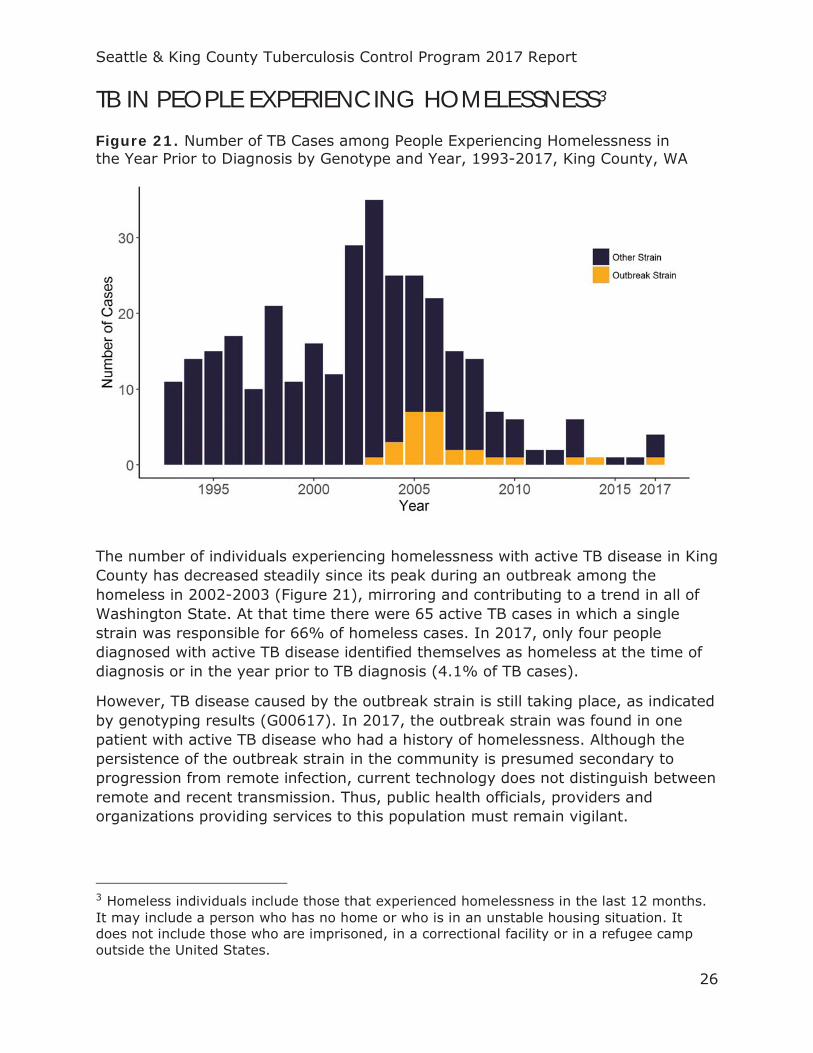
The number of individuals experiencing homelessness with active TB disease in King County has decreased steadily since its peak during an outbreak among the homeless in 2002-2003 (Figure 21), mirroring and contributing to a trend in all of Washington State. At that time there were 65 active TB cases in which a single strain was responsible for 66% of homeless cases. In 2017, only four people diagnosed with active TB disease identified themselves as homeless at the time of diagnosis or in the year prior to TB diagnosis (4.1% of TB cases).
However, TB disease caused by the outbreak strain is still taking place, as indicated by genotyping results (G00617). In 2017, the outbreak strain was found in one patient with active TB disease who had a history of homelessness. Although the persistence of the outbreak strain in the community is presumed secondary to progression from remote infection, current technology does not distinguish between remote and recent transmission. Thus, public health officials, providers and organizations providing services to this population must remain vigilant.
3 Homeless individuals include those that experienced homelessness in the last 12 months. It may include a person who has no home or who is in an unstable housing situation. It does not include those who are imprisoned, in a correctional facility or in a refugee camp outside the United States.
Figure 21. Number of TB Cases among People Experiencing Homelessness in the Year Prior to Diagnosis by Genotype and Year, 1993-2017, King County, WA
Seattle & King County Tuberculosis Control Program 2017 Report
27
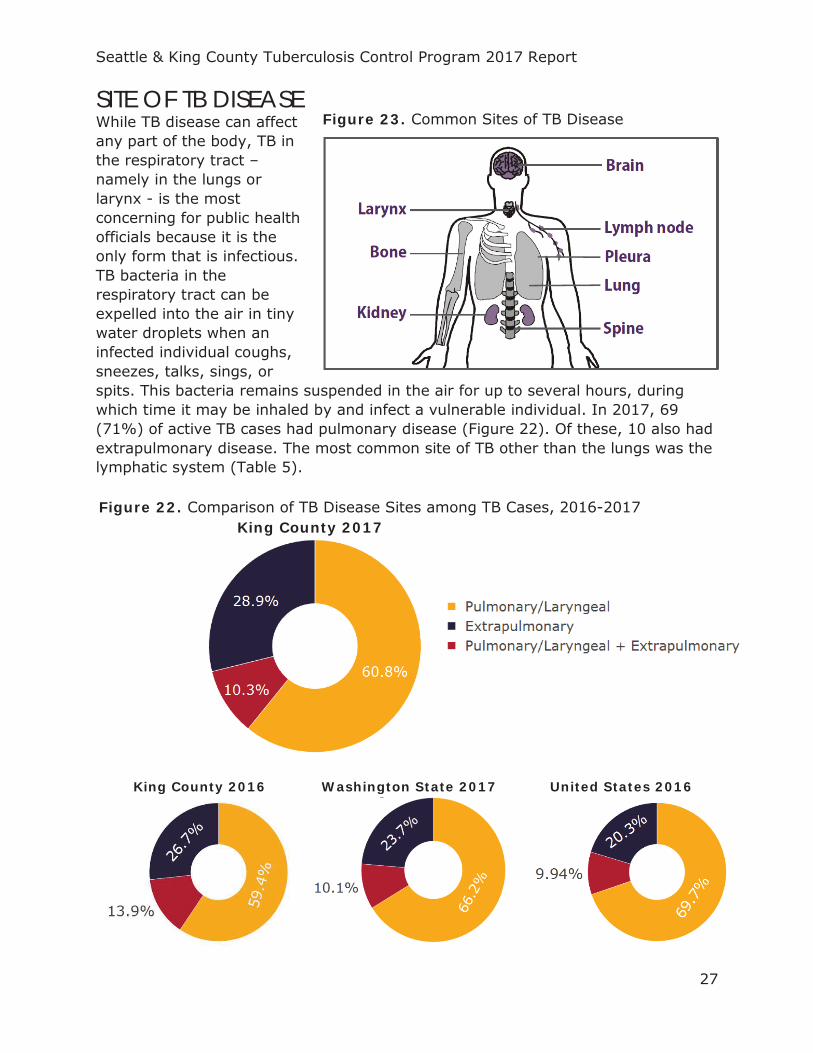
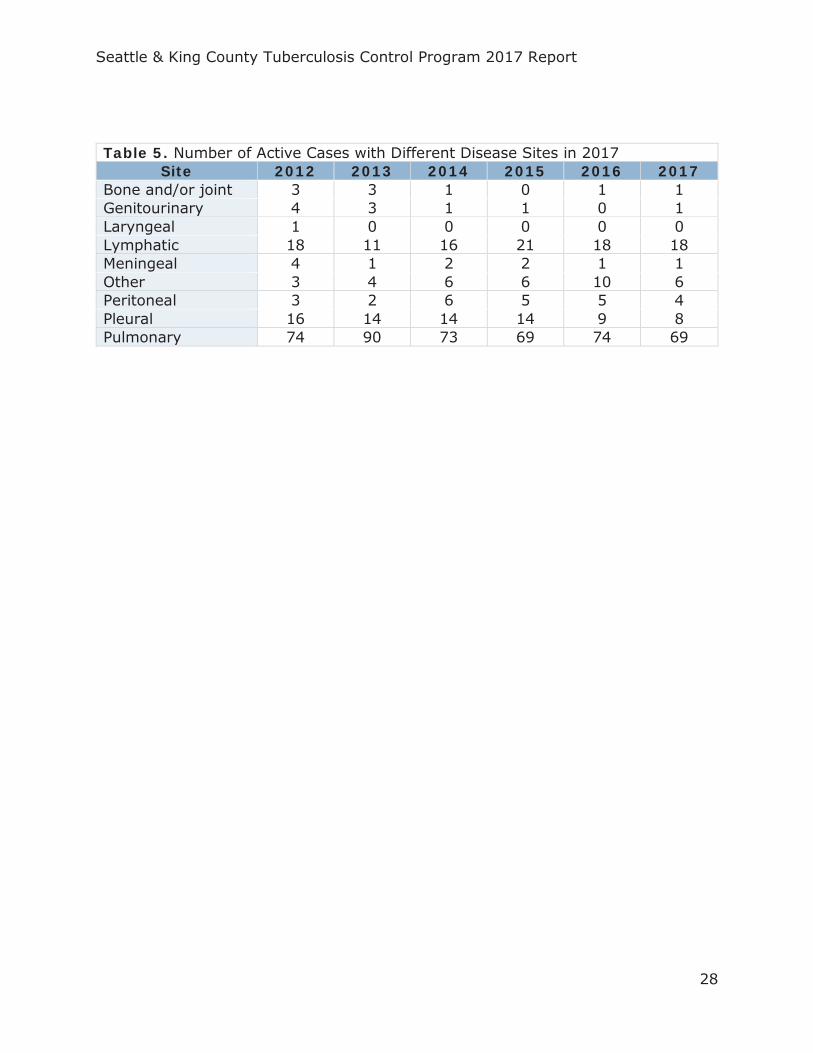
SITE OF TB DISEASE While TB disease can affect any part of the body, TB in the respiratory tract – namely in the lungs or larynx - is the most concerning for public health officials because it is the only form that is infectious. TB bacteria in the respiratory tract can be expelled into the air in tiny water droplets when an infected individual coughs, sneezes, talks, sings, or spits. This bacteria remains suspended in the air for up to several hours, during which time it may be inhaled by and infect a vulnerable individual. In 2017, 69 (71%) of active TB cases had pulmonary disease (Figure 22). Of these, 10 also had extrapulmonary disease. The most common site of TB other than the lungs was the lymphatic system (Table 5).
King County 2016
Washington State 2017
United States 2016
Figure 23. Common Sites of TB Disease
Figure 22. Comparison of TB Disease Sites among TB Cases, 2016-2017 King County 2017
Seattle & King County Tuberculosis Control Program 2017 Report
28
Table 5. Number of Active Cases with Different Disease Sites in 2017 Site 2012 2013 2014 2015 2016 2017
Bone and/or joint 3 3 1 0 1 1 Genitourinary 4 3 1 1 0 1 Laryngeal 1 0 0 0 0 0 Lymphatic 18 11 16 21 18 18 Meningeal 4 1 2 2 1 1 Other 3 4 6 6 10 6 Peritoneal 3 2 6 5 5 4 Pleural 16 14 14 14 9 8 Pulmonary 74 90 73 69 74 69
Seattle & King County Tuberculosis Control Program 2017 Report
29
TB DISEASE DIAGNOSTIC TESTING Figure 24. Comparison of Results of Non-Fatal Adult Pulmonary TB Case Diagnostic Testing, 2012-2017, King County, WA
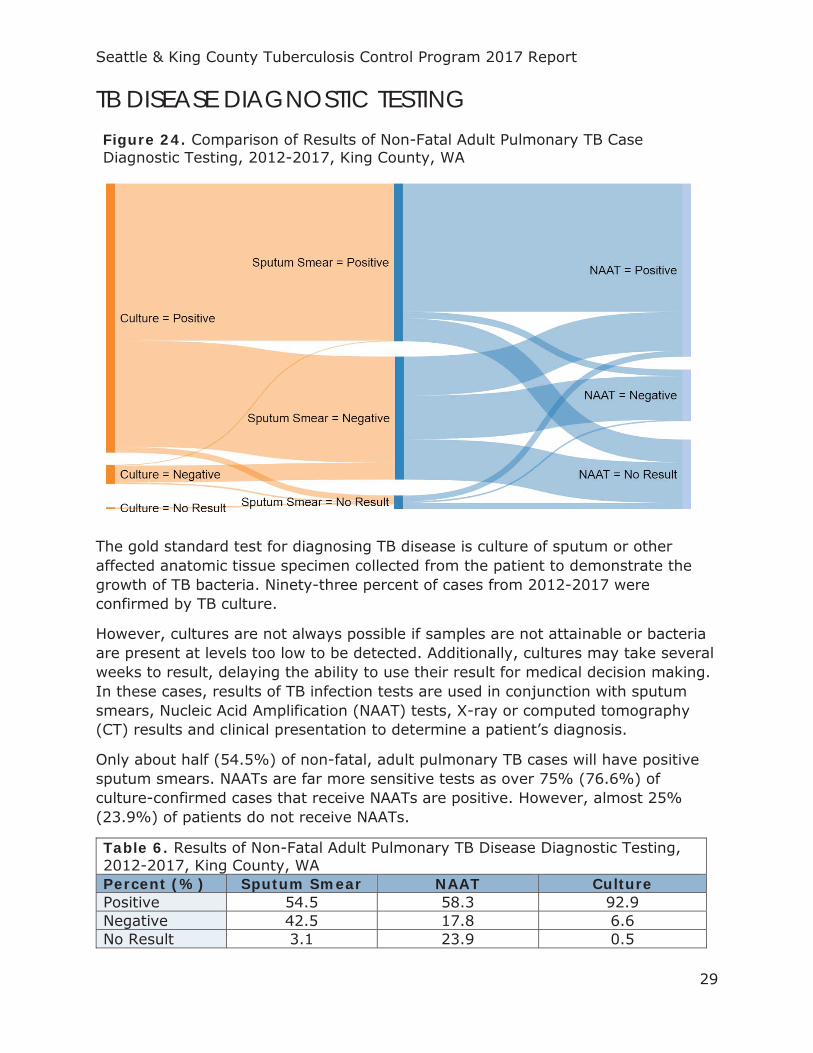
The gold standard test for diagnosing TB disease is culture of sputum or other affected anatomic tissue specimen collected from the patient to demonstrate the growth of TB bacteria. Ninety-three percent of cases from 2012-2017 were confirmed by TB culture.
However, cultures are not always possible if samples are not attainable or bacteria are present at levels too low to be detected. Additionally, cultures may take several weeks to result, delaying the ability to use their result for medical decision making. In these cases, results of TB infection tests are used in conjunction with sputum smears, Nucleic Acid Amplification (NAAT) tests, X-ray or computed tomography (CT) results and clinical presentation to determine a patient’s diagnosis.
Only about half (54.5%) of non-fatal, adult pulmonary TB cases will have positive sputum smears. NAATs are far more sensitive tests as over 75% (76.6%) of culture-confirmed cases that receive NAATs are positive. However, almost 25% (23.9%) of patients do not receive NAATs.
Table 6. Results of Non-Fatal Adult Pulmonary TB Disease Diagnostic Testing, 2012-2017, King County, WA Percent (%) Sputum Smear NAAT Culture Positive 54.5 58.3 92.9 Negative 42.5 17.8 6.6 No Result 3.1 23.9 0.5

Seattle & King County Tuberculosis Control Program 2017 Report
30
DRUG RESISTANCE In 2017, 19 cases (19.6%) treated for TB were resistant to at least one first-line TB medication, and two individuals were diagnosed and treated for multidrug-resistant TB (MDR TB) (Table 7). This accounted for 50% of MDR TB cases in Washington State. MDR TB is defined as TB that is resistant to at least isoniazid (INH) and rifampin (RIF), the two most effective first-line TB antibiotics. There were no cases of extensively drug-resistant TB (XDR TB) - defined as resistance to isoniazid and rifampin, plus any fluoroquinolone and at least one of three injectable second-line drugs (i.e., amikacin, kanamycin, or capreomycin) – diagnosed anywhere in Washington State.
Consistent with national trends, INH resistance is more common than resistance to RIF or any of its derivatives (Figure 26). This is especially true among cases non-U.S-born cases (Figure 25).
Figure 26. Percent of TB Cases with Anti-TB Drug Resistance, 1993-2017, King County, WA
Figure 25. Percent of U.S. and Non-U.S.-Born TB Cases with Isoniazid Resistance, 1993-2017, King County, WA
Seattle & King County Tuberculosis Control Program 2017 Report
31
Table 7. Case Count and Percent of Cases with Anti-TB Drug Resistance, 2017, King County, WA
Status Measure 2012 2013 2014 2015 2016 2017 Resistant to 1+ First-Line Drug
# (%)
21 (19.4)
17 (14.9)
18 (18)
12 (12.2)
16 (15.8)
19 (19.6)
MDR TB # (%)
2 (1.9)
0 (0)
1 (1)
3 (3.1)
0 (0)
2 (2.1)
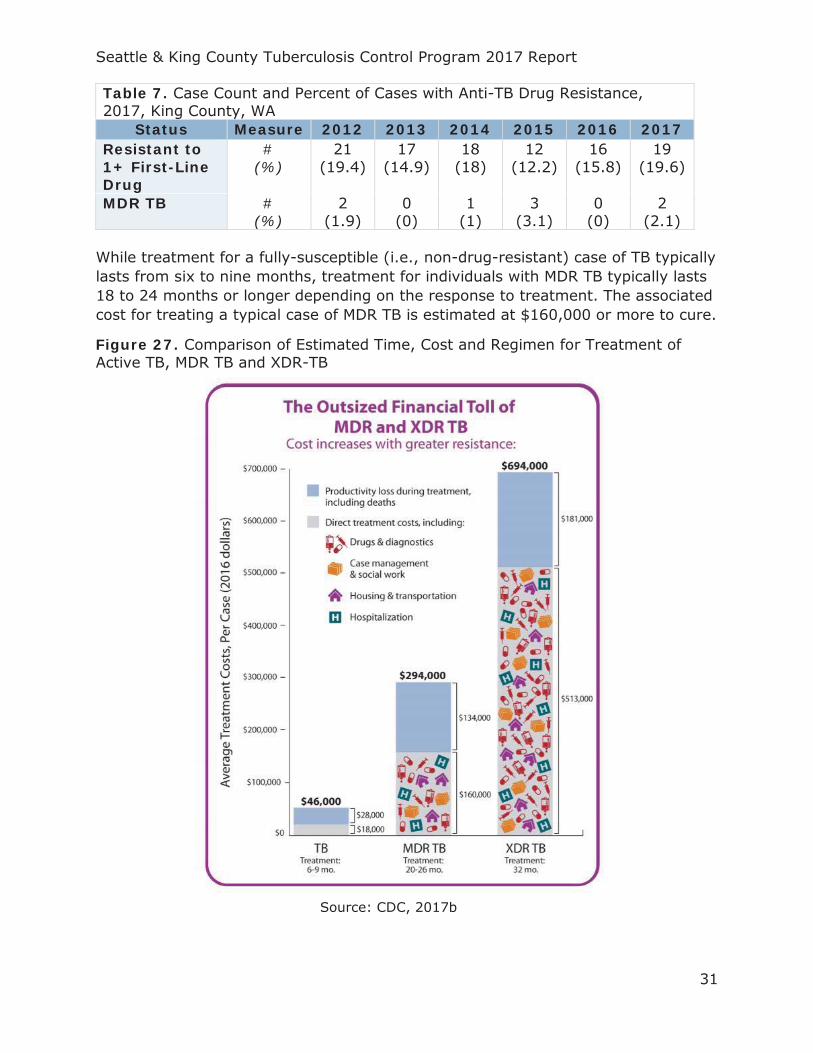
While treatment for a fully-susceptible (i.e., non-drug-resistant) case of TB typically lasts from six to nine months, treatment for individuals with MDR TB typically lasts 18 to 24 months or longer depending on the response to treatment. The associated cost for treating a typical case of MDR TB is estimated at $160,000 or more to cure.
Figure 27. Comparison of Estimated Time, Cost and Regimen for Treatment of Active TB, MDR TB and XDR-TB
Source: CDC, 2017b
Seattle & King County Tuberculosis Control Program 2017 Report
32
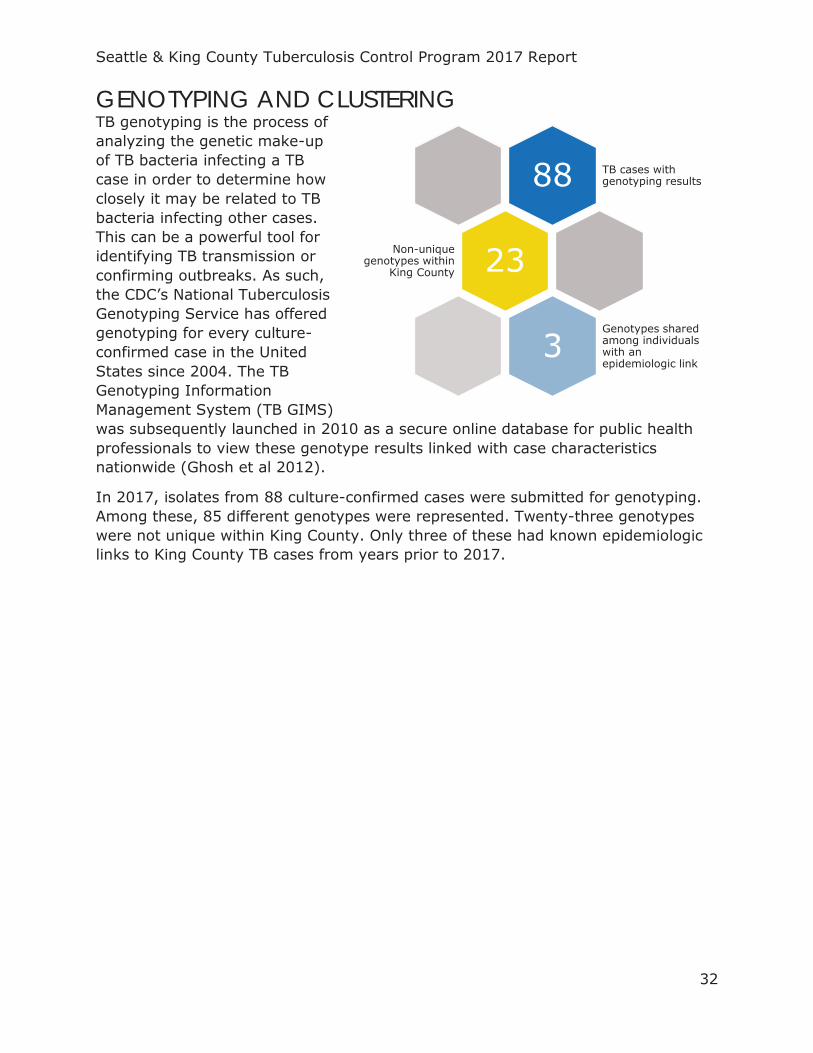
GENOTYPING AND CLUSTERING TB genotyping is the process of analyzing the genetic make-up of TB bacteria infecting a TB case in order to determine how closely it may be related to TB bacteria infecting other cases. This can be a powerful tool for identifying TB transmission or confirming outbreaks. As such, the CDC’s National Tuberculosis Genotyping Service has offered genotyping for every culture-confirmed case in the United States since 2004. The TB Genotyping Information Management System (TB GIMS) was subsequently launched in 2010 as a secure online database for public health professionals to view these genotype results linked with case characteristics nationwide (Ghosh et al 2012).
In 2017, isolates from 88 culture-confirmed cases were submitted for genotyping. Among these, 85 different genotypes were represented. Twenty-three genotypes were not unique within King County. Only three of these had known epidemiologic links to King County TB cases from years prior to 2017.
88 TB cases with genotyping results
23Non-unique genotypes within
King County
3Genotypes shared among individuals with an epidemiologic link
Seattle & King County Tuberculosis Control Program 2017 Report
33
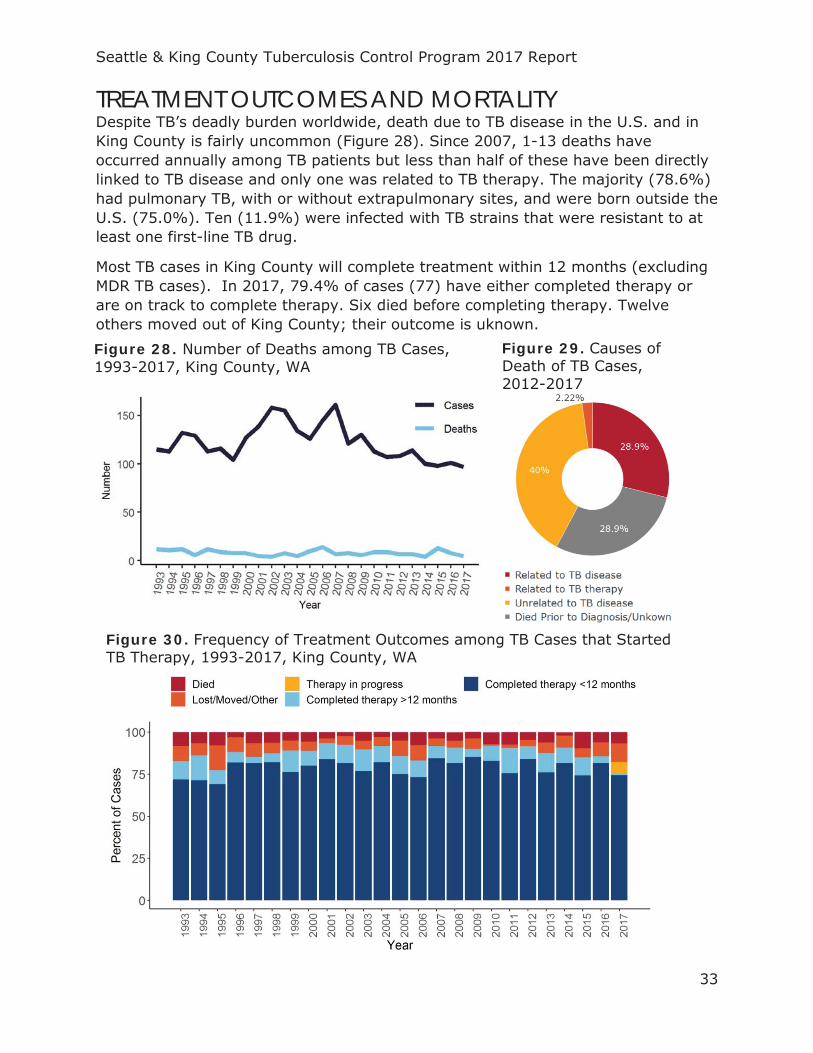
TREATMENT OUTCOMES AND MORTALITY Despite TB’s deadly burden worldwide, death due to TB disease in the U.S. and in King County is fairly uncommon (Figure 28). Since 2007, 1-13 deaths have occurred annually among TB patients but less than half of these have been directly linked to TB disease and only one was related to TB therapy. The majority (78.6%) had pulmonary TB, with or without extrapulmonary sites, and were born outside the U.S. (75.0%). Ten (11.9%) were infected with TB strains that were resistant to at least one first-line TB drug.
Most TB cases in King County will complete treatment within 12 months (excluding MDR TB cases). In 2017, 79.4% of cases (77) have either completed therapy or are on track to complete therapy. Six died before completing therapy. Twelve others moved out of King County; their outcome is uknown. Figure 28. Number of Deaths among TB Cases, 1993-2017, King County, WA
Figure 29. Causes of Death of TB Cases, 2012-2017
Figure 30. Frequency of Treatment Outcomes among TB Cases that Started TB Therapy, 1993-2017, King County, WA
Seattle & King County Tuberculosis Control Program 2017 Report
34
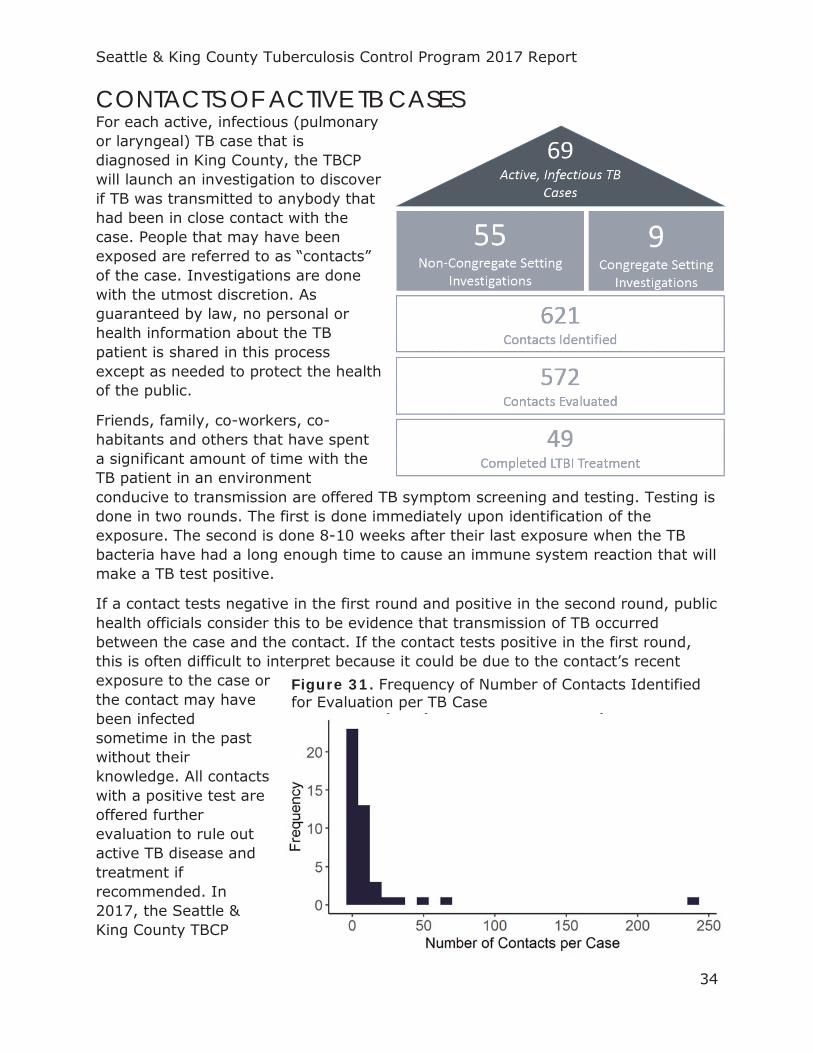
CONTACTS OF ACTIVE TB CASES For each active, infectious (pulmonary or laryngeal) TB case that is diagnosed in King County, the TBCP will launch an investigation to discover if TB was transmitted to anybody that had been in close contact with the case. People that may have been exposed are referred to as “contacts” of the case. Investigations are done with the utmost discretion. As guaranteed by law, no personal or health information about the TB patient is shared in this process except as needed to protect the health of the public.
Friends, family, co-workers, co-habitants and others that have spent a significant amount of time with the TB patient in an environment conducive to transmission are offered TB symptom screening and testing. Testing is done in two rounds. The first is done immediately upon identification of the exposure. The second is done 8-10 weeks after their last exposure when the TB bacteria have had a long enough time to cause an immune system reaction that will make a TB test positive.
If a contact tests negative in the first round and positive in the second round, public health officials consider this to be evidence that transmission of TB occurred between the case and the contact. If the contact tests positive in the first round, this is often difficult to interpret because it could be due to the contact’s recent exposure to the case or the contact may have been infected sometime in the past without their knowledge. All contacts with a positive test are offered further evaluation to rule out active TB disease and treatment if recommended. In 2017, the Seattle & King County TBCP
Figure 31. Frequency of Number of Contacts Identified for Evaluation per TB Case
Seattle & King County Tuberculosis Control Program 2017 Report
35
identified 621 contacts of 69 active, infectious TB cases. There were between zero and 242 contacts per case, with a median of 4 contacts per case. These ranged in age from 2 months to 88 years (median age: 19). Over half (55.2%) were male.
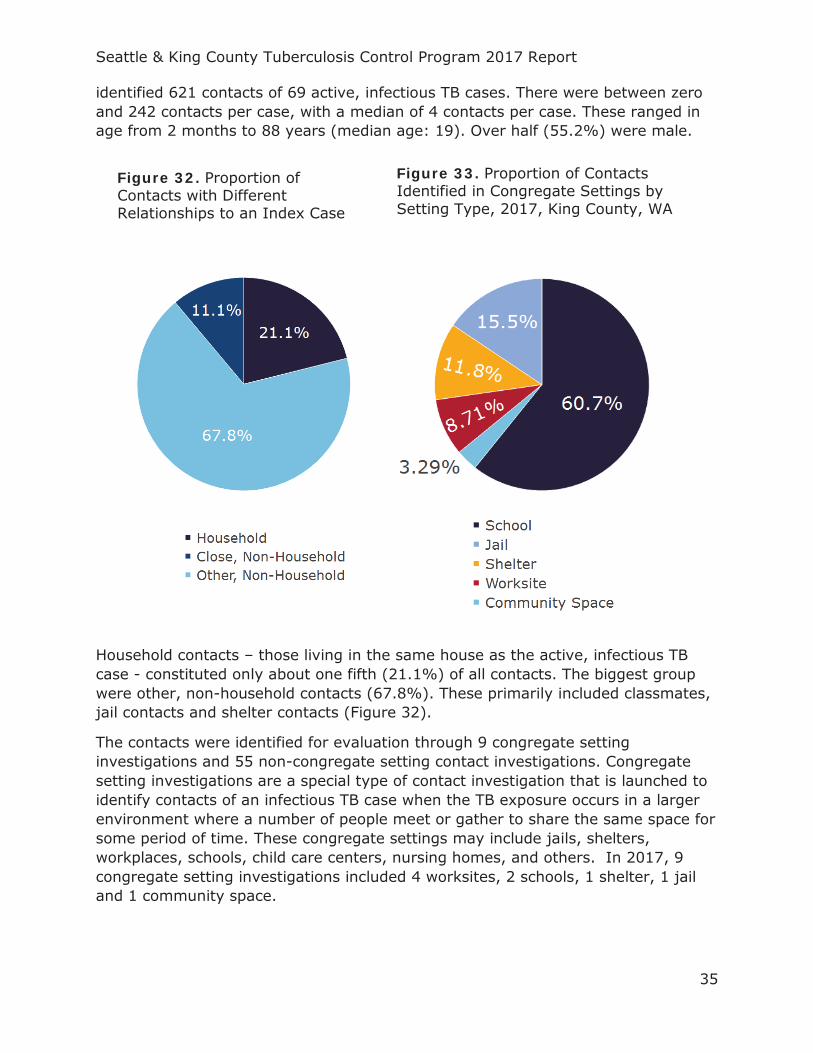
Household contacts – those living in the same house as the active, infectious TB case - constituted only about one fifth (21.1%) of all contacts. The biggest group were other, non-household contacts (67.8%). These primarily included classmates, jail contacts and shelter contacts (Figure 32).
The contacts were identified for evaluation through 9 congregate setting investigations and 55 non-congregate setting contact investigations. Congregate setting investigations are a special type of contact investigation that is launched to identify contacts of an infectious TB case when the TB exposure occurs in a larger environment where a number of people meet or gather to share the same space for some period of time. These congregate settings may include jails, shelters, workplaces, schools, child care centers, nursing homes, and others. In 2017, 9 congregate setting investigations included 4 worksites, 2 schools, 1 shelter, 1 jail and 1 community space.
Figure 32. Proportion of Contacts with Different Relationships to an Index Case
Figure 33. Proportion of Contacts Identified in Congregate Settings by Setting Type, 2017, King County, WA
Seattle & King County Tuberculosis Control Program 2017 Report
36
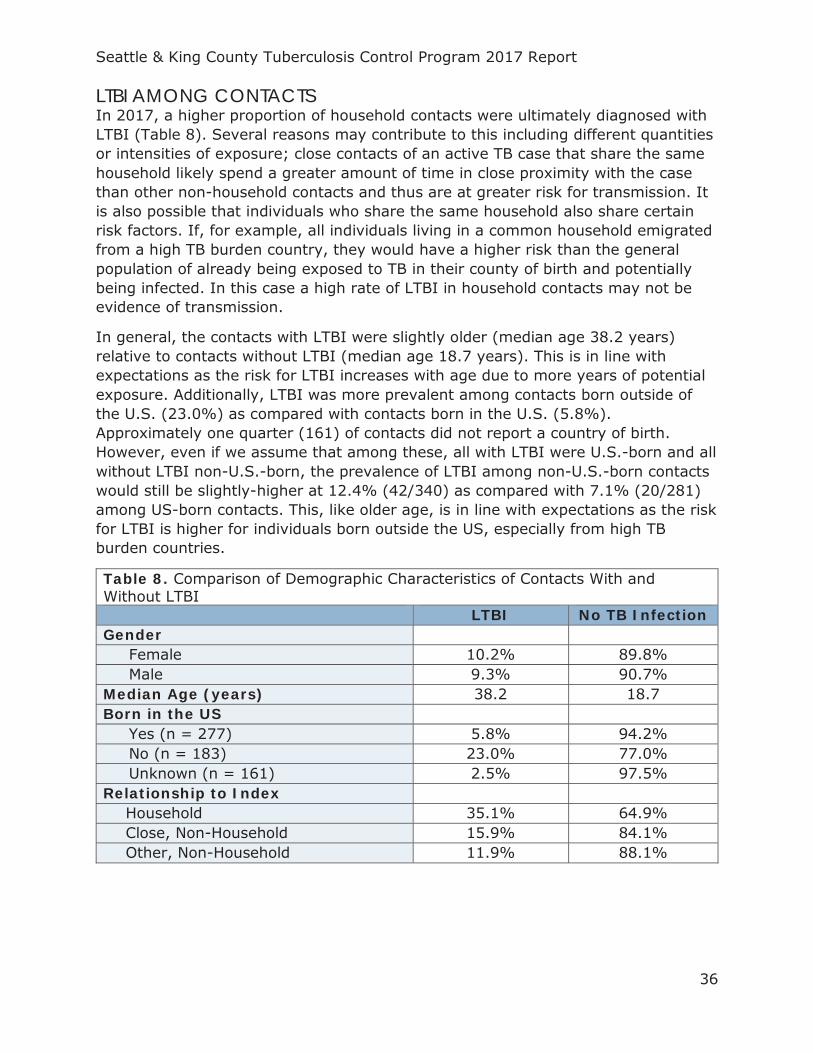
LTBI AMONG CONTACTS In 2017, a higher proportion of household contacts were ultimately diagnosed with LTBI (Table 8). Several reasons may contribute to this including different quantities or intensities of exposure; close contacts of an active TB case that share the same household likely spend a greater amount of time in close proximity with the case than other non-household contacts and thus are at greater risk for transmission. It is also possible that individuals who share the same household also share certain risk factors. If, for example, all individuals living in a common household emigrated from a high TB burden country, they would have a higher risk than the general population of already being exposed to TB in their county of birth and potentially being infected. In this case a high rate of LTBI in household contacts may not be evidence of transmission.
In general, the contacts with LTBI were slightly older (median age 38.2 years) relative to contacts without LTBI (median age 18.7 years). This is in line with expectations as the risk for LTBI increases with age due to more years of potential exposure. Additionally, LTBI was more prevalent among contacts born outside of the U.S. (23.0%) as compared with contacts born in the U.S. (5.8%). Approximately one quarter (161) of contacts did not report a country of birth. However, even if we assume that among these, all with LTBI were U.S.-born and all without LTBI non-U.S.-born, the prevalence of LTBI among non-U.S.-born contacts would still be slightly-higher at 12.4% (42/340) as compared with 7.1% (20/281) among US-born contacts. This, like older age, is in line with expectations as the risk for LTBI is higher for individuals born outside the US, especially from high TB burden countries.
Table 8. Comparison of Demographic Characteristics of Contacts With and Without LTBI LTBI No TB Infection Gender Female 10.2% 89.8% Male 9.3% 90.7% Median Age (years) 38.2 18.7 Born in the US Yes (n = 277) 5.8% 94.2% No (n = 183) 23.0% 77.0% Unknown (n = 161) 2.5% 97.5% Relationship to Index
Household 35.1% 64.9% Close, Non-Household 15.9% 84.1% Other, Non-Household 11.9% 88.1%
Seattle & King County Tuberculosis Control Program 2017 Report
37
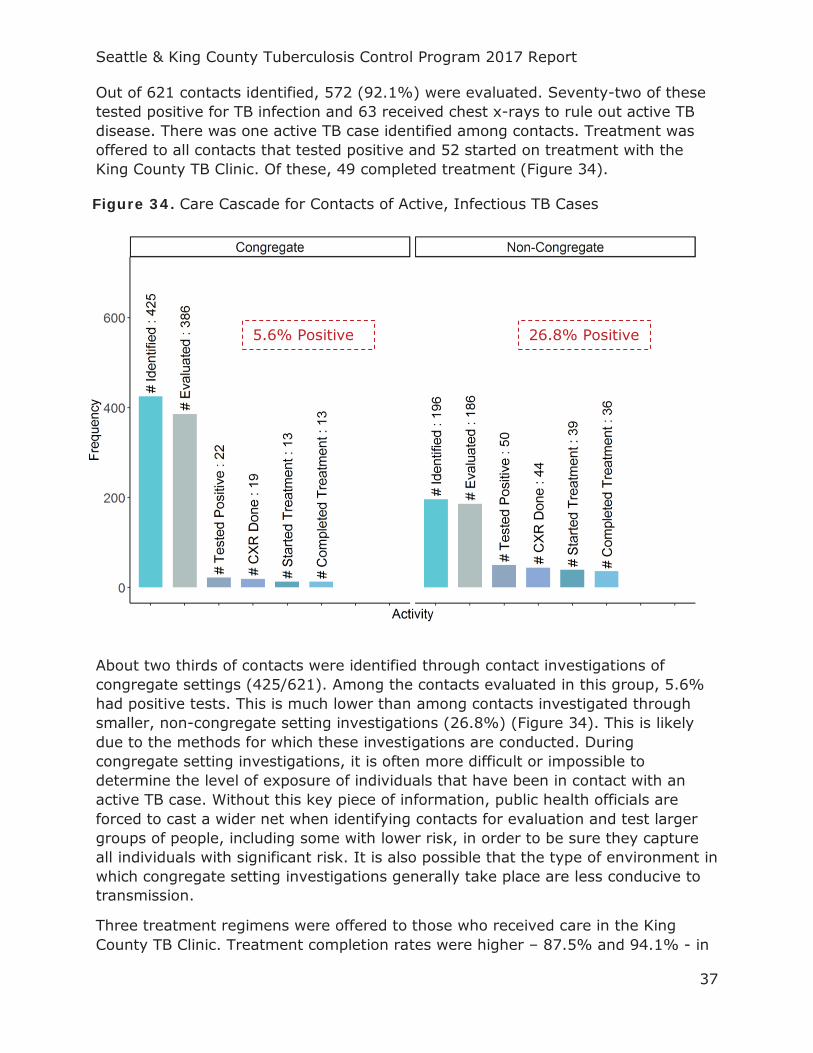
Out of 621 contacts identified, 572 (92.1%) were evaluated. Seventy-two of these tested positive for TB infection and 63 received chest x-rays to rule out active TB disease. There was one active TB case identified among contacts. Treatment was offered to all contacts that tested positive and 52 started on treatment with the King County TB Clinic. Of these, 49 completed treatment (Figure 34).
About two thirds of contacts were identified through contact investigations of congregate settings (425/621). Among the contacts evaluated in this group, 5.6% had positive tests. This is much lower than among contacts investigated through smaller, non-congregate setting investigations (26.8%) (Figure 34). This is likely due to the methods for which these investigations are conducted. During congregate setting investigations, it is often more difficult or impossible to determine the level of exposure of individuals that have been in contact with an active TB case. Without this key piece of information, public health officials are forced to cast a wider net when identifying contacts for evaluation and test larger groups of people, including some with lower risk, in order to be sure they capture all individuals with significant risk. It is also possible that the type of environment in which congregate setting investigations generally take place are less conducive to transmission.
Three treatment regimens were offered to those who received care in the King County TB Clinic. Treatment completion rates were higher – 87.5% and 94.1% - in
5.6% Positive 26.8% Positive
Figure 34. Care Cascade for Contacts of Active, Infectious TB Cases
Seattle & King County Tuberculosis Control Program 2017 Report
38
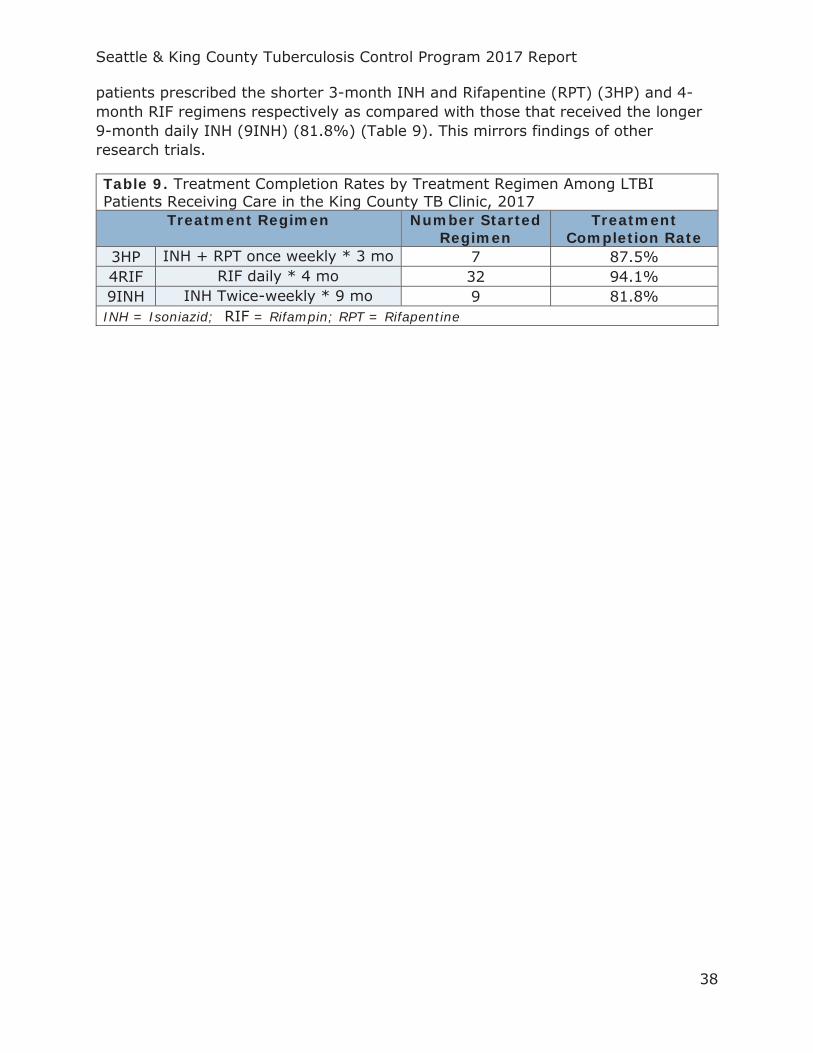
patients prescribed the shorter 3-month INH and Rifapentine (RPT) (3HP) and 4-month RIF regimens respectively as compared with those that received the longer 9-month daily INH (9INH) (81.8%) (Table 9). This mirrors findings of other research trials.
Table 9. Treatment Completion Rates by Treatment Regimen Among LTBI Patients Receiving Care in the King County TB Clinic, 2017
Treatment Regimen Number Started Regimen
Treatment Completion Rate
3HP INH + RPT once weekly * 3 mo 7 87.5% 4RIF RIF daily * 4 mo 32 94.1% 9INH INH Twice-weekly * 9 mo 9 81.8% INH = Isoniazid; RIF = Rifampin; RPT = Rifapentine

Seattle & King County Tuberculosis Control Program 2017 Report
39
SCREENING OF IMMIGRANTS AND REFUGEES Given the high rate of TB among non-U.S.-born residents of King County (19 times higher than U.S.-born), an important control measure for TB is the screening of immigrants and refugees as they enter the country. As many come from high-incidence countries, they are likely to have been exposed to TB at some point in their life and may have TB infection without ever knowing it.
In accordance with CDC guidelines, prior to departure for the United States, all immigrants and refugees receive an overseas medical examination to identify, among other things, TB infection or active TB disease (CDC 2010). People diagnosed with smear-positive, active TB disease must undergo treatment and demonstrate non-infectiousness before boarding a flight to the U.S. Once in the U.S., the medical evaluation results for all adult immigrants and refugees with evidence of lung abnormalities, children with evidence of TB infection during pre-departure medical examination and those with a history of contact with a known TB case are sent to the relevant Local Health Jurisdiction (LHJ) (i.e. King County) by the CDC. Public health officials attempt to contact these individuals to offer further evaluation or recommend follow-up with their primary care provider.
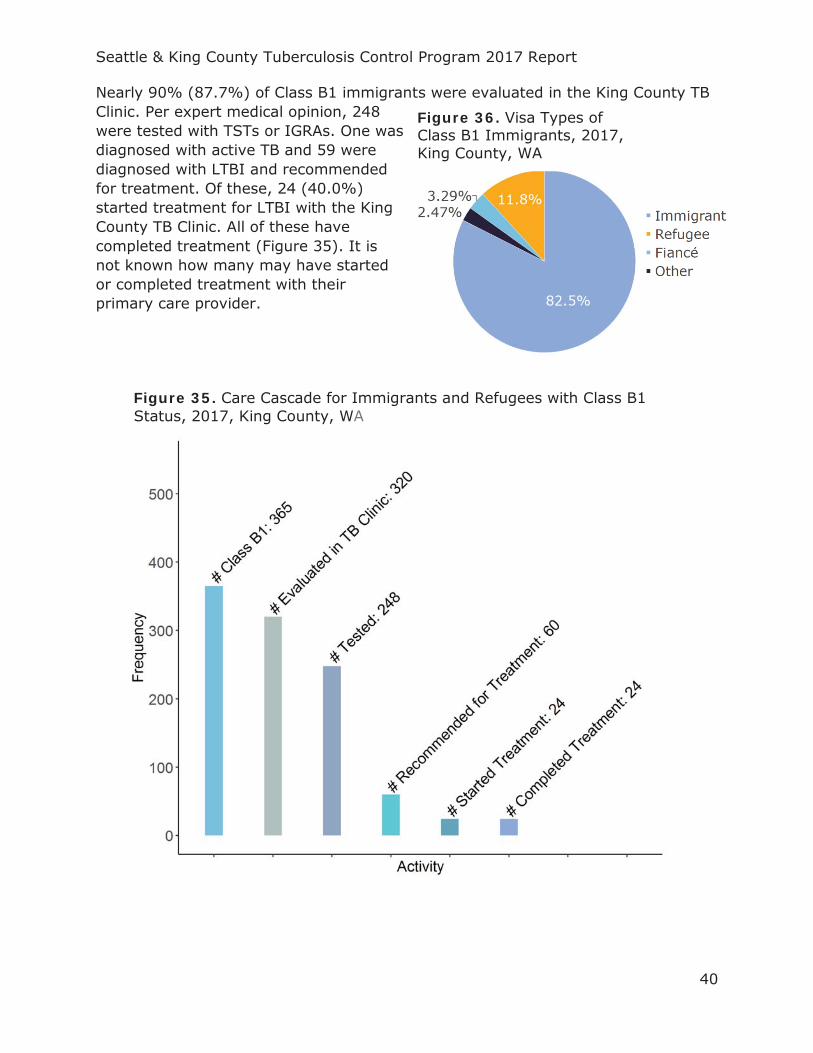
In 2017, the Seattle & King County TBCP was notified of the arrival of 485 immigrants or refugees under this system. Among these were 365 adults whom were contacted for further evaluation (Class B1), 116 children (Class B2) who were referred for follow-up with their primary care providers and 4 contacts of known TB cases (Class B3) (Table 10). The majority of these (82.5%) arrived with immigrant visas; 11.8% arrived with refugee visas (Figure 36).
Table 10. Number of Class B Arrivals to King County, 2017
Classification Definition Number
Class B1
Adult with evidence of lung abnormalities during pre-immigration medical examination
365
Class B2
Child with evidence of TB infection during pre-immigration medical examination
116
Class B3
Individual with a history of contact with a known TB case identified during pre- immigration medical examination
4
Total 485
Seattle & King County Tuberculosis Control Program 2017 Report
40
Nearly 90% (87.7%) of Class B1 immigrants were evaluated in the King County TB Clinic. Per expert medical opinion, 248 were tested with TSTs or IGRAs. One was diagnosed with active TB and 59 were diagnosed with LTBI and recommended for treatment. Of these, 24 (40.0%) started treatment for LTBI with the King County TB Clinic. All of these have completed treatment (Figure 35). It is not known how many may have started or completed treatment with their primary care provider.
Figure 36. Visa Types of Class B1 Immigrants, 2017, King County, WA
Figure 35. Care Cascade for Immigrants and Refugees with Class B1 Status, 2017, King County, WA
Seattle & King County Tuberculosis Control Program 2017 Report
41
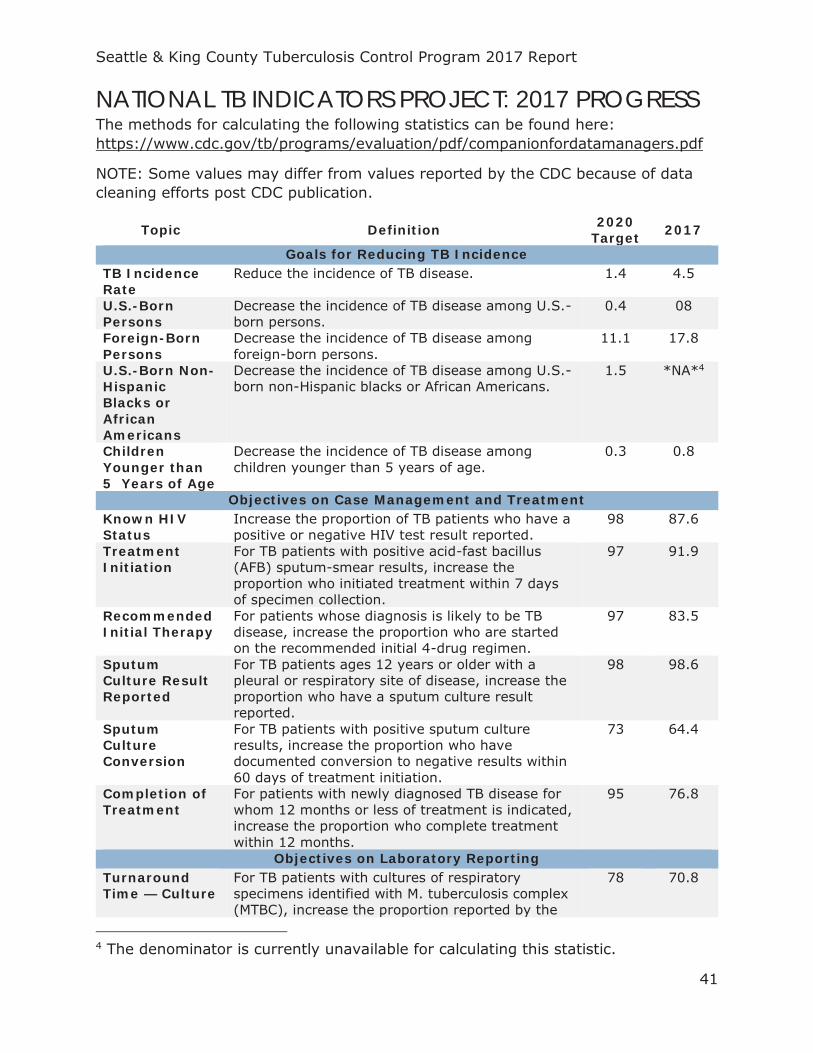
NATIONAL TB INDICATORS PROJECT: 2017 PROGRESS The methods for calculating the following statistics can be found here: https://www.cdc.gov/tb/programs/evaluation/pdf/companionfordatamanagers.pdf
NOTE: Some values may differ from values reported by the CDC because of data cleaning efforts post CDC publication.
Topic Definition 2020 Target 2017
Goals for Reducing TB Incidence TB Incidence Rate
Reduce the incidence of TB disease. 1.4 4.5
U.S.-Born Persons
Decrease the incidence of TB disease among U.S.-born persons.
0.4 08
Foreign-Born Persons
Decrease the incidence of TB disease among foreign-born persons.
11.1 17.8
U.S.-Born Non-Hispanic Blacks or African Americans
Decrease the incidence of TB disease among U.S.-born non-Hispanic blacks or African Americans.
1.5 *NA*4
Children Younger than 5 Years of Age
Decrease the incidence of TB disease among children younger than 5 years of age.
0.3 0.8
Objectives on Case Management and Treatment Known HIV Status
Increase the proportion of TB patients who have a positive or negative HIV test result reported.
98 87.6
Treatment Initiation
For TB patients with positive acid-fast bacillus (AFB) sputum-smear results, increase the proportion who initiated treatment within 7 days of specimen collection.
97 91.9
Recommended Initial Therapy
For patients whose diagnosis is likely to be TB disease, increase the proportion who are started on the recommended initial 4-drug regimen.
97 83.5
Sputum Culture Result Reported
For TB patients ages 12 years or older with a pleural or respiratory site of disease, increase the proportion who have a sputum culture result reported.
98 98.6
Sputum Culture Conversion
For TB patients with positive sputum culture results, increase the proportion who have documented conversion to negative results within 60 days of treatment initiation.
73 64.4
Completion of Treatment
For patients with newly diagnosed TB disease for whom 12 months or less of treatment is indicated, increase the proportion who complete treatment within 12 months.
95 76.8
Objectives on Laboratory Reporting Turnaround Time — Culture
For TB patients with cultures of respiratory specimens identified with M. tuberculosis complex (MTBC), increase the proportion reported by the
78 70.8
4 The denominator is currently unavailable for calculating this statistic.

Seattle & King County Tuberculosis Control Program 2017 Report
42
laboratory within 25 days from the date the specimen was collected.
Turnaround Time — Nucleic Acid Amplification (NAA)
For TB patients with respiratory specimens positive for MTBC by nucleic acid amplification (NAA), increase the proportion reported by the laboratory within 6 days from the date the specimen was collected.
92 75.6
Drug-Susceptibility Result
For TB patients with positive culture results, increase the proportion who have initial drug-susceptibility results reported.
100 100
Universal Genotyping
For TB patients with a positive culture result, increase the proportion who have a MTBC genotyping result reported.
100 98.9
Objectives on Contact Investigations Contact Elicitation
For TB patients with positive AFB sputum-smear results, increase the proportion who have contacts elicited.
100 94.6
Examination For contacts to sputum AFB smear-positive TB cases, increase the proportion who are examined for infection and disease.
93 94.2
Treatment Initiation
For contacts to sputum AFB smear-positive TB cases diagnosed with latent TB infection, increase the proportion who start treatment.
91 70
Treatment Completion
For contacts to sputum AFB smear-positive TB cases who have started treatment for latent TB infection, increase the proportion who complete treatment.
81 94.8
Objectives on Examination of Immigrants and Refugees5 Examination Initiation
For immigrants and refugees with abnormal chest radiographs (X-rays) read overseas as consistent with TB, increase the proportion who initiate a medical examination within 30 days of notification.
84 87.1
Examination Completion
For immigrants and refugees with abnormal chest X-rays read overseas as consistent with TB, increase the proportion who complete a medical examination within 90 days of notification.
76 76.4
Treatment Initiation
For immigrants and refugees with abnormal chest X-rays read overseas as consistent with TB who are diagnosed with latent TB infection or have radiographic findings consistent with prior pulmonary TB (ATS/CDC Class 4) on the basis of examination in the U.S., for whom treatment was recommended, increase the proportion who start treatment.
93 39.3
Treatment Completion
For immigrants and refugees with abnormal chest X-rays read overseas as consistent with TB who are diagnosed with latent TB infection or have radiographic findings consistent with prior pulmonary TB (ATS/CDC Class 4) on the basis of examination in the U.S., and who have started on
83 100
5 Class B1 Only
Seattle & King County Tuberculosis Control Program 2017 Report
43
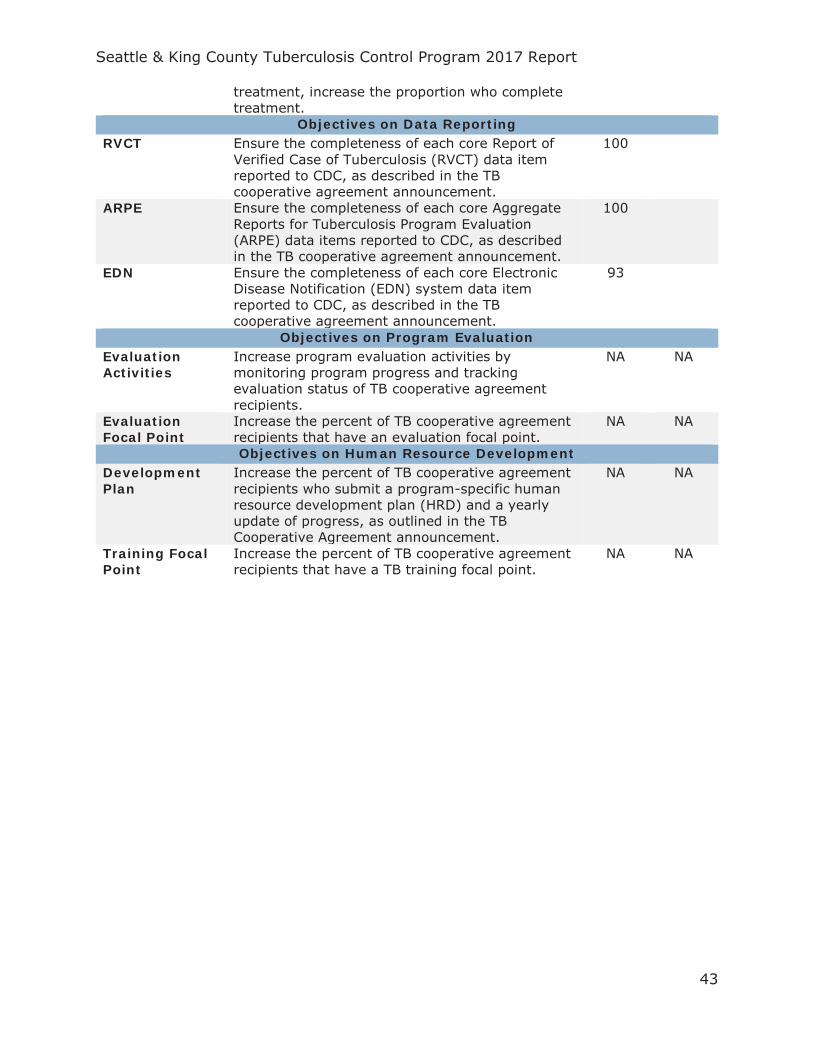
treatment, increase the proportion who complete treatment.
Objectives on Data Reporting RVCT Ensure the completeness of each core Report of
Verified Case of Tuberculosis (RVCT) data item reported to CDC, as described in the TB cooperative agreement announcement.
100
ARPE Ensure the completeness of each core Aggregate Reports for Tuberculosis Program Evaluation (ARPE) data items reported to CDC, as described in the TB cooperative agreement announcement.
100
EDN Ensure the completeness of each core Electronic Disease Notification (EDN) system data item reported to CDC, as described in the TB cooperative agreement announcement.
93
Objectives on Program Evaluation Evaluation Activities
Increase program evaluation activities by monitoring program progress and tracking evaluation status of TB cooperative agreement recipients.
NA NA
Evaluation Focal Point
Increase the percent of TB cooperative agreement recipients that have an evaluation focal point.
NA NA
Objectives on Human Resource Development Development Plan
Increase the percent of TB cooperative agreement recipients who submit a program-specific human resource development plan (HRD) and a yearly update of progress, as outlined in the TB Cooperative Agreement announcement.
NA NA
Training Focal Point
Increase the percent of TB cooperative agreement recipients that have a TB training focal point.
NA NA
Seattle & King County Tuberculosis Control Program 2017 Report
44
TB CONTROL PROGRAM HIGHLIGHTS

Seattle & King County Tuberculosis Control Program 2017 Report
45
HEALTH SYSTEM MODERNIZATION WASHINGTON TB COLLABORATIVE NETWORK (WTCN)
The Washington TB Collaborative Network (WTCN) is a new initiative to promote effective and efficient models of TB control and prevention in Washington State. The network is housed in the Public Health – Seattle & King County Tuberculosis Control Program but aims to foster regional collaboration among all interested local health jurisdictions (LHJs), tribal territories and the Washington State DOH Tuberculosis Program.
This program aims to demonstrate an innovative method for efficiently sharing public services across counties. The landscape of TB in Washington State is such that half of all TB cases occur in King County while 23 LHJs have had 5 cases or fewer over the past five years. In this dual reality, it is challenging for the majority of counties who encounter TB cases so infrequently to maintain expertise in TB management and control. Remote consultation or onsite support from TB experts and peers working in LHJs where TB is more common, including King County, can be invaluable in handling a complex case or contact investigation to ensure high quality of patient care and effective control of TB.
Seattle & King County Tuberculosis Control Program 2017 Report
46
Support is provided to other LHJs through a variety of means. These include:
Remote consultations are available for providers and LHJ TB Program Staff via teleconference, phone, and the TB ECHO weekly tele-mentorship conference (see below);
Shoulder-to-shoulder training is available to nurses and community workers that are new to working in TB or simply wish to refresh skillsets;
The King County Public Health Lab is open to use by all LHJs for processing the newest generation TB blood tests at discounted costs;
Medical staff, community workers and epidemiologists are available for emergent deployment to assist in large congregate setting investigations;
And any other support as identified by LHJs.
If you have any questions or requests, please contact WTCN:
Email: [email protected] Phone: (206) 790 – 9283
Seattle & King County Tuberculosis Control Program 2017 Report
47
TB ECHO
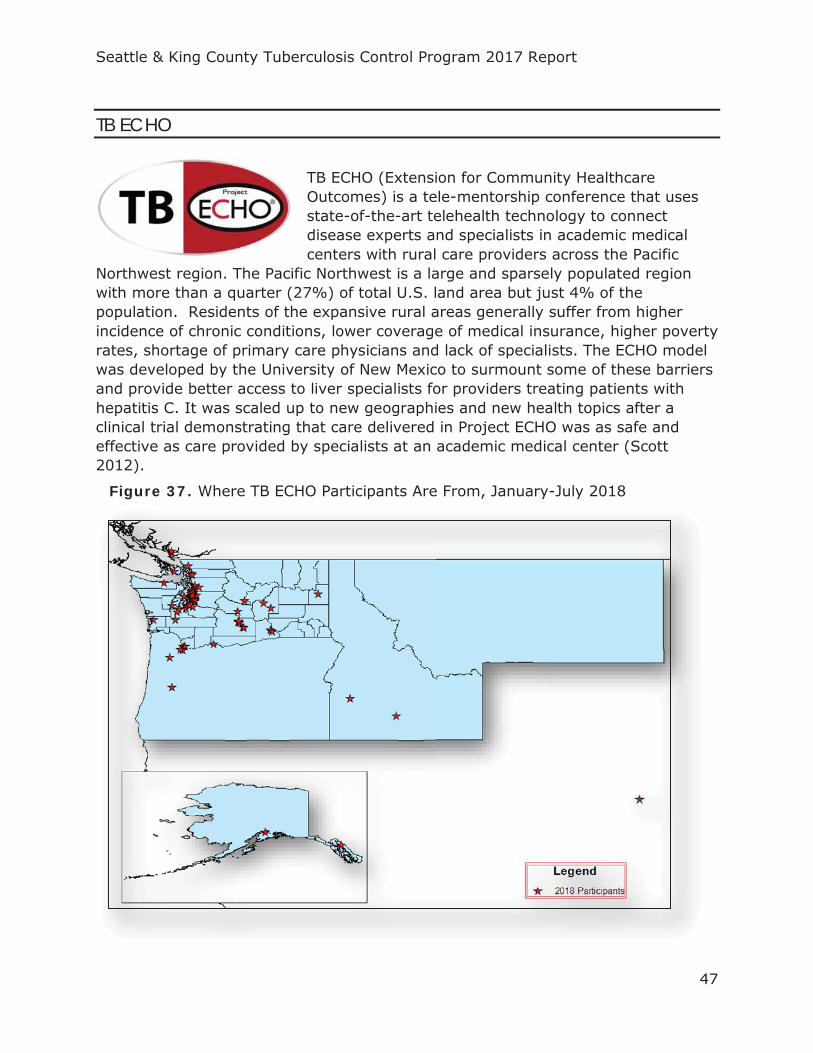
TB ECHO (Extension for Community Healthcare Outcomes) is a tele-mentorship conference that uses state-of-the-art telehealth technology to connect disease experts and specialists in academic medical centers with rural care providers across the Pacific
Northwest region. The Pacific Northwest is a large and sparsely populated region with more than a quarter (27%) of total U.S. land area but just 4% of the population. Residents of the expansive rural areas generally suffer from higher incidence of chronic conditions, lower coverage of medical insurance, higher poverty rates, shortage of primary care physicians and lack of specialists. The ECHO model was developed by the University of New Mexico to surmount some of these barriers and provide better access to liver specialists for providers treating patients with hepatitis C. It was scaled up to new geographies and new health topics after a clinical trial demonstrating that care delivered in Project ECHO was as safe and effective as care provided by specialists at an academic medical center (Scott 2012).
Figure 37. Where TB ECHO Participants Are From, January-July 2018
Seattle & King County Tuberculosis Control Program 2017 Report
48
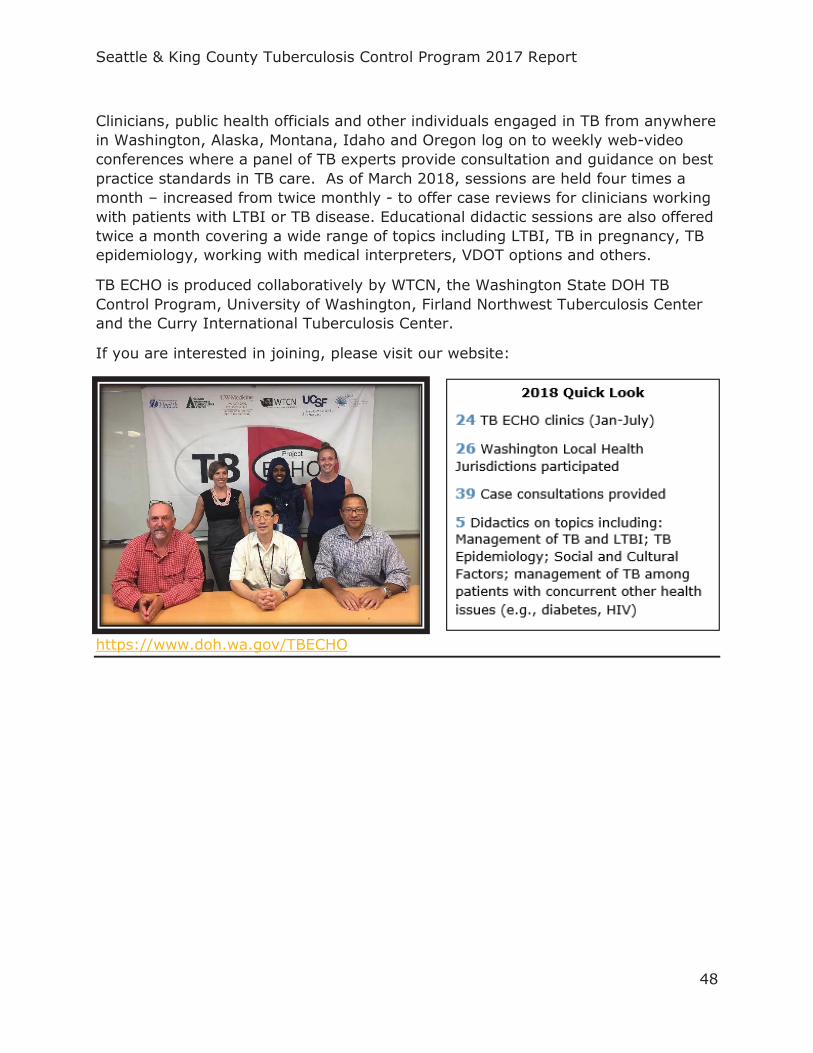
Clinicians, public health officials and other individuals engaged in TB from anywhere in Washington, Alaska, Montana, Idaho and Oregon log on to weekly web-video conferences where a panel of TB experts provide consultation and guidance on best practice standards in TB care. As of March 2018, sessions are held four times a month – increased from twice monthly - to offer case reviews for clinicians working with patients with LTBI or TB disease. Educational didactic sessions are also offered twice a month covering a wide range of topics including LTBI, TB in pregnancy, TB epidemiology, working with medical interpreters, VDOT options and others.
TB ECHO is produced collaboratively by WTCN, the Washington State DOH TB Control Program, University of Washington, Firland Northwest Tuberculosis Center and the Curry International Tuberculosis Center.
If you are interested in joining, please visit our website:
https://www.doh.wa.gov/TBECHO
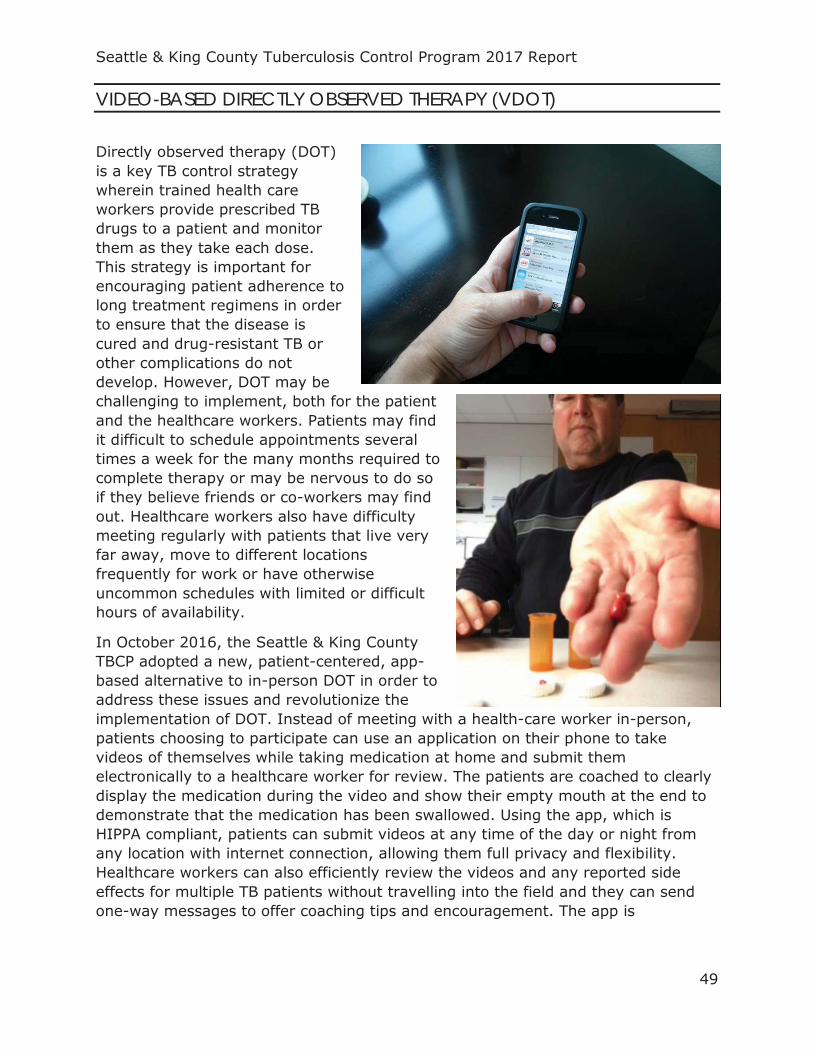
Seattle & King County Tuberculosis Control Program 2017 Report
49
VIDEO-BASED DIRECTLY OBSERVED THERAPY (VDOT)
Directly observed therapy (DOT) is a key TB control strategy wherein trained health care workers provide prescribed TB drugs to a patient and monitor them as they take each dose. This strategy is important for encouraging patient adherence to long treatment regimens in order to ensure that the disease is cured and drug-resistant TB or other complications do not develop. However, DOT may be challenging to implement, both for the patient and the healthcare workers. Patients may find it difficult to schedule appointments several times a week for the many months required to complete therapy or may be nervous to do so if they believe friends or co-workers may find out. Healthcare workers also have difficulty meeting regularly with patients that live very far away, move to different locations frequently for work or have otherwise uncommon schedules with limited or difficult hours of availability.
In October 2016, the Seattle & King County TBCP adopted a new, patient-centered, app-based alternative to in-person DOT in order to address these issues and revolutionize the implementation of DOT. Instead of meeting with a health-care worker in-person, patients choosing to participate can use an application on their phone to take videos of themselves while taking medication at home and submit them electronically to a healthcare worker for review. The patients are coached to clearly display the medication during the video and show their empty mouth at the end to demonstrate that the medication has been swallowed. Using the app, which is HIPPA compliant, patients can submit videos at any time of the day or night from any location with internet connection, allowing them full privacy and flexibility. Healthcare workers can also efficiently review the videos and any reported side effects for multiple TB patients without travelling into the field and they can send one-way messages to offer coaching tips and encouragement. The app is
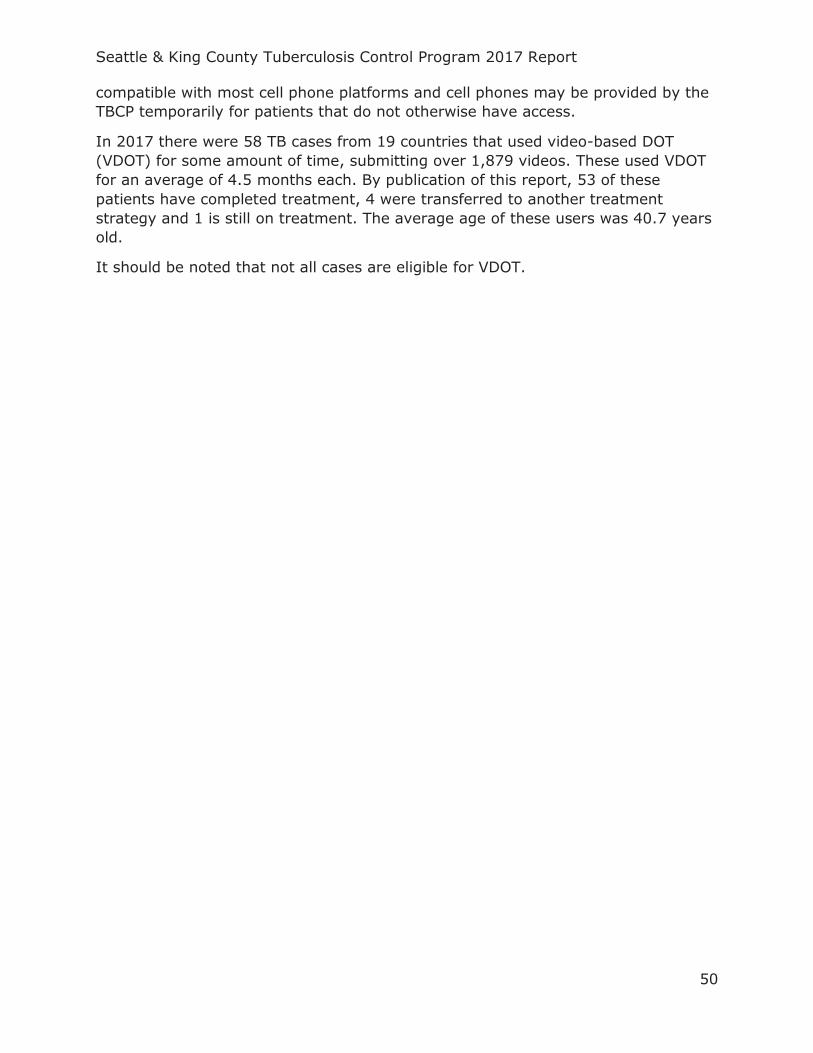
Seattle & King County Tuberculosis Control Program 2017 Report
50
compatible with most cell phone platforms and cell phones may be provided by the TBCP temporarily for patients that do not otherwise have access.
In 2017 there were 58 TB cases from 19 countries that used video-based DOT (VDOT) for some amount of time, submitting over 1,879 videos. These used VDOT for an average of 4.5 months each. By publication of this report, 53 of these patients have completed treatment, 4 were transferred to another treatment strategy and 1 is still on treatment. The average age of these users was 40.7 years old.
It should be noted that not all cases are eligible for VDOT.
Seattle & King County Tuberculosis Control Program 2017 Report
51
WASHINGTON DISEASE REPORTING SYSTEM (WDRS)
In 2017, the Seattle & King County TBCP joined other LHJs in Washington State in adopting a new electronic disease surveillance system. This system – the Washington Disease Reporting System (WDRS) - allows TB program staff to securely enter, view, track and summarize TB-related data. Furthermore, it facilitates direct reporting to the Washington State surveillance system. This data is protected by the highest
level of security to assure security and confidentiality.
To learn more about WDRS, please view the DOH website: https://www.doh.wa.gov/ForPublicHealthandHealthcareProviders/PublicHealthSystemResourcesandServices/WDRS
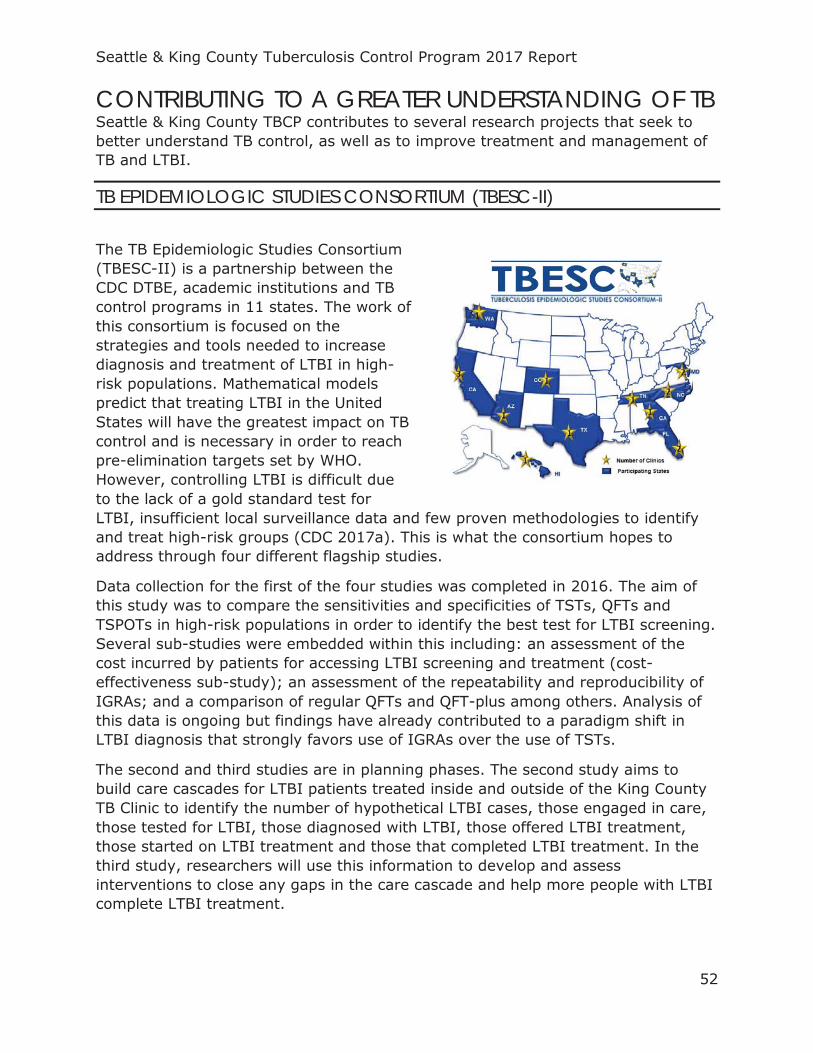
Seattle & King County Tuberculosis Control Program 2017 Report
52
CONTRIBUTING TO A GREATER UNDERSTANDING OF TBSeattle & King County TBCP contributes to several research projects that seek to better understand TB control, as well as to improve treatment and management of TB and LTBI.
TB EPIDEMIOLOGIC STUDIES CONSORTIUM (TBESC-II)
The TB Epidemiologic Studies Consortium (TBESC-II) is a partnership between the CDC DTBE, academic institutions and TB control programs in 11 states. The work of this consortium is focused on the strategies and tools needed to increase diagnosis and treatment of LTBI in high-risk populations. Mathematical models predict that treating LTBI in the United States will have the greatest impact on TB control and is necessary in order to reach pre-elimination targets set by WHO. However, controlling LTBI is difficult due to the lack of a gold standard test for LTBI, insufficient local surveillance data and few proven methodologies to identify and treat high-risk groups (CDC 2017a). This is what the consortium hopes to address through four different flagship studies.
Data collection for the first of the four studies was completed in 2016. The aim of this study was to compare the sensitivities and specificities of TSTs, QFTs and TSPOTs in high-risk populations in order to identify the best test for LTBI screening. Several sub-studies were embedded within this including: an assessment of the cost incurred by patients for accessing LTBI screening and treatment (cost-effectiveness sub-study); an assessment of the repeatability and reproducibility of IGRAs; and a comparison of regular QFTs and QFT-plus among others. Analysis of this data is ongoing but findings have already contributed to a paradigm shift in LTBI diagnosis that strongly favors use of IGRAs over the use of TSTs.
The second and third studies are in planning phases. The second study aims to build care cascades for LTBI patients treated inside and outside of the King County TB Clinic to identify the number of hypothetical LTBI cases, those engaged in care, those tested for LTBI, those diagnosed with LTBI, those offered LTBI treatment, those started on LTBI treatment and those that completed LTBI treatment. In the third study, researchers will use this information to develop and assess interventions to close any gaps in the care cascade and help more people with LTBI complete LTBI treatment.
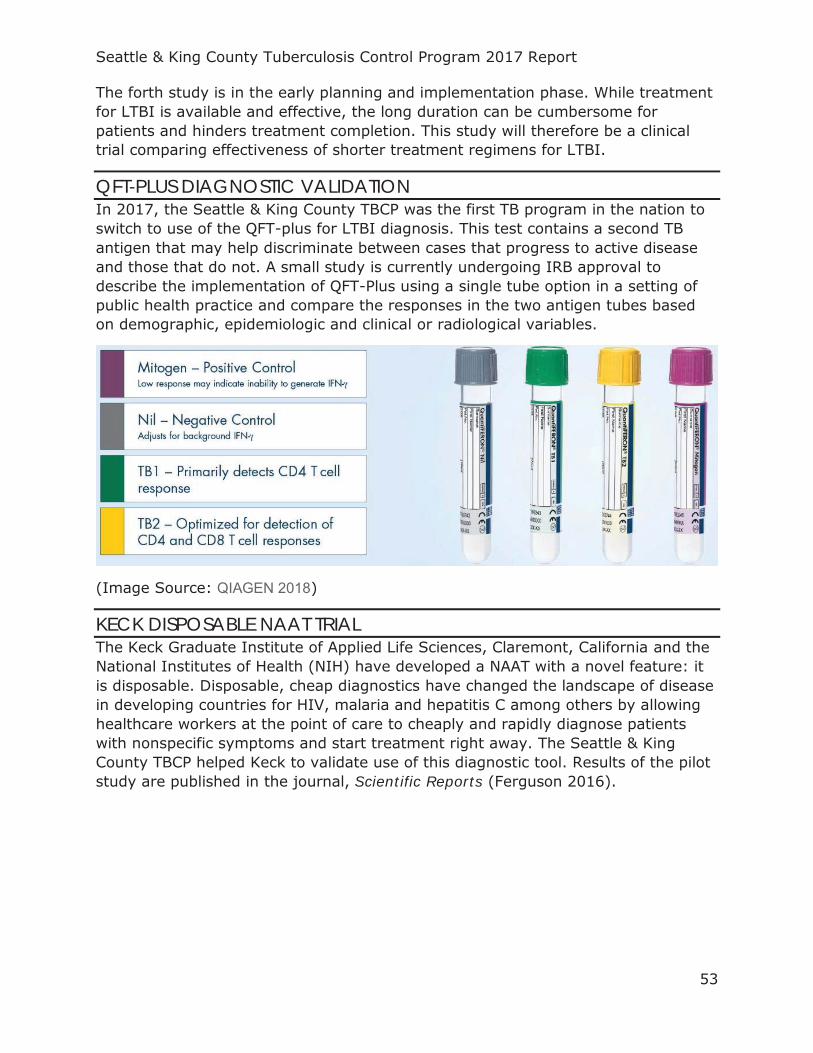
Seattle & King County Tuberculosis Control Program 2017 Report
53
The forth study is in the early planning and implementation phase. While treatment for LTBI is available and effective, the long duration can be cumbersome for patients and hinders treatment completion. This study will therefore be a clinical trial comparing effectiveness of shorter treatment regimens for LTBI.
QFT-PLUS DIAGNOSTIC VALIDATION In 2017, the Seattle & King County TBCP was the first TB program in the nation to switch to use of the QFT-plus for LTBI diagnosis. This test contains a second TB antigen that may help discriminate between cases that progress to active disease and those that do not. A small study is currently undergoing IRB approval to describe the implementation of QFT-Plus using a single tube option in a setting of public health practice and compare the responses in the two antigen tubes based on demographic, epidemiologic and clinical or radiological variables.
(Image Source: QIAGEN 2018)
KECK DISPOSABLE NAAT TRIAL The Keck Graduate Institute of Applied Life Sciences, Claremont, California and the National Institutes of Health (NIH) have developed a NAAT with a novel feature: it is disposable. Disposable, cheap diagnostics have changed the landscape of disease in developing countries for HIV, malaria and hepatitis C among others by allowing healthcare workers at the point of care to cheaply and rapidly diagnose patients with nonspecific symptoms and start treatment right away. The Seattle & King County TBCP helped Keck to validate use of this diagnostic tool. Results of the pilot study are published in the journal, Scientific Reports (Ferguson 2016).
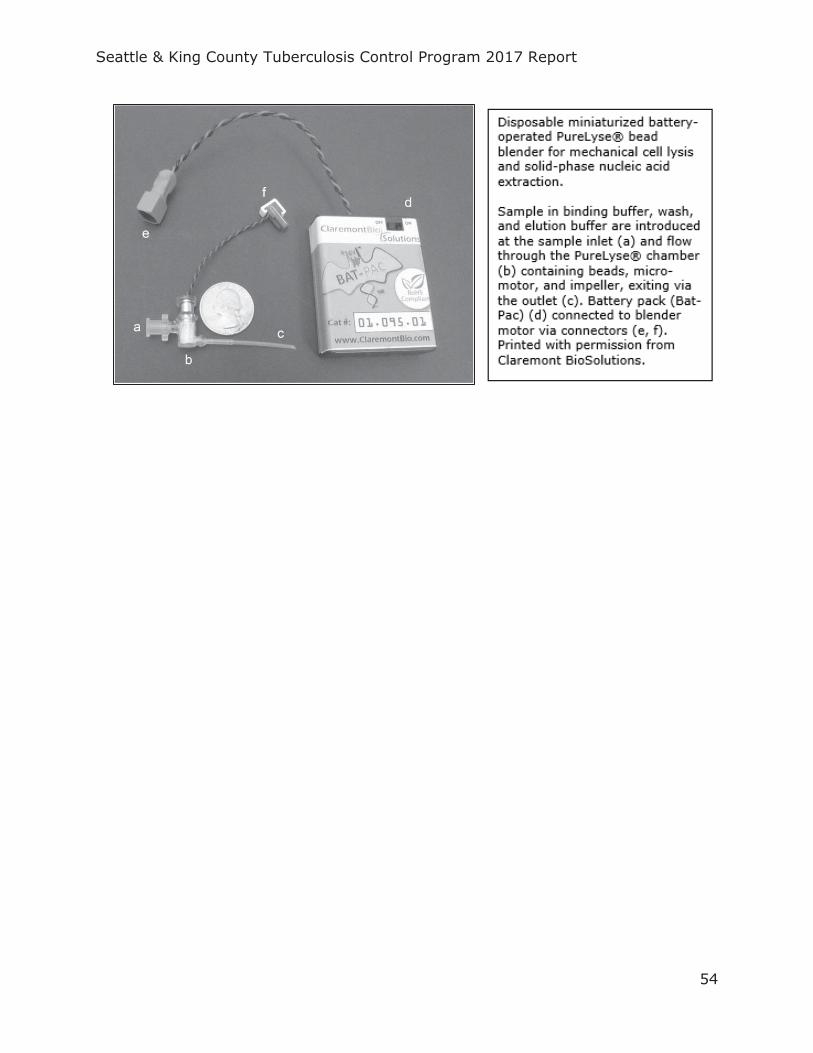
Seattle & King County Tuberculosis Control Program 2017 Report
54
Seattle & King County Tuberculosis Control Program 2017 Report
55
CDC PUBLIC HEALTH ASSOCIATE PROGRAM In 2017, the Seattle & King County TBCP was selected to participate in the CDC’s Public Health Associate Program (PHAP). This is a highly competitive, two-year training program for aspiring public health practitioners to gain hands-on experience working with public health agencies and nongovernmental organizations in the United States and U.S. territories (CDC-PHAP, 2018).
Laura Mummert began her fellowship with the Seattle & King County TB Program in October 2017. In response to a recognized lack of understanding about why patients diagnosed with LTBI choose to undergo LTBI treatment or not, she has initiated a new project in partnership with the Multnomah County TBCP to conduct in-depth interview with patients and providers and perform a qualitative assessment.
In addition to this, Laura performs several activities crucial for the regular workflow of the TB TBCP including production of regular workload
reports, tracking of genotyping results, technical assistance for VDOT and care coordination.
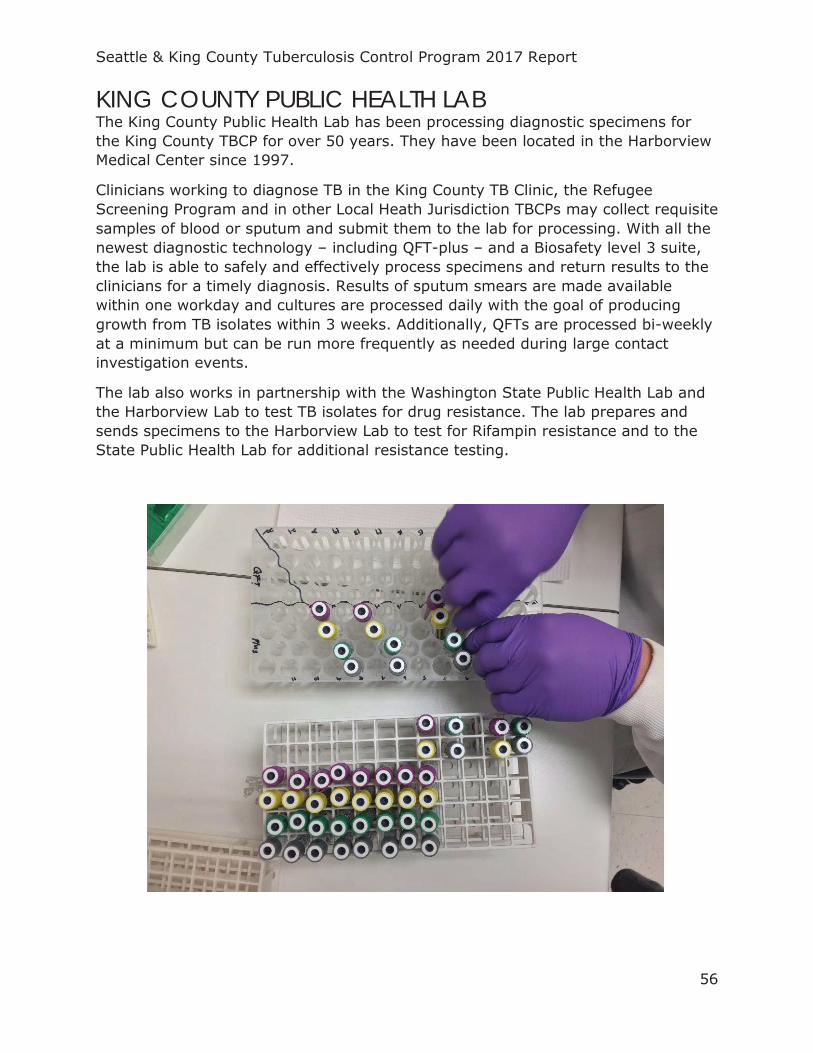
Seattle & King County Tuberculosis Control Program 2017 Report
56
KING COUNTY PUBLIC HEALTH LAB The King County Public Health Lab has been processing diagnostic specimens for the King County TBCP for over 50 years. They have been located in the Harborview Medical Center since 1997.
Clinicians working to diagnose TB in the King County TB Clinic, the Refugee Screening Program and in other Local Heath Jurisdiction TBCPs may collect requisite samples of blood or sputum and submit them to the lab for processing. With all the newest diagnostic technology – including QFT-plus – and a Biosafety level 3 suite, the lab is able to safely and effectively process specimens and return results to the clinicians for a timely diagnosis. Results of sputum smears are made available within one workday and cultures are processed daily with the goal of producing growth from TB isolates within 3 weeks. Additionally, QFTs are processed bi-weekly at a minimum but can be run more frequently as needed during large contact investigation events.
The lab also works in partnership with the Washington State Public Health Lab and the Harborview Lab to test TB isolates for drug resistance. The lab prepares and sends specimens to the Harborview Lab to test for Rifampin resistance and to the State Public Health Lab for additional resistance testing.
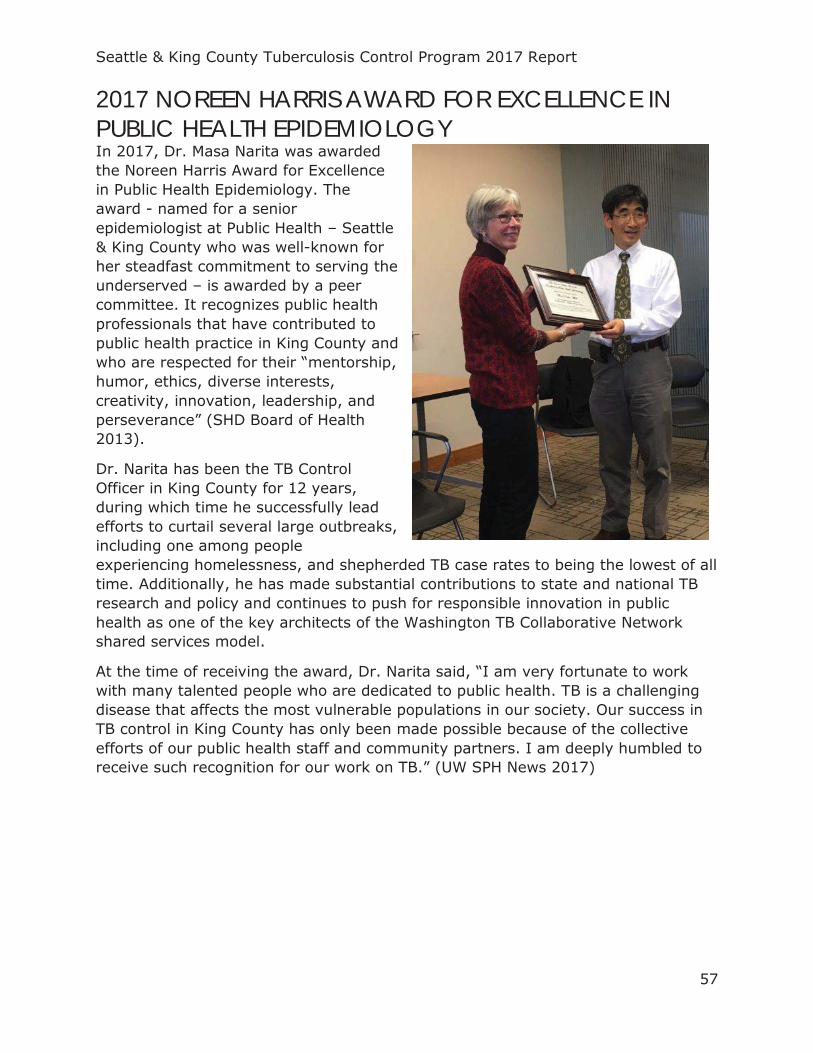
Seattle & King County Tuberculosis Control Program 2017 Report
57
2017 NOREEN HARRIS AWARD FOR EXCELLENCE IN PUBLIC HEALTH EPIDEMIOLOGY In 2017, Dr. Masa Narita was awarded the Noreen Harris Award for Excellence in Public Health Epidemiology. The award - named for a senior epidemiologist at Public Health – Seattle & King County who was well-known for her steadfast commitment to serving the underserved – is awarded by a peer committee. It recognizes public health professionals that have contributed to public health practice in King County and who are respected for their “mentorship, humor, ethics, diverse interests, creativity, innovation, leadership, and perseverance” (SHD Board of Health 2013).
Dr. Narita has been the TB Control Officer in King County for 12 years, during which time he successfully lead efforts to curtail several large outbreaks, including one among people experiencing homelessness, and shepherded TB case rates to being the lowest of all time. Additionally, he has made substantial contributions to state and national TB research and policy and continues to push for responsible innovation in public health as one of the key architects of the Washington TB Collaborative Network shared services model.
At the time of receiving the award, Dr. Narita said, “I am very fortunate to work with many talented people who are dedicated to public health. TB is a challenging disease that affects the most vulnerable populations in our society. Our success in TB control in King County has only been made possible because of the collective efforts of our public health staff and community partners. I am deeply humbled to receive such recognition for our work on TB.” (UW SPH News 2017)
Seattle & King County Tuberculosis Control Program 2017 Report
58
RESOURCES FOR PROVIDERS
Seattle & King County Tuberculosis Control Program 2017 Report
59
REPORTING REQUIREMENTS
The following is adapted from the Washington State Department of Health TB Reporting and Surveillance Guidelines:
Purposes of Reporting and Surveillance
1. To identify and ensure the adequate evaluation and treatment of persons with TB disease.
2. To identify the contacts of TB cases and ensure their evaluation. 3. To ensure that all eligible infected contacts are offered and complete
preventive therapy
Legal Reporting Requirements
1. HEALTH CARE PROVIDERS: immediately notifiable to local health jurisdiction (WAC 246-101- 101).
2. HOSPITAL: immediately notifiable to local health jurisdiction (WAC 246-101-301).
3. LABORATORIES: initial culture notifiable to local health jurisdiction within two days; (WAC 246-101-201).
4. LOCAL HEALTH JURISDICTIONS: notifiable to the Washington State Department of Health (DOH) within 7 days of case investigation or summary required within 21 days (WAC 246-101).
Local Health Jurisdiction Investigation Responsibilities
1. Start the initial assessment of the patient within ≤ 1 work day of receiving the case report and do or assure the following:
http://www.doh.wa.lcl/Portals/1/Documents/Pubs/343-071-WATBManual-Introduction.pdf
2. Communicate to Washington State TB program staff: Enter case into TB Public Health Issue Management System (PHIMS)
within 7 days of the LHJ receiving notification of the suspect case AND Submit the “Contact Investigation Form” to WA State TB Services within 2
weeks.
More information on reporting requirements, case definitions, case investigation protocols and other related items is available on the Washington State DOH website: https://www.doh.wa.gov/YouandYourFamily/IllnessandDisease/Tuberculosis/LawsGuidelines
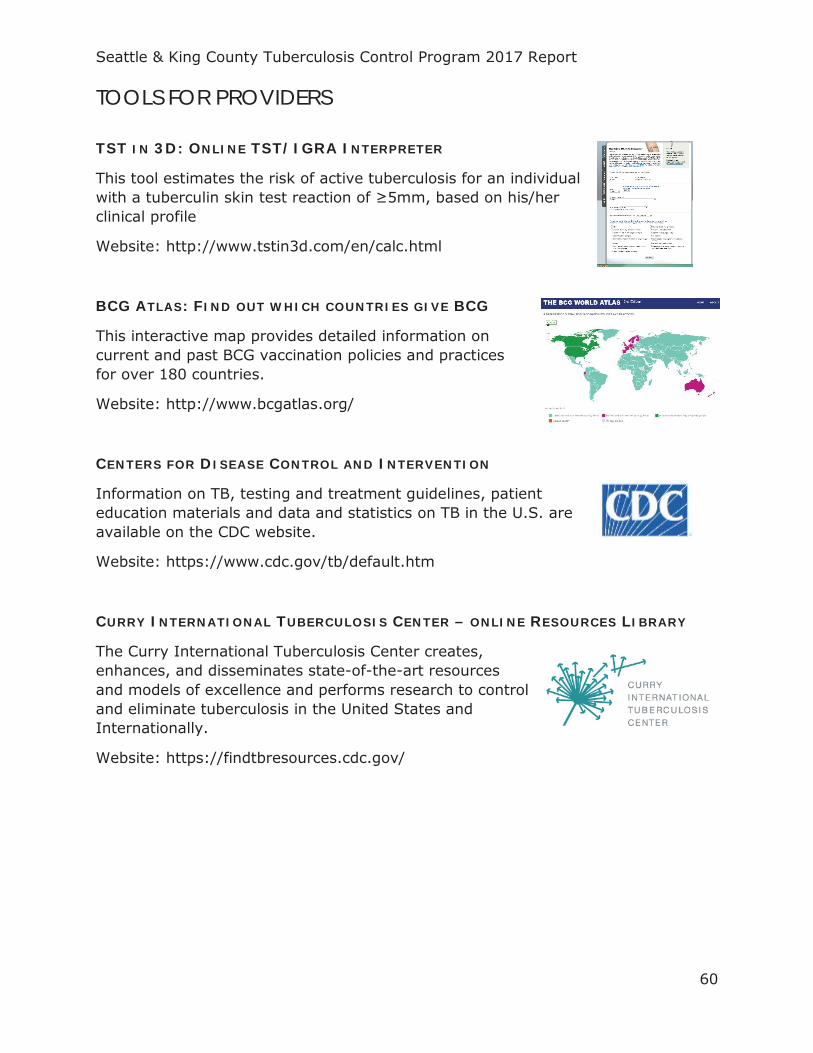
Seattle & King County Tuberculosis Control Program 2017 Report
60
TOOLS FOR PROVIDERS
TST IN 3D: ONLINE TST/IGRA INTERPRETER
This tool estimates the risk of active tuberculosis for an individual with a tuberculin skin test reaction of ≥5mm, based on his/her clinical profile
Website: http://www.tstin3d.com/en/calc.html
BCG ATLAS: FIND OUT WHICH COUNTRIES GIVE BCG
This interactive map provides detailed information on current and past BCG vaccination policies and practices for over 180 countries.
Website: http://www.bcgatlas.org/
CENTERS FOR DISEASE CONTROL AND INTERVENTION
Information on TB, testing and treatment guidelines, patient education materials and data and statistics on TB in the U.S. are available on the CDC website.
Website: https://www.cdc.gov/tb/default.htm
CURRY INTERNATIONAL TUBERCULOSIS CENTER – ONLINE RESOURCES LIBRARY
The Curry International Tuberculosis Center creates, enhances, and disseminates state-of-the-art resources and models of excellence and performs research to control and eliminate tuberculosis in the United States and Internationally.
Website: https://findtbresources.cdc.gov/
Seattle & King County Tuberculosis Control Program 2017 Report
61
TECHNICAL NOTES All charts and tables, unless otherwise specified, are from the Seattle & King County TB Control Program.
Data reported for previous years may have changed slightly from what was reported in the respective year’s summary, as data are updated with current statistics upon preparation of this report.
Some percentages may not sum to 100 percent due to rounding.
Since TB is a reportable disease, all diagnosed cases are assumed to have been included in this report. For detailed reporting requirements, see the TB Control Program Resource Guide found on our website. Case verification is determined by the Washington State Department of Health using TB case classifications defined by the CDC.
All case data came from the Washington Disease Reporting System (WDRS). This database was designed to allow counties and states to report TB surveillance data to the CDC. WDRS uses data from the Report of Verified Case of Tuberculosis (RVCT) case report form, submitted by all reporting areas. Additional information is supplemented by internal program databases.
All contact and congregate setting investigation data came from internal program databases.
Patient-level genotyping data came from the CDC’s Genotyping Information Management System (TB GIMS) database. GIMS provides TB genotyping information data for TB patients nationwide. http://www.cdc.gov/tb/programs/genotyping/default.htm
Individual-level data for immigrants and refugees screened for TB came from the CDC’s Electronic Disease Notification (EDN) database. EDN provides TB screening information for immigrants and refugees that received TB screening prior to immigration nationwide.
King County 1990-2000 and 2000-2010 total population and population by age and gender are from the Washington State Office of Financial Management’s (OFM) Intercensal and Postcensal Estimates of April 1 Population by Age and Sex. King County 2010-2017 total population and population by age and gender are from OFM’s Small Area Demographic Estimates of April 1 Population by Age and Sex. Values from both datasets for 1990, 2000 and 2010 reflect actual population counts for their respective years. The models produce negligible differences in estimates for the years where both models produced estimates and so it was deemed appropriate to combine them to create a full time series. http://www.ofm.wa.gov/pop/asr/default.asp
King County 2000-2010 population by race and ethnicity are from the OFM’s Intercensal and Postcensal Estimates of April 1 Population by Race and Hispanic
Seattle & King County Tuberculosis Control Program 2017 Report
62
Origin. King County 2010-2017 population by race and ethnicity are from OFM’s Small Area Demographic Estimates of April 1 Population by Race and Hispanic Origin. Values from both datasets for 1990, 2000 and 2010 reflect actual population counts for their respective years. The models produce negligible differences in estimates for the years where both models produced estimates and so it was deemed appropriate to combine them to create a full time series. http://www.ofm.wa.gov/pop/asr/default.asp
King County 2009-2016 non-U.S.-born and U.S.-born population is from the U.S. Census Bureau’s American Community Survey from each respective year. The 2017 non-U.S.-born and U.S.-born population were estimated using a tobit model to predict the proportion of the population that is foreign-born with year as an independent variable while constraining values between 0 and 1. A tobit model was deemed appropriate because the proportion of the population that is non-U.S.-born can aptly be treated as a continuous various with censored values. Model outputs were multiplied by the total expected population by race from OFM’s Small Area Demographic Estimates of April 1 Population by Race and Hispanic Origin for 2017 to estimate population in whole numbers for U.S.-born and non-U.S.-born individuals in various race categories. https://factfinder.census.gov/faces/tableservices/jsf/pages/productview.xhtml?src=CF
Population by city in King County for 1990-2017 was compiled from two sources: the U.S. Census Bureau’s American Community Survey and Google’s public data exploration tool for visualizing U.S. Census Bureau data. For city-year populations that were missing in these two data sources, population estimates were made using a mixed effects linear regression model with a fixed effect on year and random effects on city. Fifty-nine city-year populations were estimated in this fashion from 1990-2017 among 33 cities. https://www.google.com/publicdata/explore?ds=kf7tgg1uo9ude_&hl=en&dl=en https://factfinder.census.gov/faces/tableservices/jsf/pages/productview.xhtml?src=CF
Annual counts of prevalent HIV cases in King County were extracted from the Public Health – Seattle & King County HIV/STD Program’s 2017 Annual Report. https://www.kingcounty.gov/depts/health/communicable-diseases/hiv-std/patients/epidemiology/~/media/depts/health/communicable-diseases/documents/hivstd/2017-hiv-aids-epidemiology-annual-report.ashx
Programmatic data for TB ECHO, WTCN and VDOT were available in internal program monitoring databases.
Washington State data are from Washington State Department of Health Tuberculosis Control Program’s ”Tuberculosis Cases Statewide”. https://www.doh.wa.gov/Portals/1/Documents/Pubs/343-113-TBStatewideByYear2017.pdf. Additional summary data were provided directly by TB Program Staff.

Seattle & King County Tuberculosis Control Program 2017 Report
63
National data are from the CDC’s “Tuberculosis – United States, 2017”. MMWR Morb Mortal Wkly Rep 2018 Mar 23; 67:317-323. http://www.cdc.gov/tb
DEFINITIONS
Hispanic ethnicity is of any race. Race is single race only, regardless of ethnicity. Race definitions are changed from reports prior to 2010, which used “Black alone or in combination with one or more other races” (all ethnicities) and may result in a change in rates reported in previous years.
In accordance with CDC definitions, a U.S.-born person is defined as a person who was eligible for U.S. citizenship at birth, regardless of the actual place of birth.
Homeless individuals include those that experienced homelessness in the last 12 months. According to the Report of Verified Case of Tuberculosis (RVCT): “A homeless person may also be defined as a person who has no home (e.g., is not paying rent, does not own a home, and is not steadily living with relatives or friends). Persons in unstable housing situations (e.g., alternating between multiple residences for short stays of uncertain duration) may also be considered homeless… Homeless does not refer to a person who is imprisoned or in a correctional facility... The homeless category is limited to living conditions in the United States and does not apply to living in refugee camps outside the United States.
Seattle & King County Tuberculosis Control Program 2017 Report
64
REFERENCES
CDC. (2010). Domestic Tuberculosis Guidelines | Immigrant and Refugee Health | CDC. Retrieved October 3, 2018, from https://www.cdc.gov/immigrantrefugeehealth/guidelines/domestic/tuberculosis-guidelines.html
CDC. (2014). Fact Sheets: The Difference Between Latent TB Infection and TB Disease. Retrieved September 13, 2018, from https://www.cdc.gov/tb/publications/factsheets/general/ltbiandactivetb.htm
CDC. (2017). Research Projects: Tuberculosis Epidemiologic Studies Consortium (TBESC). Retrieved October 4, 2018, from https://www.cdc.gov/tb/topic/research/tbesc/default.htm
CDC-PHAP. (2018, August 23). CDC - Public Health Associate Program (PHAP). Retrieved September 18, 2018, from https://www.cdc.gov/phap/index.html
Dooley, K. E., & Chaisson, R. E. (2009). Tuberculosis and diabetes mellitus: convergence of two epidemics. The Lancet Infectious Diseases, 9(12), 737–746. https://doi.org/10.1016/S1473-3099(09)70282-8
Ferguson, T. M., Weigel, K. M., Lakey Becker, A., Ontengco, D., Narita, M., Tolstorukov, I., … Niemz, A. (2016). Pilot study of a rapid and minimally instrumented sputum sample preparation method for molecular diagnosis of tuberculosis. Scientific Reports, 6, 19541. https://doi.org/10.1038/srep19541
Ghosh, S., Moonan, P. K., Cowan, L., Grant, J., Kammerer, S., & Navin, T. R. (2012). Tuberculosis Genotyping Information Management System: Enhancing Tuberculosis Surveillance in the United States. Infection, Genetics and Evolution, 12(4), 782–788. https://doi.org/10.1016/j.meegid.2011.10.013
Houben, R. M. G. J., & Dodd, P. J. (2016). The Global Burden of Latent Tuberculosis Infection: A Re-estimation Using Mathematical Modelling. PLOS Medicine, 13(10), e1002152. https://doi.org/10.1371/journal.pmed.1002152
IHME. (2017). GBD Compare | IHME Viz Hub. Retrieved September 13, 2018, from http://vizhub.healthdata.org/gbd-compare
QIAGEN. (2018). Why Should Laboratories Choose QFT-Plus – QuantiFERON. Retrieved September 18, 2018, from https://www.quantiferon.com/us/products/quantiferon-tb-gold-plus-us/laboratory-resources/why_qft-plus-laboratories/
Scott, J. D., Unruh, K. T., Catlin, M. C., Merrill, J. O., Tauben, D. J., Rosenblatt, R., … Spacha, D. H. (2012). Project ECHO: a model for complex, chronic care in the Pacific Northwest region of the United States. Journal of Telemedicine and Telecare, 18(8), 481–484. https://doi.org/10.1258/jtt.2012.GTH113
Snohomish Health District (SHD) Board of Health. (2013). Dr. Gary Goldbaum honored for excellence in public health epidemiology. Retrieved September 18, 2018, from http://www.snohd.org/About-Us/Board-of-Health/Board-Meeting-
Seattle & King County Tuberculosis Control Program 2017 Report
65
Agenda/ArtMID/4373/ArticleID/1083/Dr-Gary-Goldbaum-honored-for-excellence-in-public-health-epidemiology
Sosa, L., & Belknap, B. (2018, May). Updated Recommendations for Tuberculosis Screening and Testing of Healthcare Personnel, United States, 2018. Presented at the National Tuberculosis Conference, Palm Springs, CA.
Stop TB USA Tuberculosis Elimination Plan Committee. (2010). A Call for Action on the Tuberculosis Elimination Plan for the United States. Atlanta, GA: Stop TB USA. Retrieved from http://www.thoracic.org/advocacy/stop-tb/Eliminate_TB_USA.pdf
UNOPS. (2018). Stop TB Partnership | About Us [Text]. Retrieved September 13, 2018, from http://www.stoptb.org/about/
UW SPH News. (2017). Tuberculosis expert receives local public health award | Department of Epidemiology. Retrieved September 18, 2018, from https://epi.washington.edu/news/tuberculosis-expert-receives-local-public-health-award
Washington State Department of Health. (2012, June 1). Washington State Tuberculosis Services Manual. Washington State Department of Health. Retrieved from https://www.doh.wa.gov/Portals/1/Documents/Pubs/343-071-WATBManual.pdf
World Health Organization. (2014). The End TB Strategy. Geneva: World Health Organization. Retrieved from http://www.who.int/tb/strategy/End_TB_Strategy.pdf?ua=1
World Health Organization. (2016). WHO calls on countries and partners to “Unite to End Tuberculosis.” Retrieved September 13, 2018, from http://www.who.int/news-room/detail/22-03-2016-who-calls-on-countries-and-partners-to-unite-to-end-tuberculosis-
World Health Organization. (2017). Global Tuberculosis Report 2017.
Zeitvogel, K. (2017). Tech designed for Africa helps US fight disease, save money - Fogarty International Center @ NIH. Global Health Matters, 16(5). Retrieved from https://www.fic.nih.gov/News/GlobalHealthMatters/september-october-2017/Pages/emocha-mobile-app.aspx