aboveground biomass allocation in three tropical tree species
DESCRIPTION
Knowledge of forest carbon stores is fundamental togenerating inventories that approximate real C stores. Forthese inventories, it necessary to have estimations of treebiomass. Allometric equations are tools for estimatingbiomass and its distribution in forest ecosystems. Theobjective of this study was to develop equations toestimate total above-ground biomass and the biomass ofstructural components of trees in the physiographic regionof the Sierra Madre del Sur, in the municipality of PlumaHidalgo, Oaxaca, Mexico. The species selected for theirrelative abundance were Cupania dentata DC., Alchornealatifolia Sw. and Inga punctata Willd. These species weregrouped using an additionality test; a regression modelwas used resulting in two groups. In the models fit forestimation of total above-ground biomass, the predictingvariables were diameter at breast height and total treeheight. Indicator variables were also included to definethe effect of the group within the model. Models werefit by linear and non-linear regression, which resulted inhigh values of the adjusted coefficient of determinationRAdj 2 >0 9. 8 . This showed differences in the quantityof total aerial biomass between groups, a situation thatwas attributed to the specific density of the wood and totree morphology. Biomass in the structural componentsof the tree (stump, stem, bark, branches and leaves) wasestimated with a system of equations based on partitionfactors using SUR (Seemingly Unrelated Regressions)to fit the regression parameters. In the three species,the greatest accumulation of biomass was concentratedmainly in the branches, followed by the stem, bark, stumpand leaves.TRANSCRIPT
299
Resumen
El conocimiento de los almacenes de carbono en bosques es fundamental para generar inventarios de este elemento cercanos a la realidad. Para ello es necesario tener estima-ciones de la biomasa de los árboles. Las ecuaciones alo-métricas permiten estimar la biomasa y su distribución en ecosistemas forestales. El objetivo del presente estudio fue desarrollar ecuaciones para estimar la biomasa aérea total y de los componentes estructurales, en árboles de la región fisiográfica de la Sierra Madre del Sur en el municipio de Pluma Hidalgo, Oaxaca, México. Las especies selecciona-das por su abundancia relativa fueron Cupania dentata DC., Alchornea latifolia Sw. e Inga punctata Willd. Las especies se agruparon mediante una prueba de adicionali-dad en un modelo de regresión, constituyendo dos grupos. En los modelos ajustados para la estimación de la biomasa aérea total; las variables predictoras fueron el diámetro nor-mal y la altura total del árbol. Además se incluyeron varia-bles indicadoras para definir el efecto del grupo dentro del modelo. Los modelos se ajustaron por medio de regresión lineal y no lineal, y los valores del coeficiente de determina-ción ajustado fueron altos RAdj
2 0 98>( ). . Esto mostró dife-rencias en la cantidad de biomasa aérea total entre grupos, situación atribuida a la densidad específica de la madera y a la morfología de los árboles. La biomasa en los componen-tes estructurales del árbol (tocón, fuste, corteza, ramas, y hojas) se estimó con un sistema de ecuaciones con factores de partición mediante regresión SUR (Seemingly Unrelated Regressions) para ajustar los parámetros de la regresión. En las tres especies, la mayor acumulación de biomasa se
AbstRAct
Knowledge of forest carbon stores is fundamental to generating inventories that approximate real C stores. For these inventories, it necessary to have estimations of tree biomass. Allometric equations are tools for estimating biomass and its distribution in forest ecosystems. The objective of this study was to develop equations to estimate total above-ground biomass and the biomass of structural components of trees in the physiographic region of the Sierra Madre del Sur, in the municipality of Pluma Hidalgo, Oaxaca, Mexico. The species selected for their relative abundance were Cupania dentata DC., Alchornea latifolia Sw. and Inga punctata Willd. These species were grouped using an additionality test; a regression model was used resulting in two groups. In the models fit for estimation of total above-ground biomass, the predicting variables were diameter at breast height and total tree height. Indicator variables were also included to define the effect of the group within the model. Models were fit by linear and non-linear regression, which resulted in high values of the adjusted coefficient of determination RAdj
2 0 98>( ). . This showed differences in the quantity of total aerial biomass between groups, a situation that was attributed to the specific density of the wood and to tree morphology. Biomass in the structural components of the tree (stump, stem, bark, branches and leaves) was estimated with a system of equations based on partition factors using SUR (Seemingly Unrelated Regressions) to fit the regression parameters. In the three species, the greatest accumulation of biomass was concentrated mainly in the branches, followed by the stem, bark, stump and leaves.
Key words: Tropical trees, indicator variable, allometric equations, Cupania dentata, Alchornea latifolia, Inga punctata.
PARTICIÓN DE LA BIOMASA AÉREA EN TRES ESPECIES ARBÓREAS TROPICALES
ABOVEGROUND BIOMASS ALLOCATION IN THREE TROPICAL TREE SPECIES
Martín Aquino-Ramírez1, Alejandro Velázquez-Martínez1*, Juan F. Castellanos-Bolaños2, Héctor De los Santos-Posadas1, Jorge D. Etchevers-Barra3
1Postgrado en Ciencias Forestales, 3Postgrado Edafología, Campus Montecillo, Colegio de Postgraduados. Carretera México-Texcoco km 36.5. 56230. Montecillo, Texcoco, Estado de México. ([email protected]). 2INIFAP-CIRPAS-Campo Experimental Valles Centrales de Oaxaca. Melchor Ocampo No. 7. 68200. Santo Domingo Barrio Bajo, Villa de Etla, Oaxaca.
*Autor responsable v Author for correspondence.Recibido: junio, 2014. Aprobado: marzo, 2015.Publicado como ARTÍCULO en Agrociencia 49: 299-314. 2015.
300
AGROCIENCIA, 1 de abril - 15 de mayo, 2015
VOLUMEN 49, NÚMERO 3
concentró principalmente en las ramas, seguida por el fus-te, la corteza, el tocón y las hojas.
Palabras clave: Árboles tropicales, variable indicadora, ecua-ciones alométricas, Cupania dentata, Alchornea latifolia, Inga punctata.
IntRoduccIón
En la mayoría de los bosques neotropicales de México se desconocen los reservorios y el potencial de almacenamiento de biomasa.
Así, es indispensable realizar estimaciones exactas y precisas para entender la función de esos bos-ques en el ciclo global de carbono. La estimación de la biomasa y su integración en los componen-tes estructurales del árbol, es muy importante en los estudios de productividad, ciclo de nutrientes, flujos de energía, almacenes y captura de carbono (Pompa-García y Yerena-Yamallel, 2014), distur-bios naturales, antropógenicos (Parresol, 1999; Bi et al., 2004; Návar, 2009), en el monitoreo de la salud del bosque y el manejo forestal sustentable (Brandeis et al., 2006). Gran parte de la incertidumbre en las estima-ciones de la cantidad y la variación espacial de la biomasa en los bosques se debe a la falta de ecua-ciones alométricas (Djomo et al., 2010). Por tanto, el desarrollo de ecuaciones específicas para especies o grupos de especies para condiciones locales o del sitio (Basuki et al., 2009) es importante para mejo-rar la precisión en la estimación no destructiva de la biomasa en la vegetación arbórea (Kuyah et al., 2012). Las relaciones alométricas con frecuencia in-corporan variables dasométricas, como el diámetro normal y la altura total del árbol, como variables predictoras (Rutishauser et al., 2013), porque pre-sentan una correlación alta con la biomasa y son fáciles de medir directamente en campo. Los estudios para generar ecuaciones de las es-pecies nativas del trópico mexicano son escasos (Acosta et al., 2002; Douterlungne et al., 2013), aunque muchas de estas especies se usan en progra-mas de plantaciones forestales comerciales y de res-tauración, y en sistemas agroforestales. En estudios para generar ecuaciones alométricas y estimar bio-masa en el bosque tropical seco en la península de Yucatán (Cairns et al., 2003) y en Sinaloa (Návar, 2009), en el bosque tropical húmedo en Oaxaca
IntRoductIon
Biomass reserves and storage potential of most of the neotropical forests of Mexico are unknown. Thus, precise estimations are
indispensable for understanding the function of these forests in the global carbon cycle. Estimation of biomass and its integration in the structural components of the tree is very important in studies of forest productivity, nutrient cycling, energy flows, carbon storage and sequestration (Pompa-García and Yerena-Yamallel, 2014), natural and anthropogenic disturbances (Parresol, 1999; Bi et al., 2004; Návar, 2009), and in the monitoring of forest health and sustainable forest management (Brandeis et al., 2006). A large part of the uncertainty in estimations of quantity and spatial variation of forest biomass is due to the lack of allometric equations (Djomo et al., 2010). For this reason, the development of specific equations for species or groups of species for local, or site, conditions (Basuki et al., 2009) is important for improving the precision of nondestructive estimation of the biomass in tree vegetation (Kuyah et al., 2012). Allometric relationships frequently incorporate dasometric variables such as diameter at breast height and total tree height as predictor variables (Rutishauser et al., 2013), because they show a high correlation with the biomass and they are easy to measure directly in the field. Studies to generate equations of native species of the Mexican tropics are scarce (Acosta et al., 2002; Douterlungne et al., 2013), even though many of these species are used in programs of commercial forest plantations and restoration, as well as in agroforestry systems. In studies carried out in order to generate allometric equation for estimation of biomass in dry tropical forests on the Yucatán peninsula (Cairns et al., 2003) and in Sinaloa (Návar, 2009), in tropical rainforest in Oaxaca (Acosta et al., 2002) and Chiapas (Douterlungne et al., 2013), and in commercial rubber plantations (Rojo et al., 2005; Monroy and Navar, 2004), linear and non-linear models were fit. They included diameter at breast height, total tree height, base diameter, basal area, and specific gravity of the wood as predicting variables. In our study, three sub-perennial tropical forest species were considered, and these species are used for shading coffee plantations (Pennington and
PARTICIÓN DE LA BIOMASA AÉREA EN TRES ESPECIES ARBÓREAS TROPICALES
301AQUINO-RAMÍREZ et al.
(Acosta et al., 2002) y en Chiapas (Douterlungne et al., 2013), y en plantaciones comerciales de hule (Rojo et al., 2005; Monroy y Navar, 2004) se ajus-taron modelos lineales y no lineales. Las variables predictoras fueron diámetro normal, altura total, diámetro de la base, área basal y gravedad especifica de la madera. En nuestro estudio se consideraron tres espe-cies del bosque tropical subperennifolio y se usan como sombra de plantaciones de café (Pennington y Sarukhán, 2005). Además, Cupania dentata DC., Alchornea latifolia Sw. e Inga punctata Willd. son es-pecies localmente consideradas como multipropó-sito (Ventura-Aquino et al., 2008), y destaca el uso como leña, construcción, ornamental, restauración, medicinal y comestible (Pennington y Sarukhán, 2005; Luna-José y Rendón-Aguilar, 2008). Por tan-to, estas especies no comerciales son un potencial de almacenamiento de carbono en los sistemas agro-forestales de café y en la vegetación natural de la región, que deben ser cuantificadas. Los objetivos de este estudio fueron: 1) desarro-llar modelos alométricos para estimar la cantidad de biomasa aérea total en C. dentata, A. latifolia e I. punctata, especies arbóreas nativas de la Sierra Sur de Oaxaca, usando variables indicadoras; y 2) desarrollar un sistema para identificar la distribu-ción de la biomasa en los distintos componentes del árbol. La hipótesis fue que las características de morfología del árbol y la densidad de la madera en la acumulación de biomasa, son similares en las tres especies y se pueden estimar con un mismo modelo.
mAteRIAles y métodos
Área de estudio
El estudio se realizó en la finca La Cabaña, municipio de Pluma Hidalgo, Oaxaca, en una superficie aproximada de 300 ha, ubicadas entre 15° 56’ 13’’ N, 96° 24’ 09’’ O y 15° 55’ 12’’ N, 96° 23’ 51.83” O, con una altitud de 700 a 1200 m. El clima es semicálido húmedo con abundantes lluvias en verano (ACm), temperatura de 18 a 26 °C y precipitación de 1500 a 3500 mm (INEGI, 2005). La zona está en la región fisiográfica de la Sierra Sur de Oaxaca con una geomorfolo-gía de sierra baja compleja; las rocas son metamórfica gneis del Jurásico, con un tipo de suelo Phaeozem (INEGI, 2009). En la zona de estudio las especies arbóreas son: A. latifolia
Sarukhán, 2005). Moreover, Cupania dentata DC., Alchornea latifolia Sw. and Inga punctata Willd. are locally considered multi-purpose (Ventura-Aquino et al., 2008); outstanding uses are firewood, construction, ornamental, restoration, medicinal and food (Pennington and Sarukhán, 2005; Luna-José and Rendón-Aguilar, 2008). Therefore, these non-commercial species are potential carbon stores in the coffee agroforestry systems and natural vegetation of the region that require quantification. The objectives of this study were: 1) to develop allometric models to estimate the joint quantity of total above-ground biomass of C. dentata, A. latifolia and I. punctata, native tree species of the Sierra Madre Sur of Oaxaca, using indicator variables; and 2) to develop a system to identify the distribution of biomass in the different tree components. The hypothesis was that the morphological characteristics of the tree and wood density in the accumulation of biomass are similar in the three species and can be estimated with the same model.
mAteRIAls And methods
Study area
The study was conducted at the farm “La Cabaña”, municipality of Pluma Hidalgo, Oaxaca. The study area covered approximately 300 ha located between 15° 56’ 13’’ N, 96° 24’ 09’’ W and 15° 55’ 12’’ N, 96° 23’ 51.83” W, at an altitude of 700 to 1200 m. The climate is warm humid with abundant rain in summer (ACm); temperatures range from 18 to 26 °C and precipitation from 1500 to 3500 mm (INEGI, 2005). The area is located in the physiographic region of the Sierra Sur of Oaxaca, with complex low mountain geomorphology; rock is metamorphic gneiss from the Jurassic and soil type is Phaeozem (INEGI, 2009). In the studied area, the following tree species are found in higher relative abundance in the natural vegetation: A. latifolia Sw., I. punctata Willd., C. dentata DC., Ficus sp., Clethra sp., Inga paterno Harms, Pterocarpus acapulcensis Rose, Homalium trichostemon S.F. Blake, Saurauia serrata DC, Cecropia obtusifolia Bertol., Diphysa robinioides Benth., Lonchocarpus guatemalensis Benth., Abutilon purpusii Standl., Calycophyllum candidissimum (Vahl) DC., Cupania glabra Sw. and Bursera simaruba (L.) Sarg. (Acosta, 1997). For the study, the first three species were chosen for development of the allometric equations because they were the most abundant and are those most used by the agroforestry coffee growers of the region.
302
AGROCIENCIA, 1 de abril - 15 de mayo, 2015
VOLUMEN 49, NÚMERO 3
Sw., I. punctata Willd., C. dentata DC., Ficus sp., Clethra sp., Inga paterno Harms, Pterocarpus acapulcensis Rose, Homalium trichostemon S.F. Blake, Saurauia serrata DC, Cecropia obtu-sifolia Bertol., Diphysa robinioides Benth., Lonchocarpus gua-temalensis Benth., Abutilon purpusii Standl., Calycophyllum candidissimum (Vahl) DC., Cupania glabra Sw. y Bursera si-maruba (L.) Sarg., las cuales tienen abundancia relativa mayor en la vegetación natural (Acosta, 1997). Para este estudio se seleccionaron las tres primeras especies para desarrollar ecua-ciones alométricas, por ser las más abundantes y con mayor uso por los productores agroforestales de café de la región.
Muestreo destructivo de árboles
Para el estudio se derribaron 48 árboles: 17 C. dentata, 17 A. latifolia y 14 I. punctata. La metodología para estimar la biomasa aérea fue similar a la propuesta por Hitchcock y McDonnell (1979). Los árboles se cortaron a ras de suelo y separados en cinco componentes estructurales: tocón, fuste, corteza de fuste, ramas y hojas. Antes del derribo se midió el diámetro normal (Dn) con cinta diamétrica a una altura de 1.30 m sobre el nivel del suelo. A esta altura perpendicu-larmente, se tomó una muestra de madera (viruta) con un taladro Pressler (Haglöf Sweden) (5 mm diámetro) para de-terminar la densidad específica de la madera ( ). Después del derribo se midió la altura total del árbol (H ) con cinta métrica. El fuste fue seccionado en trozas de 1 m de longitud para obtener el peso verde. Cada componente del árbol se pesó in situ por separado para obtener su peso verde con una báscula digital (TECNOCOR modelo IPEN) de 100 kg, con una pre-cisión de 0.5 kg. El peso seco de cada componente se obtu-vo mediante la relación peso seco: peso fresco, para lo cual se obtuvieron submuestras de madera en secciones transversales (rodajas) de fuste aproximado de 4 a 6 cm de grosor. Las pri-meras dos rodajas se obtuvieron a una altura de 0.30 y 1.30 m sobre el nivel suelo y después, en la parte superior de cada troza donde el diámetro fue mayor, separando la corteza de cada una de ellas. Además, se dividió la copa en dos secciones de manera horizontal (alta y baja) y se recolectaron al azar dos muestras en cada una de ellas y cuatro muestras de 0.5 kg de hojas de la misma forma. Todas las submuestras se pesaron de inmediato para evitar pérdidas de humedad, se colocaron en bolsas de papel con sus respectivas etiquetas, se transportaron y se pusieron 96 h en una estufa de secado de madera (Nyle modelo L500) a 70 °C o hasta lograr un peso constante. El peso verde y el peso seco de las submuestras pequeñas se ob-tuvieron en una báscula electrónica (TECNOCOR modelo COR-30) con una precisión de 5 g. La relación peso seco:
Destructive tree sampling
For the study, 48 trees were felled: 17 C. dentata, 17 A. latifolia and 14 I. punctata. The methodology used to estimate aboveground biomass was similar to that proposed by Hitchcock and McDonnell (1979). The trees were cut at ground level and separated into five structural components: stump, stem, stem bark, branches and leaves. Before felling, the normal diameter (Dn) at breast height (DBH) was measured with a diameter tape at a height of 1.30 m above ground level. At this height, perpendicularly, a wood sample (core) was taken with a 5 mm diameter Pressler increment borer (Haglöf, Sweden) to determine specific density of the wood ( ). After felling, total tree height (H ) was measured with a metric measuring tape. The stem was cut into 1 m long sections to obtain green weight. Also, each tree component was weighed separately in situ with a digital scale (TECNOCOR model IPEN) with capacity to weigh 100 kg and precision of 0.5 kg. Dry weight of each component was obtained with the ratio dry weight:fresh weight. To this end, sub-samples of wood of cross-sections of the stem 4 to 6 cm thick were obtained. The first two sections were obtained at a height of 0.30 and 1.30 m above ground level and the other sub-samples from the upper part of each section, where the diameter was larger. The bark was separated from each section. In addition, the crown was divided horizontally into two sections (upper and lower) and two samples were collected at random from each section as well as four random samples of 0.5 kg leaves. All of the sub-samples were immediately weighed before loss of moisture and placed in labeled paper bags. After transport to the laboratory, the samples were place in a wood drying oven (Nyle model L500) for 96 h at 70 °C, or until constant weight. Green and dry weights of the samples were obtained with an electronic scale (TECNOCOR model COR-30) with precision of 5 g. The average dry weight:fresh weight ratio was used to obtain biomass (dry weight) of stump, branches and leaves, while for the stem and bark, the ratio was obtained from each of the sub-sample sections. Total aboveground biomass (Bt ) of each tree (kg) is the sum of the biomass of each of its components:
Bt BstumpBstemBbarkBbranchesBleaves
Determination of wood specific density
Wood specific density ( ) in the shavings was obtained with the relationship of dry weight to green volume (g cm3). Green volume was determined by the water displacement method. Dry weight was obtained by placing the samples in a drying oven for 48 h, or until constant weight, at a temperature of 75 °C. The
PARTICIÓN DE LA BIOMASA AÉREA EN TRES ESPECIES ARBÓREAS TROPICALES
303AQUINO-RAMÍREZ et al.
peso fresco promedio se usó para obtener la biomasa (peso seco) en el tocón, las ramas y las hojas; para el fuste y la corte-za, dicha relación se obtuvo de cada submuestra de las trozas. La biomasa total aérea (Bt ) de cada árbol (kg) fue la suma de la biomasa de cada componente:
Bt BtocónBfusteBcortezaBramasBhojas
Determinación de la densidad específica de la madera
La densidad específica de la madera ( ) en las virutas se obtuvo por la relación del peso seco con el volumen verde (g cm3), y el volumen verde por el método de desplazamiento de agua. El peso seco se obtuvo colocando las muestras en una estufa de secado por 48 h o hasta a alcanzar un peso constante, a 75 °C. Los valores medios de la densidad específica de la ma-dera en las tres especies se compararon con la prueba de Tukey HSD (p0.05).
Comparación de grupos de especies
La biomasa total de las tres especies se analizó de manera conjunta para conocer la posibilidad de agruparlas como una sola especie o grupos de especies, y determinar su contribu-ción relativa en una sola ecuación. Para ello se desarrolló una prueba de adicionalidad simple con un análisis de regresión lineal incorporando variables indicadoras (dummy) (Draper y Smith, 1981; Montgomery y Peck, 1982). El modelo fue:
Bt Dn H= + ( )+α β ε0 12
A éste se incorporó el factor especie como una variable indi-cadora de la siguiente forma:
Bt Z Z Z Z Dn H= + +[ ]+ + +[ ]( )+α α α β β β ε0 1 1 2 2 0 1 1 2 22
ZA latifolia
110
=
, ., si pertenece a de otra forma
ZI punctata
210
=
, ., si pertenece a de otra forma
donde Bt es la biomasa área total del árbol (kg), Dn es el diáme-tro normal (cm), H es la altura total (m), Z1 y Z2 son las varia-bles indicadoras, 0, 0 son los parámetros de regresión, 1, 2, 1, 2 los parámetros de regresión debidos a la adicionalidad,
mean values of specific density of the wood of the three species were compared with the Tukey HSD test (p0.05).
Comparison of species groups
Total biomass of the three species was analyzed jointly to determine whether it was possible to group them as a single species or as groups of species and, therefore, use a single equation to estimate their relative contribution. To this end, a test of simple additionality was developed with a linear regression analysis incorporating indicator (dummy) variables (Draper and Smith, 1981; Montgomery and Peck, 1982). The model was:
Bt Dn H= + ( )+α β ε0 12
To this equation, the factor species was incorporated as a dummy variable in the following way:
Bt Z Z Z Z Dn H= + +[ ]+ + +[ ]( )+α α α β β β ε0 1 1 2 2 0 1 1 2 22
ZA latifolia
110
=
, ., if otherwise
ZI punctata
210
=
, ., if otherwise
where Bt is the total tree aboveground biomass (kg), Dn is diameter at breast height (cm), H is total height (m), Z1 and Z2 are dummy variables, 0, 0 are regression parameters, 1, 2, 1, 2 are regression parameters due to additionality, and is the random error. Cupania dentata was considered the base species in the model because it has the largest number of observations of the total of the felled trees. To group the species as a single group or groups of species, intercepts and slopes were considered homogeneous H0 1 2 1 2 0= = = = =( )α α β β .
Adjustment of the regression models
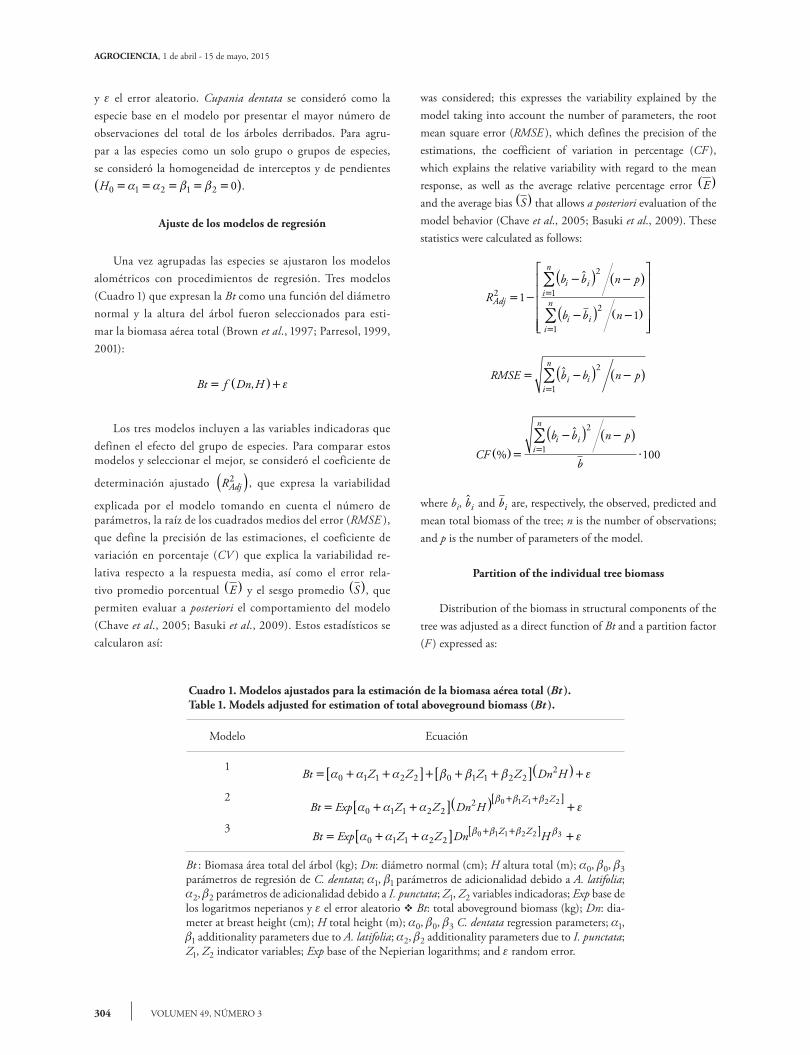
Once the species were grouped, the allometric models were fit with regression procedures. Three models (Table 1) that express Bt as a function of diameter at breast height and tree height were selected to estimate total aboveground biomass (Brown et al., 1997; Parresol, 1999, 2001):
Bt f Dn H= ( )+, ε
The three models include the dummy variables that define the effect of the group of species. To compare these models and
select the best, the adjusted coefficient of determination RAdj2( )
304
AGROCIENCIA, 1 de abril - 15 de mayo, 2015
VOLUMEN 49, NÚMERO 3
y el error aleatorio. Cupania dentata se consideró como la especie base en el modelo por presentar el mayor número de observaciones del total de los árboles derribados. Para agru-par a las especies como un solo grupo o grupos de especies, se consideró la homogeneidad de interceptos y de pendientes H0 1 2 1 2 0= = = = =( )α α β β .
Ajuste de los modelos de regresión
Una vez agrupadas las especies se ajustaron los modelos alométricos con procedimientos de regresión. Tres modelos (Cuadro 1) que expresan la Bt como una función del diámetro normal y la altura del árbol fueron seleccionados para esti-mar la biomasa aérea total (Brown et al., 1997; Parresol, 1999, 2001):
Bt f Dn H= ( )+, ε
Los tres modelos incluyen a las variables indicadoras que definen el efecto del grupo de especies. Para comparar estos modelos y seleccionar el mejor, se consideró el coeficiente de
determinación ajustado RAdj2( ) , que expresa la variabilidad
explicada por el modelo tomando en cuenta el número de parámetros, la raíz de los cuadrados medios del error (RMSE ), que define la precisión de las estimaciones, el coeficiente de variación en porcentaje (CV ) que explica la variabilidad re-lativa respecto a la respuesta media, así como el error rela-tivo promedio porcentual E( ) y el sesgo promedio S( ), que permiten evaluar a posteriori el comportamiento del modelo (Chave et al., 2005; Basuki et al., 2009). Estos estadísticos se calcularon así:
was considered; this expresses the variability explained by the model taking into account the number of parameters, the root mean square error (RMSE ), which defines the precision of the estimations, the coefficient of variation in percentage (CF ), which explains the relative variability with regard to the mean response, as well as the average relative percentage error E( ) and the average bias S( ) that allows a posteriori evaluation of the model behavior (Chave et al., 2005; Basuki et al., 2009). These statistics were calculated as follows:
Rb b n p
b b nAdj
i ii
n
i ii
n2
2
1
2
1
11
= −
−( ) −( )
−( ) −( )
=
=
∑
∑
RMSE b b n pi ii
n= −( ) −( )
=∑
2
1
CF
b b n p
b
i ii
n
%( )=
−( ) −( )⋅=
∑
2
1 100
where bi, bi and bi are, respectively, the observed, predicted and
mean total biomass of the tree; n is the number of observations; and p is the number of parameters of the model.
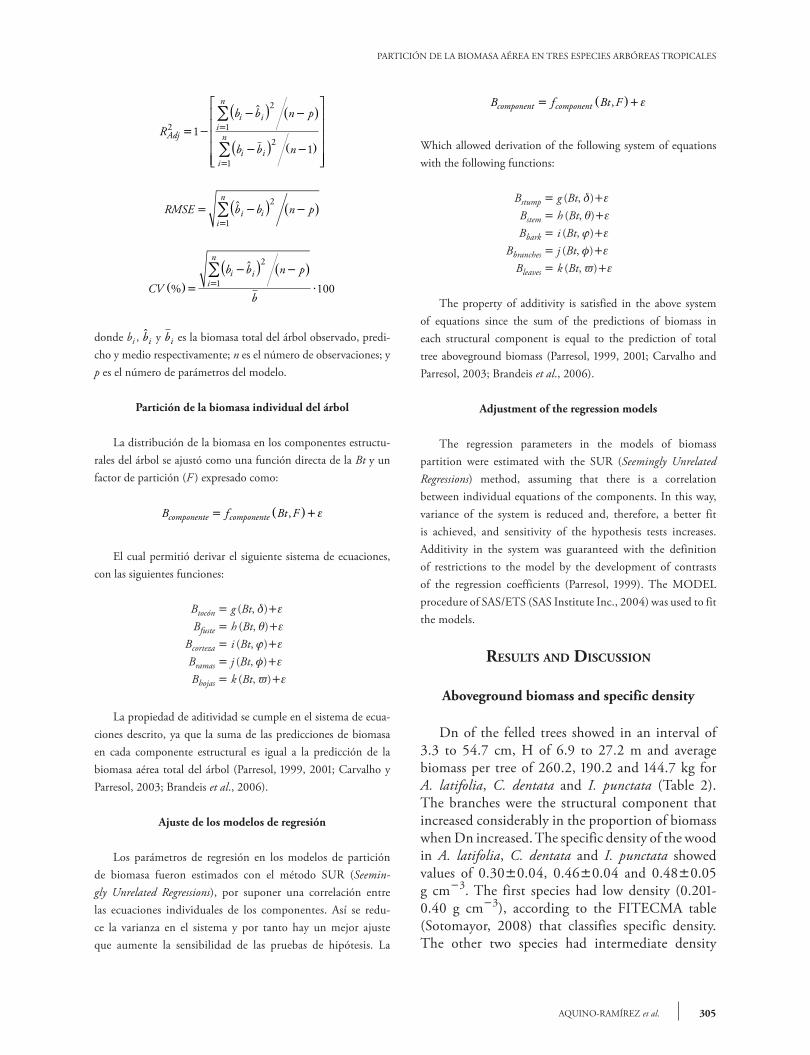
Partition of the individual tree biomass
Distribution of the biomass in structural components of the tree was adjusted as a direct function of Bt and a partition factor (F ) expressed as:
Cuadro 1. Modelos ajustados para la estimación de la biomasa aérea total (Bt ).Table 1. Models adjusted for estimation of total aboveground biomass (Bt ).
Modelo Ecuación
1Bt Z Z Z Z Dn H= + +[ ]+ + +[ ]( )+α α α β β β ε0 1 1 2 2 0 1 1 2 2
2
2Bt Exp Z Z Dn H
Z Z= + +[ ]( ) +
+ +[ ]α α α ε
β β β0 1 1 2 2
2 0 1 1 2 2
3Bt Exp Z Z Dn HZ Z= + +[ ] ++ +[ ]α α α εβ β β β
0 1 1 2 20 1 1 2 2 3
Bt : Biomasa área total del árbol (kg); Dn: diámetro normal (cm); H altura total (m); 0, 0, 3 parámetros de regresión de C. dentata; 1, 1 parámetros de adicionalidad debido a A. latifolia; 2, 2 parámetros de adicionalidad debido a I. punctata; Z1, Z2 variables indicadoras; Exp base de los logaritmos neperianos y el error aleatorio v Bt: total aboveground biomass (kg); Dn: dia-meter at breast height (cm); H total height (m); 0, 0, 3 C. dentata regression parameters; 1, 1 additionality parameters due to A. latifolia; 2, 2 additionality parameters due to I. punctata; Z1, Z2 indicator variables; Exp base of the Nepierian logarithms; and random error.
PARTICIÓN DE LA BIOMASA AÉREA EN TRES ESPECIES ARBÓREAS TROPICALES
305AQUINO-RAMÍREZ et al.
Rb b n p
b b nAdj
i ii
n
i ii
n2
2
1
2
1
11
= −
−( ) −( )
−( ) −( )
=
=
∑
∑
RMSE b b n pi ii
n= −( ) −( )
=∑
2
1
CV
b b n p
b
i ii
n
%( )=
−( ) −( )⋅=
∑
2
1 100
donde bi , bi y bi es la biomasa total del árbol observado, predi-
cho y medio respectivamente; n es el número de observaciones; y p es el número de parámetros del modelo.
Partición de la biomasa individual del árbol
La distribución de la biomasa en los componentes estructu-rales del árbol se ajustó como una función directa de la Bt y un factor de partición (F ) expresado como:
B f Bt Fcomponente componente= ( )+, ε
El cual permitió derivar el siguiente sistema de ecuaciones, con las siguientes funciones:
Btocón g (Bt, )
Bfuste h (Bt, )
Bcorteza i (Bt, )
Bramas j (Bt, )
Bhojas k (Bt, )
La propiedad de aditividad se cumple en el sistema de ecua-ciones descrito, ya que la suma de las predicciones de biomasa en cada componente estructural es igual a la predicción de la biomasa aérea total del árbol (Parresol, 1999, 2001; Carvalho y Parresol, 2003; Brandeis et al., 2006).
Ajuste de los modelos de regresión
Los parámetros de regresión en los modelos de partición de biomasa fueron estimados con el método SUR (Seemin-gly Unrelated Regressions), por suponer una correlación entre las ecuaciones individuales de los componentes. Así se redu-ce la varianza en el sistema y por tanto hay un mejor ajuste que aumente la sensibilidad de las pruebas de hipótesis. La
B f Bt Fcomponent component= ( )+, ε
Which allowed derivation of the following system of equations with the following functions:
Bstump g (Bt, )
Bstem h (Bt, )
Bbark i (Bt, )
Bbranches j (Bt, )
Bleaves k (Bt, )
The property of additivity is satisfied in the above system of equations since the sum of the predictions of biomass in each structural component is equal to the prediction of total tree aboveground biomass (Parresol, 1999, 2001; Carvalho and Parresol, 2003; Brandeis et al., 2006).
Adjustment of the regression models
The regression parameters in the models of biomass partition were estimated with the SUR (Seemingly Unrelated Regressions) method, assuming that there is a correlation between individual equations of the components. In this way, variance of the system is reduced and, therefore, a better fit is achieved, and sensitivity of the hypothesis tests increases. Additivity in the system was guaranteed with the definition of restrictions to the model by the development of contrasts of the regression coefficients (Parresol, 1999). The MODEL procedure of SAS/ETS (SAS Institute Inc., 2004) was used to fit the models.
Results And dIscussIon
Aboveground biomass and specific density
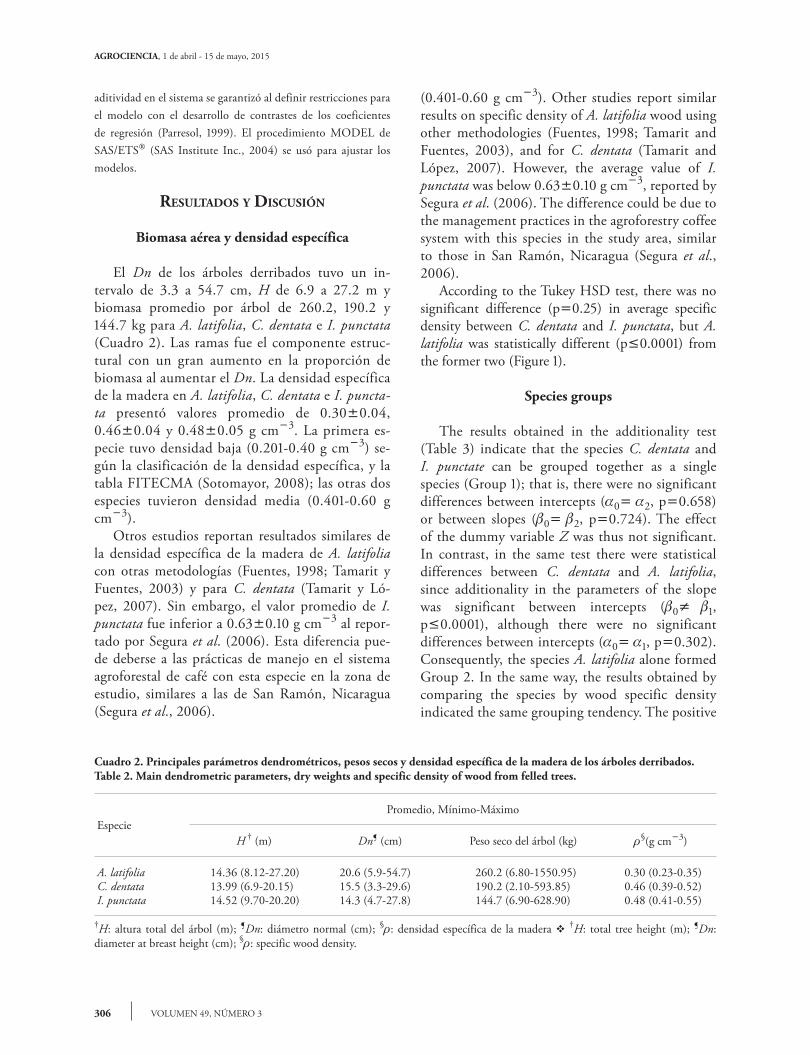
Dn of the felled trees showed in an interval of 3.3 to 54.7 cm, H of 6.9 to 27.2 m and average biomass per tree of 260.2, 190.2 and 144.7 kg for A. latifolia, C. dentata and I. punctata (Table 2). The branches were the structural component that increased considerably in the proportion of biomass when Dn increased. The specific density of the wood in A. latifolia, C. dentata and I. punctata showed values of 0.300.04, 0.460.04 and 0.480.05 g cm3. The first species had low density (0.201-0.40 g cm3), according to the FITECMA table (Sotomayor, 2008) that classifies specific density. The other two species had intermediate density
306
AGROCIENCIA, 1 de abril - 15 de mayo, 2015
VOLUMEN 49, NÚMERO 3
aditividad en el sistema se garantizó al definir restricciones para el modelo con el desarrollo de contrastes de los coeficientes de regresión (Parresol, 1999). El procedimiento MODEL de SAS/ETS (SAS Institute Inc., 2004) se usó para ajustar los modelos.
ResultAdos y dIscusIón
Biomasa aérea y densidad específica
El Dn de los árboles derribados tuvo un in-tervalo de 3.3 a 54.7 cm, H de 6.9 a 27.2 m y biomasa promedio por árbol de 260.2, 190.2 y 144.7 kg para A. latifolia, C. dentata e I. punctata (Cuadro 2). Las ramas fue el componente estruc-tural con un gran aumento en la proporción de biomasa al aumentar el Dn. La densidad específica de la madera en A. latifolia, C. dentata e I. puncta-ta presentó valores promedio de 0.300.04, 0.460.04 y 0.480.05 g cm3. La primera es-pecie tuvo densidad baja (0.201-0.40 g cm3) se-gún la clasificación de la densidad específica, y la tabla FITECMA (Sotomayor, 2008); las otras dos especies tuvieron densidad media (0.401-0.60 g cm3). Otros estudios reportan resultados similares de la densidad específica de la madera de A. latifolia con otras metodologías (Fuentes, 1998; Tamarit y Fuentes, 2003) y para C. dentata (Tamarit y Ló-pez, 2007). Sin embargo, el valor promedio de I. punctata fue inferior a 0.630.10 g cm3 al repor-tado por Segura et al. (2006). Esta diferencia pue-de deberse a las prácticas de manejo en el sistema agroforestal de café con esta especie en la zona de estudio, similares a las de San Ramón, Nicaragua (Segura et al., 2006).
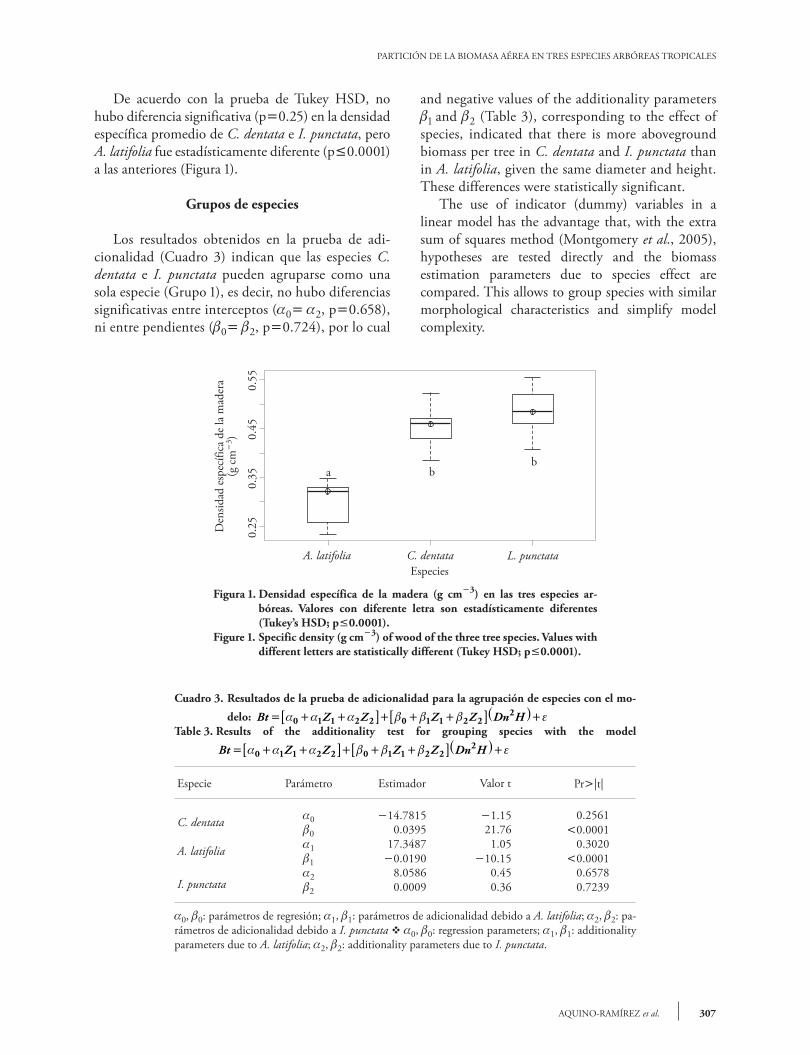
(0.401-0.60 g cm3). Other studies report similar results on specific density of A. latifolia wood using other methodologies (Fuentes, 1998; Tamarit and Fuentes, 2003), and for C. dentata (Tamarit and López, 2007). However, the average value of I. punctata was below 0.630.10 g cm3, reported by Segura et al. (2006). The difference could be due to the management practices in the agroforestry coffee system with this species in the study area, similar to those in San Ramón, Nicaragua (Segura et al., 2006). According to the Tukey HSD test, there was no significant difference (p0.25) in average specific density between C. dentata and I. punctata, but A. latifolia was statistically different (p0.0001) from the former two (Figure 1).
Species groups
The results obtained in the additionality test (Table 3) indicate that the species C. dentata and I. punctate can be grouped together as a single species (Group 1); that is, there were no significant differences between intercepts (0 2, p0.658) or between slopes (0 2, p0.724). The effect of the dummy variable Z was thus not significant. In contrast, in the same test there were statistical differences between C. dentata and A. latifolia, since additionality in the parameters of the slope was significant between intercepts (0 1, p0.0001), although there were no significant differences between intercepts (0 1, p0.302). Consequently, the species A. latifolia alone formed Group 2. In the same way, the results obtained by comparing the species by wood specific density indicated the same grouping tendency. The positive
Cuadro 2. Principales parámetros dendrométricos, pesos secos y densidad específica de la madera de los árboles derribados.Table 2. Main dendrometric parameters, dry weights and specific density of wood from felled trees.
EspeciePromedio, Mínimo-Máximo
H † (m) Dn¶ (cm) Peso seco del árbol (kg) §(g cm3)
A. latifolia 14.36 (8.12-27.20) 20.6 (5.9-54.7) 260.2 (6.80-1550.95) 0.30 (0.23-0.35)C. dentata 13.99 (6.9-20.15) 15.5 (3.3-29.6) 190.2 (2.10-593.85) 0.46 (0.39-0.52)I. punctata 14.52 (9.70-20.20) 14.3 (4.7-27.8) 144.7 (6.90-628.90) 0.48 (0.41-0.55)
†H: altura total del árbol (m); ¶Dn: diámetro normal (cm); §: densidad específica de la madera v †H: total tree height (m); ¶Dn: diameter at breast height (cm); §: specific wood density.
PARTICIÓN DE LA BIOMASA AÉREA EN TRES ESPECIES ARBÓREAS TROPICALES
307AQUINO-RAMÍREZ et al.
De acuerdo con la prueba de Tukey HSD, no hubo diferencia significativa (p0.25) en la densidad específica promedio de C. dentata e I. punctata, pero A. latifolia fue estadísticamente diferente (p0.0001) a las anteriores (Figura 1).
Grupos de especies
Los resultados obtenidos en la prueba de adi-cionalidad (Cuadro 3) indican que las especies C. dentata e I. punctata pueden agruparse como una sola especie (Grupo 1), es decir, no hubo diferencias significativas entre interceptos (0 2, p0.658), ni entre pendientes (0 2, p0.724), por lo cual
and negative values of the additionality parameters 1 and 2 (Table 3), corresponding to the effect of species, indicated that there is more aboveground biomass per tree in C. dentata and I. punctata than in A. latifolia, given the same diameter and height. These differences were statistically significant. The use of indicator (dummy) variables in a linear model has the advantage that, with the extra sum of squares method (Montgomery et al., 2005), hypotheses are tested directly and the biomass estimation parameters due to species effect are compared. This allows to group species with similar morphological characteristics and simplify model complexity.
Figura 1. Densidad específica de la madera (g cm3) en las tres especies ar-bóreas. Valores con diferente letra son estadísticamente diferentes (Tukey’s HSD; p0.0001).
Figure 1. Specific density (g cm3) of wood of the three tree species. Values with different letters are statistically different (Tukey HSD; p0.0001).
A. latifolia C. dentata L. punctataEspecies
a bb
0.25Den
sidad
esp
ecífi
ca d
e la
mad
era
-3
(g c
m)
0.55
0.45
0.35
Cuadro 3. Resultados de la prueba de adicionalidad para la agrupación de especies con el mo-
delo: Bt Z Z Z Z Dn H= + +[ ]+ + +[ ]( )+α α α β β β ε0 1 1 2 2 0 1 1 2 22
Table 3. Results of the additionality test for grouping species with the model
Bt Z Z Z Z Dn H= + +[ ]+ + +[ ]( )+α α α β β β ε0 1 1 2 2 0 1 1 2 22
Especie Parámetro Estimador Valor t Pr|t|
C. dentata 0 14.7815 1.15 0.25610 0.0395 21.76 0.0001
A. latifolia 1 17.3487 1.05 0.30201 0.0190 10.15 0.0001
I. punctata2 8.0586 0.45 0.65782 0.0009 0.36 0.7239
0, 0: parámetros de regresión; 1, 1: parámetros de adicionalidad debido a A. latifolia; 2, 2: pa-rámetros de adicionalidad debido a I. punctata v 0, 0: regression parameters; 1, 1: additionality parameters due to A. latifolia; 2, 2: additionality parameters due to I. punctata.
308
AGROCIENCIA, 1 de abril - 15 de mayo, 2015
VOLUMEN 49, NÚMERO 3
el efecto de la variable indicadora Z no fue signifi-cativo. Al contrario, en la misma prueba hubo di-ferencias estadísticas entre C. dentata y A. latifolia, ya que la adicionalidad en los parámetros de la pen-diente fue significativa (0 1, p0.0001), aun-que no hubo diferencias entre interceptos (0 1, p0.302); por tanto, la especie A. latifolia confor-mó por si sola al Grupo 2. De la misma manera, los resultados de la comparación de la densidad es-pecífica de la madera entre especies, indicaron esta misma tendencia de agrupamiento. El valor positivo y negativo de los parámetros de adicionalidad 1 y 2 (Cuadro 3), correspondiente al efecto de las es-pecies, indicaron mayor biomasa aérea por árbol en C. dentata e I. punctata que para A. latifolia, dado el mismo diámetro y altura; estas diferencias fueron estadísticamente significativas. El uso de variables indicadoras en un modelo lineal tiene la ventaja de realizar pruebas de hipó-tesis directamente con el método de la suma extra de cuadrados (Montgomery et al., 2005) y compa-rar los parámetros de los modelos de estimación de biomasa debidos al efecto de la especie. Lo anterior permitiría agrupar especies con características mor-fológicas similares simplificando la complejidad de los modelos.
Modelos de biomasa
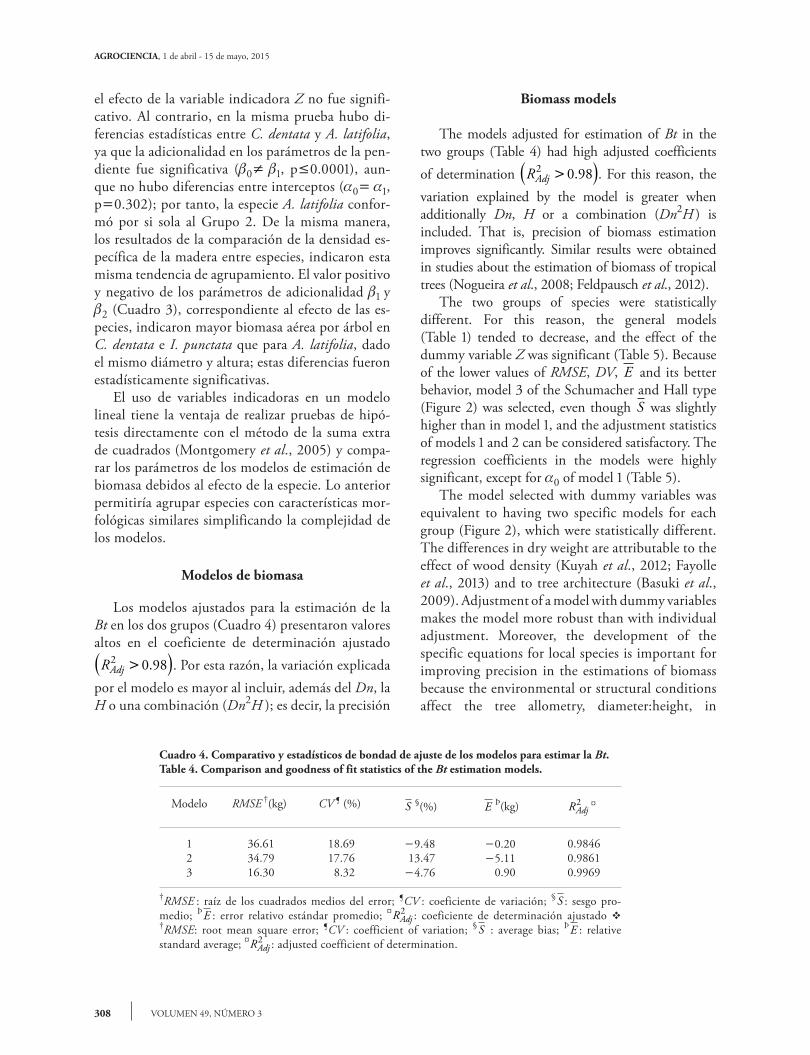
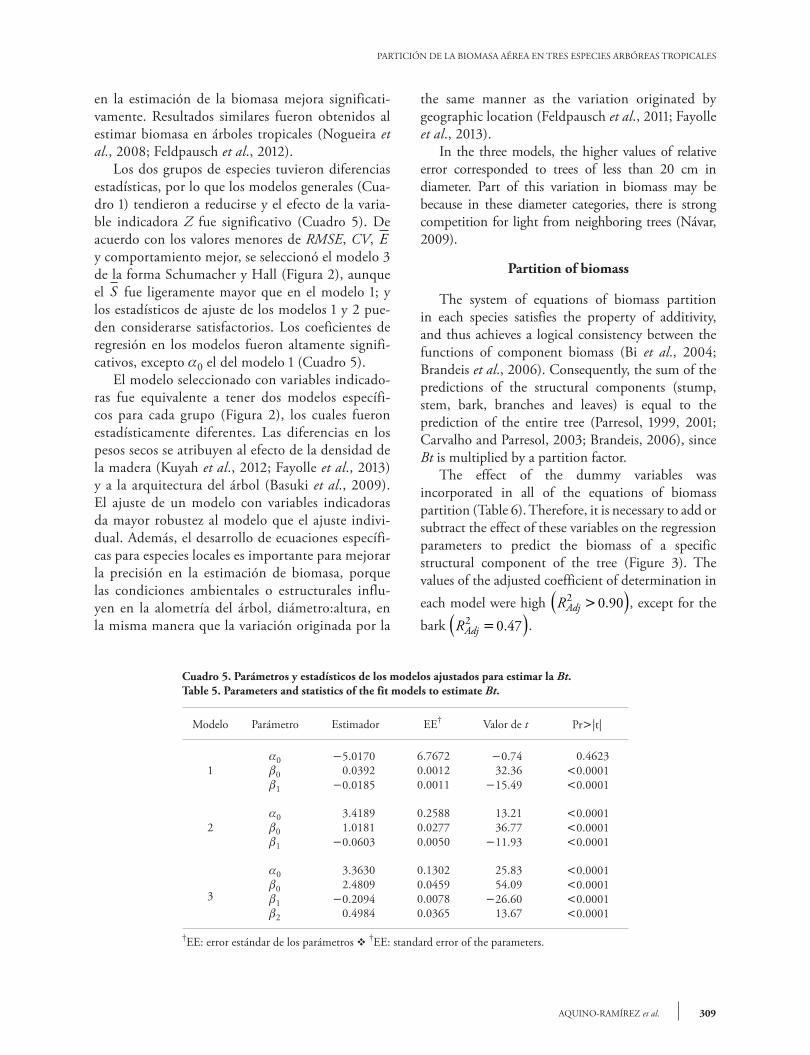
Los modelos ajustados para la estimación de la Bt en los dos grupos (Cuadro 4) presentaron valores altos en el coeficiente de determinación ajustado RAdj
2 0 98>( ). . Por esta razón, la variación explicada por el modelo es mayor al incluir, además del Dn, la H o una combinación (Dn2H ); es decir, la precisión
Biomass models
The models adjusted for estimation of Bt in the two groups (Table 4) had high adjusted coefficients of determination RAdj
2 0 98>( ). . For this reason, the variation explained by the model is greater when additionally Dn, H or a combination (Dn2H ) is included. That is, precision of biomass estimation improves significantly. Similar results were obtained in studies about the estimation of biomass of tropical trees (Nogueira et al., 2008; Feldpausch et al., 2012). The two groups of species were statistically different. For this reason, the general models (Table 1) tended to decrease, and the effect of the dummy variable Z was significant (Table 5). Because of the lower values of RMSE, DV, E and its better behavior, model 3 of the Schumacher and Hall type (Figure 2) was selected, even though S was slightly higher than in model 1, and the adjustment statistics of models 1 and 2 can be considered satisfactory. The regression coefficients in the models were highly significant, except for 0 of model 1 (Table 5). The model selected with dummy variables was equivalent to having two specific models for each group (Figure 2), which were statistically different. The differences in dry weight are attributable to the effect of wood density (Kuyah et al., 2012; Fayolle et al., 2013) and to tree architecture (Basuki et al., 2009). Adjustment of a model with dummy variables makes the model more robust than with individual adjustment. Moreover, the development of the specific equations for local species is important for improving precision in the estimations of biomass because the environmental or structural conditions affect the tree allometry, diameter:height, in
Cuadro 4. Comparativo y estadísticos de bondad de ajuste de los modelos para estimar la Bt. Table 4. Comparison and goodness of fit statistics of the Bt estimation models.
Modelo RMSE †(kg) CV ¶ (%) S §(%) E Þ(kg) RAdj2 ¤
1 36.61 18.69 9.48 0.20 0.98462 34.79 17.76 13.47 5.11 0.98613 16.30 8.32 4.76 0.90 0.9969
†RMSE : raíz de los cuadrados medios del error; ¶CV : coeficiente de variación; § S : sesgo pro-medio; ÞE : error relativo estándar promedio; ¤RAdj
2 : coeficiente de determinación ajustado v †RMSE: root mean square error; ¶CV : coefficient of variation; § S : average bias; ÞE : relative standard average; ¤RAdj
2 : adjusted coefficient of determination.
PARTICIÓN DE LA BIOMASA AÉREA EN TRES ESPECIES ARBÓREAS TROPICALES
309AQUINO-RAMÍREZ et al.
en la estimación de la biomasa mejora significati-vamente. Resultados similares fueron obtenidos al estimar biomasa en árboles tropicales (Nogueira et al., 2008; Feldpausch et al., 2012). Los dos grupos de especies tuvieron diferencias estadísticas, por lo que los modelos generales (Cua-dro 1) tendieron a reducirse y el efecto de la varia-ble indicadora Z fue significativo (Cuadro 5). De acuerdo con los valores menores de RMSE, CV, E y comportamiento mejor, se seleccionó el modelo 3 de la forma Schumacher y Hall (Figura 2), aunque el S fue ligeramente mayor que en el modelo 1; y los estadísticos de ajuste de los modelos 1 y 2 pue-den considerarse satisfactorios. Los coeficientes de regresión en los modelos fueron altamente signifi-cativos, excepto 0 el del modelo 1 (Cuadro 5). El modelo seleccionado con variables indicado-ras fue equivalente a tener dos modelos específi-cos para cada grupo (Figura 2), los cuales fueron estadísticamente diferentes. Las diferencias en los pesos secos se atribuyen al efecto de la densidad de la madera (Kuyah et al., 2012; Fayolle et al., 2013) y a la arquitectura del árbol (Basuki et al., 2009). El ajuste de un modelo con variables indicadoras da mayor robustez al modelo que el ajuste indivi-dual. Además, el desarrollo de ecuaciones específi-cas para especies locales es importante para mejorar la precisión en la estimación de biomasa, porque las condiciones ambientales o estructurales influ-yen en la alometría del árbol, diámetro:altura, en la misma manera que la variación originada por la
the same manner as the variation originated by geographic location (Feldpausch et al., 2011; Fayolle et al., 2013). In the three models, the higher values of relative error corresponded to trees of less than 20 cm in diameter. Part of this variation in biomass may be because in these diameter categories, there is strong competition for light from neighboring trees (Návar, 2009).
Partition of biomass
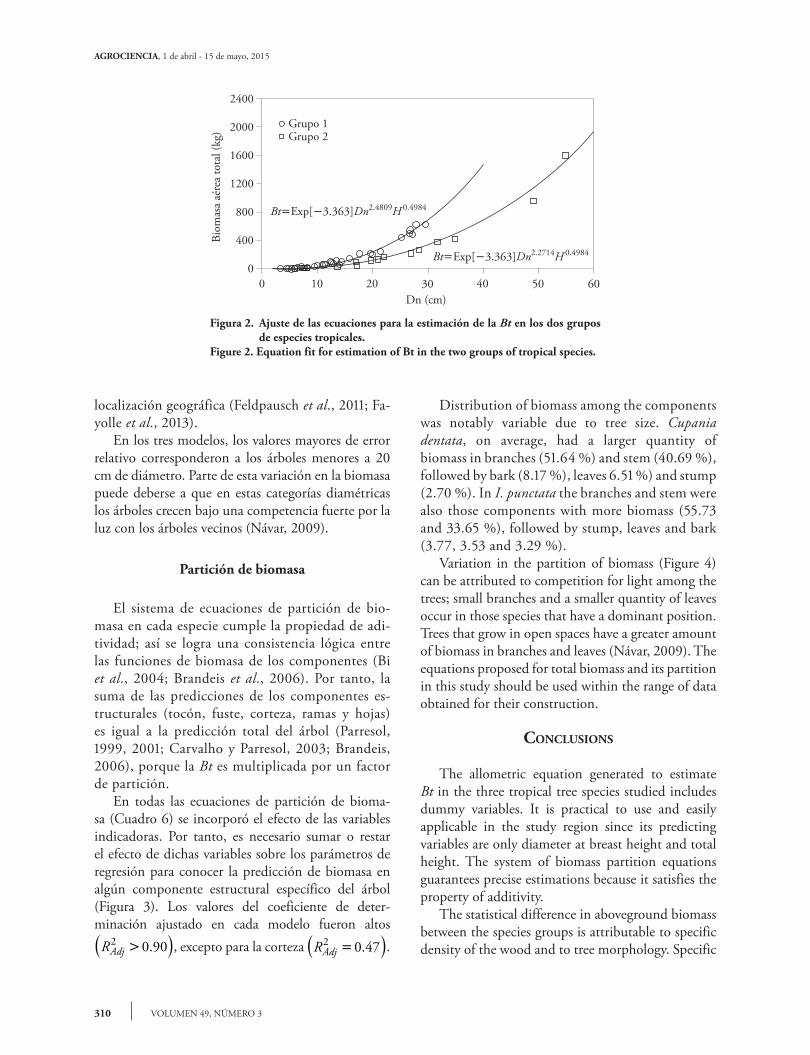
The system of equations of biomass partition in each species satisfies the property of additivity, and thus achieves a logical consistency between the functions of component biomass (Bi et al., 2004; Brandeis et al., 2006). Consequently, the sum of the predictions of the structural components (stump, stem, bark, branches and leaves) is equal to the prediction of the entire tree (Parresol, 1999, 2001; Carvalho and Parresol, 2003; Brandeis, 2006), since Bt is multiplied by a partition factor. The effect of the dummy variables was incorporated in all of the equations of biomass partition (Table 6). Therefore, it is necessary to add or subtract the effect of these variables on the regression parameters to predict the biomass of a specific structural component of the tree (Figure 3). The values of the adjusted coefficient of determination in each model were high RAdj
2 0 90>( ). , except for the bark RAdj
2 0 47=( ). .
Cuadro 5. Parámetros y estadísticos de los modelos ajustados para estimar la Bt.Table 5. Parameters and statistics of the fit models to estimate Bt.
Modelo Parámetro Estimador EE† Valor de t Pr|t|
10 5.0170 6.7672 0.74 0.46230 0.0392 0.0012 32.36 0.00011 0.0185 0.0011 15.49 0.0001
20 3.4189 0.2588 13.21 0.00010 1.0181 0.0277 36.77 0.00011 0.0603 0.0050 11.93 0.0001
3
0 3.3630 0.1302 25.83 0.00010 2.4809 0.0459 54.09 0.00011 0.2094 0.0078 26.60 0.00012 0.4984 0.0365 13.67 0.0001
†EE: error estándar de los parámetros v †EE: standard error of the parameters.
310
AGROCIENCIA, 1 de abril - 15 de mayo, 2015
VOLUMEN 49, NÚMERO 3
localización geográfica (Feldpausch et al., 2011; Fa-yolle et al., 2013). En los tres modelos, los valores mayores de error relativo corresponderon a los árboles menores a 20 cm de diámetro. Parte de esta variación en la biomasa puede deberse a que en estas categorías diamétricas los árboles crecen bajo una competencia fuerte por la luz con los árboles vecinos (Návar, 2009).
Partición de biomasa
El sistema de ecuaciones de partición de bio-masa en cada especie cumple la propiedad de adi-tividad; así se logra una consistencia lógica entre las funciones de biomasa de los componentes (Bi et al., 2004; Brandeis et al., 2006). Por tanto, la suma de las predicciones de los componentes es-tructurales (tocón, fuste, corteza, ramas y hojas) es igual a la predicción total del árbol (Parresol, 1999, 2001; Carvalho y Parresol, 2003; Brandeis, 2006), porque la Bt es multiplicada por un factor de partición. En todas las ecuaciones de partición de bioma-sa (Cuadro 6) se incorporó el efecto de las variables indicadoras. Por tanto, es necesario sumar o restar el efecto de dichas variables sobre los parámetros de regresión para conocer la predicción de biomasa en algún componente estructural específico del árbol (Figura 3). Los valores del coeficiente de deter-minación ajustado en cada modelo fueron altos RAdj
2 0 90>( ). , excepto para la corteza RAdj2 0 47=( ). .
Distribution of biomass among the components was notably variable due to tree size. Cupania dentata, on average, had a larger quantity of biomass in branches (51.64 %) and stem (40.69 %), followed by bark (8.17 %), leaves 6.51 %) and stump (2.70 %). In I. punctata the branches and stem were also those components with more biomass (55.73 and 33.65 %), followed by stump, leaves and bark (3.77, 3.53 and 3.29 %). Variation in the partition of biomass (Figure 4) can be attributed to competition for light among the trees; small branches and a smaller quantity of leaves occur in those species that have a dominant position. Trees that grow in open spaces have a greater amount of biomass in branches and leaves (Návar, 2009). The equations proposed for total biomass and its partition in this study should be used within the range of data obtained for their construction.
conclusIons
The allometric equation generated to estimate Bt in the three tropical tree species studied includes dummy variables. It is practical to use and easily applicable in the study region since its predicting variables are only diameter at breast height and total height. The system of biomass partition equations guarantees precise estimations because it satisfies the property of additivity. The statistical difference in aboveground biomass between the species groups is attributable to specific density of the wood and to tree morphology. Specific
2400
2000
1600
1200
800
400
0
Biom
asa
aére
a to
tal (
kg)
Grupo 1Grupo 2
2.4809 0.4984Bt=Exp[-3.363]Dn H
2.2714 0.4984Bt=Exp[-3.363]Dn H
0 10 20 30 40 50 60Dn (cm)
Figura 2. Ajuste de las ecuaciones para la estimación de la Bt en los dos grupos de especies tropicales.
Figure 2. Equation fit for estimation of Bt in the two groups of tropical species.
PARTICIÓN DE LA BIOMASA AÉREA EN TRES ESPECIES ARBÓREAS TROPICALES
311AQUINO-RAMÍREZ et al.
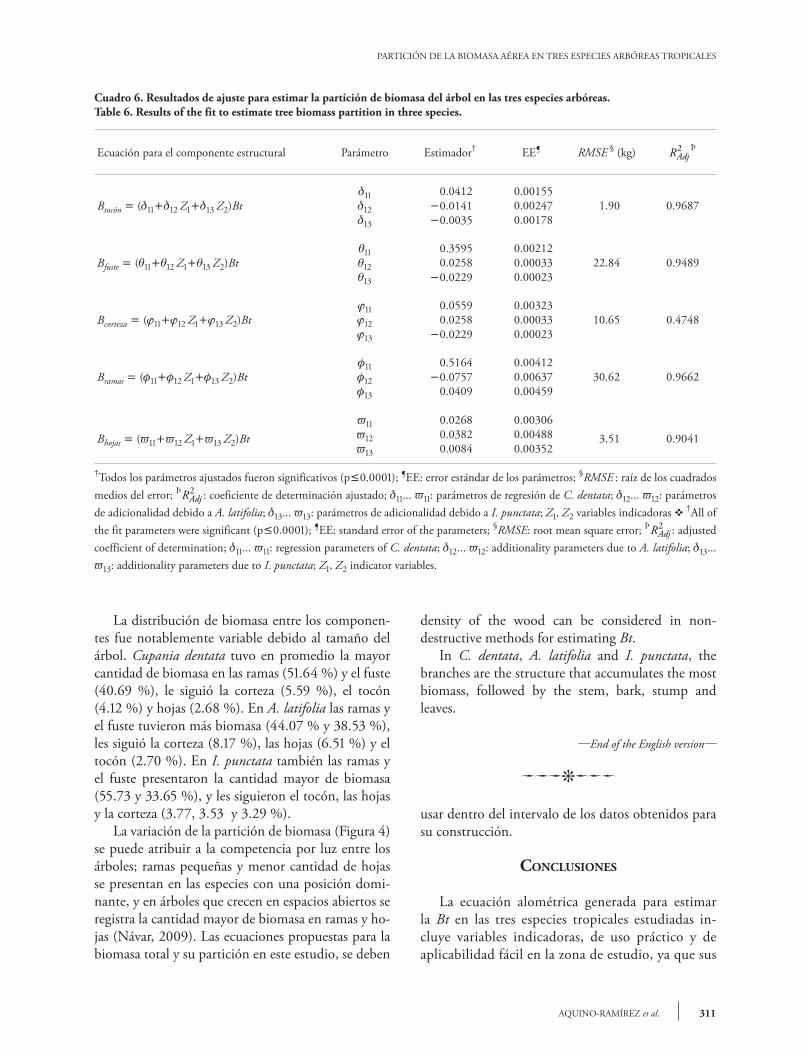
Cuadro 6. Resultados de ajuste para estimar la partición de biomasa del árbol en las tres especies arbóreas.Table 6. Results of the fit to estimate tree biomass partition in three species.
Ecuación para el componente estructural Parámetro Estimador† EE¶ RMSE § (kg) RAdj2 Þ
Btocón (1112 Z113 Z2)Bt11 0.0412 0.00155
1.90 0.968712 0.0141 0.0024713 0.0035 0.00178
Bfuste (1112 Z113 Z2)Bt11 0.3595 0.00212
22.84 0.948912 0.0258 0.0003313 0.0229 0.00023
Bcorteza (1112 Z113 Z2)Bt11 0.0559 0.00323
10.65 0.474812 0.0258 0.0003313 0.0229 0.00023
Bramas (1112 Z113 Z2)Bt11 0.5164 0.00412
30.62 0.966212 0.0757 0.0063713 0.0409 0.00459
Bhojas (1112 Z113 Z2)Bt11 0.0268 0.00306
3.51 0.904112 0.0382 0.0048813 0.0084 0.00352
†Todos los parámetros ajustados fueron significativos (p0.0001); ¶EE: error estándar de los parámetros; §RMSE : raíz de los cuadrados medios del error; ÞRAdj
2 : coeficiente de determinación ajustado; 11... 11: parámetros de regresión de C. dentata; 12... 12: parámetros de adicionalidad debido a A. latifolia; 13... 13: parámetros de adicionalidad debido a I. punctata; Z1, Z2 variables indicadoras v †All of the fit parameters were significant (p0.0001); ¶EE: standard error of the parameters; §RMSE: root mean square error; ÞRAdj
2 : adjusted coefficient of determination; 11... 11: regression parameters of C. dentata; 12... 12: additionality parameters due to A. latifolia; 13... 13: additionality parameters due to I. punctata; Z1, Z2 indicator variables.
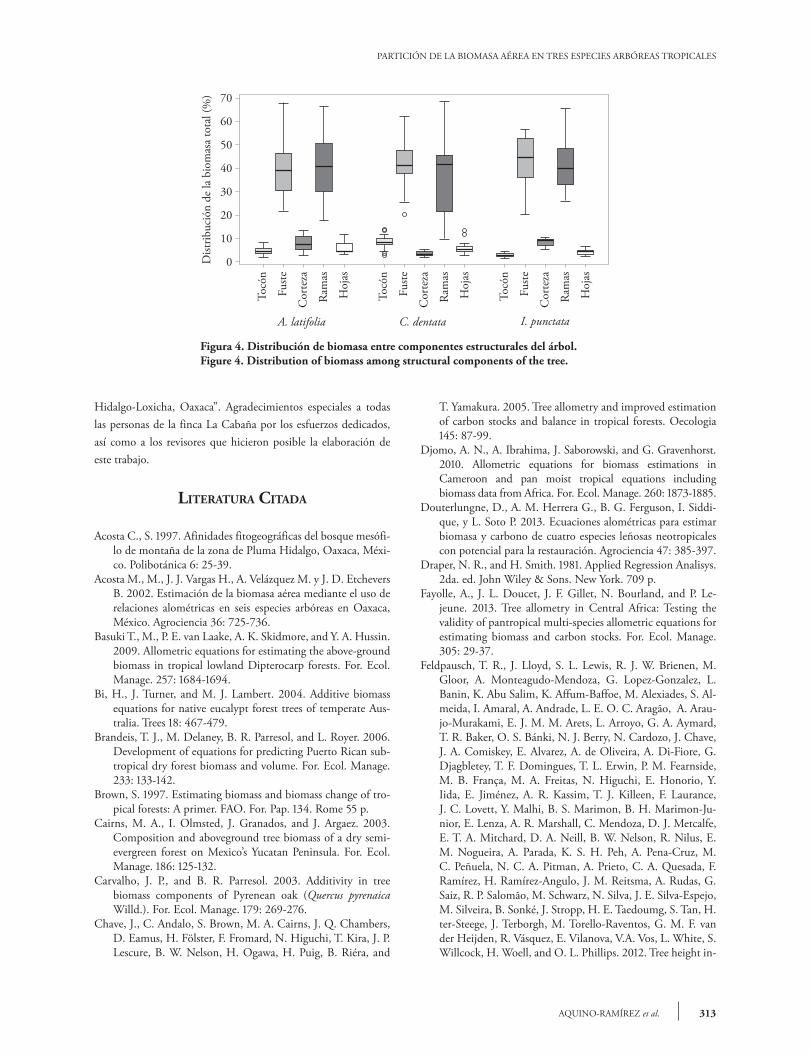
La distribución de biomasa entre los componen-tes fue notablemente variable debido al tamaño del árbol. Cupania dentata tuvo en promedio la mayor cantidad de biomasa en las ramas (51.64 %) y el fuste (40.69 %), le siguió la corteza (5.59 %), el tocón (4.12 %) y hojas (2.68 %). En A. latifolia las ramas y el fuste tuvieron más biomasa (44.07 % y 38.53 %), les siguió la corteza (8.17 %), las hojas (6.51 %) y el tocón (2.70 %). En I. punctata también las ramas y el fuste presentaron la cantidad mayor de biomasa (55.73 y 33.65 %), y les siguieron el tocón, las hojas y la corteza (3.77, 3.53 y 3.29 %). La variación de la partición de biomasa (Figura 4) se puede atribuir a la competencia por luz entre los árboles; ramas pequeñas y menor cantidad de hojas se presentan en las especies con una posición domi-nante, y en árboles que crecen en espacios abiertos se registra la cantidad mayor de biomasa en ramas y ho-jas (Návar, 2009). Las ecuaciones propuestas para la biomasa total y su partición en este estudio, se deben
density of the wood can be considered in non-destructive methods for estimating Bt. In C. dentata, A. latifolia and I. punctata, the branches are the structure that accumulates the most biomass, followed by the stem, bark, stump and leaves.
—End of the English version—
pppvPPP
usar dentro del intervalo de los datos obtenidos para su construcción.
conclusIones
La ecuación alométrica generada para estimar la Bt en las tres especies tropicales estudiadas in-cluye variables indicadoras, de uso práctico y de aplicabilidad fácil en la zona de estudio, ya que sus
312
AGROCIENCIA, 1 de abril - 15 de mayo, 2015
VOLUMEN 49, NÚMERO 3
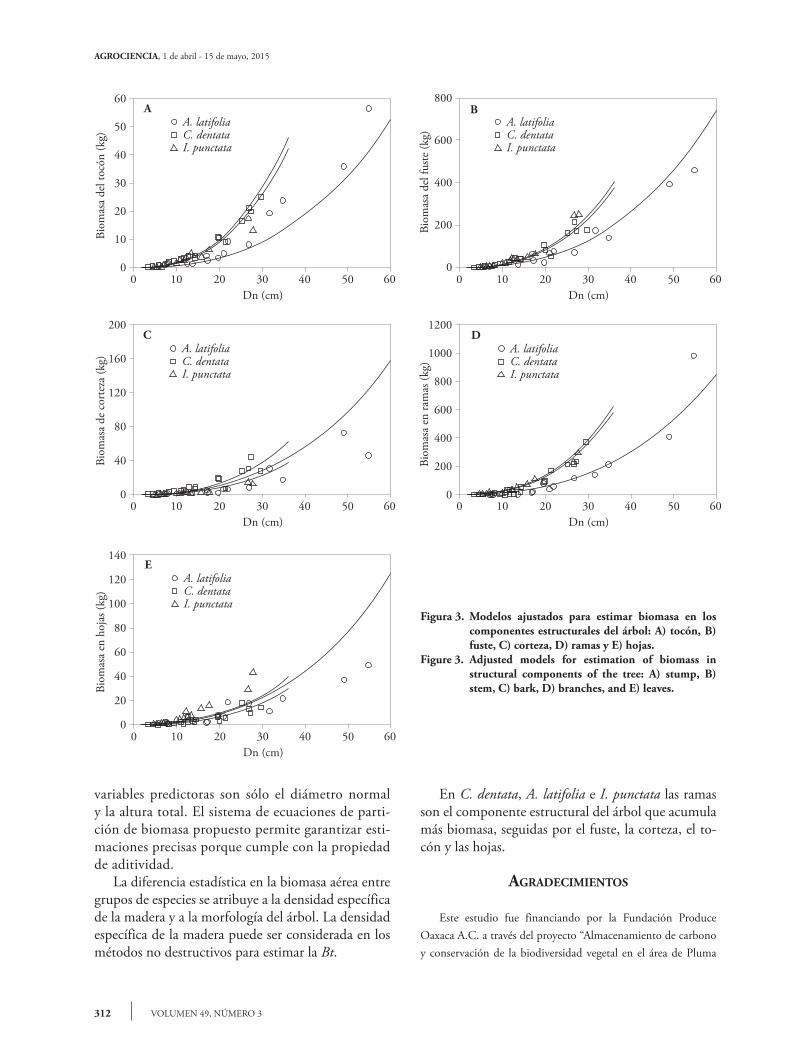
Figura 3. Modelos ajustados para estimar biomasa en los componentes estructurales del árbol: A) tocón, B) fuste, C) corteza, D) ramas y E) hojas.
Figure 3. Adjusted models for estimation of biomass in structural components of the tree: A) stump, B) stem, C) bark, D) branches, and E) leaves.
0 10 20 30 40 50 60Dn (cm)
A. latifoliaC. dentataI. punctata
60
50
40
30
20
10
0
Biom
asa
del t
ocón
(kg)
AA. latifoliaC. dentataI. punctata
B
0 10 20 30 40 50 60Dn (cm)
800
600
400
200
0
Biom
asa
del f
uste
(kg)
0 10 20 30 40 50 60Dn (cm)
A. latifoliaC. dentataI. punctata
C200
160
120
80
40
0
Biom
asa
de c
orte
za (k
g)
A. latifoliaC. dentataI. punctata
D
0 10 20 30 40 50 60Dn (cm)
1200
1000
800
600
400
200
0
Biom
asa
en ra
mas
(kg)
0 10 20 30 40 50 60Dn (cm)
A. latifoliaC. dentataI. punctata
E140
120
100
80
60
40
20
0
Biom
asa
en h
ojas
(kg)
variables predictoras son sólo el diámetro normal y la altura total. El sistema de ecuaciones de parti-ción de biomasa propuesto permite garantizar esti-maciones precisas porque cumple con la propiedad de aditividad. La diferencia estadística en la biomasa aérea entre grupos de especies se atribuye a la densidad específica de la madera y a la morfología del árbol. La densidad específica de la madera puede ser considerada en los métodos no destructivos para estimar la Bt.
En C. dentata, A. latifolia e I. punctata las ramas son el componente estructural del árbol que acumula más biomasa, seguidas por el fuste, la corteza, el to-cón y las hojas.
AgRAdecImIentos
Este estudio fue financiando por la Fundación Produce Oaxaca A.C. a través del proyecto “Almacenamiento de carbono y conservación de la biodiversidad vegetal en el área de Pluma
PARTICIÓN DE LA BIOMASA AÉREA EN TRES ESPECIES ARBÓREAS TROPICALES
313AQUINO-RAMÍREZ et al.
Figura 4. Distribución de biomasa entre componentes estructurales del árbol.Figure 4. Distribution of biomass among structural components of the tree.
Tocó
n
Fuste
Cor
teza
Ram
as
Hoj
as
Tocó
n
Fuste
Cor
teza
Ram
as
Hoj
as
Tocó
n
Fuste
Cor
teza
Ram
as
Hoj
as
A. latifolia C. dentata I. punctata
70
60
50
40
30
20
10
0Dist
ribuc
ión
de la
bio
mas
a to
tal (
%)
Hidalgo-Loxicha, Oaxaca”. Agradecimientos especiales a todas las personas de la finca La Cabaña por los esfuerzos dedicados, así como a los revisores que hicieron posible la elaboración de este trabajo.
lIteRAtuRA cItAdA
Acosta C., S. 1997. Afinidades fitogeográficas del bosque mesófi-lo de montaña de la zona de Pluma Hidalgo, Oaxaca, Méxi-co. Polibotánica 6: 25-39.
Acosta M., M., J. J. Vargas H., A. Velázquez M. y J. D. Etchevers B. 2002. Estimación de la biomasa aérea mediante el uso de relaciones alométricas en seis especies arbóreas en Oaxaca, México. Agrociencia 36: 725-736.
Basuki T., M., P. E. van Laake, A. K. Skidmore, and Y. A. Hussin. 2009. Allometric equations for estimating the above-ground biomass in tropical lowland Dipterocarp forests. For. Ecol. Manage. 257: 1684-1694.
Bi, H., J. Turner, and M. J. Lambert. 2004. Additive biomass equations for native eucalypt forest trees of temperate Aus-tralia. Trees 18: 467-479.
Brandeis, T. J., M. Delaney, B. R. Parresol, and L. Royer. 2006. Development of equations for predicting Puerto Rican sub-tropical dry forest biomass and volume. For. Ecol. Manage. 233: 133-142.
Brown, S. 1997. Estimating biomass and biomass change of tro-pical forests: A primer. FAO. For. Pap. 134. Rome 55 p.
Cairns, M. A., I. Olmsted, J. Granados, and J. Argaez. 2003. Composition and aboveground tree biomass of a dry semi-evergreen forest on Mexico’s Yucatan Peninsula. For. Ecol. Manage. 186: 125-132.
Carvalho, J. P., and B. R. Parresol. 2003. Additivity in tree biomass components of Pyrenean oak (Quercus pyrenaica Willd.). For. Ecol. Manage. 179: 269-276.
Chave, J., C. Andalo, S. Brown, M. A. Cairns, J. Q. Chambers, D. Eamus, H. Fölster, F. Fromard, N. Higuchi, T. Kira, J. P. Lescure, B. W. Nelson, H. Ogawa, H. Puig, B. Riéra, and
T. Yamakura. 2005. Tree allometry and improved estimation of carbon stocks and balance in tropical forests. Oecologia 145: 87-99.
Djomo, A. N., A. Ibrahima, J. Saborowski, and G. Gravenhorst. 2010. Allometric equations for biomass estimations in Cameroon and pan moist tropical equations including biomass data from Africa. For. Ecol. Manage. 260: 1873-1885.
Douterlungne, D., A. M. Herrera G., B. G. Ferguson, I. Siddi-que, y L. Soto P. 2013. Ecuaciones alométricas para estimar biomasa y carbono de cuatro especies leñosas neotropicales con potencial para la restauración. Agrociencia 47: 385-397.
Draper, N. R., and H. Smith. 1981. Applied Regression Analisys. 2da. ed. John Wiley & Sons. New York. 709 p.
Fayolle, A., J. L. Doucet, J. F. Gillet, N. Bourland, and P. Le-jeune. 2013. Tree allometry in Central Africa: Testing the validity of pantropical multi-species allometric equations for estimating biomass and carbon stocks. For. Ecol. Manage. 305: 29-37.
Feldpausch, T. R., J. Lloyd, S. L. Lewis, R. J. W. Brienen, M. Gloor, A. Monteagudo-Mendoza, G. Lopez-Gonzalez, L. Banin, K. Abu Salim, K. Affum-Baffoe, M. Alexiades, S. Al-meida, I. Amaral, A. Andrade, L. E. O. C. Aragão, A. Arau-jo-Murakami, E. J. M. M. Arets, L. Arroyo, G. A. Aymard, T. R. Baker, O. S. Bánki, N. J. Berry, N. Cardozo, J. Chave, J. A. Comiskey, E. Alvarez, A. de Oliveira, A. Di-Fiore, G. Djagbletey, T. F. Domingues, T. L. Erwin, P. M. Fearnside, M. B. França, M. A. Freitas, N. Higuchi, E. Honorio, Y. Iida, E. Jiménez, A. R. Kassim, T. J. Killeen, F. Laurance, J. C. Lovett, Y. Malhi, B. S. Marimon, B. H. Marimon-Ju-nior, E. Lenza, A. R. Marshall, C. Mendoza, D. J. Metcalfe, E. T. A. Mitchard, D. A. Neill, B. W. Nelson, R. Nilus, E. M. Nogueira, A. Parada, K. S. H. Peh, A. Pena-Cruz, M. C. Peñuela, N. C. A. Pitman, A. Prieto, C. A. Quesada, F. Ramírez, H. Ramírez-Angulo, J. M. Reitsma, A. Rudas, G. Saiz, R. P. Salomão, M. Schwarz, N. Silva, J. E. Silva-Espejo, M. Silveira, B. Sonké, J. Stropp, H. E. Taedoumg, S. Tan, H. ter-Steege, J. Terborgh, M. Torello-Raventos, G. M. F. van der Heijden, R. Vásquez, E. Vilanova, V.A. Vos, L. White, S. Willcock, H. Woell, and O. L. Phillips. 2012. Tree height in-

314
AGROCIENCIA, 1 de abril - 15 de mayo, 2015
VOLUMEN 49, NÚMERO 3
tegrated into pantropical forest biomass estimates. Biogeosci. Discuss. 9: 2567-2622.
Feldpausch, T. R., L. Banin, O. L. Phillips, T. R. Baker, S. L. Lewis, C. A. Quesada, K. Affum-Baffoe, E. Arets, N. J. Berry, and M. Bird. 2011. Height-diameter allometry of tropical forest trees. Biogeosciences 8: 1081-1106.
Fuentes S., M. 1998. Propiedades tecnológicas de las maderas mexicanas, de importancia en la construcción. Revista Cha-pingo Serie Ciencias Forestales y del Ambiente 4: 221-229.
Hitchcock, H. C., and J. P. McDonnell. 1979. Biomass measurement: a synthesis of the literature. In: Proceedings of the Forest Inventory Workshop, SAF-IUFRO. Ft. Collins, Colorado. pp: 596-614.
INEGI. 2005. Conjunto de datos vectoriales del uso del suelo y vegetación, Serie III (continuo nacional), escala 1:250 000. Instituto Nacional de Estadística, Geografía e Informática, Aguascalientes, México.
INEGI. 2009. Prontuario de información geográfica municipal de los Estados Unidos Mexicanos. http://www3.inegi.org.mx/sistemas/mexicocifras/datosgeograficos/20/20071.pdf. (Consulta: septiembre 2013).
Kuyah, S., J. Dietz, C. Muthuri, R. Jamnadass, P. Mwangi, R. Coe, and H. Neufeldt. 2012. Allometric equations for estimating biomass in agricultural landscapes: I. Aboveground biomass. Agric. Ecosyst. Environ. 158: 216-224.
Luna-José, A. D. L., y B. Rendón-Aguilar. 2008. Recursos vege-tales útiles en diez comunidades de la Sierra Madre del Sur, Oaxaca, México. Polibotánica 26: 193-242.
Monroy, R. C., y J. J. Návar C. 2004. Ecuaciones de adi-tividad para estimar componentes de biomasa de Hevea brasiliensis Mull. Arg., en Veracruz, México. Madera y Bosques 10: 29-43.
Montgomery D., C., and E. A. Peck. 1982. Introduction to Linear Regression Analysis. Wiley. New York. 504 p.
Montgomery, D. C., E. A. Peck, y G. G. Vining. 2005. Intro-ducción al Análisis de Regresión Lineal. Tercera edición. Ed. Continental. México. 742 p.
Návar, J. 2009. Allometric equations for tree species and carbon stocks for forests of northwestern Mexico. For. Ecol. Mana-ge. 257: 427-434.
Nogueira, E. M., P. M. Fearnside, B. W. Nelson, R. I. Barbosa and E. W. H. Keizer. 2008. Estimates of forest biomass in the Brazilian Amazon: New allometric equations and ad-
justments to biomass from wood-volume inventories. For. Ecol. Manage. 256: 1853-1867.
Parresol, B. 1999. Assessing tree and stand biomass: a review with examples and critical comparisons. For. Sci. 45: 573-593.
Parresol, B. R. 2001. Additivity of nonlinear biomass equations. Can. J. For. Res. 31: 865-878.
Pennington, T. D., y K. Sarukhán. 2005. Manual para la Iden-tificación de Campo de los Principales Árboles Tropicales de México. Tercera ed. Inst. Nal. Invest. Forest. SAG. Mé-xico. 523 p.
Pompa-García, M., y J. I. Yerena-Yamallel. 2014. Concentración de carbono en Pinus cembroides Zucc: fuente potencial de mitigación del calentamiento global. Revista Chapingo Serie Ciencias Forestales y del Ambiente 20: 169-175.
Rojo M., G. E., J. Jasso M., J. J. Vargas H., D. J. Palma L. y A. Velázquez M. 2005. Biomasa aérea en plantaciones comer-ciales de hule (Hevea brasiliensis Mull. Arg.) en el estado de Oaxaca, México. Agrociencia 39: 449-456.
Rutishauser, E., F. Noor’an, Y. Laumonier, J. Halperin, Rufi’ie, K. Hergoualc’h, and L.Verchot. 2013. Generic allometric models including height best estimate forest biomass and carbon stocks in Indonesia. For. Ecol. Ma-nage. 307: 219-225.
SAS Institute Inc. 2004. SAS/ETS® 9.1 User’s Guide. Cary, NC. 2416 p.
Segura, M., M. Kanninen, and D. Suárez. 2006. Allometric mo-dels for estimating aboveground biomass of shade trees and coffee bushes grown together. Agrofor. Syst. 68: 143-150.
Sotomayor C., J. R. 2008. Segunda edición. Tabla Fitecma de clasificación de características mecánicas de maderas mexica-nas. FITECMA. UMSNH. Formato: 3060 cm.
Tamarit U., J. C., y M. Fuentes S. 2003. Parámetros de humedad de 63 maderas latifoliadas mexicanas en función de su densi-dad básica. Revista Chapingo Serie Ciencias Forestales y del Ambiente 9:155-164.
Tamarit U., J. C., y J. L. López T. 2007. Xilotecnología de los principales árboles tropicales de México. Libro técnico No. 3. INIFAP-CIR Golfo Centro, Campo Experimental San Martinito, Tlahuapan, Puebla, México.
Ventura-Aquino, Y., B. Rendón, S. Rebollar and G. Hernández. 2008. Use and conservation of forest resources in the municipality of San Agustín Loxicha, Sierra Madre del Sur, Oaxaca, México. Agrofor. Syst. 73: 167-180.