abrasive-free copper chemical mechanical polishing in...
TRANSCRIPT
Qingjun QinAdvisor: Professor R. Shankar Subramanian
Center for Advanced Materials Processing (CAMP)Department of Chemical & Biomolecular Engineering
Clarkson UniversityPotsdam, New York 13699
Abrasive-free Copper Chemical Mechanical Polishing in an
Orbital Polisher

ObjectiveBackgroundExperimental WorkModel developmentResults and DiscussionConclusionsSuggested future workAcknowledgements
Outline
Objective
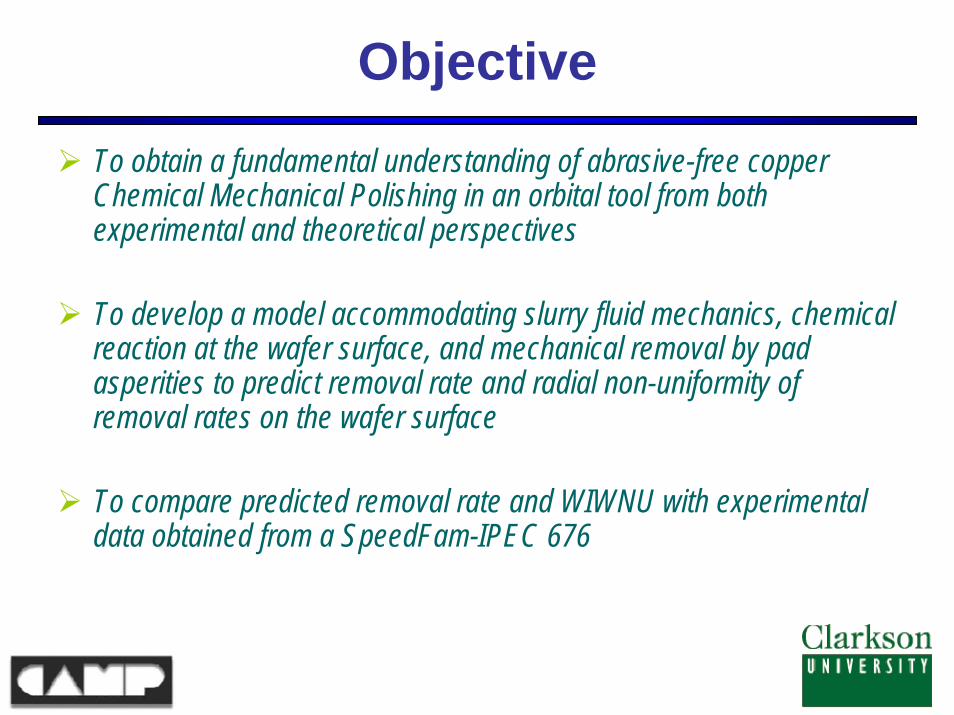
To obtain a fundamental understanding of abrasive-free copper Chemical Mechanical Polishing in an orbital tool from both experimental and theoretical perspectives
To develop a model accommodating slurry fluid mechanics, chemical reaction at the wafer surface, and mechanical removal by pad asperities to predict removal rate and radial non-uniformity of removal rates on the wafer surface
To compare predicted removal rate and WIWNU with experimental data obtained from a SpeedFam-IPEC 676

BackgroundSpecial features of orbital tool
Wafer
Pad
Platen
Slurry Flow
Orbit circle of the pad center
Center line of platen/pad
Axis of wafer rotation
Wafer
Pad
Reference: Oliver et al. (2004)
Experimental WorkExperiment conditions
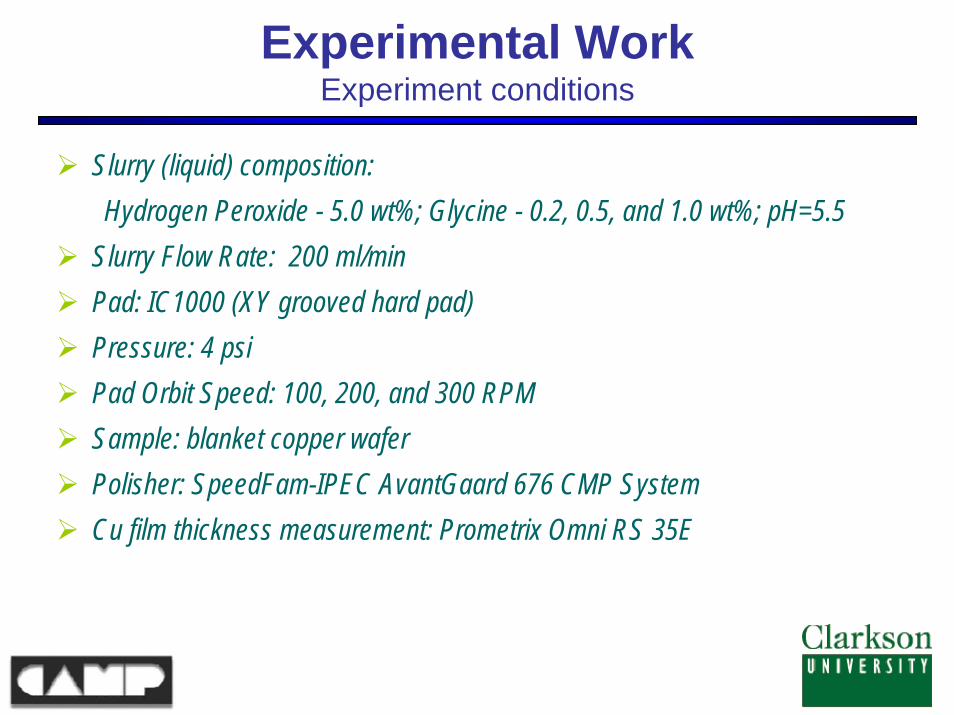
Slurry (liquid) composition: Hydrogen Peroxide - 5.0 wt%; Glycine - 0.2, 0.5, and 1.0 wt%; pH=5.5
Slurry Flow Rate: 200 ml/minPad: IC1000 (XY grooved hard pad)Pressure: 4 psiPad Orbit Speed: 100, 200, and 300 RPMSample: blanket copper waferPolisher: SpeedFam-IPEC AvantGaard 676 CMP System Cu film thickness measurement: Prometrix Omni RS 35E
Experimental WorkGlycine conc. & pad orbit speed Impact
0.20.51.0
Glycine Conc. (wt%)
0 50 100 150 200 250 300 350Pad Orbit Speed (RPM)
400050
100150200250300350
Rem
oval
Rat
e (n
m/m
in) 400
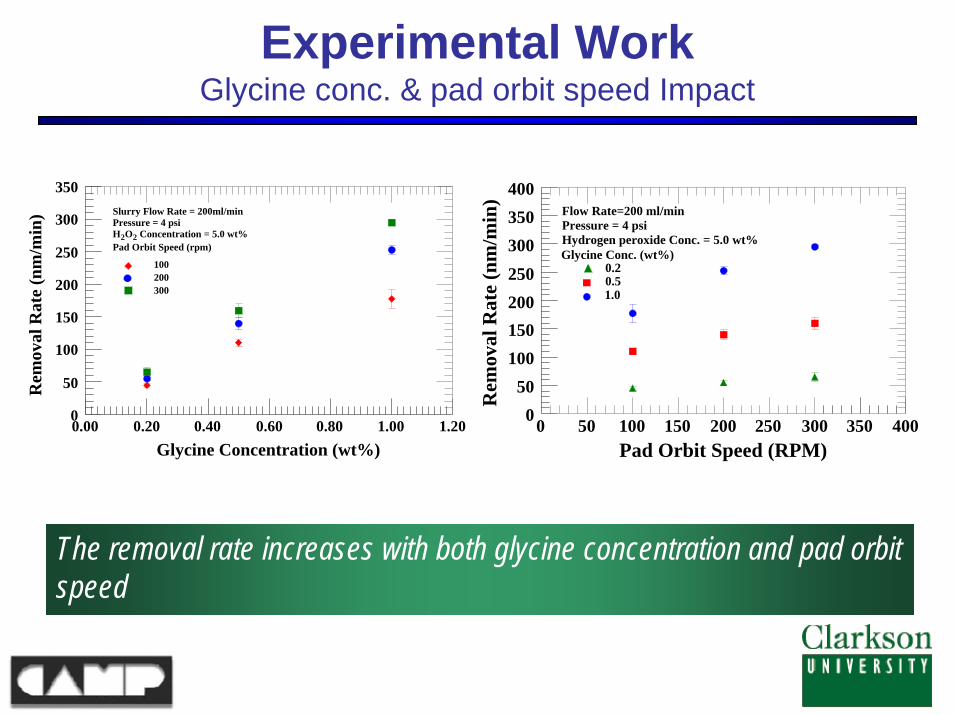
Flow Rate=200 ml/minPressure = 4 psiHydrogen peroxide Conc. = 5.0 wt%
The removal rate increases with both glycine concentration and pad orbit speed
Glycine Concentration (wt%)0.00 0.20 0.40 0.60 0.80 1.00 1.20
Rem
oval
Rat
e (n
m/m
in)
0
50
100
150
200
250
300
350
100200300
Slurry Flow Rate = 200ml/minPressure = 4 psiH2O2 Concentration = 5.0 wt%Pad Orbit Speed (rpm)
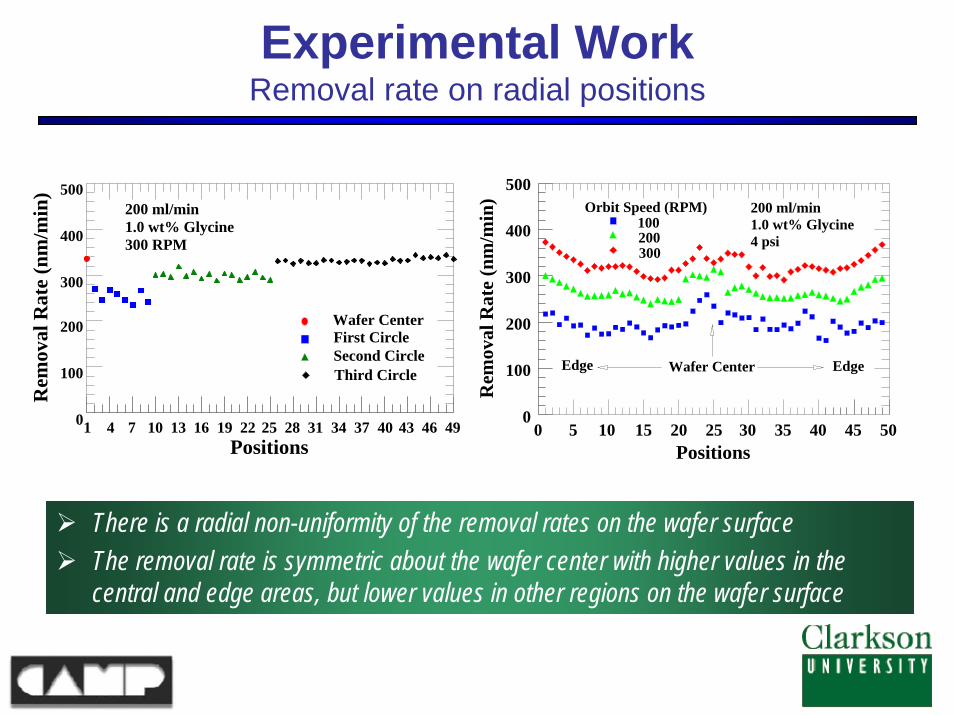
Experimental WorkRemoval rate on radial positions
Orbit Speed (RPM)100200300
200 ml/min1.0 wt% Glycine4 psi
0 5 10 15 20 25 30 35 40 45 50Positions
0
100
200
300
400
500
Rem
oval
Rat
e (n
m/m
in)
Edge Wafer Center Edge
There is a radial non-uniformity of the removal rates on the wafer surfaceThe removal rate is symmetric about the wafer center with higher values in the central and edge areas, but lower values in other regions on the wafer surface
0
100
200
300
400
500
Rem
oval
Rat
e (n
m/m
in)
1 4 7 10 13 16 19 22 25 28 31 34 37 40 43 46 49Positions
Wafer Center
Second CircleFirst Circle
Third Circle
200 ml/min1.0 wt% Glycine300 RPM

Model DevelopmentMain idea to predict removal rate
( ) ( ) 3
1 1
g mN Nji
m i ji ji j
lh dMR f C f CV V dA= =
= + +∑ ∑
0.127
0.127−
Y i( )
0.1270.127− X i( )
( ) 3= +m f dMR CdA
Y i( )
X i( )
( ) ( )( ) ( )
0 0
0 0
cos cos
sin sinw o o
w o o
x d t R t
y t R t
ρ β ω θ ω
ρ β ω θ ω
= + + − +
= + − +
Y i( )
X i( )
Y i( )
X i( )
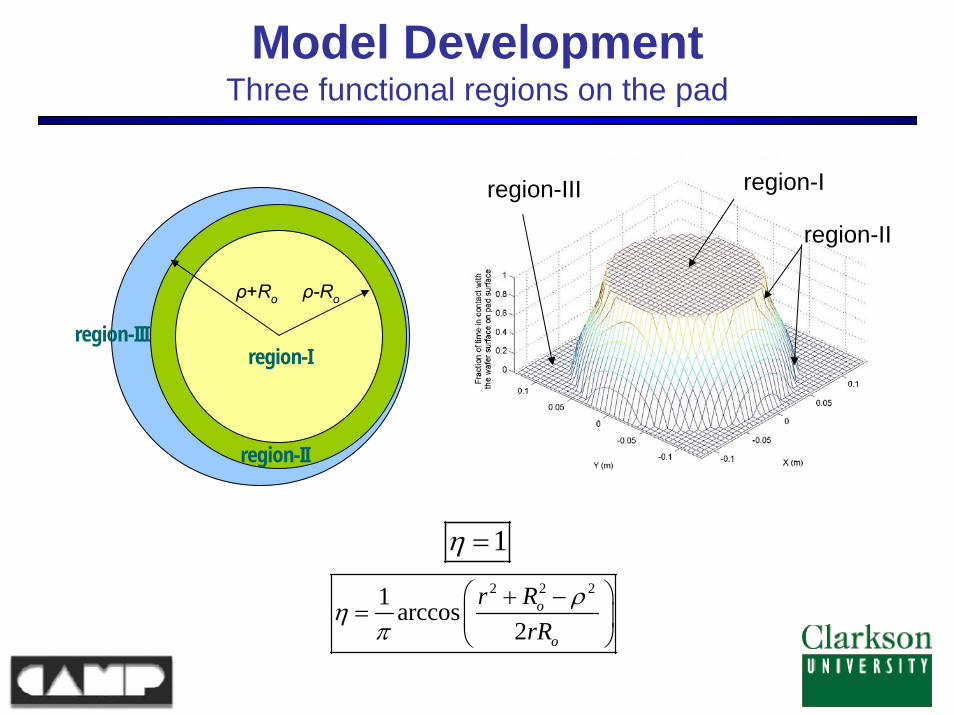
Model DevelopmentThree functional regions on the pad
1η =
region-I
region-II
region-III
ρ-Roρ+Ro
2 2 21 arccos2
o
o
r RrR
ρηπ
⎛ ⎞+ −= ⎜ ⎟
⎝ ⎠
region-I
region-II
region-III
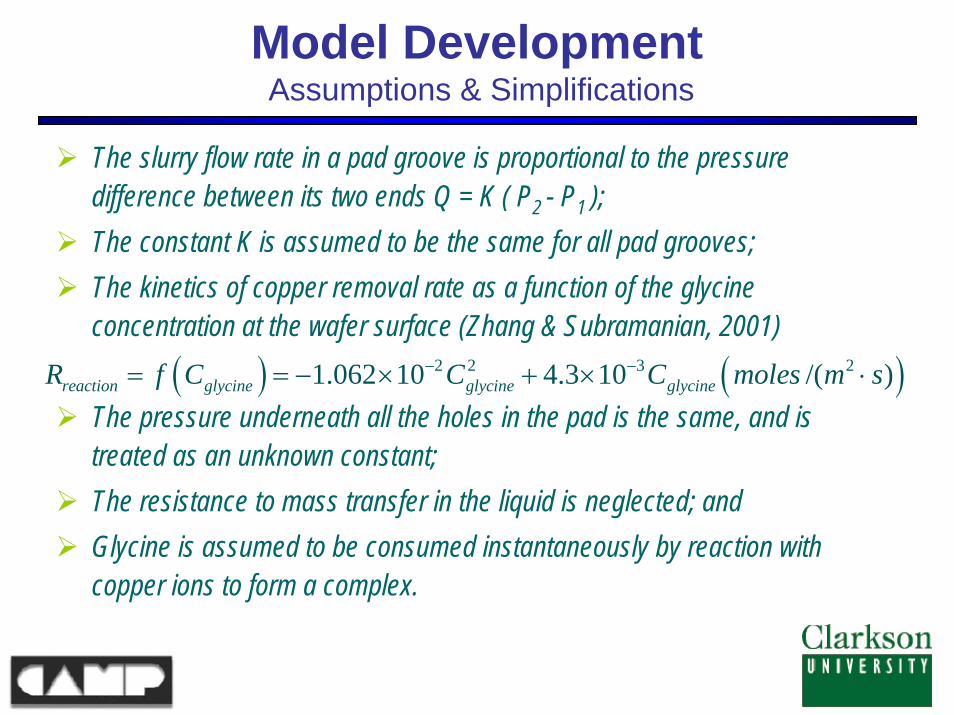
Model DevelopmentAssumptions & Simplifications
The slurry flow rate in a pad groove is proportional to the pressure difference between its two ends Q = K ( P2 - P1 );The constant K is assumed to be the same for all pad grooves;The kinetics of copper removal rate as a function of the glycineconcentration at the wafer surface (Zhang & Subramanian, 2001)
The pressure underneath all the holes in the pad is the same, and is treated as an unknown constant;The resistance to mass transfer in the liquid is neglected; andGlycine is assumed to be consumed instantaneously by reaction with copper ions to form a complex.
( ) ( )2 2 3 21.062 10 4.3 10 /( )reaction glycine glycine glycineR f C C C moles m s− −= = − × + × ⋅
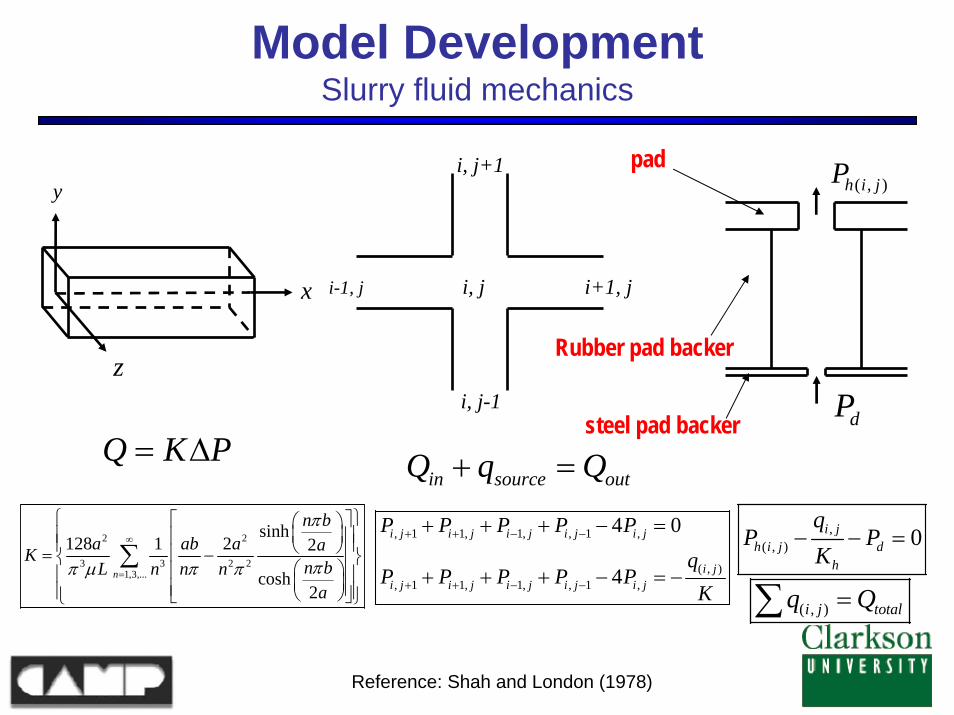
Model DevelopmentSlurry fluid mechanics
Q K P= Δ
, 1 1, 1, , 1 ,
( , ), 1 1, 1, , 1 ,
4 0
4
i j i j i j i j i j
i ji j i j i j i j i j
P P P P P
qP P P P P
K
+ + − −
+ + − −
+ + + − =
+ + + − = −
,( , ) 0i j
h i j dh
qP P
K− − =
i, j i+1, ji-1, j
i, j-1
i, j+1
in source outQ q Q+ =
y
x
z
2 2
3 3 2 21,3,...
sinh128 1 2 2
cosh2
n
n ba ab a aK
n bL n n na
π
ππ μ π π
∞
=
⎧ ⎫⎡ ⎤⎛ ⎞⎜ ⎟⎪ ⎪⎢ ⎥⎪ ⎪⎝ ⎠⎢ ⎥= −⎨ ⎬⎛ ⎞⎢ ⎥⎪ ⎪⎜ ⎟⎢ ⎥⎪ ⎪⎝ ⎠⎣ ⎦⎩ ⎭
∑
( , )i j totalq Q=∑
Reference: Shah and London (1978)
( , )h i jP
dP
pad
Rubber pad backer
steel pad backer

Model DevelopmentPressure Distribution
Pressures near the pad center are much higher than those in the pad edge areaThe pressure drops fast near the pad edge areaSlurry flow rates in each groove can be obtained by using this pressure distribution and Q = K ( P2 - P1 )
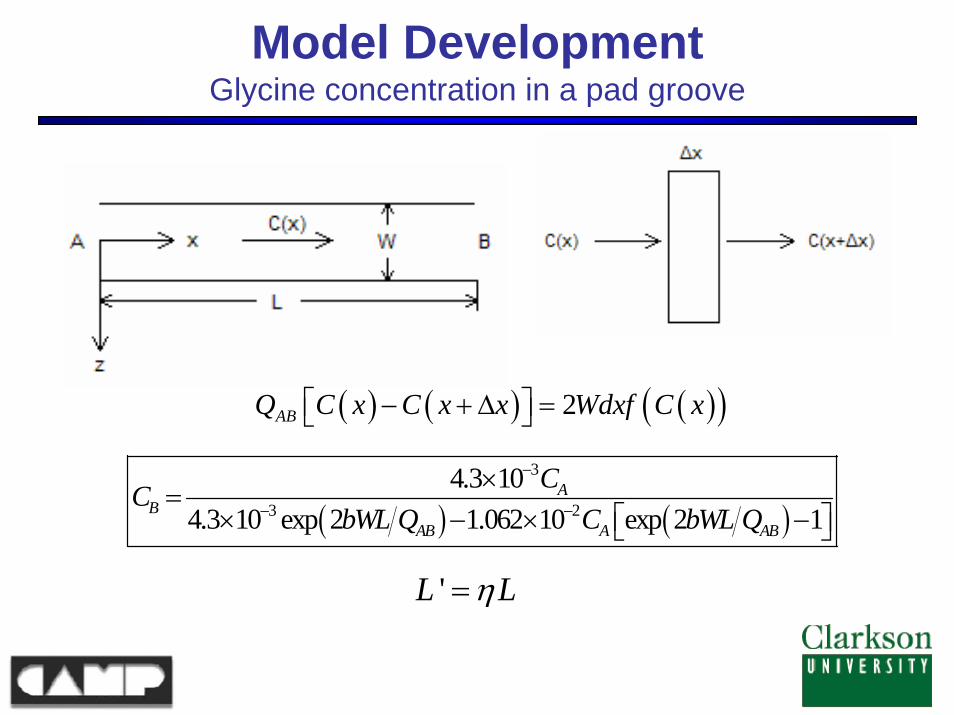
Model DevelopmentGlycine concentration in a pad groove
( ) ( )3
3 2
4.3 104.3 10 exp 2 1.062 10 exp 2 1
AB
AB A AB
CCbWL Q C bWL Q
−
− −
×=
× − × −⎡ ⎤⎣ ⎦
'L Lη=
( ) ( ) ( )( )2⎡ ⎤− + Δ =⎣ ⎦ABQ C x C x x Wdxf C x

Model DevelopmentComputation of glycine concentration distribution
1C
Calculation of the glycine concentrations at all intersections from 61 known concentrations at holes is an iterative computation
2C
3C1C
1C
2C
1C 2C
0C
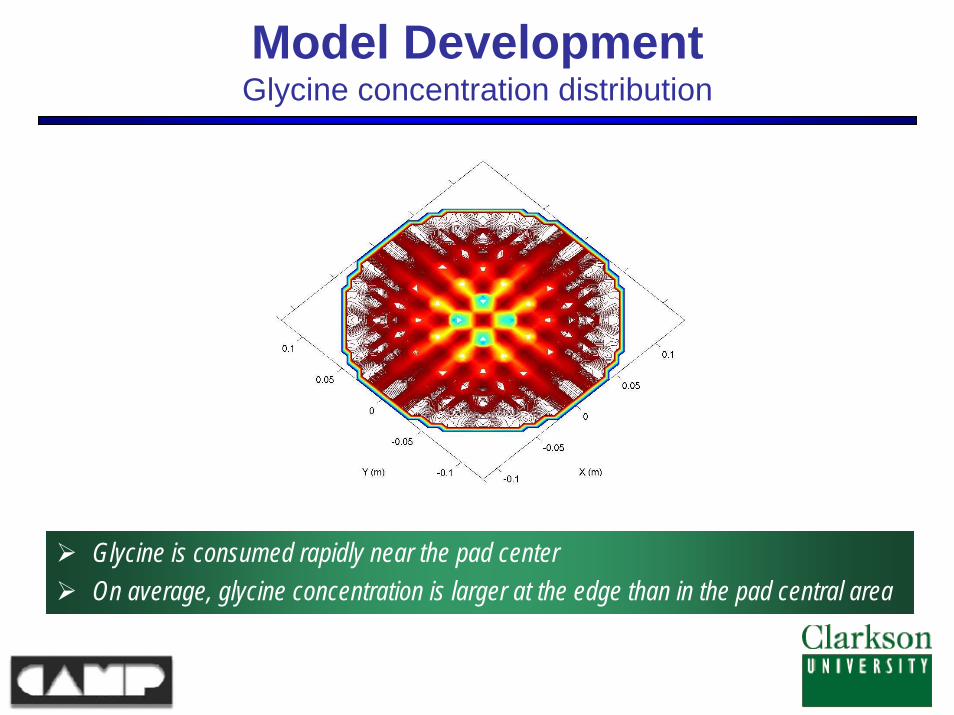
Model DevelopmentGlycine concentration distribution
Glycine is consumed rapidly near the pad centerOn average, glycine concentration is larger at the edge than in the pad central area

Model DevelopmentAverage glycine concentration in path annulus
=∑∑
gi gi
gg
i
C AC
A
Radial Position (m)0.00 0.02 0.04 0.06 0.08 0.10
Gly
cine
Con
cent
ratio
n (m
ol/m
3 )
0
50
100
150
C0 = 26.6 mol/m3
C0 = 66.6 mol/m3
C0 = 133.2 mol/m3

Model DevelopmentMechanical removal by pad asperities
Pad Orbit Speed (rpm)0 50 100 150 200 250 300 350 400
Mec
hani
cal R
emov
al R
ate
(nm
/min
)
0
50
100
150Glycine concentration (wt%)
0.20.51.0
( )mech expt modelR R f C= −
Glycine Concentration (wt%)0.00 0.20 0.40 0.60 0.80 1.00 1.20
Mec
hani
cal R
emov
al R
ate
(nm
/min
)
0
50
100
150
Pad orbit speed (rpm)100200300
( )model 2.16 model wpR f C C V= +
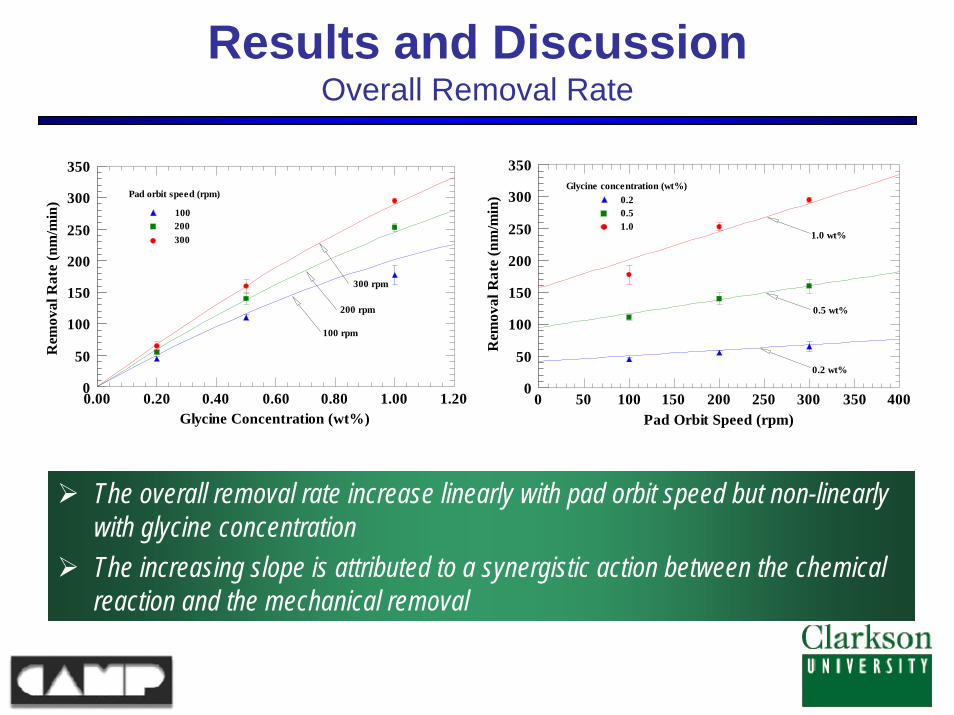
Results and DiscussionOverall Removal Rate
Glycine Concentration (wt%)0.00 0.20 0.40 0.60 0.80 1.00 1.20
Rem
oval
Rat
e (n
m/m
in)
0
50
100
150
200
250
300
350
100 rpm
200 rpm
300 rpm
100200300
Pad orbit speed (rpm)
Pad Orbit Speed (rpm)0 50 100 150 200 250 300 350 400
Rem
oval
Rat
e (n
m/m
in)
0
50
100
150
200
250
300
350
0.2 wt%
0.5 wt%
1.0 wt%
0.20.51.0
Glycine concentration (wt%)
The overall removal rate increase linearly with pad orbit speed but non-linearly with glycine concentrationThe increasing slope is attributed to a synergistic action between the chemical reaction and the mechanical removal
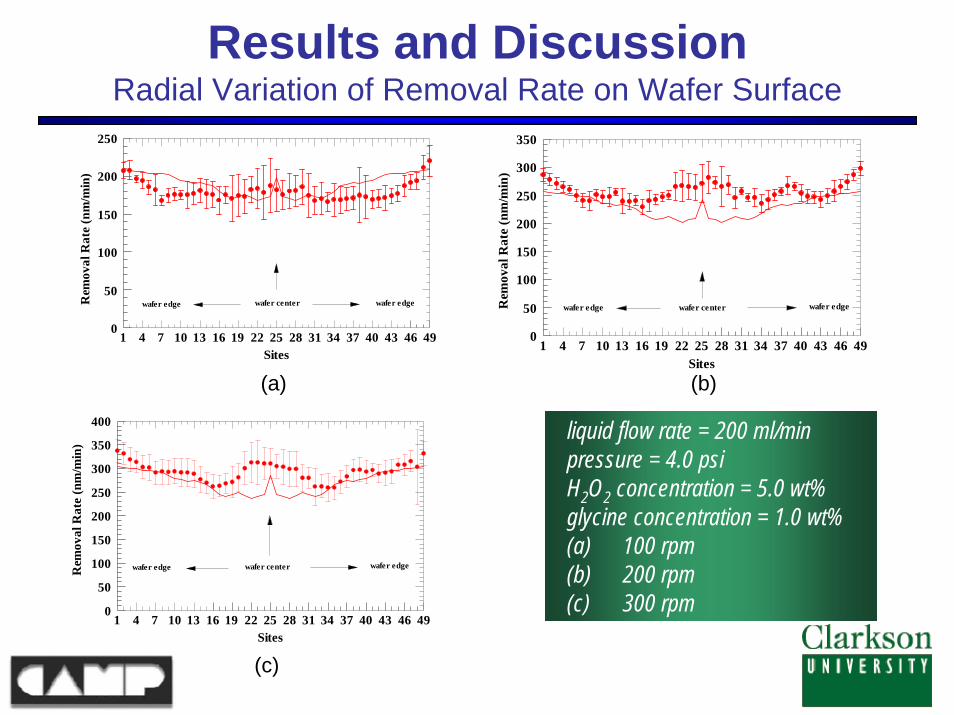
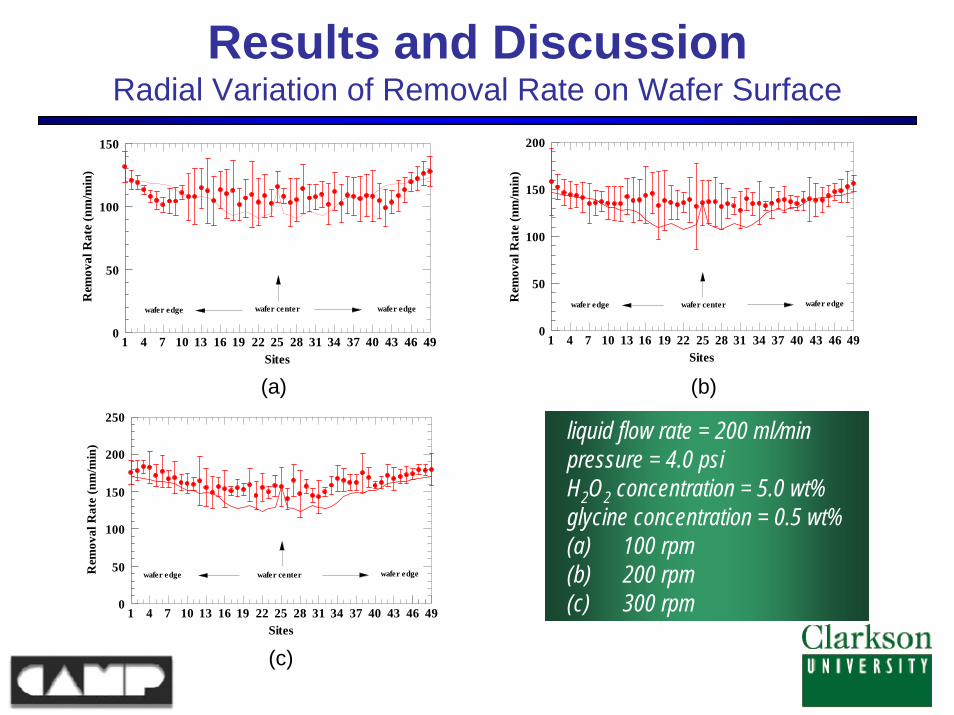
Results and DiscussionRadial Variation of Removal Rate on Wafer Surface
Sites1 4 7 10 13 16 19 22 25 28 31 34 37 40 43 46 49
Rem
oval
Rat
e (n
m/m
in)
0
50
100
150
200
250
wafer center wafer edgewafer edge
Sites1 4 7 10 13 16 19 22 25 28 31 34 37 40 43 46 49
Rem
oval
Rat
e (n
m/m
in)
0
50
100
150
200
250
300
350
wafer centerwafer edge wafer edge
Sites1 4 7 10 13 16 19 22 25 28 31 34 37 40 43 46 49
Rem
oval
Rat
e (n
m/m
in)
0
50
100
150
200
250
300
350
400
wafer center wafer edgewafer edge
(a)
(c)
(b)
liquid flow rate = 200 ml/minpressure = 4.0 psiH2O2 concentration = 5.0 wt%glycine concentration = 1.0 wt%(a) 100 rpm(b) 200 rpm(c) 300 rpm
Results and DiscussionRadial Variation of Removal Rate on Wafer Surface
Sites1 4 7 10 13 16 19 22 25 28 31 34 37 40 43 46 49
Rem
oval
Rat
e (n
m/m
in)
0
50
100
150
wafer center wafer edgewafer edge
Sites1 4 7 10 13 16 19 22 25 28 31 34 37 40 43 46 49
Rem
oval
Rat
e (n
m/m
in)
0
50
100
150
200
wafer center wafer edgewafer edge
Sites1 4 7 10 13 16 19 22 25 28 31 34 37 40 43 46 49
Rem
oval
Rat
e (n
m/m
in)
0
50
100
150
200
250
wafer edgewafer centerwafer edge
(a)
(c)
(b)
liquid flow rate = 200 ml/minpressure = 4.0 psiH2O2 concentration = 5.0 wt%glycine concentration = 0.5 wt%(a) 100 rpm(b) 200 rpm(c) 300 rpm
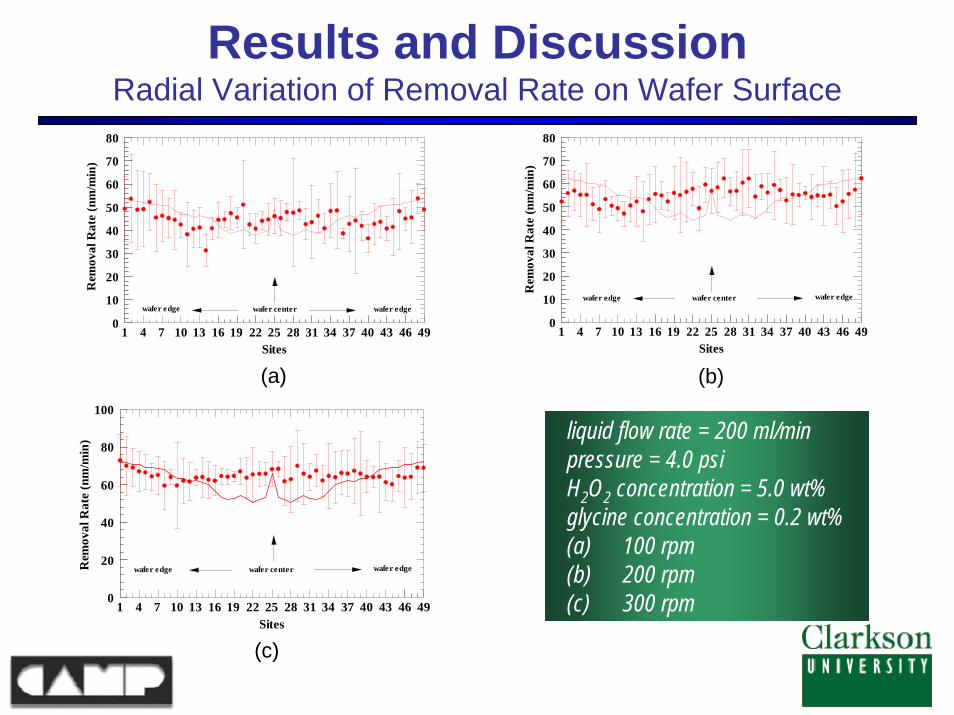
Results and DiscussionRadial Variation of Removal Rate on Wafer Surface
Sites1 4 7 10 13 16 19 22 25 28 31 34 37 40 43 46 49
Rem
oval
Rat
e (n
m/m
in)
0
10
20
30
40
50
60
70
80
wafer center wafer edgewafer edge
Sites1 4 7 10 13 16 19 22 25 28 31 34 37 40 43 46 49
Rem
oval
Rat
e (n
m/m
in)
0
10
20
30
40
50
60
70
80
wafer center wafer edgewafer edge
Sites1 4 7 10 13 16 19 22 25 28 31 34 37 40 43 46 49
Rem
oval
Rat
e (n
m/m
in)
0
20
40
60
80
100
wafer center wafer edgewafer edge
(a)
(c)
(b)
liquid flow rate = 200 ml/minpressure = 4.0 psiH2O2 concentration = 5.0 wt%glycine concentration = 0.2 wt%(a) 100 rpm(b) 200 rpm(c) 300 rpm
Conclusions
The discrepancy between the experimentally measured removal rateand the predicted chemical removal is attributed to mechanical removal of the reacted film by the pad asperities on the mesas
The overall removal rate of copper from the wafer surface depends approximately linearly on the pad orbit speed and non-linearly on the glycine concentration
There appears to be a synergy between the chemical action and mechanical action during CMP, which reinforces material removal and can be enhanced by increasing the glycine concentration
Conclusions(Continued)
The shape of the radial variation of the removal rate depends on the nominal glycine concentration in the experiment, but is independent of the nominal glycine concentration or the pad orbit speed in the modeling
For glycine concentrations of 0.5 wt% and 1.0 wt%, in most cases, the agreement between the predicted radial variation and the experimental radial variation is good near the wafer edge but not good in the central region of the wafer
Other factors can influence the radial variation of the removal rates
Suggested Future Work
The constant K in the assumption Q = K ( P2 - P1 ) will be different for different pad grooves, and needs to be calculated individually
Mass transport in the groove should be accommodated
For an accurate prediction of the radial non-uniformity of the removal rate on the wafer surface, the incoming-wafer film uniformity, down-force, wafer curvature, backside pressure, wafer-to-retaining-ring protrusion, retaining ring pressure, pad conditioning, etc. should be considered
The mechanical aspects of removal in abrasive-free polishing are worth pursuing in-depth
A better understanding of the slurry delivery system is needed to improve the accuracy of the predictions from the model
Acknowledgements
Professor R. Shankar Subramanian for his guidance throughout this research program both personally and professionally
Novellus Systems, Inc. (SpeedFam/IPEC) and Rohm and Haas Electronic Materials CMP Technologies for supplies and advice
New York State Office of Science, Technology, and Academic Research (NYSTAR) for financial support
Professor Yuzhuo Li and members of his group for their help with the experiments