abridged annual report for f. y. 2018-19 - mutual funds india
TRANSCRIPT
ICICI Prudential Trust Limited
Mr. Vinod Dhall Chairman and Independent Director
Mr. Jyotin Mehta Independent Director
Mr.Ranganayakulu Jagarlamudi
Independent Director
Mr. Lakshman Kumar Mylavarapu
Nominee Director – Prudential Corporation Holdings Limited
Mr. Pramod Rao Nominee Director - ICICI Bank Limited
ICICI Prudential Asset Management Company LimitedMr. C.R. Muralidharan Chairman and Independent DirectorMr. Suresh Kumar Independent DirectorMs. Lakshmi Venkatachalam Independent DirectorMr. Ved Prakash Chaturvedi Independent DirectorMr. Dilip Karnik Independent DirectorMr. Anup Bagchi Nominee Director - ICICI Bank LimitedMr. Sandeep Batra Nominee Director - Prudential
Corporation Holdings LimitedMr. Guy Robert Strapp* Nominee Director - Prudential
Corporation Holdings LimitedMr. Nimesh Shah Managing DirectorMr. Sankaran Naren Executive Director
*Mr. Guy Robert Strapp ceased to be the Director of the Company with effect from April 15, 2019.
Mr. Seck Wai Kwong was appointed as the Director of the Company with effect from April 15, 2019.
• ICICI Prudential Bharat Consumption Fund - Series 1• ICICI Prudential Bharat Consumption Fund - Series 2• ICICI Prudential Bharat Consumption Fund - Series 3• ICICI Prudential Bharat Consumption Fund - Series 4• ICICI Prudential Bharat Consumption Fund - Series 5• ICICI Prudential Business Cycle Fund Series 1• ICICI Prudential Growth Fund Series 1• ICICI Prudential Growth Fund Series 2• ICICI Prudential Growth Fund Series 3• ICICI Prudential India Recovery Fund Series 5• ICICI Prudential India Recovery Fund Series 7• ICICI Prudential Value Fund Series 10• ICICI Prudential Value Fund Series 11
ABRIDGED ANNUAL REPORT FOR F. Y. 2018-19
Sponsors: ICICI Bank Limited Regd. Office: Landmark, Race Course Circle, Vadodara 390 007, India; and Prudential plc, 1 Angel Court, London EC2R 7AG, United Kingdom
Investment Manager: ICICI Prudential Asset Management Company Limited Corporate Identity Number: U99999DL1993PLC054135
Corporate Office: One BKC, 13th Floor, Bandra Kurla Complex, Mumbai - 400051, Tel: (022) 2652 5000 Fax: (022) 2652 8100. Website: www.icicipruamc.com, Email id : [email protected]
Central Service Office: : 2nd Floor, Block B-2, Nirlon Knowledge Park, Western Express Highway, Goregaon (East), Mumbai - 400 063.Tel.: 022-26852000, Fax No.: 022-2686 8313.
Registered Office: 12th Floor, Narain Manzil, 23 Barakhamba Road, New Delhi 110 001.
Trustee: ICICI Prudential Trust Limited
Corporate Identity Number: U74899DL1993PLC054134Registered Office: 12th Floor, Narain Manzil, 23 Barakhamba Road, New Delhi 110 001.
Registrars: Computer Age Management Services Pvt. Ltd. (CAMS) Registered Office: New No 10. Old No. 178, Opp. to Hotel Palm Grove, MGR Salai (K.H.Road), Chennai - 600 034
• ICICI Prudential Value Fund Series 12• ICICI Prudential Value Fund Series 13• ICICI Prudential Value Fund Series 14• ICICI Prudential Value Fund Series 15• ICICI Prudential Value Fund Series 16• ICICI Prudential Value Fund Series 17• ICICI Prudential Value Fund Series 18• ICICI Prudential Value Fund Series 19• ICICI Prudential Value Fund Series 20• ICICI Prudential Value Fund Series 4• ICICI Prudential Value Fund Series 8• ICICI Prudential Value Fund Series 9
2
INDEPENDENT AUDITOR’S REPORTTo the Trustees ofICICI Prudential Mutual Fund
Report on the Financial Statements
The accompanying abridged financial statements, which comprise of the abridged balance sheet as at March 31, 2019 and the abridged revenue account for the period April 01, 2018/ launch date to March 31, 2019 (the ‘year/period’), and related notes of ICICI Prudential Mutual Fund (collectively referred to as ‘the Schemes’) are derived from the audited financial statements of the Schemes of ICICI Prudential Mutual Fund (the ‘Fund’) as at March 31, 2019 and for the year/period ended March 31, 2019. We expressed an unmodified audit opinion on those financial statements in our report dated July 22, 2019.
• ICICI Prudential Bharat Consumption Fund - Series 1 • ICICI Prudential Value Fund - Series 11• ICICI Prudential Bharat Consumption Fund - Series 2 • ICICI Prudential Value Fund - Series 12• ICICI Prudential Bharat Consumption Fund - Series 3 • ICICI Prudential Value Fund - Series 13• ICICI Prudential Bharat Consumption Fund - Series 4 • ICICI Prudential Value Fund - Series 14• ICICI Prudential Bharat Consumption Fund - Series 5 • ICICI Prudential Value Fund - Series 15• ICICI Prudential Business Cycle Fund Series 1 • ICICI Prudential Value Fund - Series 16• ICICI Prudential Growth Fund - Series 1 • ICICI Prudential Value Fund - Series 17• ICICI Prudential Growth Fund - Series 2 • ICICI Prudential Value Fund - Series 18• ICICI Prudential Growth Fund - Series 3 • ICICI Prudential Value Fund - Series 19• ICICI Prudential India Recovery Fund - Series 5 • ICICI Prudential Value Fund - Series 20• ICICI Prudential India Recovery Fund - Series 7 • ICICI Prudential Value Fund - Series 4• ICICI Prudential Value Fund - Series 10 • ICICI Prudential Value Fund Series 8
• ICICI Prudential Value Fund - Series 9
The abridged financial statements do not contain all the disclosures required by the accounting principles generally accepted in India, including the accounting policies and standards specified in the Ninth Schedule to the SEBI Regulations. Reading the abridged financial statements, therefore, is not a substitute for reading the audited financial statements of the Schemes of the Fund.
Management’s Responsibility for the Abridged Financial Statements
ICICI Prudential Asset Management Company Limited, the Schemes’ Asset Manager (‘the AMC’), is responsible for the preparation of the abridged financial statements of the Schemes of the Fund pursuant to Regulation 56 (1) of Securities and Exchange Board of India (Mutual Funds) Regulations, 1996, as amended (the ‘Regulations’) and as per the format prescribed by Securities and Exchange Board of India (‘SEBI’) vide circular number SEBI/IMD/CIR No.8/132968/2008 dated 24 July 2008 (the ‘Circular’) and are derived from the audited financial statements of the Schemes of the Fund for the year/period ended March 31, 2019, prepared in accordance with the accounting policies and standards specified in the Ninth Schedule to the Regulations and Generally Accepted Accounting Principles in India to the extent applicable and covered by our report of even date to the Trustees of the Fund.
Auditor’s Responsibility
Our responsibility is to express an opinion on the Abridged Financial Statements based on our procedures, which were conducted in accordance with Standard on Auditing (SA) 810, “Engagements to Report on Summary Financial Statements” issued by the Institute of Chartered Accountants of India.
Opinion
In our opinion, the abridged financial statements, derived from the audited financial statements of the Schemes of the Fund as at March 31, 2019 and for the year/period ended March 31, 2019 are in fair summary of those financial statements, and are in accordance with the accounting policies and standards specified in the Ninth Schedule to the Regulations and Generally Accepted Accounting Principles in India to the extent applicable and as per the format prescribed by the Circular.
For S.R. Batliboi & Co. LLPChartered AccountantsICAI Firm Registration Number: 301003E/E300005
Sd- per Shrawan Jalan Partner
Membership No.: 102102UDIN: 19102102AAAAKT9148
Place: MumbaiDate: July 22, 2019

3
Dear Unitholder,
We have pleasure in presenting the 26th Annual Report of the Schemes of ICICI Prudential Mutual Fund (“the Mutual Fund” or “the Fund”) for the financial year ended March 31, 2019 (FY2019), along with the audited financial statements of the Schemes.
I. SCHEME PERFORMANCE, FUTURE OUTLOOK AND OPERATIONS OF THE SCHEMES
A. Performance of the Schemes and Investment Folios
1. Performance of the Schemes
The Net Asset Values (NAVs) and other pertinent details of the various Schemes as on March 31, 2019 are below: Scheme Name
Date of
AllotmentQuarterly
AAUM for the period ended
March 31, 2019 (Rs. in lakh)
Quarterly AAUM for the period ended
March 31, 2018 (Rs. in lakh)
NAV per unit at March 31, 2019
(Rs.)
Returns Brief Description
Last 1 year return (%)
Since inception
returns (%)
ICICI Prudential Value Fund - Series 4 08-May-14 7,318.54 8,523.98 21.34 -2.82 16.76 Close ended equity scheme
S&P BSE 500 TRI Index 9.64 14.78
ICICI Prudential Growth Fund - Series 1 20-Jun-14 9,817.01 10,878.25 11.30 10.54 14.85 Close ended equity scheme
Nifty 50 TRI Index 16.40 10.94
ICICI Prudential Growth Fund - Series 2 01-Aug-14 4,686.41 23,380.34 11.92 11.58 14.98 Close ended equity scheme
Nifty 50 TRI Index 16.40 10.86
ICICI Prudential Growth Fund - Series 3 10-Oct-14 4,249.36 37,601.67 10.52 -0.57 10.02 Close ended equity scheme
Nifty 50 TRI Index 16.40 10.49
ICICI Prudential Value Fund - Series 8 06-Aug-15 1,108.01 28,772.23 10.38 0.68 8.46 Close ended equity scheme
S&P BSE 500 TRI Index 9.64 9.77
ICICI Prudential Business Cycle Fund - Series 1
07-Oct-15 26,687.79 32,844.25 12.79 -4.96 7.33 Close ended equity scheme
S&P BSE 500 TRI Index 9.64 11.88
ICICI Prudential India Recovery Fund - Series 5
12-May-16 7,455.75 7,678.42 13.95 4.87 12.26 Close ended equity scheme
S&P BSE 500 TRI Index 9.64 15.47
ICICI Prudential India Recovery Fund - Series 7
22-Jun-16 4,386.08 4,821.83 11.08 8.71 14.31 Close ended equity scheme
S&P BSE 500 TRI Index 9.64 14.59
ICICI Prudential Value Fund - Series 9 29-Oct-16 27,380.37 31,186.14 12.44 3.23 9.47 Close ended equity scheme
S&P BSE 500 TRI Index 9.64 12.47
ICICI Prudential Value Fund - Series 10 09-Jan-17 13,744.10 15,522.38 11.35 -1.04 5.88 Close ended equity scheme
S&P BSE 500 TRI Index 9.64 16.55
ICICI Prudential Value Fund - Series 11 25-Jan-17 13,406.22 15,331.97 12.02 -0.74 8.84 Close ended equity scheme
S&P BSE 500 TRI Index 9.64 14.52
ICICI Prudential Value Fund - Series 12 17-Apr-17 67,564.68 71,571.01 10.83 9.26 10.62 Close ended equity scheme
S&P BSE 500 TRI Index 9.64 11.39
ICICI Prudential Value Fund - Series 13 16-May-17 68,350.04 73,857.31 10.55 6.33 6.85 Close ended equity scheme
S&P BSE 500 TRI Index 9.64 9.31
ICICI Prudential Value Fund - Series 14 14-Jun-17 51,312.60 55,740.83 10.64 1.91 3.53 Close ended equity scheme
S&P BSE 500 TRI Index 9.64 9.48
ICICI Prudential Value Fund - Series 15 17-Jul-17 57,726.55 60,324.09 11.01 8.13 5.83 Close ended equity scheme
S&P BSE 500 TRI Index 9.64 7.98
ICICI Prudential Value Fund - Series 16 11-Aug-17 59,327.58 61,897.07 10.99 5.05 5.96 Close ended equity scheme
S&P BSE 500 TRI Index 9.64 9.99
ICICI Prudential Value Fund - Series 17 18-Sep-17 18,707.12 19,643.74 10.65 4.81 4.21 Close ended equity scheme
S&P BSE 500 TRI Index 9.64 6.34
ICICI Prudential Value Fund - Series 18 25-Oct-17 12,813.54 12,347.06 11.34 10.50 9.23 Close ended equity scheme
S&P BSE 500 TRI Index 9.64 5.82
ICICI Prudential Value Fund - Series 19 10-Jan-18 180,126.67 161,973.28 10.52 9.78 4.27 Close ended equity scheme
S&P BSE 500 TRI Index 9.64 1.65
ICICI PRUDENTIAL TRUST LIMITEDTRUSTEES’ REPORT
ICICI Prudential Mutual FundAddress: 2nd Floor, Block B-2, Nirlon Knowledge Park, Western Express Highway, Goregaon, Mumbai – 400063
4
Scheme Name
Date of Allotment
Quarterly AAUM for the period ended
March 31, 2019 (Rs. in lakh)
Quarterly AAUM for the period ended
March 31, 2018 (Rs. in lakh)
NAV per unit at March 31, 2019
(Rs.)
Returns Brief Description
Last 1 year return (%)
Since inception
returns (%)
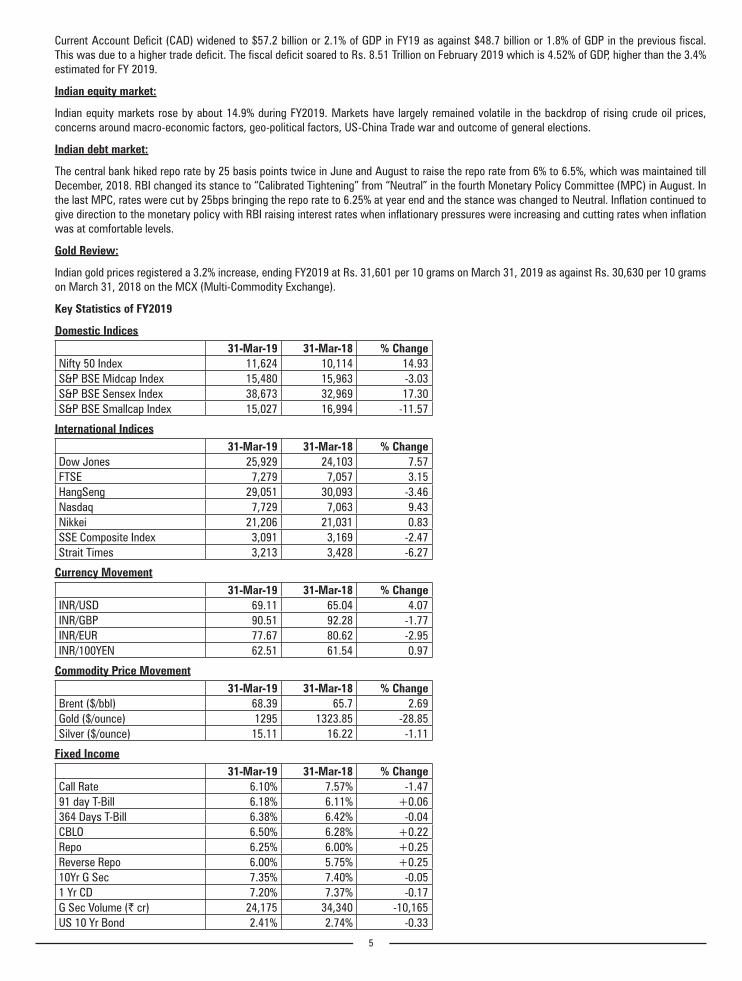
ICICI Prudential Value Fund - Series 20 06-Feb-18 48,182.33 30,765.06 9.82 0.20 -1.58 Close ended equity scheme
S&P BSE 500 TRI Index 9.64 5.97
ICICI Prudential Bharat Consumption Fund - Series 1
11-Apr-18 91,855.77 - 10.24 ** 2.40 Close ended equity scheme
Nifty India Consumption TRI Index ** 0.03
ICICI Prudential Bharat Consumption Fund - Series 2
04-May-18 27,032.47 - 10.02 ** 0.20 Close ended equity scheme
Nifty India Consumption TRI Index ** -1.18
ICICI Prudential Bharat Consumption Fund - Series 3
17-Jul-18 12,345.96 - 10.31 ** 3.10 Close ended equity scheme
Nifty India Consumption TRI Index ** -4.27
ICICI Prudential Bharat Consumption Fund - Series 4
20-Aug-18 39,609.46 - 9.78 ** -2.20 Close ended equity scheme
Nifty India Consumption TRI Index ** -9.01
ICICI Prudential Bharat Consumption Fund - Series 5
28-Nov-18 3,223.21 - 10.60 ** 6.00 Close ended equity scheme
Nifty India Consumption TRI Index ** 0.71
** Since these scheme(s)/ plan(s) have not completed one year from the allotment, one year returns are not calculated. Since inception returns for schemes which have not completed one year from the date of allotment are shown on an absolute basis.
Past performance may or may not be sustained in the future. Returns are calculated on the basis of Compounded Annual Growth Rate (CAGR). For computation of since inception returns the allotment NAV has been taken as `10.
Performance figures have been computed based on the last declared NAV.
Returns have been calculated based on NAV of Growth option without considering load, wherever applicable.
The performance of the scheme is benchmarked to the Total Return Variant of the Index (TRI).
Allotment date shown is the date from which units under the plans are available throughout.
Average Asset Under Management (AAUM)
2. Investment Folios
The total numbers of live folios as at March 31, 2019 were 77.07 lakh.
B. Market Review and Outlook
Market Review FY2019
Global Economy :
The US economy, chugged along strongly during 2018, clocked in a growth rate of 2.9%, higher than 2.2% in 2017, on the back of high exports and slowing imports.
The US Federal Reserve hiked rates in December 2018 - the ninth time since December 2015 and the third time in FY 2019 - announcing a half-point rate hike to 2.25% from 1.75% earlier, on the back of stronger growth and economic outlook, lower unemployment rates and an increase in inflation expectations. The US Federal Reserve however is maintaining a dovish stance on the back of global growth concerns and has maintained that there they would be holding interest rates steady indicating that there won’t be further rate hikes this year.
Meanwhile, the European Central Bank (ECB) lowered its key interest rates to -0.4% from 0% earlier to boost economic growth. The ECB has not laid down any new easing measures despite weak growth. The 2018 growth rate for the region slowed down to 1.9% compared with 2.4% in 2017.
UK’s 2016 Brexit decision, i.e. its gradual withdrawal from the European Union, continued to impact the country’s economy. UK’s 2018 growth remained sluggish at 1.4%, down 1.8% in 2017 on the back of weak performance of service & construction sectors.
Chinese economy grew at 6.6% in 2018 - its slowest rate since 1990 compared with 6.8% in 2017 owing to weakening domestic demand and a tense trade war with the United States.
The United States announced sanctions on Iran which meant an end to the waivers granted to few oil importing countries which led to increased tensions among the 2 nations. Owing to this, crude prices have been on the rise since last few months and ended at $72.8/bl as on April 30, 2019.
Indian economy:
According to the Central Statistics Office (CSO), the Indian economy grew at 6.8% in FY 2019 compared to 7.2% in FY 2018 on the back of slowdown in private consumption. Crude oil price has been on the rise since January – March 2019 quarter and is expected to remain volatile due to US sanctions on Iran (US announced an end to the waivers granted to few oil importing countries). This might lead to inflation and may also impact trade & current account deficit
5
Current Account Deficit (CAD) widened to $57.2 billion or 2.1% of GDP in FY19 as against $48.7 billion or 1.8% of GDP in the previous fiscal. This was due to a higher trade deficit. The fiscal deficit soared to Rs. 8.51 Trillion on February 2019 which is 4.52% of GDP, higher than the 3.4% estimated for FY 2019.
Indian equity market:
Indian equity markets rose by about 14.9% during FY2019. Markets have largely remained volatile in the backdrop of rising crude oil prices, concerns around macro-economic factors, geo-political factors, US-China Trade war and outcome of general elections.
Indian debt market:
The central bank hiked repo rate by 25 basis points twice in June and August to raise the repo rate from 6% to 6.5%, which was maintained till December, 2018. RBI changed its stance to “Calibrated Tightening” from “Neutral” in the fourth Monetary Policy Committee (MPC) in August. In the last MPC, rates were cut by 25bps bringing the repo rate to 6.25% at year end and the stance was changed to Neutral. Inflation continued to give direction to the monetary policy with RBI raising interest rates when inflationary pressures were increasing and cutting rates when inflation was at comfortable levels.
Gold Review:
Indian gold prices registered a 3.2% increase, ending FY2019 at Rs. 31,601 per 10 grams on March 31, 2019 as against Rs. 30,630 per 10 grams on March 31, 2018 on the MCX (Multi-Commodity Exchange).
Key Statistics of FY2019
Domestic Indices31-Mar-19 31-Mar-18 % Change
Nifty 50 Index 11,624 10,114 14.93S&P BSE Midcap Index 15,480 15,963 -3.03S&P BSE Sensex Index 38,673 32,969 17.30S&P BSE Smallcap Index 15,027 16,994 -11.57
International Indices 31-Mar-19 31-Mar-18 % ChangeDow Jones 25,929 24,103 7.57FTSE 7,279 7,057 3.15HangSeng 29,051 30,093 -3.46Nasdaq 7,729 7,063 9.43Nikkei 21,206 21,031 0.83SSE Composite Index 3,091 3,169 -2.47Strait Times 3,213 3,428 -6.27
Currency Movement31-Mar-19 31-Mar-18 % Change
INR/USD 69.11 65.04 4.07INR/GBP 90.51 92.28 -1.77INR/EUR 77.67 80.62 -2.95INR/100YEN 62.51 61.54 0.97
Commodity Price Movement31-Mar-19 31-Mar-18 % Change
Brent ($/bbl) 68.39 65.7 2.69Gold ($/ounce) 1295 1323.85 -28.85Silver ($/ounce) 15.11 16.22 -1.11
Fixed Income31-Mar-19 31-Mar-18 % Change
Call Rate 6.10% 7.57% -1.4791 day T-Bill 6.18% 6.11% +0.06364 Days T-Bill 6.38% 6.42% -0.04CBLO 6.50% 6.28% +0.22Repo 6.25% 6.00% +0.25Reverse Repo 6.00% 5.75% +0.2510Yr G Sec 7.35% 7.40% -0.051 Yr CD 7.20% 7.37% -0.17G Sec Volume (` cr) 24,175 34,340 -10,165US 10 Yr Bond 2.41% 2.74% -0.33

6
Institutional Flow as on March 31, 2019 (Equity)
Purchase (` Cr.)
Sales (` Cr.)
Net (` Cr.)
YTD (` Cr.)
FII Flows 150,058 116,077 33,981 -87MF Flows 56,865 64,530 -7,665 87,743
Sectoral Performance
31-Mar-19 31-Mar-18 % ChangeS&P BSE Auto 18,825 24,057 -21.75S&P BSE Bankex 34,142 27,198 25.53S&P BSE Consumer Durables 23,857 22,262 7.16S&P BSE Capital Goods 18,472 18,477 -0.03S&P BSE Fast Moving Consumer Goods 11,742 10,290 14.10S&P BSE HealthCare 14,408 13,158 9.50S&P BSE Information Technology 15,280 12,101 26.28S&P BSE Metals 11,355 13,322 -14.76S&P BSE Oil & Gas 15,270 14,614 4.48S&P BSE Power Index 2,034 2,126 -4.30S&P BSE PSU 7,640 7,861 -2.81S&P BSE Realty 2,077 2,230 -6.85
So how is FY2020 shaping up?
Economic outlook
A slowdown in GDP growth rate has been observed in the last 4 quarters (from 8% in Q1 FY2019 to 5.8% in Q4 FY2019). This slowdown can be attributed to the following reasons:
• Lowfoodinflationowingtoliquidityconcerns
• Shiftindomesticconsumptionpreferences-fromhighenddiscretionaryproductstolowenddiscretionaryproductsandstaples
• Geo-politicalfactorslikeUS-ChinaTradewar
• PressureofrisingoilpricesifIran-UStensionsrise
The long term growth story however remains intact with India expected to benefit from certain factors like:
• ManufacturingshiftfromChinatoIndia
• IndiahasademographicedgeoverothercountrieswhichcanhelpreapthebenefitsofthisshiftfromChinatoIndia(India’sworkingageasa % of China’s working age is 88%).
• EaseofDoingBusiness
With the Government intent on reforms to boost rural economy and infrastructure, we expect growth rate to better in FY2020.
Equity market outlook:
Equity markets currently look richly valued; however, this has not come along with a recovery in earnings. Therefore, an earnings recovery would further bode well for the market and provide opportunities through reasonable valuations.
The re-election of the incumbent government with a thumping majority is a positive for the equity markets in the near term. However, over long term, markets seek direction from macro-economic indicators which highlight the overall health of the economy.
Hence, we continue to remain neutral on equities and would be watchful of key macro events which can guide equity markets in the long-term. Some of the events are mentioned below:
• US-ChinaTradeIssues
• PressureofrisingoilpricesifIran-UStensionsrise
• Measurestakenbythenewgovernmenttoreducefiscaldeficit
• Slowingruralandtier2/3urbancitiesconsumptiongrowthreflectedinfallingtwowheelerandcarsalessinceAugust2018.
• AssetliabilitymismatchintheNBFC
• Absenceofprivatecapexrebound

7
Debt market outlook:
The year started with the G-Sec yields at 7.40% levels (March 31, 2018) and ended at 7.35% (March 2019). FY2019 saw debt markets being volatile on account of various global and domestic factors.
We remain cautious on the longer end of the curve, as fiscal concerns continue due to the central government’s shortfall from GST collection, a key reason for fiscal slippage. Also, the liquidity remained in the deficit due to which the RBI has increased OMO purchases since last few months and implemented a new monetary tool in the form of dollar swap.
The global narrative on growth which was beginning to look somewhat optimistic again post the US Fed’s stance on being patient for rate hikes and recent Chinese expansion of credit has turned pessimistic once more with hopes around a US – China deal having been disappointed for now.
The MPC has so far responded with two rate cuts, but the transmission remained inadequate. The election mandate of a continued strong government will help reduce sovereign risk premium and allow policy to focus on the local narrative of slowing growth. A decisive focus on the guidance tool for both rates and liquidity by the RBI would positively influence monetary transmission.
We remain watchful of any fiscal slippages, reversal in prices of any perishable food items, uncertainty regarding global events and escalating trade tensions between US and China.
As per our investment framework, accrual schemes have moved into ‘buy’ territory with attractive valuations (spread between repo rate), reduced flows, and negative sentiments (NBFC liquidity crunch). The risk-reward benefit has turned favourable and it’s a good time to earn the carry with high credit spreads available in the corporate bond space. Having said that, we remain cognizant of managing the liquidity, concentration, credit and duration in our accrual portfolios to provide better risk-adjusted returns.
We would recommend low/short duration schemes which could mitigate interest rate volatility, accrual schemes which provide better carry, and dynamic duration schemes which are flexible enough to benefit out of interest rate volatility.
C. Operations of the Schemes
1. Average Assets under Management (AAUM)
The AAUM of the Mutual Fund for the quarter ended March 31, 2019 stood at ` 3,21,281.17 crore, while for the quarter ended March 31, 2018 the AAUM of the Mutual Fund was ` 3,06,173.50 crore.
As of March 31, 2019, the Fund comprised 64 open ended scheme which includes 18 Equity schemes, 16 Debt schemes, 6 Hybrid schemes, 2 Solution Oriented schemes (Retirement Fund having 4 plans there under, each having different portfolio), 3 Index Funds, 11 Exchange Traded Funds, 7 Fund of Funds investing domestically, 1 Fund of Funds scheme investing overseas and 189 close ended schemes.
During the year under review, the Fund has launched 3 Equity schemes, 1 Debt Scheme, 1 Solution Oriented (Retirement Fund having 4 plans there under, each having different portfolio), 3 Exchange Trade Funds and 1 Fund of Funds, 55 Fixed Maturity Plans, 1 Capital Protection Oriented Schemes and 5 Close Ended Equity Funds. During the year under review, 46 Fixed Maturity Plans, 27 Capital Protection Oriented Schemes, 6 Multiple Yield Funds, 2 Interval Funds and 16 Close Ended Equity Fund matured.
2. Operations and Consumer Service
With a view to rendering timely and efficient customer service, the Investment Manager of the Fund, viz., ICICI Prudential Asset Management Company Ltd. (“the AMC”) has been effectively leveraging on its 201 branches including 96 functioning as official points of acceptance of transactions, as on March 31, 2019, effectively servicing the large client base. Additionally a dedicated contact center has been effective in providing investor support and redressing their grievances. The AMC’s focus has always been on technological innovation for facilitating investors’ convenience.
3. Scheme-wise commentary
• ICICI Prudential Value Fund - Series 4
ICICI Prudential Value Fund - Series 4 is a close ended equity scheme that aims to provide capital appreciation by investing in a well-diversified portfolio of stocks through fundamental analysis.
The Growth option of the scheme posted a return of -2.82% in FY2019. The benchmark, S&P BSE 500 TRI Index, posted 9.64% for the year.
The AAUM of the scheme during the last quarter of FY2019 was ` 73.19 crore.
• ICICI Prudential Value Fund - Series 8
ICICI Prudential Value Fund - Series 8 is a close ended equity scheme that aims to provide capital appreciation by investing in a well-diversified portfolio of stocks through fundamental analysis.
The Dividend option of the scheme posted a return of 0.68% in FY2019. The benchmark, S&P BSE 500 TRI Index, posted 9.64% for the year.
The AAUM of the scheme during the last quarter of FY2019 was ` 11.08 crore.
8
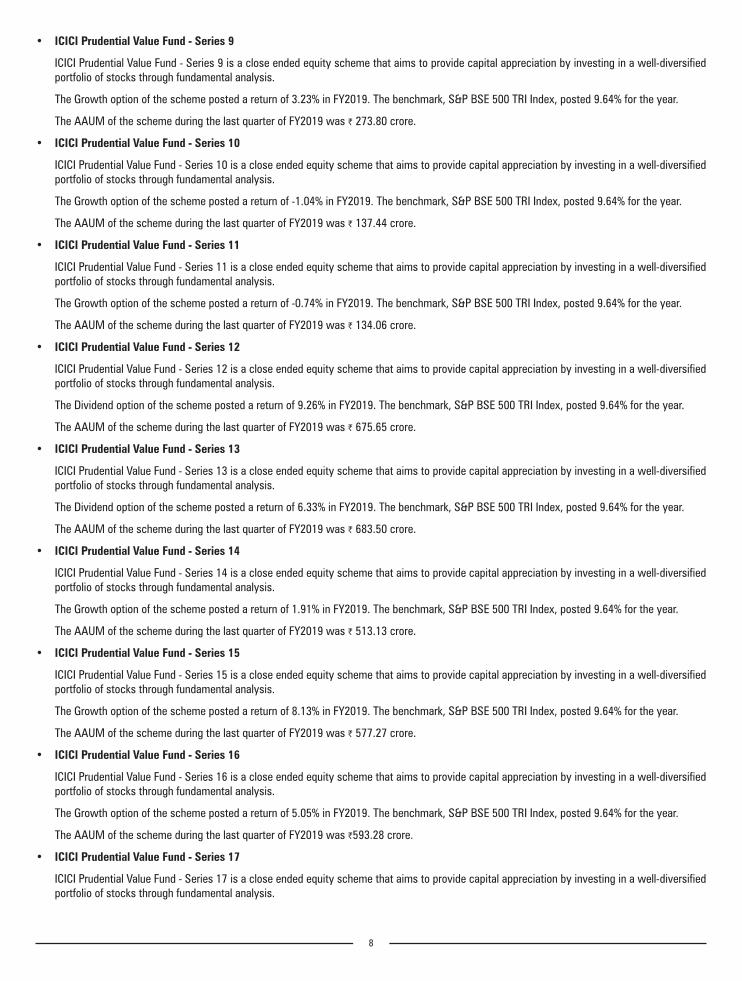
• ICICI Prudential Value Fund - Series 9
ICICI Prudential Value Fund - Series 9 is a close ended equity scheme that aims to provide capital appreciation by investing in a well-diversified portfolio of stocks through fundamental analysis.
The Growth option of the scheme posted a return of 3.23% in FY2019. The benchmark, S&P BSE 500 TRI Index, posted 9.64% for the year.
The AAUM of the scheme during the last quarter of FY2019 was ` 273.80 crore.
• ICICI Prudential Value Fund - Series 10
ICICI Prudential Value Fund - Series 10 is a close ended equity scheme that aims to provide capital appreciation by investing in a well-diversified portfolio of stocks through fundamental analysis.
The Growth option of the scheme posted a return of -1.04% in FY2019. The benchmark, S&P BSE 500 TRI Index, posted 9.64% for the year.
The AAUM of the scheme during the last quarter of FY2019 was ` 137.44 crore.
• ICICI Prudential Value Fund - Series 11
ICICI Prudential Value Fund - Series 11 is a close ended equity scheme that aims to provide capital appreciation by investing in a well-diversified portfolio of stocks through fundamental analysis.
The Growth option of the scheme posted a return of -0.74% in FY2019. The benchmark, S&P BSE 500 TRI Index, posted 9.64% for the year.
The AAUM of the scheme during the last quarter of FY2019 was ` 134.06 crore.
• ICICI Prudential Value Fund - Series 12
ICICI Prudential Value Fund - Series 12 is a close ended equity scheme that aims to provide capital appreciation by investing in a well-diversified portfolio of stocks through fundamental analysis.
The Dividend option of the scheme posted a return of 9.26% in FY2019. The benchmark, S&P BSE 500 TRI Index, posted 9.64% for the year.
The AAUM of the scheme during the last quarter of FY2019 was ` 675.65 crore.
• ICICI Prudential Value Fund - Series 13
ICICI Prudential Value Fund - Series 13 is a close ended equity scheme that aims to provide capital appreciation by investing in a well-diversified portfolio of stocks through fundamental analysis.
The Dividend option of the scheme posted a return of 6.33% in FY2019. The benchmark, S&P BSE 500 TRI Index, posted 9.64% for the year.
The AAUM of the scheme during the last quarter of FY2019 was ` 683.50 crore.
• ICICI Prudential Value Fund - Series 14
ICICI Prudential Value Fund - Series 14 is a close ended equity scheme that aims to provide capital appreciation by investing in a well-diversified portfolio of stocks through fundamental analysis.
The Growth option of the scheme posted a return of 1.91% in FY2019. The benchmark, S&P BSE 500 TRI Index, posted 9.64% for the year.
The AAUM of the scheme during the last quarter of FY2019 was ` 513.13 crore.
• ICICI Prudential Value Fund - Series 15
ICICI Prudential Value Fund - Series 15 is a close ended equity scheme that aims to provide capital appreciation by investing in a well-diversified portfolio of stocks through fundamental analysis.
The Growth option of the scheme posted a return of 8.13% in FY2019. The benchmark, S&P BSE 500 TRI Index, posted 9.64% for the year.
The AAUM of the scheme during the last quarter of FY2019 was ` 577.27 crore.
• ICICI Prudential Value Fund - Series 16
ICICI Prudential Value Fund - Series 16 is a close ended equity scheme that aims to provide capital appreciation by investing in a well-diversified portfolio of stocks through fundamental analysis.
The Growth option of the scheme posted a return of 5.05% in FY2019. The benchmark, S&P BSE 500 TRI Index, posted 9.64% for the year.
The AAUM of the scheme during the last quarter of FY2019 was `593.28 crore.
• ICICI Prudential Value Fund - Series 17
ICICI Prudential Value Fund - Series 17 is a close ended equity scheme that aims to provide capital appreciation by investing in a well-diversified portfolio of stocks through fundamental analysis.

9
The Growth option of the scheme posted a return of 4.81% in FY2019. The benchmark, S&P BSE 500 TRI Index, posted 9.64% for the year.
The AAUM of the scheme during the last quarter of FY2019 was ` 187.07 crore.
• ICICI Prudential Value Fund - Series 18
ICICI Prudential Value Fund - Series 18 is a close ended equity scheme that aims to provide capital appreciation by investing in a well-diversified portfolio of stocks through fundamental analysis.
The Growth option of the scheme posted a return of 10.50% in FY2019. The benchmark, S&P BSE 500 TRI Index, posted 9.64% for the year.
The AAUM of the scheme during the last quarter of FY2019 was ` 128.14 crore.
• ICICI Prudential Value Fund - Series 19
ICICI Prudential Value Fund - Series 19 is a close ended equity scheme that aims to provide capital appreciation by investing in a well-diversified portfolio of stocks through fundamental analysis.
The Growth option of the scheme posted a return of 9.78% in FY2019. The benchmark, S&P BSE 500 TRI Index, posted 9.64% for the year.
The AAUM of the scheme during the last quarter of FY2019 was ` 1801.27 crore.
• ICICI Prudential Value Fund - Series 20
ICICI Prudential Value Fund - Series 20 is a close ended equity scheme that aims to provide capital appreciation by investing in a well-diversified portfolio of stocks through fundamental analysis.
The Growth option of the scheme posted a return of 0.20% in FY2019. The benchmark, S&P BSE 500 TRI Index, posted 9.64% for the year.
The AAUM of the scheme during the last quarter of FY2019 was ` 481.82 crore.
• ICICI Prudential Growth Fund - Series 1
ICICI Prudential Growth Fund - Series 1 is a close ended equity scheme that seeks to provide capital appreciation by investing in a well-diversified portfolio of equity and equity related securities.
The Dividend option of the scheme posted a return of 10.54% in FY2019. The benchmark, Nifty 50 TRI Index, posted 16.40% for the year.
The AAUM of the scheme during the last quarter of FY2019 was ` 98.17 crore.
• ICICI Prudential Growth Fund - Series 2
ICICI Prudential Growth Fund - Series 2 is a close ended equity scheme that seeks to provide capital appreciation by investing in a well-diversified portfolio of equity and equity related securities.
The Dividend option of the scheme posted a return of 11.58% in FY2019. The benchmark, Nifty 50 TRI Index, posted 16.40% for the year.
The AAUM of the scheme during the last quarter of FY2019 was ` 46.86 crore.
• ICICI Prudential Growth Fund - Series 3
ICICI Prudential Growth Fund - Series 3 is a close ended equity scheme that seeks to provide capital appreciation by investing in a well-diversified portfolio of equity and equity related securities.
The Dividend option of the scheme posted a return of -0.57% in FY2019. The benchmark, Nifty 50 TRI Index, posted 16.40% for the year.
The AAUM of the scheme during the last quarter of FY2019 was ` 42.49 crore.
• ICICI Prudential India Recovery Fund - Series 5
ICICI Prudential India Recovery Fund - Series 5 is a close ended equity scheme that seeks to provide capital appreciation by investing in equity and equity related securities that are likely to benefit from recovery in the Indian economy.
The Growth option of the scheme posted a return of 4.87% in FY2019. The benchmark, S&P BSE 500 TRI Index, posted 9.64% for the year.
The AAUM of the scheme during the last quarter of FY2019 was ` 74.56 crore.
• ICICI Prudential India Recovery Fund - Series 7
ICICI Prudential India Recovery Fund - Series 7 is a close ended equity scheme that seeks to provide capital appreciation by investing in equity and equity related securities that are likely to benefit from recovery in the Indian economy.
The Dividend option of the scheme posted a return of 8.71% in FY2019. The benchmark, S&P BSE 500 TRI Index, posted 9.64% for the year.
The AAUM of the scheme during the last quarter of FY2019 was ` 43.86 crore.

10
• ICICI Prudential Business Cycle Fund - Series 1
ICICI Prudential Business Cycle Fund - Series 1 is a close ended equity scheme that seeks to provide capital appreciation by predominantly investing in equity and equity related securities with focus on riding business cycles through dynamic allocation between various sectors and stocks.
The Growth option of the scheme posted a return of -4.96% in FY2019. The benchmark, S&P BSE 500 TRI Index, posted 9.64% for the year.
The AAUM of the scheme during the last quarter of FY2019 was ` 266.88 crore.
• ICICI Prudential Bharat Consumption Fund – Series 1
ICICI Prudential Bharat Consumption Fund – Series 1 is a close ended equity scheme that seeks to provide capital appreciation by investing predominantly in equity and equity related instruments of sectors that could benefit from growth in consumption and related activities.
The Growth option of the scheme posted a return of 2.40% from the inception date (April 11, 2018) till March 31, 2019. The benchmark, Nifty India Consumption TRI Index, posted 0.03% for the same period.
The AAUM of the scheme during the last quarter of FY2019 was ` 918.56 crore.
• ICICI Prudential Bharat Consumption Fund – Series 2
ICICI Prudential Bharat Consumption Fund – Series 2 is a close ended equity scheme that seeks to provide capital appreciation by investing predominantly in equity and equity related instruments of sectors that could benefit from growth in consumption and related activities.
The Growth option of the scheme posted a return of 0.20% from the inception date (May 4, 2018) till March 31, 2019. The benchmark, Nifty India Consumption TRI Index, posted -1.18% for the same period.
The AAUM of the scheme during the last quarter of FY2019 was ` 270.32 crore.
• ICICI Prudential Bharat Consumption Fund – Series 3
ICICI Prudential Bharat Consumption Fund – Series 3 is a close ended equity scheme that seeks to provide capital appreciation by investing predominantly in equity and equity related instruments of sectors that could benefit from growth in consumption and related activities.
The Growth option of the scheme posted a return of 3.10% from the inception date (July 17, 2018) till March 31, 2019. The benchmark, Nifty India Consumption TRI Index, posted -4.27% for the same period.
The AAUM of the scheme during the last quarter of FY2019 was `123.46 crore.
• ICICI Prudential Bharat Consumption Fund – Series 4
ICICI Prudential Bharat Consumption Fund – Series 4 is a close ended equity scheme that seeks to provide capital appreciation by investing predominantly in equity and equity related instruments of sectors that could benefit from growth in consumption and related activities.
The Growth option of the scheme posted a return of -2.20% from the inception date (August 20, 2018) till March 31, 2019. The benchmark, Nifty India Consumption TRI Index, posted -9.01% for the same period.
The AAUM of the scheme during the last quarter of FY2019 was ` 396.09 crore.
• ICICI Prudential Bharat Consumption Fund – Series 5
ICICI Prudential Bharat Consumption Fund – Series 5 is a close ended equity scheme that seeks to provide capital appreciation by investing predominantly in equity and equity related instruments of sectors that could benefit from growth in consumption and related activities.
The Growth option of the scheme posted a return of 6.00% from the inception date (November 28, 2018) till March 31, 2019. The benchmark, Nifty India Consumption TRI Index, posted 0.71% for the same period.
The AAUM of the scheme during the last quarter of FY2019 was ` 32.23 crore.
BRIEF BACKGROUND OF SPONSORS, TRUST, TRUSTEE AND THE AMC
A. Sponsors
1. ICICI Bank Limited
ICICI Bank is India’s largest private sector bank with total assets of ` 9,644.59 billion at March 31, 2019 and profit after tax ` 33.63 billion for the year ended March 31, 2019. ICICI Bank as at March 31, 2019 had a network of 4,874 Branches and 14,987 ATM’s across India. ICICI Bank and their subsidiaries offers a wide range of banking and financial services including commercial banking, retail banking, project and corporate finance, working capital finance, insurance, venture capital and private equity, investment banking, broking and treasury products and services.
ICICI Bank’s international footprint consists of subsidiaries in the United Kingdom and Canada, branches in the United States, Singapore, Bahrain, Hong Kong, Sri Lanka, Dubai International Finance Centre, South Africa and China and representative offices in the United Arab Emirates, Bangladesh, Malaysia and Indonesia. The UK subsidiary of the Bank has six branches in UK and one branch in Germany.
11
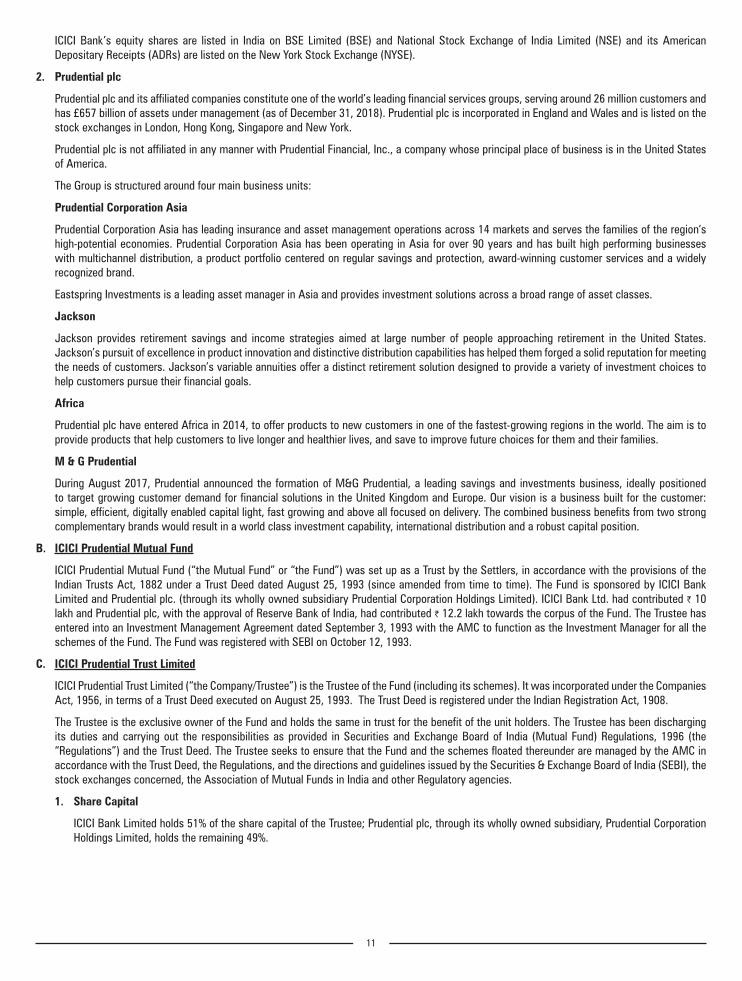
ICICI Bank’s equity shares are listed in India on BSE Limited (BSE) and National Stock Exchange of India Limited (NSE) and its American Depositary Receipts (ADRs) are listed on the New York Stock Exchange (NYSE).
2. Prudential plc
Prudential plc and its affiliated companies constitute one of the world’s leading financial services groups, serving around 26 million customers and has £657 billion of assets under management (as of December 31, 2018). Prudential plc is incorporated in England and Wales and is listed on the stock exchanges in London, Hong Kong, Singapore and New York.
Prudential plc is not affiliated in any manner with Prudential Financial, Inc., a company whose principal place of business is in the United States of America.
The Group is structured around four main business units:
Prudential Corporation Asia
Prudential Corporation Asia has leading insurance and asset management operations across 14 markets and serves the families of the region‘s high-potential economies. Prudential Corporation Asia has been operating in Asia for over 90 years and has built high performing businesses with multichannel distribution, a product portfolio centered on regular savings and protection, award-winning customer services and a widely recognized brand.
Eastspring Investments is a leading asset manager in Asia and provides investment solutions across a broad range of asset classes.
Jackson
Jackson provides retirement savings and income strategies aimed at large number of people approaching retirement in the United States. Jackson’s pursuit of excellence in product innovation and distinctive distribution capabilities has helped them forged a solid reputation for meeting the needs of customers. Jackson’s variable annuities offer a distinct retirement solution designed to provide a variety of investment choices to help customers pursue their financial goals.
Africa
Prudential plc have entered Africa in 2014, to offer products to new customers in one of the fastest-growing regions in the world. The aim is to provide products that help customers to live longer and healthier lives, and save to improve future choices for them and their families.
M & G Prudential
During August 2017, Prudential announced the formation of M&G Prudential, a leading savings and investments business, ideally positioned to target growing customer demand for financial solutions in the United Kingdom and Europe. Our vision is a business built for the customer: simple, efficient, digitally enabled capital light, fast growing and above all focused on delivery. The combined business benefits from two strong complementary brands would result in a world class investment capability, international distribution and a robust capital position.
B. ICICI Prudential Mutual Fund
ICICI Prudential Mutual Fund (“the Mutual Fund” or “the Fund”) was set up as a Trust by the Settlers, in accordance with the provisions of the Indian Trusts Act, 1882 under a Trust Deed dated August 25, 1993 (since amended from time to time). The Fund is sponsored by ICICI Bank Limited and Prudential plc. (through its wholly owned subsidiary Prudential Corporation Holdings Limited). ICICI Bank Ltd. had contributed ` 10 lakh and Prudential plc, with the approval of Reserve Bank of India, had contributed ` 12.2 lakh towards the corpus of the Fund. The Trustee has entered into an Investment Management Agreement dated September 3, 1993 with the AMC to function as the Investment Manager for all the schemes of the Fund. The Fund was registered with SEBI on October 12, 1993.
C. ICICI Prudential Trust Limited
ICICI Prudential Trust Limited (“the Company/Trustee”) is the Trustee of the Fund (including its schemes). It was incorporated under the Companies Act, 1956, in terms of a Trust Deed executed on August 25, 1993. The Trust Deed is registered under the Indian Registration Act, 1908.
The Trustee is the exclusive owner of the Fund and holds the same in trust for the benefit of the unit holders. The Trustee has been discharging its duties and carrying out the responsibilities as provided in Securities and Exchange Board of India (Mutual Fund) Regulations, 1996 (the “Regulations”) and the Trust Deed. The Trustee seeks to ensure that the Fund and the schemes floated thereunder are managed by the AMC in accordance with the Trust Deed, the Regulations, and the directions and guidelines issued by the Securities & Exchange Board of India (SEBI), the stock exchanges concerned, the Association of Mutual Funds in India and other Regulatory agencies.
1. Share Capital
ICICI Bank Limited holds 51% of the share capital of the Trustee; Prudential plc, through its wholly owned subsidiary, Prudential Corporation Holdings Limited, holds the remaining 49%.

12
2. Board of Directors
As of March 31, 2019, the Board comprised:
Sr. No. Name of the Director Designation1. Mr. Vinod Dhall Chairman and Independent Director2. Mr. Jyotin Mehta Independent Director 3. Mr.Ranganayakulu Jagarlamudi Independent Director4. Mr. Lakshman Kumar Mylavarapu Nominee Director – Prudential Corporation Holdings Limited5. Mr. Pramod Rao Nominee Director - ICICI Bank Limited
D. ICICI Prudential Asset Management Company Limited
ICICI Prudential Asset Management Company Limited (“the AMC”), a company incorporated on June 22, 1993 under the Companies Act, 1956, was registered with SEBI on October 13, 1993 to act as the Investment Manager to all the Schemes of ICICI Prudential Mutual Fund. The Trustee has entered into an Investment Management Agreement dated September 3, 1993 with the AMC to function as the Investment Manager for all the schemes of the Fund.
The AMC has been providing portfolio management services (PMS) since October 2000, with the requisite approvals/permissions from SEBI and the Trustee as envisaged under Regulation 24(b) of the Regulations. The AMC under its portfolio management license has also been appointed as the investment manager by the Trust for managing the scheme launched under ICICI Prudential Venture Capital Fund. Further, the AMC is also rendering Advisory Services to SEBI-registered foreign portfolio investors (FPIs). The AMC is also providing investment management services to Category II and Category III Alternative Investment Funds registered under SEBI (Alternative Investment Funds) Regulations, 2012. These activities are not in conflict with the activities of the Mutual Fund. In the situations of unavoidable conflicts of interest, the AMC undertakes that it shall satisfy itself that adequate disclosures are made of sources of conflict, potential ‘material risk or damage’ to investor interest and develop parameters for the same.
The AMC has secured a leading position in the Indian mutual fund industry with quarterly AAUM of ` 3,21,281.17 crore for the quarter ended March 31, 2019. The AMC manages a comprehensive range of Schemes to meet the varying investment needs of its investors spread across various cities through 462 Official Points of Transactions (including 261 branches operated through the Registrar of the Mutual Fund) in the country as on March 31, 2019.
1. Share Capital
ICICI Bank Limited holds 51% of the share capital of the AMC; Prudential plc, through its wholly owned subsidiary, Prudential Corporation Holdings Limited, holds the remaining 49%.
2. Board of Directors
As on March 31, 2019, the Board comprised:
Sr. No. Name of the Director Designation1. Mr. C.R. Muralidharan Chairman and Independent Director2. Mr. Suresh Kumar Independent Director3. Ms. Lakshmi Venkatachalam Independent Director4. Mr. Ved Prakash Chaturvedi Independent Director 5. Mr. Dilip Karnik Independent Director6. Mr. Anup Bagchi Nominee Director - ICICI Bank Limited7. Mr. Sandeep Batra Nominee Director - Prudential Corporation Holdings Limited8. Mr. Guy Robert Strapp* Nominee Director - Prudential Corporation Holdings Limited9. Mr. Nimesh Shah Managing Director
10. Mr. Sankaran Naren Executive Director*Mr. Guy Strapp ceased to be the Director of the Company with effect from April 15, 2019.Mr. Seck Wai Kwong was appointed as the Director of the Company with effect from April 15, 2019.
III. INVESTMENT OBJECTIVES OF THE SCHEMES
• ICICI Prudential Value Series 4 and 8-20
The investment objective of the Scheme is to provide capital appreciation by investing in a well-diversified portfolio of stocks through fundamental analysis.
However, there can be no assurance that the investment objectives of the Scheme will be realized.
• ICICI Prudential Growth Series 1-3
The investment objective of the Scheme is to provide capital appreciation by investing in a well-diversified portfolio of equity and equity related securities.

13
However, there can be no assurance that the investment objectives of the Scheme will be realized.
• ICICI Prudential India Recovery Fund Series 5 and 7
The investment objective of the Scheme is to provide capital appreciation by investing in equity and equity related securities that are likely to benefit from recovery in the Indian economy.
However, there can be no assurance that the investment objectives of the Scheme will be realized.
• ICICI Prudential Business Cycle Fund Series 1
The investment objective of the Scheme is to provide capital appreciation by predominantly investing in equity and equity related securities with focus on riding business cycles through dynamic allocation between various sectors and stocks.
However, there can be no assurance that the investment objective of the Scheme will be realized.
• ICICI Prudential Bharat Consumption Fund – Series 1 to Series 5
The investment objective of the schemes is to provide capital appreciation by investing predominantly in equity and equity related instruments of sectors that could benefit from growth in consumption and related activities.
However, there can be no assurance that the investment objective of the Scheme will be realized.
IV. SIGNIFICANT ACCOUNTING/ VALUATION POLICIES
Accounting policies are in accordance with Securities and Exchange Board of India (Mutual Fund) Regulations, 1996. The changes in the accounting/valuation policies, if any, are stated in the notes to the financial statements.
V. UNCLAIMED DIVIDEND AND REDEMPTION
Details of unclaimed dividends and redemptions under the various Schemes are given below:
Unclaimed dividend and redemption data for the year ended March 31, 2019Unclaimed Dividend/ Redemption normally represent the time lag between funding of the respective accounts (with bank) by the AMC and the time taken for presentation of redemption/ dividend warrant by the investors. Unclaimed Dividend/Redemption amount in respect of Schemes/ Plans as on March 31, 2019, is as follows:
Scheme Name
Dividend RedemptionAmount (`) Count Amount (`) Count
ICICI Prudential Bharat Consumption Fund 0.00 0 1,269.17 435ICICI Prudential Business Cycle Fund Series 1 845,959.12 20 1.22 1ICICI Prudential Growth Fund Series 1 2,808,544.74 975 2,008,159.82 1087ICICI Prudential Growth Fund Series 2 3,499,908.14 920 3,124,282.52 876ICICI Prudential Growth Fund Series 3 4,281,311.26 1009 3,447,198.78 913ICICI Prudential India Recovery Fund Series 5 0.00 0 11.80 3ICICI Prudential India Recovery Fund Series 7 257,117.27 15 0.00 0ICICI Prudential Value Fund Series 10 29,981.69 8 64.36 16ICICI Prudential Value Fund Series 11 0.00 0 5.11 1ICICI Prudential Value Fund Series 12 5,322,961.69 160 600.02 177ICICI Prudential Value Fund Series 13 6,083,034.64 143 442.84 156ICICI Prudential Value Fund Series 14 312,605.80 30 435.54 138ICICI Prudential Value Fund Series 15 133,522.61 31 479.82 130ICICI Prudential Value Fund Series 16 138,979.61 8 112.17 32ICICI Prudential Value Fund Series 17 20,014.44 5 114.12 23ICICI Prudential Value Fund Series 18 28,878.86 4 79.81 19ICICI Prudential Value Fund Series 19 0.00 0 660.12 268ICICI Prudential Value Fund Series 20 0.00 0 211.69 75ICICI Prudential Value Fund Series 4 10,179.79 16 27.37 7ICICI Prudential Value Fund Series 8 405,032.35 61 1,395,055.25 13ICICI Prudential Value Fund Series 9 925,829.03 2 1.22 3

14
VI. DISCLOSURE OF INVESTOR COMPLAINTS
The disclosure regarding the redressal of Investor Complaints received against the Fund during the FY2019 is given below:Redressal of Complaints received during the period April 2018 - March 2019Name of the Mutual Fund – ICICI Prudential Mutual FundTotal Number of Folios :77,06,864Com-plaint Code
Type of Complaint# (a) No. of
complaints pending at the
beginning of the Year
(b) No. of
Complaints received
during the year
Action on (a) and (b)Resolved Non
Action-able $
PendingWithin 30 days
30-60 days
60-180 days
Beyond 180 days
0-3 months
3-6 months
6-9 months
9-12 months
I A Non receipt of Dividend on Units 3 89 92 0 0 0 0 0 0 0 0I B Interest on delayed payment of
Dividend0 1 1 0 0 0 0 0 0 0 0
I C Non receipt of Redemption Proceeds
0 53 52 0 0 0 0 1 0 0 0
I D Interest on delayed payment of Redemption
0 0 0 0 0 0 0 0 0 0 0
II A Non receipt of Statement of Account/Unit Certificate
0 1 1 0 0 0 0 0 0 0 0
II B Discrepancy in Statement of Account
29 1561 1585 0 0 0 0 5 0 0 0
II C Data corrections in Investor details
0 1260 1254 0 0 0 0 6 0 0 0
II D Non receipt of Annual Report/Abridged Summary
0 0 0 0 0 0 0 0 0 0 0
III A Wrong switch between Schemes
2 177 179 0 0 0 0 0 0 0 0
III B Unauthorized switch between Schemes
0 0 0 0 0 0 0 0 0 0 0
III C Deviation from Scheme attributes
0 0 0 0 0 0 0 0 0 0 0
III D Wrong or excess charges/load 0 0 0 0 0 0 0 0 0 0 0III E Non updation of changes viz.
address, PAN, bank details, nomination, etc
0 307 306 0 0 0 0 1 0 0 0
IV Others* 3 110 113 0 0 0 0 0 0 0 0 Total 37 3559 3583 0 0 0 0 13 0 0 0ICICI Prudential Mutual Fund for FY2018-2019 Complaints SummaryParticulars CountTotal Complaints Received 3559Total Number of Folios 7,706,864Percentage Complaints Against Folios 0.05%* If others include a type of complaint which is more than 10% of overall complaint, provide that reason separately.Example : Complaint number from I A to III E is 1000 and Others alone is 500 and transmission linked complaints (within others) are 200 then provide Transmission as separate reason (V) along with all other parameters# including against its authorized persons/ distributors/ employees. etc.$ Non actionable means the complaint that are incomplete / outside the scope of the mutual fund.
VII. CORPORATE GOVERNANCE
Pursuant to SEBI circular no. SEBI/IMD/CIR no. 18/198647/2010 dated March 15, 2010 and subsequent clarifications/circulars issued by SEBI, the Fund has formulated a policy for exercise of voting rights by the AMC in investee companies (i.e. companies in whose securities schemes of the Fund have invested).
The AMC has disclosed the Voting Policy and the votes exercised during FY2019 on a quarterly and annual basis along with Scrutinizer’s certification on website of the AMC, viz. www.icicipruamc.com.
VIII. STATUTORY INFORMATION
A. The Sponsors are not responsible or liable for any loss resulting from the operation of the schemes of the Fund beyond their initial contribution of ` 22.2 lakh for setting up the Fund and accretions/additions thereto.
B. The price and redemption value of the units, and income from them, can go up as well as down with fluctuations in the market values of the underlying investments.

15
C. Full Annual Report shall be disclosed on the website (www.icicipruamc.com) and shall be available for inspection at the Central Service Office of the AMC. Present and prospective unit holder can contact the Central Service Office of the AMC to obtain a physical copy of the trust deed and the full Annual Report of the Fund/ AMC.
IX. RISK MANAGEMENT SYSTEM
As mandated by a SEBI circular dated September 30, 2002, and in line with the policies of the sponsors of the Fund, the AMC has adopted a full-fledged risk-management framework. In the opinion of the Trustee, on the basis of the data presented by the AMC and reviewed at meetings of its Board of Directors, the system serves its objectives adequately.
X. LIABILITY AND RESPONSIBILITY OF THE TRUSTEE AND THE SPONSORS
The Trustee’s primary responsibility is to safeguard the interests of the unit holders and, inter alia, ensure that the AMC functions in the interests of investors and in accordance with the Regulations, the provisions of the Trust Deed, and the Scheme Information Documents of the Schemes of the Fund. From the information provided to the Trustee by the AMC and discussions with AMC officials at meetings of its Board and Committee, and reviews by the Trustee through its Board of Directors at such meetings, the Trustee is of the opinion that the AMC has operated in the interests of the unit holders and functioned in compliance with the Regulations.
The Sponsors are not responsible or liable for any loss or shortfall resulting from the operations of the Schemes beyond the initial contribution of ` 22.2 lakh collectively made by them towards setting up the Fund and such other accretions and additions to the corpus set up by the Sponsors
XI. ACKNOWLEDGEMENT
The Trustee expresses its gratitude to the unit holders, SEBI, RBI, AMFI, the registrars, bankers, the custodians of the Fund, the stock exchanges where the units of various Schemes are listed, Department of Investment and Public Asset Management, ICICI Bank Limited and Prudential plc. and the management and employees of the AMC for their continued support and assistance during the year.
For and on behalf of ICICI Prudential Trust Limited
Place: Mumbai Date: July 26, 2019 Sd/- Jyotin Mehta Director
Note: Source for compilation of key statistics and other data is the website of third party research agencies

16
ICICI Prudential Mutual FundAddress: 2nd Floor, Block B-2, Nirlon Knowledge Park, Western Express Highway, Goregaon, Mumbai – 400063Abridged Balance Sheet as at March 31, 2019 (figures as per Audited Financials)(As per format prescribed for Abridged schemewise Annual Report- SEBI/IMD/CIR No.8/132968/2008 dt 24/07/08) (` in Lakhs)
ICICI Prudential Bharat
Consumption Fund - Series 1 #
ICICI Prudential Bharat
Consumption Fund - Series 2 #
ICICI Prudential Bharat
Consumption Fund - Series 3 #
ICICI Prudential Bharat
Consumption Fund - Series 4 #
ICICI Prudential Bharat
Consumption Fund - Series 5 #
As at As at As at As at As at 31-Mar-2019 31-Mar-2019 31-Mar-2019 31-Mar-2019 31-Mar-2019
LIABILITIES1 Unit Capital 91,855.16 27,873.18 12,199.59 41,234.05 3,151.91 2 Reserves & Surplus2.1 Unit Premium Reserve - - - - - 2.2 Unrealised Appreciation Reserve - - - - 149.61 2.3 Other Reserves 2,252.05 56.89 376.45 (912.36) 39.34 3 Loans & Borrowings - - - - - 4 Current Liabilities & Provisions4.1 Provision for doubtful Income / deposits - - - - - 4.2 Other Current Liabilities & Provisions 492.78 144.12 61.25 101.49 9.48
TOTAL 94,599.99 28,074.19 12,637.29 40,423.18 3,350.34 ASSETS
1 Investments1.1 Listed Securities: 1.1.1.a Equity Shares 84,999.23 23,803.01 11,025.17 35,969.09 2,858.07 1.1.1.b Indian Depository Receipts - - - - - 1.1.1.c Warrants - - - - - 1.1.2 Preference Shares - - - - - 1.1.3 Equity Linked Debentures - - - - - 1.1.4 Other Debentures & Bonds - - - - - 1.1.5 Securitised Debt Securities - - - - - 1.2 Securities Awaited Listing:1.2.1 Equity Shares - - - - - 1.2.2 Preference Shares - - - - - 1.2.3 Equity Linked Debentures - - - - - 1.2.4 Other Debentures & Bonds - - - - - 1.2.5 Securitised Debt Securities - - - - - 1.3 Unlisted Securities:1.3.1 Equity Shares - - - - - 1.3.2 Preference Shares - - - - - 1.3.3 Equity Linked Debentures - - - - - 1.3.4 Other Debentures & Bonds - - - - - 1.3.5 Securitised Debt Securities - - - - - 1.4 Government Securities - - - - - 1.5 Treasury Bills - - - - - 1.6 Commercial Papers - - - - - 1.7 Certificate of Deposits - - - - - 1.8 Bill Rediscounting - - - - - 1.9 Units of Domestic Mutual Fund - - - - 20.19 1.10 Foreign Securities - - - - - 1.11 Gold - - - - - 1.12 Units of Infrastructure Investment Trusts - - - - - 1.13 Units of Real Estate Investment Trusts - - - - -
Investments 84,999.23 23,803.01 11,025.17 35,969.09 2,878.26 2 Deposits 4,058.16 1,616.62 608.17 725.22 2.52 3 Other Current Assets3.1 Cash & Bank Balance 97.35 0.50 2.00 0.50 0.50 3.2 Collateralised Lending / Reverse Repo / Tri-Party Repo 2,241.28 1,231.89 621.14 3,671.33 433.83 3.3 Others 3,203.97 1,422.17 380.81 57.04 35.23 4 Deferred Revenue Expenditure - - - - -
(To the Extent not written off)TOTAL 94,599.99 28,074.19 12,637.29 40,423.18 3,350.34 Fund Manager Sankaran Naren
& Atul Patel Mrinal Singh Sankaran Naren
& Atul PatelSankaran Naren & Rajat Chandak
Sankaran Naren & Roshan Chutkey
Annexure I- Notes to Accounts Figures Less than ` 500 are shown as zero # Schemes were launched after 31.03.2018, hence there are no previous year figures.

17
ICICI Prudential Mutual FundAddress: 2nd Floor, Block B-2, Nirlon Knowledge Park, Western Express Highway, Goregaon, Mumbai – 400063Abridged Balance Sheet as at March 31, 2019 (figures as per Audited Financials)(As per format prescribed for Abridged schemewise Annual Report- SEBI/IMD/CIR No.8/132968/2008 dt 24/07/08) (` in Lakhs)
ICICI Prudential Business Cycle Fund Series 1
ICICI Prudential Growth Fund - Series 1
ICICI Prudential Growth Fund - Series 2
As at As at As at As at As at As at 31-Mar-2019 31-Mar-2018 31-Mar-2019 31-Mar-2018 31-Mar-2019 31-Mar-2018
LIABILITIES1 Unit Capital 26,803.37 26,803.37 9,214.27 9,214.27 4,082.08 4,088.57 2 Reserves & Surplus2.1 Unit Premium Reserve - - - - - - 2.2 Unrealised Appreciation Reserve - 179.94 795.71 - 584.58 298.77 2.3 Other Reserves 1,014.63 2,289.19 419.59 213.20 210.88 (9.18)3 Loans & Borrowings - - - - - - 4 Current Liabilities & Provisions4.1 Provision for doubtful Income / deposits - - - - - - 4.2 Other Current Liabilities & Provisions 50.19 3,386.31 28.21 187.44 17.85 446.48
TOTAL 27,868.19 32,658.81 10,457.78 9,614.91 4,895.39 4,824.64 ASSETS
1 Investments1.1 Listed Securities: 1.1.1.a Equity Shares 15,999.42 24,135.35 8,605.60 7,476.77 4,215.91 3,941.96 1.1.1.b Indian Depository Receipts - - - - - - 1.1.1.c Warrants - - - - - - 1.1.2 Preference Shares - - - - - - 1.1.3 Equity Linked Debentures - - - - - - 1.1.4 Other Debentures & Bonds - - - - - - 1.1.5 Securitised Debt Securities - - - - - - 1.2 Securities Awaited Listing:1.2.1 Equity Shares - - - - - - 1.2.2 Preference Shares - - - - - - 1.2.3 Equity Linked Debentures - - - - - - 1.2.4 Other Debentures & Bonds - - - - - - 1.2.5 Securitised Debt Securities - - - - - - 1.3 Unlisted Securities:1.3.1 Equity Shares - - - - - - 1.3.2 Preference Shares - - - - - - 1.3.3 Equity Linked Debentures - - - - - - 1.3.4 Other Debentures & Bonds - - - - - - 1.3.5 Securitised Debt Securities - - - - - - 1.4 Government Securities - - - - - - 1.5 Treasury Bills - - - - - - 1.6 Commercial Papers - - - - - - 1.7 Certificate of Deposits - - - - - - 1.8 Bill Rediscounting - - - - - - 1.9 Units of Domestic Mutual Fund - - - 314.99 12.09 - 1.10 Foreign Securities - - - - - - 1.11 Gold - - - - - - 1.12 Units of Infrastructure Investment Trusts - - - - - - 1.13 Units of Real Estate Investment Trusts - - - - - -
Investments 15,999.42 24,135.35 8,605.60 7,791.76 4,228.00 3,941.96 2 Deposits 41.82 10.14 8.73 2.95 3.16 11.98 3 Other Current Assets3.1 Cash & Bank Balance 0.50 752.14 0.50 1.37 0.50 1.41 3.2 Collateralised Lending / Reverse Repo / Tri-Party Repo 10,039.89 5,606.73 378.65 1,281.91 452.71 461.01 3.3 Others 1,786.56 2,154.45 1,464.30 536.92 211.02 408.28 4 Deferred Revenue Expenditure - - - - - -
(To the Extent not written off)TOTAL 27,868.19 32,658.81 10,457.78 9,614.91 4,895.39 4,824.64 Fund Manager Mrinal Singh and
Mittul Kalawadia Sankaran Naren & Atul Patel Mittul Kalawadia & Mrinal Singh
Annexure I- Notes to Accounts Figures Less than ` 500 are shown as zero # Schemes were launched after 31.03.2018, hence there are no previous year figures.

18
ICICI Prudential Mutual FundAddress: 2nd Floor, Block B-2, Nirlon Knowledge Park, Western Express Highway, Goregaon, Mumbai – 400063Abridged Balance Sheet as at March 31, 2019 (figures as per Audited Financials)(As per format prescribed for Abridged schemewise Annual Report- SEBI/IMD/CIR No.8/132968/2008 dt 24/07/08) (` in Lakhs)
ICICI Prudential Growth Fund - Series 3
ICICI Prudential India Recovery Fund - Series 5
ICICI Prudential India Recovery Fund - Series 7
As at As at As at As at As at As at 31-Mar-2019 31-Mar-2018 31-Mar-2019 31-Mar-2018 31-Mar-2019 31-Mar-2018
LIABILITIES1 Unit Capital 4,196.60 29,802.95 6,539.90 6,539.90 4,189.45 4,189.45 2 Reserves & Surplus2.1 Unit Premium Reserve - - - - - - 2.2 Unrealised Appreciation Reserve - - 319.63 - 281.56 42.30 2.3 Other Reserves 226.44 1,785.04 860.54 818.38 172.32 38.48 3 Loans & Borrowings - - - - - - 4 Current Liabilities & Provisions4.1 Provision for doubtful Income / deposits - - - - - - 4.2 Other Current Liabilities & Provisions 8.98 120.87 23.64 57.51 10.10 8.58
TOTAL 4,432.02 31,708.86 7,743.71 7,415.79 4,653.43 4,278.81 ASSETS
1 Investments1.1 Listed Securities: 1.1.1.a Equity Shares 3,586.82 - 6,223.59 6,256.80 3,901.05 3,167.07 1.1.1.b Indian Depository Receipts - - - - - - 1.1.1.c Warrants - - - - - - 1.1.2 Preference Shares - - - - - - 1.1.3 Equity Linked Debentures - - - - - - 1.1.4 Other Debentures & Bonds - - - - - - 1.1.5 Securitised Debt Securities - - - - - - 1.2 Securities Awaited Listing:1.2.1 Equity Shares - - - - - - 1.2.2 Preference Shares - - - - - - 1.2.3 Equity Linked Debentures - - - - - - 1.2.4 Other Debentures & Bonds - - - - - - 1.2.5 Securitised Debt Securities - - - - - - 1.3 Unlisted Securities:1.3.1 Equity Shares - - - - - - 1.3.2 Preference Shares - - - - - - 1.3.3 Equity Linked Debentures - - - - - - 1.3.4 Other Debentures & Bonds - - - - - - 1.3.5 Securitised Debt Securities - - - - - - 1.4 Government Securities - - - - - - 1.5 Treasury Bills - - - - - - 1.6 Commercial Papers - - - - - - 1.7 Certificate of Deposits - - - - - - 1.8 Bill Rediscounting - - - - - - 1.9 Units of Domestic Mutual Fund - - - - - 174.99 1.10 Foreign Securities - - - - - - 1.11 Gold - - - - - - 1.12 Units of Infrastructure Investment Trusts - - - - - - 1.13 Units of Real Estate Investment Trusts - - - - - -
Investments 3,586.82 - 6,223.59 6,256.80 3,901.05 3,342.06 2 Deposits 79.68 13.87 5.93 1.24 152.49 1.03 3 Other Current Assets3.1 Cash & Bank Balance 0.50 0.50 0.50 0.50 0.50 0.50 3.2 Collateralised Lending / Reverse Repo / Tri-Party Repo 719.29 26,989.10 823.91 962.03 417.66 792.59 3.3 Others 45.73 4,705.39 689.78 195.22 181.73 142.63 4 Deferred Revenue Expenditure - - - - - -
(To the Extent not written off)TOTAL 4,432.02 31,708.86 7,743.71 7,415.79 4,653.43 4,278.81 Fund Manager Sankaran Naren & Ashwin Jain Atul Patel Sankaran Naren & Atul Patel
Annexure I- Notes to Accounts Figures Less than ` 500 are shown as zero # Schemes were launched after 31.03.2018, hence there are no previous year figures.

19
ICICI Prudential Mutual FundAddress: 2nd Floor, Block B-2, Nirlon Knowledge Park, Western Express Highway, Goregaon, Mumbai – 400063Abridged Balance Sheet as at March 31, 2019 (figures as per Audited Financials)(As per format prescribed for Abridged schemewise Annual Report- SEBI/IMD/CIR No.8/132968/2008 dt 24/07/08) (` in Lakhs)
ICICI Prudential Value Fund - Series 10
ICICI Prudential Value Fund - Series 11
ICICI Prudential Value Fund - Series 12
As at As at As at As at As at As at 31-Mar-2019 31-Mar-2018 31-Mar-2019 31-Mar-2018 31-Mar-2019 31-Mar-2018
LIABILITIES1 Unit Capital 13,490.33 13,490.33 12,661.11 12,661.11 66,149.00 66,149.00 2 Reserves & Surplus2.1 Unit Premium Reserve - - - - - - 2.2 Unrealised Appreciation Reserve - - 621.71 476.13 887.61 - 2.3 Other Reserves 782.60 928.20 649.70 883.01 4,677.54 (545.43)3 Loans & Borrowings - - - - - - 4 Current Liabilities & Provisions4.1 Provision for doubtful Income / deposits - - - - - - 4.2 Other Current Liabilities & Provisions 23.61 790.59 590.86 1,027.86 126.16 99.30
TOTAL 14,296.54 15,209.12 14,523.38 15,048.11 71,840.31 65,702.87 ASSETS
1 Investments1.1 Listed Securities: 1.1.1.a Equity Shares 11,638.41 11,002.38 11,852.08 12,256.17 62,752.55 56,494.66 1.1.1.b Indian Depository Receipts - - - - - - 1.1.1.c Warrants - 189.12 - - - - 1.1.2 Preference Shares - - - - - - 1.1.3 Equity Linked Debentures - - - - - - 1.1.4 Other Debentures & Bonds - - - - - - 1.1.5 Securitised Debt Securities - - - - - - 1.2 Securities Awaited Listing:1.2.1 Equity Shares - 733.26 - 585.39 - - 1.2.2 Preference Shares - - - - - - 1.2.3 Equity Linked Debentures - - - - - - 1.2.4 Other Debentures & Bonds - - - - - - 1.2.5 Securitised Debt Securities - - - - - - 1.3 Unlisted Securities:1.3.1 Equity Shares - - - - - - 1.3.2 Preference Shares - - - - - - 1.3.3 Equity Linked Debentures - - - - - - 1.3.4 Other Debentures & Bonds - - - - - - 1.3.5 Securitised Debt Securities - - - - - - 1.4 Government Securities - - - - - - 1.5 Treasury Bills - - - - - - 1.6 Commercial Papers - - - - - - 1.7 Certificate of Deposits - - - - - - 1.8 Bill Rediscounting - - - - - - 1.9 Units of Domestic Mutual Fund 96.72 - - - - - 1.10 Foreign Securities - - - - - - 1.11 Gold - - - - - - 1.12 Units of Infrastructure Investment Trusts - - - - - - 1.13 Units of Real Estate Investment Trusts - - - - - -
Investments 11,735.13 11,924.76 11,852.08 12,841.56 62,752.55 56,494.66 2 Deposits 351.44 1.50 13.97 3.64 56.68 23.61 3 Other Current Assets3.1 Cash & Bank Balance 0.50 458.91 341.24 0.50 0.50 0.54 3.2 Collateralised Lending / Reverse Repo / Tri-Party Repo 1,257.01 1,723.37 2,167.99 2,092.62 8,704.05 6,839.27 3.3 Others 952.46 1,100.58 148.10 109.79 326.53 2,344.79 4 Deferred Revenue Expenditure - - - - - -
(To the Extent not written off)TOTAL 14,296.54 15,209.12 14,523.38 15,048.11 71,840.31 65,702.87 Fund Manager Mrinal Singh and
Mittul Kalawadia Sankaran Naren & Rajat Chandak Sankaran Naren
Annexure I- Notes to Accounts Figures Less than ` 500 are shown as zero # Schemes were launched after 31.03.2018, hence there are no previous year figures.

20
ICICI Prudential Mutual FundAddress: 2nd Floor, Block B-2, Nirlon Knowledge Park, Western Express Highway, Goregaon, Mumbai – 400063Abridged Balance Sheet as at March 31, 2019 (figures as per Audited Financials)(As per format prescribed for Abridged schemewise Annual Report- SEBI/IMD/CIR No.8/132968/2008 dt 24/07/08) (` in Lakhs)
ICICI Prudential Value Fund - Series 13
ICICI Prudential Value Fund - Series 14
ICICI Prudential Value Fund - Series 15
As at As at As at As at As at As at 31-Mar-2019 31-Mar-2018 31-Mar-2019 31-Mar-2018 31-Mar-2019 31-Mar-2018
LIABILITIES1 Unit Capital 67,833.74 67,833.74 51,460.85 51,460.85 56,624.47 56,624.47 2 Reserves & Surplus2.1 Unit Premium Reserve - - - - - - 2.2 Unrealised Appreciation Reserve - - - - - - 2.3 Other Reserves 3,860.55 (517.18) 2,465.52 1,331.51 5,231.09 529.23 3 Loans & Borrowings - - - - - - 4 Current Liabilities & Provisions4.1 Provision for doubtful Income / deposits - - - - - - 4.2 Other Current Liabilities & Provisions 119.33 21.26 115.52 58.14 2,436.26 432.07
TOTAL 71,813.62 67,337.82 54,041.89 52,850.50 64,291.82 57,585.77 ASSETS
1 Investments1.1 Listed Securities: 1.1.1.a Equity Shares 65,672.87 54,734.43 42,567.46 42,695.23 51,110.08 47,266.36 1.1.1.b Indian Depository Receipts - - - - - - 1.1.1.c Warrants - - - - - - 1.1.2 Preference Shares - - - - - - 1.1.3 Equity Linked Debentures - - - - - - 1.1.4 Other Debentures & Bonds - - - - - - 1.1.5 Securitised Debt Securities - - - - - - 1.2 Securities Awaited Listing:1.2.1 Equity Shares - - - - - - 1.2.2 Preference Shares - - - - - - 1.2.3 Equity Linked Debentures - - - - - - 1.2.4 Other Debentures & Bonds - - - - - - 1.2.5 Securitised Debt Securities - - - - - - 1.3 Unlisted Securities:1.3.1 Equity Shares - - - - - - 1.3.2 Preference Shares - - - - - - 1.3.3 Equity Linked Debentures - - - - - - 1.3.4 Other Debentures & Bonds - - - - - - 1.3.5 Securitised Debt Securities - - - - - - 1.4 Government Securities - - - - - - 1.5 Treasury Bills - - - - - - 1.6 Commercial Papers - - - - - - 1.7 Certificate of Deposits - - - - - - 1.8 Bill Rediscounting - - - - - - 1.9 Units of Domestic Mutual Fund - - - - - - 1.10 Foreign Securities - - - - - - 1.11 Gold - - - - - - 1.12 Units of Infrastructure Investment Trusts - - - - - - 1.13 Units of Real Estate Investment Trusts - - - - - -
Investments 65,672.87 54,734.43 42,567.46 42,695.23 51,110.08 47,266.36 2 Deposits 759.26 23.08 1,355.38 18.18 960.59 15.49 3 Other Current Assets3.1 Cash & Bank Balance 0.50 0.56 0.50 8.66 1,404.17 3.30 3.2 Collateralised Lending / Reverse Repo / Tri-Party Repo 5,307.64 10,115.16 10,001.13 8,406.96 8,931.21 9,128.76 3.3 Others 73.35 2,464.59 117.42 1,721.47 1,885.77 1,171.86 4 Deferred Revenue Expenditure - - - - - -
(To the Extent not written off)TOTAL 71,813.62 67,337.82 54,041.89 52,850.50 64,291.82 57,585.77 Fund Manager Sankaran Naren Prakash Gaurav Goel and
Ashwin JainSankaran Naren & Ihab Dalwai
Annexure I- Notes to Accounts Figures Less than ` 500 are shown as zero # Schemes were launched after 31.03.2018, hence there are no previous year figures.

21
ICICI Prudential Mutual FundAddress: 2nd Floor, Block B-2, Nirlon Knowledge Park, Western Express Highway, Goregaon, Mumbai – 400063Abridged Balance Sheet as at March 31, 2019 (figures as per Audited Financials)(As per format prescribed for Abridged schemewise Annual Report- SEBI/IMD/CIR No.8/132968/2008 dt 24/07/08) (` in Lakhs)
ICICI Prudential Value Fund - Series 16
ICICI Prudential Value Fund - Series 17
ICICI Prudential Value Fund - Series 18
As at As at As at As at As at As at 31-Mar-2019 31-Mar-2018 31-Mar-2019 31-Mar-2018 31-Mar-2019 31-Mar-2018
LIABILITIES1 Unit Capital 57,968.76 57,968.76 18,660.56 18,660.56 11,902.96 11,902.96 2 Reserves & Surplus2.1 Unit Premium Reserve - - - - - - 2.2 Unrealised Appreciation Reserve 3,139.44 - - - 364.42 - 2.3 Other Reserves 1,464.23 1,544.22 1,074.96 153.76 1,165.43 240.66 3 Loans & Borrowings - - - - - - 4 Current Liabilities & Provisions4.1 Provision for doubtful Income / deposits - - - - - - 4.2 Other Current Liabilities & Provisions 2,464.97 60.38 80.62 26.94 36.10 20.97
TOTAL 65,037.40 59,573.36 19,816.14 18,841.26 13,468.91 12,164.59 ASSETS
1 Investments1.1 Listed Securities: 1.1.1.a Equity Shares 52,879.78 47,040.48 15,744.83 15,206.92 9,810.34 9,918.97 1.1.1.b Indian Depository Receipts - - - - - - 1.1.1.c Warrants - - - - - - 1.1.2 Preference Shares - - - - - - 1.1.3 Equity Linked Debentures - - - - - - 1.1.4 Other Debentures & Bonds - - - - - - 1.1.5 Securitised Debt Securities - - - - - - 1.2 Securities Awaited Listing:1.2.1 Equity Shares - - - - - - 1.2.2 Preference Shares - - - - - - 1.2.3 Equity Linked Debentures - - - - - - 1.2.4 Other Debentures & Bonds - - - - - - 1.2.5 Securitised Debt Securities - - - - - - 1.3 Unlisted Securities:1.3.1 Equity Shares - - - - - - 1.3.2 Preference Shares - - - - - - 1.3.3 Equity Linked Debentures - - - - - - 1.3.4 Other Debentures & Bonds - - - - - - 1.3.5 Securitised Debt Securities - - - - - - 1.4 Government Securities - - - - - - 1.5 Treasury Bills - - - - - - 1.6 Commercial Papers - - - - - - 1.7 Certificate of Deposits - - - - - - 1.8 Bill Rediscounting - - - - - - 1.9 Units of Domestic Mutual Fund 1,515.58 - 229.53 - 144.96 - 1.10 Foreign Securities - - - - - - 1.11 Gold - - - - - - 1.12 Units of Infrastructure Investment Trusts - - - - - - 1.13 Units of Real Estate Investment Trusts - - - - - -
Investments 54,395.36 47,040.48 15,974.36 15,206.92 9,955.30 9,918.97 2 Deposits 37.74 20.21 516.06 5.86 561.95 3.66 3 Other Current Assets3.1 Cash & Bank Balance 1,234.23 21.74 0.50 8.23 0.50 3.10 3.2 Collateralised Lending / Reverse Repo / Tri-Party Repo 7,257.65 9,941.51 3,250.59 3,150.19 2,653.44 1,694.68 3.3 Others 2,112.42 2,549.42 74.63 470.06 297.72 544.18 4 Deferred Revenue Expenditure - - - - - -
(To the Extent not written off)TOTAL 65,037.40 59,573.36 19,816.14 18,841.26 13,468.91 12,164.59 Fund Manager Sankaran Naren & Prakash Gaurav
GoelSankaran Naren & Prakash Gaurav
GoelSankaran Naren & Prakash Gaurav
Goel
Annexure I- Notes to Accounts Figures Less than ` 500 are shown as zero # Schemes were launched after 31.03.2018, hence there are no previous year figures.

22
ICICI Prudential Mutual FundAddress: 2nd Floor, Block B-2, Nirlon Knowledge Park, Western Express Highway, Goregaon, Mumbai – 400063Abridged Balance Sheet as at March 31, 2019 (figures as per Audited Financials)(As per format prescribed for Abridged schemewise Annual Report- SEBI/IMD/CIR No.8/132968/2008 dt 24/07/08) (` in Lakhs)
ICICI Prudential Value Fund - Series 19
ICICI Prudential Value Fund - Series 20
ICICI Prudential Value Fund - Series 4
As at As at As at As at As at As at 31-Mar-2019 31-Mar-2018 31-Mar-2019 31-Mar-2018 31-Mar-2019 31-Mar-2018
LIABILITIES1 Unit Capital 183,441.13 183,441.13 51,758.41 51,758.41 5,748.24 5,748.24 2 Reserves & Surplus2.1 Unit Premium Reserve - - - - - - 2.2 Unrealised Appreciation Reserve - - - - 487.92 380.31 2.3 Other Reserves 9,664.61 (7,707.33) (895.42) (1,059.64) 1,380.45 1,708.18 3 Loans & Borrowings - - - - - - 4 Current Liabilities & Provisions4.1 Provision for doubtful Income / deposits - - - - - - 4.2 Other Current Liabilities & Provisions 323.86 295.59 104.03 109.46 12.29 193.13
TOTAL 193,429.60 176,029.39 50,967.02 50,808.23 7,628.90 8,029.86 ASSETS
1 Investments1.1 Listed Securities: 1.1.1.a Equity Shares 184,730.39 138,373.90 42,026.34 40,614.01 6,827.91 7,095.05 1.1.1.b Indian Depository Receipts - - - - - - 1.1.1.c Warrants - - - - - - 1.1.2 Preference Shares - - - - - - 1.1.3 Equity Linked Debentures - - - - - - 1.1.4 Other Debentures & Bonds - - - - - - 1.1.5 Securitised Debt Securities - - - - - - 1.2 Securities Awaited Listing:1.2.1 Equity Shares - 4,535.27 - 339.62 - - 1.2.2 Preference Shares - - - - - - 1.2.3 Equity Linked Debentures - - - - - - 1.2.4 Other Debentures & Bonds - - - - - - 1.2.5 Securitised Debt Securities - - - - - - 1.3 Unlisted Securities:1.3.1 Equity Shares - - - - - - 1.3.2 Preference Shares - - - - - - 1.3.3 Equity Linked Debentures - - - - - - 1.3.4 Other Debentures & Bonds - - - - - - 1.3.5 Securitised Debt Securities - - - - - - 1.4 Government Securities - - - - - - 1.5 Treasury Bills - - - - - - 1.6 Commercial Papers - - - - - - 1.7 Certificate of Deposits - - - - - - 1.8 Bill Rediscounting - - - - - - 1.9 Units of Domestic Mutual Fund - - 925.68 - - - 1.10 Foreign Securities - - - - - - 1.11 Gold - - - - - - 1.12 Units of Infrastructure Investment Trusts - - - - - - 1.13 Units of Real Estate Investment Trusts - - - - - -
Investments 184,730.39 142,909.17 42,952.02 40,953.63 6,827.91 7,095.05 2 Deposits 103.11 6,515.48 2,028.84 2,559.27 3.97 1.40 3 Other Current Assets3.1 Cash & Bank Balance 0.50 7.66 0.50 0.50 0.50 1.94 3.2 Collateralised Lending / Reverse Repo / Tri-Party Repo 7,644.64 23,963.57 2,540.20 5,284.13 714.80 930.83 3.3 Others 950.96 2,633.51 3,445.46 2,010.70 81.72 0.64 4 Deferred Revenue Expenditure - - - - - -
(To the Extent not written off)TOTAL 193,429.60 176,029.39 50,967.02 50,808.23 7,628.90 8,029.86 Fund Manager Sankaran Naren & Ashwin Jain Sankaran Naren & Mittul
KalawadiaMrinal Singh and
Rajat Chandak
Annexure I- Notes to Accounts Figures Less than ` 500 are shown as zero # Schemes were launched after 31.03.2018, hence there are no previous year figures.

23
ICICI Prudential Mutual FundAddress: 2nd Floor, Block B-2, Nirlon Knowledge Park, Western Express Highway, Goregaon, Mumbai – 400063Abridged Balance Sheet as at March 31, 2019 (figures as per Audited Financials)(As per format prescribed for Abridged schemewise Annual Report- SEBI/IMD/CIR No.8/132968/2008 dt 24/07/08) (` in Lakhs)
ICICI Prudential Value Fund Series 8 ICICI Prudential Value Fund - Series 9 As at As at As at As at
31-Mar-2019 31-Mar-2018 31-Mar-2019 31-Mar-2018LIABILITIES
1 Unit Capital 1,090.97 25,570.16 25,951.09 25,951.092 Reserves & Surplus2.1 Unit Premium Reserve - - - -2.2 Unrealised Appreciation Reserve - - 207.51 821.602.3 Other Reserves 44.75 808.59 3,030.64 1,457.543 Loans & Borrowings - - - -4 Current Liabilities & Provisions4.1 Provision for doubtful Income / deposits - - - -4.2 Other Current Liabilities & Provisions 1.81 37.67 25.26 65.19
TOTAL 1,137.53 26,416.42 29,214.50 28,295.42ASSETS
1 Investments1.1 Listed Securities: 1.1.1.a Equity Shares 989.47 24,639.48 23,989.97 23,221.05 1.1.1.b Indian Depository Receipts - - - - 1.1.1.c Warrants - - - - 1.1.2 Preference Shares - - - - 1.1.3 Equity Linked Debentures - - - - 1.1.4 Other Debentures & Bonds - - - - 1.1.5 Securitised Debt Securities - - - -1.2 Securities Awaited Listing:1.2.1 Equity Shares - - - -1.2.2 Preference Shares - - - -1.2.3 Equity Linked Debentures - - - -1.2.4 Other Debentures & Bonds - - - -1.2.5 Securitised Debt Securities - - - -1.3 Unlisted Securities:1.3.1 Equity Shares - - - -1.3.2 Preference Shares - - - -1.3.3 Equity Linked Debentures - - - -1.3.4 Other Debentures & Bonds - - - -1.3.5 Securitised Debt Securities - - - -1.4 Government Securities - - - -1.5 Treasury Bills - - - -1.6 Commercial Papers - - - -1.7 Certificate of Deposits - - - -1.8 Bill Rediscounting - - - -1.9 Units of Domestic Mutual Fund - - - 927.871.10 Foreign Securities - - - -1.11 Gold - - - -1.12 Units of Infrastructure Investment Trusts - - - -1.13 Units of Real Estate Investment Trusts - - - -
Investments 989.47 24,639.48 23,989.97 24,148.922 Deposits 1.14 5.49 22.45 7.343 Other Current Assets3.1 Cash & Bank Balance 0.50 0.53 0.50 0.503.2 Collateralised Lending / Reverse Repo / Tri-Party Repo 145.17 1,108.80 4,522.16 4,135.823.3 Others 1.25 662.12 679.42 2.844 Deferred Revenue Expenditure - - - -
(To the Extent not written off)TOTAL 1,137.53 26,416.42 29,214.50 28,295.42Fund Manager Sankaran Naren Sankaran Naren & Atul Patel
Annexure I- Notes to Accounts Figures Less than ` 500 are shown as zero # Schemes were launched after 31.03.2018, hence there are no previous year figures.

24
ICICI Prudential Mutual FundAddress: 2nd Floor, Block B-2, Nirlon Knowledge Park, Western Express Highway, Goregaon, Mumbai – 400063Abridged Revenue Account for the year/period ended March 31, 2019 (figures as per Audited Financials)(As per format prescribed for Abridged schemewise Annual Report- SEBI/IMD/CIR No.8/132968/2008 dt 24/07/08) (` in Lakhs)
ICICI Prudential Bharat
Consumption Fund - Series 1 #
ICICI Prudential Bharat
Consumption Fund - Series 2 #
ICICI Prudential Bharat
Consumption Fund - Series 3 #
ICICI Prudential Bharat
Consumption Fund - Series 4 #
ICICI Prudential Bharat
Consumption Fund - Series 5 #
Period Ended Period Ended Period Ended Period Ended Period Ended
31-Mar-2019 31-Mar-2019 31-Mar-2019 31-Mar-2019 31-Mar-2019
1 INCOME
1.1 Dividend 968.88 225.57 71.95 54.49 24.03
1.2 Interest 878.42 275.61 87.41 273.76 14.43
1.3 Realised Gains/(Losses) on Foreign Exchange Transactions - - - - -
1.4 Realised Gains/(Losses) on Interscheme sale of Investments - - - - -
1.5 Realised Gains/(Losses) on External Sale/Redemption of Investments (171.16) 322.82 39.82 (1,038.78) 9.61
1.6 Realised Gains/(Losses) on Derivative Transactions 5,303.73 992.83 520.94 1,792.55 21.08
1.7 Other Income - - - - -
( A ) 6,979.87 1,816.83 720.12 1,082.02 69.15
2 EXPENSES & LOSSES (Note 7)
2.1 Interest on Borrowing - - - - -
2.2 Management Fees 782.65 291.78 88.48 281.45 9.65
2.3 Goods & Services Tax on Management Fees 140.88 52.52 15.93 50.66 1.74
2.4 Transfer Agent’s Fees & Expenses 35.80 9.63 3.50 9.43 0.54
2.5 Custodian Fees 2.66 0.74 0.30 0.84 0.04
2.6 Trusteeship Fees 0.17 0.05 0.02 0.05 -
2.7 Commission to Agents 1,100.22 289.88 132.47 297.94 17.25
2.8 Marketing & Distribution Expenses 0.09 0.02 0.01 0.03 -
2.9 Audit Fees 0.94 0.47 0.47 0.47 0.18
2.10 Other Operating Expenses 23.27 6.31 2.37 7.27 0.41
( B ) 2,086.68 651.40 243.55 648.14 29.81
3 Net Realised Gains / (Losses) for the Year / Period (A-B = C) 4,893.19 1,165.43 476.57 433.88 39.34
4 Change in Unrealised Depreciation in value of Investments (D) 2,641.14 1,108.54 100.12 1,346.24 -
5 Net Gains / (Losses) for the Year/Period ( E= C - D) 2,252.05 56.89 376.45 (912.36) 39.34
6 Change in Unrealised Appreciation in value of Investments (F) - - - - 149.61
7 Net Surplus/ (Deficit) for the year/period (G = E + F) 2,252.05 56.89 376.45 (912.36) 188.95
7.1 Add: Balance Transfer from Unrealised Appreciation Reserve - - - - -
7.2 Less: Balance Transfer to Unrealised Appreciation Reserve - - - - 149.61
7.3 Add/(Less) : Premium on Redemption - - - - -
7.4 Surplus/(Deficit) brought forward - - - - -
8 Total 2,252.05 56.89 376.45 (912.36) 39.34
9 Dividend Appropriation
9.1 Income Distributed during the year/period - - - - -
9.2 Tax on Income distributed during the year/period - - - - -
10 Retained Surplus/ (Deficit) Carried forward to Balance Sheet 2,252.05 56.89 376.45 (912.36) 39.34
Fund Manager Sankaran Naren & Atul Patel
Mrinal Singh Sankaran Naren & Atul Patel
Sankaran Naren & Rajat Chandak
Sankaran Naren & Roshan Chutkey
Annexure I- Notes to Accounts Figures Less than ` 500 are shown as zero # Schemes were launched after 31.03.2018, hence there are no previous year figures.

25
ICICI Prudential Mutual FundAddress: 2nd Floor, Block B-2, Nirlon Knowledge Park, Western Express Highway, Goregaon, Mumbai – 400063Abridged Revenue Account for the year/period ended March 31, 2019 (figures as per Audited Financials)(As per format prescribed for Abridged schemewise Annual Report- SEBI/IMD/CIR No.8/132968/2008 dt 24/07/08) (` in Lakhs)
ICICI Prudential Business Cycle Fund Series 1
ICICI Prudential Growth Fund - Series 1
ICICI Prudential Growth Fund - Series 2
Year Ended Year Ended Year Ended
31-Mar-2019 31-Mar-2018 31-Mar-2019 31-Mar-2018 31-Mar-2019 31-Mar-2018
1 INCOME
1.1 Dividend 189.37 181.81 114.48 173.72 55.28 353.34
1.2 Interest 265.87 267.91 85.02 251.69 20.53 371.89
1.3 Realised Gains/(Losses) on Foreign Exchange Transactions
- - - - - -
1.4 Realised Gains/(Losses) on Interscheme sale of Investments
- - - 168.95 - 1,082.98
1.5 Realised Gains/(Losses) on External Sale/Redemption of Investments
(1,288.17) 7,223.65 188.57 9,274.95 340.58 13,967.32
1.6 Realised Gains/(Losses) on Derivative Transac-tions
638.82 916.02 66.20 335.28 (75.24) 69.41
1.7 Other Income 3.33 - 0.01 0.55 0.03 0.02
( A ) (190.78) 8,589.39 454.28 10,205.14 341.18 15,844.96
2 EXPENSES & LOSSES (Note 7)
2.1 Interest on Borrowing - - - - - -
2.2 Management Fees 491.23 584.81 138.79 274.53 68.84 532.68
2.3 Goods & Services Tax on Management Fees 88.42 102.21 24.98 44.77 12.39 91.43
2.4 Transfer Agent’s Fees & Expenses 10.77 13.28 3.60 10.70 1.61 19.17
2.5 Custodian Fees 0.95 1.14 0.28 0.59 0.14 1.29
2.6 Trusteeship Fees 0.05 0.07 0.02 0.05 0.01 0.04
2.7 Commission to Agents 120.02 144.85 87.61 240.01 37.30 493.76
2.8 Marketing & Distribution Expenses 0.02 0.13 0.01 0.13 - 0.13
2.9 Audit Fees 0.47 0.38 0.24 0.37 0.18 0.38
2.10 Other Operating Expenses 5.71 6.72 2.22 6.69 1.12 11.27
( B ) 717.64 853.59 257.75 577.84 121.59 1,150.15
3 Net Realised Gains / (Losses) for the Year / Period (A-B = C)
(908.42) 7,735.80 196.53 9,627.30 219.59 14,694.81
4 Change in Unrealised Depreciation in value of Investments (D)
546.08 3,378.44 - 6,697.34 - 8,816.07
5 Net Gains / (Losses) for the Year/Period ( E= C - D)
(1,454.50) 4,357.36 196.53 2,929.96 219.59 5,878.74
6 Change in Unrealised Appreciation in value of Investments (F)
- - 805.57 - 285.80 -
7 Net Surplus/ (Deficit) for the year/period (G = E + F)
(1,454.50) 4,357.36 1,002.10 2,929.96 505.39 5,878.74
7.1 Add: Balance Transfer from Unrealised Apprecia-tion Reserve
179.94 3,558.39 - 6,687.48 298.77 9,114.85
7.2 Less: Balance Transfer to Unrealised Apprecia-tion Reserve
- 179.94 795.71 - 584.58 298.77
7.3 Add/(Less) : Premium on Redemption - - - (7,504.47) (0.61) (8,153.58)
7.4 Surplus/(Deficit) brought forward 2,289.19 1,283.96 213.20 4,246.75 (9.18) 2,928.62
8 Total 1,014.63 9,019.77 419.59 6,359.72 209.79 9,469.86
9 Dividend Appropriation
9.1 Income Distributed during the year/period - 6,730.58 - 6,146.52 (1.09) 9,479.04
9.2 Tax on Income distributed during the year/period - - - - - -
10 Retained Surplus/ (Deficit) Carried forward to Balance Sheet
1,014.63 2,289.19 419.59 213.20 210.88 (9.18)
Fund Manager Mrinal Singh and Mittul Kalawadia
Sankaran Naren and Atul Patel
Mittul Kalawadia and Mrinal Singh
Annexure I- Notes to Accounts Figures Less than ` 500 are shown as zero # Schemes were launched after 31.03.2018, hence there are no previous year figures.

26
ICICI Prudential Mutual FundAddress: 2nd Floor, Block B-2, Nirlon Knowledge Park, Western Express Highway, Goregaon, Mumbai – 400063Abridged Revenue Account for the year/period ended March 31, 2019 (figures as per Audited Financials)(As per format prescribed for Abridged schemewise Annual Report- SEBI/IMD/CIR No.8/132968/2008 dt 24/07/08) (` in Lakhs)
ICICI Prudential Growth Fund - Series 3
ICICI Prudential India Recovery Fund - Series 5
ICICI Prudential India Recovery Fund - Series 7
Year Ended Year Ended Year Ended
31-Mar-2019 31-Mar-2018 31-Mar-2019 31-Mar-2018 31-Mar-2019 31-Mar-2018
1 INCOME
1.1 Dividend 69.82 232.10 113.26 127.31 66.87 61.22
1.2 Interest 89.27 286.69 38.65 27.14 31.34 36.30
1.3 Realised Gains/(Losses) on Foreign Exchange Transactions
0.01 27.36 - - - -
1.4 Realised Gains/(Losses) on Interscheme sale of Investments
- 1,150.98 - - - -
1.5 Realised Gains/(Losses) on External Sale/Redemption of Investments
31.79 10,863.73 (266.70) 758.32 19.04 1,147.31
1.6 Realised Gains/(Losses) on Derivative Transac-tions
322.00 (405.98) 164.11 36.39 131.94 71.47
1.7 Other Income 0.22 0.15 - - - -
( A ) 513.11 12,155.03 49.32 949.16 249.19 1,316.30
2 EXPENSES & LOSSES (Note 7)
2.1 Interest on Borrowing - - - - - -
2.2 Management Fees 55.01 462.64 125.43 134.47 52.90 62.04
2.3 Goods & Services Tax on Management Fees 9.90 79.81 22.58 23.21 9.52 10.53
2.4 Transfer Agent’s Fees & Expenses 2.56 12.27 2.96 1.70 1.78 1.97
2.5 Custodian Fees 0.25 1.23 0.32 0.29 0.17 0.17
2.6 Trusteeship Fees 0.01 0.08 0.01 0.01 0.01 0.01
2.7 Commission to Agents 59.65 418.78 49.37 48.76 49.79 53.25
2.8 Marketing & Distribution Expenses - 11.13 0.01 0.13 - 0.13
2.9 Audit Fees 0.18 0.38 0.24 0.18 0.18 0.14
2.10 Other Operating Expenses 1.95 8.94 1.61 1.65 1.00 1.12
( B ) 129.51 995.26 202.53 210.40 115.35 129.36
3 Net Realised Gains / (Losses) for the Year / Period (A-B = C)
383.60 11,159.77 (153.21) 738.76 133.84 1,186.94
4 Change in Unrealised Depreciation in value of Investments (D)
73.47 5,069.36 - 116.44 - 649.43
5 Net Gains / (Losses) for the Year/Period ( E= C - D)
310.13 6,090.41 (153.21) 622.32 133.84 537.51
6 Change in Unrealised Appreciation in value of Investments (F)
- - 515.00 - 239.26 -
7 Net Surplus/ (Deficit) for the year/period (G = E + F)
310.13 6,090.41 361.79 622.32 373.10 537.51
7.1 Add: Balance Transfer from Unrealised Apprecia-tion Reserve
- 4,966.76 - - 42.30 691.73
7.2 Less: Balance Transfer to Unrealised Apprecia-tion Reserve
- - 319.63 - 281.56 42.30
7.3 Add/(Less) : Premium on Redemption (1,868.85) - - - - -
7.4 Surplus/(Deficit) brought forward 1,785.04 2,649.16 818.38 1,117.46 38.48 129.32
8 Total 226.32 13,706.33 860.54 1,739.78 172.32 1,316.26
9 Dividend Appropriation
9.1 Income Distributed during the year/period (0.12) 11,921.29 - 921.40 - 1,277.78
9.2 Tax on Income distributed during the year/period - - - - - -
10 Retained Surplus/ (Deficit) Carried forward to Balance Sheet
226.44 1,785.04 860.54 818.38 172.32 38.48
Fund Manager Sankaran Naren and Ashwin Jain
Atul Patel Sankaran Naren and Atul Patel
Annexure I- Notes to Accounts Figures Less than ` 500 are shown as zero # Schemes were launched after 31.03.2018, hence there are no previous year figures.

27
ICICI Prudential Mutual FundAddress: 2nd Floor, Block B-2, Nirlon Knowledge Park, Western Express Highway, Goregaon, Mumbai – 400063Abridged Revenue Account for the year/period ended March 31, 2019 (figures as per Audited Financials)(As per format prescribed for Abridged schemewise Annual Report- SEBI/IMD/CIR No.8/132968/2008 dt 24/07/08) (` in Lakhs)
ICICI Prudential Value Fund - Series 10
ICICI Prudential Value Fund - Series 11
ICICI Prudential Value Fund - Series 12
Year Ended Year Ended Year Ended Period Ended
31-Mar-2019 31-Mar-2018 31-Mar-2019 31-Mar-2018 31-Mar-2019 31-Mar-2018
1 INCOME
1.1 Dividend 128.83 165.62 103.86 128.23 1,847.34 1,186.20
1.2 Interest 126.65 96.53 73.02 52.33 629.07 815.63
1.3 Realised Gains/(Losses) on Foreign Exchange Transactions
- - - - - -
1.4 Realised Gains/(Losses) on Interscheme sale of Investments
- - - - 131.03 22.03
1.5 Realised Gains/(Losses) on External Sale/Redemption of Investments
480.13 2,118.53 (135.48) 2,375.46 90.94 10,965.66
1.6 Realised Gains/(Losses) on Derivative Transac-tions
(98.92) (36.24) 61.69 - 2,217.86 (1,596.47)
1.7 Other Income 0.08 - 0.12 0.01 0.02 -
( A ) 636.77 2,344.44 103.21 2,556.03 4,916.26 11,393.05
2 EXPENSES & LOSSES (Note 7)
2.1 Interest on Borrowing - - - - - -
2.2 Management Fees 160.22 170.80 179.30 173.40 358.19 328.35
2.3 Goods & Services Tax on Management Fees 28.84 29.52 32.27 29.98 64.47 56.65
2.4 Transfer Agent’s Fees & Expenses 5.28 6.42 5.15 5.89 25.20 29.69
2.5 Custodian Fees 0.49 0.59 0.50 0.56 2.29 2.39
2.6 Trusteeship Fees 0.03 0.03 0.03 0.03 0.13 0.15
2.7 Commission to Agents 164.64 191.59 115.91 144.87 1,002.81 1,251.27
2.8 Marketing & Distribution Expenses 0.01 0.13 0.01 0.13 0.07 0.32
2.9 Audit Fees 0.47 0.36 0.47 0.36 0.95 0.74
2.10 Other Operating Expenses 3.14 3.54 2.87 3.11 15.29 22.33
( B ) 363.12 402.98 336.51 358.33 1,469.40 1,691.89
3 Net Realised Gains / (Losses) for the Year / Period (A-B = C)
273.65 1,941.46 (233.30) 2,197.70 3,446.86 9,701.16
4 Change in Unrealised Depreciation in value of Investments (D)
419.25 1,462.62 - - - 1,775.57
5 Net Gains / (Losses) for the Year/Period ( E= C - D)
(145.60) 478.84 (233.30) 2,197.70 3,446.86 7,925.59
6 Change in Unrealised Appreciation in value of Investments (F)
- - 145.57 330.05 2,663.17 -
7 Net Surplus/ (Deficit) for the year/period (G = E + F)
(145.60) 478.84 (87.73) 2,527.75 6,110.03 7,925.59
7.1 Add: Balance Transfer from Unrealised Apprecia-tion Reserve
- 1,374.97 476.13 146.09 - -
7.2 Less: Balance Transfer to Unrealised Apprecia-tion Reserve
- - 621.71 476.13 887.61 -
7.3 Add/(Less) : Premium on Redemption - - - - - -
7.4 Surplus/(Deficit) brought forward 928.20 186.01 883.01 82.48 (545.43) -
8 Total 782.60 2,039.82 649.70 2,280.19 4,676.99 7,925.59
9 Dividend Appropriation
9.1 Income Distributed during the year/period - 1,111.62 - 1,397.18 (0.55) 8,471.02
9.2 Tax on Income distributed during the year/period - - - - - -
10 Retained Surplus/ (Deficit) Carried forward to Balance Sheet
782.60 928.20 649.70 883.01 4,677.54 (545.43)
Fund Manager Mrinal Singh and Mittul Kalawadia
Sankaran Naren and Rajat Chandak
Sankaran Naren
Annexure I- Notes to Accounts Figures Less than ` 500 are shown as zero # Schemes were launched after 31.03.2018, hence there are no previous year figures.

28
ICICI Prudential Mutual FundAddress: 2nd Floor, Block B-2, Nirlon Knowledge Park, Western Express Highway, Goregaon, Mumbai – 400063Abridged Revenue Account for the year/period ended March 31, 2019 (figures as per Audited Financials)(As per format prescribed for Abridged schemewise Annual Report- SEBI/IMD/CIR No.8/132968/2008 dt 24/07/08) (` in Lakhs)
ICICI Prudential Value Fund - Series 13
ICICI Prudential Value Fund - Series 14
ICICI Prudential Value Fund - Series 15
Year Ended Period Ended Year Ended Period Ended Year Ended Period Ended
31-Mar-2019 31-Mar-2018 31-Mar-2019 31-Mar-2018 31-Mar-2019 31-Mar-2018
1 INCOME
1.1 Dividend 1,932.87 1,289.01 981.61 944.35 1,205.89 563.90
1.2 Interest 717.82 642.96 638.17 464.41 518.17 343.63
1.3 Realised Gains/(Losses) on Foreign Exchange Transactions
- - - - - -
1.4 Realised Gains/(Losses) on Interscheme sale of Investments
- 11.98 - - - (0.01)
1.5 Realised Gains/(Losses) on External Sale/Redemption of Investments
(1,244.38) 6,832.63 (1,832.10) 3,451.40 2,773.73 2,866.44
1.6 Realised Gains/(Losses) on Derivative Transac-tions
4,550.79 1,121.58 869.60 438.73 1,361.74 419.90
1.7 Other Income 0.03 - 0.01 - 0.01 -
( A ) 5,957.13 9,898.16 657.29 5,298.89 5,859.54 4,193.86
2 EXPENSES & LOSSES (Note 7)
2.1 Interest on Borrowing - - - - - -
2.2 Management Fees 464.34 401.54 284.39 293.87 522.42 301.94
2.3 Goods & Services Tax on Management Fees 83.62 70.82 51.19 52.48 94.03 54.35
2.4 Transfer Agent’s Fees & Expenses 25.94 18.46 19.41 19.24 21.38 18.06
2.5 Custodian Fees 2.30 2.26 1.68 1.51 1.96 1.51
2.6 Trusteeship Fees 0.13 0.15 0.10 0.11 0.11 0.09
2.7 Commission to Agents 891.39 1,032.11 712.30 663.18 647.53 662.67
2.8 Marketing & Distribution Expenses 0.07 0.13 0.03 0.13 0.03 0.70
2.9 Audit Fees 0.95 0.74 0.95 0.74 0.95 0.74
2.10 Other Operating Expenses 15.70 21.30 11.63 15.90 12.47 15.09
( B ) 1,484.44 1,547.51 1,081.68 1,047.16 1,300.88 1,055.15
3 Net Realised Gains / (Losses) for the Year / Period (A-B = C)
4,472.69 8,350.65 (424.39) 4,251.73 4,558.66 3,138.71
4 Change in Unrealised Depreciation in value of Investments (D)
94.95 3,908.25 - 1,876.84 - 2,068.03
5 Net Gains / (Losses) for the Year/Period ( E= C - D)
4,377.74 4,442.40 (424.39) 2,374.89 4,558.66 1,070.68
6 Change in Unrealised Appreciation in value of Investments (F)
- - 1,558.40 - 143.20 -
7 Net Surplus/ (Deficit) for the year/period (G = E + F)
4,377.74 4,442.40 1,134.01 2,374.89 4,701.86 1,070.68
7.1 Add: Balance Transfer from Unrealised Apprecia-tion Reserve
- - - - - -
7.2 Less: Balance Transfer to Unrealised Apprecia-tion Reserve
- - - - - -
7.3 Add/(Less) : Premium on Redemption - - - - - -
7.4 Surplus/(Deficit) brought forward (517.18) - 1,331.51 - 529.23 -
8 Total 3,860.56 4,442.40 2,465.52 2,374.89 5,231.09 1,070.68
9 Dividend Appropriation
9.1 Income Distributed during the year/period 0.01 4,959.58 - 1,043.38 - 541.45
9.2 Tax on Income distributed during the year/period - - - - - -
10 Retained Surplus/ (Deficit) Carried forward to Balance Sheet
3,860.55 (517.18) 2,465.52 1,331.51 5,231.09 529.23
Fund Manager Sankaran Naren Prakash Gaurav Goel and Ashwin Jain
Sankaran Naren and Ihab Dalwai
Annexure I- Notes to Accounts Figures Less than ` 500 are shown as zero # Schemes were launched after 31.03.2018, hence there are no previous year figures.
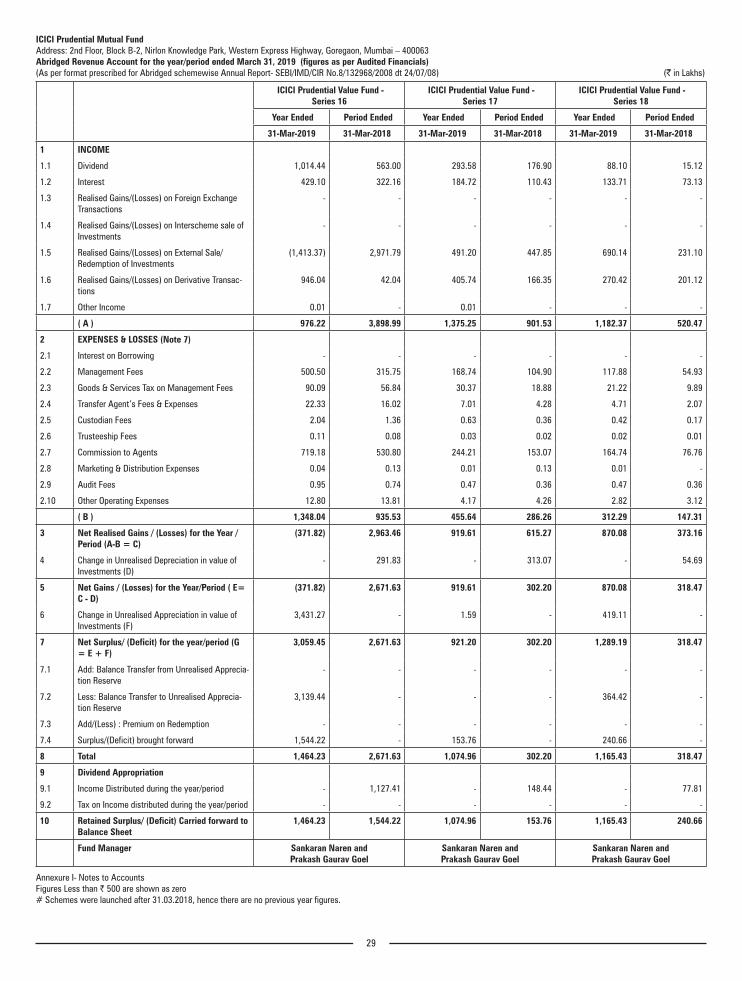
29
ICICI Prudential Mutual FundAddress: 2nd Floor, Block B-2, Nirlon Knowledge Park, Western Express Highway, Goregaon, Mumbai – 400063Abridged Revenue Account for the year/period ended March 31, 2019 (figures as per Audited Financials)(As per format prescribed for Abridged schemewise Annual Report- SEBI/IMD/CIR No.8/132968/2008 dt 24/07/08) (` in Lakhs)
ICICI Prudential Value Fund - Series 16
ICICI Prudential Value Fund - Series 17
ICICI Prudential Value Fund - Series 18
Year Ended Period Ended Year Ended Period Ended Year Ended Period Ended
31-Mar-2019 31-Mar-2018 31-Mar-2019 31-Mar-2018 31-Mar-2019 31-Mar-2018
1 INCOME
1.1 Dividend 1,014.44 563.00 293.58 176.90 88.10 15.12
1.2 Interest 429.10 322.16 184.72 110.43 133.71 73.13
1.3 Realised Gains/(Losses) on Foreign Exchange Transactions
- - - - - -
1.4 Realised Gains/(Losses) on Interscheme sale of Investments
- - - - - -
1.5 Realised Gains/(Losses) on External Sale/Redemption of Investments
(1,413.37) 2,971.79 491.20 447.85 690.14 231.10
1.6 Realised Gains/(Losses) on Derivative Transac-tions
946.04 42.04 405.74 166.35 270.42 201.12
1.7 Other Income 0.01 - 0.01 - - -
( A ) 976.22 3,898.99 1,375.25 901.53 1,182.37 520.47
2 EXPENSES & LOSSES (Note 7)
2.1 Interest on Borrowing - - - - - -
2.2 Management Fees 500.50 315.75 168.74 104.90 117.88 54.93
2.3 Goods & Services Tax on Management Fees 90.09 56.84 30.37 18.88 21.22 9.89
2.4 Transfer Agent’s Fees & Expenses 22.33 16.02 7.01 4.28 4.71 2.07
2.5 Custodian Fees 2.04 1.36 0.63 0.36 0.42 0.17
2.6 Trusteeship Fees 0.11 0.08 0.03 0.02 0.02 0.01
2.7 Commission to Agents 719.18 530.80 244.21 153.07 164.74 76.76
2.8 Marketing & Distribution Expenses 0.04 0.13 0.01 0.13 0.01 -
2.9 Audit Fees 0.95 0.74 0.47 0.36 0.47 0.36
2.10 Other Operating Expenses 12.80 13.81 4.17 4.26 2.82 3.12
( B ) 1,348.04 935.53 455.64 286.26 312.29 147.31
3 Net Realised Gains / (Losses) for the Year / Period (A-B = C)
(371.82) 2,963.46 919.61 615.27 870.08 373.16
4 Change in Unrealised Depreciation in value of Investments (D)
- 291.83 - 313.07 - 54.69
5 Net Gains / (Losses) for the Year/Period ( E= C - D)
(371.82) 2,671.63 919.61 302.20 870.08 318.47
6 Change in Unrealised Appreciation in value of Investments (F)
3,431.27 - 1.59 - 419.11 -
7 Net Surplus/ (Deficit) for the year/period (G = E + F)
3,059.45 2,671.63 921.20 302.20 1,289.19 318.47
7.1 Add: Balance Transfer from Unrealised Apprecia-tion Reserve
- - - - - -
7.2 Less: Balance Transfer to Unrealised Apprecia-tion Reserve
3,139.44 - - - 364.42 -
7.3 Add/(Less) : Premium on Redemption - - - - - -
7.4 Surplus/(Deficit) brought forward 1,544.22 - 153.76 - 240.66 -
8 Total 1,464.23 2,671.63 1,074.96 302.20 1,165.43 318.47
9 Dividend Appropriation
9.1 Income Distributed during the year/period - 1,127.41 - 148.44 - 77.81
9.2 Tax on Income distributed during the year/period - - - - - -
10 Retained Surplus/ (Deficit) Carried forward to Balance Sheet
1,464.23 1,544.22 1,074.96 153.76 1,165.43 240.66
Fund Manager Sankaran Naren and Prakash Gaurav Goel
Sankaran Naren and Prakash Gaurav Goel
Sankaran Naren and Prakash Gaurav Goel
Annexure I- Notes to Accounts Figures Less than ` 500 are shown as zero # Schemes were launched after 31.03.2018, hence there are no previous year figures.

30
ICICI Prudential Mutual FundAddress: 2nd Floor, Block B-2, Nirlon Knowledge Park, Western Express Highway, Goregaon, Mumbai – 400063Abridged Revenue Account for the year/period ended March 31, 2019 (figures as per Audited Financials)(As per format prescribed for Abridged schemewise Annual Report- SEBI/IMD/CIR No.8/132968/2008 dt 24/07/08) (` in Lakhs)
ICICI Prudential Value Fund - Series 19
ICICI Prudential Value Fund - Series 20
ICICI Prudential Value Fund - Series 4
Year Ended Period Ended Year Ended Period Ended Year Ended Period Ended
31-Mar-2019 31-Mar-2018 31-Mar-2019 31-Mar-2018 31-Mar-2019 31-Mar-2018
1 INCOME
1.1 Dividend 6,053.79 1,675.45 727.79 152.42 68.14 63.26
1.2 Interest 1,335.29 693.93 465.02 175.62 38.89 63.96
1.3 Realised Gains/(Losses) on Foreign Exchange Transactions
- - - - - -
1.4 Realised Gains/(Losses) on Interscheme sale of Investments
- - - - - 51.42
1.5 Realised Gains/(Losses) on External Sale/Redemption of Investments
(747.88) 768.34 (481.38) (110.23) (241.04) 2,884.77
1.6 Realised Gains/(Losses) on Derivative Transac-tions
8,645.71 3,681.13 610.40 715.22 11.68 -
1.7 Other Income 1,705.66 - 0.02 - 0.08 0.39
( A ) 16,992.57 6,818.85 1,321.85 933.03 (122.25) 3,063.80
2 EXPENSES & LOSSES (Note 7)
2.1 Interest on Borrowing - - - - - -
2.2 Management Fees 726.54 238.69 622.17 97.20 127.42 157.24
2.3 Goods & Services Tax on Management Fees 130.78 42.96 111.99 17.50 22.93 27.09
2.4 Transfer Agent’s Fees & Expenses 67.45 20.03 18.58 3.89 2.84 3.80
2.5 Custodian Fees 6.31 1.35 1.70 0.21 0.29 0.34
2.6 Trusteeship Fees 0.34 0.09 0.09 0.01 0.01 0.02
2.7 Commission to Agents 2,393.38 546.31 407.06 60.98 50.21 75.20
2.8 Marketing & Distribution Expenses 0.11 1.00 0.03 - - 0.13
2.9 Audit Fees 1.78 1.50 0.48 0.71 0.24 0.18
2.10 Other Operating Expenses 42.27 21.53 11.11 7.23 1.54 2.40
( B ) 3,368.96 873.46 1,173.21 187.73 205.48 266.40
3 Net Realised Gains / (Losses) for the Year / Period (A-B = C)
13,623.61 5,945.39 148.64 745.30 (327.73) 2,797.40
4 Change in Unrealised Depreciation in value of Investments (D)
- 13,652.72 - 1,804.94 - 1,893.31
5 Net Gains / (Losses) for the Year/Period ( E= C - D)
13,623.61 (7,707.33) 148.64 (1,059.64) (327.73) 904.09
6 Change in Unrealised Appreciation in value of Investments (F)
3,748.33 - 15.58 - 107.61 -
7 Net Surplus/ (Deficit) for the year/period (G = E + F)
17,371.94 (7,707.33) 164.22 (1,059.64) (220.12) 904.09
7.1 Add: Balance Transfer from Unrealised Apprecia-tion Reserve
- - - - 380.31 2,273.62
7.2 Less: Balance Transfer to Unrealised Apprecia-tion Reserve
- - - - 487.92 380.31
7.3 Add/(Less) : Premium on Redemption - - - - - (2,699.21)
7.4 Surplus/(Deficit) brought forward (7,707.33) - (1,059.64) - 1,708.18 3,009.07
8 Total 9,664.61 (7,707.33) (895.42) (1,059.64) 1,380.45 3,107.26
9 Dividend Appropriation
9.1 Income Distributed during the year/period - - - - - 1,399.08
9.2 Tax on Income distributed during the year/period - - - - - -
10 Retained Surplus/ (Deficit) Carried forward to Balance Sheet
9,664.61 (7,707.33) (895.42) (1,059.64) 1,380.45 1,708.18
Fund Manager Sankaran Naren and Ashwin Jain
Sankaran Naren and Mittul Kalawadia
Mrinal Singh and Rajat Chandak
Annexure I- Notes to Accounts Figures Less than ` 500 are shown as zero # Schemes were launched after 31.03.2018, hence there are no previous year figures.

31
ICICI Prudential Mutual FundAddress: 2nd Floor, Block B-2, Nirlon Knowledge Park, Western Express Highway, Goregaon, Mumbai – 400063Abridged Revenue Account for the year/period ended March 31, 2019 (figures as per Audited Financials)(As per format prescribed for Abridged schemewise Annual Report- SEBI/IMD/CIR No.8/132968/2008 dt 24/07/08) (` in Lakhs)
ICICI Prudential Value Fund Series 8
ICICI Prudential Value Fund - Series 9
Year Ended Period Ended Year Ended Period Ended
31-Mar-2019 31-Mar-2018 31-Mar-2019 31-Mar-2018
1 INCOME
1.1 Dividend 84.67 510.74 489.44 250.40
1.2 Interest 170.60 183.56 223.81 218.28
1.3 Realised Gains/(Losses) on Foreign Exchange Transactions - - - -
1.4 Realised Gains/(Losses) on Interscheme sale of Investments 236.76 - - 103.15
1.5 Realised Gains/(Losses) on External Sale/Redemption of Investments (940.17) 4,948.43 485.54 4,368.50
1.6 Realised Gains/(Losses) on Derivative Transactions 484.86 56.47 1,067.05 (17.53)
1.7 Other Income 0.69 0.01 0.14 -
( A ) 37.41 5,699.21 2,265.98 4,922.80
2 EXPENSES & LOSSES (Note 7)
2.1 Interest on Borrowing - - - -
2.2 Management Fees 126.93 421.95 494.77 402.82
2.3 Goods & Services Tax on Management Fees 22.85 71.52 89.06 69.93
2.4 Transfer Agent’s Fees & Expenses 4.10 8.87 10.36 12.27
2.5 Custodian Fees 0.32 1.07 0.97 1.09
2.6 Trusteeship Fees 0.02 0.06 0.05 0.06
2.7 Commission to Agents 104.50 236.73 91.55 200.41
2.8 Marketing & Distribution Expenses - 0.13 0.02 0.13
2.9 Audit Fees 0.47 0.37 0.47 0.37
2.10 Other Operating Expenses 2.67 6.52 5.64 6.20
( B ) 261.86 747.22 692.89 693.28
3 Net Realised Gains / (Losses) for the Year / Period (A-B = C) (224.45) 4,951.99 1,573.09 4,229.52
4 Change in Unrealised Depreciation in value of Investments (D) - 2,604.02 614.08 906.19
5 Net Gains / (Losses) for the Year/Period ( E= C - D) (224.45) 2,347.97 959.01 3,323.33
6 Change in Unrealised Appreciation in value of Investments (F) 1,047.10 - - -
7 Net Surplus/ (Deficit) for the year/period (G = E + F) 822.65 2,347.97 959.01 3,323.33
7.1 Add: Balance Transfer from Unrealised Appreciation Reserve - 1,508.24 821.60 1,727.78
7.2 Less: Balance Transfer to Unrealised Appreciation Reserve - - 207.51 821.60
7.3 Add/(Less) : Premium on Redemption (1,586.49) - - -
7.4 Surplus/(Deficit) brought forward 808.59 4,623.43 1,457.54 467.44
8 Total 44.75 8,479.64 3,030.64 4,696.95
9 Dividend Appropriation
9.1 Income Distributed during the year/period - 7,671.05 - 3,239.41
9.2 Tax on Income distributed during the year/period - - - -
10 Retained Surplus/ (Deficit) Carried forward to Balance Sheet 44.75 808.59 3,030.64 1,457.54
Fund Manager Sankaran Naren Sankaran Naren and Atul Patel
Annexure I- Notes to Accounts Figures Less than ` 500 are shown as zero # Schemes were launched after 31.03.2018, hence there are no previous year figures.

32
ICICI Prudential Mutual Fund
Address: 2nd Floor, Block B-2, Nirlon Knowledge Park, Western Express Highway, Goregaon, Mumbai – 400063
Notes to Accounts – Annexure I to the Abridged Balance Sheet and Revenue Account for the Year ended March 31, 2019 for the following schemes:
Scheme Code Scheme Name
BHACON1 ICICI Prudential Bharat Consumption Fund - Series 1
BHACON2 ICICI Prudential Bharat Consumption Fund - Series 2
BHACON3 ICICI Prudential Bharat Consumption Fund - Series 3
BHACON4 ICICI Prudential Bharat Consumption Fund - Series 4
BHACON5 ICICI Prudential Bharat Consumption Fund - Series 5
BUSINESS1 ICICI Prudential Business Cycle Fund Series 1
GROWTH1 ICICI Prudential Growth Fund - Series 1
GROWTH2 ICICI Prudential Growth Fund - Series 2
GROWTH3 ICICI Prudential Growth Fund - Series 3
RECOVERY5 ICICI Prudential India Recovery Fund - Series 5
RECOVERY7 ICICI Prudential India Recovery Fund - Series 7
VALUE10 ICICI Prudential Value Fund - Series 10
VALUE11 ICICI Prudential Value Fund - Series 11
VALUE12 ICICI Prudential Value Fund - Series 12
VALUE13 ICICI Prudential Value Fund - Series 13
VALUE14 ICICI Prudential Value Fund - Series 14
VALUE15 ICICI Prudential Value Fund - Series 15
VALUE16 ICICI Prudential Value Fund - Series 16
VALUE17 ICICI Prudential Value Fund - Series 17
VALUE18 ICICI Prudential Value Fund - Series 18
VALUE19 ICICI Prudential Value Fund - Series 19
VALUE20 ICICI Prudential Value Fund - Series 20
VALUE4 ICICI Prudential Value Fund - Series 4
VALUE8 ICICI Prudential Value Fund Series 8
VALUE9 ICICI Prudential Value Fund - Series 9
1 Investments
1.1 All investments of the scheme except Government Securities and Treasury Bills are registered in the name of the Trustees for the benefits of the Schemes Unitholders. All investments in Government Securities and Treasury Bills are held in an SGL account in the name of “ICICI Prudential Mutual Fund”.
1.2 Open Positions of derivatives:
Scheme Code As on March 31, 2019 As on March 31, 2018
Long Positions (` in Lakhs)
% to Net Assets
Short Positions (` in Lakhs)
% to Net Assets
Long Positions (` in Lakhs)
% to Net Assets
Short Positions (` in Lakhs)
% to Net Assets
BHACON1 - - 28,909.57 30.72% - - - -
BHACON2 - - 5,289.24 18.94% - - - -
BHACON3 227.81 1.81% 3,681.15 29.27% - - - -
BHACON4 - - 3,325.87 8.25% - - - -
BHACON5 - - 164.61 4.93% - - - -
GROWTH1 108.51 1.04% 1,847.89 17.72% - - 2,047.23 21.72%
GROWTH2 - - 1,127.32 23.11% - - - -
GROWTH3 - - 753.35 17.03% 15,524.87 49.15% - -
RECOVERY5 32.08 0.42% 2,301.52 29.81% 156.77 2.13% 375.69 5.11%
RECOVERY7 365.53 7.87% 1,323.33 28.50% - - 589.23 13.80%
VALUE10 - - 289.85 2.03% - - - -
VALUE11 841.63 6.04% - - 110.80 0.79% - -
VALUE12 - - 1,156.44 1.61% - - 6,781.84 10.34%
VALUE13 - - - - - - 3,762.34 5.59%
VALUE14 - - 9,625.46 17.85% 94.48 0.18% 8,693.38 16.47%
VALUE15 1,223.42 1.98% 7,362.93 11.90% 179.51 0.31% 5,201.38 9.10%
VALUE16 2,332.34 3.73% - - 1,974.36 3.32% 5,522.81 9.28%
VALUE17 220.51 1.12% 2,977.12 15.09% - - 2,290.23 12.17%

33
VALUE18 726.60 5.41% 2,884.60 21.47% - - 2,955.25 24.34%
VALUE19 837.78 0.43% - - - - 43,124.34 24.54%
VALUE20 - - 7,392.94 14.53% - - 14,152.87 27.92%
VALUE4 305.91 4.02% - - - - - -
VALUE8 - - - - - - 3,264.70 12.38%
VALUE9 638.98 2.19% - - - - - -
Disclosure as required under SEBI Circular -Cir/ IMD/ DF/ 11/ 2010 dated August 18, 2010 – Annexure I(b) for the year 2018-19
a Hedging Positions through Futures as on March 31, 2019:
Scheme Code Underlying Security Name
Long/(Short) Future price when purchased (in `)
Current price of the contract (in `)
Margin Maintained (` in Lakhs)
GROWTH1 Cipla Ltd. (Short) 532.08 532.70 54.09
GROWTH1 Housing Development Finance Corporation Ltd. (Short) 1,952.23 1,976.60 103.62
GROWTH1 Sun Pharmaceuticals Industries Ltd. (Short) 465.85 481.70 35.31
GROWTH2 HCL Technologies Ltd. (Short) 1,035.21 1,094.70 32.32
GROWTH2 ICICI BANK LIMITED (Short) 389.96 400.50 66.38
GROWTH2 Tech Mahindra Ltd. (Short) 775.26 779.45 23.03
RECOVERY5 Ambuja Cements Ltd. (Short) 234.25 237.35 61.76
RECOVERY5 Bharti Airtel Ltd. (Short) 330.42 335.20 22.70
RECOVERY5 Cipla Ltd. (Short) 529.85 532.70 -
RECOVERY5 Hindalco Industries Ltd. (Short) 207.54 207.10 -
RECOVERY5 ITC Ltd. (Short) 299.64 299.00 -
RECOVERY5 Axis Bank Ltd. (Short) 751.88 780.30 19.93
RECOVERY5 Indian Oil Corporation Ltd. (Short) 161.56 162.60 -
RECOVERY5 Larsen & Toubro Ltd. (Short) 1,410.23 1,391.50 -
RECOVERY5 Motherson Sumi Systems Ltd. (Short) 149.43 150.00 -
RECOVERY5 Vedanta Limited (Short) 176.00 185.30 20.26
RECOVERY5 Dabur India Ltd. (Short) 427.68 412.25 38.34
RECOVERY5 Housing Development Finance Corporation Ltd. (Short) 1,966.04 1,976.60 51.81
RECOVERY5 Zee Entertainment Enterprises Ltd. (Short) 436.72 447.20 38.61
RECOVERY7 Bharti Airtel Ltd. (Short) 330.53 335.20 13.42
RECOVERY7 GAIL (India) Ltd. (Short) 360.86 349.45 25.43
RECOVERY7 Housing Development Finance Corporation Ltd. (Short) 1,943.95 1,976.60 34.54
RECOVERY7 Cummins India Ltd. (Short) 728.20 752.95 23.00
RECOVERY7 State Bank of India (Short) 300.25 322.05 10.18
RECOVERY7 Tech Mahindra Ltd. (Short) 776.03 779.45 26.32
RECOVERY7 Wipro Ltd. (Short) 256.25 256.95 39.09
VALUE10 State Bank of India (Short) 312.65 322.05 50.89
VALUE12 ICICI BANK LIMITED (Short) 390.04 400.50 205.01
VALUE14 HDFC Bank Ltd. (Short) 2,320.41 2,329.40 287.07
VALUE15 ICICI BANK LIMITED (Short) 390.05 400.50 140.58
VALUE17 Bharti Airtel Ltd. (Short) 330.17 335.20 41.28
VALUE17 Maruti Suzuki India Ltd. (Short) 6,571.53 6,719.40 28.99
VALUE17 State Bank of India (Short) 300.42 322.05 145.87
VALUE18 Asian Paints Ltd. (Short) 1,490.37 1,501.50 87.70
VALUE18 Housing Development Finance Corporation Ltd. (Short) 1,946.43 1,976.60 22.45
VALUE18 Hindustan Unilever Ltd. (Short) 1,693.14 1,714.70 44.87
VALUE18 HCL Technologies Ltd. (Short) 1,034.32 1,094.70 18.85
VALUE18 Infosys Ltd. (Short) 725.55 747.25 74.84
VALUE18 MAX FINANCIAL SERVICES LIMITED (Short) 446.55 438.65 13.08
VALUE18 Tata Chemicals Ltd. (Short) 582.40 594.20 17.21
VALUE20 Bank of Baroda (Short) 120.95 129.65 282.86
VALUE20 State Bank of India (Short) 300.63 322.05 254.43
VALUE20 Sun Pharmaceuticals Industries Ltd. (Short) 466.40 481.70 92.92
VALUE20 Union Bank of India (Short) 91.03 96.30 283.00
VALUE20 Punjab National Bank (Short) 94.45 96.25 533.89
BHACON1 Britannia Industries Ltd (Short) 3,104.48 3,102.25 19.73
BHACON1 TITAN COMPANY LTD (Short) 1,119.90 1,145.05 1,085.52
BHACON1 Zee Entertainment Enterprises Ltd. (Short) 428.52 447.20 203.22
BHACON1 Maruti Suzuki India Ltd. (Short) 6,606.91 6,719.40 1,281.57
BHACON1 Bharti Airtel Ltd. (Short) 323.64 335.20 552.13

34
Scheme Code Underlying Security Name
Long/(Short) Future price when purchased (in `)
Current price of the contract (in `)
Margin Maintained (` in Lakhs)
BHACON1 Sun Pharmaceuticals Industries Ltd. (Short) 473.20 481.70 734.09
BHACON2 Tata Global Beverages Ltd. (Short) 196.00 204.90 104.97
BHACON2 TITAN COMPANY LTD (Short) 1,103.62 1,145.05 499.04
BHACON2 United Spirits Ltd. (Short) 550.39 557.00 312.14
BHACON3 Colgate Palmolive (India) Ltd. (Short) 1,270.00 1,262.80 52.82
BHACON3 Britannia Industries Ltd (Short) 3,109.50 3,102.25 173.21
BHACON3 Bharti Airtel Ltd. (Short) 329.67 335.20 72.24
BHACON3 Hindustan Unilever Ltd. (Short) 1,692.54 1,714.70 105.89
BHACON3 Marico Ltd. (Short) 335.65 348.20 88.88
BHACON3 Maruti Suzuki India Ltd. (Short) 6,561.11 6,719.40 61.49
BHACON4 Asian Paints Ltd. (Short) 1,498.75 1,501.50 312.53
BHACON4 Hindustan Unilever Ltd. (Short) 1,691.66 1,714.70 192.03
BHACON4 ITC Ltd. (Short) 294.85 299.00 81.73
BHACON5 Hindustan Unilever Ltd. (Short) 1,692.00 1,714.70 28.71
b Other than hedging Positions through Futures as on March 31, 2019:
Scheme Code Underlying Security Name
Long/(Short) Future price when purchased (in `)
Current price of the contract (in `)
Margin Maintained (` in Lakhs)
VALUE4 NTPC Ltd. Long 139.06 135.60 58.01
GROWTH1 NIFTY (Short) 11,620.15 11,679.90 83.66
GROWTH1 Oil & Natural Gas Corporation Ltd Long 160.17 160.75 19.08
GROWTH2 NIFTY (Short) 11,642.55 11,679.90 49.21
GROWTH3 NIFTY (Short) 11,600.30 11,679.90 84.64
RECOVERY7 NTPC Ltd. Long 138.94 135.60 18.51
RECOVERY7 Oil & Natural Gas Corporation Ltd Long 160.19 160.75 37.11
RECOVERY7 NIFTY (Short) 11,620.95 11,679.90 39.37
RECOVERY7 Indian Oil Corporation Ltd. Long 162.03 162.60 10.88
VALUE9 Oil & Natural Gas Corporation Ltd Long 159.64 160.75 112.39
VALUE11 NIFTY Long 11,620.14 11,679.90 35.64
VALUE14 NIFTY (Short) 11,635.24 11,679.90 897.58
VALUE15 Oil & Natural Gas Corporation Ltd Long 155.24 160.75 190.85
VALUE15 NIFTY (Short) 11,633.64 11,679.90 738.14
VALUE16 MindTree Ltd. Long 950.36 952.45 20.13
VALUE17 NTPC Ltd. Long 138.91 135.60 18.51
VALUE17 NIFTY (Short) 11,641.96 11,679.90 231.53
VALUE17 MindTree Ltd. Long 950.80 952.45 15.11
VALUE18 NTPC Ltd. Long 138.76 135.60 123.42
VALUE18 MindTree Ltd. Long 950.80 952.45 10.07
VALUE18 NIFTY (Short) 11,640.43 11,679.90 156.41
BHACON1 NIFTY (Short) 11,634.50 11,679.90 836.56
BHACON3 NIFTY (Short) 11,641.15 11,679.90 59.05
BHACON3 NTPC Ltd. Long 139.09 135.60 43.20
c Hedging Positions through Put Options as on March 31, 2019 is Nil.
d Other than Hedging Position through Options as on March 31, 2019:
Scheme Code Underlying Security Name
Call/Put Strike price Number of con-tracts *
Option price when purchased (in ` )
Current Price (in `) Total exposure due to Options (non
hedging positions) as a % of Net
Assets
RECOVERY5 NIFTY PUT 11400.000 446 169.48 95.90 0.42%
VALUE11 NIFTY PUT 10700.000 1,550 491.55 68.40 0.57%
VALUE15 NIFTY PUT 11300.000 666 526.58 277.00 0.22%
VALUE16 NIFTY PUT 11500.000 413 124.72 123.85 0.06%
VALUE16 NIFTY PUT 11500.000 5,213 520.71 513.65 3.21%
VALUE17 NIFTY PUT 11500.000 400 122.92 123.85 0.19%
VALUE18 NIFTY PUT 11500.000 200 121.78 123.85 0.14%
VALUE19 NIFTY PUT 11700.000 4,666 474.12 239.40 0.43%
* Number of contracts have been arrived using the applicable lot size as on the date of original purchase.

35
e For the Period ended March 31, 2019, the following transactions through futures have been squared off/ expired:
Hedging Transactions
Scheme Code Transactions Where futures were bought Transactions Where futures were Sold Combined Hedged Net Profit/(Loss) (` in Lakhs)
Total % of existing Assets hedged through
FuturesNo of Contract Gross Notional Value
(` in Lakhs)No of Contract Gross Notional Value
(` in Lakhs)
BHACON1 - - 46,128 278,457.75 4,246.40 22.69%
BHACON2 - - 20,057 119,748.69 992.85 18.86%
BHACON3 - - 3,921 29,380.46 384.01 24.96%
BHACON4 - - 6,796 50,435.18 1,792.67 8.20%
BHACON5 - - 76 740.38 21.08 4.90%
BUSINESS1 - - 2,037 15,620.37 338.46 -
GROWTH1 - - 4,018 26,916.61 (44.72) 10.52%
GROWTH2 - - 1,334 11,898.80 (58.87) 14.10%
GROWTH3 - - 828 5,914.00 75.32 -
RECOVERY5 - - 894 5,274.05 72.91 29.65%
RECOVERY7 - - 1,900 13,697.79 72.24 20.82%
VALUE10 - - 1,135 9,408.54 (78.41) 2.02%
VALUE12 - - 23,139 181,684.46 2,053.14 1.61%
VALUE13 - - 24,051 150,888.91 3,971.89 -
VALUE14 - - 10,769 73,554.34 1,136.73 3.02%
VALUE15 - - 12,708 93,120.88 945.94 1.28%
VALUE16 - - 7,496 58,473.39 852.99 -
VALUE17 - - 7,595 53,867.45 334.37 6.18%
VALUE18 - - 5,603 40,645.93 171.91 10.98%
VALUE19 - - 56,828 408,710.27 6,250.19 -
VALUE20 - - 23,711 129,026.43 252.40 14.44%
VALUE8 - - 3,783 26,029.15 554.83 -
VALUE9 - - 2,454 17,055.62 890.64 -
Other than Hedging Transactions
Transactions Where futures were bought
Transactions Where futures were Sold
Combined Non Hedged Net Profit/(Loss)
(` in Lakhs)
Total exposure due to Futures (non hedging positions) as a % of
Net AssetsScheme Code No of Contract Gross Notional Value
(` in Lakhs)No of Contract Gross Notional Value
(` in Lakhs)
BHACON1 1,502 8,713.06 6,898 51,173.75 1,217.81 7.91%
BHACON3 42 206.15 634 5,254.06 136.93 5.99%
BUSINESS1 2,212 16,289.50 - - 300.36 -
GROWTH1 85 429.70 1,630 13,135.65 118.92 8.18%
GROWTH2 - - 324 2,643.43 (16.37) 8.98%
GROWTH3 2,039 15,627.47 812 6,669.27 257.83 17.03%
RECOVERY5 370 2,112.77 - - 91.20 -
RECOVERY7 129 733.27 594 4,898.17 63.28 15.42%
VALUE10 - - 2,296 18,572.51 (20.50) -
VALUE11 539 4,065.97 - - 62.11 5.47%
VALUE12 245 1,511.47 10,514 85,845.15 164.62 -
VALUE13 724 3,964.28 12,120 99,363.25 578.78 -
VALUE14 - - 11,200 91,001.27 (224.79) 14.81%
VALUE15 2,122 10,337.34 9,463 76,992.99 547.99 12.38%
VALUE16 428 2,250.48 80 661.34 93.00 0.46%
VALUE17 33 180.46 2,422 19,378.12 71.37 9.81%
VALUE18 208 1,274.88 1,641 12,961.11 98.51 15.70%
VALUE19 3,715 16,535.14 22,254 183,507.07 2,426.66 -
VALUE20 570 2,994.28 5,930 48,306.61 357.96 -
VALUE4 56 301.92 - - 11.68 4.02%
VALUE9 1,661 9,000.98 - - 176.40 2.19%
VALUE8 - - 1,214 9,726.42 (60.05) -
f No hedging transaction through Options were transacted during the year ended March 31, 2019.

36
g For the period ended March 31, 2019, with regard to non-hedging transactions through options which have already been exercised/expired:
Scheme Code Underlying Security Name
Call/Put Strike price Number of contracts Gross Notional Value (in ` Lakhs)
Net Profit/(Loss) (in ` Lakhs)
BHACON1 NIFTY PUT 11,000.00 2,200 255.25 (225.76)
BHACON1 NIFTY PUT 11,400.00 2,200 160.67 (161.00)
BHACON1 NIFTY PUT 11,600.00 900 100.06 281.33
BHACON1 NIFTY PUT 11,700.00 2,200 211.01 889.15
BHACON3 NIFTY PUT 11,600.00 130 14.74 41.30
GROWTH1 NIFTY PUT 10,700.00 189 20.11 (9.12)
GROWTH1 NIFTY PUT 11,000.00 112 13.04 (11.57)
GROWTH1 NIFTY PUT 11,400.00 112 8.00 (8.01)
GROWTH1 NIFTY PUT 11,700.00 112 10.72 19.96
GROWTH2 NIFTY PUT 10,800.00 28 3.62 (1.15)
GROWTH3 NIFTY PUT 10,700.00 252 28.00 (9.54)
GROWTH3 NIFTY PUT 10,800.00 27 2.67 (1.65)
GROWTH3 NIFTY PUT 11,600.00 49 5.45 (1.46)
RECOVERY5 NIFTY PUT 9,500.00 901 290.85 (249.49)
RECOVERY5 NIFTY PUT 11,000.00 1,678 484.15 (344.82)
RECOVERY7 NIFTY PUT 10,700.00 72 7.65 (3.40)
RECOVERY7 NIFTY PUT 11,000.00 51 5.94 (5.28)
RECOVERY7 NIFTY PUT 11,400.00 51 3.58 (3.59)
RECOVERY7 NIFTY PUT 11,600.00 30 3.36 9.74
RECOVERY7 NIFTY PUT 11,700.00 51 5.35 4.33
VALUE10 NIFTY PUT 10,800.00 93 13.03 (5.03)
VALUE11 NIFTY PUT 8,600.00 977 411.97 (329.10)
VALUE11 NIFTY PUT 8,800.00 804 324.57 (246.22)
VALUE12 BANKEX PUT 27,200.00 307 17.78 3.92
VALUE12 NIFTY PUT 11,500.00 1,165 117.49 (23.18)
VALUE13 BANKEX PUT 27,200.00 307 17.79 3.93
VALUE13 NIFTY PUT 11,500.00 1,165 117.46 (23.11)
VALUE14 NIFTY PUT 10,000.00 680 95.70 (40.64)
VALUE14 NIFTY PUT 10,700.00 1,146 126.25 (42.31)
VALUE15 NIFTY PUT 10,000.00 1,292 181.75 (76.91)
VALUE15 NIFTY PUT 10,700.00 1,000 104.36 (44.50)
VALUE15 NIFTY PUT 10,800.00 149 14.94 (9.32)
VALUE15 NIFTY PUT 11,000.00 1,000 127.07 (119.50)
VALUE15 NIFTY PUT 11,200.00 666 92.15 (79.89)
VALUE15 NIFTY PUT 11,500.00 1,666 122.96 (123.21)
VALUE15 NIFTY PUT 11,700.00 1,666 160.17 676.60
VALUE16 NIFTY CALL 11,100.00 500 35.89 134.38
VALUE16 NIFTY PUT 9,800.00 3,267 1,460.08 (1,001.13)
VALUE16 NIFTY PUT 9,900.00 1,199 545.34 (359.83)
VALUE16 NIFTY PUT 10,000.00 2,200 995.38 (608.81)
VALUE16 NIFTY PUT 10,500.00 1,092 471.52 (211.91)
VALUE17 NIFTY CALL 11,100.00 200 14.43 55.27
VALUE18 NIFTY CALL 11,100.00 300 21.60 77.11
VALUE19 BANKEX PUT 27,300.00 586 15.83 24.04
VALUE19 NIFTY PUT 10,800.00 21 2.11 (1.32)
VALUE19 NIFTY PUT 11,000.00 2,478 307.81 14.82
VALUE19 NIFTY PUT 11,100.00 4,123 352.07 192.84
VALUE19 NIFTY PUT 11,200.00 12,079 1,430.71 789.01
VALUE19 NIFTY PUT 11,300.00 5,845 1,912.34 (697.75)
VALUE19 NIFTY PUT 11,600.00 2,000 128.28 (128.90)
VALUE19 NIFTY PUT 11,700.00 2,000 200.83 695.71
VALUE20 NIFTY PUT 10,800.00 318 44.48 (15.36)
VALUE8 NIFTY PUT 10,800.00 164 16.22 (10.04)
VALUE8 NIFTY PUT 11,700.00 55 5.31 21.65
h Hedging Positions through swap as on March 31, 2019 is Nil.
Disclosure as required under SEBI Circular -Cir/ IMD/ DF/ 11/ 2010 dated August 18, 2010 – Annexure I(b) for the year 2017-18

37
a Hedging Positions through Futures as on March 31, 2018:.
Scheme Code Underlying Security Name
Long/(Short) Future price when purchased (in `)
Current price of the contract
(in `)
Margin Maintained (` in Lakhs)
GROWTH1 KOTAK MAHINDRA BANK LIMITED (Short) 1,055.68 1,053.60 19.96
GROWTH1 HOUSING DEVELOPMENT FINANCE CORPORATION (Short) 1,827.30 1,834.55 54.87
GROWTH1 TATA CONSULTANCY SERVICES LIMITED (Short) 2,884.00 2,864.65 71.39
GROWTH1 TVS MOTOR COMPANY LIMITED (Short) 614.47 618.90 46.31
VALUE8 HCL TECHNOLOGIES LIMITED (Short) 970.47 970.90 189.83
VALUE8 HINDUSTAN PETROLEUM CORPORATION (Short) 345.30 345.70 217.55
RECOVERY5 HINDUSTAN PETROLEUM CORPORATION LIMITED (Short) 346.32 345.70 18.78
RECOVERY7 KOTAK MAHINDRA BANK LIMITED (Short) 1,055.79 1,053.60 43.07
VALUE12 MAHINDRA AND MAHINDRA LIMITED (Short) 742.40 742.60 441.70
VALUE12 HINDUSTAN PETROLEUM CORPORATION LIMITED (Short) 345.54 345.70 404.51
VALUE13 HINDUSTAN PETROLEUM CORPORATION LIMITED (Short) 345.43 345.70 469.78
VALUE14 KOTAK MAHINDRA BANK LIMITED (Short) 1,053.61 1,053.60 171.24
VALUE14 OIL AND NATURAL GAS CORPORATION LIMITED (Short) 178.51 178.60 101.89
VALUE14 HCL TECHNOLOGIES LIMITED (Short) 970.57 970.90 228.81
VALUE14 BHARTI AIRTEL LIMITED (Short) 400.20 400.05 101.84
VALUE14 ICICI BANK LIMITED (Short) 279.67 279.75 175.87
VALUE14 UNION BANK OF INDIA (Short) 95.10 94.50 34.44
VALUE14 NTPC LIMITED (Short) 168.39 168.50 105.83
VALUE14 PUNJAB NATIONAL BANK (Short) 97.30 95.90 44.51
VALUE14 HOUSING DEVELOPMENT FINANCE CORPORATION (Short) 1,834.18 1,834.55 153.19
VALUE15 HOUSING DEVELOPMENT FINANCE CORPORATION (Short) 1,834.09 1,834.55 182.91
VALUE15 LARSEN AND TOUBRO LIMITED (Short) 1,317.17 1,318.35 162.66
VALUE15 INDIAN OIL CORPORATION LIMITED (Short) 176.54 176.70 176.16
VALUE15 AXIS BANK LIMITED (Short) 511.11 511.30 127.04
VALUE16 BANK OF BARODA (Short) 142.65 142.65 35.66
VALUE16 LARSEN AND TOUBRO LIMITED (Short) 1,317.06 1,318.35 197.75
VALUE16 INTERGLOBE AVIATION LIMITED. (Short) 1,282.59 1,283.05 42.73
VALUE17 BANK OF BARODA (Short) 142.71 142.65 51.74
VALUE17 STATE BANK OF INDIA (Short) 251.26 251.20 84.42
VALUE17 LARSEN AND TOUBRO LIMITED (Short) 1,316.87 1,318.35 96.12
VALUE17 INTERGLOBE AVIATION LIMITED. (Short) 1,292.11 1,283.05 47.98
VALUE17 OIL AND NATURAL GAS CORPORATION LIMITED (Short) 178.40 178.60 20.04
VALUE18 TATA CHEMICALS LIMITED (Short) 683.06 681.00 58.58
VALUE18 HOUSING DEVELOPMENT FINANCE CORPORATION (Short) 1,827.63 1,834.55 48.01
VALUE18 MAX FINANCIAL SERVICES LIMITED (Short) 453.50 454.25 36.80
VALUE18 HCL TECHNOLOGIES LIMITED (Short) 972.60 970.90 11.86
VALUE18 BANK OF BARODA (Short) 142.75 142.65 31.77
VALUE18 STATE BANK OF INDIA (Short) 252.96 251.20 9.82
VALUE18 SUN PHARMACEUTICAL INDUSTRIES LIMITED. (Short) 502.71 497.45 16.36
VALUE18 HDFC BANK LIMITED (Short) 1,890.40 1,890.40 105.99
VALUE18 ITC LIMITED (Short) 259.04 256.90 50.85
VALUE19 HOUSING DEVELOPMENT FINANCE CORPORATION (Short) 1,834.02 1,834.55 467.56
VALUE19 RELIANCE INDUSTRIES LIMITED (Short) 887.46 887.15 426.75
VALUE19 HERO MOTOCORP LIMITED (Short) 3,527.40 3,528.95 897.92
VALUE19 HDFC BANK LIMITED (Short) 1,890.31 1,890.40 520.54
VALUE19 VEDANTA LIMITED (Short) 279.19 279.30 180.36
VALUE19 INFOSYS LIMITED (Short) 1,136.58 1,136.85 236.34
VALUE19 HINDALCO INDUSTRIES LIMITED (Short) 214.53 214.65 272.24
VALUE19 EICHER MOTORS LIMITED (Short) 28,465.09 28,493.55 601.73
VALUE19 MAHINDRA AND MAHINDRA LIMITED (Short) 742.20 742.60 467.63
VALUE19 UNION BANK OF INDIA (Short) 95.23 94.50 25.17
VALUE19 TATA STEEL LIMITED (Short) 573.07 573.45 551.37
VALUE19 LUPIN LIMITED (Short) 747.44 740.00 52.04
VALUE19 HINDUSTAN PETROLEUM CORPORATION LIMITED (Short) 345.33 345.70 594.87
VALUE19 CANARA BANK (Short) 265.52 265.55 135.43
VALUE19 GAIL (INDIA) LIMITED (Short) 331.41 330.40 52.73
VALUE20 POWER FINANCE CORPORATION LIMITED. (Short) 86.07 86.10 154.79

38
Scheme Code Underlying Security Name
Long/(Short) Future price when purchased (in `)
Current price of the contract
(in `)
Margin Maintained (` in Lakhs)
VALUE20 BANK OF BARODA (Short) 142.64 142.65 238.73
VALUE20 TITAN COMPANY LIMITED (Short) 945.19 942.95 118.15
VALUE20 CIPLA LIMITED (Short) 544.49 544.55 203.38
VALUE20 PIDILITE INDUSTRIES LIMITED (Short) 922.26 922.50 209.36
VALUE20 UNION BANK OF INDIA (Short) 94.64 94.50 54.97
VALUE20 IDEA CELLULAR LIMITED (Short) 76.94 76.40 62.12
VALUE20 PUNJAB NATIONAL BANK (Short) 95.93 95.90 596.11
VALUE20 SUN PHARMACEUTICAL INDUSTRIES LIMITED. (Short) 497.35 497.45 347.72
VALUE20 MARUTI SUZUKI INDIA LIMITED (Short) 8,994.92 8,905.20 71.57
VALUE20 GAIL (INDIA) LIMITED (Short) 329.91 330.40 54.93
b Other than hedging Positions through Futures as on March 31, 2018:
Scheme Code Underlying Security Name
Long/(Short) Future price when purchased (in `)
Current price of the contract (in `)
Margin Maintained (` in Lakhs)
GROWTH1 NIFTY (Short) 10,219.75 10,151.95 40.00 RECOVERY7 NIFTY (Short) 10,219.75 10,151.95 19.39 VALUE18 NIFTY (Short) 10,219.75 10,151.95 3.64 GROWTH3 NIFTY Long 10,219.04 10,151.95 1,242.12
c Hedging Positions through Put Options as on March 31, 2018 is Nil.
d Other than Hedging Position through Options as on March 31, 2018:
Scheme Code Underlying Security Name
Call/Put Strike price Number of con-tracts *
Option price when purchased (in ` )
Current Price (in `) Total exposure due to Options (non
hedging positions) as a % of Net
Assets
RECOVERY5 NIFTY PUT 9500.000 901 430.41 232.00 2.13%
VALUE11 NIFTY PUT 8800.000 804 538.26 93.95 0.79%
VALUE11 NIFTY PUT 8600.000 977 562.22 73.90
VALUE14 NIFTY PUT 10000.000 680 187.65 185.25 0.18%
VALUE15 NIFTY PUT 10000.000 1292 187.56 185.25 0.31%
VALUE16 NIFTY PUT 9900.000 1199 606.44 268.25 3.32%
VALUE16 NIFTY PUT 10000.000 2200 603.26 288.05
VALUE16 NIFTY PUT 9800.000 3267 595.89 249.30
VALUE16 NIFTY PUT 10500.000 1092 575.73 790.00e For the Period ended March 31, 2018, the following transactions through futures have been squared off/ expired:
Hedging TransactionsScheme Code Transactions Where futures were bought Transactions Where futures were Sold Combined Hedged
Net Profit/(Loss) (` in Lakhs)
Total % of existing Assets hedged through
FuturesNo of Contract Gross Notional Value
(` in Lakhs)No of Contract Gross Notional Value
(` in Lakhs)BUSINESS1 - - 58 641.40 43.97 - GROWTH1 - - 797 5,832.83 190.77 16.32%GROWTH2 - - 23 199.46 7.14 - GROWTH3 - - 1,352 11,062.72 (51.70) - RECOVERY5 - - 69 416.37 42.05 5.09%RECOVERY7 - - 365 2,746.25 77.02 8.05%VALUE10 - - 55 455.53 34.20 - VALUE12 - - 18,414 146,160.34 (2,009.31) 10.30%VALUE13 - - 19,522 147,967.59 1,551.85 5.58%VALUE14 - - 3,205 24,241.13 441.18 16.41%VALUE15 - - 1,358 11,227.10 470.17 9.07%VALUE16 - - 1,348 11,480.78 14.78 9.25%VALUE17 - - 409 3,223.92 149.37 12.14%VALUE18 - - 621 4,485.41 159.88 23.87%VALUE19 - - 14,211 102,450.29 4,173.01 24.48%VALUE20 - - 2,730 16,157.55 820.59 27.81%VALUE8 - - 3,716 23,395.49 159.69 12.35%VALUE9 - - 832 7,200.01 (21.35) -

39
Other than Hedging Transactions
Scheme Code Transactions Where futures were bought Transactions Where futures were Sold Combined Non Hedged Net Profit/(Loss)
(` in Lakhs)
Total exposure due to Futures (non hedging positions) as a % of
Net Assets
No of Contract Gross Notional Value (` in Lakhs)
No of Contract Gross Notional Value (` in Lakhs)
BUSINESS1 3,640 31,348.77 464 3,664.79 872.05 -
GROWTH1 3,467 24,874.02 260 2,052.45 144.51 5.33%
GROWTH2 1,712 13,523.44 - - 62.28 -
GROWTH3 2,432 18,947.32 3,816 29,976.86 (354.28) 49.15%
RECOVERY5 180 1,442.23 - - (5.43) -
RECOVERY7 143 1,077.64 253 1,980.50 (5.55) 5.71%
VALUE10 945 6,475.67 - - (70.44) -
VALUE12 5,936 41,982.66 4,202 34,081.27 412.84 -
VALUE13 1,917 12,884.58 4,510 35,912.29 (430.27) -
VALUE15 - - 785 6,452.85 (48.03) -
VALUE16 250 1,680.96 240 1,915.93 28.14 -
VALUE17 320 2,171.44 367 2,903.79 16.98 -
VALUE18 250 1,655.38 223 1,790.31 41.24 0.38%
VALUE19 - - 10,655 86,296.08 (491.88) -
VALUE20 1,470 11,546.97 - - (105.37) -
VALUE8 499 3,392.63 2,659 21,707.77 (103.21) -
VALUE9 400 3,091.03 - - 3.82 -
f No hedging transaction through Options were transacted during the year ended March 31, 2018.
g For the period ended March 31, 2018 with regard to non-hedging transactions through options which have already been exercised/expired:
Scheme Code Underlying Security Name
Call/Put Strike price Number of contracts Gross Notional Value (` in Lakhs )
Net Profit/(Loss) (` in Lakhs )
GROWTH1 NIFTY PUT 9,600.00 151 42.61 (20.46)
GROWTH1 NIFTY PUT 9,800.00 804 52.90 (31.99)
GROWTH1 NIFTY PUT 9,900.00 502 5.53 (9.94)
GROWTH1 NIFTY PUT 10,000.00 2,505 110.30 21.00
GROWTH1 NIFTY PUT 10,100.00 1,155 41.17 13.87
GROWTH1 NIFTY PUT 10,200.00 659 31.71 5.43
GROWTH1 NIFTY PUT 10,300.00 323 24.76 (6.36)
GROWTH1 NIFTY PUT 10,400.00 192 23.93 (0.30)
GROWTH1 NIFTY PUT 10,500.00 148 14.56 (10.44)
GROWTH1 NIFTY PUT 10,700.00 74 7.79 (6.36)
GROWTH1 NIFTY PUT 10,900.00 148 16.65 (7.73)
GROWTH1 NIFTY PUT 11,000.00 148 18.84 (2.41)
GROWTH2 NIFTY PUT 10,500.00 660 64.91 (47.75)
GROWTH2 NIFTY PUT 10,700.00 330 34.72 (28.36)
GROWTH2 NIFTY PUT 10,900.00 660 74.25 (34.73)
GROWTH2 NIFTY PUT 11,000.00 660 84.23 (10.55)
GROWTH3 NIFTY PUT 10,500.00 509 50.09 (39.96)
GROWTH3 NIFTY PUT 10,700.00 255 26.83 (21.92)
GROWTH3 NIFTY PUT 10,900.00 509 57.26 (26.77)
GROWTH3 NIFTY PUT 11,000.00 509 64.80 (8.29)
RECOVERY5 NIFTY PUT 7,900.00 2,124 62.34 (227.44)
RECOVERY5 NIFTY PUT 8,100.00 456 15.14 (42.55)
RECOVERY5 NIFTY PUT 8,200.00 609 21.78 (57.42)
RECOVERY5 NIFTY PUT 8,600.00 180 8.96 (12.47)
RECOVERY7 NIFTY PUT 10,500.00 66 6.49 (4.61)
RECOVERY7 NIFTY PUT 10,700.00 33 3.47 (2.84)
RECOVERY7 NIFTY PUT 10,900.00 66 7.43 (3.48)
RECOVERY7 NIFTY PUT 11,000.00 66 8.40 (1.08)
VALUE12 BANK NIFTY PUT 22,800.00 499 18.96 (9.63)
VALUE12 NIFTY PUT 10,500.00 990 97.36 (71.63)
VALUE12 NIFTY PUT 10,700.00 495 52.09 (42.55)
VALUE12 NIFTY PUT 10,900.00 990 111.38 (52.17)
VALUE12 NIFTY PUT 11,000.00 990 126.04 (16.13)
VALUE13 NIFTY PUT 9,500.00 720 9.93 0.83

40
Scheme Code Underlying Security Name
Call/Put Strike price Number of contracts Gross Notional Value (` in Lakhs )
Net Profit/(Loss) (` in Lakhs )
VALUE13 NIFTY PUT 10,500.00 924 90.87 (66.86)
VALUE13 NIFTY PUT 10,700.00 462 48.61 (39.71)
VALUE13 NIFTY PUT 10,900.00 924 103.95 (48.69)
VALUE13 NIFTY PUT 11,000.00 924 117.64 (15.05)
VALUE14 NIFTY PUT 9,600.00 667 173.21 (80.61)
VALUE14 NIFTY PUT 9,800.00 4,190 223.99 (168.77)
VALUE14 NIFTY PUT 9,900.00 1,920 23.17 (15.60)
VALUE14 NIFTY PUT 10,000.00 12,843 582.38 108.33
VALUE14 NIFTY PUT 10,100.00 5,607 195.92 43.19
VALUE14 NIFTY PUT 10,200.00 3,194 152.87 23.45
VALUE14 NIFTY PUT 10,300.00 1,699 132.81 (34.53)
VALUE14 NIFTY PUT 10,400.00 1,042 126.39 (6.43)
VALUE14 NIFTY PUT 10,500.00 660 64.91 (47.75)
VALUE14 NIFTY PUT 10,700.00 330 34.72 (28.36)
VALUE14 NIFTY PUT 10,900.00 660 74.25 (34.78)
VALUE14 NIFTY PUT 11,000.00 660 84.03 (10.75)
VALUE15 NIFTY PUT 9,800.00 2,895 202.36 (109.69)
VALUE15 NIFTY PUT 9,900.00 2,267 25.95 (30.95)
VALUE15 NIFTY PUT 10,000.00 11,043 518.31 49.62
VALUE15 NIFTY PUT 10,100.00 6,225 255.86 104.54
VALUE15 NIFTY PUT 10,200.00 3,501 167.93 25.27
VALUE15 NIFTY PUT 10,300.00 1,973 150.60 (41.85)
VALUE15 NIFTY PUT 10,400.00 1,258 148.07 (10.43)
VALUE15 NIFTY PUT 10,500.00 785 77.23 (63.79)
VALUE15 NIFTY PUT 10,700.00 393 41.35 (33.78)
VALUE15 NIFTY PUT 10,900.00 785 88.31 (41.36)
VALUE15 NIFTY PUT 11,000.00 785 99.94 (12.79)
VALUE17 NIFTY PUT 9,900.00 179 1.02 (14.96)
VALUE17 NIFTY PUT 10,000.00 399 25.12 17.98
VALUE17 NIFTY PUT 10,100.00 399 34.32 24.58
VALUE17 NIFTY PUT 10,200.00 599 48.63 20.99
VALUE17 NIFTY PUT 10,300.00 766 57.77 (13.86)
VALUE17 NIFTY PUT 10,400.00 574 63.49 (6.05)
VALUE17 NIFTY PUT 10,500.00 257 25.31 (21.01)
VALUE17 NIFTY PUT 10,700.00 129 13.57 (11.09)
VALUE17 NIFTY PUT 10,900.00 257 28.91 (13.54)
VALUE17 NIFTY PUT 11,000.00 257 32.72 (4.19)
VALUE18 NIFTY PUT 10,500.00 157 15.47 (11.09)
VALUE18 NIFTY PUT 10,700.00 79 8.31 (6.79)
VALUE18 NIFTY PUT 10,900.00 157 17.66 (8.27)
VALUE18 NIFTY PUT 11,000.00 157 19.99 (2.56)
VALUE8 NIFTY PUT 10,500.00 402 39.53 (32.91)
VALUE8 NIFTY PUT 10,700.00 201 21.15 (17.28)
VALUE8 NIFTY PUT 10,900.00 402 45.23 (21.18)
VALUE8 NIFTY PUT 11,000.00 402 51.18 (6.55)
h Hedging Positions through swap as on March 31, 2018 is Nil.
1.3 Investments made by schemes in Sponsor/Associates/Group Companies: (` in Lakhs)
Scheme Code Name of Sponsor/ Associate/Group Company Nature of Investment 2018-19 2017-18
Market value of Investment by Scheme
Market value of Investment by Scheme
BHACON5 Aster DM Healthcare Limited $ Equity Shares 130.53 -
BUSINESS1 ICICI Bank Limited Equity Shares 643.81 2,176.88
GROWTH1 ICICI Bank Limited Equity Shares 866.35 719.76
GROWTH2 ICICI Bank Limited Equity Shares 406.70 294.03
RECOVERY5 ICICI Bank Limited Equity Shares 320.40 -
RECOVERY7 ICICI Bank Limited Equity Shares 265.59 315.84
VALUE10 ICICI Bank Limited Equity Shares 179.66 591.80
VALUE11 ICICI Bank Limited Equity Shares 582.31 404.71

41
Scheme Code Name of Sponsor/ Associate/Group Company Nature of Investment 2018-19 2017-18
Market value of Investment by Scheme
Market value of Investment by Scheme
VALUE12 Brigade Enterprises Limited $ Equity Shares 425.68 1,725.60
VALUE12 ICICI Bank Limited Equity Shares 1,161.10 3,083.84
VALUE13 ICICI Bank Limited Equity Shares - 5,566.86
VALUE14 ICICI Bank Limited Equity Shares - 1,400.80
VALUE15 Brigade Enterprises Limited $ Equity Shares 1,511.54 -
VALUE15 ICICI Bank Limited Equity Shares 2,803.50 2,510.72
VALUE16 ICICI Bank Limited Equity Shares 3,181.39 2,677.60
VALUE16 ICICI Lombard General Insurance Company Limited & Equity Shares 225.84 -
VALUE17 Brigade Enterprises Limited $ Equity Shares 300.72 294.78
VALUE17 ICICI Bank Limited Equity Shares 833.70 579.42
VALUE17 ICICI Lombard General Insurance Company Limited & Equity Shares 225.84 -
VALUE18 ICICI Bank Limited Equity Shares 560.70 334.02
VALUE18 ICICI Lombard General Insurance Company Limited & Equity Shares 207.78 -
VALUE19 ICICI Bank Limited Equity Shares 5,762.19 3,490.51
VALUE19 ICICI Securities Ltd. & Equity Shares - 4,000.36
VALUE4 ICICI Bank Limited Equity Shares 325.69 226.35
VALUE9 ICICI Bank Limited Equity Shares 1,708.70 2,257.60
(` in Lakhs)
Name of Sponsor/ Associate/Group Company Nature of Investment 2018-19 2017-18
Aggregate Market Value of Investment
by all Schemes
Aggregate Market Value of Investment
by all Schemes
Aster DM Healthcare Limited $ Equity Shares 2,144.63 -
Birla Corporation Limited $ Equity Shares 0.09 -
Brigade Enterprises Limited $ Equity Shares 14,184.22 9,645.02
City Union Bank Ltd $ Equity Shares - 1,473.97
Gammon Infrastructure Projects Limited Equity Shares 70.98 -
GMR Infrastructure Ltd $ Equity Shares 0.27 3,154.32
ICICI Bank Limited Debentures and Bonds 318,759.50 248,862.17
ICICI Bank Limited Equity Shares 579,737.79 459,652.09
ICICI Home Finance Company Limited Debentures and Bonds 9,924.08 42,514.30
ICICI Lombard General Insurance Company Limited & Equity Shares 29,382.91 4,160.66
ICICI Prudential Life Insurance Company Limited & Equity Shares 23,562.82 18,077.29
ICICI Securities Ltd. & Equity Shares 18,624.99 64,000.07
The above investments are in normal course and are in accordance with the investment objective of relevant scheme.
$ The disclosure has been made as director (s) of the AMC is/ are also on the board of the aforesaid companies.
& The disclosure has been made as Group company and as director (s) of the AMC is/ are also on the board of the aforesaid companies.
1.4 Subscription by scheme (excluding Secondary Market Purchases) in the issues lead managed by the associate company during 2018-19:
(` in Lakhs)
Name of the Issuer Instrument Scheme Code Amount
HDFC Asset Management Company Limited Equity Share BUSINESS1 672.96
HDFC Asset Management Company Limited Equity Share VALUE10 414.99
HDFC Asset Management Company Limited Equity Share VALUE16 5,625.19
HDFC Asset Management Company Limited Equity Share VALUE17 726.58
HDFC Asset Management Company Limited Equity Share VALUE18 1,203.06
HDFC Asset Management Company Limited Equity Share VALUE9 299.87
Subscription by scheme (excluding Secondary Market Purchases) in the issues lead managed by the associate company during 2017-18: (` in Lakhs)
Name of the Issuer Instrument Scheme Code Amount
AU Small Finance Bank Limited Equity Share BUSINESS1 991.35
Galaxy Surfactants Limited Equity Share VALUE16 1,746.40
Housing And Urban Development Corporation Limited Equity Share BUSINESS1 2,058.48
Sandhar Technologies Limited Equity Share VALUE10 733.26
Sandhar Technologies Limited Equity Share VALUE20 4,394.15
Sandhar Technologies Limited Equity Share VALUE19 6,920.96
SBI Life Insurance Company Limited Equity Share RECOVERY7 244.90

42
Name of the Issuer Instrument Scheme Code Amount
SBI Life Insurance Company Limited Equity Share VALUE12 1,457.36
SBI Life Insurance Company Limited Equity Share VALUE15 2,099.90
SBI Life Insurance Company Limited Equity Share VALUE16 2,099.90
SBI Life Insurance Company Limited Equity Share VALUE17 699.87
SBI Life Insurance Company Limited Equity Share VALUE9 2,519.87
Tata Steel Limited Equity Share GROWTH1 10.50
Tata Steel Limited Equity Share RECOVERY7 5.62
Tata Steel Limited Equity Share VALUE13 36.53
1.5 Subscription to any issue of equity or debt on private placement basis where the sponsor or its associate companies have acted as arranger or manager during 2018-19 :Nil (Previous Year - Nil)
1.6 Open Position of securities borrowed : Nil (Previous Year - Nil)
Open Position of securities lend : Nil (Previous Year - Nil)
1.7 Details of NPA
Aggregate market value : Nil (Previous Year - Nil)
Provision thereof Nil (Previous Year - Nil)
1.8 Aggregate Unrealised Gain / Loss as at the end of the Financial Year and percentage to net assets:
Scheme Code 2018-19 2017-18
Unrealised Gain / (Loss) (` in Lakhs) % of Net Assets Unrealised Gain / (Loss) (` in Lakhs) % of Net Assets
BHACON1 (2,641.14) -2.81% - -
BHACON2 (1,108.54) -3.97% - -
BHACON3 (100.12) -0.80% - -
BHACON4 (1,346.24) -3.34% - -
BHACON5 149.61 4.48% - -
BUSINESS1 (366.14) -1.32% 179.94 0.61%
GROWTH1 795.71 7.63% (9.86) -0.10%
GROWTH2 584.58 11.99% 298.77 6.82%
GROWTH3 (176.07) -3.98% (102.60) -0.32%
RECOVERY5 319.63 4.14% (195.37) -2.66%
RECOVERY7 281.56 6.06% 42.29 0.99%
VALUE10 (506.89) -3.55% (87.64) -0.61%
VALUE11 621.71 4.46% 476.13 3.40%
VALUE12 887.60 1.24% (1,775.57) -2.71%
VALUE13 (4,003.19) -5.58% (3,908.24) -5.81%
VALUE14 (318.44) -0.59% (1,876.84) -3.56%
VALUE15 (1,924.83) -3.11% (2,068.02) -3.62%
VALUE16 3,139.44 5.02% (291.83) -0.49%
VALUE17 (311.48) -1.58% (313.07) -1.66%
VALUE18 364.41 2.71% (54.69) -0.45%
VALUE19 (9,904.39) -5.13% (13,652.72) -7.77%
VALUE20 (1,789.36) -3.52% (1,804.94) -3.56%
VALUE4 487.92 6.41% 380.31 4.85%
VALUE8 (48.68) -4.29% (1,095.79) -4.15%
VALUE9 207.51 0.71% 821.59 2.91%
1.9 Aggregate Value of Purchase and Sale with Percentage to average assets :
Scheme Code 2018-19 2017-18Average Net
Assets (` in Lakhs)
Purchases (` in Lakhs)
% to Average
Net Assets
Sales (` in Lakhs)
% to Average Net
Assets
Average Net Assets
(` in Lakhs)
Purchases (` in Lakhs)
% to Average Net
Assets
Sales (` in Lakhs)
% to Average Net
AssetsEquity SecuritiesBHACON1 91,912.99 120,548.25 131.15% 32,282.58 35.12% - - - - - BHACON2 27,356.75 31,494.22 115.12% 7,056.57 25.79% - - - - - BHACON3 12,344.29 14,667.31 118.82% 3,585.99 29.05% - - - - - BHACON4 39,641.31 43,767.67 110.41% 5,437.96 13.72% - - - - - BHACON5 3,219.43 3,250.28 100.96% 552.30 17.16% - - - - - BUSINESS1 27,737.28 9,365.75 33.77% 15,637.24 56.38% 32,691.61 19,255.49 58.90% 27,786.44 85.00%GROWTH1 9,609.51 3,417.90 35.57% 3,291.25 34.25% 21,805.57 9,666.72 44.33% 59,661.69 273.61%GROWTH2 4,615.19 1,087.18 23.56% 1,449.01 31.40% 43,766.26 15,523.55 35.47% 63,417.63 144.90%GROWTH3 4,944.64 6,030.21 121.95% 2,305.67 46.63% 37,255.81 21,182.04 56.86% 64,488.58 173.10%RECOVERY5 7,478.46 12,415.33 166.01% 13,194.15 176.43% 7,506.37 13,252.52 176.55% 15,205.11 202.56%

43
Scheme Code 2018-19 2017-18Average Net
Assets (` in Lakhs)
Purchases (` in Lakhs)
% to Average
Net Assets
Sales (` in Lakhs)
% to Average Net
Assets
Average Net Assets
(` in Lakhs)
Purchases (` in Lakhs)
% to Average Net
Assets
Sales (` in Lakhs)
% to Average Net
AssetsRECOVERY7 4,328.38 2,566.80 59.30% 2,094.26 48.38% 4,832.38 4,394.72 90.94% 6,456.19 133.60%VALUE10 14,202.54 4,296.00 30.25% 4,640.66 32.67% 15,808.86 12,702.86 80.35% 15,024.83 95.04%VALUE11 13,694.52 1,675.79 12.24% 3,112.95 22.73% 14,551.03 5,100.71 35.05% 7,603.93 52.26%VALUE12 66,957.24 46,620.01 69.63% 43,198.84 64.52% 71,571.82 137,935.24 192.72% 90,691.14 126.71%VALUE13 68,460.49 57,171.86 83.51% 44,815.14 65.46% 72,080.50 117,102.57 162.46% 65,505.06 90.88%VALUE14 51,583.83 22,566.72 43.75% 22,499.24 43.62% 54,633.75 61,404.37 112.39% 20,590.79 37.69%VALUE15 56,805.68 44,577.00 78.47% 43,423.31 76.44% 58,824.98 69,838.78 118.72% 23,607.00 40.13%VALUE16 59,310.39 30,509.51 51.44% 27,011.48 45.54% 60,248.60 67,604.54 112.21% 24,660.67 40.93%VALUE17 18,632.43 9,600.66 51.53% 9,520.45 51.10% 19,531.78 21,309.38 109.10% 6,280.13 32.15%VALUE18 12,507.85 4,371.95 34.95% 5,553.07 44.40% 12,233.85 13,099.70 107.08% 3,389.23 27.70%VALUE19 179,160.71 179,231.72 100.04% 140,062.08 78.18% 179,939.13 178,635.20 99.28% 22,885.88 12.72%VALUE20 49,355.37 18,699.01 37.89% 17,272.12 35.00% 51,265.68 45,724.04 89.19% 2,965.49 5.78%VALUE4 7,552.06 866.14 11.47% 1,007.63 13.34% 9,190.33 6,762.70 73.58% 17,581.33 191.30%VALUE8 10,339.97 13,943.25 134.85% 37,913.04 366.66% 29,290.21 43,547.68 148.68% 51,674.18 176.42%VALUE9 27,543.56 15,880.15 57.65% 14,945.32 54.26% 30,285.24 14,973.88 49.44% 21,523.64 71.07%Other than Equity SecuritiesBHACON1 91,912.99 23,364.90 25.42% 19,124.13 20.81% - - - - - BHACON2 27,356.75 8,099.00 29.61% 6,499.00 23.76% - - - - - BHACON3 12,344.29 2,099.00 17.00% 1,500.00 12.15% - - - - - BHACON4 39,641.31 4,250.00 10.72% 3,550.00 8.96% - - - - - BHACON5 3,219.43 18.89 0.59% - - - - - - - BUSINESS1 27,737.28 1,913.17 6.90% 1,945.82 7.02% 32,691.61 3,078.25 9.42% 3,127.84 9.57%GROWTH1 9,609.51 1,518.67 15.80% 1,827.63 19.02% 21,805.57 324.19 1.49% - - GROWTH2 4,615.19 225.59 4.89% 227.49 4.93% 43,766.26 3,710.55 8.48% 3,757.37 8.59%GROWTH3 4,944.64 324.50 6.56% 249.50 5.05% 37,255.81 971.92 2.61% 1,010.10 2.71%RECOVERY5 7,478.46 300.00 4.01% 300.59 4.02% 7,506.37 - - - - RECOVERY7 4,328.38 850.00 19.64% 886.39 20.48% 4,832.38 180.09 3.73% - - VALUE10 14,202.54 1,063.82 7.49% 643.95 4.53% 15,808.86 - - - - VALUE11 13,694.52 - - - - 14,551.03 - - - - VALUE12 66,957.24 13,256.25 19.80% 13,289.67 19.85% 71,571.82 22,765.57 31.81% 23,149.15 32.34%VALUE13 68,460.49 13,876.14 20.27% 13,240.67 19.34% 72,080.50 16,586.71 23.01% 16,888.91 23.43%VALUE14 51,583.83 10,499.45 20.35% 9,075.00 17.59% 54,633.75 9,981.79 18.27% 10,000.00 18.30%VALUE15 56,805.68 8,424.56 14.83% 7,425.00 13.07% 58,824.98 538.53 0.92% 564.63 0.96%VALUE16 59,310.39 10,155.70 17.12% 8,872.12 14.96% 60,248.60 3,366.35 5.59% 3,456.82 5.74%VALUE17 18,632.43 4,815.89 25.85% 4,120.89 22.12% 19,531.78 546.63 2.80% 572.71 2.93%VALUE18 12,507.85 3,944.79 31.54% 3,229.17 25.82% 12,233.85 370.66 3.03% 388.01 3.17%VALUE19 179,160.71 33,106.85 18.48% 39,846.18 22.24% 179,939.13 22,721.98 12.63% 16,346.35 9.08%VALUE20 49,355.37 14,461.98 29.30% 14,262.11 28.90% 51,265.68 2,500.00 4.88% - - VALUE4 7,552.06 - - - - 9,190.33 - - - - VALUE8 10,339.97 1,500.00 14.51% 1,500.00 14.51% 29,290.21 4,209.66 14.37% 4,231.03 14.45%VALUE9 27,543.56 998.00 3.62% 1,947.83 7.07% 30,285.24 1,959.46 6.47% 1,008.19 3.33%TotalBHACON1 91,912.99 143,913.16 156.58% 51,406.71 55.93% - - - - - BHACON2 27,356.75 39,593.22 144.73% 13,555.57 49.55% - - - - - BHACON3 12,344.29 16,766.31 135.82% 5,085.99 41.20% - - - - - BHACON4 39,641.31 48,017.67 121.13% 8,987.96 22.67% - - - - - BHACON5 3,219.43 3,269.17 101.54% 552.30 17.16% - - - - - BUSINESS1 27,737.28 11,278.92 40.66% 17,583.06 63.39% 32,691.61 22,333.73 68.32% 30,914.27 94.56%GROWTH1 9,609.51 4,936.56 51.37% 5,118.88 53.27% 21,805.57 9,990.90 45.82% 59,661.69 273.61%GROWTH2 4,615.19 1,312.78 28.44% 1,676.51 36.33% 43,766.26 19,234.09 43.95% 67,175.00 153.49%GROWTH3 4,944.64 6,354.71 128.52% 2,555.17 51.68% 37,255.81 22,153.96 59.46% 65,498.68 175.81%RECOVERY5 7,478.46 12,715.33 170.03% 13,494.73 180.45% 7,506.37 13,252.52 176.55% 15,205.11 202.56%RECOVERY7 4,328.38 3,416.80 78.94% 2,980.65 68.86% 4,832.38 4,574.81 94.67% 6,456.19 133.60%VALUE10 14,202.54 5,359.82 37.74% 5,284.62 37.21% 15,808.86 12,702.86 80.35% 15,024.83 95.04%VALUE11 13,694.52 1,675.79 12.24% 3,112.95 22.73% 14,551.03 5,100.71 35.05% 7,603.93 52.26%VALUE12 66,957.24 59,876.26 89.42% 56,488.52 84.37% 71,571.82 160,700.81 224.53% 113,840.29 159.06%VALUE13 68,460.49 71,047.99 103.78% 58,055.81 84.80% 72,080.50 133,689.28 185.47% 82,393.97 114.31%VALUE14 51,583.83 33,066.17 64.10% 31,574.24 61.21% 54,633.75 71,386.16 130.66% 30,590.79 55.99%VALUE15 56,805.68 53,001.56 93.30% 50,848.31 89.51% 58,824.98 70,377.31 119.64% 24,171.63 41.09%

44
Scheme Code 2018-19 2017-18Average Net
Assets (` in Lakhs)
Purchases (` in Lakhs)
% to Average
Net Assets
Sales (` in Lakhs)
% to Average Net
Assets
Average Net Assets
(` in Lakhs)
Purchases (` in Lakhs)
% to Average Net
Assets
Sales (` in Lakhs)
% to Average Net
AssetsVALUE16 59,310.39 40,665.21 68.56% 35,883.60 60.50% 60,248.60 70,970.89 117.80% 28,117.49 46.67%VALUE17 18,632.43 14,416.55 77.37% 13,641.34 73.21% 19,531.78 21,856.00 111.90% 6,852.83 35.09%VALUE18 12,507.85 8,316.74 66.49% 8,782.24 70.21% 12,233.85 13,470.36 110.11% 3,777.24 30.88%VALUE19 179,160.71 212,338.56 118.52% 179,908.26 100.42% 179,939.13 201,357.17 111.90% 39,232.22 21.80%VALUE20 49,355.37 33,160.99 67.19% 31,534.22 63.89% 51,265.68 48,224.04 94.07% 2,965.49 5.78%VALUE4 7,552.06 866.14 11.47% 1,007.63 13.34% 9,190.33 6,762.70 73.58% 17,581.33 191.30%VALUE8 10,339.97 15,443.25 149.35% 39,413.04 381.17% 29,290.21 47,757.34 163.05% 55,905.21 190.87%VALUE9 27,543.56 16,878.15 61.28% 16,893.15 61.33% 30,285.24 16,933.34 55.91% 22,531.83 74.40%
Excludes transactions in futures & options, Interest Rate Swaps, Collaterised Lending,Reverse Repo and Tri-Party Repo Includes Units of Mutual Funds, debt and money market and Fixed Deposits.
1.10 Non-Traded securities in the portfolio:
Scheme Code
Particulars As at March 31, 2019 As at March 31, 2018Amount (` in Lakhs) % of Net Assets Value Amount (` in Lakhs) % of Net Assets Value
GROWTH1 Aggregate value of non traded Units of Mutual Fund - - 314.99 3.34%GROWTH2 Aggregate value of non traded Units of Mutual Fund 12.09 0.25% - - RECOVERY7 Aggregate value of non traded Units of Mutual Fund - - 174.99 4.10%VALUE10 Aggregate value of non traded Units of Mutual Fund 96.71 0.68% - - VALUE9 Aggregate value of non traded Units of Mutual Fund - - 927.87 3.29%VALUE16 Aggregate value of non traded Units of Mutual Fund 1,515.58 2.42% - - VALUE17 Aggregate value of non traded Units of Mutual Fund 229.53 1.16% - - VALUE18 Aggregate value of non traded Units of Mutual Fund 144.96 1.08% - - VALUE20 Aggregate value of non traded Units of Mutual Fund 925.68 1.82% - - BHACON5 Aggregate value of non traded Units of Mutual Fund 20.19 0.60% - -
2 Details of Transaction with Associates under regulation 25(8).
Brokerage paid to associates/related parties/group companies of Sponsor/AMC
Name Nature of Association/
Nature of relation
Scheme Code
2018-19 2017-18
Value of transaction (` in Lakhs)
% of total value of transaction of the fund
Brokerage (` in Lakhs)
% of the total
brokerage related to scheme
Value of transaction (` in Lakhs)
% of total value of transaction of the fund
Brokerage (` in Lakhs)
% of the total
brokerage related to scheme
ICICI Securi-ties Limited
Group Company BHACON1 29,467.19 3.69% 10.25 6.37% - - - -
BHACON2 14,545.69 5.25% 3.37 6.47% - - - -
BHACON3 2,226.63 2.49% 0.66 3.56% - - - -
BHACON4 2,748.91 1.90% 1.64 4.23% - - - -
BHACON5 497.93 9.19% 0.26 12.71% - - - -
BUSINESS1 672.63 0.81% 0.40 1.81% 3,630.01 3.21% 2.13 7.07%
GROWTH1 787.90 0.93% 0.43 3.06% 13,289.32 9.87% 8.04 14.54%
GROWTH2 173.67 0.53% 0.10 1.83% 11,398.86 10.97% 6.67 11.82%
GROWTH3 916.76 1.83% 0.53 4.65% 14,028.23 7.17% 7.49 10.49%
RECOVERY5 5,083.67 12.40% 2.88 15.88% 8,282.55 25.33% 4.86 24.43%
RECOVERY7 475.95 1.08% 0.25 3.31% 3,941.76 18.81% 2.32 30.77%
VALUE10 837.04 1.33% 0.50 4.28% 5,242.30 13.68% 3.07 17.60%
VALUE11 984.93 7.08% 0.58 12.73% 4,598.51 37.76% 2.72 32.16%
VALUE12 16,421.94 2.84% 4.49 4.14% 28,717.58 4.64% 12.40 5.31%
VALUE13 24,850.28 4.42% 4.99 4.06% 14,311.39 2.92% 6.20 3.25%
VALUE14 13,679.44 3.76% 3.10 4.75% 1,802.90 1.47% 1.05 1.53%
VALUE15 13,768.24 3.22% 5.54 6.01% 25,955.69 20.20% 13.92 18.66%
VALUE16 2,385.48 1.51% 1.16 2.07% 10,649.26 8.79% 5.35 6.74%
VALUE17 1,199.75 0.73% 0.68 2.28% 9,333.48 21.10% 5.25 24.08%
VALUE18 700.76 0.59% 0.41 1.88% 5,539.10 16.22% 3.27 25.33%
VALUE19 38,823.16 2.81% 12.37 3.66% 62,827.64 11.85% 12.29 5.35%
VALUE20 8,634.84 2.40% 1.29 2.30% 4,336.37 4.72% 2.52 8.59%
VALUE4 370.38 13.21% 0.22 16.48% 13,515.99 55.48% 8.01 52.92%
VALUE8 9,039.79 8.42% 5.25 13.89% 13,332.91 7.29% 7.38 9.16%
VALUE9 3,653.84 4.78% 2.02 9.57% 5,001.00 10.23% 2.95 11.59%

45
Commission paid to associates/related parties/group companies of Sponsor/AMC
Name Nature of As-sociation/ Nature
of relation
Scheme Code
2018-19 2017-18
Value of transaction (` in Lakhs)
% of total value of
transaction of the fund
Commission (` in Lakhs)
% of the total
commission related to scheme
Value of transaction (` in Lakhs)
% of total value of
transaction of the fund
Commission (` in Lakhs)
% of the total
commission related to scheme
ICICI Bank Limited @ Sponsor BHACON1 53,503.42 59.01% 1,118.60 61.33% - - - -
BHACON2 89.43 0.31% 1.65 0.32% - - - -
BHACON3 35.74 0.29% 0.18 0.07% - - - -
BHACON4 12,786.11 29.77% 220.31 31.30% - - - -
BHACON5 6.85 0.19% 0.03 0.18% - - - -
BUSINESS1 20.65 2.55% 2.69 2.22% 6.51 0.10% 3.25 2.25%
GROWTH1 3.13 1.11% 9.20 10.37% 94.80 2.78% 42.12 24.51%
GROWTH2 - - 7.22 18.85% 230.66 7.16% 73.54 58.52%
GROWTH3 2.14 1.75% 13.28 19.40% 53.94 3.55% 49.48 84.94%
RECOVERY5 - - 21.69 43.57% - - 21.86 43.61%
RECOVERY7 2.08 1.51% 44.65 88.45% 13.29 4.28% 51.44 88.21%
VALUE10 59.30 10.54% 114.32 69.23% 22.48 4.05% 132.45 68.82%
VALUE11 61.21 5.95% 35.87 30.78% 15.29 2.68% 39.17 25.58%
VALUE12 132.34 5.44% 562.66 55.57% 31,512.25 46.21% 748.51 43.38%
VALUE13 132.55 5.57% 256.79 28.15% 18,585.41 26.22% 476.17 29.43%
VALUE14 68.50 2.65% 1.80 0.25% 169.63 0.32% 2.16 0.21%
VALUE15 63.58 3.02% 332.32 49.90% 33,177.21 57.02% 779.73 64.68%
VALUE16 62.30 2.43% 510.88 68.60% 40,397.58 67.70% 809.83 74.56%
VALUE17 121.88 16.49% 136.53 51.25% 9,895.14 51.91% 192.54 59.59%
VALUE18 11.11 2.61% 73.71 41.80% 4,978.41 41.29% 102.07 54.71%
VALUE19 445.77 9.09% 1,383.14 56.21% 89,261.78 47.35% 845.90 46.23%
VALUE20 12.46 0.59% 3.56 0.91% 239.46 0.46% 1.23 0.21%
VALUE4 - - 4.46 8.83% 2.61 0.04% 11.51 9.18%
VALUE8 33.39 8.65% 67.28 64.54% 1,274.21 54.59% 175.82 63.19%
VALUE9 0.71 0.07% 0.20 0.22% - - 0.30 0.14%
ICICI Securities Limited Group Company BHACON1 2,407.88 2.66% 29.60 1.62% - - - -
BHACON2 401.29 1.41% 5.18 1.01% - - - -
BHACON3 116.57 0.95% 1.74 0.72% - - - -
BHACON4 3,585.70 8.35% 62.20 8.84% - - - -
BHACON5 14.25 0.39% 0.09 0.55% - - - -
BUSINESS1 2.54 0.31% 1.32 1.09% 45.24 0.67% 1.03 0.71%
GROWTH1 7.66 2.72% 2.14 2.41% 149.57 4.38% 4.36 2.54%
GROWTH2 22.67 20.72% 2.00 5.22% 281.84 8.75% 17.52 13.94%
GROWTH3 15.54 12.68% 1.62 2.37% 170.85 11.23% 3.72 6.38%
RECOVERY5 - - 1.38 2.77% 42.28 10.44% 1.35 2.69%
RECOVERY7 38.05 27.57% 1.60 3.17% 69.66 22.41% 1.84 3.16%
VALUE10 58.49 10.40% 5.52 3.34% 114.13 20.57% 6.45 3.35%
VALUE11 15.60 1.52% 4.16 3.57% 69.96 12.28% 4.57 2.99%
VALUE12 364.48 14.99% 17.14 1.69% 1,385.41 2.03% 19.53 1.13%
VALUE13 264.41 11.12% 16.02 1.76% 1,227.67 1.73% 15.37 0.95%
VALUE14 171.56 6.63% 229.04 31.31% 12,738.33 23.75% 210.74 20.81%
VALUE15 377.34 17.94% 33.52 5.03% 2,180.69 3.75% 25.60 2.12%
VALUE16 440.10 17.13% 8.33 1.12% 990.13 1.66% 5.66 0.52%
VALUE17 144.80 19.59% 4.54 1.70% 457.57 2.40% 2.63 0.82%
VALUE18 84.09 19.73% 29.14 16.53% 1,833.45 15.21% 12.89 6.91%
VALUE19 826.07 16.85% 123.02 5.00% 7,711.38 4.09% 41.79 2.28%
VALUE20 129.03 6.12% 43.19 11.02% 2,648.08 5.04% 6.72 1.14%
VALUE4 3.96 1.67% 0.87 1.72% 10.58 0.14% 2.11 1.69%
VALUE8 31.15 8.07% 1.15 1.10% 233.98 10.02% 2.75 0.99%
VALUE9 - - 1.35 1.47% 0.36 ^^ 2.22 1.08%

46
Name Nature of As-sociation/ Nature
of relation
Scheme Code
2018-19 2017-18
Value of transaction (` in Lakhs)
% of total value of
transaction of the fund
Commission (` in Lakhs)
% of the total
commission related to scheme
Value of transaction (` in Lakhs)
% of total value of
transaction of the fund
Commission (` in Lakhs)
% of the total
commission related to scheme
Abinash Bardhan $ ## Distributor is a rela-tive of an employee of the AMC
BHACON1 2.95 ^^ 0.06 ^^ - - - -
BHACON4 5.00 0.01% 0.12 0.02% - - - -
VALUE12 - - 0.05 ^^ 7.45 0.01% 0.29 0.02%
VALUE13 - - ^^ ^^ 0.05 ^^ ^^ ^^
VALUE15 - - ^^ ^^ 0.30 ^^ 0.01 ^^
VALUE18 - - 0.01 0.01% 2.40 0.02% 0.06 0.03%
VALUE19 - - - - 1.15 ^^ - -
VALUE20 - - - - 0.45 ^^ - -
Agarwal Investments $ Distributor is a rela-tive of an employee of the AMC
GROWTH2 - - - - - - ^^ ^^
VALUE10 - - ^^ ^^ - - ^^ ^^
VALUE13 - - 0.01 ^^ 0.65 ^^ 0.02 ^^
VALUE14 - - 0.01 ^^ 0.75 ^^ 0.02 ^^
VALUE19 - - ^^ ^^ 0.50 ^^ ^^ ^^
Anil Khera $ Distributor is a rela-tive of an employee of the AMC
VALUE12 - - 0.06 0.01% - - 0.03 ^^
VALUE15 - - 0.02 ^^ - - 0.01 ^^
VALUE16 7.97 0.31% - - - - - -
VALUE18 - - - - 20.36 0.17% - -
Ganesh Kumar Sivasu-bramanian $
Distributor is a rela-tive of an employee of the AMC
BHACON4 0.10 ^^ ^^ ^^ - - - -
Dhara Janak Kapadia $ &
Distributor is a rela-tive of an employee of the AMC
BHACON1 0.10 ^^ ^^ ^^ - - - -
Other Charges paid to associates/related parties/group companies of Sponsor/AMC
Entity Nature of Association/ Nature of relation
Nature of Payment Scheme Code Amount (` in Lakhs)
2018-19 2017-18
ICICI Bank Limited @ Sponsor Bank Charges ** BHACON1 13.99 -
BHACON2 4.10 -
BHACON3 1.22 -
BHACON4 2.10 -
BHACON5 0.05 -
BUSINESS1 1.01 1.27
GROWTH1 1.45 2.21
GROWTH2 0.51 1.26
GROWTH3 0.89 2.69
RECOVERY5 0.82 0.29
RECOVERY7 0.71 0.27
VALUE10 0.92 0.23
VALUE11 0.54 ^^
VALUE12 9.04 9.38
VALUE13 8.66 8.28
VALUE14 5.94 5.70
VALUE15 8.06 5.82
VALUE16 3.98 1.78
VALUE17 2.46 1.43
VALUE18 1.86 0.54
VALUE19 29.28 7.82
VALUE20 6.08 1.24
VALUE4 0.01 0.02
VALUE8 1.31 2.22
VALUE9 0.87 0.36
ICICI Bank Limited @ Sponsor Investor Service Charges BHACON1 ^^ -
BHACON2 ^^ -
GROWTH3 ^^ -
VALUE12 - 0.02
VALUE13 - 0.02

47
Entity Nature of Association/ Nature of relation
Nature of Payment Scheme Code Amount (` in Lakhs)
2018-19 2017-18
ICICI Bank Limited @ Sponsor Investor Service Charges VALUE14 - 0.02
VALUE15 - 0.02
VALUE16 - 0.02
VALUE17 - 0.02
VALUE18 - 0.01
VALUE19 - 0.08
VALUE20 - 0.02 **Bank charges paid include transaction charges paid to ICICI Bank Limited (Professional clearing member) for futures & options transactions
^^ Amount less than Rs. 0.005 lakhs or 0.005%
@ Holding by a major shareholder of AMC, viz, ICICI Bank Limited whether directly or indirectly
$ The disclosure has been made as Distributor is a relative of an employee of the AMC.
& Commission paid to distributor not disclosed for previous year as the relative of the distributor has joined as an employee of the AMC during the FY 2018-2019
## Relative of Distributor is ceased to be an employee of the AMC from 28th September 2018.
Commission disclosed above is net off recovery, if any.
Note : The schemes have paid Management Fees and Trustee ship fees to ICICI Prudential Asset Management Company Limited and ICICI Prudential Trust Limited respectively as disclosed in Revenue Account.
3 Investors holding units in the Scheme over 25% of the NAV as on March 31, 2019 are Nil. (Previous year – Nil)
4 Unit Capital movement during the year ended :
2018-19Scheme
CodePlan Balance at the
beginning of the year
Issued during the year/period
Repurchased during the year/
period
Balance at close of the year
Face Value of Units at the close of the
year Units Units Units Units Amount (` in
Lakhs)BUSINESS1 Direct Dividend Option 453,726 - - 453,726 45.37 BUSINESS1 Direct Growth Option 2,323,694 - - 2,323,694 232.37 BUSINESS1 Dividend Option 202,881,488 - - 202,881,488 20,288.15 BUSINESS1 Growth Option 62,374,834 - - 62,374,834 6,237.48 BUSINESS1 Total 268,033,742 - - 268,033,742 26,803.37 GROWTH1 Direct Dividend Option 1,703,793 - - 1,703,793 170.38 GROWTH1 Dividend Option 90,438,872 - - 90,438,872 9,043.89 GROWTH1 Total 92,142,665 - - 92,142,665 9,214.27 GROWTH2 Direct Dividend Option 1,279,212 - - 1,279,212 127.92 GROWTH2 Dividend Option 39,606,523 - (64,965) 39,541,558 3,954.16 GROWTH2 Total 40,885,735 - (64,965) 40,820,770 4,082.08 GROWTH3$ Direct Dividend Option 4,685,645 - (3,450,607) 1,235,038 123.50 GROWTH3$ Dividend Option 293,343,866 - (252,612,947) 40,730,919 4,073.09 GROWTH3$ Total 298,029,511 - (256,063,554) 41,965,957 4,196.60 RECOVERY5 Direct Dividend Option 131,094 - - 131,094 13.11 RECOVERY5 Direct Growth Option 267,718 - - 267,718 26.77 RECOVERY5 Dividend Option 41,747,606 - - 41,747,606 4,174.76 RECOVERY5 Growth Option 23,252,616 - - 23,252,616 2,325.26 RECOVERY5 Total 65,399,034 - - 65,399,034 6,539.90 RECOVERY7 Direct Dividend Option 504,301 - - 504,301 50.43 RECOVERY7 Dividend Option 41,390,233 - - 41,390,233 4,139.02 RECOVERY7 Total 41,894,534 - - 41,894,534 4,189.45 VALUE10 Direct Dividend Option 1,654,900 - - 1,654,900 165.49 VALUE10 Direct Growth Option 1,980,760 - - 1,980,760 198.08 VALUE10 Dividend Option 77,746,799 - - 77,746,799 7,774.68 VALUE10 Growth Option 53,520,829 - - 53,520,829 5,352.08 VALUE10 Total 134,903,288 - - 134,903,288 13,490.33 VALUE11 Direct Dividend Option 11,773,250 - - 11,773,250 1,177.33 VALUE11 Direct Growth Option 1,544,822 - - 1,544,822 154.48 VALUE11 Dividend Option 68,065,414 - - 68,065,414 6,806.54

48
2018-19Scheme
CodePlan Balance at the
beginning of the year
Issued during the year/period
Repurchased during the year/
period
Balance at close of the year
Face Value of Units at the close of the
year Units Units Units Units Amount (` in
Lakhs)VALUE11 Growth Option 45,227,591 - - 45,227,591 4,522.76 VALUE11 Total 126,611,077 - - 126,611,077 12,661.11 VALUE12 Direct Dividend Option 19,729,330 - - 19,729,330 1,972.93 VALUE12 Dividend Option 641,760,631 - - 641,760,631 64,176.06 VALUE12 Total 661,489,961 - - 661,489,961 66,149.00 VALUE13 Direct Dividend Option 38,578,829 - - 38,578,829 3,857.88 VALUE13 Dividend Option 639,758,575 - - 639,758,575 63,975.86 VALUE13 Total 678,337,404 - - 678,337,404 67,833.74 VALUE14 Direct Dividend Option 17,142,464 - - 17,142,464 1,714.25 VALUE14 Direct Growth Option 40,219,173 - - 40,219,173 4,021.92 VALUE14 Dividend Option 191,533,345 - - 191,533,345 19,153.33 VALUE14 Growth Option 265,713,529 - - 265,713,529 26,571.35 VALUE14 Total 514,608,511 - - 514,608,511 51,460.85 VALUE15 Direct Dividend Option 5,650,883 - - 5,650,883 565.09 VALUE15 Direct Growth Option 17,780,473 - - 17,780,473 1,778.05 VALUE15 Dividend Option 207,989,742 - - 207,989,742 20,798.97 VALUE15 Growth Option 334,823,583 - - 334,823,583 33,482.36 VALUE15 Total 566,244,681 - - 566,244,681 56,624.47 VALUE16 Direct Dividend Option 4,110,532 - - 4,110,532 411.05 VALUE16 Direct Growth Option 12,947,985 - - 12,947,985 1,294.80 VALUE16 Dividend Option 263,538,637 - - 263,538,637 26,353.86 VALUE16 Growth Option 299,090,463 - - 299,090,463 29,909.05 VALUE16 Total 579,687,617 - - 579,687,617 57,968.76 VALUE17 Direct Dividend Option 1,348,267 - - 1,348,267 134.83 VALUE17 Direct Growth Option 4,996,088 - - 4,996,088 499.61 VALUE17 Dividend Option 58,025,982 - - 58,025,982 5,802.60 VALUE17 Growth Option 122,235,289 - - 122,235,289 12,223.53 VALUE17 Total 186,605,626 - - 186,605,626 18,660.56 VALUE18 Direct Dividend Option 1,052,859 - - 1,052,859 105.29 VALUE18 Direct Growth Option 5,293,782 - - 5,293,782 529.38 VALUE18 Dividend Option 32,687,353 - - 32,687,353 3,268.74 VALUE18 Growth Option 79,995,650 - - 79,995,650 7,999.57 VALUE18 Total 119,029,644 - - 119,029,644 11,902.96 VALUE19 Direct Dividend Option 29,932,259 - - 29,932,259 2,993.23 VALUE19 Direct Growth Option 64,320,068 - - 64,320,068 6,432.01 VALUE19 Dividend Option 618,521,449 0 (0) 618,521,449 61,852.14 VALUE19 Growth Option 1,121,637,573 - - 1,121,637,573 112,163.76 VALUE19 Total 1,834,411,349 0 (0) 1,834,411,349 183,441.13 VALUE20 Direct Dividend Option 3,282,291 - - 3,282,291 328.23 VALUE20 Direct Growth Option 12,221,794 - - 12,221,794 1,222.18 VALUE20 Dividend Option 192,742,005 - 1 192,742,006 19,274.20 VALUE20 Growth Option 309,338,020 - - 309,338,020 30,933.80 VALUE20 Total 517,584,110 - 1 517,584,111 51,758.41 VALUE4 Direct Dividend Option 365,922 - - 365,922 36.59 VALUE4 Direct Growth Option 230,814 - - 230,814 23.08 VALUE4 Dividend Option 41,658,405 - - 41,658,405 4,165.84 VALUE4 Growth Option 15,227,265 - - 15,227,265 1,522.73 VALUE4 Total 57,482,406 - - 57,482,406 5,748.24 VALUE8$ Direct Dividend Option 4,209,022 - (3,811,393) 397,629 39.76 VALUE8$ Dividend Option 251,492,538 - (240,980,514) 10,512,024 1,051.20 VALUE8$ Total 255,701,560 - (244,791,907) 10,909,653 1,090.97 VALUE9 Direct Dividend Option 47,929,265 - - 47,929,265 4,792.93 VALUE9 Direct Growth Option 2,363,585 - - 2,363,585 236.36 VALUE9 Dividend Option 137,180,144 - - 137,180,144 13,718.01

49
2018-19Scheme
CodePlan Balance at the
beginning of the year
Issued during the year/period
Repurchased during the year/
period
Balance at close of the year
Face Value of Units at the close of the
year Units Units Units Units Amount (` in
Lakhs)VALUE9 Growth Option 72,037,938 - - 72,037,938 7,203.79 VALUE9 Total 259,510,932 - - 259,510,932 25,951.09 BHACON1# Direct Dividend Option - 10,442,960 - 10,442,960 1,044.30 BHACON1# Direct Growth Option - 41,667,886 - 41,667,886 4,166.79 BHACON1# Dividend Option - 238,753,643 - 238,753,643 23,875.36 BHACON1# Growth Option - 627,687,087 - 627,687,087 62,768.71 BHACON1# Total - 918,551,576 - 918,551,576 91,855.16 BHACON2# Direct Dividend Option - 1,379,403 - 1,379,403 137.94 BHACON2# Direct Growth Option - 7,240,236 - 7,240,236 724.02 BHACON2# Dividend Option - 66,464,329 - 66,464,329 6,646.43 BHACON2# Growth Option - 203,647,788 - 203,647,788 20,364.78 BHACON2# Total - 278,731,756 - 278,731,756 27,873.18 BHACON3# Direct Dividend Option - 347,500 - 347,500 34.75 BHACON3# Direct Growth Option - 1,663,879 - 1,663,879 166.39 BHACON3# Dividend Option - 16,321,591 - 16,321,591 1,632.16 BHACON3# Growth Option - 103,662,930 - 103,662,930 10,366.29 BHACON3# Total - 121,995,900 - 121,995,900 12,199.59 BHACON4# Direct Dividend Option - 513,120 - 513,120 51.31 BHACON4# Direct Growth Option - 3,854,004 - 3,854,004 385.40 BHACON4# Dividend Option - 55,921,551 - 55,921,551 5,592.16 BHACON4# Growth Option - 352,051,806 - 352,051,806 35,205.18 BHACON4# Total - 412,340,481 - 412,340,481 41,234.05 BHACON5# Direct Dividend Option - 52,000 - 52,000 5.20 BHACON5# Direct Growth Option - 890,841 - 890,841 89.08 BHACON5# Dividend Option - 3,159,326 - 3,159,326 315.93 BHACON5# Growth Option - 27,416,982 - 27,416,982 2,741.70 BHACON5# Total - 31,519,149 - 31,519,149 3,151.91
2017-18Scheme Code Plan Balance at the
beginning of the year Issued during the
year/period Repurchased during
the year/period Balance at close of
the year Face Value of Units at the close of the year
Units Units Units Units Amount (` in Lakhs)
BUSINESS1 Direct Dividend Option 453,726 - - 453,726 45.37 BUSINESS1 Direct Growth Option 2,323,694 - - 2,323,694 232.37 BUSINESS1 Dividend Option 202,881,488 - - 202,881,488 20,288.15 BUSINESS1 Growth Option 62,374,834 - - 62,374,834 6,237.48 BUSINESS1 Total 268,033,742 - - 268,033,742 26,803.37 GROWTH1$ Direct Dividend Option 5,841,433 - (4,137,640) 1,703,793 170.38 GROWTH1$ Dividend Option 506,552,575 - (416,113,703) 90,438,872 9,043.89 GROWTH1$ Total 512,394,008 - (420,251,343) 92,142,665 9,214.27 GROWTH2$ Direct Dividend Option 4,896,269 - (3,617,057) 1,279,212 127.92 GROWTH2$ Dividend Option 389,313,429 - (349,706,906) 39,606,523 3,960.65 GROWTH2$ Total 394,209,698 - (353,323,963) 40,885,735 4,088.57 GROWTH3 Direct Dividend Option 4,685,645 - - 4,685,645 468.56 GROWTH3 Dividend Option 293,343,866 - - 293,343,866 29,334.39 GROWTH3 Total 298,029,511 - - 298,029,511 29,802.95 RECOVERY5 Direct Dividend Option 131,094 - - 131,094 13.11 RECOVERY5 Direct Growth Option 267,718 - - 267,718 26.77 RECOVERY5 Dividend Option 41,747,606 - - 41,747,606 4,174.76 RECOVERY5 Growth Option 23,252,616 - - 23,252,616 2,325.26 RECOVERY5 Total 65,399,034 - - 65,399,034 6,539.90 RECOVERY7 Direct Dividend Option 504,301 - - 504,301 50.43 RECOVERY7 Dividend Option 41,390,233 - - 41,390,233 4,139.02 RECOVERY7 Total 41,894,534 - - 41,894,534 4,189.45

50
2017-18Scheme Code Plan Balance at the
beginning of the year Issued during the
year/period Repurchased during
the year/period Balance at close of
the year Face Value of Units at the close of the year
Units Units Units Units Amount (` in Lakhs)
VALUE10 Direct Dividend Option 1,654,900 - - 1,654,900 165.49 VALUE10 Direct Growth Option 1,980,760 - - 1,980,760 198.08 VALUE10 Dividend Option 77,746,799 - - 77,746,799 7,774.68 VALUE10 Growth Option 53,520,829 - - 53,520,829 5,352.08 VALUE10 Total 134,903,288 - - 134,903,288 13,490.33 VALUE11 Direct Dividend Option 11,773,250 - - 11,773,250 1,177.33 VALUE11 Direct Growth Option 1,544,822 - - 1,544,822 154.48 VALUE11 Dividend Option 68,065,414 - - 68,065,414 6,806.54 VALUE11 Growth Option 45,227,591 - - 45,227,591 4,522.76 VALUE11 Total 126,611,077 - - 126,611,077 12,661.11 VALUE12# Direct Dividend Option - 19,729,367 (37) 19,729,330 1,972.93 VALUE12# Dividend Option - 641,761,558 (927) 641,760,631 64,176.06 VALUE12# Total - 661,490,925 (964) 661,489,961 66,148.99 VALUE13# Direct Dividend Option - 38,578,877 (48) 38,578,829 3,857.88 VALUE13# Dividend Option - 639,759,560 (985) 639,758,575 63,975.86 VALUE13# Total - 678,338,438 (1,034) 678,337,404 67,833.74 VALUE14# Direct Dividend Option - 17,142,479 (15) 17,142,464 1,714.25 VALUE14# Direct Growth Option - 40,219,204 (31) 40,219,173 4,021.92 VALUE14# Dividend Option - 191,533,547 (202) 191,533,345 19,153.33 VALUE14# Growth Option - 265,713,902 (373) 265,713,529 26,571.35 VALUE14# Total - 514,609,133 (622) 514,608,511 51,460.85 VALUE15# Direct Dividend Option - 5,650,886 (3) 5,650,883 565.09 VALUE15# Direct Growth Option - 17,780,500 (27) 17,780,473 1,778.05 VALUE15# Dividend Option - 207,989,962 (220) 207,989,742 20,798.97 VALUE15# Growth Option - 334,824,002 (419) 334,823,583 33,482.36 VALUE15# Total - 566,245,351 (670) 566,244,681 56,624.47 VALUE16# Direct Dividend Option - 4,110,536 (4) 4,110,532 411.05 VALUE16# Direct Growth Option - 12,948,001 (16) 12,947,985 1,294.80 VALUE16# Dividend Option - 263,538,790 (153) 263,538,637 26,353.86 VALUE16# Growth Option - 299,090,655 (192) 299,090,463 29,909.05 VALUE16# Total - 579,687,982 (365) 579,687,617 57,968.76 VALUE17# Direct Dividend Option - 1,348,268 (1) 1,348,267 134.83 VALUE17# Direct Growth Option - 4,996,097 (9) 4,996,088 499.61 VALUE17# Dividend Option - 58,026,025 (43) 58,025,982 5,802.60 VALUE17# Growth Option - 122,235,391 (102) 122,235,289 12,223.53 VALUE17# Total - 186,605,782 (156) 186,605,626 18,660.57 VALUE18# Direct Dividend Option - 1,052,859 - 1,052,859 105.29 VALUE18# Direct Growth Option - 5,293,787 (5) 5,293,782 529.38 VALUE18# Dividend Option - 32,687,370 (17) 32,687,353 3,268.74 VALUE18# Growth Option - 79,995,735 (85) 79,995,650 7,999.57 VALUE18# Total - 119,029,751 (107) 119,029,644 11,902.98 VALUE19# Direct Dividend Option - 29,932,285 (26) 29,932,259 2,993.23 VALUE19# Direct Growth Option - 64,320,648 (580) 64,320,068 6,432.01 VALUE19# Dividend Option - 618,521,919 (470) 618,521,449 61,852.14 VALUE19# Growth Option - 1,121,638,633 (1,060) 1,121,637,573 112,163.76 VALUE19# Total - 1,834,413,486 (2,137) 1,834,411,349 183,441.14 VALUE20# Direct Dividend Option - 3,282,300 (9) 3,282,291 328.23 VALUE20# Direct Growth Option - 12,221,815 (21) 12,221,794 1,222.18 VALUE20# Dividend Option - 192,742,161 (156) 192,742,005 19,274.20 VALUE20# Growth Option - 309,338,322 (302) 309,338,020 30,933.80 VALUE20# Total - 517,584,598 (488) 517,584,110 51,758.41 VALUE4$ Direct Dividend Option 627,627 - (261,705) 365,922 36.59 VALUE4$ Direct Growth Option 513,565 - (282,751) 230,814 23.08 VALUE4$ Dividend Option 89,526,443 - (47,868,038) 41,658,405 4,165.84 VALUE4$ Growth Option 36,496,564 - (21,269,299) 15,227,265 1,522.73 VALUE4$ Total 127,164,199 - (69,681,793) 57,482,406 5,748.24
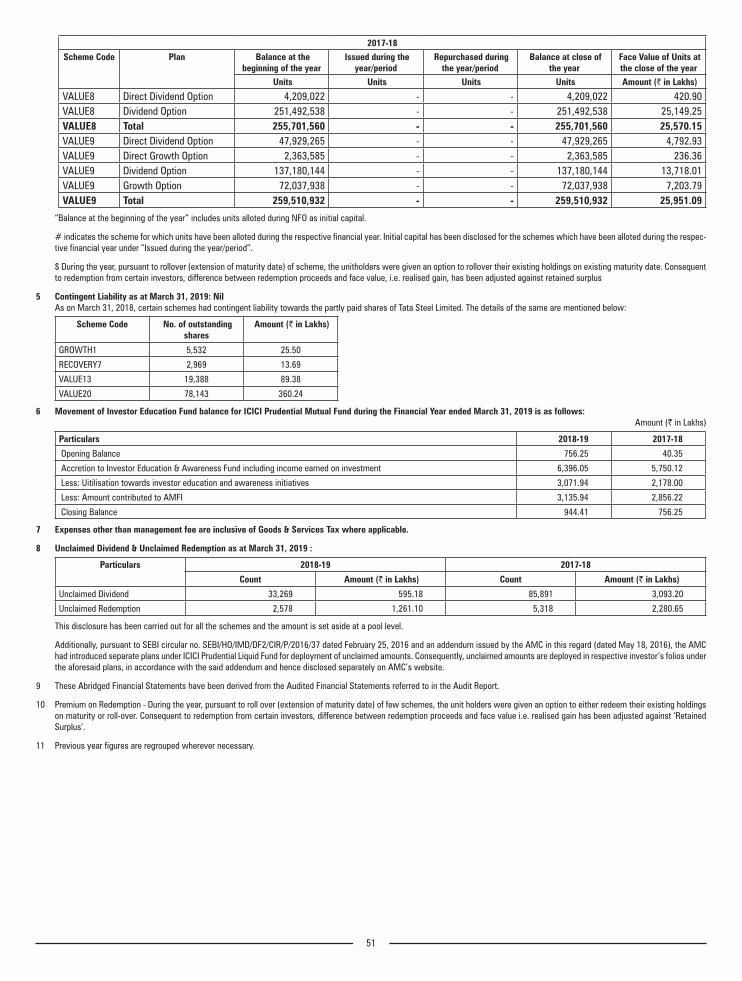
51
2017-18Scheme Code Plan Balance at the
beginning of the year Issued during the
year/period Repurchased during
the year/period Balance at close of
the year Face Value of Units at the close of the year
Units Units Units Units Amount (` in Lakhs)
VALUE8 Direct Dividend Option 4,209,022 - - 4,209,022 420.90 VALUE8 Dividend Option 251,492,538 - - 251,492,538 25,149.25 VALUE8 Total 255,701,560 - - 255,701,560 25,570.15 VALUE9 Direct Dividend Option 47,929,265 - - 47,929,265 4,792.93 VALUE9 Direct Growth Option 2,363,585 - - 2,363,585 236.36 VALUE9 Dividend Option 137,180,144 - - 137,180,144 13,718.01 VALUE9 Growth Option 72,037,938 - - 72,037,938 7,203.79 VALUE9 Total 259,510,932 - - 259,510,932 25,951.09
“Balance at the beginning of the year” includes units alloted during NFO as initial capital.
# indicates the scheme for which units have been alloted during the respective financial year. Initial capital has been disclosed for the schemes which have been alloted during the respec-tive financial year under ”Issued during the year/period”.
$ During the year, pursuant to rollover (extension of maturity date) of scheme, the unitholders were given an option to rollover their existing holdings on existing maturity date. Consequent to redemption from certain investors, difference between redemption proceeds and face value, i.e. realised gain, has been adjusted against retained surplus
5 Contingent Liability as at March 31, 2019: Nil As on March 31, 2018, certain schemes had contingent liability towards the partly paid shares of Tata Steel Limited. The details of the same are mentioned below:
Scheme Code No. of outstanding shares
Amount (` in Lakhs)
GROWTH1 5,532 25.50
RECOVERY7 2,969 13.69
VALUE13 19,388 89.38
VALUE20 78,143 360.24
6 Movement of Investor Education Fund balance for ICICI Prudential Mutual Fund during the Financial Year ended March 31, 2019 is as follows: Amount (` in Lakhs)
Particulars 2018-19 2017-18
Opening Balance 756.25 40.35
Accretion to Investor Education & Awareness Fund including income earned on investment 6,396.05 5,750.12
Less: Uitilisation towards investor education and awareness initiatives 3,071.94 2,178.00
Less: Amount contributed to AMFI 3,135.94 2,856.22
Closing Balance 944.41 756.25
7 Expenses other than management fee are inclusive of Goods & Services Tax where applicable.
8 Unclaimed Dividend & Unclaimed Redemption as at March 31, 2019 :
Particulars 2018-19 2017-18
Count Amount (` in Lakhs) Count Amount (` in Lakhs)
Unclaimed Dividend 33,269 595.18 85,891 3,093.20
Unclaimed Redemption 2,578 1,261.10 5,318 2,280.65
This disclosure has been carried out for all the schemes and the amount is set aside at a pool level.
Additionally, pursuant to SEBI circular no. SEBI/HO/IMD/DF2/CIR/P/2016/37 dated February 25, 2016 and an addendum issued by the AMC in this regard (dated May 18, 2016), the AMC had introduced separate plans under ICICI Prudential Liquid Fund for deployment of unclaimed amounts. Consequently, unclaimed amounts are deployed in respective investor’s folios under the aforesaid plans, in accordance with the said addendum and hence disclosed separately on AMC’s website.
9 These Abridged Financial Statements have been derived from the Audited Financial Statements referred to in the Audit Report.
10 Premium on Redemption - During the year, pursuant to roll over (extension of maturity date) of few schemes, the unit holders were given an option to either redeem their existing holdings on maturity or roll-over. Consequent to redemption from certain investors, difference between redemption proceeds and face value i.e. realised gain has been adjusted against ‘Retained Surplus’.
11 Previous year figures are regrouped wherever necessary.

52
ICICI Prudential Mutual FundAddress: 2nd Floor, Block B-2, Nirlon Knowledge Park, Western Express Highway, Goregaon, Mumbai – 400063Key Statistics (On the basis of closing units) for the year/period ended March 31, 2019 (figures as per Audited Financials)(As per format prescribed for Abridged schemewise Annual Report- SEBI/IMD/CIR No.8/132968/2008 dt 24/07/08)
ICICI Prudential Bharat
Consumption Fund - Series 1 #
ICICI Prudential Bharat
Consumption Fund - Series 2 #
ICICI Prudential Bharat
Consumption Fund - Series 3 #
ICICI Prudential Bharat
Consumption Fund - Series 4 #
ICICI Prudential Bharat
Consumption Fund - Series 5 #
March 31, 2019 March 31, 2019 March 31, 2019 March 31, 2019 March 31, 2019
1 NAV PER UNIT (`)
A Open
Direct Dividend Option - - - - -
Direct Growth Option - - - - -
Dividend Option - - - - -
Growth Option - - - - -
B High
Direct Dividend Option 10.42 10.20 10.50 10.08 10.69
Direct Growth Option 10.42 10.20 10.50 10.08 10.69
Dividend Option 10.32 10.15 10.43 10.05 10.63
Growth Option 10.32 10.15 10.43 10.05 10.63
C Low
Direct Dividend Option 9.63 9.46 9.71 8.99 9.82
Direct Growth Option 9.63 9.46 9.71 8.99 9.82
Dividend Option 9.56 9.37 9.68 8.97 9.78
Growth Option 9.56 9.37 9.68 8.97 9.78
D End
Direct Dividend Option 10.40 10.16 10.44 9.87 10.66
Direct Growth Option 10.40 10.16 10.44 9.87 10.66
Dividend Option 10.24 10.02 10.31 9.78 10.60
Growth Option 10.24 10.02 10.31 9.78 10.60
2 Assets Under Management (` in Lakhs)
Closing 94,107.19 27,930.07 12,576.04 40,321.67 3,340.85
Average (AAuM) 91,912.99 27,356.75 12,344.29 39,641.31 3,219.43
3 Gross Income as % of AAuM * 7.83% 7.32% 8.29% 4.47% 6.37%
4 Expense Ratio
A Total Expense as % of AAuM (plan wise) *
Direct Option 0.82% 1.14% 0.99% 1.08% 1.08%
Other than Direct Option 2.43% 2.67% 2.83% 2.69% 2.80%
B Management Fee as % of AAuM (plan wise) *
Direct Option 0.63% 0.90% 0.77% 0.84% 0.83%
Other than Direct Option 0.89% 1.18% 1.02% 1.17% 0.89%
5 Net Income as % of AAuM * 5.49% 4.70% 5.48% 1.79% 3.63%
6 Portfolio Turnover Ratio - Aggregate for all Asset category
0.56 0.50 0.41 0.23 0.17
Portfolio Turnover Ratio – Equity 0.35 0.26 0.29 0.14 0.17
7 Total Dividend per unit distributed during the Year / Period (plan- wise)
Direct Dividend Option - - - - -
Direct Growth Option - - - - -
Dividend Option - - - - -
Growth Option - - - - -

53
ICICI Prudential Bharat
Consumption Fund - Series 1 #
ICICI Prudential Bharat
Consumption Fund - Series 2 #
ICICI Prudential Bharat
Consumption Fund - Series 3 #
ICICI Prudential Bharat
Consumption Fund - Series 4 #
ICICI Prudential Bharat
Consumption Fund - Series 5 #
March 31, 2019 March 31, 2019 March 31, 2019 March 31, 2019 March 31, 2019
8 Returns
A Last One Year
Scheme
Direct Option NA NA NA NA NA
Other than Direct Option NA NA NA NA NA
Benchmark NA NA NA NA NA
B Since Inception
Scheme
Direct Option 4.00% 1.60% 4.40% -1.30% 6.60%
Other than Direct Option 2.40% 0.20% 3.10% -2.20% 6.00%
Benchmark
Direct Option 0.03% -1.18% -4.27% -9.01% 0.71%
Other than Direct Option 0.03% -1.18% -4.27% -9.01% 0.71%
Benchmark Index Nifty India Consumption Total
Return Index
Nifty India Consumption Total
Return Index
Nifty India Consumption Total
Return Index
Nifty India Consumption Total
Return Index
Nifty India Consumption Total
Return Index
* Annualised # Schemes were launched after 31.03.2018, hence there are no previous year figures.
Note:
1 Scheme Returns and Benchmark Returns for schemes launched during the year are computed from date of allotment. These returns are shown on absolute basis.For the remaining schemes, Scheme Returns and Benchmark Returns are shown on CAGR basis.
2 Returns have been calculated based on Growth option. In case where Growth option NAV is not available, Dividend option NAV is considered.
3 Gross Income = Amount against (A) in the Revenue account i.e income
4 Net Income = Amount against (C) in the Revenue account i.e Net realised Gains/(Losses) for the Year/Period
5 Portfolio Turnover = Lower of sales or purchase divided by Average AUM for the Year/Period
6 AAuM = Average daily net assets
7 Performance for scheme options in which units are fully redeemed & were reissued at Face Value on fresh subcriptions (except in case of Direct Plan where NAV of corresponding ‘Other than Direct’ Plan is considered) made by the investors during the year are shown on absolute basis and accordingly corresponding previous year figures are not shown.
8 Performance figures have been computed based on the last declared NAV.
9 Plans closed during the year are not considered for above disclosures
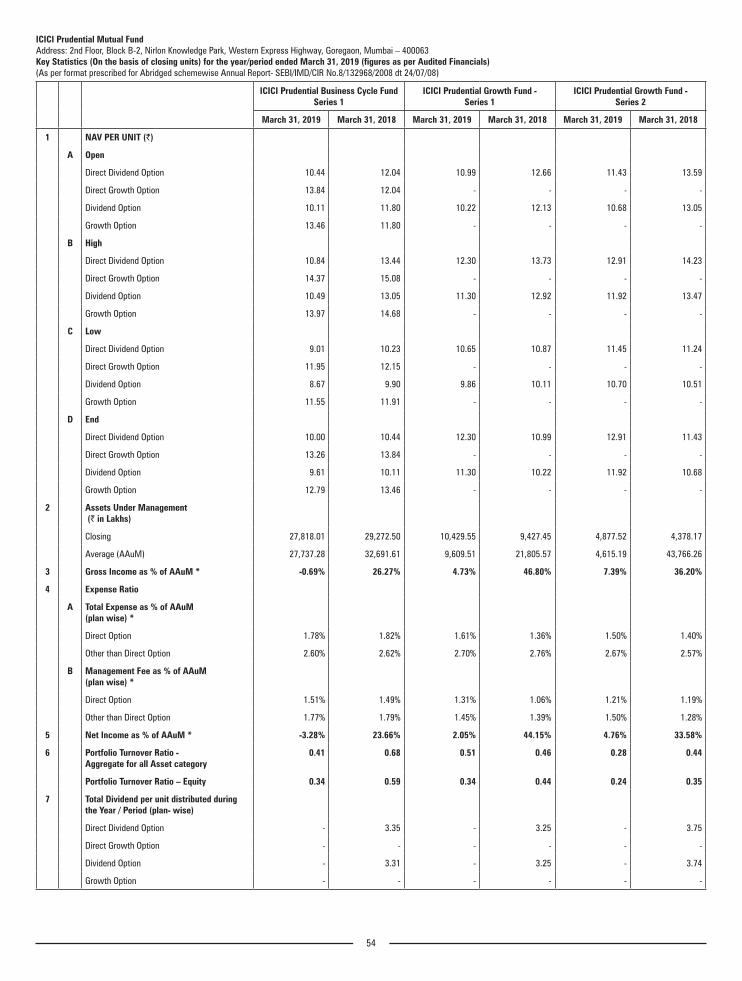
54
ICICI Prudential Mutual FundAddress: 2nd Floor, Block B-2, Nirlon Knowledge Park, Western Express Highway, Goregaon, Mumbai – 400063Key Statistics (On the basis of closing units) for the year/period ended March 31, 2019 (figures as per Audited Financials)(As per format prescribed for Abridged schemewise Annual Report- SEBI/IMD/CIR No.8/132968/2008 dt 24/07/08)
ICICI Prudential Business Cycle Fund Series 1
ICICI Prudential Growth Fund - Series 1
ICICI Prudential Growth Fund - Series 2
March 31, 2019 March 31, 2018 March 31, 2019 March 31, 2018 March 31, 2019 March 31, 2018
1 NAV PER UNIT (`)
A Open
Direct Dividend Option 10.44 12.04 10.99 12.66 11.43 13.59
Direct Growth Option 13.84 12.04 - - - -
Dividend Option 10.11 11.80 10.22 12.13 10.68 13.05
Growth Option 13.46 11.80 - - - -
B High
Direct Dividend Option 10.84 13.44 12.30 13.73 12.91 14.23
Direct Growth Option 14.37 15.08 - - - -
Dividend Option 10.49 13.05 11.30 12.92 11.92 13.47
Growth Option 13.97 14.68 - - - -
C Low
Direct Dividend Option 9.01 10.23 10.65 10.87 11.45 11.24
Direct Growth Option 11.95 12.15 - - - -
Dividend Option 8.67 9.90 9.86 10.11 10.70 10.51
Growth Option 11.55 11.91 - - - -
D End
Direct Dividend Option 10.00 10.44 12.30 10.99 12.91 11.43
Direct Growth Option 13.26 13.84 - - - -
Dividend Option 9.61 10.11 11.30 10.22 11.92 10.68
Growth Option 12.79 13.46 - - - -
2 Assets Under Management (` in Lakhs)
Closing 27,818.01 29,272.50 10,429.55 9,427.45 4,877.52 4,378.17
Average (AAuM) 27,737.28 32,691.61 9,609.51 21,805.57 4,615.19 43,766.26
3 Gross Income as % of AAuM * -0.69% 26.27% 4.73% 46.80% 7.39% 36.20%
4 Expense Ratio
A Total Expense as % of AAuM (plan wise) *
Direct Option 1.78% 1.82% 1.61% 1.36% 1.50% 1.40%
Other than Direct Option 2.60% 2.62% 2.70% 2.76% 2.67% 2.57%
B Management Fee as % of AAuM (plan wise) *
Direct Option 1.51% 1.49% 1.31% 1.06% 1.21% 1.19%
Other than Direct Option 1.77% 1.79% 1.45% 1.39% 1.50% 1.28%
5 Net Income as % of AAuM * -3.28% 23.66% 2.05% 44.15% 4.76% 33.58%
6 Portfolio Turnover Ratio - Aggregate for all Asset category
0.41 0.68 0.51 0.46 0.28 0.44
Portfolio Turnover Ratio – Equity 0.34 0.59 0.34 0.44 0.24 0.35
7 Total Dividend per unit distributed during the Year / Period (plan- wise)
Direct Dividend Option - 3.35 - 3.25 - 3.75
Direct Growth Option - - - - - -
Dividend Option - 3.31 - 3.25 - 3.74
Growth Option - - - - - -
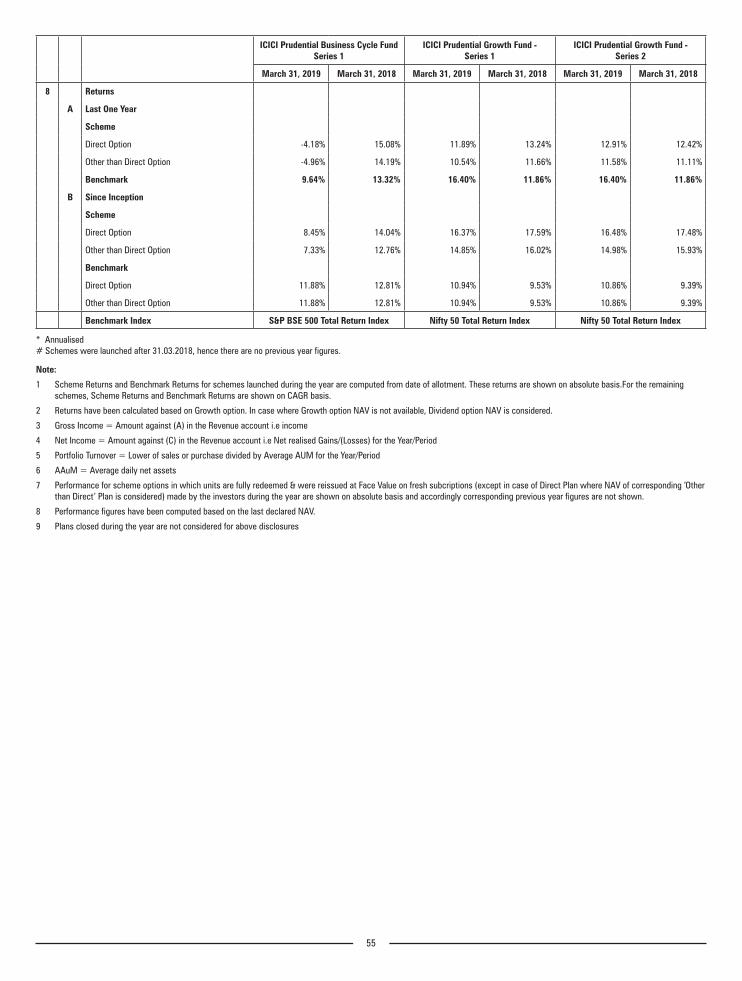
55
ICICI Prudential Business Cycle Fund Series 1
ICICI Prudential Growth Fund - Series 1
ICICI Prudential Growth Fund - Series 2
March 31, 2019 March 31, 2018 March 31, 2019 March 31, 2018 March 31, 2019 March 31, 2018
8 Returns
A Last One Year
Scheme
Direct Option -4.18% 15.08% 11.89% 13.24% 12.91% 12.42%
Other than Direct Option -4.96% 14.19% 10.54% 11.66% 11.58% 11.11%
Benchmark 9.64% 13.32% 16.40% 11.86% 16.40% 11.86%
B Since Inception
Scheme
Direct Option 8.45% 14.04% 16.37% 17.59% 16.48% 17.48%
Other than Direct Option 7.33% 12.76% 14.85% 16.02% 14.98% 15.93%
Benchmark
Direct Option 11.88% 12.81% 10.94% 9.53% 10.86% 9.39%
Other than Direct Option 11.88% 12.81% 10.94% 9.53% 10.86% 9.39%
Benchmark Index S&P BSE 500 Total Return Index Nifty 50 Total Return Index Nifty 50 Total Return Index
* Annualised # Schemes were launched after 31.03.2018, hence there are no previous year figures.
Note:
1 Scheme Returns and Benchmark Returns for schemes launched during the year are computed from date of allotment. These returns are shown on absolute basis.For the remaining schemes, Scheme Returns and Benchmark Returns are shown on CAGR basis.
2 Returns have been calculated based on Growth option. In case where Growth option NAV is not available, Dividend option NAV is considered.
3 Gross Income = Amount against (A) in the Revenue account i.e income
4 Net Income = Amount against (C) in the Revenue account i.e Net realised Gains/(Losses) for the Year/Period
5 Portfolio Turnover = Lower of sales or purchase divided by Average AUM for the Year/Period
6 AAuM = Average daily net assets
7 Performance for scheme options in which units are fully redeemed & were reissued at Face Value on fresh subcriptions (except in case of Direct Plan where NAV of corresponding ‘Other than Direct’ Plan is considered) made by the investors during the year are shown on absolute basis and accordingly corresponding previous year figures are not shown.
8 Performance figures have been computed based on the last declared NAV.
9 Plans closed during the year are not considered for above disclosures

56
ICICI Prudential Mutual FundAddress: 2nd Floor, Block B-2, Nirlon Knowledge Park, Western Express Highway, Goregaon, Mumbai – 400063Key Statistics (On the basis of closing units) for the year/period ended March 31, 2019 (figures as per Audited Financials)(As per format prescribed for Abridged schemewise Annual Report- SEBI/IMD/CIR No.8/132968/2008 dt 24/07/08)
ICICI Prudential Growth Fund - Series 3
ICICI Prudential India Recovery Fund - Series 5
ICICI Prudential India Recovery Fund - Series 7
March 31, 2019 March 31, 2018 March 31, 2019 March 31, 2018 March 31, 2019 March 31, 2018
1 NAV PER UNIT (`)
A Open
Direct Dividend Option 11.30 13.02 10.34 11.57 10.52 12.11
Direct Growth Option - - 13.61 12.40 - -
Dividend Option 10.58 12.55 10.10 11.41 10.19 11.96
Growth Option - - 13.30 12.24 - -
B High
Direct Dividend Option 11.73 14.24 11.42 12.07 11.60 12.86
Direct Growth Option - - 15.03 14.19 - -
Dividend Option 10.97 13.54 11.10 11.89 11.08 12.53
Growth Option - - 14.60 13.90 - -
C Low
Direct Dividend Option 10.18 11.22 9.94 9.96 10.18 10.43
Direct Growth Option - - 13.09 12.22 - -
Dividend Option 9.47 10.52 9.70 9.80 9.82 10.10
Growth Option - - 12.77 12.00 - -
D End
Direct Dividend Option 11.37 11.30 10.98 10.34 11.60 10.52
Direct Growth Option - - 14.45 13.61 - -
Dividend Option 10.52 10.58 10.60 10.10 11.08 10.19
Growth Option - - 13.95 13.30 - -
2 Assets Under Management (` in Lakhs)
Closing 4,423.01 31,587.98 7,720.10 7,358.28 4,643.32 4,270.23
Average (AAuM) 4,944.64 37,255.81 7,478.46 7,506.37 4,328.38 4,832.38
3 Gross Income as % of AAuM * 10.38% 32.63% 0.66% 12.64% 5.76% 27.24%
4 Expense Ratio
A Total Expense as % of AAuM (plan wise) *
Direct Option 1.40% 1.51% 1.47% 1.79% 1.32% 1.26%
Other than Direct Option 2.68% 2.69% 2.72% 2.81% 2.68% 2.69%
B Management Fee as % of AAuM (plan wise) *
Direct Option 1.10% 1.24% 1.21% 1.48% 1.06% 1.02%
Other than Direct Option 1.12% 1.24% 1.68% 1.79% 1.22% 1.29%
5 Net Income as % of AAuM * 7.76% 29.95% -2.05% 9.84% 3.09% 24.56%
6 Portfolio Turnover Ratio - Aggregate for all Asset category
0.52 0.59 1.70 1.77 0.69 0.95
Portfolio Turnover Ratio – Equity 0.47 0.57 1.66 1.77 0.48 0.91
7 Total Dividend per unit distributed during the Year / Period (plan- wise)
Direct Dividend Option - 4.00 - 2.25 - 3.05
Direct Growth Option - - - - - -
Dividend Option - 4.00 - 2.20 - 3.05
Growth Option - - - - - -

57
ICICI Prudential Growth Fund - Series 3
ICICI Prudential India Recovery Fund - Series 5
ICICI Prudential India Recovery Fund - Series 7
March 31, 2019 March 31, 2018 March 31, 2019 March 31, 2018 March 31, 2019 March 31, 2018
8 Returns
A Last One Year
Scheme
Direct Option 0.62% 19.05% 6.15% 9.84% 10.24% 12.95%
Other than Direct Option -0.57% 17.59% 4.87% 8.73% 8.71% 11.43%
Benchmark 16.40% 11.86% 9.64% 13.32% 9.64% 13.32%
B Since Inception
Scheme
Direct Option 11.52% 14.89% 13.64% 17.85% 15.97% 19.36%
Other than Direct Option 10.02% 13.29% 12.26% 16.41% 14.31% 17.62%
Benchmark
Direct Option 10.49% 8.84% 15.47% 18.70% 14.59% 17.51%
Other than Direct Option 10.49% 8.84% 15.47% 18.70% 14.59% 17.51%
Benchmark Index Nifty 50 Total Return Index S&P BSE 500 Total Return Index S&P BSE 500 Total Return Index
* Annualised # Schemes were launched after 31.03.2018, hence there are no previous year figures.
Note:
1 Scheme Returns and Benchmark Returns for schemes launched during the year are computed from date of allotment. These returns are shown on absolute basis.For the remaining schemes, Scheme Returns and Benchmark Returns are shown on CAGR basis.
2 Returns have been calculated based on Growth option. In case where Growth option NAV is not available, Dividend option NAV is considered.
3 Gross Income = Amount against (A) in the Revenue account i.e income
4 Net Income = Amount against (C) in the Revenue account i.e Net realised Gains/(Losses) for the Year/Period
5 Portfolio Turnover = Lower of sales or purchase divided by Average AUM for the Year/Period
6 AAuM = Average daily net assets
7 Performance for scheme options in which units are fully redeemed & were reissued at Face Value on fresh subcriptions (except in case of Direct Plan where NAV of corresponding ‘Other than Direct’ Plan is considered) made by the investors during the year are shown on absolute basis and accordingly corresponding previous year figures are not shown.
8 Performance figures have been computed based on the last declared NAV.
9 Plans closed during the year are not considered for above disclosures

58
ICICI Prudential Mutual FundAddress: 2nd Floor, Block B-2, Nirlon Knowledge Park, Western Express Highway, Goregaon, Mumbai – 400063Key Statistics (On the basis of closing units) for the year/period ended March 31, 2019 (figures as per Audited Financials)(As per format prescribed for Abridged schemewise Annual Report- SEBI/IMD/CIR No.8/132968/2008 dt 24/07/08)
ICICI Prudential Value Fund - Series 10
ICICI Prudential Value Fund - Series 11
ICICI Prudential Value Fund - Series 12
March 31, 2019 March 31, 2018 March 31, 2019 March 31, 2018 March 31, 2019 March 31, 2018
1 NAV PER UNIT (`)
A Open
Direct Dividend Option 10.34 11.19 10.64 10.20 10.10 -
Direct Growth Option 11.68 11.19 12.32 10.20 - -
Dividend Option 10.13 11.16 10.43 10.18 9.91 -
Growth Option 11.47 11.16 12.11 10.18 - -
B High
Direct Dividend Option 10.95 12.79 11.17 13.24 11.23 12.09
Direct Growth Option 12.37 12.79 12.93 13.27 - -
Dividend Option 10.67 12.59 10.94 13.06 10.83 11.92
Growth Option 12.08 12.59 12.70 13.07 - -
C Low
Direct Dividend Option 9.45 10.23 9.82 10.29 9.85 9.98
Direct Growth Option 10.67 11.25 11.37 10.29 - -
Dividend Option 9.16 10.03 9.52 10.27 9.61 9.90
Growth Option 10.36 11.21 11.05 10.27 - -
D End
Direct Dividend Option 10.37 10.34 10.70 10.64 11.23 10.10
Direct Growth Option 11.71 11.68 12.40 12.32 - -
Dividend Option 10.03 10.13 10.35 10.43 10.83 9.91
Growth Option 11.35 11.47 12.02 12.11 - -
2 Assets Under Management (` in Lakhs)
Closing 14,272.92 14,418.53 13,932.51 14,020.24 71,714.18 65,603.58
Average (AAuM) 14,202.54 15,808.86 13,694.52 14,551.03 66,957.24 71,571.82
3 Gross Income as % of AAuM * 4.48% 14.83% 0.75% 17.57% 7.34% 16.70%
4 Expense Ratio
A Total Expense as % of AAuM (plan wise) *
Direct Option 1.27% 1.10% 1.23% 1.14% 0.50% 0.53%
Other than Direct Option 2.59% 2.59% 2.60% 2.62% 2.25% 2.54%
B Management Fee as % of AAuM (plan wise) *
Direct Option 1.02% 0.88% 0.99% 0.91% 0.37% 0.38%
Other than Direct Option 1.13% 1.09% 1.35% 1.22% 0.54% 0.48%
5 Net Income as % of AAuM * 1.93% 12.28% -1.70% 15.10% 5.15% 14.22%
6 Portfolio Turnover Ratio - Aggregate for all Asset category
0.37 0.80 0.12 0.35 0.84 1.59
Portfolio Turnover Ratio – Equity 0.30 0.80 0.12 0.35 0.65 1.27
7 Total Dividend per unit distributed during the Year / Period (plan- wise)
Direct Dividend Option - 1.40 - 1.75 - 1.30
Direct Growth Option - - - - - -
Dividend Option - 1.40 - 1.75 - 1.28
Growth Option - - - - - -

59
ICICI Prudential Value Fund - Series 10
ICICI Prudential Value Fund - Series 11
ICICI Prudential Value Fund - Series 12
March 31, 2019 March 31, 2018 March 31, 2019 March 31, 2018 March 31, 2019 March 31, 2018
8 Returns
A Last One Year
Scheme
Direct Option 0.26% 4.42% 0.65% 20.97% 11.16% NA
Other than Direct Option -1.04% 2.80% -0.74% 19.13% 9.26% NA
Benchmark 9.64% 13.32% 9.64% 13.32% 9.64% NA
B Since Inception
Scheme
Direct Option 7.38% 13.65% 10.41% 19.52% 12.70% 13.52%
Other than Direct Option 5.88% 11.96% 8.84% 17.78% 10.62% 11.39%
Benchmark
Direct Option 16.55% 22.59% 14.52% 18.87% 11.39% 12.50%
Other than Direct Option 16.55% 22.59% 14.52% 18.87% 11.39% 12.50%
Benchmark Index S&P BSE 500 Total Return Index S&P BSE 500 Total Return Index S&P BSE 500 Total Return Index
* Annualised # Schemes were launched after 31.03.2018, hence there are no previous year figures.
Note:
1 Scheme Returns and Benchmark Returns for schemes launched during the year are computed from date of allotment. These returns are shown on absolute basis.For the remaining schemes, Scheme Returns and Benchmark Returns are shown on CAGR basis.
2 Returns have been calculated based on Growth option. In case where Growth option NAV is not available, Dividend option NAV is considered.
3 Gross Income = Amount against (A) in the Revenue account i.e income
4 Net Income = Amount against (C) in the Revenue account i.e Net realised Gains/(Losses) for the Year/Period
5 Portfolio Turnover = Lower of sales or purchase divided by Average AUM for the Year/Period
6 AAuM = Average daily net assets
7 Performance for scheme options in which units are fully redeemed & were reissued at Face Value on fresh subcriptions (except in case of Direct Plan where NAV of corresponding ‘Other than Direct’ Plan is considered) made by the investors during the year are shown on absolute basis and accordingly corresponding previous year figures are not shown.
8 Performance figures have been computed based on the last declared NAV.
9 Plans closed during the year are not considered for above disclosures

60
ICICI Prudential Mutual FundAddress: 2nd Floor, Block B-2, Nirlon Knowledge Park, Western Express Highway, Goregaon, Mumbai – 400063Key Statistics (On the basis of closing units) for the year/period ended March 31, 2019 (figures as per Audited Financials)(As per format prescribed for Abridged schemewise Annual Report- SEBI/IMD/CIR No.8/132968/2008 dt 24/07/08)
ICICI Prudential Value Fund - Series 13
ICICI Prudential Value Fund - Series 14
ICICI Prudential Value Fund - Series 15
March 31, 2019 March 31, 2018 March 31, 2019 March 31, 2018 March 31, 2019 March 31, 2018
1 NAV PER UNIT (`)
A Open
Direct Dividend Option 10.07 - 10.12 - 9.95 -
Direct Growth Option - - 10.61 - 10.33 -
Dividend Option 9.92 - 9.95 - 9.94 -
Growth Option - - 10.44 - 10.18 -
B High
Direct Dividend Option 10.90 11.58 10.51 11.48 10.92 11.26
Direct Growth Option - - 11.02 11.48 11.33 11.26
Dividend Option 10.55 11.44 10.14 11.34 10.75 11.15
Growth Option - - 10.64 11.34 11.01 11.15
C Low
Direct Dividend Option 9.78 9.75 9.55 9.86 9.37 9.72
Direct Growth Option - - 10.02 9.86 9.73 9.72
Dividend Option 9.53 9.75 9.24 9.85 9.33 9.71
Growth Option - - 9.69 9.85 9.56 9.71
D End
Direct Dividend Option 10.90 10.07 10.51 10.12 10.92 9.95
Direct Growth Option - - 11.02 10.61 11.33 10.33
Dividend Option 10.55 9.92 10.14 9.95 10.75 9.94
Growth Option - - 10.64 10.44 11.01 10.18
2 Assets Under Management (` in Lakhs)
Closing 71,694.32 67,316.58 53,926.39 52,792.36 61,855.57 57,153.71
Average (AAuM) 68,460.49 72,080.50 51,583.83 54,633.75 56,805.68 58,824.98
3 Gross Income as % of AAuM * 8.70% 15.71% 1.27% 12.21% 10.32% 10.13%
4 Expense Ratio
A Total Expense as % of AAuM (plan wise) *
Direct Option 0.60% 0.67% 0.47% 0.58% 0.90% 0.62%
Other than Direct Option 2.27% 2.56% 2.31% 2.64% 2.35% 2.63%
B Management Fee as % of AAuM (plan wise) *
Direct Option 0.44% 0.51% 0.33% 0.42% 0.70% 0.45%
Other than Direct Option 0.69% 0.64% 0.58% 0.71% 0.93% 0.74%
5 Net Income as % of AAuM * 6.53% 13.26% -0.82% 9.79% 8.03% 7.58%
6 Portfolio Turnover Ratio - Aggregate for all Asset category
0.85 1.14 0.61 0.56 0.90 0.41
Portfolio Turnover Ratio – Equity 0.65 0.91 0.44 0.38 0.76 0.40
7 Total Dividend per unit distributed during the Year / Period (plan- wise)
Direct Dividend Option - 0.75 - 0.50 - 0.38
Direct Growth Option - - - - - -
Dividend Option - 0.73 - 0.50 - 0.25
Growth Option - - - - - -
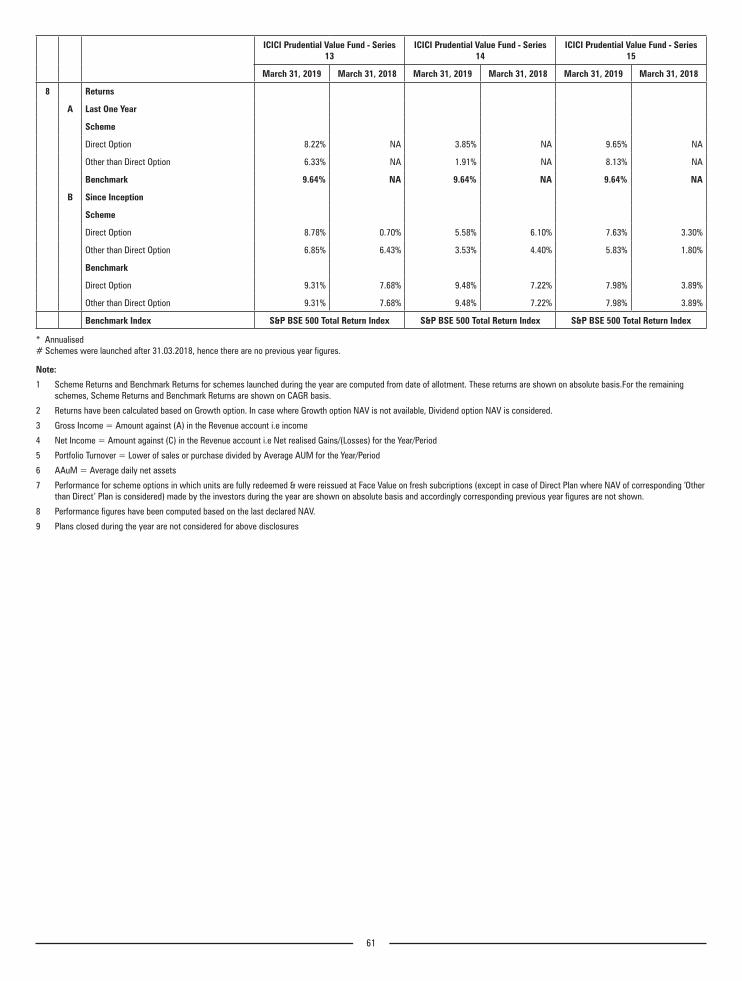
61
ICICI Prudential Value Fund - Series 13
ICICI Prudential Value Fund - Series 14
ICICI Prudential Value Fund - Series 15
March 31, 2019 March 31, 2018 March 31, 2019 March 31, 2018 March 31, 2019 March 31, 2018
8 Returns
A Last One Year
Scheme
Direct Option 8.22% NA 3.85% NA 9.65% NA
Other than Direct Option 6.33% NA 1.91% NA 8.13% NA
Benchmark 9.64% NA 9.64% NA 9.64% NA
B Since Inception
Scheme
Direct Option 8.78% 0.70% 5.58% 6.10% 7.63% 3.30%
Other than Direct Option 6.85% 6.43% 3.53% 4.40% 5.83% 1.80%
Benchmark
Direct Option 9.31% 7.68% 9.48% 7.22% 7.98% 3.89%
Other than Direct Option 9.31% 7.68% 9.48% 7.22% 7.98% 3.89%
Benchmark Index S&P BSE 500 Total Return Index S&P BSE 500 Total Return Index S&P BSE 500 Total Return Index
* Annualised # Schemes were launched after 31.03.2018, hence there are no previous year figures.
Note:
1 Scheme Returns and Benchmark Returns for schemes launched during the year are computed from date of allotment. These returns are shown on absolute basis.For the remaining schemes, Scheme Returns and Benchmark Returns are shown on CAGR basis.
2 Returns have been calculated based on Growth option. In case where Growth option NAV is not available, Dividend option NAV is considered.
3 Gross Income = Amount against (A) in the Revenue account i.e income
4 Net Income = Amount against (C) in the Revenue account i.e Net realised Gains/(Losses) for the Year/Period
5 Portfolio Turnover = Lower of sales or purchase divided by Average AUM for the Year/Period
6 AAuM = Average daily net assets
7 Performance for scheme options in which units are fully redeemed & were reissued at Face Value on fresh subcriptions (except in case of Direct Plan where NAV of corresponding ‘Other than Direct’ Plan is considered) made by the investors during the year are shown on absolute basis and accordingly corresponding previous year figures are not shown.
8 Performance figures have been computed based on the last declared NAV.
9 Plans closed during the year are not considered for above disclosures

62
ICICI Prudential Mutual FundAddress: 2nd Floor, Block B-2, Nirlon Knowledge Park, Western Express Highway, Goregaon, Mumbai – 400063Key Statistics (On the basis of closing units) for the year/period ended March 31, 2019 (figures as per Audited Financials)(As per format prescribed for Abridged schemewise Annual Report- SEBI/IMD/CIR No.8/132968/2008 dt 24/07/08)
ICICI Prudential Value Fund - Series 16
ICICI Prudential Value Fund - Series 17
ICICI Prudential Value Fund - Series 18
March 31, 2019 March 31, 2018 March 31, 2019 March 31, 2018 March 31, 2019 March 31, 2018
1 NAV PER UNIT (`)
A Open
Direct Dividend Option 10.07 - 10.01 - 10.10 -
Direct Growth Option 10.57 - 10.26 - 10.35 -
Dividend Option 10.04 - 9.91 - 10.03 -
Growth Option 10.46 - 10.16 - 10.26 -
B High
Direct Dividend Option 10.74 11.17 10.67 11.07 11.34 10.70
Direct Growth Option 11.28 11.17 10.93 11.07 11.62 10.70
Dividend Option 10.55 11.08 10.39 11.01 11.09 10.65
Growth Option 10.99 11.08 10.65 11.01 11.34 10.65
C Low
Direct Dividend Option 9.61 9.76 9.57 9.89 10.05 9.92
Direct Growth Option 10.09 9.76 9.81 9.89 10.30 9.92
Dividend Option 9.54 9.75 9.43 9.83 9.96 9.90
Growth Option 9.94 9.75 9.66 9.88 10.19 9.90
D End
Direct Dividend Option 10.74 10.07 10.67 10.01 11.34 10.10
Direct Growth Option 11.28 10.57 10.93 10.26 11.62 10.35
Dividend Option 10.55 10.04 10.39 9.91 11.09 10.03
Growth Option 10.99 10.46 10.65 10.16 11.34 10.26
2 Assets Under Management (` in Lakhs)
Closing 62,572.45 59,512.98 19,735.50 18,814.33 13,432.80 12,143.62
Average (AAuM) 59,310.39 60,248.60 18,632.43 19,531.78 12,507.85 12,233.85
3 Gross Income as % of AAuM * 1.65% 10.18% 7.38% 8.68% 9.45% 9.89%
4 Expense Ratio
A Total Expense as % of AAuM (plan wise) *
Direct Option 0.80% 0.83% 0.87% 0.96% 0.93% 1.03%
Other than Direct Option 2.32% 2.49% 2.50% 2.82% 2.59% 2.90%
B Management Fee as % of AAuM (plan wise) *
Direct Option 0.63% 0.63% 0.67% 0.74% 0.73% 0.78%
Other than Direct Option 0.85% 0.83% 0.91% 1.02% 0.95% 1.06%
5 Net Income as % of AAuM * -0.63% 7.74% 4.94% 5.93% 6.96% 7.09%
6 Portfolio Turnover Ratio - Aggregate for all Asset category
0.61 0.47 0.73 0.35 0.66 0.31
Portfolio Turnover Ratio – Equity 0.46 0.41 0.51 0.32 0.35 0.28
7 Total Dividend per unit distributed during the Year / Period (plan- wise)
Direct Dividend Option - 0.50 - 0.25 - 0.25
Direct Growth Option - - - - - -
Dividend Option - 0.42 - 0.25 - 0.23
Growth Option - - - - - -

63
ICICI Prudential Value Fund - Series 16
ICICI Prudential Value Fund - Series 17
ICICI Prudential Value Fund - Series 18
March 31, 2019 March 31, 2018 March 31, 2019 March 31, 2018 March 31, 2019 March 31, 2018
8 Returns
A Last One Year
Scheme
Direct Option 6.70% NA 6.51% NA 12.24% NA
Other than Direct Option 5.05% NA 4.81% NA 10.50% NA
Benchmark 9.64% NA 9.64% NA 9.64% NA
B Since Inception
Scheme
Direct Option 7.67% 5.70% 6.00% 2.60% 11.11% 3.50%
Other than Direct Option 5.96% 4.60% 4.21% 1.60% 9.23% 2.60%
Benchmark
Direct Option 9.99% 6.50% 6.34% 0.15% 5.82% -1.16%
Other than Direct Option 9.99% 6.50% 6.34% 0.15% 5.82% -1.16%
Benchmark Index S&P BSE 500 Total Return Index S&P BSE 500 Total Return Index S&P BSE 500 Total Return Index
* Annualised # Schemes were launched after 31.03.2018, hence there are no previous year figures.
Note:
1 Scheme Returns and Benchmark Returns for schemes launched during the year are computed from date of allotment. These returns are shown on absolute basis.For the remaining schemes, Scheme Returns and Benchmark Returns are shown on CAGR basis.
2 Returns have been calculated based on Growth option. In case where Growth option NAV is not available, Dividend option NAV is considered.
3 Gross Income = Amount against (A) in the Revenue account i.e income
4 Net Income = Amount against (C) in the Revenue account i.e Net realised Gains/(Losses) for the Year/Period
5 Portfolio Turnover = Lower of sales or purchase divided by Average AUM for the Year/Period
6 AAuM = Average daily net assets
7 Performance for scheme options in which units are fully redeemed & were reissued at Face Value on fresh subcriptions (except in case of Direct Plan where NAV of corresponding ‘Other than Direct’ Plan is considered) made by the investors during the year are shown on absolute basis and accordingly corresponding previous year figures are not shown.
8 Performance figures have been computed based on the last declared NAV.
9 Plans closed during the year are not considered for above disclosures
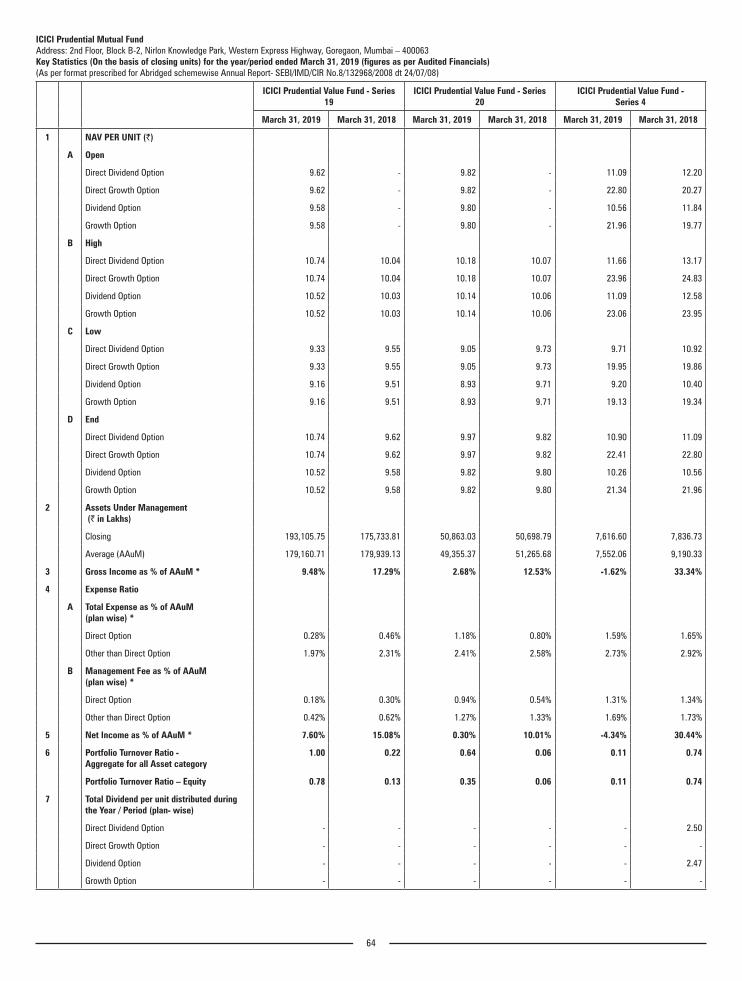
64
ICICI Prudential Mutual FundAddress: 2nd Floor, Block B-2, Nirlon Knowledge Park, Western Express Highway, Goregaon, Mumbai – 400063Key Statistics (On the basis of closing units) for the year/period ended March 31, 2019 (figures as per Audited Financials)(As per format prescribed for Abridged schemewise Annual Report- SEBI/IMD/CIR No.8/132968/2008 dt 24/07/08)
ICICI Prudential Value Fund - Series 19
ICICI Prudential Value Fund - Series 20
ICICI Prudential Value Fund - Series 4
March 31, 2019 March 31, 2018 March 31, 2019 March 31, 2018 March 31, 2019 March 31, 2018
1 NAV PER UNIT (`)
A Open
Direct Dividend Option 9.62 - 9.82 - 11.09 12.20
Direct Growth Option 9.62 - 9.82 - 22.80 20.27
Dividend Option 9.58 - 9.80 - 10.56 11.84
Growth Option 9.58 - 9.80 - 21.96 19.77
B High
Direct Dividend Option 10.74 10.04 10.18 10.07 11.66 13.17
Direct Growth Option 10.74 10.04 10.18 10.07 23.96 24.83
Dividend Option 10.52 10.03 10.14 10.06 11.09 12.58
Growth Option 10.52 10.03 10.14 10.06 23.06 23.95
C Low
Direct Dividend Option 9.33 9.55 9.05 9.73 9.71 10.92
Direct Growth Option 9.33 9.55 9.05 9.73 19.95 19.86
Dividend Option 9.16 9.51 8.93 9.71 9.20 10.40
Growth Option 9.16 9.51 8.93 9.71 19.13 19.34
D End
Direct Dividend Option 10.74 9.62 9.97 9.82 10.90 11.09
Direct Growth Option 10.74 9.62 9.97 9.82 22.41 22.80
Dividend Option 10.52 9.58 9.82 9.80 10.26 10.56
Growth Option 10.52 9.58 9.82 9.80 21.34 21.96
2 Assets Under Management (` in Lakhs)
Closing 193,105.75 175,733.81 50,863.03 50,698.79 7,616.60 7,836.73
Average (AAuM) 179,160.71 179,939.13 49,355.37 51,265.68 7,552.06 9,190.33
3 Gross Income as % of AAuM * 9.48% 17.29% 2.68% 12.53% -1.62% 33.34%
4 Expense Ratio
A Total Expense as % of AAuM (plan wise) *
Direct Option 0.28% 0.46% 1.18% 0.80% 1.59% 1.65%
Other than Direct Option 1.97% 2.31% 2.41% 2.58% 2.73% 2.92%
B Management Fee as % of AAuM (plan wise) *
Direct Option 0.18% 0.30% 0.94% 0.54% 1.31% 1.34%
Other than Direct Option 0.42% 0.62% 1.27% 1.33% 1.69% 1.73%
5 Net Income as % of AAuM * 7.60% 15.08% 0.30% 10.01% -4.34% 30.44%
6 Portfolio Turnover Ratio - Aggregate for all Asset category
1.00 0.22 0.64 0.06 0.11 0.74
Portfolio Turnover Ratio – Equity 0.78 0.13 0.35 0.06 0.11 0.74
7 Total Dividend per unit distributed during the Year / Period (plan- wise)
Direct Dividend Option - - - - - 2.50
Direct Growth Option - - - - - -
Dividend Option - - - - - 2.47
Growth Option - - - - - -

65
ICICI Prudential Value Fund - Series 19
ICICI Prudential Value Fund - Series 20
ICICI Prudential Value Fund - Series 4
March 31, 2019 March 31, 2018 March 31, 2019 March 31, 2018 March 31, 2019 March 31, 2018
8 Returns
A Last One Year
Scheme
Direct Option 11.61% NA 1.52% NA -1.71% 12.59%
Other than Direct Option 9.78% NA 0.20% NA -2.82% 11.17%
Benchmark 9.64% NA 9.64% NA 9.64% 13.32%
B Since Inception
Scheme
Direct Option 6.06% -3.80% -0.26% -1.80% 17.93% 23.60%
Other than Direct Option 4.27% -4.20% -1.58% -2.00% 16.76% 22.41%
Benchmark
Direct Option 1.65% -6.98% 5.97% -2.59% 14.78% 16.14%
Other than Direct Option 1.65% -6.98% 5.97% -2.59% 14.78% 16.14%
Benchmark Index S&P BSE 500 Total Return Index S&P BSE 500 Total Return Index S&P BSE 500 Total Return Index
* Annualised # Schemes were launched after 31.03.2018, hence there are no previous year figures.
Note:
1 Scheme Returns and Benchmark Returns for schemes launched during the year are computed from date of allotment. These returns are shown on absolute basis.For the remaining schemes, Scheme Returns and Benchmark Returns are shown on CAGR basis.
2 Returns have been calculated based on Growth option. In case where Growth option NAV is not available, Dividend option NAV is considered.
3 Gross Income = Amount against (A) in the Revenue account i.e income
4 Net Income = Amount against (C) in the Revenue account i.e Net realised Gains/(Losses) for the Year/Period
5 Portfolio Turnover = Lower of sales or purchase divided by Average AUM for the Year/Period
6 AAuM = Average daily net assets
7 Performance for scheme options in which units are fully redeemed & were reissued at Face Value on fresh subcriptions (except in case of Direct Plan where NAV of corresponding ‘Other than Direct’ Plan is considered) made by the investors during the year are shown on absolute basis and accordingly corresponding previous year figures are not shown.
8 Performance figures have been computed based on the last declared NAV.
9 Plans closed during the year are not considered for above disclosures

66
ICICI Prudential Mutual FundAddress: 2nd Floor, Block B-2, Nirlon Knowledge Park, Western Express Highway, Goregaon, Mumbai – 400063Key Statistics (On the basis of closing units) for the year/period ended March 31, 2019 (figures as per Audited Financials)(As per format prescribed for Abridged schemewise Annual Report- SEBI/IMD/CIR No.8/132968/2008 dt 24/07/08)
ICICI Prudential Value Fund Series 8 ICICI Prudential Value Fund - Series 9
March 31, 2019 March 31, 2018 March 31, 2019 March 31, 2018
1 NAV PER UNIT (`)
A Open
Direct Dividend Option 10.77 12.69 10.57 10.90
Direct Growth Option - - 12.27 10.90
Dividend Option 10.31 12.39 10.35 10.83
Growth Option - - 12.05 10.83
B High
Direct Dividend Option 11.48 12.99 10.99 13.13
Direct Growth Option - - 12.76 13.29
Dividend Option 10.95 12.56 10.69 12.91
Growth Option - - 12.44 13.05
C Low
Direct Dividend Option 10.24 10.73 9.62 10.39
Direct Growth Option - - 11.18 10.98
Dividend Option 9.68 10.28 9.37 10.17
Growth Option - - 10.91 10.89
D End
Direct Dividend Option 11.01 10.77 10.99 10.57
Direct Growth Option - - 12.76 12.27
Dividend Option 10.38 10.31 10.69 10.35
Growth Option - - 12.44 12.05
2 Assets Under Management (` in Lakhs)
Closing 1,135.69 26,378.73 29,189.25 28,230.24
Average (AAuM) 10,339.97 29,290.21 27,543.56 30,285.24
3 Gross Income as % of AAuM * 0.36% 19.46% 8.23% 16.25%
4 Expense Ratio
A Total Expense as % of AAuM (plan wise) *
Direct Option 0.98% 1.44% 2.01% 1.28%
Other than Direct Option 2.50% 2.57% 2.64% 2.53%
B Management Fee as % of AAuM (plan wise) *
Direct Option 0.69% 1.18% 1.64% 1.04%
Other than Direct Option 0.97% 1.45% 1.83% 1.40%
5 Net Income as % of AAuM * -2.17% 16.91% 5.71% 13.97%
6 Portfolio Turnover Ratio - Aggregate for all Asset category
1.49 1.63 0.61 0.56
Portfolio Turnover Ratio – Equity 1.35 1.49 0.54 0.49
7 Total Dividend per unit distributed during the Year / Period (plan- wise)
Direct Dividend Option - 3.00 - 1.75
Direct Growth Option - - - -
Dividend Option - 3.00 - 1.75
Growth Option - - - -

67
ICICI Prudential Value Fund Series 8 ICICI Prudential Value Fund - Series 9
March 31, 2019 March 31, 2018 March 31, 2019 March 31, 2018
8 Returns
A Last One Year
Scheme
Direct Option 2.22% 9.08% 3.98% 12.68%
Other than Direct Option 0.68% 7.85% 3.23% 11.36%
Benchmark 9.64% 13.32% 9.64% 13.32%
B Since Inception
Scheme
Direct Option 9.97% 13.06% 10.63% 15.60%
Other than Direct Option 8.46% 11.56% 9.47% 14.13%
Benchmark
Direct Option 9.77% 9.81% 12.47% 14.53%
Other than Direct Option 9.77% 9.81% 12.47% 14.53%
Benchmark Index S&P BSE 500 Total Return Index S&P BSE 500 Total Return Index
* Annualised # Schemes were launched after 31.03.2018, hence there are no previous year figures.
Note:
1 Scheme Returns and Benchmark Returns for schemes launched during the year are computed from date of allotment. These returns are shown on absolute basis.For the remaining schemes, Scheme Returns and Benchmark Returns are shown on CAGR basis.
2 Returns have been calculated based on Growth option. In case where Growth option NAV is not available, Dividend option NAV is considered.
3 Gross Income = Amount against (A) in the Revenue account i.e income
4 Net Income = Amount against (C) in the Revenue account i.e Net realised Gains/(Losses) for the Year/Period
5 Portfolio Turnover = Lower of sales or purchase divided by Average AUM for the Year/Period
6 AAuM = Average daily net assets
7 Performance for scheme options in which units are fully redeemed & were reissued at Face Value on fresh subcriptions (except in case of Direct Plan where NAV of corresponding ‘Other than Direct’ Plan is considered) made by the investors during the year are shown on absolute basis and accordingly corresponding previous year figures are not shown.
8 Performance figures have been computed based on the last declared NAV.
9 Plans closed during the year are not considered for above disclosures

68
THIS
PAGE
HAS BEE
N INTE
NTIONALL
Y LEF
T BLA
NK

69
THIS
PAGE
HAS BEE
N INTE
NTIONALL
Y LEF
T BLA
NK
70
The Abridged Annual Report has been extracted from the Audited Balance Sheet, Revenue Account and Notes to Accounts.Full Annual Report is available on the website www.icicipruamc.com Unitholders may refer to the full Annual Report displayedon the website w.r.t. general policies and procedures for exercising voting rights, the details of proxy voting exercised duringthe Financial Year 2018-19 along with scrutinizers’ certification. For Unitholders of the Scheme, full Annual Report is availablefor inspection at the Corporate Office/Central Service Office of the AMC and a copy thereof shall be made available to theUnitholder on request on payment of nominal fees.
Mutual Fund investments are subject to market risks, read all scheme related documents carefully.Disclaimer
In the preparation of the material contained in this document, the Asset Management Company (AMC) has used information that is publicly available, including information developed in-house. Some of the material used in the document may have been obtained from members/persons other than the AMC and/or its affiliates and which may have been made available to the AMC and/or to its affiliates. Information gathered and material used in this document is believed to be from reliable sources. The AMC however does not warrant the accuracy, reasonableness and / or completeness of any information. We have included statements / opinions / recommendations in this document, which contain words, or phrases such as “will”, “expect”, “should”, “believe” and similar expressions or variations of such expressions that are “forward looking statements”. Actual results may differ materially from those suggested by the forward looking statements due to risk or uncertainties associated with our expectations with respect to, but not limited to, exposure to market risks, general economic and political conditions in India and other countries globally, which have an impact on our services and / or investments, the monetary and interest policies of India, inflation, deflation, unanticipated turbulence in interest rates, foreign exchange rates, equity prices or other rates or prices etc.
Investors are requested to refer the Scheme Information Document for Product Label assigned to various schemes in terms of risk associated with investing in such Products.

Thank you for your investment and continued patronage with ICICI Prudential Mutual Fund.
We, at ICICI Prudential Asset Management Company Limited, request you to join us in our initiatives to promote paperless communication in an effort to save the environment. You can do your part by updating your current Email ID and mobile number to receive various investor communications digitally. For this, you can submit the KYC Change Request form to any of our
nearest branch or CAMS Centre .
Be Eco-friendly, Go Green !!
Additionally, investors are also requested to update their PAN and complete all KYC requirements, in case not yet updated.
To update PAN/KYC, kindly submit a written request or PAN/KYC updation form along with updated PAN copy to our nearest branch. Further, if investors are not KYC compliant, they can submit KYC
form along with the respective KYC documents at our branch.
You can download the requisite forms as follows :
For PAN/ KYC updation form download “Common Transaction Request - Non Financial Transaction” Form available at https://www.icicipruamc.com/Downloads/mutual-fund-application-form.aspx -
For KYC change request form download “CKYC Individual” form available at https://www.icicipruamc.com/Downloads/mutual-fund-application-form.aspx
To Locate nearest branch https://www.icicipruamc.com/ContactUs/BranchLocator.aspx

72
Desi
gned
& P
rinte
d by
Uch
itha
Grap
hic
(ww
w.u
chith
a.co
m)
3