abs east investor presentation october 2010edg1.vcall.com/irwebsites/firstmarblehead/fmd - abs...
TRANSCRIPT

ABS EAST INVESTOR PRESENTATION
OCTOBER 2010

Forward-Looking StatementsStatements in this presentation regarding First Marblehead’s strategy, competitive position, future opportunities and growth prospects, outlook, demand for private education loans, including with regard to the future performance of securitization trusts that First Marblehead has facilitated (the “Trusts”) and the Monogram loan product as well as any other statements that are not purely historical, constitute forward-looking statements for purposes of the safe harbor provisions of The Private Securities Litigation Reform Act of 1995. These forward-looking statements are based on our historical performance, the historical performance of the Trusts, and on our plans, estimates and expectations as of September 30, 2010. The inclusion of this forward-looking information should not be regarded as a representation by us or any other person that the future results, plans, projections, estimates or expectations expressed or implied will actually be achieved. You are cautioned that matters subject to forward-looking statements involve known and unknown risks and uncertainties, including economic, legislative, regulatory, competitive and other factors, which may cause actual results, including facilitated loan volumes, or the timing of events, to be materially different than those expressed or implied by our forward-looking statements. Important factors that could cause or contribute to such differences include: market acceptance of and demand for our Monogram loan product and fee-based service offerings; the volume, timing and performance of facilitated loan loans; the size and structure of credit enhancement provided by us in connection with our Monogram loan product; degradation of credit quality, credit enhancement or performance of the Trusts’ loan portfolios; economic, legislative, regulatory, competitive and other factors affecting default, recovery and prepayment rates on private student loan portfolios, including general economic conditions, the consumer credit environment, interest rates and unemployment rates; borrower defaults and the Trusts’ ability to recover principal and interest from such borrowers; capital market receptivity to private student loan asset-backed securities; the inability of The Education Resources Institute, Inc. (TERI), the third party guarantor of the Trusts’ underlying loans, which has filed a voluntary petition for reorganization under federal bankruptcy laws, to meet its guaranty obligations; developments in the bankruptcy proceedings of TERI, including the terms of any plan of reorganization; changes to bankruptcy laws that could affect the non-dischargeable status of education-related loans; and the other factors set forth under the caption "risk factors" in our annual report on Form 10-K filed with the Securities and Exchange Commission on September 2, 2010. We specifically disclaim any obligation to update any forward-looking statements as a result of developments occurring after September 30, 2010.
DisclaimerThe information in this presentation is intended to provide a broad overview of a portfolio of private education loans facilitated by First Marblehead. Neither First Marblehead nor any other party is offering any securities by making this presentation or soliciting any action based upon the information provided. Nothing in this presentation should be relied upon as a representation by First Marblehead, or any other person, as to the future performance of any securitization trust described in this presentation or as to any securities that may be issued in the future. The information contained herein is intended to be illustrative only, and historical collateral pools may not be representative of any future collateral pool.
October 2010 - 2
Section I: FMD Overview
Section II: New Product Strategies
Section III: Risk Methodology
Section IV: Portfolio Management Competencies
Section V: Student Loan ABS Market Snapshot
Table of Contents
October 2010 - 3

Section I
FMD Overview
October 2010 - 4
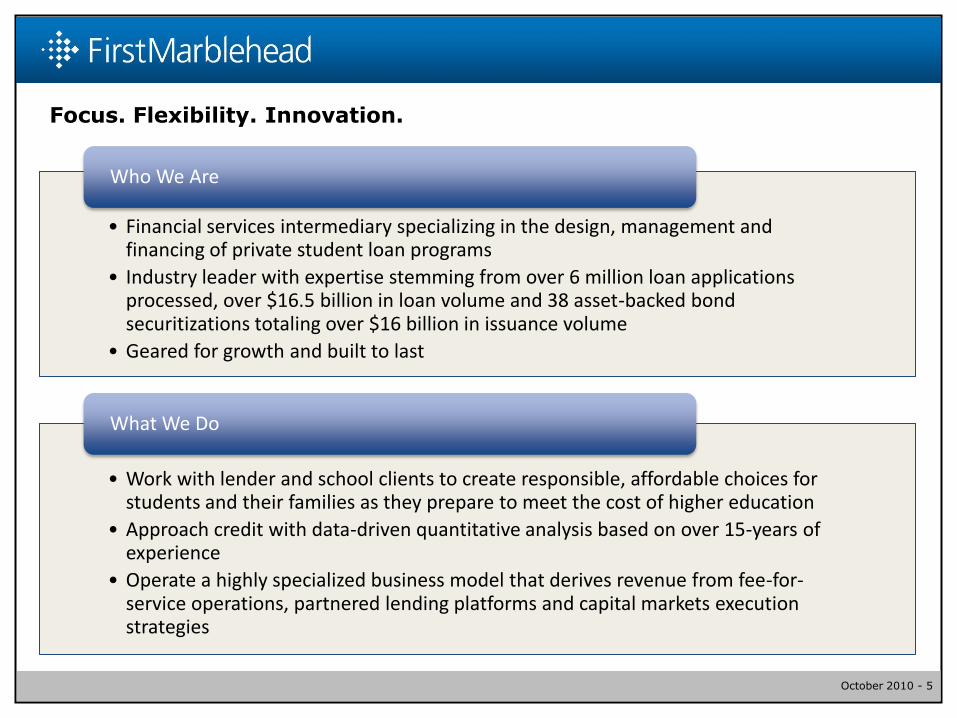
Focus. Flexibility. Innovation.
• Financial services intermediary specializing in the design, management and financing of private student loan programs
• Industry leader with expertise stemming from over 6 million loan applications processed, over $16.5 billion in loan volume and 38 asset-backed bond securitizations totaling over $16 billion in issuance volume
• Geared for growth and built to last
Who We Are
• Work with lender and school clients to create responsible, affordable choices for students and their families as they prepare to meet the cost of higher education
• Approach credit with data-driven quantitative analysis based on over 15-years of experience
• Operate a highly specialized business model that derives revenue from fee-for-service operations, partnered lending platforms and capital markets execution strategies
What We Do
October 2010 - 5

• Leverage extensive private student loan performance database applying sophisticated risk analysis capabilities and high-touch portfolio management strategies designed to optimize performance
• Utilize a seasoned national sales force and transparent loan application process to deliver customized loan products uniquely designed to meet borrowers’ needs
• Coordinate with investment banks, rating agencies and investors to strategically deploy capital to create viable and flexible disposition strategies for clients
How We Do It
• Families struggle more than ever to fill the funding “gap” created by ever-increasing college costs, low federal loan limits and shrinking state and institutional aid
• Legislative changes and the credit crisis have tempered lending activities
• Number of competitors has diminished
• Ensure the right students at the right schools receive the right student loans
Why We Do It
October 2010 - 6
Focus. Flexibility. Innovation.

Program DesignBorrower
Inquiry and Application
Loan Origination and Disbursement
Loan FinancingPortfolio
Management
• Dissemination of loan materials and applications
• Application intake
• Customer call center management
• Program design
• Proprietary risk scoring models inform repayment terms and payment options
• Application processing and credit underwriting
• Delivery of credit agreement
• Disbursement of funds
• Regulatory and legal compliance
• Organization of critical resources
• Structuring of securitization/asset selection
• Negotiation with transaction parties and coordination with rating agencies
• Execution and reconciliation
• Dynamic strategy driven by data and analysis
• Servicing, billing, account and call center management
• Collections and recoveries management
• Trust administration
First Marblehead Provides End-to-End Solutions
October 2010 - 7

Fee-for-ServiceEnable clients to choose from a suite of vertically
Integrated fee-based loan products and services operated and managed by FMD
Capital MarketsLong term loan dispositionstrategies for lenders with
the option of earning structuraladvisory fees and spread income andretaining residual interests in facilities
Partnered LendingDevelop loan programs
with clients in which FMD providescredit enhancement in exchange
for portion of loan spread
Derive Revenue from Three Inter-related Business Models
October 2010 - 8

PLUS/Grad PLUS loan utilization has been stagnant
Stafford loan limits fail to keep pace with tuition increases
Private loans remain the gap filler
October 2010 - 9
Market Opportunities Still Exist

Extensive Experience
Industry Leader
Attractive & Innovative Products
Geared for Growth
Why First Marblehead
EXCEPTIONAL STOCKHOLDER VALUE
October 2010 - 10

October 2010 - 11
Section II
New Product Strategies
October 2010 - 12
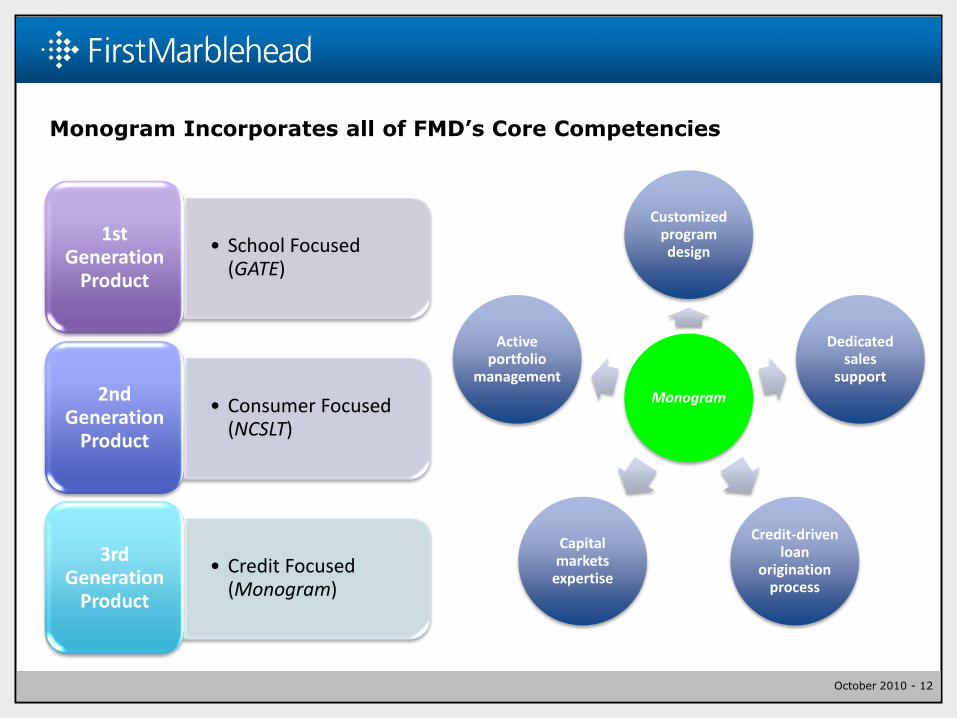
Monogram Incorporates all of FMD’s Core Competencies
• School Focused (GATE)
1st Generation
Product
• Consumer Focused (NCSLT)
2nd Generation
Product
• Credit Focused (Monogram)
3rd Generation
Product
Monogram
Customized program design
Dedicated sales
support
Credit-driven loan
origination process
Capital markets
expertise
Active portfolio
management
October 2010 - 13
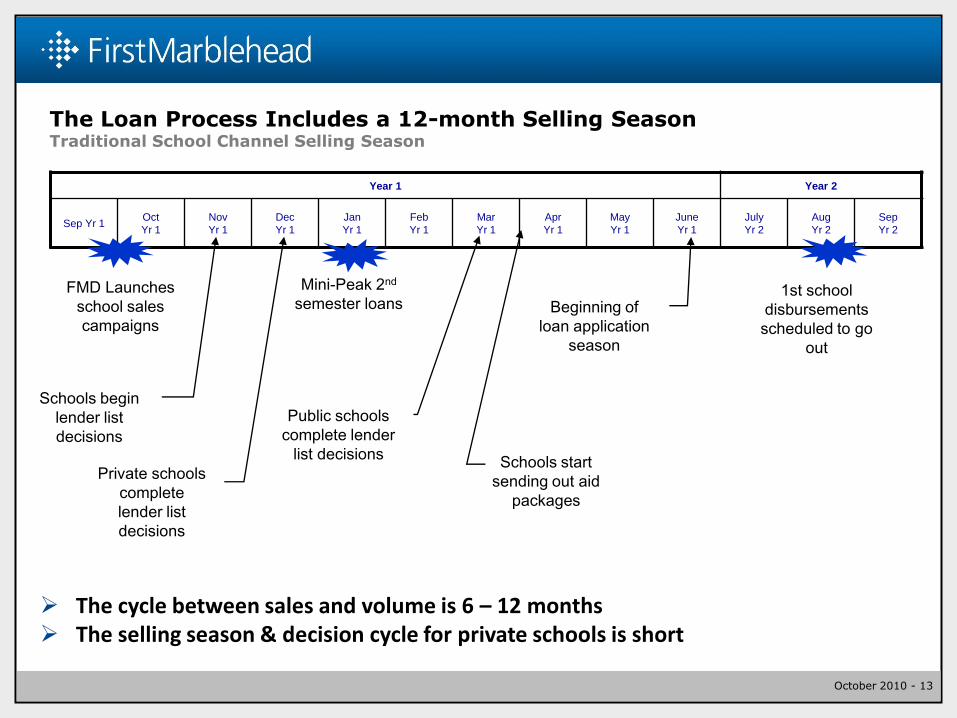
The Loan Process Includes a 12-month Selling SeasonTraditional School Channel Selling Season
The cycle between sales and volume is 6 – 12 months The selling season & decision cycle for private schools is short
Year 1 Year 2
Sep Yr 1Oct
Yr 1
Nov
Yr 1
Dec
Yr 1
Jan
Yr 1
Feb
Yr 1
Mar
Yr 1
Apr
Yr 1
May
Yr 1
June
Yr 1
July
Yr 2
Aug
Yr 2
Sep
Yr 2
FMD Launches
school sales
campaigns
1st school
disbursements
scheduled to go
out
Schools begin
lender list
decisions
Schools start
sending out aid
packages
Beginning of
loan application
season
Private schools
complete
lender list
decisions
Public schools
complete lender
list decisions
Mini-Peak 2nd
semester loans
October 2010 - 14
4
1
3
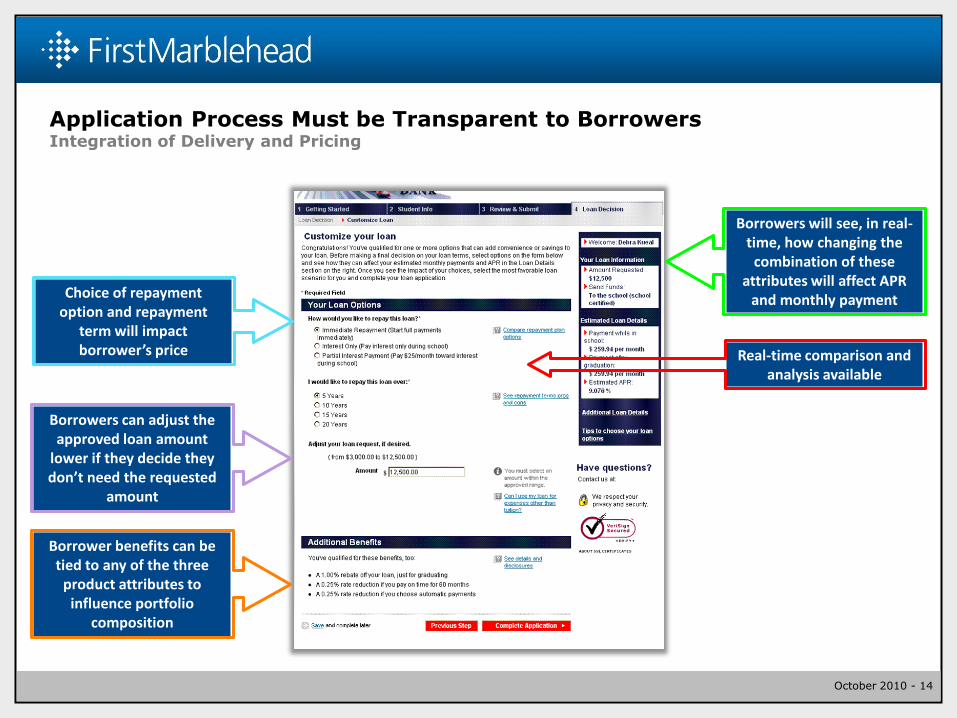
Application Process Must be Transparent to BorrowersIntegration of Delivery and Pricing
Choice of repayment option and repayment
term will impact borrower’s price
1
Borrowers can adjust the approved loan amount
lower if they decide they don’t need the requested
amount
Borrowers will see, in real-time, how changing the
combination of these attributes will affect APR
and monthly payment
Borrower benefits can be tied to any of the three
product attributes to influence portfolio
composition
Real-time comparison and analysis available

October 2010 - 15
Section III
Risk Methodology

October 2010 - 16
Five Core Principles of Credit Risk for Private Student Loans
• Complex asset class requires sophisticated analytical capabilities
• Integration of historical data with prospective modelingData and Analytics must be a Priority
• Evaluate both obligors on an application—student and cosigner—and do not rely on FICO alone
• Approve schools based on risk parameters
Effective, Quantitative Underwriting
• Seek to avoid adverse selection
• Prevent over-borrowingMarket Responsibly
to Students
• Involve the cosigner early and often
• Apply adaptive strategies to fit borrowers’ changing credit profilesDynamic Portfolio
Management
• Ideally, assign a value to the student’s education
• Challenge is pursued through data gathering and analysis of borrower behavior
Ongoing Effort to Determine LTV for
Student Loans

October 2010 - 17
• Our suite of risk models are used throughout the life cycle of a loan to optimize
profitability and best manage risk
Credit Scoring
Fraud Mitigation
Prepayment (at origination, during deferment, during repayment)
Drop-Out Probability
Early Awareness
Collectability
Recoverability
Monthly Default Risk Score
Robust Dataset Yields Better AnalyticsMultiple FMD Proprietary Scorecards in Use
October 2010 - 18
• Subject to regulation and oversight by the SEC and NYSE as a publicly traded corporation
• Subject to OTS supervision and examination as a thrift holding company
• Maintain a dedicated Enterprise Risk Management staff
• Internal control structure is regularly audited by KPMG and Corporate Audit staffs
• Third-party external review and validation of proprietary rank order model
• Third-party external review and validation of method of performance data analysis
Sample Internal/External Validation and Controls

October 2010 - 19
Section IV
Portfolio Management Competencies

October 2010 - 20
• Highly segmented account strategy driven by risk-based scoring model outcomes
• Proactive borrower contact strategies yield favorable repayment performance
• Aggressive early delinquency coordination with servicer decreases roll rates
• Rigorous collections agency management combined with enhanced reporting improves transparency and liquidation rates
• Robust skip tracing techniques increase success in locating borrowers
• Efficient recovery process results in greater and faster loss mitigation
• Granular performance-based portfolio reporting improves transparency
Performance Driven Portfolio Management StrategyEnhanced Analytics and Flexible Operations Applied Throughout the Loan Lifecycle

October 2010 - 21
June 30, 2010
NCSLT Portfolio Segment 1 Segment 2 Segment 3
Distribution by original loan amount 25.5% 27.0% 47.5%
Distribution by total outstanding loan amount(1):
Not in repayment(2) 4.3 6.7 16.9
In repayment 18.5 20.5 33.1
Gross default rate(3) 9.7 19.6 48.8
Recovery rate(3) 40.0 40.0 40.0
Net default rate(3) 5.8 11.8 23.9
Prepayment rate(3) 6.9(4) 4.9(4) 3.1(4)
1) Outstanding aggregate principal and capitalized interest balance as of June 30, 2010.2) Loans “not in repayment” include loans in deferment or forbearance status as of June 30, 2010.3) Using projected defaults, net defaults and recoveries over the lives of the trusts as a percentage of original outstanding aggregate
principal and accrued interest balance.4) Amount presented is the weighted average conditional prepayment rate (CPR) over the next ten years. The CPR is an estimate of
the likelihood that a loan will be prepaid during a period given that it has not previously defaulted or been repaid in full.
Source: FMD 10-K filed 9/2/10
old methodology used only WA approach
More Granular Portfolio Risk SegmentationNCSLT Portfolio Distribution and Assumptions
Example:

October 2010 - 22
Portfolio Seasoning: 76.8% of the portfolio is in repayment or forbearance as of June 30
Defaults: Annualized charge-off rates declined by 60% from 3Q09 to 2Q10
Delinquencies: Percentage of the portfolio 1-180 days delinquent declined 310 bps between 2Q09 and 2Q10
Prepayments: Voluntary prepayment rates have remained historically low and stable at under 2% CPR
Portfolio Management Strategies Improve PerformanceNCSLT Portfolio Improved Performance Through June 30, 2010
Gross Recoveries (in millions) - Secondary
(6-12 Months Post-Default)
$0.0
$0.2
$0.4
$0.6
$0.8
$1.0
$1.2
$1.4
Oct-08 Dec-08 Feb-09 Apr-09 Jun-09 Aug-09 Oct-09 Dec-09 Feb-10 Apr-10 Jun-10Source: FMD
Comparison of DBRS PSL Default Index to NCSLT Portfolio
0.0%
2.0%
4.0%
6.0%
8.0%
10.0%
12.0%
14.0%
Sep-09 Dec-09 Mar-10 Jun-10
PSL Index (gross) NCSLT (gross)Sources: FMD; DBRS

October 2010 - 23
Section V
Student Loan ABS Market Snapshot

October 2010 - 24
The ABS Marketplace
Collateral Type
# of
Deals
% of
Volume
Auto Fleet 5 2.2%
Auto Leases 5 7.8%
Auto Non Prime 12 8.0%
Auto Prime 25 32.4%
Auto Trucks 2 2.0%
Containers 1 0.3%
CrCds - Bank 6 4.4%
CrCds - Retail 6 2.9%
Equip - Heavy 3 3.4%
Equip - SmTkt 2 1.0%
Floorplan 10 9.1%
Premium Finance 3 2.0%
Servicer Advances 3 1.3%
StLns - FFELP 16 14.2%
StLns - Private 5 6.1%
Stranded Asset 3 1.1%
Structured Settlements 1 0.1%
Taxes 1 0.1%
Timeshare 4 1.5%
Total: 104
2010 YTD ABS Issuance - Breakdown by Volume
Auto Leases
7.8%
Auto Fleet
2.2%
Structured
Settlements
0.1%
StLns - Private
6.1%
Stranded Asset
1.1%
Timeshare
1.5%
Taxes
0.1%
StLns - FFELP
14.2% Auto Non Prime
8.0%
Floorplan
9.1%
Equip - SmTkt
1.0%
Auto Trucks
2.0%
Equip - Heavy
3.4%
CrCds - Retail
2.9%
Containers
0.3%CrCds - Bank
4.4%
Servicer Advances
1.3%
Premium Finance
2.0%Auto Prime
32.4%
Source: JPMorgan
Excludes tax-exempt student loan issuance

October 2010 - 25
No new FFELP loan volume being originated
FFELP transactions include seasoned collateral or re-securitization of existing collateral backing ARS
SLCLT 2010-B and SLMA 2010-A executed via the TALF
4 tax-exempt transactions from state agencies included 100% private loans
The Student Loan ABS Marketplace
Student Loan Issuance by Volume (ABS +TE)
StLns -
FFELP
68%
StLns -
FFELP TE
1%
StLns -
Private
28%
StLns -
Private TE
3%
Source: JPMorgan; MuniOS
Student Loan Issuance by Deal Count (ABS + TE)
StLns -
FFELP
19
StLns -
Private
5
StLns -
Private TE
4
StLns -
FFELP TE
1
Source: JPMorgan; MuniOS
October 2010 - 26
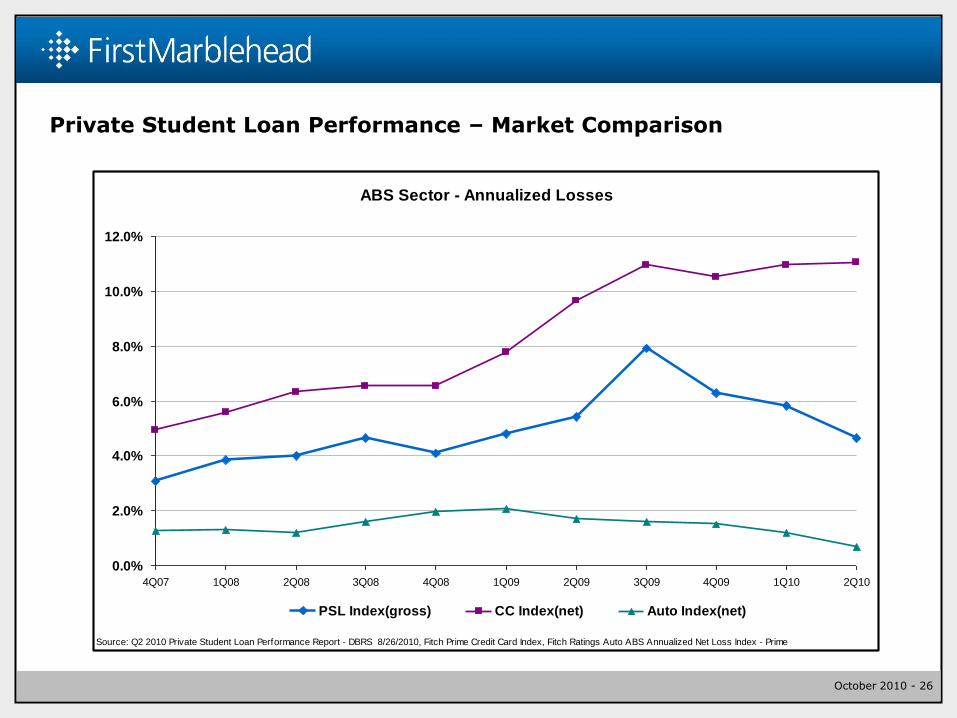
ABS Sector - Annualized Losses
0.0%
2.0%
4.0%
6.0%
8.0%
10.0%
12.0%
4Q07 1Q08 2Q08 3Q08 4Q08 1Q09 2Q09 3Q09 4Q09 1Q10 2Q10
PSL Index(gross) CC Index(net) Auto Index(net)
Source: Q2 2010 Private Student Loan Performance Report - DBRS 8/26/2010, Fitch Prime Credit Card Index, Fitch Ratings Auto ABS Annualized Net Loss Index - Prime
Private Student Loan Performance – Market Comparison

October 2010 - 27
Date Issuer Series Class Amount WAL Spread Benchmark Moody's S&P Fitch DBRS
7/13/10 SLMA 2010-B A-1 303.00 0.90 192 1mL Aaa AAA
A-2 274.00 4.92 n/a 1mL Aaa AAA
A-3 292.00 10.33 n/a 1mL Aaa AAA
869.00
6/30/10 SLMA 2010-C A-1 451.00 0.99 165 1mL Aaa AAA
A-2 209.38 3.51 265 1mL Aaa AAA
A-3 300.00 5.84 350 1mL Aaa AAA
A-4 335.00 9.00 425 1mL Aaa AAA
A-5 406.06 12.82 475 1mL Aaa AAA
1,701.44
5/27/10 ACCSS 2010-A A 463.50 6.59 275 3mL Aaa AAA
463.50
3/4/10 SLCLT 2010-B A-1 207.70 4.99 75 Prime Aaa AAA
A-2 475.50 4.99 350 1mL Aaa AAA
683.20
1/29/10 SLCLT 2010-A A-1 781.00 6.98 100 Prime Aaa
781.00
2010 YTD Private Student Loan ABS Transactions

October 2010 - 28
Capital Markets Contacts
Gary Santo, Jr.Managing Director
Capital Markets(617) 638-2022
Dana ArvidsonVice President
Capital Markets(617) 638-2253
David HartungVice President
Capital Markets(617) 638-2011
Lee JacobsonVice President
Capital Markets(617) 638-2186
Ray MorelVice President
Capital Markets(617) 638-2234