absolute quantitation of microbiota abundance in
TRANSCRIPT
METHODOLOGY Open Access
Absolute quantitation of microbiotaabundance in environmental samplesAndrzej Tkacz, Marion Hortala and Philip S. Poole*
Abstract
Background: Microbial communities (microbiota) influence human and animal disease and immunity, geochemicalnutrient cycling and plant productivity. Specific groups, including bacteria, archaea, eukaryotes or fungi, are amplifiedby PCR to assess the relative abundance of sub-groups (e.g. genera). However, neither the absolute abundance ofsub-groups is revealed, nor can different amplicon families (i.e. OTUs derived from a specific pair of PCR primers suchas bacterial 16S, eukaryotic 18S or fungi ITS) be compared. This prevents determination of the absolute abundanceof a particular group and domain-level shifts in microbiota abundance can remain undetected.
Results: We have developed absolute quantitation of amplicon families using synthetic chimeric DNA spikes. Syntheticspikes were added directly to environmental samples, co-isolated and PCR-amplified, allowing calculation of theabsolute abundance of amplicon families (e.g. prokaryotic 16S, eukaryotic 18S and fungal ITS per unit mass of sample).
Conclusions: Spikes can be adapted to any amplicon-specific group including rhizobia from soils, Firmicutes andBifidobacteria from human gut or Enterobacteriaceae from food samples. Crucially, using highly complex soil samples,we show that the absolute abundance of specific groups can remain steady or increase, even when their relativeabundance decreases. Thus, without absolute quantitation, the underlying pathology, physiology and ecology ofmicrobial groups may be masked by their relative abundance.
BackgroundOver the last decade, affordable amplicon DNA sequen-cing has revealed that the microbiota influences humanimmunity [1], digestion [2], mental health [3], and plantgrowth and development [4]. These studies in diversefields have revealed a delicate relationship among differ-ent microbial groups and, in the case of plants, havehighlighted the importance of the microbial communityof soil in plant health [5, 6]. The environmental micro-bial community has multiple components that arenormally abundant and are typically investigated by PCRamplification of marker genes. However, for most stud-ies, only one microbiota domain, such as bacteria, is in-vestigated. Furthermore, most microbiota studies arelimited by the production of PCR amplicons (amplifiedgenes from an individual environmental sample) usingdomain-specific primers. This in turn leads to loss ofquantitative comparison between any two or moregroups of PCR amplicons. However, in order to unravel
the real complexity of the gut, soil and other environ-ments, the quantitative relations between major micro-bial groups must be determined.There is a complex relationship between intercon-
nected bacterial, archaeal, fungal, viral and single-celleukaryotic organisms, all of which are PCR-amplified tovarying extents by different sets of PCR primers. CurrentDNA technologies allow parallel sequencing of multiplesamples, yielding millions of short reads. The most com-mon way to profile the prokaryotic community is toamplify the 16S rRNA gene, while profiling of eukaryotesis typically performed by 18S rRNA amplification.However, from PCR experiments using different primerpairs, any cross-domain comparison of microbiota is im-possible. The problem of quantitative comparison be-comes even more intractable when considering primersdesigned for fungi or specific groups of bacteria, such asBifidobacteria, that are key components of the gutmicrobiota [7]. There are a few strategies attempting toovercome this problem. Gene-coding proteins, such asCpn60, are universally present in prokaryotes and ineukaryotic mitochondria and chloroplasts. They can
* Correspondence: [email protected] of Plant Sciences, University of Oxford, South Parks Road, OxfordOX1 3RB, UK
© The Author(s). 2018 Open Access This article is distributed under the terms of the Creative Commons Attribution 4.0International License (http://creativecommons.org/licenses/by/4.0/), which permits unrestricted use, distribution, andreproduction in any medium, provided you give appropriate credit to the original author(s) and the source, provide a link tothe Creative Commons license, and indicate if changes were made. The Creative Commons Public Domain Dedication waiver(http://creativecommons.org/publicdomain/zero/1.0/) applies to the data made available in this article, unless otherwise stated.
Tkacz et al. Microbiome (2018) 6:110 https://doi.org/10.1186/s40168-018-0491-7

therefore be used to profile prokaryotic communitiesand compare their relative abundance against eukaryotichost organelle abundance [8]. Moreover, comparisonsbased on the gene-encoding Cpn60 proved to be usefulat predicting bacterial genome similarities [9]. However,the current limitation of this method is a relatively smallreference database. A set of life-universal primers wasdeveloped based on a similarity between prokaryotic andeukaryotic ribosomal gene sequences [10]. It is a promis-ing advance in the field, but the primers were developedfor sponge symbionts and may lose their phylogeneticcompatibility in more complex gut or soil environments.Microbial profiling can also be made using housekeepinggenes as rpoB, amoA, pmoA, nirS, nirK, nosZ and pufM[11]. Among these genes, rpoB was shown to be verypowerful at discriminating closely related species [12].Moreover, these approaches based on the gene encodingCpn60 or universal 16S/18S rRNA genes, despite beingable to compare the relative abundance within a domain,do not provide estimation of the total DNA abundancein a sample. qPCR can be used for the estimation of mi-crobial abundance, as it allows calculation of the copynumber of a specific gene per amount of total DNA.However, it does not provide information on the envir-onmental in situ gene abundance. Furthermore, it re-quires separate and complex qPCR analysis for eachgroup, subsequent to initial metagenomic sequencing.Other approaches include measurements based ontri-phosphate abundance (ATP), flow cytometry (FCM),phospholipid fatty acids (PLFA) and microbial biomasscarbon (MBC) [13].An elaborate flow cytometry method was used in a
breakthrough study identifying microbiome abundanceas a key driver in Crohn’s disease. Measurement of theabsolute abundance of organisms revealed the ratio ofBacteroides to Prevotella, which is considered an im-portant maker of gut health, is an artefact of relativequantification [14]. While such an elaborate method isnot easily transferred to other organisms, it is possible to‘spike’ samples, by adding a known number of bacterialcells of a species not normally found in a given environ-ment. Mammalian gut samples were spiked with an ex-treme soil halophile, not present in gut, and the absoluteabundance of all groups determined by comparison tothe number of 16S rRNA reads of the halophile relativeto its input abundance [15]. This is limited by the re-quirement for prior knowledge of which bacterial speciesare absent from an environment and the necessity ofpreparing a culture to a highly controlled cell density.In RNA-seq-based studies, it is common to add syn-
thetic RNA standard to an environmental sample priorto RNA isolation. Environmental and synthetic RNA isthen co-purified, converted to cDNA, and sequenced.From the normalised ratio of these in the sequencing
output, it is possible to compare RNA relative abun-dance between the samples [16, 17].Here, we show results of a DNA-based PCR amplicon
adaptation of the RNA-seq method. We have designedshort chimeric synthetic DNA fragments that containuniversal primer binding sites specific for three majormicrobiota domains: prokaryotes, eukaryotes and fungi.During PCR, these synthetic DNA molecules producetheir respective expected amplicon size, due to the pres-ence of a synthetic stuffer region. Adding a knownamount of synthetic DNA spikes directly to environmen-tal samples and calculating their relative abundance inthe sequencing output allows the absolute abundance ofspecific groups of organisms to be determined bothwithin and between amplicon classes. Here, we demon-strate the strength of this approach with both pure bac-terial cultures and complex soil samples. We first testour spiking approach on a define number of bacterialcells. Later, we show how this method can be applied tosamples with an unknown microbiota structure. Accord-ing to different estimates, the soil microbiota is at leastan order of magnitude more diverse than that of the gut[18]. Hence, this method can be adapted for analysis ofsimpler environments such as that of food samples orhuman/animal gut. Strikingly, we show that when com-paring samples, the relative abundance of microbial taxamay be higher in a sample even when its absolute abun-dance is lower.
MethodsDesign of P, E and F synthetic spikesSynthetic spikes were designed with three key elements:(i) primer binding sites (PBSs) from the common genesused for identification of prokaryotes (P), eukaryotes (E)and fungi (F), respectively; (ii) an optimised syntheticstuffer sequence of the same length and GC content asthe in vivo target and (iii) a readily available, easy tohandle source of synthetic spike DNA (Fig. 1).PBSs are based on the three sets of PCR primers
chosen for microbiota amplification. For prokaryotes (P),the prokaryotic 16S rRNA V4 region primers 515F and806R [19] were used as they are commonly used in soilstudies. For eukaryotes (E), we used the 18S primer pair,F1427 and R1616 [20], that targets a broad range ofeukaryotic taxa including algae, diatoms, animals, exca-vates (protists, flagellates), fungi and moulds. The thirdprimer pair specifically targets fungi (F), ITS1F andITS2R and are widely used in soil microbiota studies[21]. These primers target the variable sized ITS frag-ment of Ascomycota and Basidiomycota, common phylain forest soils [22]. As variability in amplicon length canbias PCR amplification efficiency, the length of thestuffer sequences of P (16S rRNA) and E (18S rRNA)were matched to the length of natural PCR products.
Tkacz et al. Microbiome (2018) 6:110 Page 2 of 13
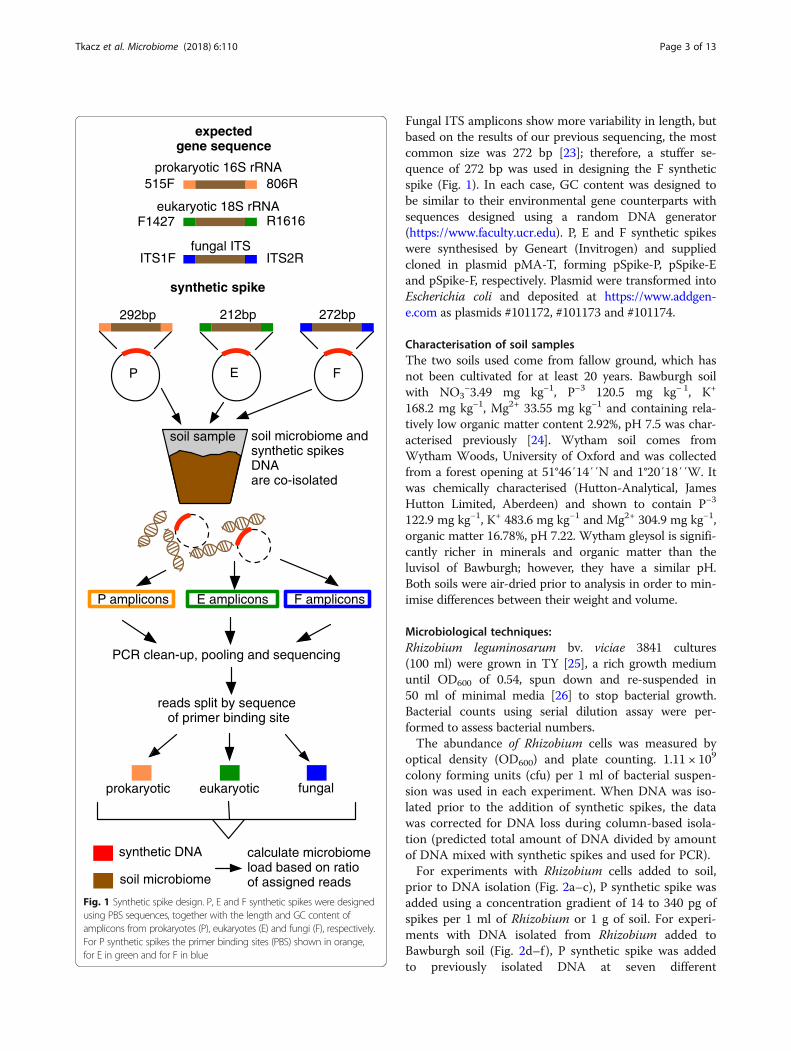
Fungal ITS amplicons show more variability in length, butbased on the results of our previous sequencing, the mostcommon size was 272 bp [23]; therefore, a stuffer se-quence of 272 bp was used in designing the F syntheticspike (Fig. 1). In each case, GC content was designed tobe similar to their environmental gene counterparts withsequences designed using a random DNA generator(https://www.faculty.ucr.edu). P, E and F synthetic spikeswere synthesised by Geneart (Invitrogen) and suppliedcloned in plasmid pMA-T, forming pSpike-P, pSpike-Eand pSpike-F, respectively. Plasmid were transformed intoEscherichia coli and deposited at https://www.addgen-e.com as plasmids #101172, #101173 and #101174.
Characterisation of soil samplesThe two soils used come from fallow ground, which hasnot been cultivated for at least 20 years. Bawburgh soilwith NO3
−3.49 mg kg−1, P−3 120.5 mg kg− 1, K+
168.2 mg kg−1, Mg2+ 33.55 mg kg−1 and containing rela-tively low organic matter content 2.92%, pH 7.5 was char-acterised previously [24]. Wytham soil comes fromWytham Woods, University of Oxford and was collectedfrom a forest opening at 51°46′14′′N and 1°20′18′′W. Itwas chemically characterised (Hutton-Analytical, JamesHutton Limited, Aberdeen) and shown to contain P−3
122.9 mg kg−1, K+ 483.6 mg kg−1 and Mg2+ 304.9 mg kg−1,organic matter 16.78%, pH 7.22. Wytham gleysol is signifi-cantly richer in minerals and organic matter than theluvisol of Bawburgh; however, they have a similar pH.Both soils were air-dried prior to analysis in order to min-imise differences between their weight and volume.
Microbiological techniques:Rhizobium leguminosarum bv. viciae 3841 cultures(100 ml) were grown in TY [25], a rich growth mediumuntil OD600 of 0.54, spun down and re-suspended in50 ml of minimal media [26] to stop bacterial growth.Bacterial counts using serial dilution assay were per-formed to assess bacterial numbers.The abundance of Rhizobium cells was measured by
optical density (OD600) and plate counting. 1.11 × 10⁹
colony forming units (cfu) per 1 ml of bacterial suspen-sion was used in each experiment. When DNA was iso-lated prior to the addition of synthetic spikes, the datawas corrected for DNA loss during column-based isola-tion (predicted total amount of DNA divided by amountof DNA mixed with synthetic spikes and used for PCR).For experiments with Rhizobium cells added to soil,
prior to DNA isolation (Fig. 2a–c), P synthetic spike wasadded using a concentration gradient of 14 to 340 pg ofspikes per 1 ml of Rhizobium or 1 g of soil. For experi-ments with DNA isolated from Rhizobium added toBawburgh soil (Fig. 2d–f ), P synthetic spike was addedto previously isolated DNA at seven different
P E
soil microbiome and synthetic spikes DNAare co-isolated
P amplicons E amplicons F amplicons
PCR clean-up, pooling and sequencing
reads split by sequence of primer binding site
soil microbiome
synthetic DNA
eukaryoticprokaryotic fungal
expected gene sequence
eukaryotic 18S rRNA
fungal ITS
515F 806R
F1427 R1616
ITS1F ITS2R
synthetic spike
soil sample
prokaryotic 16S rRNA
F
272bp292bp 212bp
calculate microbiome load based on ratio of assigned reads
Fig. 1 Synthetic spike design. P, E and F synthetic spikes were designedusing PBS sequences, together with the length and GC content ofamplicons from prokaryotes (P), eukaryotes (E) and fungi (F), respectively.For P synthetic spikes the primer binding sites (PBS) shown in orange,for E in green and for F in blue
Tkacz et al. Microbiome (2018) 6:110 Page 3 of 13
concentrations: 2, 4, 8, 20, 40, 80 and 200 pg per 1 μg ofmicrobial DNA.In experiments comparing Bawburgh and Wytham
soil, 300 mg of soil was routinely used. Even though thesoil was well mixed, some variation in the microbialcomposition and abundance would be expected. Foreach soil, 24 samples were prepared, with the eight levelsof PEF synthetic spikes used (Table 1) performed in
triplicate. These levels contain a defined amount of eachof the P, E and F synthetic spikes. We anticipated a de-creased abundance of eukaryotic 18S rRNA and fungalITS compared with prokaryotic 16S rRNA based on ourprevious work [27], and hence, we used differentamounts of PEF spikes.Samples were processed using a soil DNA isolation kit
(D6001, Zymo research, Irvine, US) according to the
a b c d e f
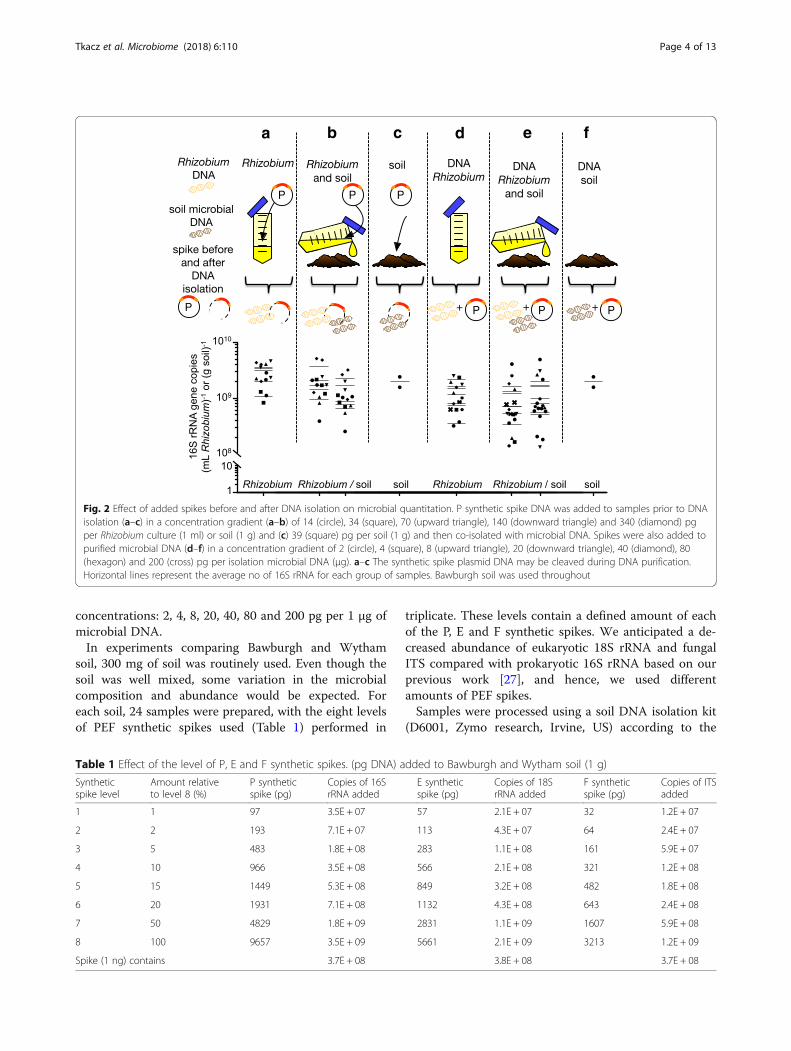
Fig. 2 Effect of added spikes before and after DNA isolation on microbial quantitation. P synthetic spike DNA was added to samples prior to DNAisolation (a–c) in a concentration gradient (a–b) of 14 (circle), 34 (square), 70 (upward triangle), 140 (downward triangle) and 340 (diamond) pgper Rhizobium culture (1 ml) or soil (1 g) and (c) 39 (square) pg per soil (1 g) and then co-isolated with microbial DNA. Spikes were also added topurified microbial DNA (d–f) in a concentration gradient of 2 (circle), 4 (square), 8 (upward triangle), 20 (downward triangle), 40 (diamond), 80(hexagon) and 200 (cross) pg per isolation microbial DNA (μg). a–c The synthetic spike plasmid DNA may be cleaved during DNA purification.Horizontal lines represent the average no of 16S rRNA for each group of samples. Bawburgh soil was used throughout
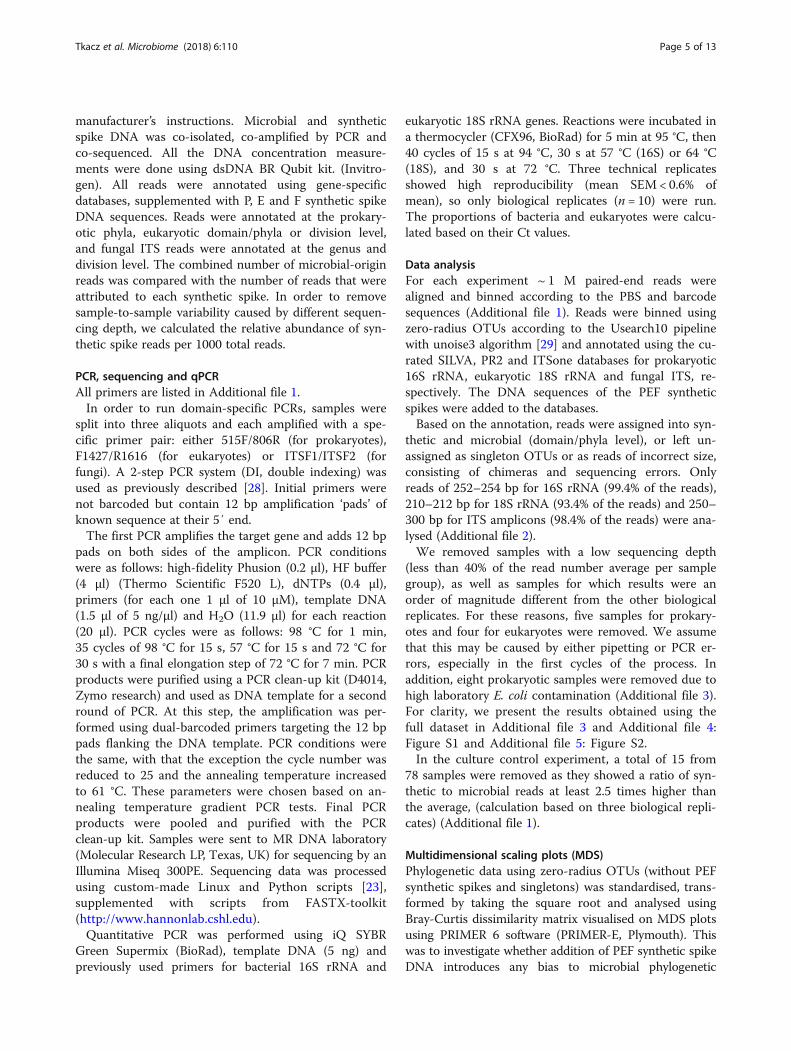
Table 1 Effect of the level of P, E and F synthetic spikes. (pg DNA) added to Bawburgh and Wytham soil (1 g)
Syntheticspike level
Amount relativeto level 8 (%)
P syntheticspike (pg)
Copies of 16SrRNA added
E syntheticspike (pg)
Copies of 18SrRNA added
F syntheticspike (pg)
Copies of ITSadded
1 1 97 3.5E + 07 57 2.1E + 07 32 1.2E + 07
2 2 193 7.1E + 07 113 4.3E + 07 64 2.4E + 07
3 5 483 1.8E + 08 283 1.1E + 08 161 5.9E + 07
4 10 966 3.5E + 08 566 2.1E + 08 321 1.2E + 08
5 15 1449 5.3E + 08 849 3.2E + 08 482 1.8E + 08
6 20 1931 7.1E + 08 1132 4.3E + 08 643 2.4E + 08
7 50 4829 1.8E + 09 2831 1.1E + 09 1607 5.9E + 08
8 100 9657 3.5E + 09 5661 2.1E + 09 3213 1.2E + 09
Spike (1 ng) contains 3.7E + 08 3.8E + 08 3.7E + 08
Tkacz et al. Microbiome (2018) 6:110 Page 4 of 13
manufacturer’s instructions. Microbial and syntheticspike DNA was co-isolated, co-amplified by PCR andco-sequenced. All the DNA concentration measure-ments were done using dsDNA BR Qubit kit. (Invitro-gen). All reads were annotated using gene-specificdatabases, supplemented with P, E and F synthetic spikeDNA sequences. Reads were annotated at the prokary-otic phyla, eukaryotic domain/phyla or division level,and fungal ITS reads were annotated at the genus anddivision level. The combined number of microbial-originreads was compared with the number of reads that wereattributed to each synthetic spike. In order to removesample-to-sample variability caused by different sequen-cing depth, we calculated the relative abundance of syn-thetic spike reads per 1000 total reads.
PCR, sequencing and qPCRAll primers are listed in Additional file 1.In order to run domain-specific PCRs, samples were
split into three aliquots and each amplified with a spe-cific primer pair: either 515F/806R (for prokaryotes),F1427/R1616 (for eukaryotes) or ITSF1/ITSF2 (forfungi). A 2-step PCR system (DI, double indexing) wasused as previously described [28]. Initial primers werenot barcoded but contain 12 bp amplification ‘pads’ ofknown sequence at their 5′ end.The first PCR amplifies the target gene and adds 12 bp
pads on both sides of the amplicon. PCR conditionswere as follows: high-fidelity Phusion (0.2 μl), HF buffer(4 μl) (Thermo Scientific F520 L), dNTPs (0.4 μl),primers (for each one 1 μl of 10 μM), template DNA(1.5 μl of 5 ng/μl) and H2O (11.9 μl) for each reaction(20 μl). PCR cycles were as follows: 98 °C for 1 min,35 cycles of 98 °C for 15 s, 57 °C for 15 s and 72 °C for30 s with a final elongation step of 72 °C for 7 min. PCRproducts were purified using a PCR clean-up kit (D4014,Zymo research) and used as DNA template for a secondround of PCR. At this step, the amplification was per-formed using dual-barcoded primers targeting the 12 bppads flanking the DNA template. PCR conditions werethe same, with that the exception the cycle number wasreduced to 25 and the annealing temperature increasedto 61 °C. These parameters were chosen based on an-nealing temperature gradient PCR tests. Final PCRproducts were pooled and purified with the PCRclean-up kit. Samples were sent to MR DNA laboratory(Molecular Research LP, Texas, UK) for sequencing by anIllumina Miseq 300PE. Sequencing data was processedusing custom-made Linux and Python scripts [23],supplemented with scripts from FASTX-toolkit(http://www.hannonlab.cshl.edu).Quantitative PCR was performed using iQ SYBR
Green Supermix (BioRad), template DNA (5 ng) andpreviously used primers for bacterial 16S rRNA and
eukaryotic 18S rRNA genes. Reactions were incubated ina thermocycler (CFX96, BioRad) for 5 min at 95 °C, then40 cycles of 15 s at 94 °C, 30 s at 57 °C (16S) or 64 °C(18S), and 30 s at 72 °C. Three technical replicatesshowed high reproducibility (mean SEM < 0.6% ofmean), so only biological replicates (n = 10) were run.The proportions of bacteria and eukaryotes were calcu-lated based on their Ct values.
Data analysisFor each experiment ~ 1 M paired-end reads werealigned and binned according to the PBS and barcodesequences (Additional file 1). Reads were binned usingzero-radius OTUs according to the Usearch10 pipelinewith unoise3 algorithm [29] and annotated using the cu-rated SILVA, PR2 and ITSone databases for prokaryotic16S rRNA, eukaryotic 18S rRNA and fungal ITS, re-spectively. The DNA sequences of the PEF syntheticspikes were added to the databases.Based on the annotation, reads were assigned into syn-
thetic and microbial (domain/phyla level), or left un-assigned as singleton OTUs or as reads of incorrect size,consisting of chimeras and sequencing errors. Onlyreads of 252–254 bp for 16S rRNA (99.4% of the reads),210–212 bp for 18S rRNA (93.4% of the reads) and 250–300 bp for ITS amplicons (98.4% of the reads) were ana-lysed (Additional file 2).We removed samples with a low sequencing depth
(less than 40% of the read number average per samplegroup), as well as samples for which results were anorder of magnitude different from the other biologicalreplicates. For these reasons, five samples for prokary-otes and four for eukaryotes were removed. We assumethat this may be caused by either pipetting or PCR er-rors, especially in the first cycles of the process. Inaddition, eight prokaryotic samples were removed due tohigh laboratory E. coli contamination (Additional file 3).For clarity, we present the results obtained using thefull dataset in Additional file 3 and Additional file 4:Figure S1 and Additional file 5: Figure S2.In the culture control experiment, a total of 15 from
78 samples were removed as they showed a ratio of syn-thetic to microbial reads at least 2.5 times higher thanthe average, (calculation based on three biological repli-cates) (Additional file 1).
Multidimensional scaling plots (MDS)Phylogenetic data using zero-radius OTUs (without PEFsynthetic spikes and singletons) was standardised, trans-formed by taking the square root and analysed usingBray-Curtis dissimilarity matrix visualised on MDS plotsusing PRIMER 6 software (PRIMER-E, Plymouth). Thiswas to investigate whether addition of PEF synthetic spikeDNA introduces any bias to microbial phylogenetic
Tkacz et al. Microbiome (2018) 6:110 Page 5 of 13

structure and to visually represent differences betweentwo different soil microbiotas.
ResultsChimeric spiking gives an accurate estimation of microbialabundanceThe accuracy of quantitative metagenomics was testedusing a series of sampling strategies with known and un-known amounts of microbial DNA (Fig. 2).P synthetic spikes were mixed using different propor-
tions with 1.11 × 10⁹ cells of Rhizobium, and their DNAwas isolated and co-amplified (Fig. 2a). Since the gen-ome of this species of Rhizobium has three copies of the16S rRNA gene, the expected outcome is 3.33 × 10⁹ 16SrRNA copies per 1 ml of culture. At the three highestlevels of P spikes, the mean of the estimated Rhizobiumgene content (3.11 × 10⁹, 3.44 × 10⁹ and 3.38 × 10⁹ 16Scopies per 1 ml culture) was 99.3% of the actual amount(Fig. 2a). The lower spike levels appeared insufficient asthey underestimated Rhizobium abundance (2.00 × 109,1.04 × 109 16S copies per 1 ml culture).Furthermore, to check whether this might be changed
by the presence of soil, P spikes were added to a cultureof Rhizobium already mixed with soil (Fig. 2a). It can beseen that the estimation for Rhizobium rRNA copy num-ber are more variable: 1.38 × 10⁹, 1.66 × 10⁹, 9.19 × 108,2.04 × 109 and 3.67 × 10⁹ 16S rRNA copies per 1 ml ofculture Fig. 2b). However, the fact that they are similarto the results obtained from pure cultures (Fig. 2a) indi-cates that addition of soil does not strongly interferewith the P synthetic spike soil DNA co-isolation andco-amplification by PCR. Potentially, soil particles couldabsorb some of the Rhizobium, it contains humic acidsthat may interfere with polymerase during PCR and itintroduces a diverse microbial community, which makesthe sequencing more difficult. It is likely someRhizobium cells attached to soil particles, and theirDNA was then not isolated completely. In this experi-ment, the soil microbiota was estimated to contain:7.6 × 10⁸, 8.7 × 10⁸, 6.3 × 10⁸, 1.7 × 10⁹ and 2.2 × 10⁹ 16SrRNA copies per gram of soil. A similar value of 1.1 × 10⁹
16S copies was estimated from a separate assay where Pspikes were added to the soil alone (Fig. 2c). Hence, thespiking approach allowed for repeated estimation of thesoil microbiota abundance with and without addition of asubstantial amount of Rhizobium cells.Next, spikes were added to already isolated bacterial
and/or soil DNA (Fig. 2d–f ). Addition of P synthetic spiketo already isolated microbial DNA resulted in lower esti-mation of 16S rRNA gene copies. DNA from culturedRhizobium gave an average estimate of 1.16 × 10⁹ 16SrRNA copies per 1 ml of culture (Fig. 2d) and DNA fromcultured Rhizobium added to soil gave 9.2 × 10⁸ ofRhizobium 16S copies per 1 ml of culture (Fig. 2e). DNA
from soil gave an average estimate of 16S rRNA gene cop-ies of 1.17 × 10⁹ per 1 ml of culture, when measuredmixed with Rhizobium culture and 1.96 × 10⁹ 16S copiesper 1 ml of culture, when measured on its own (Fig. 2f).In order to obtain these values, the concentration of iso-lated DNA was measured to enable calculation of theabundance of Rhizobium and/or soil microbiota 16SrRNA copies. This may introduce a significant bias fromestimation of the DNA quantity. Moreover, while the copynumber of 16S rRNA is known for a defined species suchas Rhizobium, it can only be approximated for unknownOTUs in the total microbiota. For comparative purposesthe Rhizobium values were used, with a genome 7.8 Mbweighting 4 billion Da and 3 rRNA operon copy per gen-ome, resulting in 377,155 16S rRNA gene copies per 1 ngof DNA. Based on these results, the most accurate resultsare obtained when spikes are added to the raw materialprior to DNA isolation.
Synthetic spikes allow measurement of in situ soil DNAabundance and microbiota composition in different soilsAs addition of spikes allows accurate estimation of theabundance of the soil microbiota, total prokaryotic,eukaryotic and fungal abundances were measured in twocontrasting soils. In order to estimate soil microbiotaabundance, P (bacterial 16S rRNA), E (eukaryotic 18S)rRNA and F synthetic spikes (fungal ITS) were added toBawburgh and Wytham soils (Table 1). A gradient of P,E and F spikes was used to test DNA isolation and/orPCR amplification bias between the amount of syntheticand environmental DNA. As expected, the higher theamount of synthetic spike added to soil samples, thehigher their recovery in the sequencing output, althoughthis plateaus at the highest levels of F synthetic spike(Fig. 3). In order to determine the optimum spike level,a simple model was constructed showing the expectednumber of synthetic sequences per 1000 total sequences.First, the microbial gene abundance was averaged (Fig. 3),and this value was used for modelling using the follow-ing equation:
SR1000 ¼ NSNSþ ENVð Þ=1000
where SR1000 is the number of synthetic reads per 1000reads of the sequencing output. NS is the number of P, Eor F spikes added per gram of soil. ENV is the gene copynumber of prokaryotic 16S rRNA, eukaryotic 18S rRNAor fungal ITS per gram of soil.The experimental data (Fig. 3, symbols) is similar to
the modelled set (Fig. 3, lines), indicating that despite a100-fold difference in spike concentration, microbiotaabundance can be accurately estimated. At every level of
Tkacz et al. Microbiome (2018) 6:110 Page 6 of 13

synthetic spikes, there were more sequenced reads per1000 total reads for the F synthetic spike (ITS) than forthe E synthetic spike (18S rRNA), which in turn, hadmore sequenced reads than the P synthetic spike (16SrRNA) (Fig. 3). As expected, prokaryotic 16S rRNA ismore abundant than eukaryotic 18S rRNA gene, whichin turn is more abundant than fungal ITS in soil.Furthermore, adding synthetic spikes (levels 1–8, Table 1)did not cause a significant change in the measured com-position of the prokaryotic, eukaryotic and fungal com-munities (Fig. 4a–c). Data points for two eukaryoticsamples showing an over-representation of AnnelidaDNA (with relative contribution of 25 and 70% com-pared to < 1% for other samples) were removed fromFig. 4 for clarity. These two soil samples were probablycontaminated with a piece of earthworm. However, thesize of the tissue was not large enough to alter theamount of detected 16S rRNA and ITS or their phylo-genetic profiles.
Determining domain abundance in two contrasting soilsAs the amount of synthetic spike DNA added to the soilis known, the in situ abundance in soil of each respectivegene (16S rRNA, 18S rRNA or ITS) can be calculated(Fig. 5). For each synthetic spike level, there was rela-tively more 16S rRNA, 18S rRNA and ITS genes inWytham soil compared with Bawburgh soil.With a 100-fold concentration of spikes, there was a
4-, 6- and 7-fold variation in the total in situ abundancemeasured for 16S rRNA, 18S rRNA and ITS, respect-ively (Fig. 5). Omitting samples with less than 200 andmore than 800 spike reads per 1000 total reads (dottedgreen lines on Fig. 3) (i.e. very low or high syntheticspike levels) reduced the variation to approx. 1.2- to1.3-fold in each case (Fig. 5). Samples that fulfil these
criteria are for 16S rRNA levels 7 and 8; for 18S rRNAlevels 3, 4, 5 and 6; and for ITS level 1 and 2 (Table 2).Using only samples fulfilling these criteria (Table 2), the
estimation of abundance of prokaryotic 16S rRNA was re-duced from 1.9 × 10⁹ to 1.8 × 10⁹ for Bawburgh soil andfrom 4.9 × 10⁹ to 2.5 × 10⁹ for Wytham soil. Eukaryotic18S rRNA gene abundance remained almost identical at1.5–1.7 × 10⁷, and 2.5–2.3 × 10⁸ while fungal ITS wasincreased from 5.8 × 10⁶ and 8.0 × 10⁶ to 9.8 × 10⁶ and1.6 × 107 for Bawburgh and Wytham soils, respectively.Fungal spike levels 3–8 were saturated with syntheticspikes and under-represented in situ microbial ITS abun-dance (Table 2). The requirement to tailor synthetic spikelevels depending on the amplification target (i.e. 16SrRNA, 18S rRNA or ITS) correlates with the totalabundance of in situ microbial DNA from each of thesegroups. We suggest using a concentration of syntheticspike at a level > 20% of the (expected) environmental mi-crobial gene abundance. Oversaturation with syntheticspikes (> 80%) increases the sequencing depth necessaryand may also bias results. In each case, the microbiota ismore abundant in Wytham soil than in Bawburgh soil,showing 25, 29 and 40% more prokaryotes, eukaryotesand fungi, respectively. These results correlate with thefact that Wytham soil is richer in organic matter and mac-ronutrients than that from Bawburgh.We observe a gradient in microbiota abundance esti-
mation based on the P and F spike level addition.Generally, the more spikes were added the lower micro-biota abundance was recorded. This relationship was notobserved for the 18S rRNA as well as for the 16S rRNAand ITS datasets inside the 20–80% ratio zone (Fig. 5). Itsuggests that the low levels of spikes may be retained insoil and hence soil type may cause a significant bias inthe microbiota estimation, while very high levels oversat-urate the DNA pool.
0100200300400500600700800900
1000
num
ber
of s
ynth
etic
rea
ds p
er 1
000
read
s
Bawburgh_16S
Wytham_16S
Bawburgh_18S
Wytham_18S
Bawburgh_ITS
Wytham_ITS
1 4 5 6 7 8 2 3 spike levels
Fig. 3 Model of synthetic spike addition. Number of sequencing reads of synthetic spike per 1000 total reads (y-axis) from 16S rRNA, 18S rRNAand ITS following addition to soil of different levels of P, E and F synthetic spikes (x-axis). Experimental results are shown by solid symbols whilemodel data is presented with lines of corresponding colours. The model shows the expected spike contribution in the sequencing output foreach spike level using the averaged gene abundance for a specific soil (as in Table 2). Dotted green lines indicate the region with 200–800synthetic reads per 1000 reads. Spike levels on the x-axis correspond to the synthetic spike levels in Table 1
Tkacz et al. Microbiome (2018) 6:110 Page 7 of 13
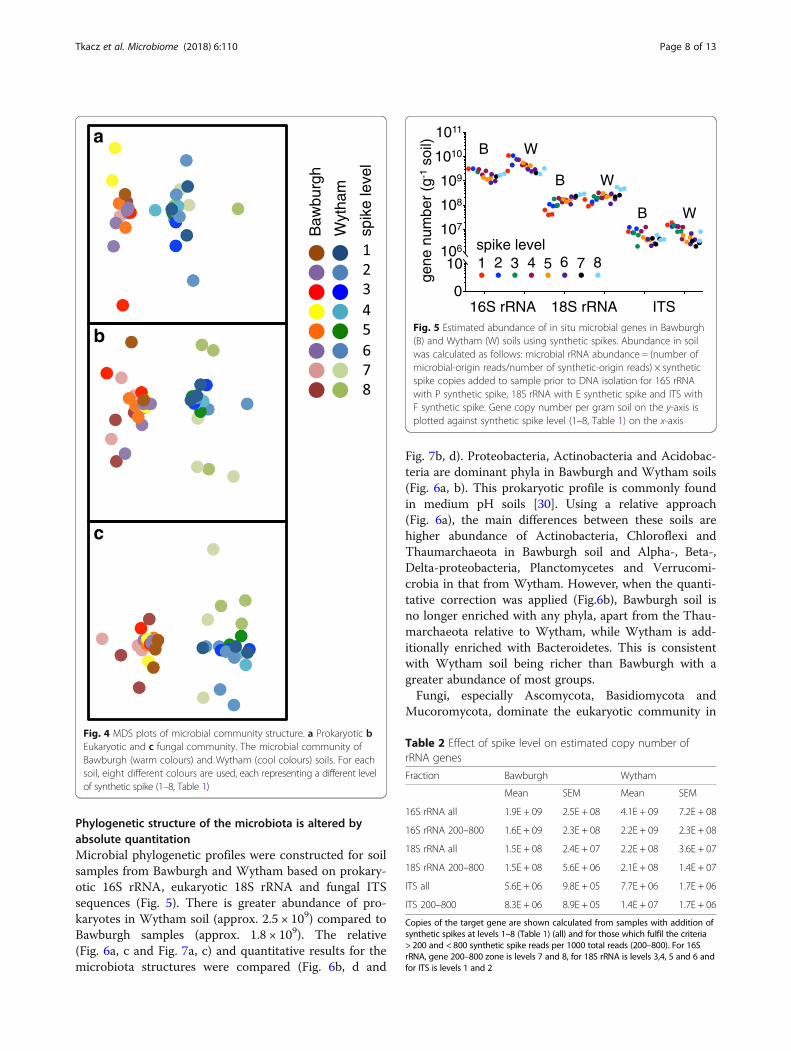
Phylogenetic structure of the microbiota is altered byabsolute quantitationMicrobial phylogenetic profiles were constructed for soilsamples from Bawburgh and Wytham based on prokary-otic 16S rRNA, eukaryotic 18S rRNA and fungal ITSsequences (Fig. 5). There is greater abundance of pro-karyotes in Wytham soil (approx. 2.5 × 10⁹) compared toBawburgh samples (approx. 1.8 × 10⁹). The relative(Fig. 6a, c and Fig. 7a, c) and quantitative results for themicrobiota structures were compared (Fig. 6b, d and
Fig. 7b, d). Proteobacteria, Actinobacteria and Acidobac-teria are dominant phyla in Bawburgh and Wytham soils(Fig. 6a, b). This prokaryotic profile is commonly foundin medium pH soils [30]. Using a relative approach(Fig. 6a), the main differences between these soils arehigher abundance of Actinobacteria, Chloroflexi andThaumarchaeota in Bawburgh soil and Alpha-, Beta-,Delta-proteobacteria, Planctomycetes and Verrucomi-crobia in that from Wytham. However, when the quanti-tative correction was applied (Fig.6b), Bawburgh soil isno longer enriched with any phyla, apart from the Thau-marchaeota relative to Wytham, while Wytham is add-itionally enriched with Bacteroidetes. This is consistentwith Wytham soil being richer than Bawburgh with agreater abundance of most groups.Fungi, especially Ascomycota, Basidiomycota and
Mucoromycota, dominate the eukaryotic community in
Baw
burg
h
Wyt
ham
spik
e le
vel
a
b
c
Fig. 4 MDS plots of microbial community structure. a Prokaryotic bEukaryotic and c fungal community. The microbial community ofBawburgh (warm colours) and Wytham (cool colours) soils. For eachsoil, eight different colours are used, each representing a different levelof synthetic spike (1–8, Table 1)
A A A A S S
06
7
8
9
0
spike level
16S rRNA 18S rRNA ITS
1011
108
107
106
109
1010
1 4 5 6 7 8 3 2
B W
B W
B W
gene
num
ber
(g-1
soi
l)
0
10
Fig. 5 Estimated abundance of in situ microbial genes in Bawburgh(B) and Wytham (W) soils using synthetic spikes. Abundance in soilwas calculated as follows: microbial rRNA abundance = (number ofmicrobial-origin reads/number of synthetic-origin reads) × syntheticspike copies added to sample prior to DNA isolation for 16S rRNAwith P synthetic spike, 18S rRNA with E synthetic spike and ITS withF synthetic spike. Gene copy number per gram soil on the y-axis isplotted against synthetic spike level (1–8, Table 1) on the x-axis
Table 2 Effect of spike level on estimated copy number ofrRNA genes
Fraction Bawburgh Wytham
Mean SEM Mean SEM
16S rRNA all 1.9E + 09 2.5E + 08 4.1E + 09 7.2E + 08
16S rRNA 200–800 1.6E + 09 2.3E + 08 2.2E + 09 2.3E + 08
18S rRNA all 1.5E + 08 2.4E + 07 2.2E + 08 3.6E + 07
18S rRNA 200–800 1.5E + 08 5.6E + 06 2.1E + 08 1.4E + 07
ITS all 5.6E + 06 9.8E + 05 7.7E + 06 1.7E + 06
ITS 200–800 8.3E + 06 8.9E + 05 1.4E + 07 1.7E + 06
Copies of the target gene are shown calculated from samples with addition ofsynthetic spikes at levels 1–8 (Table 1) (all) and for those which fulfil the criteria> 200 and < 800 synthetic spike reads per 1000 total reads (200–800). For 16SrRNA, gene 200–800 zone is levels 7 and 8, for 18S rRNA is levels 3,4, 5 and 6 andfor ITS is levels 1 and 2
Tkacz et al. Microbiome (2018) 6:110 Page 8 of 13

both Bawburgh and Wytham soils. Quantitation indi-cates that the dominant phyla of Ascomycota and Chy-tridiomycota are more abundant in Wytham soil, whileMucoromycota is prevalent in that from Bawburgh(Fig. 6c, d). One of the soil samples (Wytham_43, Fig. 6d)contained a piece of Annelida tissue with more than70% of the sequencing reads belonging to this group. Asmight be expected, a substantial piece of animal tissueincreased the abundance of 18S rRNA copies (approx.3.2 × 108) over that of the average (approx. 2.5 × 10⁸) forWytham soil.
Insight into primers specificityThere is a clear difference between phylogenetic profilesand microbiota quantitation obtained using 18S rRNAand ITS primers. Fungi consist of 77% (corresponding to1.3 × 108 gene copies per 1 g of soil) and 79% (corre-sponding to 1.8 × 10⁸ gene copies per 1 g of soil) of thetotal 18S rRNA-based eukaryotic community for Baw-burgh and Wytham soils, respectively. However,ITS-based analysis indicates that fungal abundance is
much lower than the results suggested from the 18SrRNA analysis with values of 8.3 × 10⁶ and 1.4 × 10⁷ forthese soils, respectively. 18S rRNA primersover-represent the abundance of fungal species and/orITS primers do not capture the whole fungal taxonomyor both of these approaches produce a bias. Not surpris-ingly ITS and 18S rRNA-based analyses indicate a differ-ent absolute and relative abundance of common fungalgenera (Fig. 7e). It is known that 18S rRNA primers arenot able to unravel detail in fungal taxonomy; however,results from both primer sets agree on soil to soil com-parison where Ceratocystis, Pleosporales and Aspergillusare more abundant in Wytham soil, while Thelebolus ismore abundant in Bawburgh soil.
Cross-domain comparisonAmplification reactions using different primer pairs maynot target a full range of potential microbial taxa. The16S rRNA primers used may not target all prokaryoticspecies, and 18S rRNA primers may not target alleukaryotic taxa. However, assuming that these primers
0.0E+00
5.0E+07
1.0E+08
1.5E+08
2.0E+08
2.5E+08
unidentified, B***, B* Metazoa, W, W Fungi_other, W***, W*** Oomycota, W**, W*** Stramenopiles_other, B***, B* Cercozoa, B***, B Streptophyta, B, W Chlorophyta, B***, B*** Amoebozoa, B***, B*** Alveolata, W, W* Mucoromycota, B***, B** Chytridiomycota, W, W** Basidiomycota, B***, B Ascomycota, W***, W***
a b
c d
0%
10%
20%
30%
40%
50%
60%
70%
80%
90%
100%
Bawburgh Wytham 0.0E+00
5.0E+08
1.0E+09
1.5E+09
2.0E+09
2.5E+09
3.0E+09
Bawburgh Wytham
unidentified, B, B other_phyla, W, W*** Thaumarchaeota, B***, B*** Verrucomicrobia, W***, W*** Planctomycetes, W, W** Firmicutes, W, W Chloroflexi, B*, B Bacteroidetes, W, W** Gammaproteobacteria, W, W Deltaproteobacteria, W***, W*** Betaproteobacteria, W***, W*** Alphaproteobacteria, W***, W*** Actinobacteria, B*, W Acidobacteria, B, B
0%
10%
20%
30%
40%
50%
60%
70%
80%
90%
100%
Bawburgh Wytham
Fig. 6 Prokaryotic and eukaryotic community structure in Bawburgh and Wytham soils. a Relative prokaryotic 16S rRNA gene abundance. bAbsolute prokaryotic 16S rRNA gene abundance. c Relative eukaryotic 18S rRNA gene abundance and d absolute eukaryotic 18S rRNA geneabundance, an additional sample of Wytham soil is presented; ‘Wytham_43’ with a high proportion of macroorganism (Annelida) tissue present.Reads with Bit-score lower than 300 are clustered into ‘low-blast’ group. ‘B’ and ‘W’ indicate that the taxa in more abundant in Bawburgh or Wythamsoil, respectively. *< 0.05, **< 0.01, ***< 0.001 using t test and Bonferroni correction for testing multiple comparisons
Tkacz et al. Microbiome (2018) 6:110 Page 9 of 13

capture most of the community, the ratio of prokaryoticto eukaryotic ribosomal content can be determined(Fig. 8). Prokaryotes make up 91.4% and eukaryotesmake up 8.6% of the soil microbiota. The limitation ofour approach is that we cannot easily compare the re-sults with microscope-based counts as prokaryotic cellsnormally have only a few ribosomal operons [31–33],while eukaryotes may have hundreds of copies [34–36].Wytham soil is richer in both 16S rRNA and 18S rRNArelative to that from Bawburgh; however, the ratio issimilar for both soils (Fig. 8). This potentially representsa biological mechanism controlling inter-domain rela-tionships in (fallow) soils.In order to confirm our findings, we have used qPCR
on the DNA isolated from Bawburgh soil. By comparingthe relative amplification efficiency of the 16S and 18SrRNA genes targets, we have calculated that eukaryotescontribute to 7.6% (max. 17%, min. 4%) and prokaryotesto 92.4% (max. 96%, min. 83%) of the soil microbialcommunity (Additional file 6). These values are only 1%different from our spike-based approach results.Our values can also be compared with results published
from a meta-transcriptomic study, which showed thatprokaryotic 16S rRNA and eukaryotic 18S rRNA contrib-ute towards 91.5 and 2.8% of a soil microbiota (theremaining 6.1% of RNA detected could not be assigned)[27]. A study comparing soils of contrasting fungi to bac-teria ratio found that fungi contributed 0.6 to 4.2% de-pending on the soil and detection method e.g. fatty acid
analysis, RNA-seq and meta-proteomics [37]. The ratio offungi to bacteria in our study is higher, 8.0% (fungi con-tribute 6.6% and bacteria contribute 83.3% for the totalmicrobiota) and 7.7% (fungi contribute 6.8% and bacteriacontribute 88.6% for the total microbiota) for Bawburghand Wytham soils, respectively (Fig. 8). An elevated ratioof fungi to bacteria has been associated with high soil fer-tility, high levels of organic carbon and lack of tillage [38].The fallow soils used in this study may indeed have a highfungal abundance, as their organic content is high andthey have not been tilled for decades.
DiscussionAbsolute quantitation of the microbiota is essential forall aspects of microbial ecology, and our approach accur-ately estimated bacterial culture and soil microbiotanumbers. The number of synthetic spikes added to soilover several orders of magnitude was directly propor-tional to the number of sequence reads obtained. Whilevariation between replicates was usually low, some sam-ples had larger errors, confirming that with very com-plex samples, such as soil, high numbers of replicatesare advisable. For example, in previous work investigat-ing the plant-soil microbiota, we used twenty-four bio-logical replicates for each condition [24]. In this work,due to the need to test a large gradient of synthetic spikelevels, we reduced the number to three replicates foreach of the eight synthetic spike levels. However, ideallyfor critical analysis of the soil microbiota, replicate
a b
c
Bawburgh Bawburgh Wytham Wytham
18S rRNA ITS
0%
20%
40%
60%
80%
100%
Bawburgh Wytham 0.0E+00
5.0E+06
1.0E+07
1.5E+07
2.0E+07
Bawburgh Wytham
unidentified, W***, W***
other_genera, W, W***
Exophiala, W, W
Thelebolus, B***, B***
Aspergillus, B**, B
Wickerhamomyces, W***, W***
Pleosporales, B, W
Ceratocystis, B*, B
0.0E+00
2.0E+06
4.0E+06
6.0E+06
8.0E+06
Thelebolus
Pleosporales
Ceratocystis
Aspergillus
Fig. 7 Fungal community structure in Bawburgh and Wytham soils. a Relative fungal ITS abundance. b Absolute fungal ITS abundance shown atthe genus level. c Relative fungal ITS abundance at the divisional level. d Absolute fungal ITS abundance at the division level. e Comparativeanalysis based on 18S rRNA or ITS for absolute abundance of selected fungal genera. Reads with Bit-score lower than 300 are clustered into‘low-blast’ group. ‘B’ and ‘W’ indicate that the taxa in more abundant in Bawburgh or Wytham soil, respectively. *< 0.05, **< 0.01, ***< 0.001 usingt test and Bonferroni correction for testing multiple comparisons
Tkacz et al. Microbiome (2018) 6:110 Page 10 of 13

numbers should be greater than this. Prokaryotic 16SrRNA was detected at around 109 and eukaryotic 18SrRNA at around 108 copies per gram of soil; however,there may be up to an order of magnitude difference incontrasting soils [38]. For example, an extensive study oftwo Chinese soils estimated bacterial load (bacterial cellsper 1 g of soil) at 8 × 10⁸ and 1.9 × 10⁸ based on ATPconcentration, 1.7 × 10⁹ and 2.5 × 10⁸ based on flow cy-tometry, 6.2 × 10⁹ and 1.6 × 10⁹ based on qPCR, 1.3 ×10⁹ and 8.1 × 10⁸ based on phospholipid-derived fattyacid and 1.4 × 10¹⁰ and 1.0 × 10¹⁰ based on minimumbactericidal concentration for rich Beijing and poorTibetan soil, respectively [13]. Using the van Bammelenfactor conversion (0.58 × soil organic matter = soil or-ganic carbon), we can compare total soil organic carboncontent between these Chinese and our soils: in mg/g ofsoil; Beijing 21.5, Wytham 9.73, Tibetan 1.50, Bawburgh1.69). Our values of 1.8 × 10⁹ and 2.5 × 10⁹ of 16S and
18S gene copies per g of soil, for the Bawburgh andWytham, respectively, are similar to the above micro-biota abundance values described for the Chinese soils.Wytham soil, which is rich in organic matter, showed
higher microbial ribosome abundance than poorerBawburgh soil. This is true both for prokaryotic andeukaryotic microbiotas (Fig. 5). Quantitation allows forstatistical correction of soil microbial abundance. Manymicrobial taxa are actually more abundant in Wythamsoil even though their relative presence is higher inBawburgh (Figs. 6 and 7). We believe this to be funda-mentally important for all aspects of microbiota researchand ecology, and it applies to microbiotas from all envi-ronments, from soil to the mammalian gut. Without ab-solute quantitation of groups, the underlying physiologyand ecology of the role of specific microbial taxa may bemasked by their relative abundance. For example,changes in the absolute abundance of keystone symbi-onts or pathogens may be masked by unaltered relativeabundance or the relative abundance may go in the op-posite direction to absolute abundance. This is likely tobe because the relative abundance of any specific groupis highly dependent on the absolute abundance of themost numerous organisms.Since the experimental setup allows detection of the
majority of microbial taxa, i.e. 16S rRNA and 18S rRNAprimers targeting most of the prokaryotic and eukaryoticdiversity, we were able to compare abundance of thesedomains of life (Fig. 8). These results agree with previousRNA-based estimates of the soil microbiota [27]. Addingsynthetic spikes allowed accurate detection of microbial16S rRNA presence in control samples of a Rhizobiumculture, with it being more effective to add spikes dir-ectly to environmental samples rather than to isolatedDNA (Fig. 2).DNA spiking may be combined with other pre-pro-
cessing steps, for instance with the removal of relicDNA (extracellular DNA). Propidium monoazide dye re-acts with DNA not protected by a cellular membraneand subsequently blocks its PCR amplification [39].Synthetic spikes could be added to aliquots of the initialsample and that with relic DNA removed. This approachwould reveal which taxa are alive and their absolutepresence.It is strongly recommended that an initial calibration
curve is performed to determine the optimal syntheticspike level for a given environmental condition. Spikeaddition in too high or too low, an amount compared tothe targeted microbiota, may skew the quantitative re-sults although the level of synthetic spike used did notalter the measured structure of the microbial community(Figs. 4, 5, and 6). However, once an initial calibration isperformed, the level of spike could be varied over threeorders of magnitude with high reproducibility. Care
Bawburgh Wytham bacterial 16S
rRNA 83.3% 88.6% archaeal 16S
rRNA 8.1% 2.7% fungal 18S
rRNA 6.6% 6.8% non-fungal 18S rRNA 2.0% 1.9%
0.E+00
1.E+09
2.E+09
3.E+09
4.E+09
Bawburgh Wytham
bacterial 16S rRNA
archaeal 16S rRNA
fungal 18S rRNA
non-fungal 18S rRNA
a
b
Fig. 8 Comparison of absolute and relative microbiota abundance insoil. a Absolute bacterial and archaeal 16S rRNA and fungal andnon-fungal 18S rRNA gene abundance and b their relative abundance
Tkacz et al. Microbiome (2018) 6:110 Page 11 of 13

needs to be taken to ensure efficient isolation of DNAand its stabilisation from different environments as thiscan bias any method of quantification. However, giventhis caveat, our approach is simple, requiring onlyaddition of known amounts of synthetic spike DNA anda single bioinformatic step post-sequencing, in order toquantify the absolute abundance of prokaryotes, eukary-otes and fungi in microbiota studies.
ConclusionQuantification of the active microbiota will contribute to abetter understanding of functional groups in environmentalmicrobiology and can help in producing better microbiotainteractions models [40]. Such quantification has wide-spread application to microbiota/metagenome-wide associ-ation studies linked to disease [41] or soil productivity [42].
Additional files
Additional file 1: Experiment preparation details: spike sequences,primers sequences, Rhizobium experiment spike output and spikeconcentration to numbers calculation. (XLSX 17 kb)
Additional file 2: Length of the sequences obtained for Bawburgh vs.Wytham soil comparison. (PDF 133 kb)
Additional file 3: Data used for figures and tables preparation. (XLSX 54 kb)
Additional file 4: Figure S1. Model of synthetic spike addition. Numberof sequencing reads of synthetic spike per 1000 total reads (y axis) from16 s rRNA, 18S rRNA and ITS following addition to soil of different levelsof P, E and F synthetic spikes (x axis). The figure presents the full datasetfrom the averaged dataset shown on Fig. 3. (TXT 39 kb)
Additional file 5: Figure S2. Estimated abundance of in situ microbialgenes in Bawburgh (B) and Wytham (W) soils using synthetic spikes.The figure presents the full dataset from the averaged dataset shown onFig. 5. (PDF 84 kb)
Additional file 6: qPCR data. (TXT 12 kb)
Additional file 7: Description of samples submitted to EBI server.(XLSX 74 kb)
Additional file 8: Bash code for the sequencing analysis. (XLSX 63 kb)
Additional file 9: Modified Bash code including Unoise3 command.(XLSX 422 kb)
Abbreviations16S and 18S rRNA: 16S and 18S ribosomal RNA genes; ITS: Internal transcribedspacer; MDS: Multidimensional scaling plot; OTU: Operational taxonomic unit; P,E and F spikes: Prokaryotic, eukaryotic, and fungal specific spikes; PBS: Primerbinding site; PCR: Polymerase chain reaction; TY: Tryptone yeast extract medium
AcknowledgementsWe thank Alison East for help with the manuscript and David Emms andJitender Cheema for help with bioinformatics.
FundingThis work was supported by the Biotechnology and Biological SciencesResearch Council [grant number BB/N013387/1] and the John Oldacre Fund.
Availability of data and materialsSequencing data for this project are available through the EBI short readarchive (primary accession nos. PRJEB22042 and PRJEB22043) (Additional file 7).Spikes are deposited at addgene as plasmids #101172, #101173 and #101174.Bash and Python codes used for sequencing output analysis are provided asAdditional file 8. The zero-radius OTU method is presented as Additional file 9.
The data needed to reproduce figures and analysis is provided asAdditional file 3.
Authors’ contributionsAT and PP conceived and planned the study. AT designed the study, and ATand MH performed the experiments. AT and PP analysed the data. AT andPP drafted the manuscript, and all authors critically revised and approved thefinal version of the manuscript.
Ethics approval and consent to participateNot applicable.
Competing interestsThe authors declare that they have no competing interests.
Publisher’s NoteSpringer Nature remains neutral with regard to jurisdictional claims in publishedmaps and institutional affiliations.
Received: 1 February 2018 Accepted: 30 May 2018
References1. Round JL, Mazmanian SK. The gut microbiome shapes intestinal immune
responses during health and disease. Nat Rev Immun. 2009;9(5):313–23.https://doi.org/10.1038/nri2515.
2. Sjostedt J, Martiny JB, Munk P, Riemann L. Abundance of broad bacterialtaxa in the sargasso sea explained by environmental conditions but notwater mass. Appl Environ Microbiol. 2014;80(9):2786–95. https://doi.org/10.1128/AEM.00099-14.
3. Evrensel A, Ceylan ME. The gut-brain axis: the missing link in depression.Clin Psychopharmacol and Neurosci. 2015;13(3):239–44. https://doi.org/10.9758/cpn.2015.13.3.239.
4. Panke-Buisse K, Poole AC, Goodrich JK, Ley RE, Kao-Kniffin J. Selection onsoil microbiomes reveals reproducible impacts on plant function. ISME J.2015;9(4):980–9. https://doi.org/10.1038/ismej.2014.196.
5. Wagner MR, Lundberg DS, Del Rio TG, Tringe SG, Dangl JL, Mitchell-Olds T.Host genotype and age shape the leaf and root microbiomes of a wildperennial plant. Nat Commun. 2016;7:12151. https://doi.org/10.1038/ncomms1215e1.
6. Zhalnina K, de Quadros PD, Gano KA, Davis-Richardson A, Fagen JR, BrownCT, et al. Ca. Nitrososphaera and Bradyrhizobium are inversely correlated andrelated to agricultural practices in long-term field experiments. FrontMicrobiol. 2013;4:104. https://doi.org/10.3389/fmicb.2013.00104.
7. Turroni F, Berry D, Ventura M. Editorial: Bifidobacteria and their role in thehuman gut microbiota. Front Microbiol. 2017;7(2148) https://doi.org/10.3389/fmicb.2016.02148.
8. Johnson LA, Chaban B, Harding JC, Hill JE. Optimizing a PCR protocol forcpn60-based microbiome profiling of samples variously contaminated withhost genomic DNA. BMC Res Notes. 2015;8:253. https://doi.org/10.1186/s13104-015-1170-4.
9. Verbeke TJ, Sparling R, Hill JE, Links MG, Levin D, Dumonceaux TJ. Predictingrelatedness of bacterial genomes using the chaperonin-60 universal target(cpn60 UT): application to Thermoanaerobacter species. Syst Appl Microbiol.2011;34(3):171–9. https://doi.org/10.1016/j.syapm.2010.11.019.
10. Wang Y, Tian RM, Gao ZM, Bougouffa S, Qian PY. Optimal eukaryotic 18Sand universal 16S/18S ribosomal RNA primers and their application in astudy of symbiosis. PLoS One. 2014;9(3):e90053. https://doi.org/10.1371/journal.pone.0090053.
11. Lan Y, Rosen G, Hershberg R. Marker genes that are less conserved in theirsequences are useful for predicting genome-wide similarity levels betweenclosely related prokaryotic strains. Microbiome. 2016;4(1):18. https://doi.org/10.1186/s40168-016-0162-5.
12. Case RJ, Boucher Y, Dahllof I, Holmstrom C, Doolittle WF, Kjelleberg S. Useof 16S rRNA and rpoB genes as molecular markers for microbial ecology.Appl Environ Microbiol. 2007;73(1):278–88. https://doi.org/10.1128/aem.01177-06.
13. Zhang Z, Qu Y, Li S, Feng K, Wang S, Cai W, et al. Soil bacterialquantification approaches coupling with relative abundances reflecting thechanges of taxa. Sci Rep. 2017;7(1):4837. https://doi.org/10.1038/s41598-017-05260-w.
Tkacz et al. Microbiome (2018) 6:110 Page 12 of 13
14. Vandeputte D, Kathagen G, D'Hoe K, Vieira-Silva S, Valles-Colomer M, SabinoJ, et al. Quantitative microbiome profiling links gut community variation tomicrobial load. Nature. 2017;551(7681):507–11. https://doi.org/10.1038/nature24460.
15. Stämmler F, Gläsner J, Hiergeist A, Holler E, Weber D, Oefner PJ, et al. Adjustingmicrobiome profiles for differences in microbial load by spike-in bacteria.Microbiome. 2016;4(1):28. https://doi.org/10.1186/s40168-016-0175-0.
16. Jiang L, Schlesinger F, Davis CA, Zhang Y, Li R, Salit M, et al. Synthetic spike-in standards for RNA-seq experiments. Genome Res. 2011;21(9):1543–51.https://doi.org/10.1101/gr.121095.111.
17. Risso D, Ngai J, Speed TP, Dudoit S. Normalization of RNA-seq data usingfactor analysis of control genes or samples. Nat Biotech. 2014;32(9):896–902.https://doi.org/10.1038/nbt.2931.
18. Hacquard S, Garrido-Oter R, González A, Spaepen S, Ackermann G, Lebeis S,et al. Microbiota and host nutrition across plant and animal kingdoms. CellHost Microbe. 2015;17(5):603–16. https://doi.org/10.1016/j.chom.2015.04.009.
19. Caporaso JG, Lauber CL, Walters WA, Berg-Lyons D, Huntley J, Fierer N, et al.Ultra-high-throughput microbial community analysis on the Illumina HiSeq andMiSeq platforms. ISME J. 2012;6(8):1621–4. https://doi.org/10.1038/ismej.2012.8.
20. van Hannen EJ, van Agterveld MP, Gons HJ, Laanbroek HJ. Revealinggenetic diversity of eukaryotic microorganims in aquatic environments bydenaturating gradient gel electrophoresis. J Phycol. 1998;34(2):206–13.https://doi.org/10.1046/j.1529-8817.1998.340206.x.
21. Cardinale M, Brusetti L, Quatrini P, Borin S, Puglia AM, Rizzi A, et al. Comparisonof different primer sets for use in automated ribosomal intergenic spaceranalysis of complex bacterial communities. Appl Environ Microbiol. 2004;70(10):6147–56. https://doi.org/10.1128/AEM.70.10.6147-6156.2004.
22. Buee M, Reich M, Murat C, Morin E, Nilsson RH, Uroz S, et al. 454pyrosequencing analyses of forest soils reveal an unexpectedly high fungaldiversity. New Phytol. 2009;184(2):449–56. doi:23.1111/j.1469–8137.2009.03003.x
23. French KE, Tkacz A, Turnbull LA. Conversion of grassland to arable decreasesmicrobial diversity and alters community composition. Appl Soil Ecol. 2017;110(Supplement C):43–52. doi: https://doi.org/10.1016/j.apsoil.2016.10.015
24. Tkacz A, Cheema J, Chandra G, Grant A, Poole PS. Stability and succession ofthe rhizosphere microbiota depends upon plant type and soil composition.ISME J. 2015;9(11):2349–59. https://doi.org/10.1038/ismej.2015.41.
25. Beringer JE. R factor transfer in Rhizobium leguminosarum. Microbiology.1974;84(1):188–98. https://doi.org/10.1099/00221287-84-1-188.
26. Poole PS, Blyth A, Reid CJ, Walters K. Myo-inositol catabolism and cataboliteregulation in Rhizobium leguminosarum bv. viciae. Microbiology. 1994;140:2787–95.
27. Turner TR, Ramakrishnan K, Walshaw J, Heavens D, Alston M, Swarbreck D, etal. Comparative metatranscriptomics reveals kingdom level changes in therhizosphere microbiome of plants. ISME J. 2013;7(12):2248–58. doi: 10.1038
28. Gohl DM, Vangay P, Garbe J, MacLean A, Hauge A, Becker A, et al.Systematic improvement of amplicon marker gene methods for increasedaccuracy in microbiome studies. Nat Biotech. 2016;34:942–9. doi: 10.1038
29. Edgar RC. UNOISE2: improved error-correction for Illumina 16S and ITSamplicon sequencing. bioRxiv. 2016;081257 https://doi.org/10.1101/081257.
30. Griffiths RI, Thomson BC, James P, Bell T, Bailey M, Whiteley AS. The bacterialbiogeography of British soils. Environ Microbiol. 2011;13(6):1642–54. https://doi.org/10.1111/j.1462-2920.2011.02480.x.
31. Acinas SG, Marcelino LA, Klepac-Ceraj V, Polz MF. Divergence andredundancy of 16S rRNA sequences in genomes with multiple rrn operons.J Bacteriol. 2004;186(9):2629–35.
32. Klappenbach JA, Dunbar JM, Schmidt TM. rRNA operon copy number reflectsecological strategies of bacteria. Appl Environ Microbiol. 2000;66(4):1328–33.
33. Vetrovsky T, Baldrian P. The variability of the 16S rRNA gene in bacterialgenomes and its consequences for bacterial community analyses. PLoSOne. 2013;8(2):e57923. https://doi.org/10.1371/journal.pone.0057923.
34. Herrera ML, Vallor AC, Gelfond JA, Patterson TF, Wickes BL. Strain-dependentvariation in 18S ribosomal DNA copy numbers in Aspergillus fumigatus. JClin Microbiol. 2009;47(5):1325–32. https://doi.org/10.1128/JCM.02073-08.
35. Kobayashi T, Heck DJ, Nomura M, Horiuchi T. Expansion and contraction ofribosomal DNA repeats in Saccharomyces cerevisiae: requirement ofreplication fork blocking (Fob1) protein and the role of RNA polymerase I.Genes Dev. 1998;12(24):3821–30.
36. Prokopowich C, Gregory T, Crease T. The correlation between rDNA copynumber and genome size in eukaryotes. Genome. 2003;46 https://doi.org/10.1139/g02-103.
37. Malik AA, Chowdhury S, Schlager V, Oliver A, Puissant J, Vazquez PG, et al.Soil fungal:bacterial ratios are linked to altered carbon cycling. FrontMicrobiol. 2016;7(1247) https://doi.org/10.3389/fmicb.2016.01247. (1994);140(10), 2787–2795. doi: https://doi.org/10.1099/00221287-140-10-2787
38. Leach JE, Triplett LR, Argueso CT, Trivedi P. Communication in the phytobiome.Cell. 2017;169(4):587–96. https://doi.org/10.1016/j.cell.2017.04.025.
39. Carini P, Marsden PJ, Leff JW, Morgan EE, Strickland MS, Fierer N. Relic DNAis abundant in soil and obscures estimates of soil microbial diversity. NatMicrobiol. 2016;2:16242. https://doi.org/10.1038/nmicrobiol.2016.242.
40. Poudel R, Jumpponen A, Schlatter DC, Paulitz TC, Gardener BB, Kinkel LL,Garrett KA. Microbiome networks: a systems framework for identifyingcandidate microbial assemblages for disease management. Phytopathology.2016;106(10):1083–96. https://doi.org/10.1094/phyto-02-16-0058-fi.
41. Gilbert JA, Quinn RA, Debelius J, Xu ZZ, Morton J, Garg N, et al.Microbiome-wide association studies link dynamic microbial consortia todisease. Nature. 2016;535(7610):94–103. https://doi.org/10.1038/nature18850.
42. Chang HX, Haudenshield JS, Bowen CR, Hartman GL. Metagenome-wideassociation study and machine learning prediction of bulk soil microbiomeand crop productivity. Front Microbiol. 2017;8(519) https://doi.org/10.3389/fmicb.2017.00519.
Tkacz et al. Microbiome (2018) 6:110 Page 13 of 13