absorbed doses to water for x-ray dosimetry on a pxi x-rad ... · ne2571 farmer-type ionization...
TRANSCRIPT

Technical document § 7
Absorbed doses to water for x-ray dosimetry on a PXI X-RAD 225
Part I – MeasurementsA technical document series for CERAD partners in support of
x-ray irradiation of cell cultures and mice.

Technical document nr. 7
Absorbed doses to water for x-ray dosimetry on a
PXI X-RAD 225
Part I – Measurements
A technical document series for CERAD partners in support of x-ray irradiation of cell cultures
and mice.
Report and analysis: Elisabeth Lindbo Hansen ([email protected])
Measurements: Ingrid Helen Ryste Hauge, Per Otto Hetland, Hans Bjerke
Statens Strålevern
Norwegian Radiation Protection Authority Østerås, 2015

Reference: Lindbo Hansen E. Absorbed doses to water for x-ray dosimetry on a PXI X-RAD 225. Teknisk dokument nr. 7. Østerås: Norwegian Radiation Protection Authority, 2015. Language: English. Key words: Dosimetry. X-ray. Depth dose distribution. Ionization chamber. Water phantom. Film. Uncertainty. Abstract: For a tube potential of 225 kV, current of 10 mA and source-to-surface distance (SSD) of 50 cm, the absorbed dose rate to water on the central field axis at a depth of 2 g/cm2 of water in the 21.0 cm×21.0 cm×11.5 cm water phantom was (1.16±0.02) Gy/min. The field diameter at this SSD was 23 cm and the absorbed dose rate to water near the surface of the phantom was calculated to (1.18±0.03) Gy/min.
Referanse: Lindbo Hansen E. Absorbed doses to water for x-ray dosimetry on a PXI X-RAD 225. Teknisk dokument nr. 7. Østerås: Statens strålevern, 2015. Språk: Engelsk Emneord: Dosimetri. Røntgen. Dybdedosefordeling. Ionisasjonskammer. Vannfantom. Film. Usikkerhet. Resymé:
For et rørpotensial på 225 kV, strøm på 10 mA og avstand fra kilde til overflate (SSD) på 50 cm var den absorberte doseraten til vann i strålefeltets sentralakse i en dybde på 2 g/cm2 vann i et 21.0 cm×21.0 cm×11.5 cm vannfantom (1.16±0.02) Gy/min. Feltdiameteren ved denne SSD’en var 23 cm og den absorberte doseraten til vann nær overflaten til fantomet ble beregnet til (1.18±0.03) Gy/min.
Prosjektleder: Åste Søvik. Godkjent:
Refseth Unn Hilde, avdelingsdirektør, avdeling overvåkning og forskning
21 sider. Publisert 2015-10-9. Statens strålevern, Postboks 55, No-1332 Østerås, Norge. Telefon 67 16 25 00, faks 67 14 74 07. E-post: [email protected] www.nrpa.no ISSN 2387-5240 (online)

Contents
Absorbed doses to water for x- ray dosimetry on a 1
PXI X- RAD 225 1
Part I – Measurements 1
1 Introduction 5
2 Summary of results 5
3 Theory and background 5
4 Materials and methods 6
4.1 The irradiation cabinet 6
4.2 The ionization chamber and the water phantom 6
4.3 Gafchromic EBT films 7
4.4 The central axis depth dose distribution 8
4.5 Uncertainty 9
5 Results and discussion 9
5.1 The mean measured accumulated charge at the reference depth on the beam axis 9
5.2 Calculated absorbed dose rates at the reference depth on the beam axis 11
5.3 Field size estimations with Gafchromic EBT film 13
5.4 Estimated absorbed dose rates near the surface of the water phantom on the beam axis 13
6 Recommendations and outlook 14
6.1 Quality control 14
6.2 Spectral measurements 14
6.3 Dosimetry for cell cultures and mice 15
7 Appendix 15
7.1 Evaluation of the error introduced by a non-standard HVL determination 15
7.2 Uncertainty budgets 17
7.3 Raw Gafchromic EBT image 18
8 Acknowledgements 19
9 References 19

1 Introduction
This report concerns measurements on a PXI X-RAD 225 (Precision X-ray Inc., North Branford, CT) [1] of the
absorbed dose to water at a depth of 2 g cm2⁄ of water in a 21.0 cm × 21.0 cm × 11.5 cm large water
phantom with poly(methyl methacrylate) (PMMA) walls. The measurements were performed with a
NE2571 Farmer-type ionization chamber traceable via a transfer ionization chamber to a calorimetric
primary standard for absorbed dose at the Physikalisch-Technische Bundesanstalt (PTB) [2]. The X-RAD 225
is a self-contained, single-focus x-ray irradiation system with available tube voltages from 5 to 225 kV
located at the Norwegian Institute of Public Health (NIPH). The measurements were performed by the
Secondary Standard Dosimetry Laboratory (SSDL) at the Norwegian Radiation Protection Authority (NRPA)
and the CERAD Center of Excellence in Environmental Radioactivity in May and September of 2014. The
purpose was to characterize the X-RAD 225 in terms of absorbed dose to water to support dose-effect
studies performed by CERAD partners from NRPA on cell cultures in Petri dishes. The measurements largely
follow the code of practice for medium-energy kilovoltage x-ray beams as defined by the International
Atomic Energy Agency (IAEA) in TRS-398 [3]. The lateral dimensions of the water phantom (21.0 cm ×
21.0 cm × 11.5 cm) relative to the extent of the field (23 cm at a set source-to-surface distance of 50 cm)
are however smaller than those recommended in TRS-398 [3] and the half-value layer (HVL) was
determined from measurements in a water phantom for a broad field rather than free-in-air for a collimated
beam. The error introduced by this is assessed in the appendix and accounted for in the reported results.
2 Summary of results
For a set potential of 225 kV, a set current of 10 mA and a set source-to-surface distance (SSD) of 50 cm,
the absorbed dose rate to water on the central field axis at a depth of 2 g cm2⁄ of water in the 21.0 cm ×
21.0 cm × 11.5 cm water phantom was found to be (1.16 ± 0.02) Gy min⁄ . Here the uncertainty is the
combined standard uncertainty. The beam was filtered through 0.80 mm Be (default) and 0.50 mm Cu
(optional). The field diameter at a set source-to-surface distance of 50 cm was found to be 23 cm. For this
field size, the absorbed dose rate to water near the surface of the phantom with a set source-to-surface
distance of 50 cm, is calculated via percentage depth dose distributions (PDDs) and tissue-air ratios (TARs)
in the literature [4, 5] to (1.18 ± 0.03) Gy min⁄ .
3 Theory and background
The current report concerns x-ray beams from a generating potential of 225 kV between a hot cathode and
a W anode. The maximal photon energy theoretically expected from such a setup is 225 keV. The potential
provides electrons with kinetic energies that are sufficient for ejection of electrons from inner shell orbitals
5

in W. Characteristic W x-ray lines, including the W K-lines at 58, 59, 67 and 69 keV [6], are therefore present
in the x-ray spectrum in addition to the continuous spectrum from bremsstrahlung events.
In the current setup, the beam undergoes filtering through 0.80 mm Be (default) and 0.50 mm Cu
(optional), corresponding to mass thicknesses of respectively 𝑥𝑥Be = 0.15 g cm2⁄ Be and 𝑥𝑥Cu = 0.45 g cm2⁄
Cu [7]. The mass thickness is the product of the thickness with the density of a material. The attenuation of
a narrow, collimated beam passing through a material is described by the equation
𝐼𝐼 = 𝐼𝐼0 exp(−(𝜇𝜇 𝜌𝜌⁄ )𝑥𝑥), (1)
where 𝐼𝐼 is the attenuated intensity, 𝐼𝐼0 the incident intensity and 𝜇𝜇 𝜌𝜌⁄ the mass attenuation coefficient [7].
When (𝜇𝜇 𝜌𝜌⁄ )𝑥𝑥 > 3.0, 𝐼𝐼 𝐼𝐼0 <⁄ 5.0%. For Cu, (𝜇𝜇 𝜌𝜌⁄ )Cu𝑥𝑥Cu > 3.0 at photon energies below roughly 30 to
40 keV [7]. About 95% or more of photons with energies below 30 to 40 keV are therefore removed from
a hypothetical narrow collimated beam by a 0.50 mm Cu filter. For a set potential of 225 kV and a filtering
of 0.50 mm Cu, the fluence weighted mean photon energy is expected to fall roughly in the range from 60
to 100 keV [8].
4 Materials and methods
4.1 The irradiation cabinet
The X-RAD 225 is a self-contained, single-focus x-ray irradiation system designed for use in research
laboratories [1]. The irradiation system uses a GE ISOVOLT TITAN 225 generator featuring a W anode. With
a focus spot size on the anode of 7.5 mm, the generator has available tube voltages from 5 to 225 kV, tube
currents from 0.1 to 45 mA, and exposure set times from 1 to 999 s or from 0.1 to 99.9 min. The maximum
tube current at maximum voltage is 13 mA, giving a tube power of 225 kV ∙ 13 mA = 2.9 kW. Higher
powers can result in the anode overheating. The safety interlock cabinet has a stainless steel interior, lead
shielding and a laminated steel exterior. A ceramic internal height shelf is used to adjust the source-to-
surface distance and features measurement notches with a 1 mm resolution. At a set source-to-surface
distance of 30.4 cm the field diameter is specified on the cabinet to be 15.7 cm, at 40.0 cm to be 20.7 cm
and at 50.0 cm to be 25.9 cm. These values are checked against Gafchromic EBT film measurements in a
later section, where it is found that the actual field diameter at a set source-to-surface distance of 50 cm is
23 cm. A filter holder is provided for optional beam hardening in addition to the inherent default filtration,
which is through 0.80 mm Be. In the current report, all measurements were made with a 0.50 mm Cu filter
in the filter holder.
4.2 The ionization chamber and the water phantom
A NE2571 Farmer-type ionization chamber in conjunction with a PMMA-enclosed water phantom was used
for measuring the absorbed dose to water at a reference depth of 𝑧𝑧𝑟𝑟𝑟𝑟𝑟𝑟 = 2 g cm2⁄ of water. The ionization
6

chamber has a cavity volume of 0.6 cm3, a cavity length of 24.0 mm and a cavity radius of 3.2 mm [3]. The
chamber wall is 0.065 g cm2⁄ of graphite and the central electrode 1.0 mm of Al [3].
The ionization chamber was coupled to a measuring assembly featuring an electrometer with a four-digit
or better resolution. The ionization chamber was inserted into a cylindrical cavity in the water phantom
whose wall thickness was 2 mm of PMMA. The outer dimensions of the water phantom were 21.0 cm ×
21.0 cm × 11.5 cm and the PMMA walls were 0.75 cm thick. The phantom was placed so that the
estimated center of the x-ray field was on the ionization chamber axis at the center of the cavity volume,
with this point being located at 𝑧𝑧𝑟𝑟𝑟𝑟𝑟𝑟 = 2 g cm2⁄ of water. In order to estimate the half-value layer, plates
of respectively 1.0, 1.5 and 2.0 mm Cu were placed on top of the water phantom. The half-value layer was
thus determined to be between 1.0 and 1.5 mm Cu, with roughly 1.3 mm Cu being the best estimate
obtained by interpolation. The error associated with this non-standard half-value layer determination is
assessed in the appendix, where it is found that the true half value layer lies closer to 1.0 than 1.5 mm Cu.
From the measured charge 𝑀𝑀 accumulated over time 𝑡𝑡, the absorbed dose rate to water is calculated as
�̇�𝐷𝑤𝑤 = �𝑁𝑁𝐷𝐷,𝑤𝑤 ∙ 𝑀𝑀 ∙ 𝑘𝑘𝑄𝑄 ∙ 𝑘𝑘𝜌𝜌� 𝑡𝑡⁄ . (2)
For the NE2571 chamber (serial number 3016), 𝑁𝑁𝐷𝐷,𝑤𝑤 = 4.519 ∙ 107 Gy C⁄ at the reference conditions of
𝑇𝑇0 = 20.0 Co (293.2 K) and 𝑃𝑃0 = 101.325 kPa [2]. The factors 𝑘𝑘𝑄𝑄 and 𝑘𝑘𝜌𝜌 provide corrections for deviations
in beam quality and air density from the reference conditions. Calculations of absorbed doses and dose
rates were performed with the aid of a TRS-398 associated spreadsheet for medium-energy kilovoltage x-
ray beams [3, 9]. Here 𝑘𝑘𝑄𝑄 is estimated from tabulated calibration data, interpolating between values of
𝑘𝑘𝑄𝑄 = 0.986 at a HVL of 0.82 mm Cu and 𝑘𝑘𝑄𝑄 = 1.000 at a HVL of 2.55 mm Cu for the specific chamber
utilized [2]. The correction factor for the air density is calculated as
𝑘𝑘𝜌𝜌 = (𝑇𝑇 ∙ 𝑃𝑃0) (𝑇𝑇0 ∙ 𝑃𝑃)⁄ , (3)
where (𝑇𝑇0,𝑃𝑃0) is the temperature (in K) and pressure at the reference conditions and (𝑇𝑇,𝑃𝑃) the
temperature and pressure at the measurement conditions. In the measurements the ambient air pressure
was 102.25 kPa, the temperature 23.3 Co (296.5 K) and the relative humidity about 50%.
4.3 Gafchromic EBT films
Gafchromic EBT films from Ashland/International Specialty Products (lot #37122-041) [10] were used to
estimate the extent of the field in the lateral directions perpendicular to the central beam axis. The films
were older than the expiration date recommended by the manufacturer (May, 2009) and were therefore
only used for relative assessments of the extent of the field. The exposed films were scanned in transmission
mode on an Epson V750 Pro. The net optical density for a pixel in the red channel was obtained as
𝑂𝑂𝐷𝐷𝑟𝑟,𝑛𝑛𝑟𝑟𝑛𝑛 = log10(𝐼𝐼 𝐼𝐼0⁄ ), (4)
7

where 𝐼𝐼 is the transmitted intensity for a pixel in the red channel and 𝐼𝐼0 the transmitted intensity for this
pixel in the red channel of an unexposed film [11, 12].
4.4 The central axis depth dose distribution
All measurements performed with an ionization chamber in the current report provide the absorbed dose
to water at a depth of 𝑧𝑧𝑟𝑟𝑟𝑟𝑟𝑟 = 2 g cm2⁄ of water. Extrapolation to absorbed doses at other depths and for
other geometries can be performed either experimentally, or via Monte Carlo radiation transport
simulations for example with Geant4 [13-15], which is a toolkit that is expected to perform well in the
current exposure scenario [16]. Preliminary estimates based on percentage depth dose distributions (PDDs)
and tissue-air ratios (TARs) in the literature [4, 5] are presented in the following chapters. It is assumed that
the only factors affecting the ratio of the absorbed dose to water near the surface to the absorbed dose to
water at the reference depth are the distance from the source (inverse square law), the attenuation of the
primary beam by the phantom, and the scatter from the phantom.
For the purpose of these calculations, field diameters are converted to equivalent square areas [5]. The
measured diameter of 23 cm at a set source-to-surface distance of 50 cm is thus converted to an equivalent
square area of between 20 cm × 20 cm and 22 cm × 22 cm [5]. The latter field dimensions coincide with
the borders of the water phantom. For a half-value layer of 1.0 mm Cu and a source-to-surface distance of
50 cm, the backscatter factor (BSF) for a 20 cm × 20 cm field, also known as the tissue-air ratio (TAR) at
zero depth, is 1.487 and the peak scatter factor (PSF), also known as the tissue-air ratio at the depth of
dose maximum, 1.589 [5]. The percentage depth dose at a depth of 𝑧𝑧𝑟𝑟𝑟𝑟𝑟𝑟 = 2 g cm2⁄ of water is 98.4%
when the source-to-surface distance is 50 cm and the dose profile is normalized to 100.0% near the surface
where 𝑧𝑧 = 𝑧𝑧0 = 0 [5]. The depth of dose maximum at the same conditions is estimated to occur at 𝑧𝑧 =
𝑧𝑧𝑚𝑚 = 1 g cm2⁄ of water with the absorbed dose to water at 𝑧𝑧𝑚𝑚 being 103.0% of the surface absorbed dose
[5].
Formulae exist for conversion of percentage depth doses between different source-to-surface distances
[5]. In particular, given a known percentage depth dose 𝑃𝑃𝐷𝐷𝐷𝐷(𝑧𝑧, 𝑆𝑆𝑆𝑆𝐷𝐷1, 𝑆𝑆 𝐹𝐹⁄ ) at the depth 𝑧𝑧 for a given
source-to-surface distance 𝑆𝑆𝑆𝑆𝐷𝐷1, the percentage depth dose at the same depth but another source-to-
surface distance 𝑆𝑆𝑆𝑆𝐷𝐷2 and surface field size 𝑆𝑆 can be calculated as [5]
𝑃𝑃𝐷𝐷𝐷𝐷(𝑧𝑧, 𝑆𝑆𝑆𝑆𝐷𝐷2,𝑆𝑆) = 𝑃𝑃𝐷𝐷𝐷𝐷(𝑧𝑧, 𝑆𝑆𝑆𝑆𝐷𝐷1,𝑆𝑆 𝐹𝐹⁄ ) ∙ (𝑃𝑃𝑆𝑆𝐹𝐹(𝑆𝑆 𝐹𝐹⁄ ) 𝑃𝑃𝑆𝑆𝐹𝐹(𝑆𝑆)⁄ ) ∙ 𝐹𝐹𝑆𝑆2, (5)
where
𝐹𝐹 = ((𝑆𝑆𝑆𝑆𝐷𝐷1 + 𝑧𝑧) 𝑆𝑆𝑆𝑆𝐷𝐷1⁄ ) ∙ (𝑆𝑆𝑆𝑆𝐷𝐷2 (𝑆𝑆𝑆𝑆𝐷𝐷2 + 𝑧𝑧)⁄ ) (6)
and
𝐹𝐹𝑆𝑆 = ((𝑆𝑆𝑆𝑆𝐷𝐷1 + 𝑧𝑧) (𝑆𝑆𝑆𝑆𝐷𝐷1 + 𝑧𝑧0)⁄ ) ∙ ((𝑆𝑆𝑆𝑆𝐷𝐷2 + 𝑧𝑧0) (𝑆𝑆𝑆𝑆𝐷𝐷2 + 𝑧𝑧)⁄ ). (7)
8

4.5 Uncertainty
Uncertainty involves both sample statistics and the estimation of population parameters. In the following,
the sample mean 𝑋𝑋� of 𝑁𝑁 measures 𝑋𝑋𝑖𝑖 is calculated as [17]
𝑋𝑋� = (1 𝑁𝑁⁄ )∑ 𝑋𝑋𝑖𝑖𝑁𝑁1 , (8)
and the sample standard deviation 𝑠𝑠𝑁𝑁 as [17]
𝑠𝑠𝑁𝑁 = �(1 𝑁𝑁⁄ )∑ (𝑋𝑋𝑖𝑖 − 𝑋𝑋�)2𝑁𝑁1 . (9)
If the sample was drawn from a population then the sample estimate for the population mean 𝜇𝜇 is obtained
as [17, 18]
�̂�𝜇 = 𝑋𝑋�, (10)
and the sample estimate for the population standard deviation 𝜎𝜎 as [17, 18]
𝜎𝜎� = �(𝑁𝑁 (𝑁𝑁 − 1)⁄ ) ∙ 𝑠𝑠𝑁𝑁. (11)
According to the central limit theorem, the sample estimate for the population mean is itself a normally
distributed random variable with mean �̂�𝜇 and standard deviation 𝜎𝜎� √𝑁𝑁⁄ [18]. The result of 𝑁𝑁 measures 𝑋𝑋𝑖𝑖
may therefore be reported as [18, 19]
�̂�𝜇 ± 𝜎𝜎� √𝑁𝑁⁄ , (12)
where 𝜎𝜎� √𝑁𝑁⁄ is the standard uncertainty of the sample estimate of the population mean.
Uncertainty budgets for the calculation of the absorbed dose at the reference depth of 𝑧𝑧𝑟𝑟𝑟𝑟𝑟𝑟 = 2 g cm2⁄ of
water and near the surface of the phantom are presented in the appendix.
5 Results and discussion
5.1 The mean measured accumulated charge at the reference depth on the beam axis
The results of measurements with the ionization chamber at the reference depth of 𝑧𝑧𝑟𝑟𝑟𝑟𝑟𝑟 = 2 g cm2⁄ of
water in the phantom are presented in Table 1. The set voltage, current and exposure time are user inputs
to the irradiation system. The set distance was the distance to the phantom surface as measured on the
ruler in the x-ray cabinet. The mean measured accumulated charge was calculated from minimally three
repeated measurements at each set point.
Table 1: Mean measured accumulated charge at different set exposure conditions at the reference depth of
𝑧𝑧𝑟𝑟𝑟𝑟𝑟𝑟 = 2 g cm2⁄ of water. The ambient air pressure was 102.25 kPa, the temperature 23.3 Co and the
9

relative humidity about 50%. The set distance was the distance to the phantom surface as measured on the
ruler in the x-ray cabinet. The uncertainty is the standard uncertainty (equation (12)).
Set voltage Set current Set exposure time Set distance Mean measured accumulated charge
[kV] [mA] [s] [cm] [nC]
225 13 60 30 84.51 ± 0.01
225 13 30 30 41.96 ± 0.02
225 13 30 35 32.03 ± 0.01
225 13 30 40 25.12 ± 0.01
225 13 30 45 20.31 ± 0.01
225 13 30 50 16.646 ± 0.005
225 10 30 50 12.790 ± 0.009
225 7 30 50 8.924 ± 0.008
225 4 30 50 5.085 ± 0.011
225 1 30 50 1.2512 ± 0.0002
225 0.1 30 50 0.2232 ± 0.0002
The measurements for fixed conditions but varying exposure times (see Table 1) indicate a timer offset of
0.4 s, so that a set exposure time of e.g. 30 s corresponds to an actual beam-on exposure estimated to
29.6 s. The timer offset is consistent with the 1 s timer resolution of the X-RAD 225 system, although the
uncertainty on the mean measured accumulated charge indicates that the precision on the exposure time
is higher but featuring the determined offset. The offset on the set source-to-surface distance relative to
the effective distance from the surface to the source focus was found to be −2 cm (see Figure 1), so that a
set distance of e.g. 50 cm corresponds to an effective source-to-surface distance of 52 cm.
10
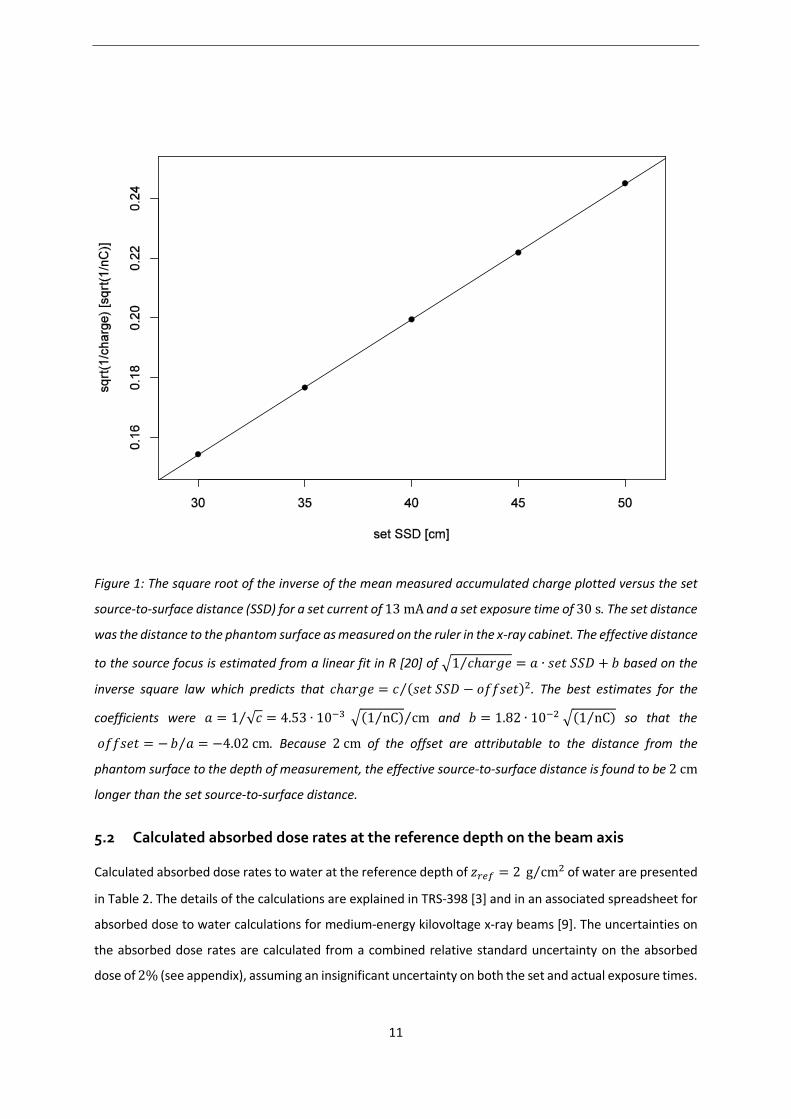
Figure 1: The square root of the inverse of the mean measured accumulated charge plotted versus the set
source-to-surface distance (SSD) for a set current of 13 mA and a set exposure time of 30 s. The set distance
was the distance to the phantom surface as measured on the ruler in the x-ray cabinet. The effective distance
to the source focus is estimated from a linear fit in R [20] of �1 𝑐𝑐ℎ𝑎𝑎𝑎𝑎𝑎𝑎𝑎𝑎⁄ = 𝑎𝑎 ∙ 𝑠𝑠𝑎𝑎𝑡𝑡 𝑆𝑆𝑆𝑆𝐷𝐷 + 𝑏𝑏 based on the
inverse square law which predicts that 𝑐𝑐ℎ𝑎𝑎𝑎𝑎𝑎𝑎𝑎𝑎 = 𝑐𝑐 (𝑠𝑠𝑎𝑎𝑡𝑡 𝑆𝑆𝑆𝑆𝐷𝐷 − 𝑜𝑜𝑜𝑜𝑜𝑜𝑠𝑠𝑎𝑎𝑡𝑡)2⁄ . The best estimates for the
coefficients were 𝑎𝑎 = 1 √𝑐𝑐⁄ = 4.53 ∙ 10−3 �(1 nC⁄ ) cm⁄ and 𝑏𝑏 = 1.82 ∙ 10−2 �(1 nC⁄ ) so that the
𝑜𝑜𝑜𝑜𝑜𝑜𝑠𝑠𝑎𝑎𝑡𝑡 = −𝑏𝑏 𝑎𝑎⁄ = −4.02 cm. Because 2 cm of the offset are attributable to the distance from the
phantom surface to the depth of measurement, the effective source-to-surface distance is found to be 2 cm
longer than the set source-to-surface distance.
5.2 Calculated absorbed dose rates at the reference depth on the beam axis
Calculated absorbed dose rates to water at the reference depth of 𝑧𝑧𝑟𝑟𝑟𝑟𝑟𝑟 = 2 g cm2⁄ of water are presented
in Table 2. The details of the calculations are explained in TRS-398 [3] and in an associated spreadsheet for
absorbed dose to water calculations for medium-energy kilovoltage x-ray beams [9]. The uncertainties on
the absorbed dose rates are calculated from a combined relative standard uncertainty on the absorbed
dose of 2% (see appendix), assuming an insignificant uncertainty on both the set and actual exposure times.
11
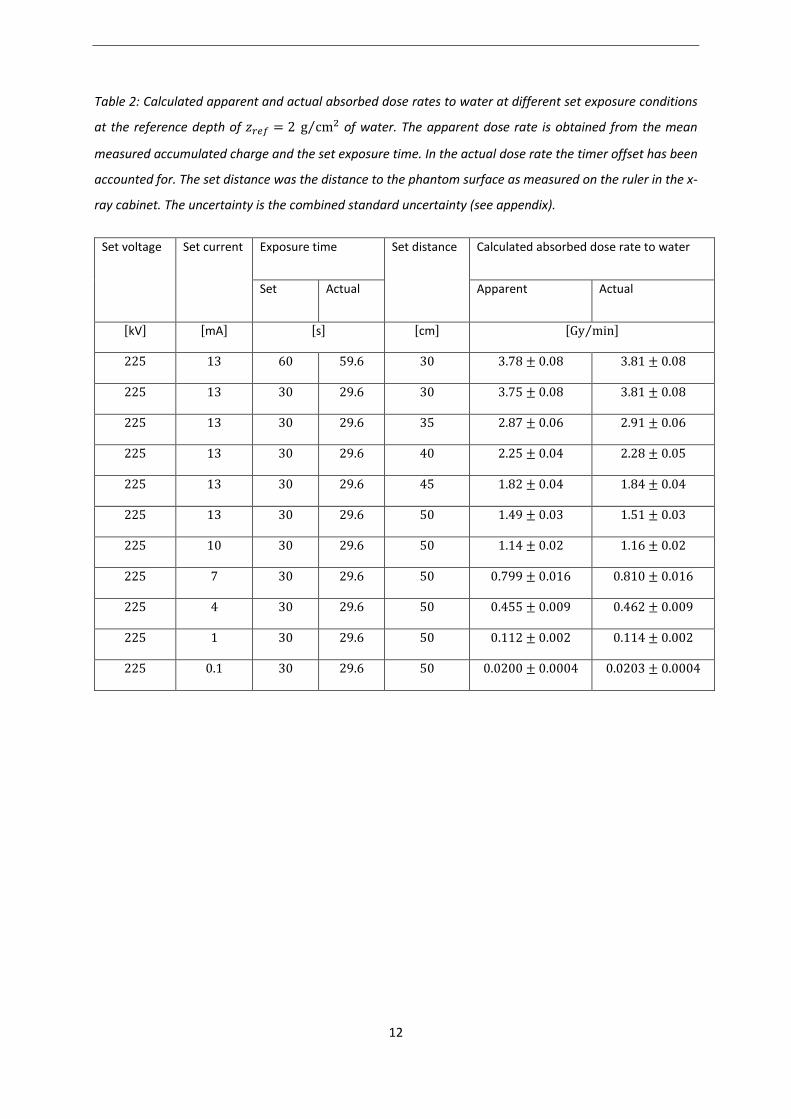
Table 2: Calculated apparent and actual absorbed dose rates to water at different set exposure conditions
at the reference depth of 𝑧𝑧𝑟𝑟𝑟𝑟𝑟𝑟 = 2 g cm2⁄ of water. The apparent dose rate is obtained from the mean
measured accumulated charge and the set exposure time. In the actual dose rate the timer offset has been
accounted for. The set distance was the distance to the phantom surface as measured on the ruler in the x-
ray cabinet. The uncertainty is the combined standard uncertainty (see appendix).
Set voltage Set current Exposure time Set distance Calculated absorbed dose rate to water
Set Actual Apparent Actual
[kV] [mA] [s] [cm] [Gy min⁄ ]
225 13 60 59.6 30 3.78 ± 0.08 3.81 ± 0.08
225 13 30 29.6 30 3.75 ± 0.08 3.81 ± 0.08
225 13 30 29.6 35 2.87 ± 0.06 2.91 ± 0.06
225 13 30 29.6 40 2.25 ± 0.04 2.28 ± 0.05
225 13 30 29.6 45 1.82 ± 0.04 1.84 ± 0.04
225 13 30 29.6 50 1.49 ± 0.03 1.51 ± 0.03
225 10 30 29.6 50 1.14 ± 0.02 1.16 ± 0.02
225 7 30 29.6 50 0.799 ± 0.016 0.810 ± 0.016
225 4 30 29.6 50 0.455 ± 0.009 0.462 ± 0.009
225 1 30 29.6 50 0.112 ± 0.002 0.114 ± 0.002
225 0.1 30 29.6 50 0.0200 ± 0.0004 0.0203 ± 0.0004
12

Figure 2: Calculated actual absorbed dose rate to water at a depth of 𝑧𝑧𝑟𝑟𝑟𝑟𝑟𝑟 = 2 g cm2⁄ of water versus the
set current for a set source-to-surface distance (SSD) of 50 cm and a set exposure time of 30 s. A linear fit
in R [20] of 𝑎𝑎𝑏𝑏𝑠𝑠𝑜𝑜𝑎𝑎𝑏𝑏𝑎𝑎𝑎𝑎 𝑎𝑎𝑜𝑜𝑠𝑠𝑎𝑎 𝑎𝑎𝑎𝑎𝑡𝑡𝑎𝑎 = 𝑎𝑎 ∙ 𝑐𝑐𝑐𝑐𝑎𝑎𝑎𝑎𝑎𝑎𝑐𝑐𝑡𝑡 + 𝑏𝑏 gives best estimates for the coefficients of 𝑎𝑎 = 1.16 ∙
10−1 (Gy min⁄ ) mA⁄ and 𝑏𝑏 = 1.47 ∙ 10−3 Gy min⁄ .
5.3 Field size estimations with Gafchromic EBT film
Gafchromic EBT films from Ashland/International Specialty Products (lot #37122-041) [10] were used to
estimate the extent of the field in the lateral directions perpendicular to the central beam axis at a set
source-to-surface distance of 50 cm. The field diameter at this source-to-surface distance was found to be
23 cm, with the net optical density across the field being within 90% of the maximum optical density
around the central field. The field was found to be well approximated as flat in a 7 cm diameter circular
area around the central field axis. A scan of one of the films is shown in the appendix.
5.4 Estimated absorbed dose rates near the surface of the water phantom on the beam
axis
Absorbed dose rates to water near the surface of the water phantom can be estimated from percentage
depth dose distributions (PDDs) and tissue-air ratios (TARs) in the literature [4, 5]. The first step is to convert
13

tabulated percentage depth dose distributions for a source-to-surface distance of 50 cm [5] with the help
of equations (5-7) to depth dose distributions for a source-to-surface distance of 52 cm. The percentage
depth dose at a depth of 𝑧𝑧𝑟𝑟𝑟𝑟𝑟𝑟 = 2 g cm2⁄ of water for a source-to-surface distance of 50 cm of 98.4% for
a half-value layer of 1.0 mm Cu, is thus converted to a percentage depth dose for a source-to-surface
distance of 52 cm of 98.7%. The dose profile is still normalized to 100.0% at the surface where 𝑧𝑧 = 𝑧𝑧0 =
0 [5]. The resulting absorbed dose rates to water near the surface of the water phantom for a set source-
to-surface distance of 50 cm are reported in Table 3 for set tube currents of 13, 10, 7 and 4 mA.
Table 3: Estimated actual absorbed dose rates to water at the reference depth in the phantom and near the
surface of the phantom. The total absorbed dose can be calculated as the actual exposure time multiplied
with the actual dose rate. The uncertainty is the combined standard uncertainty (see appendix).
Set voltage Set current Exposure time Set distance Calculated actual dose rate
Set Actual At the reference
depth
Near the phantom
surface
[kV] [mA] [s] [cm] [Gy min⁄ ]
225 13 30 29.6 50 1.51 ± 0.03 1.53 ± 0.04
225 10 30 29.6 50 1.16 ± 0.02 1.18 ± 0.03
225 7 30 29.6 50 0.810 ± 0.016 0.82 ± 0.02
225 4 30 29.6 50 0.462 ± 0.009 0.468 ± 0.013
6 Recommendations and outlook
6.1 Quality control
Quality control is necessary for all scientific equipment. For the PXI X-RAD 225, a quality control system
should be established for periodic measurements of a dose or radiometric quantity in a well-defined
reference setup. The measurements should involve a standards-traceable protocol.
6.2 Spectral measurements
The error associated with a non-standard half-value layer determination has been assessed in the appendix
and accounted for in the reported results. For a more detailed characterization of the system and to support
radiation transport simulations it is recommended that equipment for spectral characterization could be
invested in. Some possible options are differently shielded passive integrating dosimeters [21] or
sufficiently small double pinhole collimated semiconductor detectors, such as CdTe detectors [22].
14

6.3 Dosimetry for cell cultures and mice
The purpose of the current work has been to characterize the X-RAD 225 in terms of absorbed dose to water
to support dose-effect studies performed by CERAD partners from NRPA on cell cultures in Petri dishes.
Special considerations necessary for the exposure of cell cultures will be discussed in a separate report. A
third report will deal with exposures of mice.
7 Appendix
7.1 Evaluation of the error introduced by a non-standard HVL determination
A simplified Geant4 [13-15] model of the irradiation cabinet was built to investigate the error introduced
by a non-standard determination of the half-value layer (HVL). The model was used to simulate the specific
energy imparted to water at 1 versus 2 g cm2⁄ of water, and to simulate the actual measurements of the
half-value layer (in poor geometry) and ideal measurements of the half-value layer (in good geometry). For
the poor geometry simulations, Cu sheets of varying thickness were placed on top of a 21.0 cm ×
21.0 cm × 11.5 cm large water phantom and the specific energy tallied to water at 2 g cm2⁄ of water. In
the good geometry simulations, two lead collimators narrowed the beam and the specific energy was tallied
to a block of lead placed free in air. All simulations were performed with the G4EmStandardPhysics_option4
physics list, with a geometrically realistic but monoenergetic beam diverging from the source focus. The
simulated water had a density of 1.00 g cm3⁄ and a mean excitation energy of 78 eV.
Validation runs at a monoenergetic exposure of 80 keV reproduced the measured data at 2 g cm2⁄ of
water with good accuracy across the relevant range of effective distances to the source focus. Data from
Tables 4 and 5 demonstrate that the ratio of the mean simulated specific energy imparted to water at 1
relative to 2 g cm2⁄ of water for photons of energy 80 keV corresponds well with tabulated data for x-rays
beams with a half-value layer of 1.0 mm of Cu [5]. The variability of this ratio across the range from 40 to
200 keV, which covers the expected spectrum of the x-rays in the actual exposures after the beam-
hardening Cu filter, is relatively small.
In Tables 4 and 5, it is found that the non-standard determination of the half-value layer in poor geometry
overestimates this quantity. This tendency is least pronounced at the lowest simulated beam energy of
40 keV where photoelectric absorption constitutes 93% of the total attenuation cross section in Cu [23],
and most pronounced at 200 keV where photoelectric absorption makes up 22% of the total attenuation
cross section and incoherent (Compton) scattering dominates [23]. In an actual broad beam exposure, this
means that a Cu filter hardens a soft beam by selectively absorbing at the lower energies but can soften a
hard beam by contributing a dose from lower energy photons scattered into the detecting volume. The
ratio of the half-value layer simulated for a broad beam and poor geometry exposure to that calculated for
an ideal exposure ranges from 1.1 at 40 keV to 1.2 at 80 keV and 1.7 at 200 keV. The simulations therefore
15

indicate that the half-value layer of 1.3 mm Cu estimated from the poor geometry measurements
corresponds to a half-value layer which for a good geometry setup would be closer to 1.0 than to 1.5 mm
Cu.
Table 4: Data for 1 ∙ 109 simulated photons at the specified energies for sensitive detectors of dimensions
10.0 mm × 10.0 mm × 4.00 mm, having volumes of 0.400 cm3 of water at a density of 1.00 g cm3⁄ . The
volumes were located on the central axis of a 21.0 cm × 21.0 cm × 11.5 cm large water phantom placed
at an effective distance from the surface to the source focus of 50.00 cm. The uncertainty on the simulated
ratio of dose quantities is the standard uncertainty (equation (12)) obtained from a Type A statistical
evaluation.
Energy Ratio of dose quantities at 1 cm
versus 2 cm depth
HVL
Simulated Tabulated, for a
HVL of 1.0 mm Cu
(from [5])
Simulated,
poor
geometry
Simulated,
good
geometry
Theoretically, good
geometry (from
[23])
[keV] [1] [1] [mm Cu]
80 1.046 ± 0.002 1.05 1.2 1.1 1.0
Table 5: Data for 1 ∙ 109 simulated photons at the specified energies for sensitive detectors of dimensions
10.0 mm × 10.0 mm × 4.00 mm, having volumes of 0.400 cm3 of water at a density of 1.00 g cm3⁄ . The
volumes were located on the central axis of a 21.0 cm × 21.0 cm × 11.5 cm large water phantom placed
at an effective distance from the surface to the source focus of 52.02 cm. The uncertainty on the simulated
ratio of dose quantities is the standard uncertainty (equation (12)) obtained from a Type A statistical
evaluation.
Energy Ratio of dose quantities at 1 cm
versus 2 cm depth
HVL
Simulated Simulated,
poor
geometry
Theoretically, good
geometry (from
[23])
[keV] [1] [mm Cu]
40 1.123 ± 0.006 0.17 0.16
80 1.036 ± 0.004 1.2 1.0
200 1.058 ± 0.005 8.7 5.0
16

7.2 Uncertainty budgets
Tables 6 and 7 present uncertainty budgets for the determination of absorbed dose to water at the
reference depth in water and near the surface of the water phantom.
Table 6: Uncertainty budget for the absorbed dose to water at 2 g cm2⁄ of water.
Quantity or procedure Relative standard uncertainty
[%]
𝑁𝑁𝐷𝐷,𝑤𝑤 ∙ 𝑘𝑘𝑄𝑄0 calibration of NE2571 Farmer chamber at PSDL [2] 1.1
Long term stability of NE2571 Farmer chamber 0.2
Establishment of reference conditions during measurement [3] 1.0
Correction for influence quantities 𝑘𝑘𝜌𝜌 [3] 0.8
Beam quality correction 𝑘𝑘𝑄𝑄 [3] 1.0
Combined relative standard uncertainty 2.0
In section 5.4, the percentage depth dose at a depth of 𝑧𝑧𝑟𝑟𝑟𝑟𝑟𝑟 = 2 g cm2⁄ of water for a source-to-surface
distance of 50 cm of 98.4% for a half-value layer of 1.0 mm Cu, was converted to a percentage depth dose
for a source-to-surface distance of 52 cm of 98.7%. For half-value layers of 0.5, 1.5 or 2.0 mm Cu, this
value is respectively 93.5%, 99.6% or 99.2% [5]. Taking into account that the non-standard determination
of the half-value layer in the measurements introduces an error which was corrected for in the previous
section of the appendix, the best estimate for the true half value layer is 1.0 mm Cu. Assuming a rectangular
distribution for the probability of the percentage depth dose at 𝑧𝑧𝑟𝑟𝑟𝑟𝑟𝑟 = 2 g cm2⁄ of water falling in the
interval from 93.5% to 99.6%, the estimated relative standard uncertainty on the absorbed dose near the
surface of the phantom from uncertain percentage depth dose distributions becomes 1.9% [25]. This is a
conservative estimate.
Table 7: Uncertainty budget for the absorbed dose to water near the surface of the phantom.
Quantity or procedure Relative standard uncertainty
[%]
Determination of the absorbed dose to water at 2 g cm2⁄ of water 2.0
Percentage depth dose distributions from tabulated rather than actual data 1.9
Combined relative standard uncertainty 2.8
17

7.3 Raw Gafchromic EBT image
Figure 3: Raw Gafchromic EBT image showing the field relative to the marks present on the irradiation shelf
in the cabinet.
18

8 Acknowledgements
This work was partly supported by the Research Council of Norway through its Centers of Excellence funding
scheme, project number 223268/F50.
9 References
1. Precision X-Ray, X-RAD 225 Series. [cited 02/10/2014], http://pxinc.com/products/cabinet-
irradiators/x-rad-225-series/
2. PTB, Calibration Certificate for NE2571 ionization chamber with serial number 3016, Calibration
mark PTB 60037-10: Braunschweig (2010).
3. IAEA, Absorbed Dose Determination in External Beam Radiotherapy: An International Code of
Practice for Dosimetry based on Standards of Absorbed Dose to Water. IAEA TRS-398 (2006).
4. R. Hill, Z. Mo, M. Haque, and C. Baldock, An evaluation of ionization chambers for the relative
dosimetry of kilovoltage x-ray beams. Med. Phys. 36 (9), 3971 (2009).
5. E.G.A. Aird, J.E. Burns, M.J. Day, S. Duane, T.J. Jordan, A. Kacperek, S.C. Klevenhagen, R.M.
Harrison, S.C. Lillicrap, A.L. McKenzie, W.G. Pitchford, J.E. Shaw, and C.W. Smith, Central Axis Depth Dose
Data for Use in Radiotherapy. British Journal of Radiology Supplement 25 (1996).
6. R.D. Deslattes, E.G. Kessler Jr., P. Indelicato, L. de Billy, E. Lindroth, J. Anton, J.S. Coursey, D.J.
Schwab, C. Chang, R. Sukumar, K. Olsen, and R.A. Dragoset, X-ray Transition Energies (version 1.2),
National Institute of Standards and Technology: Gaithersburg, MD (2005).
7. J.H. Hubbell and S.M. Seltzer, Tables of X-Ray Mass Attenuation Coefficients and Mass Energy-
Absorption Coefficients (version 1.4), National Institute of Standards and Technology: Gaithersburg, MD
(2004).
8. F. Verhaegen, A.E. Nahum, S.V.d. Putte, and Y. Namito, Monte Carlo modelling of radiotherapy kV
x-ray units. Phys. Med. Biol. 44 (7), 1767 (1999).
9. IAEA, Dosimetry Codes of Practice and Spreadsheets. [cited 27/05/2014], http://www-
naweb.iaea.org/nahu/DMRP/codeofpractice.html
10. Ashland, Gafchromic radiotherapy films. [cited 02/10/2014],
http://www.ashland.com/products/gafchromic-radiotherapy-films
11. A. Mauring, Radiokromisk film for kontroll av strålefelt: Protokoll for praktisk bruk og behandling
av GafChromic EBT til dosimetriformål innen stråleterapi, in Strålevernsrapport, Statens Strålevern:
Østerås (2009).
19

12. M.J. Butson, P.K.N. Yu, T. Cheung, and P. Metcalfe, Radiochromic film for medical radiation
dosimetry. Mat. Sci. Eng. R 41 (3–5), 61 (2003).
13. S. Agostinelli, et al., Geant4 - a simulation toolkit. Nucl. Instr. Meth. Phys. Res. A 506 (3), 250
(2003).
14. J. Allison, et al., Geant4 developments and applications. IEEE Trans. Nucl. Sci. 53 (1), 270 (2006).
15. S. Incerti, et al., Comparison of GEANT4 very low energy cross section models with experimental
data in water. Med. Phys. 37 (9), 4692 (2010).
16. C.C. Guimarães, M. Moralles, and E. Okuno, Performance of GEANT4 in dosimetry applications:
Calculation of X-ray spectra and kerma-to-dose equivalent conversion coefficients. Radiat. Meas. 43 (9–
10), 1525 (2008).
17. C. Rose and M.D. Smith, Mathematical Statistics with Mathematica. Springer Texts in Statistics.
New York: Springer-Verlag (2002).
18. J.L. Devore and K.N. Berk, Modern Mathematical Statistics with Applications. 2nd ed. Springer
Texts in Statistics, ed. G. Casella, et al., New York: Springer-Verlag (2012).
19. BIPM, IEC, IFCC, ILAC, ISO, IUPAC, IUPAP, and OIML, Evaluation of measurement data - Guide to
the expression of uncertainty in measurement (GUM 1995 with minor corrections), in JCGM 100 (2008).
20. R.C. Team, R: A language and environment for statistical computing. http://www.R-project.org/
21. R. Nolte, R. Behrens, M. Schnürer, A. Rousse, and P. Ambrosi, A TLD-Based Few-Channel
Spectrometer for X-Ray Fields with High Fluence Rates. Radiat. Prot. Dosim. 84 (1-4), 367 (1999).
22. AMPTEK, CdTe Application Note: Characterization of X-ray Tubes. [cited 25/03/2015],
http://www.amptek.com/cdte-application-note-characterization-of-x-ray-tubes/
23. M.J. Berger, J.H. Hubbell, S. Seltzer, M., J. Chang, J.S. Coursey, R. Sukumar, D.S. Zucker, and K.
Olsen, XCOM: Photon Cross Sections Database (version 1.5), National Institute of Standards and
Technology: Gaithersburg, MD (2010).
20

ISSN 2387-5240
www.stralevernet.no twitter.com/Straalevernet facebook.com/Straalevernet