abstract dissertation: enabling rapid phenotypic detection …
TRANSCRIPT
ABSTRACT
Title of Dissertation: ENABLING RAPID PHENOTYPIC
DETECTION OF CEPHALOSPORIN
RESISTANCE BEYOND THE CENTRAL
LABORATORY
Hieu Thuong Nguyen
Doctor of Philosophy
2019
Dissertation directed by: Associate Professor Ian White
Fischell Department of Bioengineering
The so-called bacterial “superbugs” are largely resistant to some of the most
commonly prescribed antibiotics, including a drug class known as cephalosporins
used to treat many hospital and community-acquired infections. This major public
health threat has been acknowledged for decades by the Centers for Disease Control
(CDC) as a major concern; yet, the detection of superbugs has not been made routine
since standard testing practices have been limited to specialized “central” laboratories
with sophisticated yet bulky and expensive equipment and highly trained personnel.
As a result, the lack of simpler testing methods that can be used in everyday clinics
and doctor’s offices can be viewed as a source of error contributing to incorrect
antibiotic treatment and poorer patient outcomes, factors that drive even more
advanced resistance, depleting our drugs or last resort.
In this dissertation, we explore new strategies for simplified methods to test
for cephalosporin resistance in order to give higher accessibility in the timely
detection of superbugs to support the improvement of patient care. To do this, we take
an organic chemistry and biochemical approach to develop new detection molecules
that report resistance activity in bacteria expressing extended-spectrum β-lactamase
(ESBL) enzymes, one of the most prolific resistance strategies used by superbugs.
Next, we describe methods of integrating these detection molecules into practical
testing methods, and detail the engineering of simpler assays that allow for rapid
readout of ESBL phenotypes using commonplace laboratory plate readers, portable
Raman devices, and even handheld personal glucose meters (used for diabetes
monitoring) purchased from the drugstore.
ENABLING RAPID PHENOTYPIC DETECTION OF CEPHALOSPORIN
RESISTANCE BEYOND THE CENTRAL LABORATORY
by
Hieu Thuong Nguyen
Dissertation submitted to the Faculty of the Graduate School of the
University of Maryland, College Park, in partial fulfillment
of the requirements for the degree of
Doctor of Philosophy
2019
Advisory Committee:
Associate Professor Ian White, Chair
Professor Philip DeShong
Professor Peter Kofinas
Professor Daniel Stein
Professor William Bentley

© Copyright by
Hieu Thuong Nguyen
2019

ii
Dedication
To all those who have ever suffered or lost at the hands of incurable disease.
iii
Acknowledgements
To my advisors, Professors Ian White and Philip DeShong for their mentorship,
wisdom, and encouraging visions that provide light to my callow eyes;
To Dr. Imaly Nanayakkara, for her continued support, companionship, and MATLAB
wizardry to produce a few beautiful figures and schematics (Figs. 3.13, 5.6, 5.7); And
the rest of the White Noise for their unbridled willingness to help;
To undergraduate student Connor Hall, for his helpful assistance in performing SERS
experiments and analyses (Figs. 5.8, 5.9);
To Dr. David Watts, for his insightful analyses of MS data and chemical substrate
characterization (Fig. 3.8, Appendices 2 and 3);
To Dr. Shweta Ganapati, for her contributions to chemical characterization
(Appendix 1);
To my dear Friends with jobs who occasionally sponsor my leisure out of pity but are
always fierce in their belief in my potential;
To my siblings, for their empathy; To my mother, for listening;
I give my deepest gratitude.
iv
Table of Contents
Dedication ..................................................................................................................... ii Acknowledgements ...................................................................................................... iii Table of Contents ......................................................................................................... iv List of Tables .............................................................................................................. vii
List of Figures ............................................................................................................ viii List of Abbreviations .................................................................................................... x Chapter 1: Introduction ................................................................................................. 1
1.1 Overview ............................................................................................................. 1
1.2 Public health implications ................................................................................... 6 1.3 Management efforts and stewardship ................................................................. 7
Chapter 2: Background ............................................................................................... 10 2.1 Βeta-lactam antibiotics ...................................................................................... 10
2.1.1 Brief history of Cephalosporins ................................................................. 10
2.1.2 Mode of action ........................................................................................... 11 2.1.3 Classes of β-lactams ................................................................................... 13
2.1.4 Clinical use................................................................................................. 17 2.2 Βeta-lactamase enzymes ................................................................................... 21
2.2.1 Molecular mechanism ................................................................................ 21
2.2.2 ESBL producers ......................................................................................... 23 2.2.3 Classification.............................................................................................. 25
2.2.4 Classical origins of ESBL .......................................................................... 26
2.3 Genetic detection of ESBL ............................................................................... 30
2.3.1 Genetics and evolution of ESBL................................................................ 30 2.3.2 Genetic methods of antibiotic resistance detection .................................... 34
2.3.3 Considerations in the genetic detection of ESBL in Gram negatives ........ 37 2.4 Phenotypic detection of ESBL .......................................................................... 37
2.4.1 Clinical and Laboratory Standards Institute (CLSI) Laboratory Guidelines.
............................................................................................................................. 37 2.4.2 Gold standard techniques for ESBL determination ................................... 39
2.4.3 Newer methods in phenotypic detection .................................................... 42 2.5 Enzymology ...................................................................................................... 48
2.5.1 Motivation .................................................................................................. 48 2.5.2 Rationale .................................................................................................... 49 2.5.3 Modeling .................................................................................................... 50
Chapter 3: Design and synthesis of ESBL detection substrates ................................. 52 3.1. Rational design of detection substrates ............................................................ 52
3.2 Reaction mechanisms........................................................................................ 57 3.2.1 Nucleophilic substitution (SN2 reaction) ................................................... 57 3.2.2. Finkelstein exchange. ................................................................................ 57
3.3 Synthesis of Cep-glucose: Reaction schemes and spectral verification ........... 58 3.3.1 Cep-glucose synthesis scheme ................................................................... 58
3.4 Cep-glucose substrate-enzyme kinetic studies with ESBL ............................... 61
v
3.4.1. Lineweaver-Burke kinetic determination ................................................. 62 3.4.2 Mass spectroscopy on reaction products .................................................... 62
3.4.3. Functional specificity studies. ................................................................... 66 3.5. Synthesis schemes of SERS-active reporters ................................................... 68
3.5.1. Cep-pNTP ................................................................................................. 68 3.5.2. Cep-diNTP ................................................................................................ 70
3.6 Conclusions ....................................................................................................... 72
3.6.1 Future work: Establishing chemistries for easier, higher yield production of
more detection substrates with tuned specificity. ............................................... 72 3.6.2 Future work: Oxidation of the Cephem starting material. ......................... 73
Chapter 4: Cep-glucose, a trimodal detection substrate.............................................. 74 4.1 Introduction ....................................................................................................... 74
4.2 Materials and Methods ...................................................................................... 77
4.2.1 Reagents and solutions. .............................................................................. 77 4.2.2 New ESBL detection substrate: Cep-glucose ............................................ 78
4.2.3 Apparatus. .................................................................................................. 78
4.2.4 Colorimetric assay with Ellman’s reagent. ................................................ 79 4.2.5. Fluorimetric assay with Amplex red reagent. ........................................... 79 4.2.6 Electrochemical assay via HRP enzyme inhibition by thiols .................... 79
4.3 Results and Discussion ..................................................................................... 80 4.3.1. Synthesis, verification, and characterization of Cep-glucose detection
substrate. ............................................................................................................. 80 4.3.2 Fluorimetric detection. ............................................................................... 84 4.3.3 Electrochemical detection by sulfide inhibition. ....................................... 87
4.3.4 Electrochemical detection of ESBL using Cep-glucose in a commercially
available personal glucose monitor (PGM) ........................................................ 90 4.3.5 Detection of ESBL-producing E. coli. ....................................................... 92
4.4 Conclusion ........................................................................................................ 94
4.4.1. Future work: Optimizing HRP activity. .................................................... 95 4.4.2 Future work. Detection using commercial personal glucose meter. .......... 95
Chapter 5: Cep-pNTP and Cep-diNTP, SERS-active reporters................................. 96 5.1 Introduction ....................................................................................................... 96
5.1.1. Raman spectroscopy. ................................................................................ 97
5.1.2 Surface enhancement. ................................................................................ 99 5.1.3 Multiplexing. ............................................................................................ 102 5.1.4. Schemes for ESBL and non-ESBL distinguishing substrates................. 104
5.2 Experimental ................................................................................................... 106 5.2.1 Absorbance colorimetry. .......................................................................... 106
5.2.2 Measurement by SERS ............................................................................ 106 5.2.3 Multiplex detection of ESBL and non-ESBL with SERS ....................... 106
5.3 Results ............................................................................................................. 107 5.3.1 Dose-response behavior of SERS-active reporter release. ...................... 107 5.3.2 Comparative spectra for multiplex analysis. ............................................ 109
5.4. Conclusion ..................................................................................................... 113 Chapter 6: Conclusion.............................................................................................. 116
6.1: Summary of findings ..................................................................................... 116
vi
6.2: Contributions to the field and potential impact ............................................. 116 6.2.1. Potential for direct impact on patient outcome ....................................... 116
6.2.2. Potential impacts on public health .......................................................... 117 6.2.3. Supporting higher accessibility to healthcare ......................................... 118
6.3: Future work .................................................................................................... 119 6.3.1. Studies with mock matrices .................................................................... 119 6.3.2. Studies with live bacteria ........................................................................ 119
6.3.3. Studies with clinical human samples. ..................................................... 119 6.3.4. Furthering SERS based multiplex detection ........................................... 119 6.3.5. Ultra-convenient and pervasive resistance detection .............................. 120
Appendices ................................................................................................................ 122 Bibliography ............................................................................................................. 149
vii
List of Tables
Table 2.1. An abridged table comparison of Amber and Bush ESBL
classifications…...……………………………………………………………………26
Table 4.1. Experimental and control results of PGM detection of ESBL with Cep-
glucose……………………………………………………………………………….91 Table 5.1. Comparative signature peak ratios for pNTP and diNTP SERS-active
reporters…………………………………………………………………………….103
Table 5.2. Ratiometric calculations of diagnostic peak heights corresponding to
pNTP and diNTP reporters following enzymatic cleavage………….……………..113
viii
List of Figures
Figure 2.1. Schematic of beta-lactamase activity against beta-lactam antibiotics that
inhibit Gram negative bacterial cell wall synthesis .....................................................13
Figure 2.2. Chemical structures of β-lactams and related compounds .......................16
Figure 2.3. Chromogenic cephalosporin substrates for phenotypic detection ............45
Figure 3.1. Cephem ring, structure, and positional numbering...................................52
Figure 3.2. Electronic rearrangement within the cephem core structure following ring
opening via nucleophilic attack, resulting in the expulsion of leaving group X ..........53
Figure 3.3. Antibiotics of different generations and their side chains corresponding to
synthesized detection substrates ..................................................................................55
Figure 3.4. Finkelstein exchange for lower-temperature alternative synthesis ...........57
Figure 3.5. Synthesis scheme and product ratios of the PMB-protected Cep-glucose
substrate (PMB-Cep-glucose) ......................................................................................59
Figure 3.6. Synthesis of Cep-glucose (Compound 3) from PMB-Cep-glucose
(Compound 1) ..............................................................................................................60
Figure 3.7. Lineweaver-Burke curve to obtain enzyme-substrate kinetics for ESBL
and the Cep-glucose substrate ......................................................................................61
Figure 3.8. Biochemical schematic representing ESBL cleavage, formation of the
ring-opened intermediate, and spontaneous release of thioglucose .............................64
Figures 3.9a-d. LC-MS analysis of the reaction between cep-glucose and ESBL at t =
1h..................................................................................................................................65
Figures 3.10a-d. LC-MS analysis of the reaction between cep-glucose and ESBL at t
= 16h ............................................................................................................................66
Figure 3.11. The Cep-glucose substrate is not cleaved by TEM-1, a non-ESBL .......67
Figure 3.12. The Cep-glucose substrate is cleaved by the commercial ESBL blend. 68
Figure 3.13. Plate reader absorbance kinetics monitoring Ellman’s reagent as a
function of time to verify the release of pNTP from Cep-pNTP in the presence of
ESBL and TEM-1 ........................................................................................................69
Figure 3.14. Synthesis scheme for Cep-diNTP ...........................................................71
Figure 3.15. Showing visually observable color change upon addition of TEM-1 or
ESBL in the presence of Ellman’s reagent ..................................................................72
Figure 3.16. (Synthetic plan) Oxidation of the starting material with the use of
mCPBA ........................................................................................................................73
Figure 4.1 Our Cep-glucose detection substrate releases glucose as a trimodal
reporter of ESBL-mediated resistance activity ............................................................76
Figure 4.2. Schematic for the colorimetric detection of ESBL ...................................82
Figures 4.3.A&B. Colorimetric dose-response timecourse and endpoint detection of
ESBL using the Cep-glucose substrate ........................................................................84
Figure 4.4. Schematic for the fluorimetric detection of ESBL ...................................85
Figs. 4.5.A&B. Fluorimetric dose-response timecourse and endpoint detection of
ESBL using the Cep-glucose substrate .................................................................. 86-87
Figure 4.6. Assay scheme for HRP-inhibitory electrochemical detection ..................87
Figures 4.7.A&B. Electrochemical detection of ESBL using Cep-glucose substrate 89
Figure 4.8. Colorimetric signal change for Cep-glucose with cultured E. coli that
produces SHV-4 ESBL ................................................................................................93
ix
Figure 5.1. Jablonski diagram representing quantum energy transitions for Rayleigh
and Raman scattering ...................................................................................................98
Figure 5.2. Comparative SERS spectral overlay of pNTP and diNTP .....................103
Figure 5.3. Cep-pNTP substrate which represents a second-generation cephalosporin
is hydrolyzed by ESBL ..............................................................................................104
Figure 5.4. Cep-diNTP substrate can be hydrolyzed by both a non-ESBL classical β-
lactamase (TEM-1) and ESBL ...................................................................................105
Figure. 5.5. Cep-diNTP is cleaved by ESBL (10 mU/mL) and releases diNTP .......108
Figure 5.6. Dose-response behavior of Cep-pNTP substrate with increasing amounts
of ESBL concentration ...............................................................................................109
Figure 5.7. SERS can distinguish ESBL from non-ESBL TEM-1 through use of Cep-
pNTP and Cep-diNTP substrates ...............................................................................110
Figure 5.8. SERS spectra from both substrates with ESBL ......................................111
Figure 5.9. SERS spectra from both substrates with TEM-1 non-ESBL ..................112
x
List of Abbreviations
AMR: antimicrobial resistant
AST: antibiotic susceptibility testing
CDC: Centers for Disease Control and Prevention
Cep-glucose: cephalosporin detection substrate releasing glucose signaling molecule
Cep-diNTP: cephalosporin detection substrate releasing diNTP reporter molecule
Cep-pNTP: cephalosporin detection substrate releasing pNTP reporter molecule
CFU: colony forming unit
CLSI: Clinical Laboratory Standards Institute
CV: cyclic voltammetry or cyclic voltammagram
DDST: disk diffusion susceptibility test
diNTP: 2,4-dinitrothiophenol
DNA: deoxyribonucleic acid
DTNB: Ellman’s reagent (5,5'-dithio-bis-[2-nitrobenzoic acid])
EDTA: Ethylenediaminetetraacetic acid
ESBL: extended-spectrum beta-lactamase
ESI-MS: electrospray ionization-mass spectrometry
GOx: glucose oxidase
HGT: horizontal gene transfer
HIV: human immunodeficiency virus
HPLC: high performance liquid chromatography
HRP: horseradish peroxidase
IR: infrared (spectroscopy)
IVD: in vitro diagnostic
LCR: ligase chain reaction
LC-MS: liquid chromatography-mass spectrometry
MBL: metallo-beta-lactamase
MIC: minimum inhibitory concentration
MS: mass spectrometry
NAG: N-acetylglucosamine
NAM: N-acetylmuramic acid
NMR: nuclear magnetic resonance
PBP: penicillin binding protein
PCR: polymerase chain reaction
PCR-RFLP: polymerase chain reaction restriction fragment length polymorphism
PCR-SSCP: polymerase chain reaction single-strand conformation polymorphism
PGM: personal glucose meter
POC: point-of-care
pNTP: para-nitrothiophenol
RT: real-time
RXN: reaction (chemical)
SNP: single nucleotide polymorphism
SERS: surface-enhanced Raman spectroscopy
UV-vis: ultraviolet visible (spectrophotometry)

1
Chapter 1: Introduction
1.1 Overview
Antimicrobial resistance (AMR) to β-lactam compounds poses a critical and
mounting challenge in the treatment of community and hospital acquired infections.
The Centers for Disease Control and Prevention (CDC) listed extended-spectrum β-
lactamase (ESBL) producing Enterobacteriaceae as one of the biggest threats in its
2013 Antimicrobial Resistance Threats Report.1,2 Though enumerated under “serious
threats,” ESBL pathogens are a direct evolutionary forerunner of carbapenem-
resistant Enterobacteriaceae, declared as an “urgent threat” to public health. The
etiology of resistant cases lies largely in Gram negative Enterobacteriaceae which
produce and disseminate plasmid-encoded enzymes capable of hydrolyzing β-lactam
antibiotics which range from older (-cillins) to more advanced (cephalosporins,
carbapenems). Incorrect antibiotic treatment not only leads to poor patient outcomes,
but also places selective pressure on the pathogen, driving AMR advancement.
Therefore, timely and accurate testing is crucial for good patient outcomes and for
safeguarding public health.
As recommended by the Clinical and Laboratory Standards Institute (CLSI), the
current standard in antimicrobial susceptibility testing (AST) relies on bacterial
culture (disk diffusion susceptibility test, Etest, broth dilution).3 Results require days-
long turnaround; in cases of sepsis, this timeline can prove to be too long, giving the
clinician no choice but to administer advanced β-lactams of last resort despite
2
antibiotic stewardship recommended guidelines.4 The need for faster reporting has led
to the adoption of four US FDA-approved automated systems that can produce
susceptibility results in the range of 3.5 hours to overnight: MicroScan WalkAway
(Siemens Healthcare Diagnostics), BD Phoenix Automated Microbiology System
(BD Diagnostics), Vitek 2 System (bioMérieux), and Sensititre ARIS 2X (Trek
Diagnostic Systems).5 These high-throughput systems measure minimum inhibitory
concentration (MIC) either by colorimetric, turbidimetric, or fluorometric means,
with a variable time-to-result for each readout method depending on the pathogen. In
the case of the MicroScan WalkAway, fluorogenic substrates are used to test Gram
negative susceptibility, and have a generally faster turnaround time (3.5-7 hours) than
turbidimetric end-point measurement for general AMR pathogens (4.5-18 hours).
Genotypic tests (ESBL Array, Check-Points) may also provide resistance
confirmation, but require more involved sample preparation than simple broth
inoculation, and are typically reserved for cases with discrepant phenotypic test
results. Furthermore, as genotypic methods are designed to detect single nucleotide
polymorphisms (SNPs), the established testing repertoire has been limited to the TEM
and SHV families of ESBLs, and only include a small handful of CTX-M variants.6
Though TEM and SHV evolutionary expansion via SNPs represents a large portion of
enzyme mutations that are conducive to resistance,7 sequencing efforts are far from
fully encompassing the widening scope of this rapidly evolving gene.
Rapid phenotypic tests including acidimetric and iodometric methods exist as
convenient, quick indicators of β-lactamase presence by way of color-change
3
readouts. The acidimetric test relies on the generation of a carboxylic acid from the
hydrolyzed β-lactam, which acidifies unbuffered systems, and methodologies to
measure the resultant pH change have been reported in the literature using aqueous
phenol red in a tube format or bromocresol purple in the form of strips.8 The
iodometric test is limited to the detection of penicillinase activity, as it relies on the
production of penicilloic acid to reduce iodine which changes color when in complex
with starch.9 Though rapid, there exists a critical tradeoff: these tests are susceptible
to producing false positives as reduction of iodine and solution acidification are
highly subject to variabilities in sample and environment, often causing them to occur
nonspecifically;10 furthermore, the β-lactamase enzymes detected by these methods
do not encompass the broad- or extended-spectrum genetic permutations whose
ascertainment is currently of crucial clinical and public health consequence.10
As more refined specificity is required to categorically identify a pathogen as ESBL-
positive and differentiate from penicillinase-only producers, several β-lactam derived
chromogenic compounds (Nitrocefin, pyridine‐2‐azo‐p‐dimethylaniline cephalosporin
(PADAC), CENTA) have previously been described as “reporters” or “sensors” of
the resistance phenotype, to better serve as effective detection substrates in the study
of ESBL activity.11,12 Nitrocefin has been established as a clinical laboratory test, and
is rapidly hydrolyzed by a range of β-lactamases upon incubation with bacterial
isolates from overnight culture. Single colonies are placed in a tube containing a
buffered solution of Nitrocefin, or dropped onto paper disks impregnated with the
compound in a commercial product marketed under the name Nitrocef Disks (Hardy
4
Diagnostics). Uncleaved Nitrocefin is visually observable as a yellow color and has
an optical absorbance peak at 390 nm, a spectral property that would preliminarily
indicate a β-lactamase-negative sample due to the apparent lack of enzymatic activity.
In the presence of β-lactamase capable of cleaving early-generation cephalosporins,
the amide bond of the β-lactam ring in Nitrocefin is hydrolyzed, producing an
observable red color change and optical absorbance peak shift to 486 nm from 389
nm at neutral pH, which can be measured spectrophotometrically using a sufficiently
sensitive absorbance reader to quantify a given β-lactamase-positive sample. Since
single colonies positive for β-lactamase would generally produce copious amounts of
the enzyme, especially if grown in selective media containing inducing factors, the
absorbance shift can be expected to be visually observable without instrumentation as
a yellow to red color change within 5 minutes. In recommended protocols, access of
the detection substrate to β-lactamase is further enhanced by CFU concentration via
centrifugation, and by cell wall disruption via sonication.13 However, Nitrocefin and
CENTA are generally cleavable by most β-lactamases, and therefore do not
distinguish a given isolate explicitly as an ESBL producer.
Commercially available resistance testing agar plates containing multiple
chromogenic substrates (chromID ESBL, CHROMagar ESBL, bioMérieux;
Brilliance ESBL, Oxoid) can provide a convenient format for culling more specific
resistance information.14 Single colonies from a pre-cultured sample are streaked onto
the plates and incubated overnight; specific color change in each colony occurs
depending on the combination of different chromogens liberated in the process of
5
bacterial growth and metabolism. This can provide identifying information by
narrowing down to groups of putative bacterial species based on the enzyme producer
profile (e.g., earlier generation β-lactamases producers, gluconuridase producers,
galactosidase producers). More specific ESBL determination can be performed in
plates additionally supplemented with specific cephalosporin antibiotics (e.g.,
cefpodoxime, cefepime) in addition to Nitrocefin. Though these methods can
determine specific resistance information, each with their own set of advantages, they
all require extended culture times.
As fluorescence measurement is generally accepted to have higher sensitivities than
chromogens, which rely on absorbance spectrophotometry, the development of
fluorogenic ESBL substrates has expanded the phenotypic detection repertoire with
the promise of lower limits of detection.15–20 They include substrates that have been
designed to release well-characterized coumarins upon specific cleavage by advanced
ESBLs including metallo-β-lactamases (MBLs), an improvement on substrates unable
to distinguish β-lactamases with extended-spectrum profiles from narrow-spectrum.21
Yet, as previously described methodologies require the specialization of a central
microbiology lab facility, resistance testing away from equipped central labs, such as
in disadvantaged regions, remains an underserved goal. Electrochemical readouts of a
redox-active reporter have the potential to meet this paradigm, as demonstrated by the
handheld personal glucose meter (PGM). Recently the PGM has been re-envisioned
and implemented as a handheld reader for general in vitro diagnostics (IVD) beyond
6
blood glucose biomarkers.22,23 Biomedical research groups have engineered schemes
incorporating a variety of materials into pathways to ultimately produce glucose for
endpoint quantitation; this has been described for DNA aptamer-based HIV
diagnostics as well as detection of contaminants such as melamine in milk.24,25
Amperometric measurements of hydrolyzed Nitrocefin have also been reported in the
literature, with the aim toward rapid detection of ESBL activity using disposable
screen-printed sensors with small sample volumes to enable robust, field-portable
instrumentation.26
1.2 Public health implications
Numerous public health organizations such as the Centers for Disease Control and
Prevention (CDC), World Health Organization (WHO), Infectious Diseases Society
of America (IDSA) have declared the rapid emergence of resistant bacteria to be a
major “crisis”, describing the situation in such dire terms as a “nightmare scenario”
that has potentially “catastrophic consequences”. As we are now in a “post-antibiotic
era” as declared by the CDC in 2013, several other agencies including the Institute of
Medicine and federal Interagency Task Force on Antimicrobial Resistance have
evaluated that multidrug resistance is an impending threat to both public health and
national security for the United States. The antibiotic pipeline has in essence “dried
up” since the 1980s, starving the medical field of new resources to continually battle
the rising threat of multidrug resistance. Having decreased steadily over last 3
decades, with 30 new antibiotics developed between the years of 1980-1989 dropping
to a mere seven new drugs between 2000-2009, this divestment is hugely attributed to
7
the low economic appeal that fails to yield worthwhile returns for many large
companies in the pharmaceutical industry. Other discouraging factors include the
larger challenges posed by the smaller market of Gram negative pathogens, as they
more rapidly acquire resistance phenotypes and are therefore more unpredictable (in
contrast with more widespread and slowly evolving Gram positive methicillin-
resistant Staphylococcus aureus). These considerations paired with regulatory
approval barriers prove to be a major disincentivizing obstacle to even more
optimistic companies.
Maintenance of proper antimicrobial stewardship through judicious use of our
remaining antibiotics serves as one of the most implementable strategies available.
Overuse or inappropriate prescribing of antibiotics is currently the main driver in the
evolution of resistance: incorrect treatment occurs in 30-50% of cases (either by
choice of agent or duration of therapy),4 and up to 60% of antibiotics prescribed in
intensive care units have been determined to be unnecessary, inappropriate, or
suboptimal.5 Subtherapeutic or subinhibitory administration promotes evolution of
resistance genes by way of mutagenesis, horizontal gene transfer (HGT), or altered
gene expression, leading to bacterial strain diversification.
1.3 Management efforts and stewardship
Currently, management strategies for the ongoing antibiotic resistance crisis have
been generally two-fold: revitalization of antimicrobial drug discovery programs by
the pharmaceuticals industry, and implementation of public initiatives through
support by the European Commission27 (ND4BB, or “New Drugs for Bad Bugs”) and

8
Infectious Diseases Society of America28 (10x’20 Initiative). Though new drugs have
reached advanced stages in the development pipeline, general consensus maintains
emphasis on antibiotic stewardship programs that mandate behavioral practices for
control and reduction of resistant pathogens: surveillance, infection control, and
selection of optimal therapeutic combinations and dosing regimens. The rapid
detection of ESBL at the point-of-care can strengthen antimicrobial stewardship not
only by aiding in treatment measures in the case of susceptible pathogen detection,
but also contribute surveillance data for Antibiogram-assisted resistance incidence
tracking and monitoring.29 The CDC has published guidelines to be taken every time
antibiotics are prescribed:30
1) Order recommended cultures before antibiotics are given and start drugs
promptly.
2) Make sure indication, dose, and expected duration are specified in the
patient record.
3) Reassess within 48 hours and adjust Rx if necessary or stop Rx if indicated.
Results from culture-based follow-up testing can later confirm initial rapid-test
readouts, as well as determine MIC; however, there are yet two considerations:
standard clinical practices typically recommend administering the highest effective
dose that is still physiologically safe for the patient, rendering MIC determinations
under this dose generally irrelevant; and culture based in vivo testing is not always

9
able to predict resistance/ susceptibility patterns in the patient, posing an added
challenge.31
Ultimate goals of this work. The assay methodologies described in the current work
can be conceived as future ex vivo clinical tests as they aims to directly interrogate
bacteria within patient samples. Further, in addition to directly impacting patient
health outcomes and contributing to public health assessment in positive ways, the
present work aims to bring rapid antibiotic resistance testing out of highly specialized
central laboratories and into standard laboratories found in hospitals, clinics, and
doctor’s offices. Ultimately, the work aims to bring rapid resistance testing to any
low-resource setting such as underserved communities or even geographically
isolated regions without complete access to healthcare facilities, through
compatibility engineering of our assays for the implementation of portable equipment
such as store-bought personal blood glucose monitors or portable SERS devices.
10
Chapter 2: Background
2.1 Βeta-lactam antibiotics
2.1.1 Brief history of Cephalosporins
Once considered a medical blessing, the first β-lactam antibiotics eventually fell to
newly emerging strains of resistance-harboring bacteria. Newer generation β-lactams
known as cephalosporins were developed to have broad-spectrum bactericidal
properties while also having lower toxicity and allergenicity. However, the
conundrum to their popularity also lay in their broad targeting scope: these antibiotics
had differential efficacies against bacteria, exerting evolutionary pressure that
selected for resistant organisms and drove their overgrowth and diversification.
Among common pathogens that have been selected, some constitutively possess a
lower degree of resistance to cephalosporins, but may develop into more broadly
resistant mutants that are capable of secondary transfer into other species. One such
example is Pseudomonas aeruginosa, whose enhanced resistance commonly arises
from treatment with oral cephalosporins (namely ceftriaxone or ceftazidime)
prescribed for urinary tract infection, and can transfer plasmid-encoded ESBL
capacity into Enterobacteriaceae.32
Overgrowth, or increased population densities of potentially pathogenic bacteria,
occurring in multiply resistant strains can be especially troublesome in the hospital
environment.31 The majority of patients and healthy individuals given cephalosporins
develop enterococcal overgrowth in the gastrointestinal tract due to the drug’s
disproportionate microbicidal effect on other bacterial species. This disruption of the
11
microbiome—caused more often by cephalosporins than other antibiotic types—can
result in associated diarrhea and colitis, clinical diseases often attributed to
Clostridium difficile overgrowth. Though treatment options include vancomycin,
metronidazole, or a combination of both, a high frequency of treatment failures has
been documented.31 As a result, C. difficile has gained widespread notoriety due to
costly and debilitating hospital outbreaks, with incidences on the rise in the UK over
the last decade. As the association of cephalosporins and C. difficile has been well
established, treatment restrictions put in place in clinical practice have already
reduced the incidence of C. difficile cases among the elderly.33,34 This modified
practice strategy has proven successful in reducing deleterious repercussions of
cephalosporin use, epitomizing improved clinical stewardship. We therefore posit that
a more informed practice enabled by a timely resistance test can further improve the
resolution of treatment on a case-by-case basis, zeroing in on instances that
necessitate last resort administration.
2.1.2 Mode of action
The β-lactam class of antibiotics exert their antibacterial effects through the inhibition
of bacterial cell wall synthesis.35 They interrupt the transpeptidation process that links
individual peptidoglycan components of the cell wall together. The bacterial cell wall
is a highly complex, rigid structure whose main building block is peptidoglycan, a
molecule composed of sugars and amino acids. Chains of peptidoglycan are cross-
linked to form tight, mesh-like networks outside the plasma membrane and serve to
maintain cell shape by counterbalancing the high internal osmotic pressure. The rigid
12
sugar-based glycan component consists of chains of alternating N-acetylmuramic acid
(NAM), to which a short, three- to five- amino acid chain is attached, and N-
acetylglucosamine (NAG).36 Crosslinking occurs between these short peptides in
adjacent glycan chains to yield the structural lattice that forms the cell wall.
Specialized bacterial enzymes known as penicillin binding proteins (PBPs) are
essential transpeptidases that catalyze the crosslinking reaction by recognizing the D-
Ala-D-Ala motif of the short peptides attached to NAM. As β-lactams have high
steric similarity to the D-Ala-D-Ala motif, they can act as a substrate due to their
resultant high affinity to PBPs.37 Upon binding to PBPs, β-lactams exert their
antibiotic action acylating the PBPs to form an irreversible covalent bond, thereby
inactivating their cross-linking ability and arresting cell wall synthesis. Meanwhile,
autolytic restructuring enzymes present in bacteria continue to degrade the cell wall,
causing membrane permeability and a consequent shift in osmotic pressure that
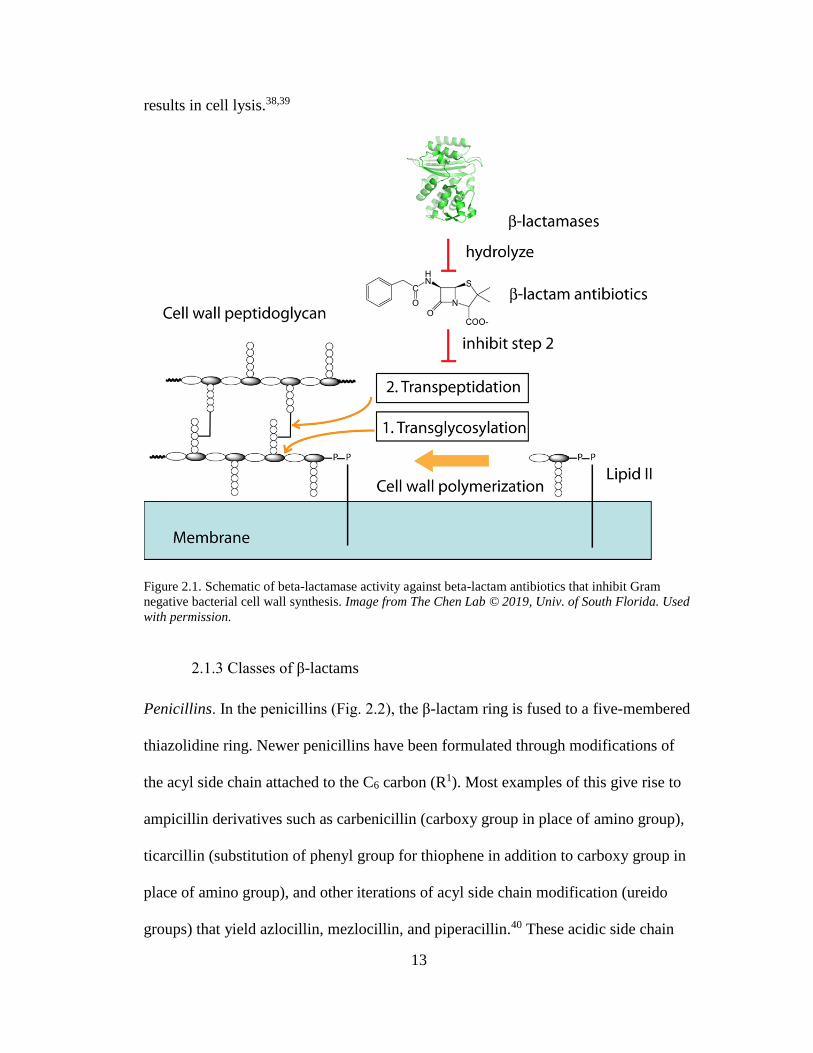
13
results in cell lysis.38,39
Figure 2.1. Schematic of beta-lactamase activity against beta-lactam antibiotics that inhibit Gram
negative bacterial cell wall synthesis. Image from The Chen Lab © 2019, Univ. of South Florida. Used
with permission.
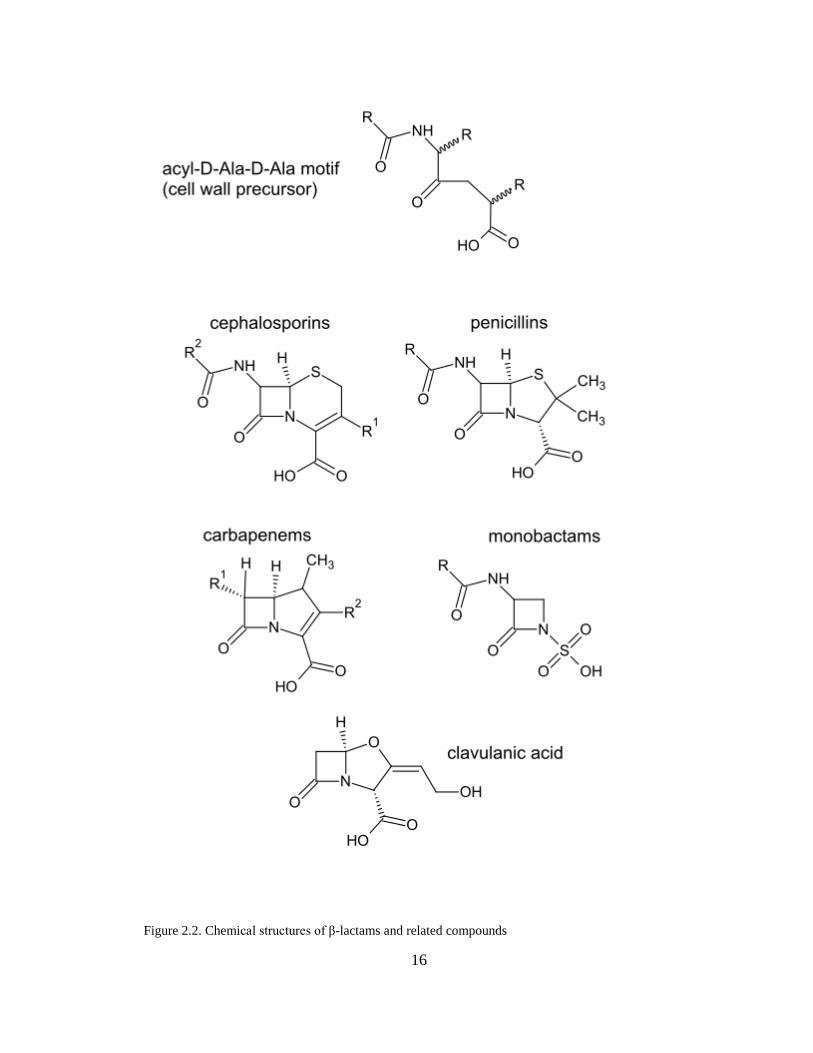
2.1.3 Classes of β-lactams
Penicillins. In the penicillins (Fig. 2.2), the β-lactam ring is fused to a five-membered
thiazolidine ring. Newer penicillins have been formulated through modifications of
the acyl side chain attached to the C6 carbon (R1). Most examples of this give rise to
ampicillin derivatives such as carbenicillin (carboxy group in place of amino group),
ticarcillin (substitution of phenyl group for thiophene in addition to carboxy group in
place of amino group), and other iterations of acyl side chain modification (ureido
groups) that yield azlocillin, mezlocillin, and piperacillin.40 These acidic side chain
14
substitutions in carbenicillin and ticarcillin decrease binding to PBPs of S. faecalis,
and therefore are less effective against the pathogen; however antibiotics of the latter
modifications have greater binding affinities to PBPs as well as increased penetration
into the cell walls of Gram negative rods including Pseudomonas aeruginosa thereby
giving them greater effectiveness overall.
Cephalosporins. Cephalosporins (Fig. 2.2) have a β-lactam ring fused to a six-
membered dihydrothiazine ring. The cephalosporin nucleus is inherently more
resistant to β-lactamase hydrolysis than that of penicillins, making it the next iteration
in the advancement of the β-lactam antibiotics after the spread of penicillin resistance,
especially among Staphylococcus aureus and E. coli. There is also greater drug
development potential in the cephalosporins because of a greater number of
therapeutically important modification sites: the 1-position sulfur, 7-position carbon
directly or via its acyl group, and the 3-position carbon.41–45
Carbapenems. This class of β-lactam antibiotics is marked by its resistance to
hydrolytic inactivation by β-lactamases, and maintain their inhibitory mode of action
by reacting with the active-site serine residue to form a long-lived acyl-enzyme
intermediate.46,47 The structure of carbapenems (Fig. 2.2) consists of a β-lactam ring
fused to a penicillin-like five-membered ring that has a carbon replacing the sulfur at
C-1, and also possesses a double bond between C-2 and C-3. Their small size allows
greater penetrability through Gram negative bacterial cell walls. A hydroxyethyl side
chain in trans configuration—in contrast to the acylamino moiety in penicillins and
15
cephalosporins—has given the carbapenems marked resistance to β-lactamase
hydrolysis, as in the case of imipenem. Yet, recent evolution of β-lactamase-mediated
resistance driven in the past 1-2 decades by poor antibiotic stewardship has resulted
in the rise of class A carbapenemases and class B metallo-β-lactamases.46,47 (This will
be detailed in the next section under “metallo-β-lactamases”.)
Monobactams. These are a group of novel compounds related to the β-lactams that
only have a single ring structure as opposed to the bicyclic structure characteristic of
the other β-lactams (Fig 2.2). As with the previous β-lactams, the monobactams can
be similarly modified to diversify the therapeutic portfolio. The 1-sulfonic acid
facilitates binding interactions with PBPs by lowering the activation energy, as in
aztreonam.48
Inhibitors. β-lactamase inhibitors come in two types: clavulanic acid and sulbactam.
These compounds structurally resemble the penicillins (Fig. 2.2) and while not
effective by themselves as an antibiotic, when administered in combination
formulations, help to enhance in vitro activity for diagnostic purposes as they exert
protective effects over certain β-lactam antibiotics. Their inhibitory activity is
sometimes described as “suicide-like” as they are designed to preferentially bind to β-
lactamases but in doing so are destroyed.49–54
16
Figure 2.2. Chemical structures of β-lactams and related compounds
17
2.1.4 Clinical use
Clinical uses - penicillins. Extended-spectrum penicillins are used for P. aeruginosa
and other aerobic Gram negative rods and anaerobes, with high response rates (60-
80%) in bacteremias, intraabdominal infections, female genitourinary tract infections,
bone and soft tissue infections, and pneumonias.55–71 Notably, no differences in
efficacy are observed in comparative trials with extended-spectrum penicillins.
However, monotherapeutic treatment has been associated with colonization by
resistant organisms in 6 to 39 percent of cases;66,67 superinfection in 7-12 percent of
cases; failures to eliminate organisms despite patient clinical improvement in 25-50
percent of cases.63,70–72 Therefore, as single-agent treatment yields poor response in
compromised hosts, they have been recommended for use in combination with
aminoglycosides especially for serious infections. Combination therapy has marked
improvements in patient response rates, improving efficacy in a variety of clinical
situations: 56-97 percent response rates in compromised hosts (e.g., patients with
neutropenia), 30-60 percent of hosts harboring P. aeruginosa (e.g., bacteremia,
endocarditis, osteomyelitis, malignant otitis externa, keratitis, central nervous system
infection), 20-50 percent of hosts harboring Enterobacteriaceae infection.71 For
anaerobe colonization of intraabdominal or pelvic spaces, or mixed aerobic-anaerobic
infections of the lung, extended-spectrum penicillins have produced response rates of
70-90 percent.73–75 Monotherapy is associated with recurrence in up to 20% of
patients; combination therapy is therefore recommended for its high efficacy. Though
the ureido penicillins are also effective prophylactic agents for treatment of pelvic,
18
inflammatory, and biliary surgery, first-generation cephalosporins are equally
effective and less expensive.72–78
Clavulanic acid with ticarcillin (Timentin, 3 g ticarcillin and 100 mg clavulanic acid,
intravenous administration) improves ticarcillin’s efficacy against ticarcillin-resistant
strains of Enterobacteriaceae, H. influenzae, S. aureus, and bacteroides by 60-80
percent; however, no increased activity is reported in P. aeruginosa. Clavulanic acid
and amoxicillin (Augmentin, 250-500 mg amoxicillin and 125 mg clavulanic acid,
oral preparation) provides enhanced activity against β-lactamase producers of
Staphylococcus, Branhamella catarrhalis, H. influenzae, Neisseria gonorrhoeae, and
bacteroides.40
Clinical uses – cephalosporins & carbapenems: Treatment and outcome of infection
by ESBL producers. The efficacy of penicillins and its related compounds flounders
in the face of β-lactamase enzymes with mutuations rendering them capable of
inactivating these older-generation antibiotics.79–82 Therefore, the range of therapeutic
options is reduced when facing infections by ESBL-producing organisms able to
hydrolyze many β-lactam antibiotics. Plasmids that these organisms harbor often
carry genes that also encode for resistance to aminoglycosides and other antimicrobial
agents such as trimethioprim and sulfamethoxazole; plasmid-encoded resistance to
cephalosporins is also associated with susceptibility decrease to quinolones including
ciprofloxacin.83–86 Interestingly, in Klebsiella pneumoniae clinical isolates, porin loss
was only observed in those strains that produce ESBL,87 with a significant number
19
expressing active quinolone efflux activity. Β-lactam/ β-lactamase inhibitor
combinations are generally effective against organisms possessing a single ESBL;
however, it has become the case that many organisms now produce multiple
ESBLs,87–90 thereby reducing the effectiveness of such combinations. A 1994-1998
study involving isolates from 35 intensive care units in Europe showed a rise from 31
percent to 63 percent resistance to piperacillin-tazobactam β-lactam/ inhibitor
combination over the span of that four year period.91 Evidenced in vitro, the
carbapenems (imipenem, meropenem, ertapenem) have the most reliable activity
against ESBL-producers as they are stable to hydrolytic activity by these enzymes.
Cephamycins (alpha-methoxy cephalosporins modified at the 7-position carbon) have
also shown stability toward the ESBLs; however, ESBL-producers tend to lose outer
membrane proteins that lead to an ESBL-unrelated form of resistance to these
antibiotics.
Serious infections that include the presence of ESBL-producers should not be treated
using third-generation cephalosporins: elevated cephalosporin MICs (4-8 μg/ mL)
that still lie within the susceptible range can result in high failure rates.92–94 Though
stochastic modeling studies of cefepime (a fourth-generation cephalosporin) have
suggested high probability of successful pharmacokinetic/ pharmacodynamics target
achievement,95 empirical data gained from clinical studies has been limited.94,96
However, a randomized trial of cefepime versus imipenem for hospital-acquired
pneumonia showed perfect clinical response (100 percent, 10 of 10 patients) to the
carbapenem versus only 69 percent response (9 of 13 patients) to cefepime for a
20
cohort of patients infected by ESBL-producers.97 As a rule of principle common
among many extended-spectrum cephalosporins, MICs for the antibiotic rise in
tandem with the inoculum of the infecting organism.98–100 CTX-M-type ESBL
producers tend to more frequently exhibit resistance activity toward cefepime,101 as a
result, cefepime should not be used as first-line therapy against ESBL-producers. The
recommended treatment for cefepime for organisms showing any in vitro MIC
activities below a certain threshold (<2 μg/mL) is either high dosage (≥2g twice a
day) or in combination with amikacin.102,103
Cephamycins are also not recommended as a first-line therapeutic in ESBL-producing
infections. Despite having reportedly good in vitro activity in the treatment of ESBL
producers,104–106 use of cephamycins (including cefoxitin) have resulted in treatment
failure and relapse of infection due to selection of porin resistant mutants during
therapy. Furthermore, treatment of Klebsiella pneumoniae infection outbreak using
combined cephamycin and carbapenem has been faced with resistant organisms.105
Even in combination with β-lactamase inhibitors, β-lactam MICs rise in tandem with
rising inoculum.100 Since ESBL-producers also often still harbor the parent enzymes
(e.g., TEM-1, SHV-1), hyperproduction of these classical β-lactamases together with
porin loss can result in decreased efficacy of β-lactamase inhibitors. Carbapenems
have been shown to be more effective than β-lactam/ β-lactamase inhibitor
combinations in some animal studies in the treatment of ESBL-producing
infections.107 Stochastic pharmacokinetic/ pharmacodynamics modeling has shown
21
lowered probabilities of reaching targets correlated with success; clinical experience
with the drug-inhibitor combinations is limited. Therefore, drug-inhibitor
combinations are also not recommended as the first line of treatment for serious
infections with ESBL-producing organisms.95
Other clinically relevant antibiotics. Quinolones have previously been shown to be a
treatment of choice for complicated urinary tract infections with ESBL-producers
when there is no detectable in vitro resistance. However, in vitro resistance is on the
rise, and the development of newer quinolones are of marginal benefit. Carbapenems
have been found to be equivalent or of greater effectiveness when compared to
quinolones.103,108–111
2.2 Βeta-lactamase enzymes
2.2.1 Molecular mechanism
This dissertation will focus on the most prominent and therefore most important mode
of β-lactam resistance, namely, the production of β-lactamases. These enzymes are
able to hydrolyze the β-lactam ring through a similar acylation mechanism to render
the antibiotic inactive toward PBP targets. However, unlike PBPs, the structure of β-
lactamases enables them to coordinate a water molecule in the hydrolysis of the
acylated substrate from their active site, thereby allowing them to turn over more β-
lactam substrates without themselves becoming inactivated.112
22
ESBLs, most of which are derived from classical TEM and SHV lineages of β-
lactamase, are of increasing concern.113 A few key features that distinguish ESBLs
from typical β-lactamases is that ESBLs possess a number of mutations allowing
them to hydrolyze expanded-spectrum β-lactam antibiotics. This functional expansion
of hydrolytic ability is accompanied by a physical expansion of the active site that
allows for the steric accommodation of extended-spectrum β-lactams having bulkier
side chains; however this physical expansion may also result in increased
susceptibility of the ESBL active site to binding by β-lactamase inhibitors.114 ESBLs
do not exhibit activity against the cephamycins (alpha-methoxy cephalosporins).
Interestingly, though most ESBL-expressing strains are thusly susceptible to
cephamycins, the loss of an outer membrane porin protein may thereby confer
compensatory resistance to cephamycins such as cefoxitin and cefotetan.104,115,116
It is also important to note two other common modes of β-lactam resistance:
Altered PBPs exhibiting lower affinity for β-lactam antibiotics. Mutations in the PBPs
of certain species such as Streptococcus pneumonia and Staphylococcus aureus have
exhibited some resistance to inactivation by penicillins, and their continued function
may compensate for inactivated PBPs117.
Diminished or eliminated expression of outer membrane proteins (OMPs). Gram
negative bacteria have been found to lower or eliminate the expression of OMPS in
order to restrict the entry of certain β-lactams into the periplasm where PBPs are
located118.
23
2.2.2 ESBL producers
The greatest threats among microorganisms are Gram negative producers of ESBL
and include include Acinetobacter baumannii, Pseudomonas aeruginosa,
vancomycin-resistant Enterococcus faecium, methicillin-resistant Staphylococcus
aureus (MRSA), and Aspergillus spp.119 Gram positive bacteria, especially
Staphylococcus aureus and Enterococcus spp. pose major threats to antibiotic
treatments, though this affront is relatively still under control as the majority of
resistance is via horizontally acquired mec genes that encode modified PBPs (PBP2A
in the case of MRSA) that have low affinity to “conventional” β-lactams (penicillin-
like antibiotics).117 Though widespread in its dissemination, MRSA can still be
combatted by a variety of drugs including the glycopeptides and later-generation β-
lactams (cephalosporins).33
Conversely, Gram negative bacteria are yet particularly worrisome, presenting a more
serious challenge in facing the antibiotic crisis. They are especially prevalent in
hospital and community settings, with Pseudomonas aeruginosa, Acinetobacter spp.,
and Enterobacteriaceae (Klebsiella pneumoniae) representative of nosocomial
infections. In the community, Escherichia coli is the main producer of extended-
spectrum ESBLs, and Neisseria gonorrhea has developed chromosomally-encoded
resistance to expanded-spectrum cephalosporins, including ceftriaxone.81
The prevalence of β-lactamases have been fueled by the plasmid capture of normally
chromosomal genes from Enterobacter cloacae, Citrobacter freundii, or P.
aeruginosa, which have been able to confer multiple resistance types to genetically
24
labile Klebsiella pneumoniae or Escherichia coli against both earlier (alpha-methoxy-
β-lactams cefoxitin, cefotetan) and later generation cephalosporins (oxyimino-β-
lactams cefotaxime, ceftriaxone, and ceftazidime).120 ESBL-producing bacteria that
express resistance (or reduced susceptibility) phenotypes to the oxyimino-
cephalosporins (e.g., cefotaxime, ceftriaxone, ceftazidime) are most largely
represented by Enterobacteriaceae, namely Eschericia coli and Klebsiella
pneumoniae. These two bacterial species are the main sources of community- and
hospital-acquired infections.121 Carbapenem resistant Enterobacteriaceae (CRE) are
one of the latest challenges facing human health. Some carbapenemase-producing
strains have become resistant to most or all available antibiotics, causing infections
extremely difficult to treat, and in some cases can contribute to death in up to 50% of
infected patients.47,122 ESBL-producing (non-carbapenemase) Enterobacteriaceae are
already responsible for 26,000 hospital-acquired infections, resulting in 1,700 deaths
per year.123
Here we focus on Gram negative pathogenic bacteria whose main resistance strategy
is the production of extended-spectrum β-lactamase (ESBL). As some physicians
recognize cephalosporins’ role in ESBL selection, so have they begun reverting to
older antibiotic combinations for community-acquired pneumonias or surgical
prophylaxis.72–74,77 Hospitals exhibit a greater concentration of resistant coliforms that
can disseminate throughout the community environment.90,108 Therefore, in addition
to eliminating cephalosporins as the prophylaxis of choice, further reduction of
suboptimal or incorrect treatment is also necessary to preserve the cephalosporin
25
arsenal. Though ESBL producers can be inhibited by such remaining newer
cephalsporins as cefepime, it must be ensured as the best choice before treatment.35
2.2.3 Classification
Functional and molecular grouping. Most ESBLs are considered as Ambler’s
molecular class A,124 a key feature of which is possession of an active site serine
residue, preferential hydrolysis of penicillins, and a molecular weight of
approximately 29 kDa.125 Ambler classification differentiates ESBLs by amino acid
sequence similarity, and class A includes families such as TEM-1, SHV-1, and S.
aureus penicillinase, yet it does not sufficiently differentiate many types of class A
enzymes. More recently, a classification scheme devised by Bush, Jacoby, and
Medeiros uses the biochemical properties of the enzyme (i.e., substrate/ inhibitor
profile) in addition to molecular structure and nucleotide gene sequence (for
sufficient characterization of ESBLs by lineage origin) to classify ESBLs into distinct
functional groups.126 Following this scheme, ESBLs are defined under functional
group 2be as β-lactamase enzymes capable of hydrolyzing oxyimino-cephalosporins
and are inhibited by clavulanic acid.
26
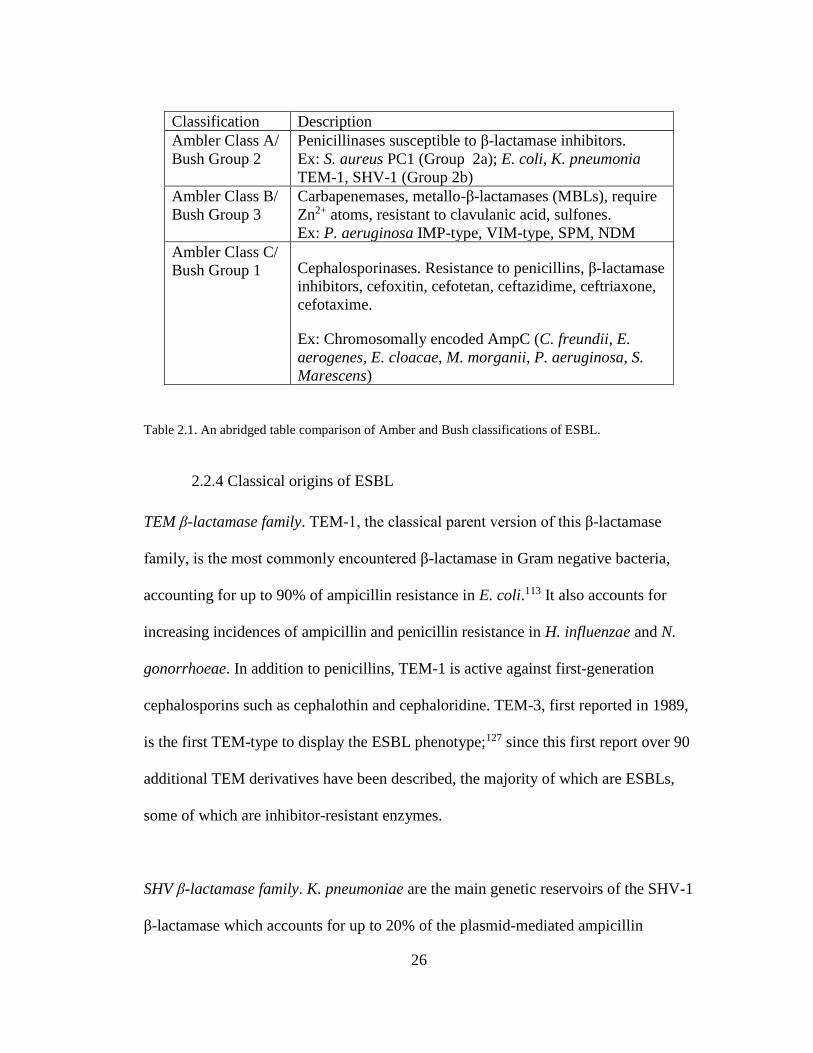
Table 2.1. An abridged table comparison of Amber and Bush classifications of ESBL.
2.2.4 Classical origins of ESBL
TEM β-lactamase family. TEM-1, the classical parent version of this β-lactamase
family, is the most commonly encountered β-lactamase in Gram negative bacteria,
accounting for up to 90% of ampicillin resistance in E. coli.113 It also accounts for
increasing incidences of ampicillin and penicillin resistance in H. influenzae and N.
gonorrhoeae. In addition to penicillins, TEM-1 is active against first-generation
cephalosporins such as cephalothin and cephaloridine. TEM-3, first reported in 1989,
is the first TEM-type to display the ESBL phenotype;127 since this first report over 90
additional TEM derivatives have been described, the majority of which are ESBLs,
some of which are inhibitor-resistant enzymes.
SHV β-lactamase family. K. pneumoniae are the main genetic reservoirs of the SHV-1
β-lactamase which accounts for up to 20% of the plasmid-mediated ampicillin
Classification Description
Ambler Class A/
Bush Group 2
Penicillinases susceptible to β-lactamase inhibitors.
Ex: S. aureus PC1 (Group 2a); E. coli, K. pneumonia
TEM-1, SHV-1 (Group 2b)
Ambler Class B/
Bush Group 3
Carbapenemases, metallo-β-lactamases (MBLs), require
Zn2+ atoms, resistant to clavulanic acid, sulfones.
Ex: P. aeruginosa IMP-type, VIM-type, SPM, NDM
Ambler Class C/
Bush Group 1 Cephalosporinases. Resistance to penicillins, β-lactamase
inhibitors, cefoxitin, cefotetan, ceftazidime, ceftriaxone,
cefotaxime.
Ex: Chromosomally encoded AmpC (C. freundii, E.
aerogenes, E. cloacae, M. morganii, P. aeruginosa, S.
Marescens)
27
resistance in the species,128 with many strains integrating the blaSHV-1 gene into their
chromosome.113 Unlike TEM-types, there exist relatively fewer derivatives of SHV-
type β-lactamases, and the changes that do give rise to derivatives occur in fewer
positions within the structural gene.
CTX-M β-lactamase family. This plasmid-encoded family of ESBL is characterized
by their ability to preferentially hydrolyze cefotaxime, and have been identified in
Salmonella enterica (Typhimurium) and E. coli among other Enterbacteriaceae.
Prominent members of this enzyme family include CTX-M-1, CTX-M-2, CTX-M-10,
and Toho enzymes 1 and 2.129,130 The CTX-M-type family is more genealogically
distinct from TEM- or SHV-types, only showing approximately 40% homology.131
Interestingly, studies comparing the genetics between CTX-M-type ESBL and AmpC
of Kluyvera ascorbata have provided evidence that there is a high degree of
homology between the CTX-M-type plasmids and chromosomally encoded AmpC
enzymes, suggesting the chromosomal origination of the former from the latter.132
Kinetic studies show CTX-M-type ESBLs hydrolyze cephalothin or cephaloridine
(first-generation cephalosporins) more efficiently than benzylpenicillin, in addition to
preferentially hydrolyzing cefotaxime over ceftazidime. Importantly, though they
exhibit low-level activity against cefotaxime, this is not sufficient to display a
survival resistance phenotype. The Ser-237 residue present in all CTX-M enzymes
plays an important role in their extended-spectrum activity.133 The nonessential Arg-
276 residue, which is equivalent to the Arg-244 residue in TEM- and SHV-type
ESBLs, may play a role in expanding the activity spectrum of CTX-M-types into the
28
oxyimino-cephalosporins.134 Toho-1 crystallographic studies (CTX-M family) have
suggested increased flexibility of the CTX-M-type (thanks to marked differences in
the β-3 strand and omega loop compared to other class A β-lactamases), and
attributed the extended-spectrum phenotype to the lack of hydrogen bonding near the
omega loop.135 Notably, CTX-M-types are better inhibited by tazobactam than other
β-lactamase inhibitors sulbactam and clavulanate.129,131,136,137
OXA β-lactamase family. Here we will briefly mention this genetically unrelated
(with respect to TEM-, SHV-, and CTX-M-types) but growing family of ESBLs.
These ESBLs belong to the molecular class D (Ambler) and functional group 2d
(Bush-Jacoby-Madeiros). They have high hydrolytic activity against oxacillin and
cloxacillin, from whence they derive their name, and also confer resistance to
ampicillin and cephalothin (first-generation cephalosporin); they are additionally
poorly inhibited by clavulanic acid. OXA-type ESBLs are mainly found in P.
aeruginosa but also in many Enterobacteriaceae. Interestingly, OXA-type ESBLs
provide only weak resistance activity against the oxyimino-cephalosporins when
cloned into E. coli but fairly high-level resistance in P. aeruginosa.138 In a similar
story to the previously mentioned ESBLs, whereas most OXA-types exhibit activity
against ceftazidime, OXA-17 in particular appears to have traded off its ceftazidime
activity to take on cefotaxime and ceftriaxone resistance.139
AmpC β-lactamases. AmpC β-lactamases are capable of hydrolyzing the alpha-
methoxy-β-lactams (cefotetan, cefoxitin) and are not inhibited by clavulanate or
29
sulbactam. AmpC expression is governed by chromosomal determinants and
overproduction of AmpC is known to produce braod-sectrum resistance to both
cephamycins and oxyimino-β-lactams.
Class B metallo-β-lactamases (MBLs). To address the growing concern of
carbapenem resistance, we must discuss their culprits, the highly transmissible
plasmid-mediated metallo-β-lactamases capable of inactivating this entire class of
antibiotics. MBLs boast great breadth in their substrate activity spectrum and can
catalyze the hydrolysis of virtually all β-lactam antibiotics with the exception of
monobactams.140 Unlike the class A serine β-lactamases, MBLs are not inhibited by
clavulanate, sulbactam, or tazobactam.141,142 Interestingly, they are additionally not
effectively inhibited by NXL-104, an inhibitor of class A and C enzymes currently in
clinical trials.143 However, as they rely on metal ions for their activity, MBLs are
accordingly inhibited by metal chelators such as EDTA.141
Genetics. Initially discovered nearly half a century ago, and found to be
chromosomally encoded in non-pathogenic organisms,144,145 MBLs have in recent
decades become a critical threat to human health with the advent and spread of IMP-
and VIM-types in Gram negative pathogenic Enterobacteriaceae, P. aeruginosa, and
A. baumanii.146,147 Additionally, the genetic promiscuity and transmissibility of IMP-
and VIM-type enzymes is due to their encoding as gene cassettes residing within the
integron structures of other resistance genes, and are associated with transposons that
can insert in either the bacterial chromosome or plasmids.147,148 Integrons are
30
essentially genetic stockpiles in bacteria that can undergo site-specific promoter
recombination to allow expression of new genes. The activation and movement of
resistance genes within plasmids is facilitated by integrons; once on plasmids, the
transfer of resistance genes between different bacteria is achieved with much greater
ease compared to genes that are chromosomally encoded.149 That this identifiable
phenomenon plays a critical role in the emergence of so-called multidrug resistant
“superbugs” in the wake of carbapenem treatment failure thus becomes obvious and
undeniable.
The more recent NDM-1 MBL first discovered in 2008 in Klebsiella pneumonia and
E. coli demonstrates the dissemination potential of MBLs. Found on several plasmid
types, blaNDM-1 can be transferred among Gram negatives by conjugation. Though not
associated with integron structures, NDM-1 nonetheless has rapidly spread
worldwide,122,150 perhaps facilitated by its association with transfer-promoting
insertion element ISAba125.
2.3 Genetic detection of ESBL
2.3.1 Genetics and evolution of ESBL
As an overview, we will begin with some important behavioral features of ESBL
genes that impact its genetic detection:
31
• The β-lactamase gene (bla) can be encoded chromosomally, on plasmids, or
on transposons. Their expression behavior (constitutive or inducible) depends
on the genetic environment in which they are situated.
• Extended-spectrum β-lactamases give rise to resistance against oxyimino-
cephalosporins (e.g., cefotaxime, ceftazidime, ceftriaxone, and aztreonam, an
oxyimino-monobactam, etc.).
• Plasmid-mediated enzymes confer resistance to alpha-methoxy-
cephalosporins, such as cephoxitin and cefotetan, as well as the oxyimino-β-
lactams. These are the class C β-lactamases which are normally
chromosomally encoded in Gram negatives.
• Class B metallo-β-lactamases confer resistance to the carbapenems such as
imipenem and meropenem, and include the oxyimino- and alpha-methoxy-
cephalosporins.
• Chromosomally encoded class A extended-spectrum enzymes are found in
Klebsiella oxytoca and other nosocomial pathogens, though these are outside
the relevant scope of this review and will not be discussed here.
TEM-1 is the most common plasmid mediated β-lactamase in enteric organisms
except in Klebsiella pneumoniae (SHV-1 dominates). Single amino acid substitutions
may yield identical enzymatic properties, but in some cases may result in low-level
enhancement of activity toward a few oxyimino-cephalosporins, as in the case of
TEM-7 or TEM-12 which differ by Ser substitution at position 164, or TEM-11
which has a His substitution at the same position, and exhibit modest enhancement
32
toward cefotaxime, ceftazidime, and aztreonam.151 Notably, marked relative increases
in activity toward ceftazidime and aztreonam occur when the 164-positional
substitutions are accompanied by one of the following: Lys-104, Lys-240 or Thr-237,
and Lys-240 appearing in the arising ESBLs TEMs -5, -6, -9, -10, -16, -24, or -26.
Interestingly, these subsitutions are always associated with greater ceftazidime
activity over cefotaxime.152 In contrast, TEMs -3, -4, and -8, which possess a Ser-238
residue change, exhibit higher activity against cefotaxime over other oxyimino-β-
lactams. Enzyme-substrate activity trends of striking similarity also appear within the
SHV family with Ser-238 association with higher cefotaxime hydrolysis over
ceftazidime, and Lys-240 (SHV-4, SHV-5) correlating to a concomitant increase in
ceftazidime activity.
It is of high importance to note that mutations yielding an advantageous increase in
relative activity is in fact a double-edged sword: the broader substrate specificity
afforded by substitutional changes from the classical enzymes, extended-spectrum β-
lactamases suffer from lowered catalytic efficiency. TEM-1 is a wonderfully efficient
enzyme153; kinetic studies of extended-spectrum TEMs -3, -5, -9, and -10 reveal they
only exhibit 0.4 to 2.2% of the specific activity of the classical TEM-1 enzyme.154 In
nature, bacteria compensate for this grave loss in catalytic efficiency by pushing the
metabolic production of these broader β-lactamases into overdrive. To do this, more
efficient promoter-possessing genes such as TEM-2 are 4 to 30 times more efficient
than TEM-1, making it the likely progenitor of the later ESBL evolutions.154,155
Hybrid promoters produced from the portions upstream of the TEM-6 gene related to
33
insertion sequence IS1 can also increase expression efficiency. Enzyme
hyperproduction by way of new combinations of promoter elements can play a
fundamental role in increasing resistance; hyperproduction of SHV-1 enhances
resistance to ceftazidime and aztreonam.156
The genes for TEM- and SHV-type ESBLs are typically encoded by large,
multiresistant plasmids thought to carry associated virulence factors that can aid
bacterial colonization and dissemination.157 Interestingly, and perhaps as a result,
strains producing ESBL often also produce TEM-1,158 potentially to compensate for
the loss in activity concomitant with substrate spectrum expansion. Yet this often
reduces the effectiveness of β-lactam-inhibitor combination treatments, as in the
example of E. coli expressing TEM-3, TEM-7, and SHV-4, but also TEM-1 thus
reducing or completely nullifying synergistic effects of ceftazidime with added
inhibitor sulbactam. The majority of SHV-type derivatives exhibit the ESBL
phenotype, and one variant, SHV-10, which possesses a glycine 130 to serine
substitution, is reported to be inhibitor-resistant.159 Importantly for purposes of
enzyme-substrate behavior prediction, the Ser140Gly mutation appears to override
the strong ESBL phenotype seen in SHV-type enzymes with the Gly238Ser and
Glu240Lys mutations. SHV-type ESBLs though mainly seen in K. pneumoniae have
also been observed in Citrobacter diversus, E. coli, and P. aeruginosa.160–163
It is believed that fluctuating selective pressure from multiple β-lactam agents within
an institutional setting are responsible for ESBL incidence rather than selection by a
single agent.151 Though E. coli and K. pneumoniae are largely the genetic reservoirs
34
for TEM-type ESBLs, their spread to other Gram negatives is occurring with
increasing frequency with reports in Enterobacteriaceae such as Enterobacter
aerogenes, Morganella morganii, Proteus mirabilis, Proteus rettgeri, and Salmonella
spp., as well as non-Enterobacteriaceae Gram negatives (e.g., TEM-42 in P.
aeruginosa; TEM-17 in Capnocytophaga ochracea).101,164–168
2.3.2 Genetic methods of antibiotic resistance detection
Since its inception in 1985, polymerase chain reaction (PCR) has proven to be a
powerful technology for the precise detection of specific gene sequences. This tool
can be used for the identification of pathogens and characterization of resistance and
virulence factors, shedding light on not just etiology but also phylogeny for
classification purposes. As such, the detection of the presence of resistance genes can
provide crucial evidentiary support for antimicrobial therapies in the clinic, and many
techniques exist for this purpose. However, there exists a strong caveat emptor of
admonition: the confirmed presence of a resistance gene within a clinical sample does
not necessarily portend treatment failure.169 Additionally, there are many challenges
in the genetic detection of resistance determinants, including: false-positive results
due to silent gene or pseudogene amplification; low sensitivity on mixed flora
samples due to PCR inhibition; susceptibility to contamination with extraneous or
residual nucleic acids; generation of false-negatives due to primer binding site
mutations; unwieldiness in screening for new resistance mechanisms in general
(especially ones due to highly varied point mutations).170–172
35
Here we will briefly mention a few developed methods providing greatest utility for
the genetic detection of antibiotic resistance.
PCR (polymerase chain reaction). This very common standard methodology can be
applied to colony hybridization for the detection of OXA-type ESBL. DNA from
positive isolates is extracted, PCR amplified using OXA-specific primers, and
digested using restriction endonucleases; restriction fragment sizes are compared to
distinguish groups of OXA-related genes. Though this technique does not directly
identify specific OXA genes present, it can distinguish between ESBL and non-ESBL
OXA-type genes.
PCR-Restriction Fragment Length Polymorphism (PCR-RFLP). This is one of the
simplest methods most commonly used to detect SHV derivatives by identifying the
specific mutation at peptide position 238.173 The extracted DNA is first amplified by
PCR, then digested with restriction enzyme NheI to detect the G to A nucleotide
change that gives rise to the G238S amino acid substitution. This substitution is
common in many early variants of the SHV-type ESBLs.
PCR-Single-Strand Conformational Polymorphism (PCR-SSCP). Able to detect
single base mutations within the blaSHV gene174,175, this test first generates a 475-bp
amplimer using oligonucleotide primers internal to the coding sequence of the blaSHV
gene, then is digested with restriction enzyme PstI. Fragments are run on a 20%
denaturing polyacrylamide gel, and the electrophoretic pattern of the digested
36
amplimer fragments can be used to identify SHVs -1 through -5, and SHV-7.
Combining PCR-SSCP and PCR-RFLP can allow for the identification of a total of
17 SHV genes.176
Ligase Chain Reaction(LCR). LCR can be used to identify DNA sequences by a
single base pair difference. This method uses a thermostable ligase and four
oligonucleotide primers complementary to the target sequence that hybridize adjacent
to each other. Subsequent amplification will only occur if there is no base mismatch,
which allows the ligase to act to produce an amplifiable sequence. LCR is performed
by first denaturing the target DNA containing the blaSHV gene, then allowing
biotinylated primers to bind, detecting mutations at four positions. An enzymatic
reaction with NADPH-alkaline phosphatase allows for detection readout. Because
this detection methodology identifies single base pair differences, new
oligonucleotides must be designed for every suspected single nucleotide
polymorphism (SNP), posing a great feasibility challenge for practical
implementation of LCR into clinical workflows.
Sequencing. Nucleotide sequencing is the fall-back standard method to determine
presence of a specific β-lactamase gene. Many methods exist for this purpose, but
high skill is required for processing and reading of sequencing autoradiographs.177
Next-Generation Sequencing (NGS) holds great promise in providing resistance gene
detection in a timely manner178, though it is outside the scope of this dissertation.
37
2.3.3 Considerations in the genetic detection of ESBL in Gram negatives
The proliferation of new subtypes within each ESBL family giving rise to an ever-
increasing number of variants poses a gargantuan challenge to genetic methods of
ESBL mediated resistance detection as these methods face inherent limitation in their
ability to encompass the full range of ESBL morphs. As such, the identification and
monitoring of ESBL by genetic methods should be reserved for reference laboratories
receiving difficult-to-type strains often exhibiting complex resistance. For molecular
epidemiological purposes, PCR-RFLP is viewed as one of the most appropriate
techniques for the most common ESBL types,179 as type-specific PCRs combined
with PCR-RFLP can cover a number of TEM, SHV, and CTX-M subtypes.176,180–182
Importantly, as phenotypic methods face difficulties from variable levels of resistance
expression, genotypic methods carried out in reference laboratories should
accompany phenotypic assessment, especially to discern any discrepancies which
may arise between the two.183 Still, direct sequencing remains the gold standard for
identifying any unknown amplification products of a given reaction. As the
automation of running and analysis of sequence gels advances, this provides an
expansive method for determining any resistance gene or mutation.184
2.4 Phenotypic detection of ESBL
2.4.1 Clinical & Laboratory Standards Institute (CLSI) Laboratory Guidelines.
Documents provided by CLSI have for many years provided laboratories with
comprehensive, up-to-date standards for antimicrobial susceptibility testing. Items
38
covered by the guidelines include most relevant drugs to test, report updates on
specific organisms, quality control measures for assurance in accuracy and
reproducibility of results, MIC breakpoints and interpretive criteria for disk diffusion
zone measurements.185,186 The M2 document provides performance criteria for disk
diffusion tests and the M7 document details performance criteria for MIC testing.
These two documents address testing of common, rapid-growing aerobic bacteria
(e.g., staphylococci, enterococci, Enterbacteriaceae, and specific species of
Pseudomonas, Acinetobacter, Burkholderia cepacian, Stenotrophomonas maltophilia,
Vibrio cholerae, Haemophilus influenzae, Neisseria gonorrhoeae, Streptococcus, and
Neisseria meningitidis). The M100 is a supporting document containing supplemental
tables with recommended drugs for testing and reporting, interpretive breakpoints,
and quality control ranges.186 The M11 document details culturing and testing
methodologies for anaerobic bacteria, such as agar and broth microdilution for MIC
determination.187
CLSI Breakpoint Methodology. Breakpoint determination or MIC interpretive criteria
for new antimicrobials, organisms yet to be characterized, or modifications to
previous criteria are established as outlined by the CLSI publication (document M23-
A2) based on four types of required data: (1) establishment of the new antimicrobial
agent’s MIC performance in wild-type isolates that lack known resistance
mechanisms, and comparisons with MIC performance in strains of isolates that have
known resistance mechanisms affecting the antimicrobial agent’s drug class; (2)
examination of pharmacokinetics of the drug in body fluids and tissues of healthy
39
patients, and comparisons with the examination of pharmacokinetics of the drug in
body fluids and tissues of in patients with infections of various types; (3)
pharmacokinetic studies (empirical evidence with the option of mathematical
modeling) to enable the observation of peak serum level of the drug and its potential
maintenance at levels above proposed MIC breakpoints (especially useful for β-
lactams and glycopeptides); (4) exhaustive review of clinical and bacteriological
response data collected over large clinical trials performed regarding a new
antimicrobial agent to substantiate potential U.S. Food and Drug Administration
(FDA) approval.
2.4.2 Gold standard techniques for ESBL determination
To address this need, the standards for testing established since the early days of
resistance incidence rely on several methods which will be described in this section.
Double-disk synergy test (DDST). The inception of this test began in epidemiological
studies on the spread of ESBL-producing Enterobacteriaceae in French hospitals in
efforts to distinguish observed cefotaxime resistance as due to ESBL production or
cephalosporinase overproduction.188 This test is based on the synergy between a third-
generation cephalosporin and clavulanate. The two are placed at a certain distance
from each other on a lawn of petri dish cultured from isolated single colonies derived
from clinical samples and are examined after an overnight period.
40
Hyperproduction of cephalosporinase can confound results attempting to pinpoint
ESBL presence; the use of a fourth-generation cephalosporin (cefepime) that is less
easily inactivated by cephalosporinase than ESBL can therefore improve the detection
of synergetic effects with clavulanate. Similarly, specific detection of ESBL over β-
lactamase classes capable of hydrolyzing both third-generation cephalosporins and
carbapenems (metallo-β-lactamases) can be performed by the inclusion of EDTA to
chelate essential metal ions in the synergetic test alongside clavulanate189.
ESBL Etest. These tests are designed to quantify the synergy between extended-
spectrum cephalosporins and clavulanate. They contain gradients of cephalosporin
either alone on one end of the strip or in combination with clavulanate on the other
end. Positive results are determined by a MIC ratio of 8 or more (three or more two-
fold dilution steps) with clavulanate, the appearance of a rounded “phantom” zone
below the lowest antibiotic concentration, or a deformation of the inhibition ellipse.
The latter two indicate the likely presence of ESBL production. ESBL detection in the
presence of metallo-β-lactamases can be determined using Etests containing EDTA
and comparing the inhibition zones corresponding to similar MIC dilution zones as
the typical Etest. Interpretation of these results can be variable and requires training
for higher accuracy, and suffers from a 30% failure rate.190
Combination Disk Method. This method involves measurement of the inhibition
zones around a cephalosporin disk compared to the same disk containing clavulanate.
A zone expansion of 50% or a difference of 5 mm or greater between the two
41
diameters are considered positive for ESBL production. The presence of clavulanate
may result in an enlarged inhibition zone (5 mm or more) for ESBL-producing
organisms in comparison to a smaller inhibition zone (1 mm or less) in AmpC
overproducers.
Distinguising from cephalosporinase overproduction (AmpC). The standard DDST
cannot provide distinguishing information between cephalosporinase overproducers
and ESBL producers. As a result, in ESBL producers, a modified Etest performed on
cloxacillin-containing agar will show positive results (MIC ratios 8 or greater) for an
Etest strip containing the cefepime-clavulanate combination. In contrast, ESBL non-
producers will show non-interpretable results for Etest strips comtaining cefepime-
clavulanate or cefotaxime-clavulanate without the presence of cloxacillin in the
media.
Automated methods. Two prominent automated MIC determination systems are the
VITEK 2 ESBL test (bioMérieux, Marcy l’Etoile, France) and Phoenix ESBL test
(Becton Dickinson, Sparks, MD, USA). These systems both rely on the bacterial
growth response to a panel of expanded-spectrum cephalosporins (cefepime,
cefotaxime, ceftazidime) with or without clavulanate. Turbidimetric measurements
are made at regular intervals following inoculation, and a computerized system
compares the proportional reduction of cell growth between wells containing the
cephalosporin alone or with clavulanate to determine ESBL status. Broth
microdilution testing may determine MICs of cephalosporins for producers and often
42
correspond to inhibition zones from disc diffusion test methods within the range of
resistance producers (0.5-2 mg/L), yet may still result in clinical failures; thus,
reliable detection still remains of high importance.191,192
Though the standard methodologies outlined above do provide high reliability in
susceptibility testing, MIC determination, and often also bacterial species
identification, they suffer from the requirement of culturing, and can only be carried
out in specialized, central laboratory spaces with highly trained personnel to operate
sophisticated equipment, and have expertise in interpretive determination which is not
always apparent (as in the case of inhibitory zones using DDST). Rather than solely
relying on turbidimetric measurement, rapid determination can be aided by the use of
chromogenic substrates that quickly produce measurable and sometimes visual
readout in a more convenient format. In the next section we will detail the
chromogenic substrates that have been developed as part of a toolkit for newer
methods of phenotypic AMR detection.
2.4.3 Newer methods in phenotypic detection
Chromogenic cephalosporins. While the rate of hydrolysis of β-lactam compounds
can be monitored by measuring the loss of absorbance at 235-260 nm (indicative of
lactam bond cleavage), this method suffers from poor analytical sensitivity due to a
few main factors: a) small molar extinction coefficients of the substrate (< 1000 M-1
cm-1), b) short optical path lengths in microtiter assay plates (< 1 cm), and c) other
components that share the same absorbance range (e.g., proteins).193 Chromogenic
43
substrates provide much higher extinction coefficients in comparison, often
enhancing sensitivity one to two orders of magnitude. Further, chromogenic
substrates are by definition within the visible range, making easy visual assessment a
feature for higher concentration samples.
Chromogenic substrates are designed by taking advantage of the cephem core’s β-
lactam ring opening mechanism as a trigger: intramolecular bond rearrangement will
release “reporters” (chromogens or small molecules capable of downstream reaction)
if the 3-position of the cephem ring is a methyl halide. CENTA (3-(4-nitro-3-
carboxyl-phenylthiol)-methyl-(6R,7R)-7-(2-thienyl-acetamido)-ceph-3-em-4-
carboxylate) is one such substrate (1 in Fig. 2.3). Upon hydrolysis, this substrate
releases 2-nitro-5-sulfanylbenzoic acid, which has an absorbance peak at 405 nm.
PADAC (2 in Fig. 2.3) is a similar substrate that releases N,N-dimethyl-4-[(Z)-
pyridin-2-yldiazenyl]aniline which has a maximum asorbance peak at 550 nm.193–195
An interesting synthetic compound (3 in Fig. 2.3) releases ethanioic S-acid when
hydrolyzed, resulting in a thiolate that can reduce tetrazolium salt in solution to form
an insoluble colored precipitate as a cleavage activity readout.196,197
Release of leaving groups on the 3-methyl of the cephem ring does not necessarily
occur in a concerted fashion with regard to β-lactam ring opening.198,199
In the case that the 3-methyl within the cephem ring is designed as a continued
alkene, without a halide but rather a carbon, designed chromogenicity may still occur
due to a bathochromic shift in maximal absorbance also spectrophotometrically
44
measurable. (4-9 in Fig. 2.3) shows styryl groups at the 3-methyl position
functionalized with various chromophores. One of the best-known of this type is
Nitrocefin (4 in Fig. 2.3) which displays a striking visual color change from an initial
maximal absorbance at 386 nm that shifts to 482 nm upon hydrolysis. As Nitrocefin
is cleavable by classical β-lactamases such as TEM-1, toward an attempt to make a
diagnostic substrate that can differentiate ESBL, compound (9 in Fig. 2.3) has been
designed to possesses an oxyimino modification similarly to third-generation
cephalosporins. Nitrocefin (4 in Fig. 2.3) and Chromacef (8 in Fig. 2.3) have been
used in screening studies of metallo-β-lactamase inhibitors, highlighting the
usefulness of these chromogenic reporter substrates in drug discovery.200–204
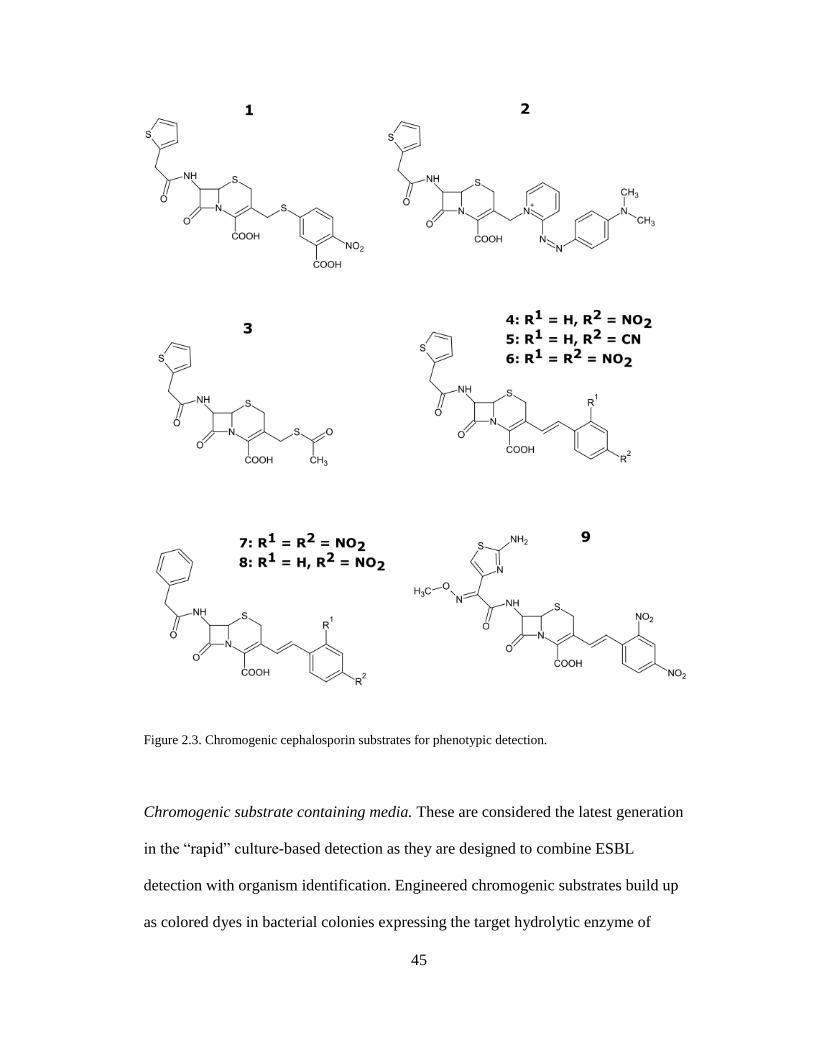
45
Figure 2.3. Chromogenic cephalosporin substrates for phenotypic detection.
Chromogenic substrate containing media. These are considered the latest generation
in the “rapid” culture-based detection as they are designed to combine ESBL
detection with organism identification. Engineered chromogenic substrates build up
as colored dyes in bacterial colonies expressing the target hydrolytic enzyme of
46
interest, allowing easy visual differentiation of (potential) pathogens from non-
expressers within a culture plate.205 However, chromID ESBL displays low
specificities (11-44%) due to interference from the growth of AmpC-
overproducers,205–208 and Brilliance ESBL suffers from similar complications. The
incorporation of cloxacillin in EbSA demonstrated significant suppression of AmpC
producers and higher specificities over chromID ESBL (78% versus 44%).206 Growth
of non-ESBL K1-OXY penicillinase overproducing K. oxytoca and some OXA-30
penicillinase-producing E. coli also compromises the specificities of chromID ESBL
and Brilliance ESBL. CHROMagar CTX which specifically targets CTX-M-type
ESBLs showed 100% sensitivity; however, this was reduced to 64% when non-CTX-
M-type ESBLs were recovered. Notably, only 14% of AmpC producers grew on
CHOMagar CTX versus 76% on chromID ESBL, indicating suppression of AmpC
producers in the former media.209
Currently commercially available chromogenic media include chromID ESBL
(bioMérieux), Brilliance ESBL (Oxoid Ltc., Basingstoke, UK), and CHROMagar
ESBL (CHROMagar, Paris, France). These are offered as either ready-to-use media,
or a proprietary selective mix that is added to a commercial product such as
CHROMagar Orientation agar base. CHROMagar also provides a product for
detection of CTX-M producers, the CHROMagar CTX supplement that is added to
the CHROMagar ECC base. These media have been shown to have almost uniformly
high sensitivities (>95%).14,206–209
47
Antibiotics as selective agents. Media selectivity can be tuned using antibiotic
combinations at certain concentrations to suppress the growth of Gram positive
organisms and yeasts in order to select for ESBL producing Gram negatives. Though
full combinations are not entirely disclosed by the company, cefpodoxime (4 μg/ mL)
is the cephalosporin of choice to select for ESBL producers and is incorporated into
the chromID ESBL and Brilliance ESBL products. The reason for this choice is
because cefpodoxime is known as a reliably selective substrate for most TEM- and
SHV-derived ESBLs, and is preferred for its effectiveness in being a single selective
substrate; this is in constrast with ceftazidime which must be combined with
cefotaxime for the reliable selection of CTX-M producers and ceftazidime-
hydrolyzing TEM-type variants. The superior performance of these commercial
chromogenic media containing cefpodoxime has been demonstrated over MacConkey
agar supplemented with ceftazidime (2 μg/ mL).208,208 However, the growth of
cephalosporinase overproducers (AmpC and K1) has presented much challenge in the
use of cefpodoxime disks, and as a result cefpodoxime concentration must be
carefully chosen as MICs in the indeterminate (“ambiguous window”) range of 2-4
μg/ mL for E. coli cannot rule our resistance mechanisms arising from changes in
porin or AmpC overexpression states.210 The chromID ESBL product also
incorporates additional antibiotics to allow better inhibition of adjunct flora.14
Efficacy of chromogen combinations to differentiate genera/ species. ChromID and
Brilliance ESBL contain chromogens that can differentiate E. coli from a grouping of
similar bacteria known as KESC (Klebsiella, Enterobacter, Serratia, Citrobacter).
48
One of the chromogens in chromoID ESBL is a substrate for β-glucuronidase that is
highly specific to E. coli (indicated by development of colonies that are pink to
burgundy in color); Brilliance ESBL agar contains chromogens that can also detect β-
galactosidase/ β-glucuronidase co-producers (indicated by the development of blue
colonies, pink colonies if β-glucuronidase-only producer). Presence of KESC
colonies are indicated by a green/ green-blue (due to β-galactosidase expression) or
brown-green (due to β-glucosidase expression) on Brilliance and chromID ESBL.
Additional supplementation with tryptophan can enable the detection of Proteus,
Morganella, and Providencia (PMP grouping) that appear tan with a brown halo due
to tryptophan deaminase production.
2.5 Enzymology
2.5.1 Motivation
Enzymes from the different Ambler classes of β-lactamases hydrolyze β-lactam
antimicrobial agents at different rates. Because β-lactamases can be encoded
chromosomally, on plasmids, or encountered alongside a variety of resistance
mechanisms that may be co-expressed, resistance determination via phenotypic
measurement may give rise to a range of MIC values due to this continuum of
antimicrobial activities. In this dissertation, resistance determination is evaluated
through the characterization of readout modalities (e.g., colorimetric or fluorescence
signal accumulation, enzyme-coupled redox activity for amperometric measurement,
photon counts quantified by spectroscopic methods) in their responses to β-lactamase
enzymatic activity. Because the majority of studies herein presented involve either
49
direct or indirect biochemical observation, enzyme activity will be expressed using
the international convention in terms of unit activity (international unit, abbreviated
as IU or just U), which is defined as the amount of enzyme that catalyzes the
hydrolysis of one micromole of substrate (the β-lactam benzylpenicillin, also known
as Penicillin G) per minute under standard conditions (aqueous buffer of neutral pH
7.0 at 25 °C).
2.5.2 Rationale
In light of bringing our biochemical studies toward clinical relevance as established
by gold standard methodologies, we must attempt to translate enzyme unit activity
into terms approximating MIC. To do this, we will take into account substrate
conversion rates described by enzymatic unit activity, and consider MIC as the
primary determining factor of substrate transport equilibrium at the bacterial outer
membrane-external media interface.
Minimum inhibitory concentration (MIC) is defined as the lowest concentration of an
antimicrobial agent (i.e., the β-lactam antibiotic in question) that will inhibit the
visible growth of a microorganism after overnight incubation. Given this definition, it
can be logically deduced that the microorganism in question would achieve growth at
an antimicrobial concentration just below the MIC threshold. Therefore, we may
conceive of this threshold as representing the cumulative whole of the
microorganism’s resistance activities that enable its replicative survival. Though this
is not the case in actuality (as natural pathogens are known to harbor multiple
50
resistance mechanisms), for demonstrative purposes we may model an initial
translation of our in vitro biochemical analysis to clinical MIC under the assumption
that 100% of the resistance activity present in a given test sample is due to β-
lactamase mediated inactivation of β-lactam antibiotics present in the test media (e.g.,
the cleavage of β-lactam derivative by ESBL). This implies that in order to survive,
the theoretical bacterial strain (acquiring 100% of its resistance through ESBL
production) must inactivate the antibiotic at the same rate at which it diffuses into the
periplasm (site where the PBP targets reside), which is proportional to the
extracellular concentration given by MIC, as described by Fick’s law of diffusion.
2.5.3 Modeling
Mathematical characterization of antibiotic penetration into the bacterial periplasmic
space where they encounter ESBL can be related in terms of rates of drug diffusion
across the outer membrane.211,212 These uptake rates are described as a permeability
coefficient (P in nm s-1) according to Fick’s law of diffusion:
V = P x A(So – Si)
where V is the rate of diffusion (nmol mg cells-1 s-1), A is the area of the cell surface
per unit weight (nm-2 mg cells-1) through which antibiotic diffusion (flux) occurs, and
So and Si are the substrate concentrations (nmol mL-1) outside and inside the bacterial
outer membrane, respectively, with their difference representing the concentration
gradient.
We can think of the flux based on concentration gradient (determined by MIC) to be
less than or equal to the rate of enzymatic product turnover as both processes would
51
be at equilibrium for the bacterial cell to maintain cell wall synthesis and survival.
Therefore, assuming overall MIC (bulk media) remains constant, the flux over time
would equal product generated over the same period of time. Product generation can
therefore be considered in terms of IU, which would depend on the enzyme’s
expression level to provide enough inactivation activity to match or overtake the
antibiotic MIC.
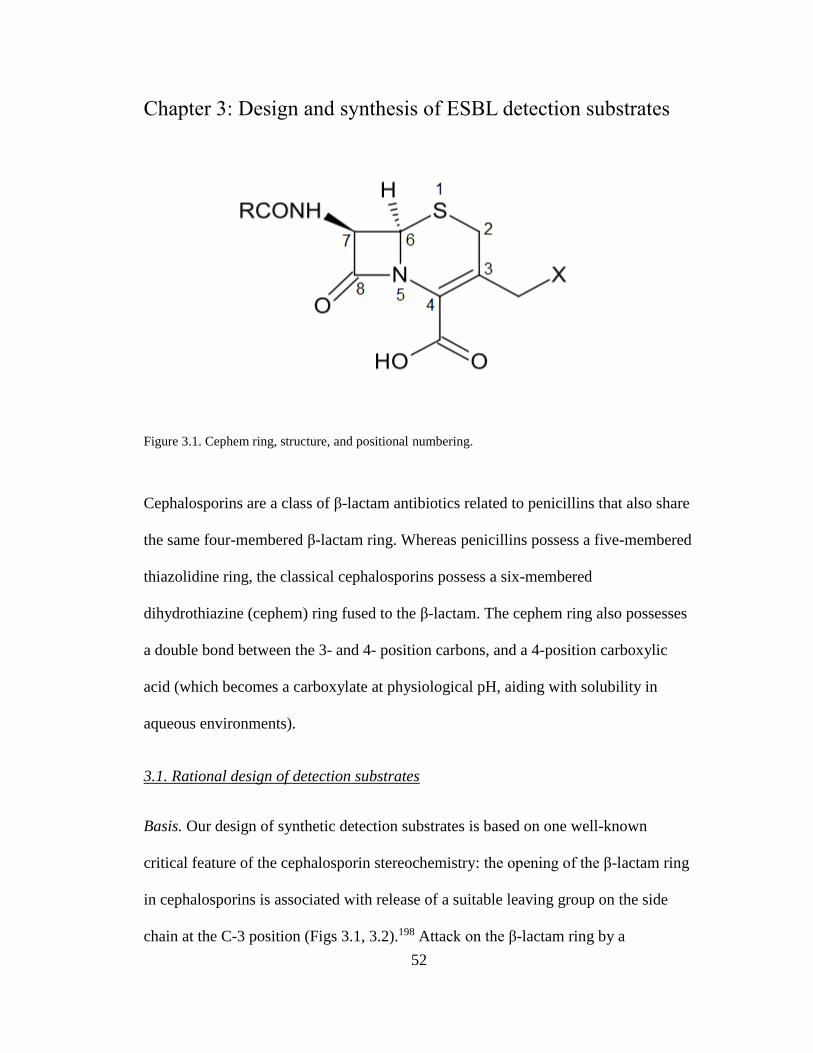
52
Chapter 3: Design and synthesis of ESBL detection substrates
Figure 3.1. Cephem ring, structure, and positional numbering.
Cephalosporins are a class of β-lactam antibiotics related to penicillins that also share
the same four-membered β-lactam ring. Whereas penicillins possess a five-membered
thiazolidine ring, the classical cephalosporins possess a six-membered
dihydrothiazine (cephem) ring fused to the β-lactam. The cephem ring also possesses
a double bond between the 3- and 4- position carbons, and a 4-position carboxylic
acid (which becomes a carboxylate at physiological pH, aiding with solubility in
aqueous environments).
3.1. Rational design of detection substrates
Basis. Our design of synthetic detection substrates is based on one well-known
critical feature of the cephalosporin stereochemistry: the opening of the β-lactam ring
in cephalosporins is associated with release of a suitable leaving group on the side
chain at the C-3 position (Figs 3.1, 3.2).198 Attack on the β-lactam ring by a
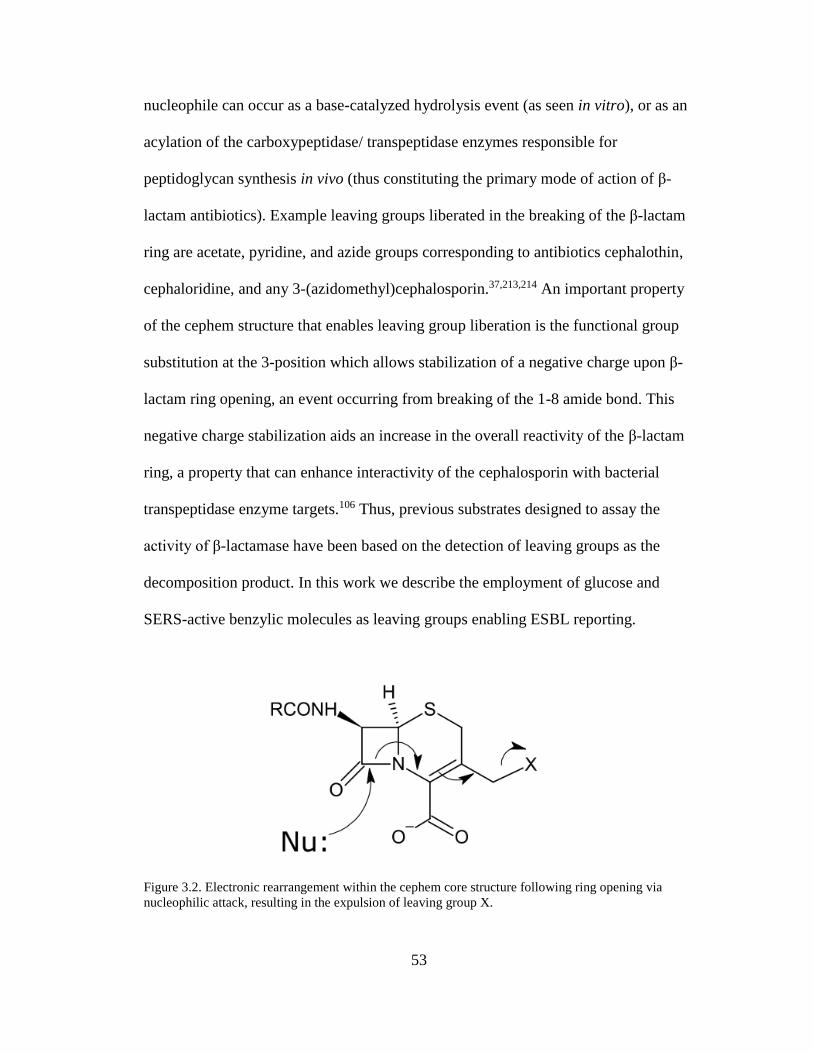
53
nucleophile can occur as a base-catalyzed hydrolysis event (as seen in vitro), or as an
acylation of the carboxypeptidase/ transpeptidase enzymes responsible for
peptidoglycan synthesis in vivo (thus constituting the primary mode of action of β-
lactam antibiotics). Example leaving groups liberated in the breaking of the β-lactam
ring are acetate, pyridine, and azide groups corresponding to antibiotics cephalothin,
cephaloridine, and any 3-(azidomethyl)cephalosporin.37,213,214 An important property
of the cephem structure that enables leaving group liberation is the functional group
substitution at the 3-position which allows stabilization of a negative charge upon β-
lactam ring opening, an event occurring from breaking of the 1-8 amide bond. This
negative charge stabilization aids an increase in the overall reactivity of the β-lactam
ring, a property that can enhance interactivity of the cephalosporin with bacterial
transpeptidase enzyme targets.106 Thus, previous substrates designed to assay the
activity of β-lactamase have been based on the detection of leaving groups as the
decomposition product. In this work we describe the employment of glucose and
SERS-active benzylic molecules as leaving groups enabling ESBL reporting.
Figure 3.2. Electronic rearrangement within the cephem core structure following ring opening via
nucleophilic attack, resulting in the expulsion of leaving group X.
54
Leaving groups. Upon opening of the β-lactam ring, it is known that the departure of
the leaving group is spontaneous.198 The electronic details describing the exact nature
behind this spontaneous departure was initially thought to be reliant on a concerted
mechanism based on quantum mechanical studies.215 However, leaving group
elimination as a concerted event has since been countered by subsequent studies
suggesting this is not a necessary case.199 By spectrophotometrically following
PADAC (pyridine-2-azo-4’-(N’,N’-dimethylaniline) cephalosporin), an intermediate
wherein the leaving group is still attached at the C-3 position post-ring opening has
been observed. Though this implies PADAC’s leaving group is a poor one, further
evidence suggests the departure of known good leaving groups such as acetoxy or
pyridinium may be concerted in the presence of certain enzymes.199
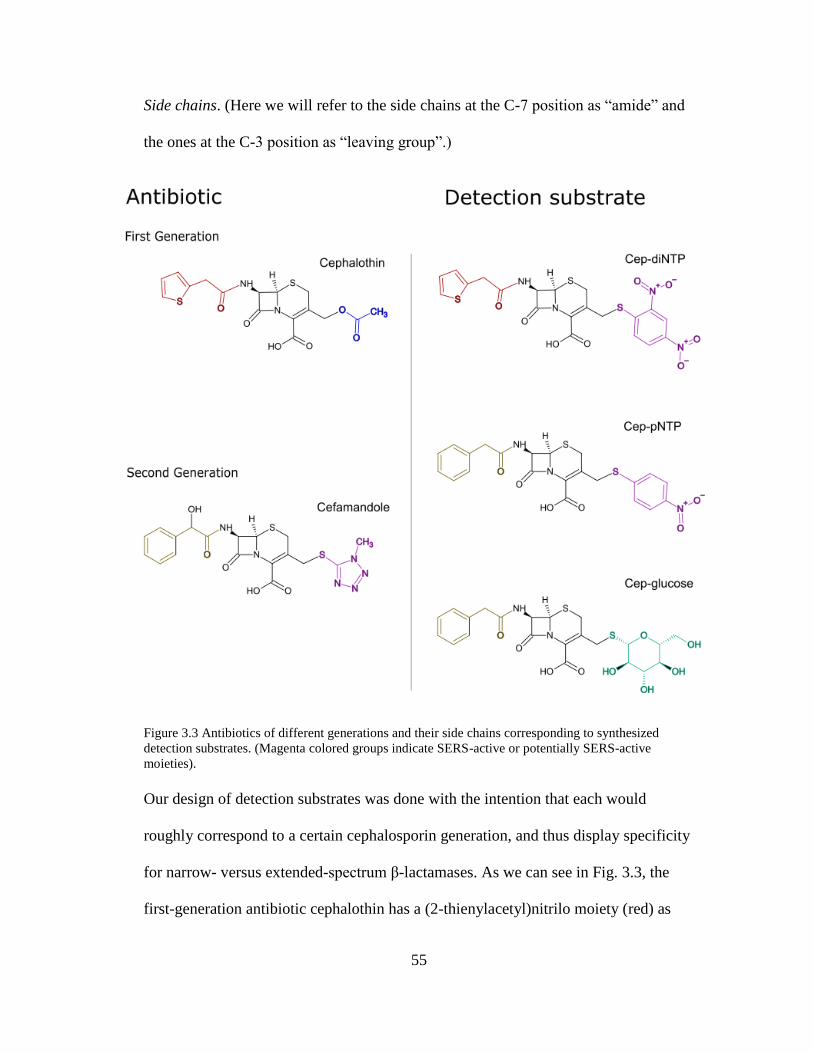
55
Side chains. (Here we will refer to the side chains at the C-7 position as “amide” and
the ones at the C-3 position as “leaving group”.)
Figure 3.3 Antibiotics of different generations and their side chains corresponding to synthesized
detection substrates. (Magenta colored groups indicate SERS-active or potentially SERS-active
moieties).
Our design of detection substrates was done with the intention that each would
roughly correspond to a certain cephalosporin generation, and thus display specificity
for narrow- versus extended-spectrum β-lactamases. As we can see in Fig. 3.3, the
first-generation antibiotic cephalothin has a (2-thienylacetyl)nitrilo moiety (red) as
56
the amide side chain and an acetoxymethyl moiety (blue) as the leaving group. We
correspondingly designed our Cep-diNTP SERS-active reporter substrate to have the
same amide side chain as the first-generation cephalothin. Second-generation
cefamandole has a (R)-mandelamido amide side chain and a N-methylthiotetrazole
leaving group side chain; we began with a starting material (Fig. 3.5, 4-
Methoxybenzyl-3-chloromethyl-7-(2-phenylacetamido)-3-cephem-4-carboxylate, or
“PMB-Cep-Cl”) with a similar (benzylacetyl)nitrile side chain which is not exactly
the same as the first-generation cephalosporin but would perhaps experimentally
show similar enzyme specificities (this has been confirmed in the following studies).
Important to note is that the leaving groups also play an important role in the enzyme
reactivity and thus also antimicrobial effects of cephalosporin antibiotics.216 Thus, it
is necessary to acknowledge that changing the amide side chain in design approach
for engineering enzyme specificity is inherently incomplete. Though Cep-pNTP and
Cep-glucose share the same amide side chains, the differing leaving groups may also
play a critical role in specificity in enzyme active site binding. Further, as thio-
glucose constitutes a poor leaving group whereas pNTP constitutes a good leaving
group, the observable kinetics of spontaneous leaving group expulsion will be
discussed in a later section (see: 3.4.2 and 5.3).
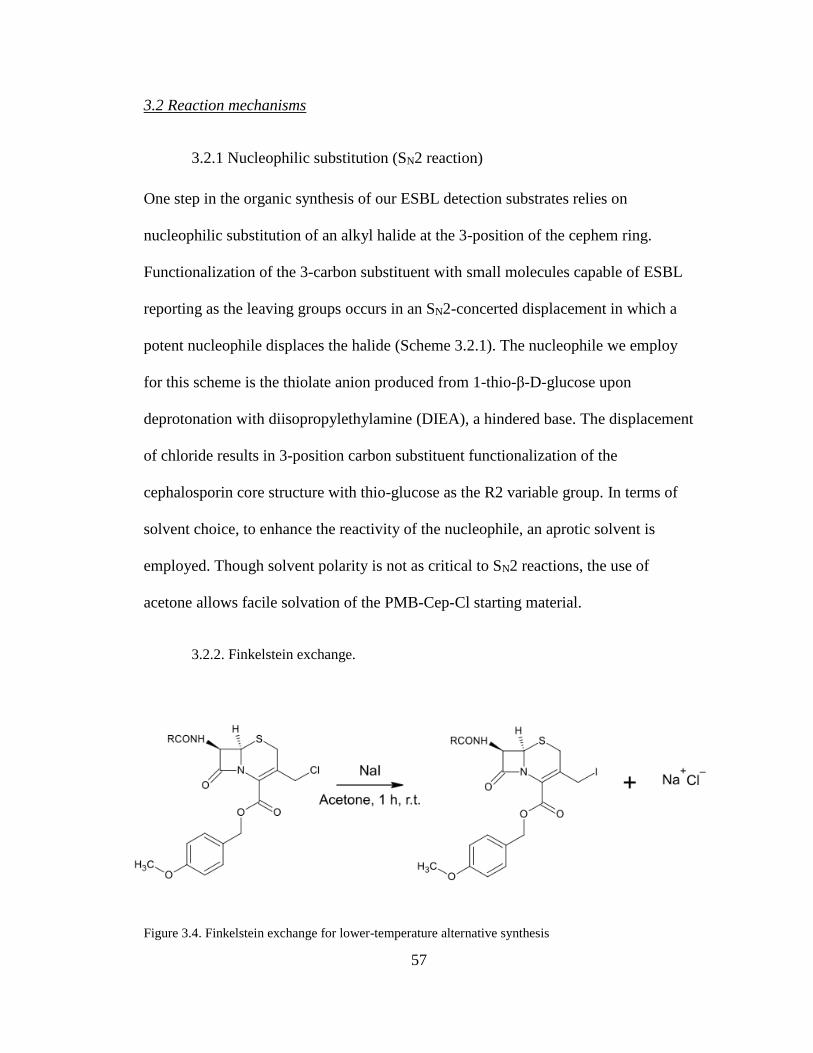
57
3.2 Reaction mechanisms
3.2.1 Nucleophilic substitution (SN2 reaction)
One step in the organic synthesis of our ESBL detection substrates relies on
nucleophilic substitution of an alkyl halide at the 3-position of the cephem ring.
Functionalization of the 3-carbon substituent with small molecules capable of ESBL
reporting as the leaving groups occurs in an SN2-concerted displacement in which a
potent nucleophile displaces the halide (Scheme 3.2.1). The nucleophile we employ
for this scheme is the thiolate anion produced from 1-thio-β-D-glucose upon
deprotonation with diisopropylethylamine (DIEA), a hindered base. The displacement
of chloride results in 3-position carbon substituent functionalization of the
cephalosporin core structure with thio-glucose as the R2 variable group. In terms of
solvent choice, to enhance the reactivity of the nucleophile, an aprotic solvent is
employed. Though solvent polarity is not as critical to SN2 reactions, the use of
acetone allows facile solvation of the PMB-Cep-Cl starting material.
3.2.2. Finkelstein exchange.
Figure 3.4. Finkelstein exchange for lower-temperature alternative synthesis

58
Nucleophilic substitution can be carried out by alkoxides as well as thiolate-bearing
ones. However, as alkoxides are less nucleophilic than thiolates, the SN2 reaction can
be enhanced by the inclusion of a Finkelstein exchange step in which the chloride
leaving group is replaced by iodide. In our synthesis scheme, reaction of the PMB-
Cep-Cl starting material with sodium iodide (NaI) for approximately one hour in
acetone at room temperature is sufficient for completion of the Finkelstein exchange;
displaced chloride anions form an ionic salt with the sodium cations and precipitate
out of solution as NaCl is insoluble in acetone, thereby excluding chloride from
participating in any potential secondary reactions. However, alternative to inclusion
of the Finkelstein exchange step, an increase in temperature from RT to reflux
conditions is sufficient for halide displacement and alkylation by thiolate to occur.
3.3 Synthesis of Cep-glucose: Reaction schemes and spectral verification
3.3.1 Cep-glucose synthesis scheme
All solvents were purchased from Fisher Scientific, 4-methoxybenzyl-3-
chloromethyl-7-(2-phenylacetamido)-3-cephem-4-carboxylate was purchased from
TCI, and 1-thio-β-D-glucose was purchased from Cayman Chemical Company.
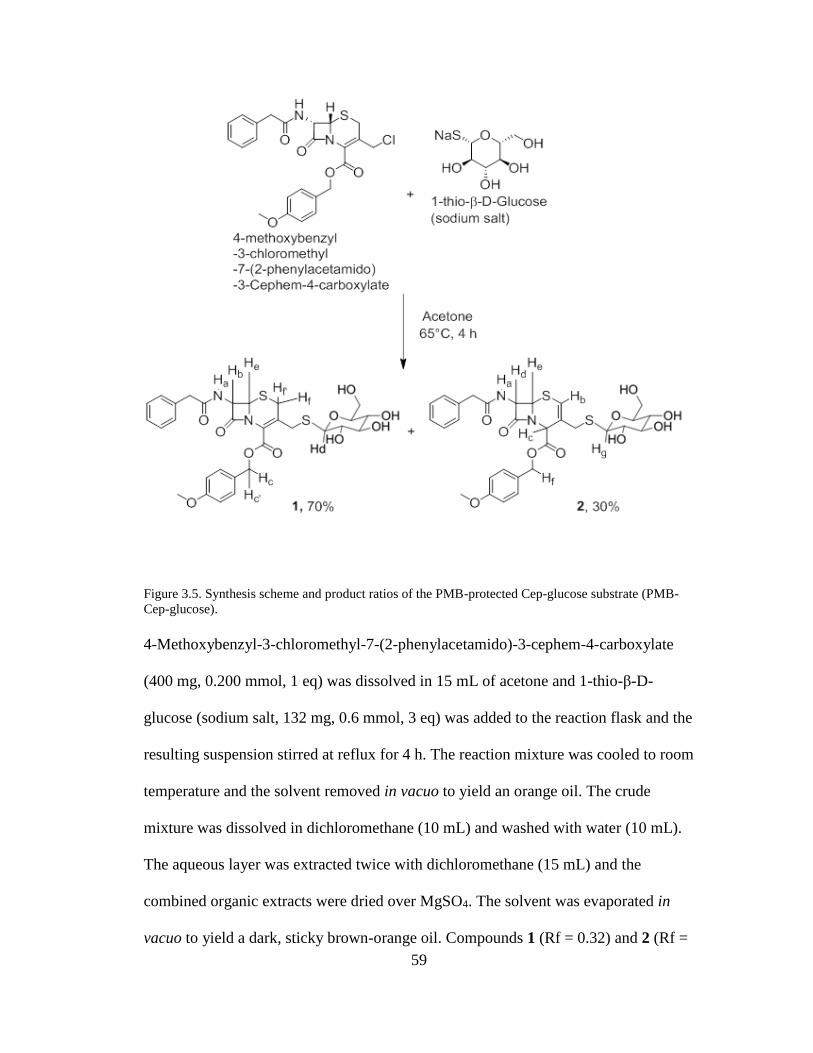
59
Figure 3.5. Synthesis scheme and product ratios of the PMB-protected Cep-glucose substrate (PMB-
Cep-glucose).
4-Methoxybenzyl-3-chloromethyl-7-(2-phenylacetamido)-3-cephem-4-carboxylate
(400 mg, 0.200 mmol, 1 eq) was dissolved in 15 mL of acetone and 1-thio-β-D-
glucose (sodium salt, 132 mg, 0.6 mmol, 3 eq) was added to the reaction flask and the
resulting suspension stirred at reflux for 4 h. The reaction mixture was cooled to room
temperature and the solvent removed in vacuo to yield an orange oil. The crude
mixture was dissolved in dichloromethane (10 mL) and washed with water (10 mL).
The aqueous layer was extracted twice with dichloromethane (15 mL) and the
combined organic extracts were dried over MgSO4. The solvent was evaporated in
vacuo to yield a dark, sticky brown-orange oil. Compounds 1 (Rf = 0.32) and 2 (Rf =
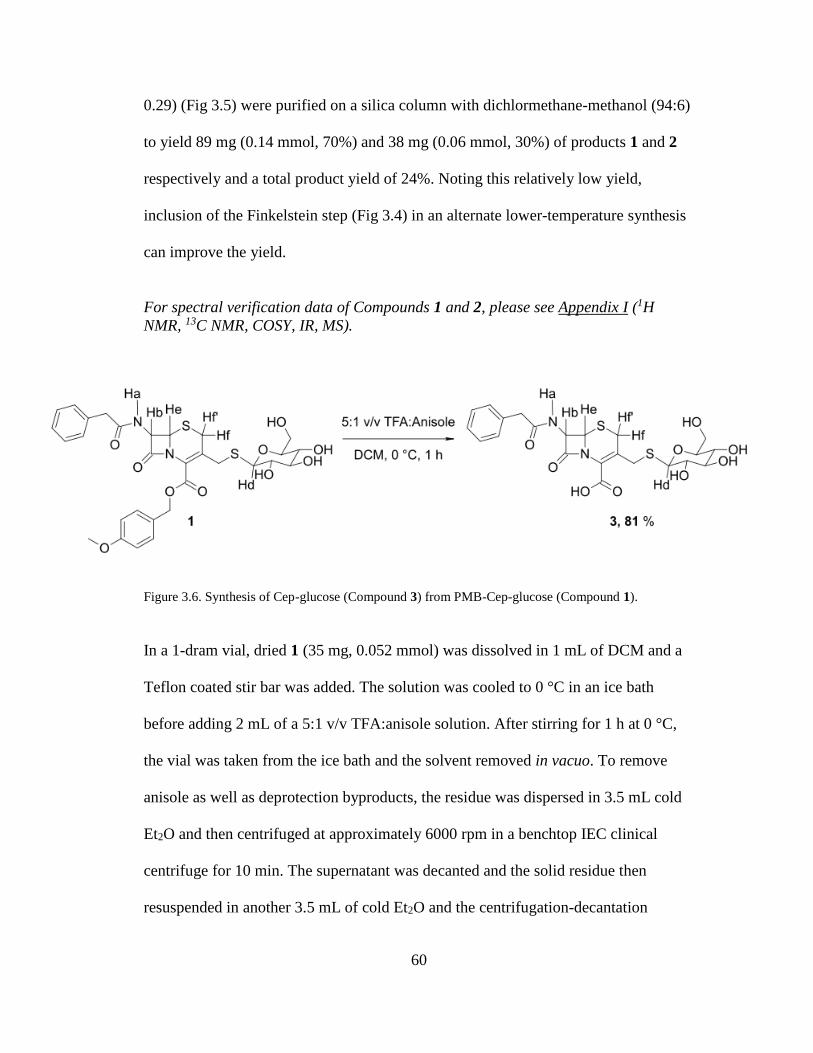
60
0.29) (Fig 3.5) were purified on a silica column with dichlormethane-methanol (94:6)
to yield 89 mg (0.14 mmol, 70%) and 38 mg (0.06 mmol, 30%) of products 1 and 2
respectively and a total product yield of 24%. Noting this relatively low yield,
inclusion of the Finkelstein step (Fig 3.4) in an alternate lower-temperature synthesis
can improve the yield.
For spectral verification data of Compounds 1 and 2, please see Appendix I (1H
NMR, 13C NMR, COSY, IR, MS).
Figure 3.6. Synthesis of Cep-glucose (Compound 3) from PMB-Cep-glucose (Compound 1).
In a 1-dram vial, dried 1 (35 mg, 0.052 mmol) was dissolved in 1 mL of DCM and a
Teflon coated stir bar was added. The solution was cooled to 0 °C in an ice bath
before adding 2 mL of a 5:1 v/v TFA:anisole solution. After stirring for 1 h at 0 °C,
the vial was taken from the ice bath and the solvent removed in vacuo. To remove
anisole as well as deprotection byproducts, the residue was dispersed in 3.5 mL cold
Et2O and then centrifuged at approximately 6000 rpm in a benchtop IEC clinical
centrifuge for 10 min. The supernatant was decanted and the solid residue then
resuspended in another 3.5 mL of cold Et2O and the centrifugation-decantation
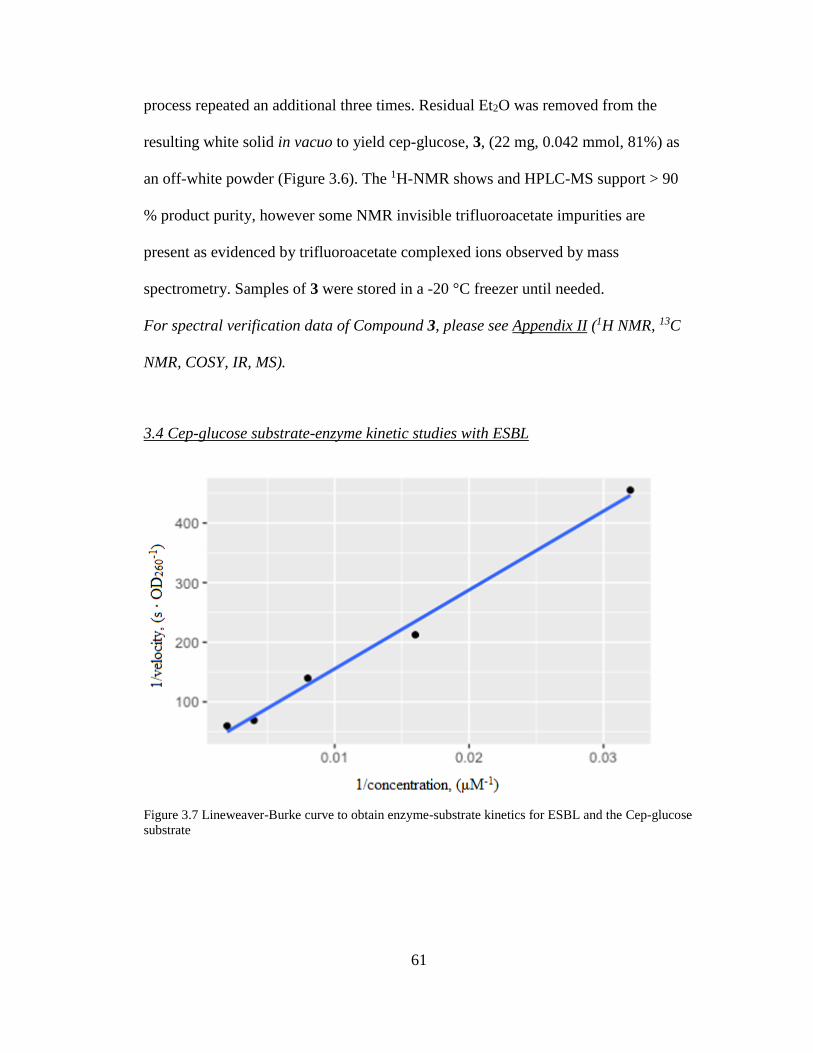
61
process repeated an additional three times. Residual Et2O was removed from the
resulting white solid in vacuo to yield cep-glucose, 3, (22 mg, 0.042 mmol, 81%) as
an off-white powder (Figure 3.6). The 1H-NMR shows and HPLC-MS support > 90
% product purity, however some NMR invisible trifluoroacetate impurities are
present as evidenced by trifluoroacetate complexed ions observed by mass
spectrometry. Samples of 3 were stored in a -20 °C freezer until needed.
For spectral verification data of Compound 3, please see Appendix II (1H NMR, 13C
NMR, COSY, IR, MS).
3.4 Cep-glucose substrate-enzyme kinetic studies with ESBL
Figure 3.7 Lineweaver-Burke curve to obtain enzyme-substrate kinetics for ESBL and the Cep-glucose
substrate
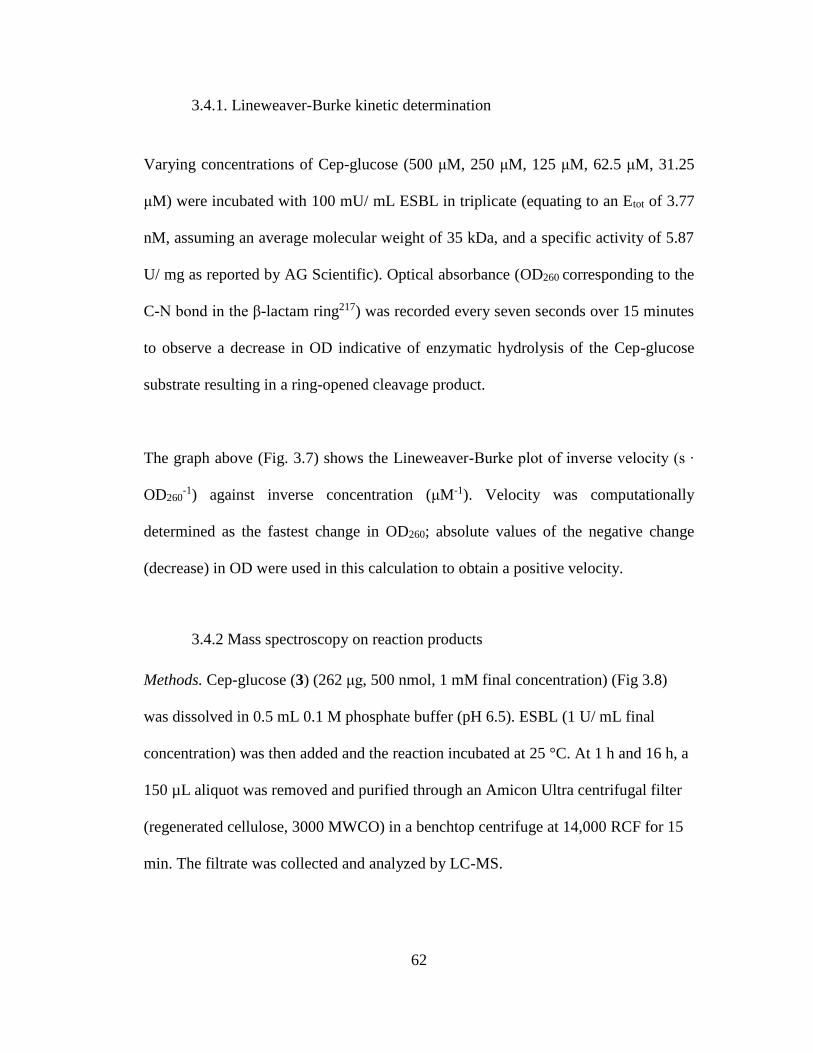
62
3.4.1. Lineweaver-Burke kinetic determination
Varying concentrations of Cep-glucose (500 μM, 250 μM, 125 μM, 62.5 μM, 31.25
μM) were incubated with 100 mU/ mL ESBL in triplicate (equating to an Etot of 3.77
nM, assuming an average molecular weight of 35 kDa, and a specific activity of 5.87
U/ mg as reported by AG Scientific). Optical absorbance (OD260 corresponding to the
C-N bond in the β-lactam ring217) was recorded every seven seconds over 15 minutes
to observe a decrease in OD indicative of enzymatic hydrolysis of the Cep-glucose
substrate resulting in a ring-opened cleavage product.
The graph above (Fig. 3.7) shows the Lineweaver-Burke plot of inverse velocity (s ∙
OD260-1) against inverse concentration (μM-1). Velocity was computationally
determined as the fastest change in OD260; absolute values of the negative change
(decrease) in OD were used in this calculation to obtain a positive velocity.
3.4.2 Mass spectroscopy on reaction products
Methods. Cep-glucose (3) (262 μg, 500 nmol, 1 mM final concentration) (Fig 3.8)
was dissolved in 0.5 mL 0.1 M phosphate buffer (pH 6.5). ESBL (1 U/ mL final
concentration) was then added and the reaction incubated at 25 °C. At 1 h and 16 h, a
150 µL aliquot was removed and purified through an Amicon Ultra centrifugal filter
(regenerated cellulose, 3000 MWCO) in a benchtop centrifuge at 14,000 RCF for 15
min. The filtrate was collected and analyzed by LC-MS.
63
Results. LC-MS analysis of the reaction between Cep-glucose and ESBL revealed the
presence of a ring-opened intermediate (4 in Fig 3.8), both confirming Cep-glucose’s
function as a substrate for ESBL and thio-glucose as a poor leaving group. The
following study was initially performed to confirm release of thio-glucose following
ESBL-mediated ring opening. Though MS confirmed the presence of a weak signal
indicative of thio-glucose, it also revealed the appearance of a strong signal
corresponding to the mass of the ring opened intermediate with thio-glucose still
attached, and, importantly, the disappearance of the initial Cep-glucose peak. Details
of the experiments are described below.
Interestingly, though spontaneous elimination of thio-glucose appeared to produce
minimal signal of the product in the initial observations, the presence of Ellman’s
reagent (DTNB) appeared to facilitate higher levels of thio-glucose release, as
evidenced by DTNB capture to produce a mixed disulfide. (Please note: Further
experimental methods and LC-MS analysis detailing the elimination behavior of
thioglucose and its capture in the presence of Ellman’s reagent to produce the mixed
disulfide are located in Appendix III.)
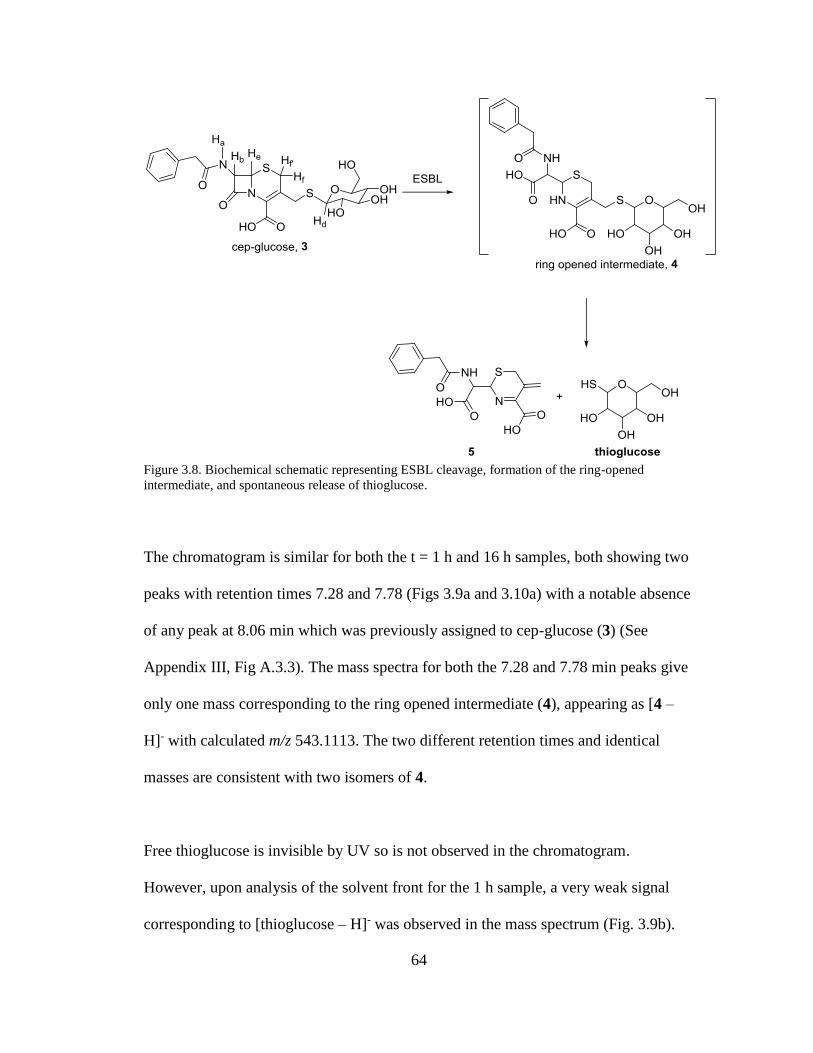
64
Figure 3.8. Biochemical schematic representing ESBL cleavage, formation of the ring-opened
intermediate, and spontaneous release of thioglucose.
The chromatogram is similar for both the t = 1 h and 16 h samples, both showing two
peaks with retention times 7.28 and 7.78 (Figs 3.9a and 3.10a) with a notable absence
of any peak at 8.06 min which was previously assigned to cep-glucose (3) (See
Appendix III, Fig A.3.3). The mass spectra for both the 7.28 and 7.78 min peaks give
only one mass corresponding to the ring opened intermediate (4), appearing as [4 –
H]- with calculated m/z 543.1113. The two different retention times and identical
masses are consistent with two isomers of 4.
Free thioglucose is invisible by UV so is not observed in the chromatogram.
However, upon analysis of the solvent front for the 1 h sample, a very weak signal
corresponding to [thioglucose – H]- was observed in the mass spectrum (Fig. 3.9b).
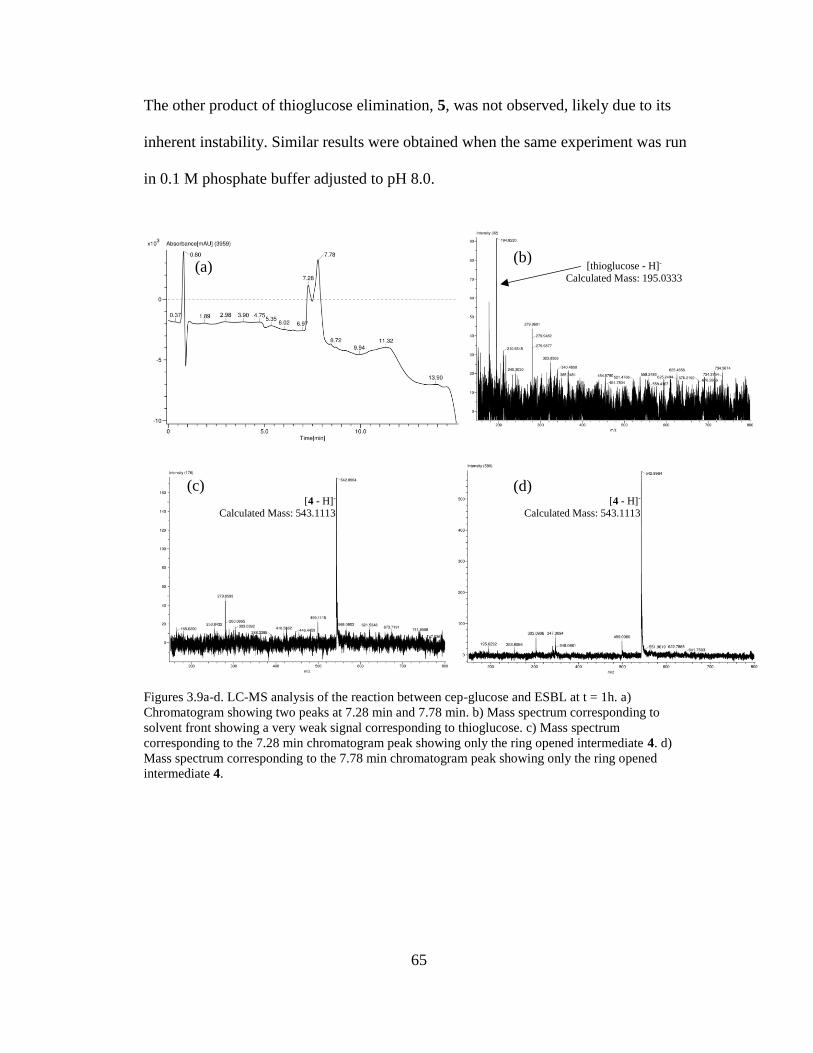
65
The other product of thioglucose elimination, 5, was not observed, likely due to its
inherent instability. Similar results were obtained when the same experiment was run
in 0.1 M phosphate buffer adjusted to pH 8.0.
Figures 3.9a-d. LC-MS analysis of the reaction between cep-glucose and ESBL at t = 1h. a)
Chromatogram showing two peaks at 7.28 min and 7.78 min. b) Mass spectrum corresponding to
solvent front showing a very weak signal corresponding to thioglucose. c) Mass spectrum
corresponding to the 7.28 min chromatogram peak showing only the ring opened intermediate 4. d)
Mass spectrum corresponding to the 7.78 min chromatogram peak showing only the ring opened
intermediate 4.
(a) (b)
(c) (d)
[thioglucose - H]-
Calculated Mass: 195.0333
[4 - H]- Calculated Mass: 543.1113
[4 - H]- Calculated Mass: 543.1113
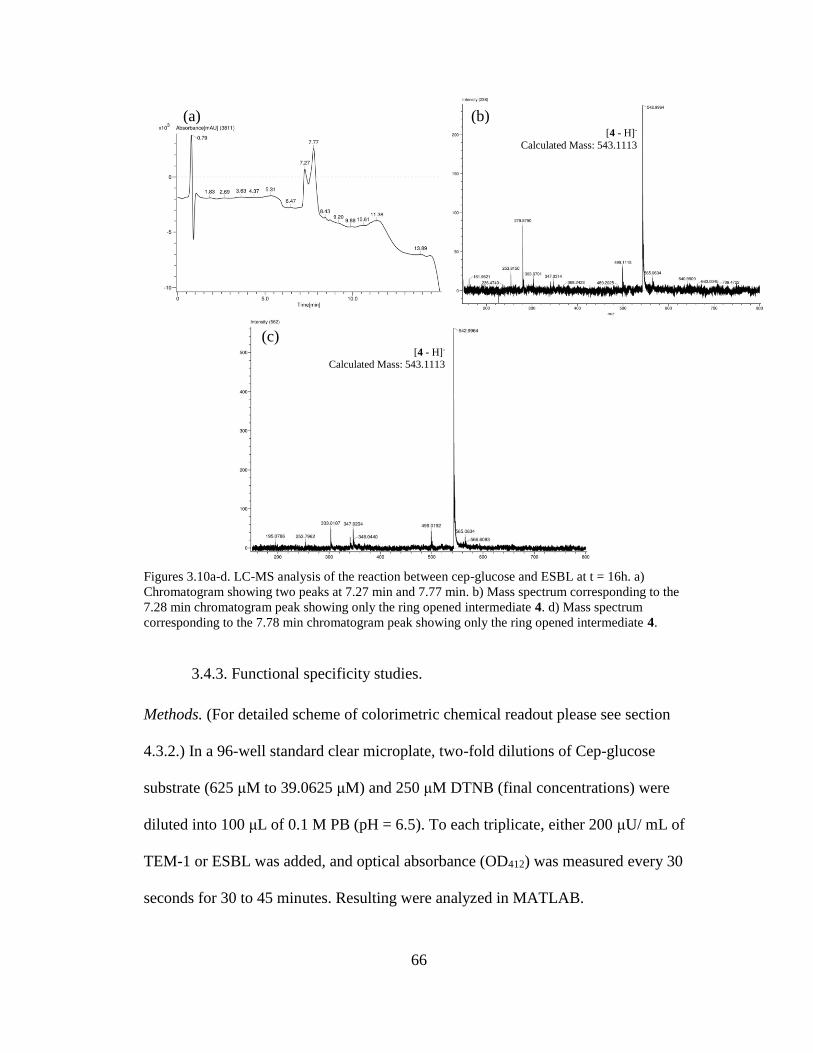
66
Figures 3.10a-d. LC-MS analysis of the reaction between cep-glucose and ESBL at t = 16h. a)
Chromatogram showing two peaks at 7.27 min and 7.77 min. b) Mass spectrum corresponding to the
7.28 min chromatogram peak showing only the ring opened intermediate 4. d) Mass spectrum
corresponding to the 7.78 min chromatogram peak showing only the ring opened intermediate 4.
3.4.3. Functional specificity studies.
Methods. (For detailed scheme of colorimetric chemical readout please see section
4.3.2.) In a 96-well standard clear microplate, two-fold dilutions of Cep-glucose
substrate (625 μM to 39.0625 μM) and 250 μM DTNB (final concentrations) were
diluted into 100 μL of 0.1 M PB (pH = 6.5). To each triplicate, either 200 μU/ mL of
TEM-1 or ESBL was added, and optical absorbance (OD412) was measured every 30
seconds for 30 to 45 minutes. Resulting were analyzed in MATLAB.
(a) (b)
(c) [4 - H]-
Calculated Mass: 543.1113
[4 - H]-
Calculated Mass: 543.1113
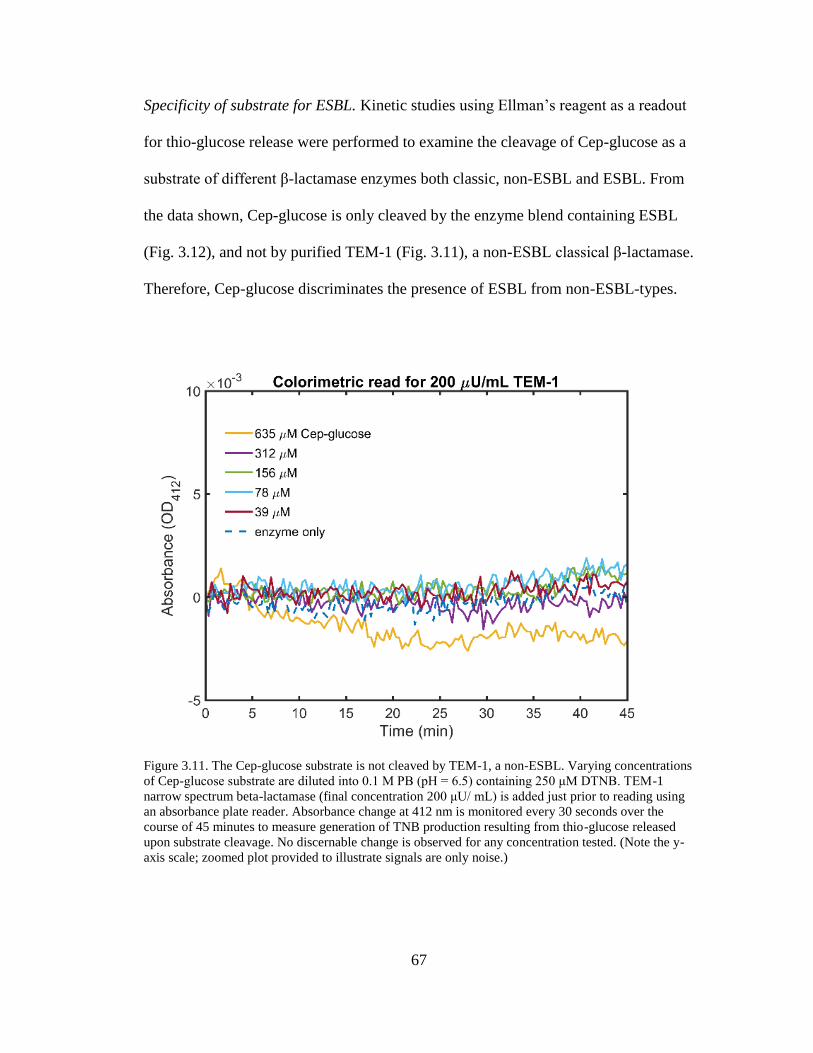
67
Specificity of substrate for ESBL. Kinetic studies using Ellman’s reagent as a readout
for thio-glucose release were performed to examine the cleavage of Cep-glucose as a
substrate of different β-lactamase enzymes both classic, non-ESBL and ESBL. From
the data shown, Cep-glucose is only cleaved by the enzyme blend containing ESBL
(Fig. 3.12), and not by purified TEM-1 (Fig. 3.11), a non-ESBL classical β-lactamase.
Therefore, Cep-glucose discriminates the presence of ESBL from non-ESBL-types.
Figure 3.11. The Cep-glucose substrate is not cleaved by TEM-1, a non-ESBL. Varying concentrations
of Cep-glucose substrate are diluted into 0.1 M PB (pH = 6.5) containing 250 μM DTNB. TEM-1
narrow spectrum beta-lactamase (final concentration 200 μU/ mL) is added just prior to reading using
an absorbance plate reader. Absorbance change at 412 nm is monitored every 30 seconds over the
course of 45 minutes to measure generation of TNB production resulting from thio-glucose released
upon substrate cleavage. No discernable change is observed for any concentration tested. (Note the y-
axis scale; zoomed plot provided to illustrate signals are only noise.)
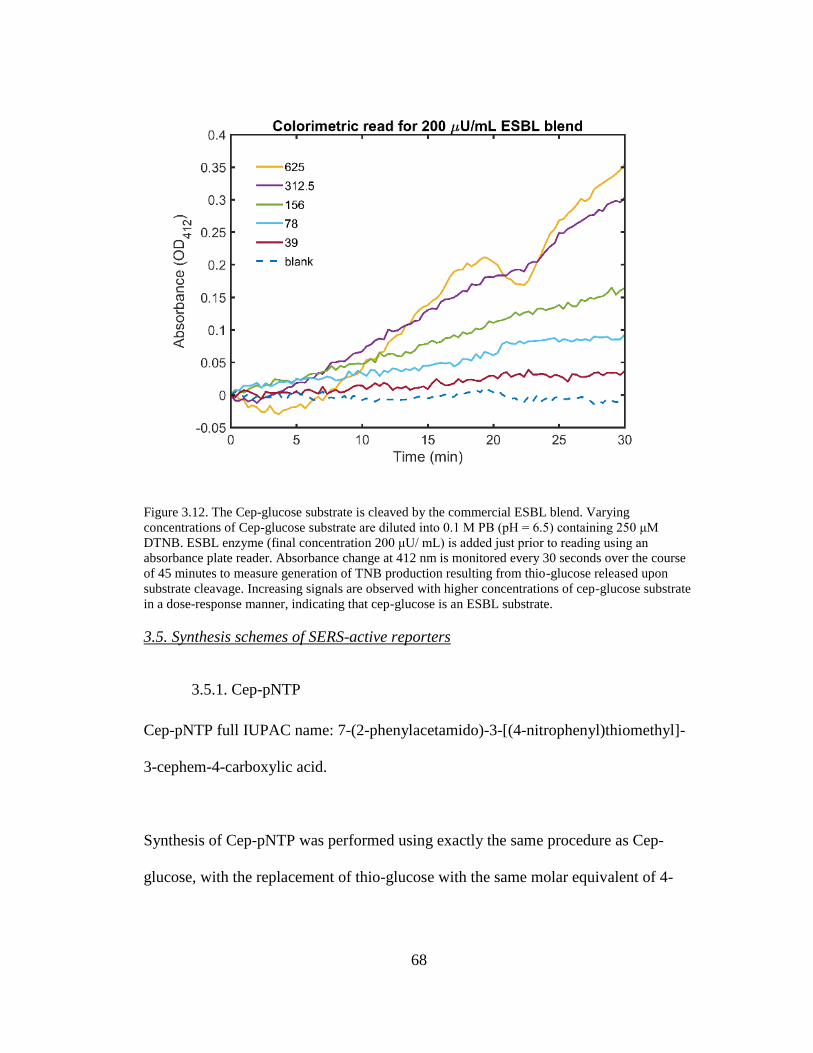
68
Figure 3.12. The Cep-glucose substrate is cleaved by the commercial ESBL blend. Varying
concentrations of Cep-glucose substrate are diluted into 0.1 M PB (pH = 6.5) containing 250 μM
DTNB. ESBL enzyme (final concentration 200 μU/ mL) is added just prior to reading using an
absorbance plate reader. Absorbance change at 412 nm is monitored every 30 seconds over the course
of 45 minutes to measure generation of TNB production resulting from thio-glucose released upon
substrate cleavage. Increasing signals are observed with higher concentrations of cep-glucose substrate
in a dose-response manner, indicating that cep-glucose is an ESBL substrate.
3.5. Synthesis schemes of SERS-active reporters
3.5.1. Cep-pNTP
Cep-pNTP full IUPAC name: 7-(2-phenylacetamido)-3-[(4-nitrophenyl)thiomethyl]-
3-cephem-4-carboxylic acid.
Synthesis of Cep-pNTP was performed using exactly the same procedure as Cep-
glucose, with the replacement of thio-glucose with the same molar equivalent of 4-
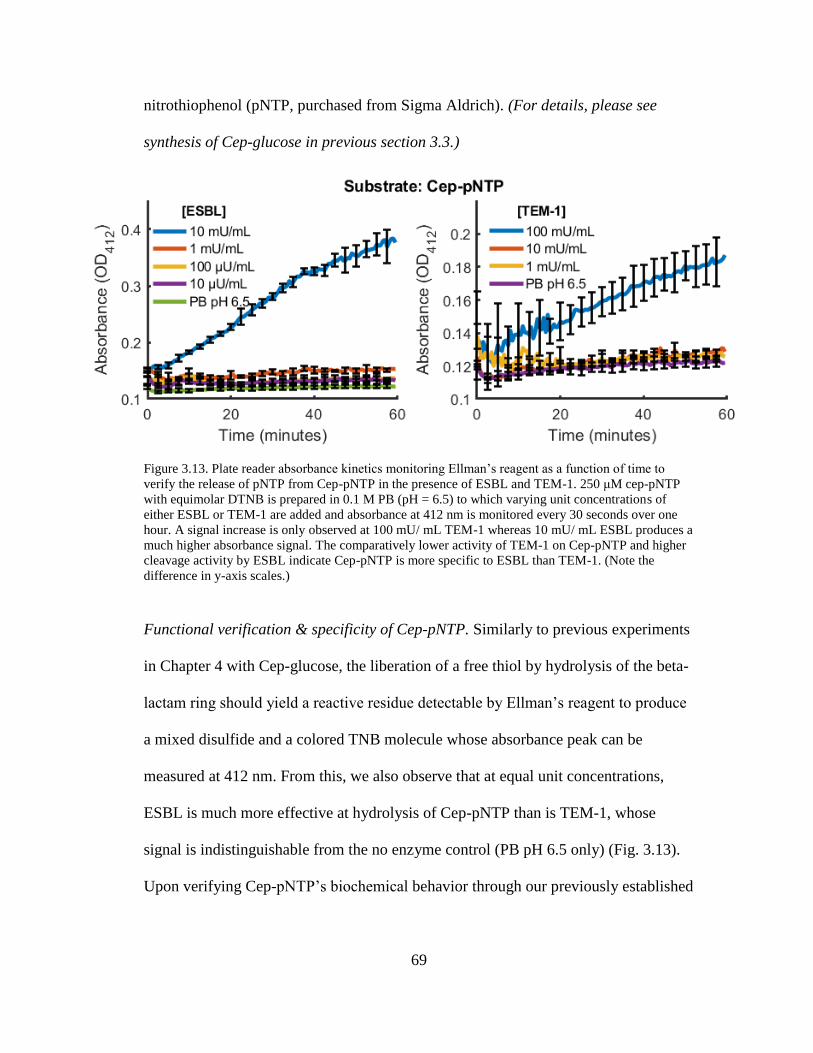
69
nitrothiophenol (pNTP, purchased from Sigma Aldrich). (For details, please see
synthesis of Cep-glucose in previous section 3.3.)
Figure 3.13. Plate reader absorbance kinetics monitoring Ellman’s reagent as a function of time to
verify the release of pNTP from Cep-pNTP in the presence of ESBL and TEM-1. 250 μM cep-pNTP
with equimolar DTNB is prepared in 0.1 M PB (pH = 6.5) to which varying unit concentrations of
either ESBL or TEM-1 are added and absorbance at 412 nm is monitored every 30 seconds over one
hour. A signal increase is only observed at 100 mU/ mL TEM-1 whereas 10 mU/ mL ESBL produces a
much higher absorbance signal. The comparatively lower activity of TEM-1 on Cep-pNTP and higher
cleavage activity by ESBL indicate Cep-pNTP is more specific to ESBL than TEM-1. (Note the
difference in y-axis scales.)
Functional verification & specificity of Cep-pNTP. Similarly to previous experiments
in Chapter 4 with Cep-glucose, the liberation of a free thiol by hydrolysis of the beta-
lactam ring should yield a reactive residue detectable by Ellman’s reagent to produce
a mixed disulfide and a colored TNB molecule whose absorbance peak can be
measured at 412 nm. From this, we also observe that at equal unit concentrations,
ESBL is much more effective at hydrolysis of Cep-pNTP than is TEM-1, whose
signal is indistinguishable from the no enzyme control (PB pH 6.5 only) (Fig. 3.13).
Upon verifying Cep-pNTP’s biochemical behavior through our previously established
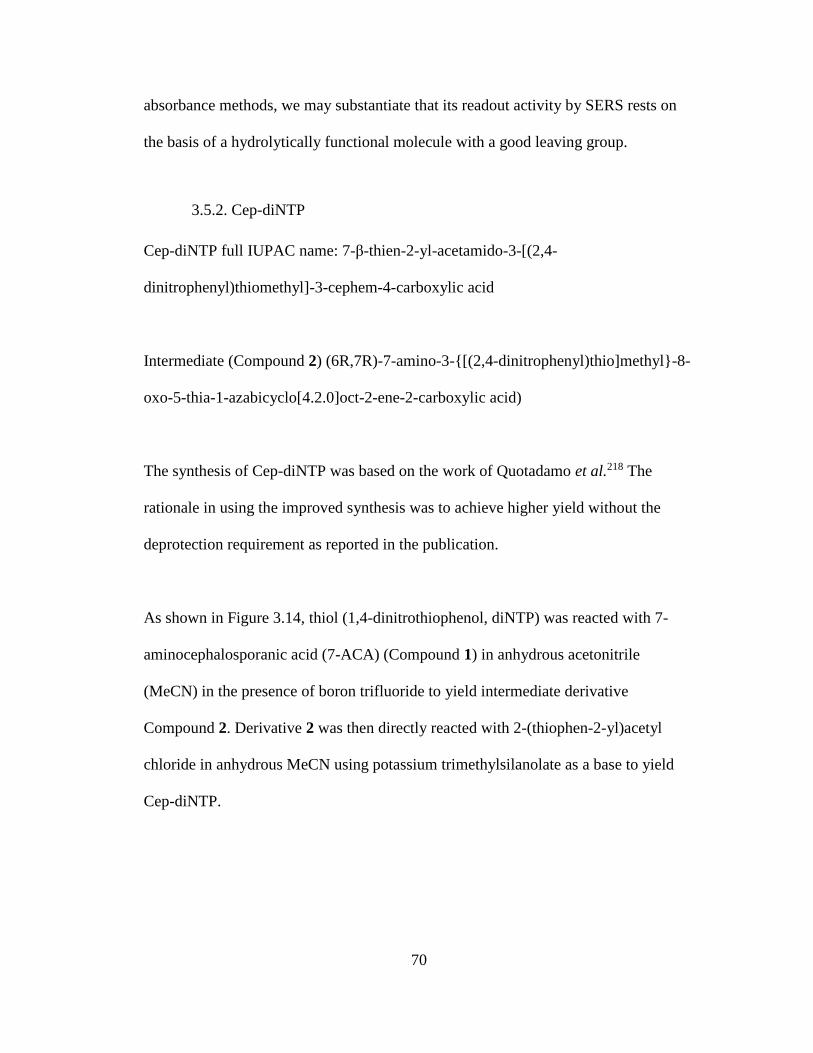
70
absorbance methods, we may substantiate that its readout activity by SERS rests on
the basis of a hydrolytically functional molecule with a good leaving group.
3.5.2. Cep-diNTP
Cep-diNTP full IUPAC name: 7-β-thien-2-yl-acetamido-3-[(2,4-
dinitrophenyl)thiomethyl]-3-cephem-4-carboxylic acid
Intermediate (Compound 2) (6R,7R)-7-amino-3-{[(2,4-dinitrophenyl)thio]methyl}-8-
oxo-5-thia-1-azabicyclo[4.2.0]oct-2-ene-2-carboxylic acid)
The synthesis of Cep-diNTP was based on the work of Quotadamo et al.218 The
rationale in using the improved synthesis was to achieve higher yield without the
deprotection requirement as reported in the publication.
As shown in Figure 3.14, thiol (1,4-dinitrothiophenol, diNTP) was reacted with 7-
aminocephalosporanic acid (7-ACA) (Compound 1) in anhydrous acetonitrile
(MeCN) in the presence of boron trifluoride to yield intermediate derivative
Compound 2. Derivative 2 was then directly reacted with 2-(thiophen-2-yl)acetyl
chloride in anhydrous MeCN using potassium trimethylsilanolate as a base to yield
Cep-diNTP.
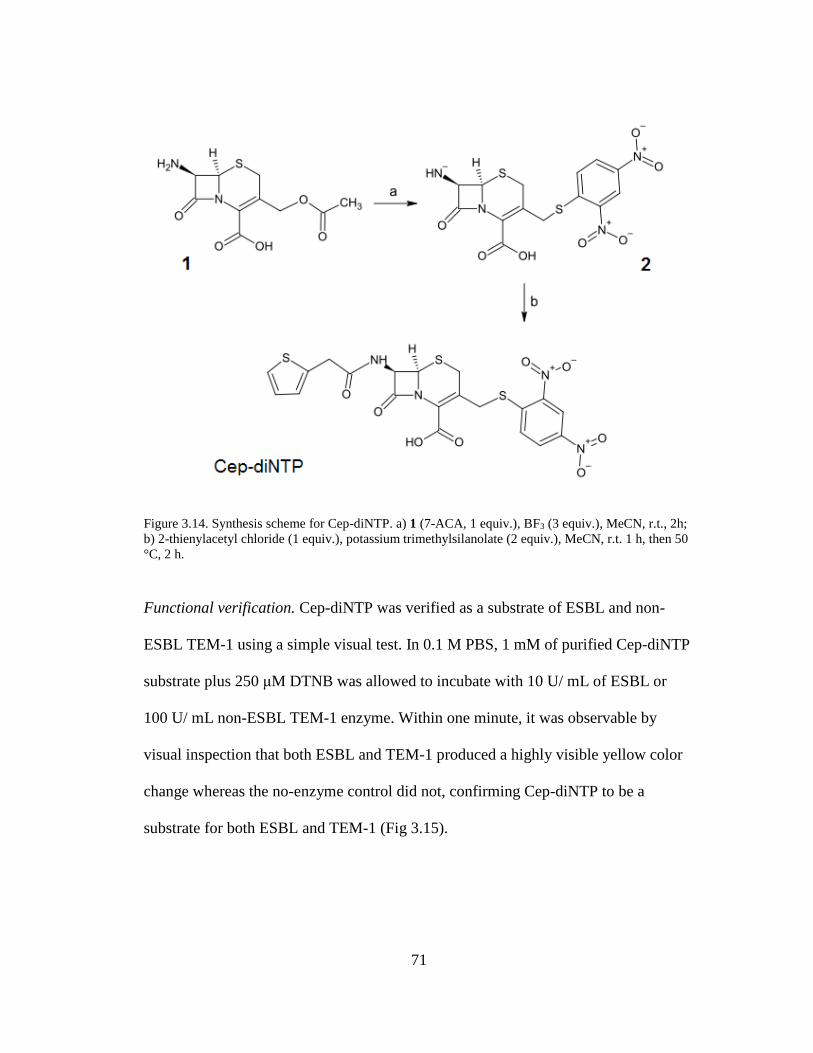
71
Figure 3.14. Synthesis scheme for Cep-diNTP. a) 1 (7-ACA, 1 equiv.), BF3 (3 equiv.), MeCN, r.t., 2h;
b) 2-thienylacetyl chloride (1 equiv.), potassium trimethylsilanolate (2 equiv.), MeCN, r.t. 1 h, then 50
°C, 2 h.
Functional verification. Cep-diNTP was verified as a substrate of ESBL and non-
ESBL TEM-1 using a simple visual test. In 0.1 M PBS, 1 mM of purified Cep-diNTP
substrate plus 250 μM DTNB was allowed to incubate with 10 U/ mL of ESBL or
100 U/ mL non-ESBL TEM-1 enzyme. Within one minute, it was observable by
visual inspection that both ESBL and TEM-1 produced a highly visible yellow color
change whereas the no-enzyme control did not, confirming Cep-diNTP to be a
substrate for both ESBL and TEM-1 (Fig 3.15).
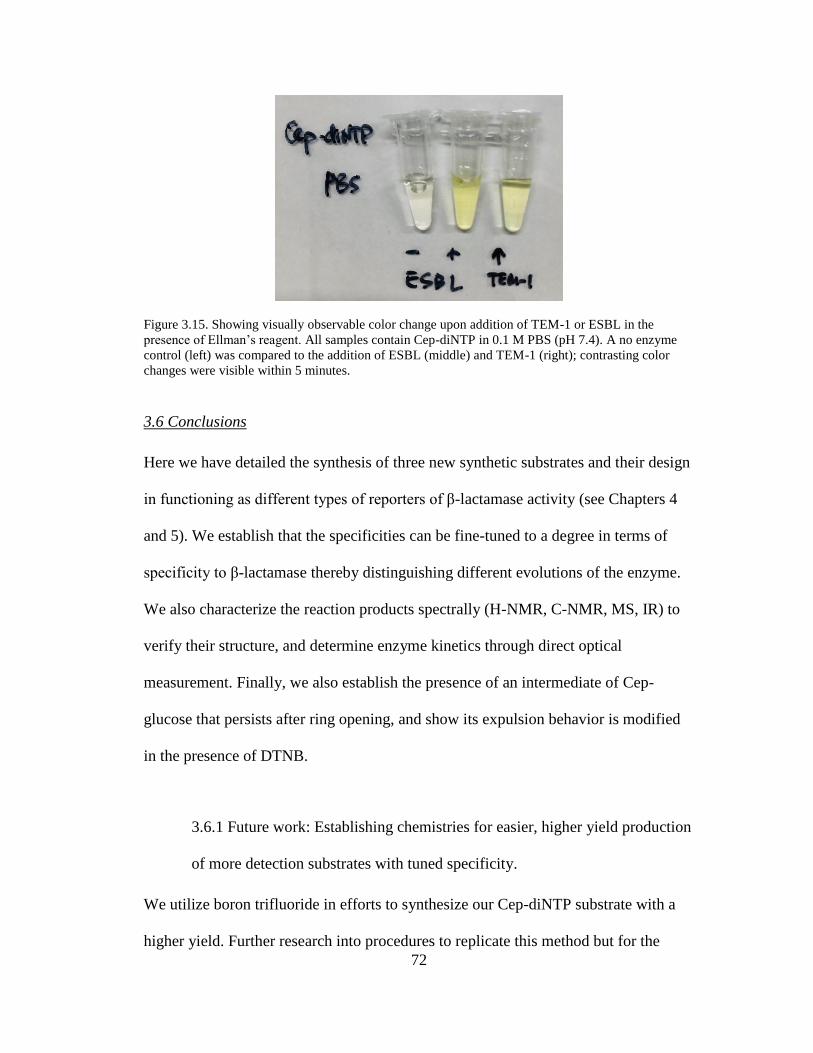
72
Figure 3.15. Showing visually observable color change upon addition of TEM-1 or ESBL in the
presence of Ellman’s reagent. All samples contain Cep-diNTP in 0.1 M PBS (pH 7.4). A no enzyme
control (left) was compared to the addition of ESBL (middle) and TEM-1 (right); contrasting color
changes were visible within 5 minutes.
3.6 Conclusions
Here we have detailed the synthesis of three new synthetic substrates and their design
in functioning as different types of reporters of β-lactamase activity (see Chapters 4
and 5). We establish that the specificities can be fine-tuned to a degree in terms of
specificity to β-lactamase thereby distinguishing different evolutions of the enzyme.
We also characterize the reaction products spectrally (H-NMR, C-NMR, MS, IR) to
verify their structure, and determine enzyme kinetics through direct optical
measurement. Finally, we also establish the presence of an intermediate of Cep-
glucose that persists after ring opening, and show its expulsion behavior is modified
in the presence of DTNB.
3.6.1 Future work: Establishing chemistries for easier, higher yield production
of more detection substrates with tuned specificity.
We utilize boron trifluoride in efforts to synthesize our Cep-diNTP substrate with a
higher yield. Further research into procedures to replicate this method but for the
73
production of more detection substrates with different reporter moieties as well as
different amide side chain determined specificities would be of high utility, especially
in looking toward parallelization of array-format testing, or further multiplexing
perhaps in a single or few samples.
3.6.2 Future work: Oxidation of the Cephem starting material.
Established procedures in the literature for the oxidation of the PMB-Cep-Cl starting
material (either single or double) have shown increased stability15 and higher yield of
the Δ2-Δ3 isomer that allows reporter release219 (shown in the schematic). Future work
on our current substrates could be to modify the starting materials to study their
stability behavior and synthetic yields, as outlined by Scheme 3.2.3 below.
Figure 3.16. (Synthetic plan) Oxidation of the starting material with the use of mCPBA; a) mCPBA,
DCM, 0°C 1 h, r.t. 4 h; b) mCPBA, DCM, 0°C 30 min, r.t. overnight. 1 is produced from (a) only, 2
from both (a) and (b).
74
Chapter 4: Cep-glucose, a trimodal detection substrate
4.1 Introduction
Bacterial resistance to β-lactam antibiotics continues to grow as their misadministration
presents evolutionary pressure that drives bacteria to develop improved resistance
enzymes. Known as extended-spectrum β-lactamases (ESBLs), these are capable of
hydrolyzing advanced β-lactam antibiotics such as third- and fourth-generation
cephalosporins. Phenotypic detection substrates can be used to rapidly identify a
cultured patient sample within minutes prior to confirmation by more exhaustive but
slower means, critically aiding in the antibiotic stewardship essential in maintaining
the effectiveness of not only the cephalosporins but indirectly also the carbapenems,
our last-resort β-lactams. To enhance the phenotypic detection arsenal, we have
designed an ESBL detection substrate that releases a glucose molecule upon β-
lactamase cleavage. Because many forms of detection for glucose exist, the substrate
enables ESBL quantification via three modalities commonly found in the clinical
laboratory: optical absorbance, for use with the most common microbiology platforms;
fluorescence, for enhanced sensitivity; and electrochemistry, which offers the potential
for integration into a handheld platform similar to a personal glucometer.
As fluorescence measurement is generally accepted to have higher sensitivities than
chromogens, which rely on absorbance spectrophotometry, the development of
fluorogenic ESBL substrates has expanded the phenotypic detection repertoire with
the promise of lower limits of detection.15–20 They include substrates that have been
75
designed to release well-characterized coumarins upon specific cleavage by advanced
ESBLs including metallo-β-lactamases (MBLs), an improvement on substrates unable
to distinguish β-lactamases with extended-spectrum profiles from narrow-spectrum β-
lactamases.21 Yet, as previously described methodologies require the specialization
of a central microbiology lab facility, resistance testing away from equipped central
labs, such as in disadvantaged regions, remains an underserved goal. Electrochemical
readouts of a redox-active reporter have the potential to meet this paradigm, as
demonstrated by the handheld personal glucose meter (PGM). Amperometric
measurements of hydrolyzed Nitrocefin have also been reported in the literature, with
the aim toward rapid detection of ESBL activity using disposable screen-printed
sensors with small sample volumes to enable robust, field-portable instrumentation.26
The description of multiple methods for resistance readout is promising as a multi-
pronged approach to AMR detection, yet, each of these testing methods requires
specific substrates, with each their own optimal readout modality. A single ESBL
substrate possessing the versatility to enable different aforementioned readout
techniques would democratize AMR testing access, as standard laboratories tend to
have equipment for optical absorbance measurement, and more specialized, central
laboratories possess fluorescence enabled equipment for sensitive detection (e.g.,
MicroScan Walkaway). Furthermore, though amperometric AMR detection is
uncommon, establishing this methodology holds great promise toward the development
of handheld, portable detection modules for use outside of equipped central lab
facilities.
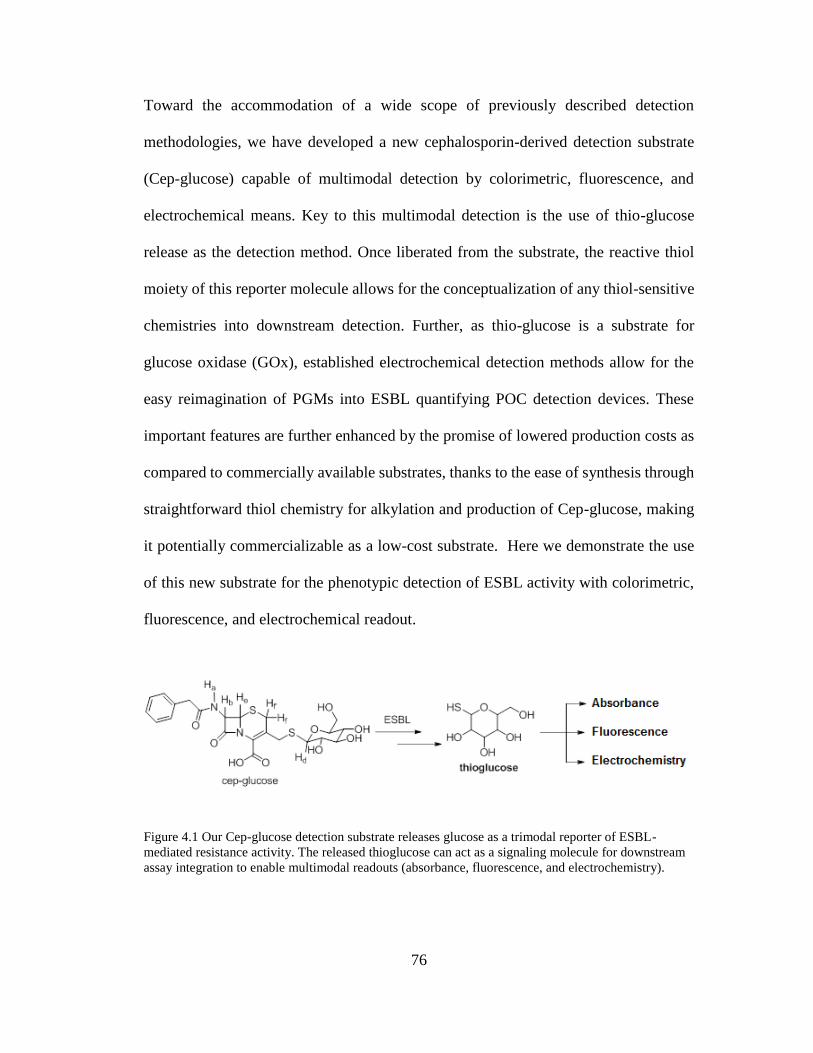
76
Toward the accommodation of a wide scope of previously described detection
methodologies, we have developed a new cephalosporin-derived detection substrate
(Cep-glucose) capable of multimodal detection by colorimetric, fluorescence, and
electrochemical means. Key to this multimodal detection is the use of thio-glucose
release as the detection method. Once liberated from the substrate, the reactive thiol
moiety of this reporter molecule allows for the conceptualization of any thiol-sensitive
chemistries into downstream detection. Further, as thio-glucose is a substrate for
glucose oxidase (GOx), established electrochemical detection methods allow for the
easy reimagination of PGMs into ESBL quantifying POC detection devices. These
important features are further enhanced by the promise of lowered production costs as
compared to commercially available substrates, thanks to the ease of synthesis through
straightforward thiol chemistry for alkylation and production of Cep-glucose, making
it potentially commercializable as a low-cost substrate. Here we demonstrate the use
of this new substrate for the phenotypic detection of ESBL activity with colorimetric,
fluorescence, and electrochemical readout.
Figure 4.1 Our Cep-glucose detection substrate releases glucose as a trimodal reporter of ESBL-
mediated resistance activity. The released thioglucose can act as a signaling molecule for downstream
assay integration to enable multimodal readouts (absorbance, fluorescence, and electrochemistry).
77
4.2 Materials and Methods
4.2.1 Reagents and solutions.
Phosphate buffer (PB; 0.1 M; pH = 6.5) and all solutions were prepared with Milli-Q
18-MΩ water (Millipore purification system) and pH-adjusted with HCl. 4-
Methoxybenzyl-3-chloromethyl-7-(2-phenylacetamido)-3-cephem-4-carboxylate was
purchased from TCI America. 1-Thio-β-D-glucose was purchased from Cayman
Chemical Company. Stock solutions of 50 mM Cep-glucose were prepared by
dissolving the purified product in dimethylsulfoxide (DMSO) and aliquots were stored
at -20 °C. Working dilutions were prepared by dissolving the stock solution in PB.
TEM-1 β-lactamase enzyme was purchased from ThermoFisher Scientific. Extended-
spectrum β-lactamase (ESBL) was purchased from AG Scientific (β-lactamase-BS),
and has been tested to show hydrolytic activity against a broad range of β-lactam
compounds including third, fourth, and fifth generation cephalosporins as well as
carbapenems. Due to its reliable cleavage as determined by our enzyme kinetic
characterization studies, this ESBL “blend” was used as a standard in this study, as
specified ESBLs are not commercially available. 5,5’-Dithiobis-[2-nitrobenzoic acid]
(DTNB, Ellman’s reagent) was purchased from Sigma-Aldrich and a 100 mM solution
was always freshly prepared in MilliQ water and diluted into PB to a final working
concentration of 200 μM. Amplex red was purchased from Molecular Probes (Eugene,
OR).
78
4.2.2 New ESBL detection substrate: Cep-glucose
Briefly, Cep-glucose was prepared as follows: 4-methoxybenzyl-3-chloromethyl-7-
(2-phenylacetamido)-3-cephem-4-caboxylate (PMB-Cep-Cl) was dissolved in
acetone and 1-thio-β-D-glucose was added to the reaction and allowed to stir at reflux
for 4 hours. After solvent removal in vacuo, the aqueous layer was extracted with
dichloromethane to yield the para-methoxybenzyl-protected Cep-glucose.
Deprotection was performed using standard trifluoroacetic acid deprotection
procedures to yield the Cep-glucose detection substrate. Full characterization of the
Cep-glucose is presented in the supporting information. For ESBL detection
experiments, Cep-glucose was prepared from frozen stocks less than six months old.
Moderate degradation in performance for long-term storage and for storage at 4 °C
are shown in Appendix IV.
4.2.3 Apparatus.
All electrochemical measurements were carried out on the Model 800B Series
Electrochemical Detector (CH Instruments, Inc.) potentiostat interfaced to a PC
system equipped with the CHI832B Electrochemical Analyzer version 9.02 software.
Zensor TE100 (#ET077-40, EDAQ) screen-printed carbon paste electrodes
possessing a Ag/AgCl reference electrode were used for replicates in cyclic
voltammetric measurements (CV; scan rate of 100 mV s-1), which were performed at
room temperature with a working volume of 100 μL. CV peak heights were
determined using eL-Chem Viewer, a freeware package available online
(www.lchem.cz/elchemviewer.htm).220 All spectral measurements (optical density,
fluorescence) were performed using the SpectraMax M5 (Molecular Devices)
79
multiplate reader interfaced to a PC system equipped with the SoftMax Pro 7
software.
4.2.4 Colorimetric assay with Ellman’s reagent.
Ellman’s reagent reacts with free thiols to form a colored product (absorbance peak at
412 nm) and thus was used to detect the release of thio-glucose upon cleavage of our
Cep-glu substrate. Measurements were carried out at room temperature in standard
96-well microplates in a 100 μL volume, with each well containing 200 μM Ellman’s
reagent and 250 μM Cep-glucose substrate in PB (pH = 6.5).
4.2.5. Fluorimetric assay with Amplex red reagent.
Each 100 μL volume of PB (pH 6.5) contained final concentrations of the following
reagents: 10 μM Amplex Red, 0.5 U GOx, 100 μU HRP, and 250 μM Cep-glucose.
Just prior to reading, experimental dilutions of ESBL or only PB were added in 10 μL
volumes to 90 μL of the previously described solutions. Oxidation of Amplex Red to
resorufin within experimental samples was measured at room temperature over the
course of 60 minutes at 30 second intervals in standard 96-well flat bottom
microplates using the kinetic fluorescent read setting on the microplate reader, with
excitation at 530 nm and emission measurement at 590 nm.
4.2.6 Electrochemical assay via HRP enzyme inhibition by thiols
Electrochemical measurements were performed using carbon screen printed
electrodes from Zensor (EDAQ). Experiments were performed in a 0.1 M phosphate
buffer (pH 6.5) containing 0.5 M KCl to increase the stability of buffer solution
against the Ag/AgCl reference electrode. 1.25 mM hydroquinone was used as a
80
mediator with 12 μM hydrogen peroxide. Each 100 μL reaction volume contained 1
U HRP, which was added after a 15 minute incubation of various dilutions of ESBL
with 500 μM of our Cep-glucose substrate and pipetted to mix prior to measurement.
CVs were run under a potential range of -0.4 to 0.6 V, a 100 mV/s sweep rate, with a
sampling rate of 0.01 V. All samples were run in triplicate using new identical
sensors as each replicate. An inhibitor calibration curve with thio-glucose as the
inhibitor was produced to relate the current to released thio-glucose upon substrate
cleavage following incubation (Appendix V).
4.3 Results and Discussion
4.3.1. Synthesis, verification, and characterization of Cep-glucose detection
substrate.
The Cep-glucose molecule is presented in Scheme 4.1. As the state of research on
detection of glucose and hydrogen peroxide is mature and reliable, we employed a
thiolated form of glucose, 1-thio-β-D-glucose (thio-glucose), as the signaling
molecule that is released upon hydrolysis of the substrate by ESBL. Importantly, as
thiol chemistry would allow for a simple, one-step synthesis methodology followed
by well-established acid-mediated deprotection protocols, we incorporated the
thiolate in SN2 displacement of the halogenated cephalosporin starting material,
PMB-Cep-Cl. The starting material was selected based on prior synthesis
methodology by van Berkel et al.,219 who produced fluorogenic substrates for the
detection of metallo-β-lactamases. Within this context, we expect that the starting
81
material, through the addition of specific side chains, can be generalized to producing
detection substrates cleavable by ESBLs hydrolyzing later-generation (third and
beyond) cephalosporins. As compared to Nitrocefin or CENTA, which are cleavable
by enzymes that inactivate second-generation cephalosporins, our starting material
has a benzyl group where CENTA and Nitrocefin have a thiophene, implying that our
Cep-glucose molecule will be more selective. Following synthesis and purification,
we verified the structure of our substrate through standard procedural analysis of
spectral profiles to confirm the formation of a cephalosporin derivative covalently
attached to thio-glucose (see: Appendix I).
Following synthesis of the new Cep-glucose molecule, we examined the adduct’s
activity as a biochemical substrate for ESBL. Cep-glucose was tested as a substrate
for an ESBL blend as well as individual older-generation β-lactamase TEM-1, which
are not considered as extended spectrum. The kinetic characterization of Cep-glucose
hydrolysis (presented in the Supporting Information) was performed by continuously
recording the absorbance variation at 260 nm, as described in previous literature.171
Using the ESBL blend, I determined that the ESBL and Cep-glucose substrate have a
Michaelis constant KM of 572.65 μM and a catalytic constant kcat of 43.9 s-1, with
catalytic efficiency kcat/ KM to be approximately 0.077 s-1 μM-1 (Vmax = 0.1655 s-1,
MW estimated as 35 kDa). In contrast to more promiscuous substrates like CENTA
and Nitrocefin that are cleavable by nearly all β-lactamases, the starting
cephalosporin material is specific for ESBL and is thus not cleavable by narrow-
spectrum β-lactamases TEM-1 (Please refer to Subsection 3.4.3 for details).
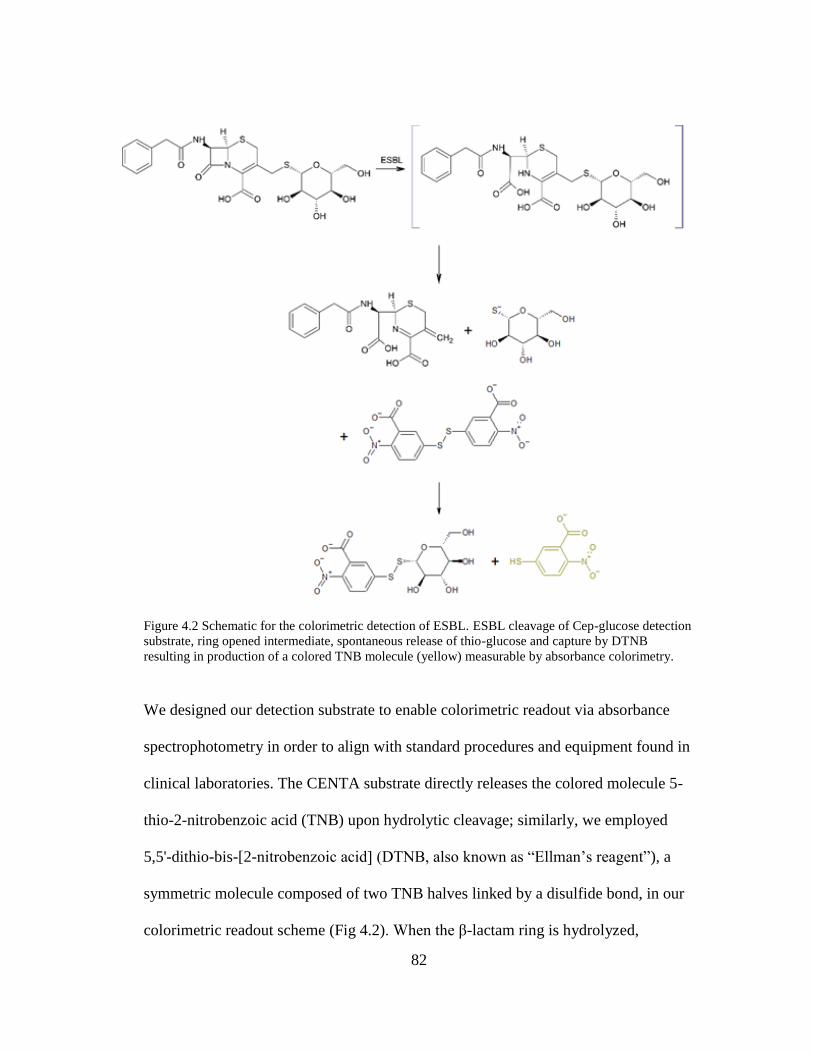
82
Figure 4.2 Schematic for the colorimetric detection of ESBL. ESBL cleavage of Cep-glucose detection
substrate, ring opened intermediate, spontaneous release of thio-glucose and capture by DTNB
resulting in production of a colored TNB molecule (yellow) measurable by absorbance colorimetry.
We designed our detection substrate to enable colorimetric readout via absorbance
spectrophotometry in order to align with standard procedures and equipment found in
clinical laboratories. The CENTA substrate directly releases the colored molecule 5-
thio-2-nitrobenzoic acid (TNB) upon hydrolytic cleavage; similarly, we employed
5,5'-dithio-bis-[2-nitrobenzoic acid] (DTNB, also known as “Ellman’s reagent”), a
symmetric molecule composed of two TNB halves linked by a disulfide bond, in our
colorimetric readout scheme (Fig 4.2). When the β-lactam ring is hydrolyzed,
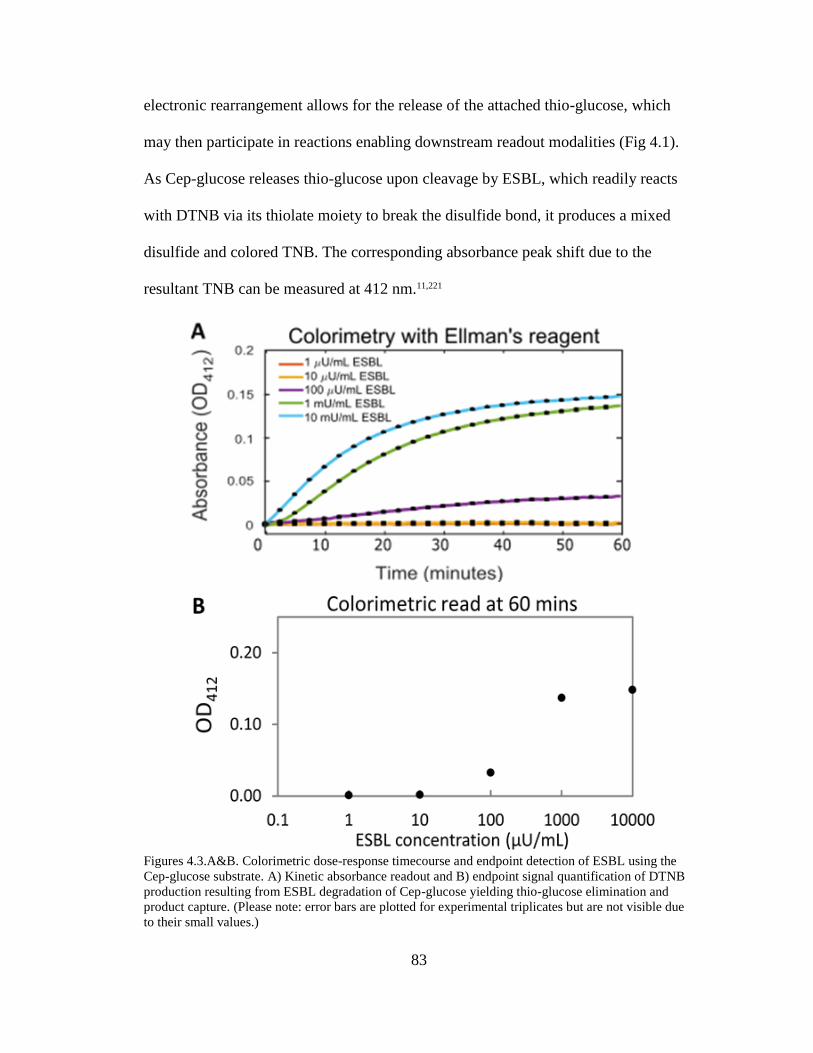
83
electronic rearrangement allows for the release of the attached thio-glucose, which
may then participate in reactions enabling downstream readout modalities (Fig 4.1).
As Cep-glucose releases thio-glucose upon cleavage by ESBL, which readily reacts
with DTNB via its thiolate moiety to break the disulfide bond, it produces a mixed
disulfide and colored TNB. The corresponding absorbance peak shift due to the
resultant TNB can be measured at 412 nm.11,221
Figures 4.3.A&B. Colorimetric dose-response timecourse and endpoint detection of ESBL using the
Cep-glucose substrate. A) Kinetic absorbance readout and B) endpoint signal quantification of DTNB
production resulting from ESBL degradation of Cep-glucose yielding thio-glucose elimination and
product capture. (Please note: error bars are plotted for experimental triplicates but are not visible due
to their small values.)
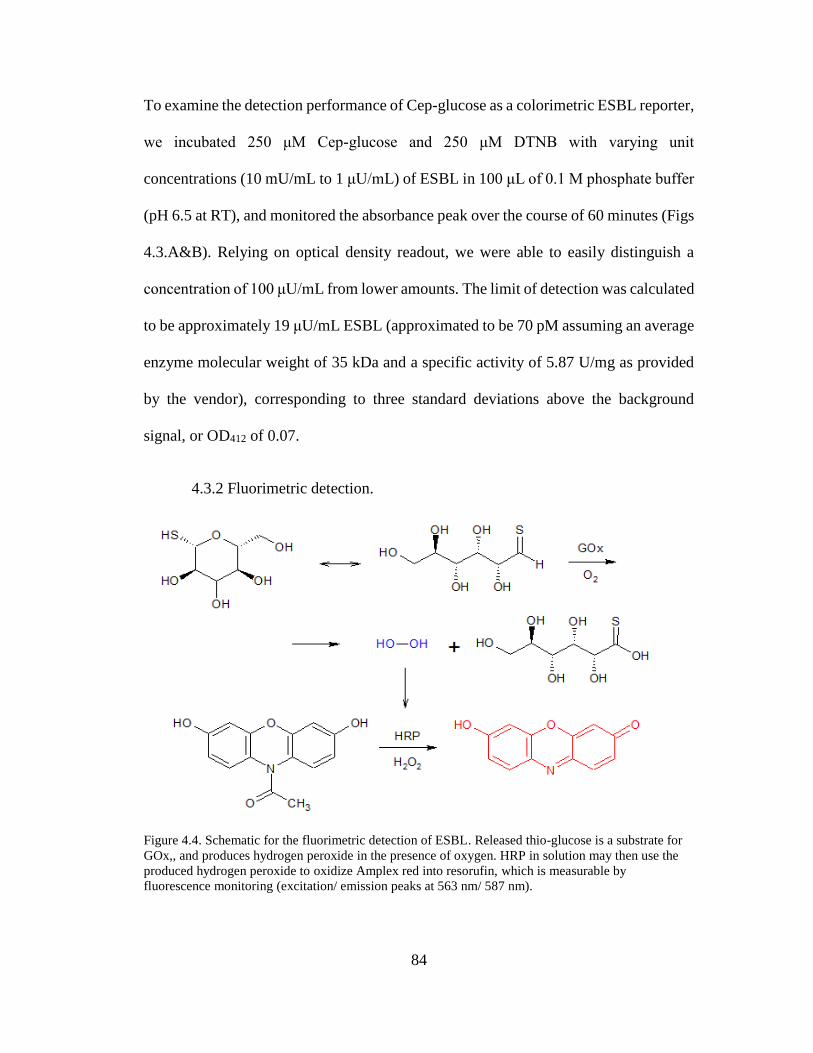
84
To examine the detection performance of Cep-glucose as a colorimetric ESBL reporter,
we incubated 250 μM Cep-glucose and 250 μM DTNB with varying unit
concentrations (10 mU/mL to 1 μU/mL) of ESBL in 100 μL of 0.1 M phosphate buffer
(pH 6.5 at RT), and monitored the absorbance peak over the course of 60 minutes (Figs
4.3.A&B). Relying on optical density readout, we were able to easily distinguish a
concentration of 100 μU/mL from lower amounts. The limit of detection was calculated
to be approximately 19 μU/mL ESBL (approximated to be 70 pM assuming an average
enzyme molecular weight of 35 kDa and a specific activity of 5.87 U/mg as provided
by the vendor), corresponding to three standard deviations above the background
signal, or OD412 of 0.07.
4.3.2 Fluorimetric detection.
Figure 4.4. Schematic for the fluorimetric detection of ESBL. Released thio-glucose is a substrate for
GOx,, and produces hydrogen peroxide in the presence of oxygen. HRP in solution may then use the
produced hydrogen peroxide to oxidize Amplex red into resorufin, which is measurable by
fluorescence monitoring (excitation/ emission peaks at 563 nm/ 587 nm).
85
With the intent of achieving lower limits of detection, we investigated the
incorporation of our Cep-glucose substrate in a biochemical scheme to allow for
measurable fluorometric readout. To accomplish this, we utilized thio-glucose’s
ability to serve as a substrate for glucose oxidase (GOx), producing 1-thio-β-D-
gluconic acid and H2O2222 (Fig 4.4). For our fluorogenic molecule, we chose N-acetyl-
3,7-dihydroxyphenoxazine (Amplex red) as it has been well-characterized as a stable
and sensitive reporter of H2O2, producing highly fluorescent resorufin (excitation
maximum at 563 nm, emission maximum at 587 nm) in an irreversible enzyme-
catalyzed oxidative reaction mediated by HRP.223 Various concentrations of ESBL (1
μU/mL to 10 mU/mL) were incubated with 250 μM Cep-glucose substrate and 10 μM
Amplex red in the presence of 0.5 U GOx and 100 μU HRP in a 100 μL volume of
0.1 M PB (pH 6.5) at room temperature, and the generation of an emission signal was
continuously recorded at 590 nm with excitation at 530 nm over the course of one
hour (Figs 4.5.A&B). With the fluorometric assay, we estimate the limit of detection
to be 0.98 μU/mL ESBL, which generates a signal that is larger than three standard
deviations above the background signal. Though the fluorometric read-out provides
higher sensitivity than the colorimetric read-out, one aspect of the assay design
prevents the difference from being much greater. HRP, which catalyzes the
conversion of Amplex red to fluorescent resorufin, is inhibited by free thiols.224
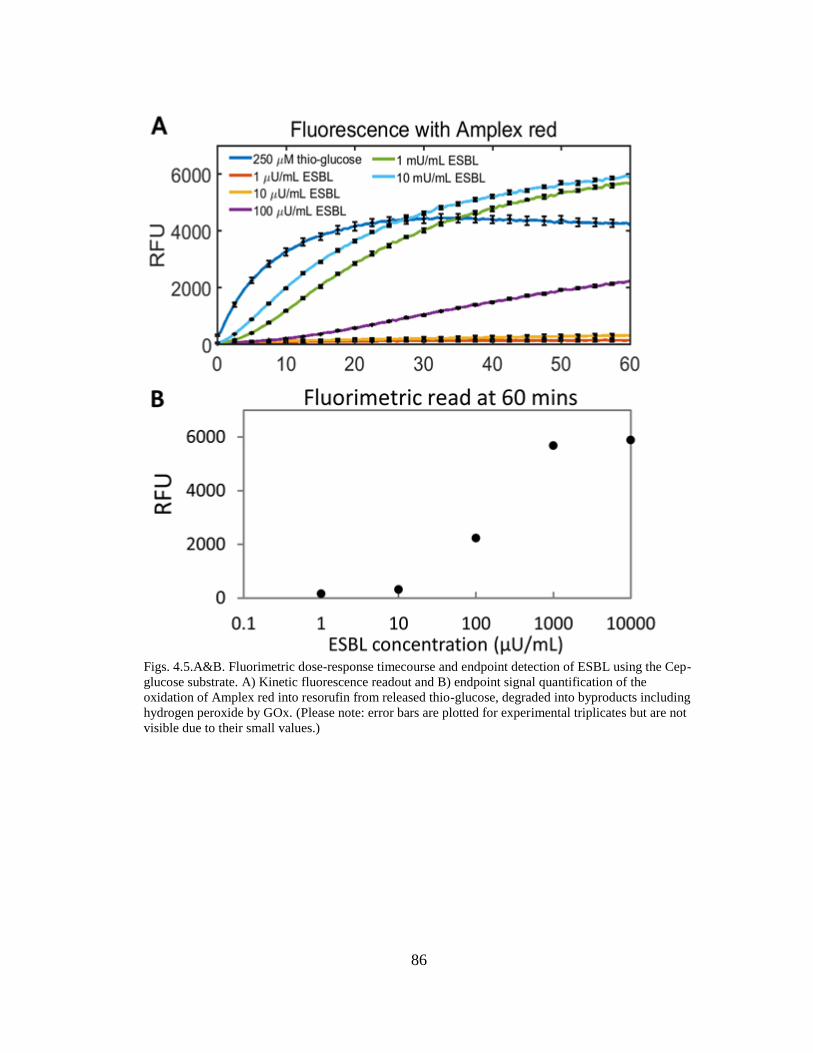
86
Figs. 4.5.A&B. Fluorimetric dose-response timecourse and endpoint detection of ESBL using the Cep-
glucose substrate. A) Kinetic fluorescence readout and B) endpoint signal quantification of the
oxidation of Amplex red into resorufin from released thio-glucose, degraded into byproducts including
hydrogen peroxide by GOx. (Please note: error bars are plotted for experimental triplicates but are not
visible due to their small values.)
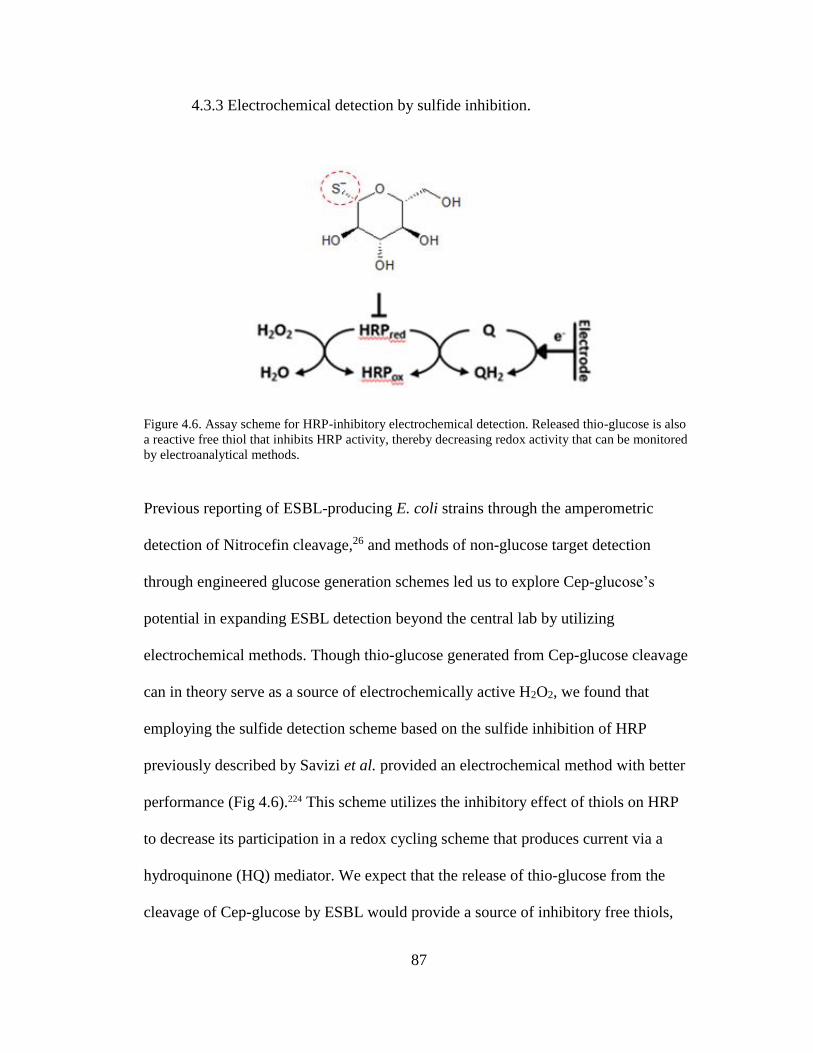
87
4.3.3 Electrochemical detection by sulfide inhibition.
Figure 4.6. Assay scheme for HRP-inhibitory electrochemical detection. Released thio-glucose is also
a reactive free thiol that inhibits HRP activity, thereby decreasing redox activity that can be monitored
by electroanalytical methods.
Previous reporting of ESBL-producing E. coli strains through the amperometric
detection of Nitrocefin cleavage,26 and methods of non-glucose target detection
through engineered glucose generation schemes led us to explore Cep-glucose’s
potential in expanding ESBL detection beyond the central lab by utilizing
electrochemical methods. Though thio-glucose generated from Cep-glucose cleavage
can in theory serve as a source of electrochemically active H2O2, we found that
employing the sulfide detection scheme based on the sulfide inhibition of HRP
previously described by Savizi et al. provided an electrochemical method with better
performance (Fig 4.6).224 This scheme utilizes the inhibitory effect of thiols on HRP
to decrease its participation in a redox cycling scheme that produces current via a
hydroquinone (HQ) mediator. We expect that the release of thio-glucose from the
cleavage of Cep-glucose by ESBL would provide a source of inhibitory free thiols,
88
and sought to demonstrate a dose-dependent current decrease with respect to ESBL.
Varying amounts of ESBL were incubated for 15 minutes under identical conditions
and HRP was added just prior to cyclic voltammetry measurement (time points up to
60 minutes were tested, however no improvement in detection sensitivity was
observed). The depth of the oxidation peak was measured (Figs. 4.7.A&B), showing
a decrease in oxidation current for increasing concentrations of ESBL. A limit of
detection of approximately 66 μU/mL was calculated (3σ above background). We
produced a calibration curve measuring varying known amounts of thio-glucose
(Appendix V). Back calculations using this calibration curve indicate an estimated
release of 147±3.3 μM thio-glucose after incubation of Cep-glucose with 10 mU/mL
ESBL.
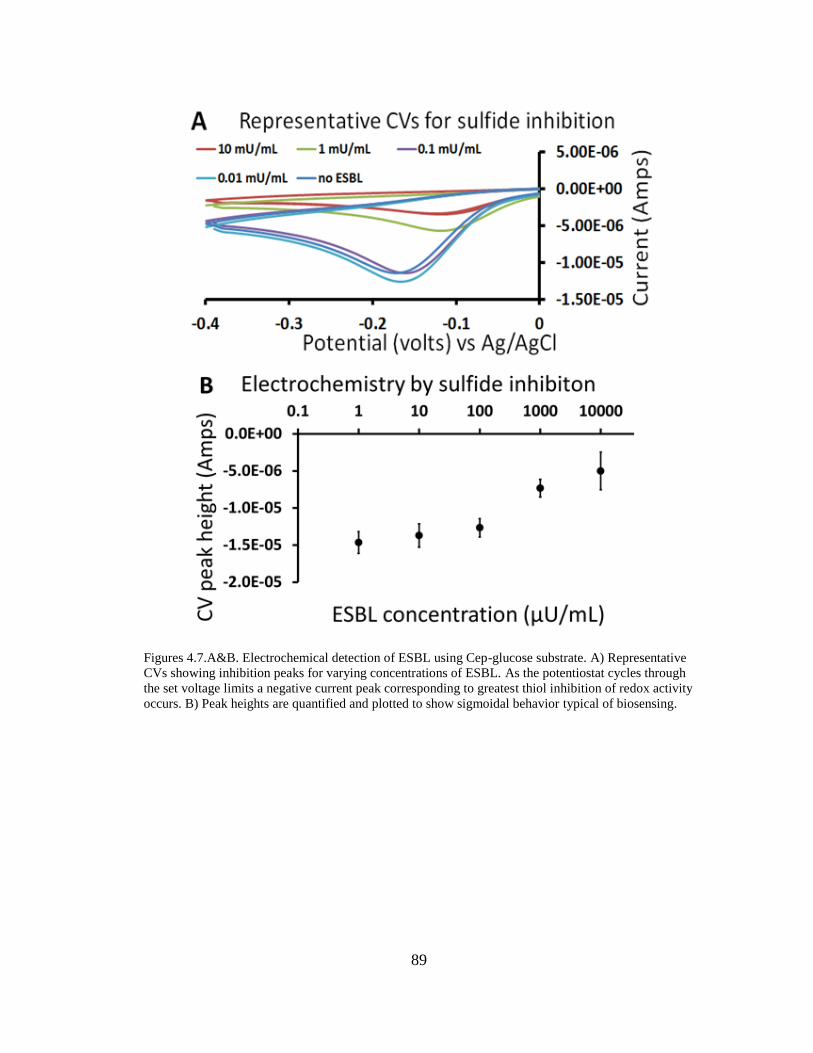
89
Figures 4.7.A&B. Electrochemical detection of ESBL using Cep-glucose substrate. A) Representative
CVs showing inhibition peaks for varying concentrations of ESBL. As the potentiostat cycles through
the set voltage limits a negative current peak corresponding to greatest thiol inhibition of redox activity
occurs. B) Peak heights are quantified and plotted to show sigmoidal behavior typical of biosensing.
90
4.3.4 Electrochemical detection of ESBL using Cep-glucose in a
commercially available personal glucose monitor (PGM)
Methods. The Cep-glucose detection substrate was prepared from a 19.5 mM stock in
deuterated DMSO, diluted into 0.1 M phosphate buffer (pH = 8.5) to a final
concentration of 3 mM. 1 µL of a 1 KU/ mL stock of the ESBL blend (AG Scientific)
was added to 24 µL of the 3 mM Cep-glucose solution (final concentration 40 U/ mL
ESBL) and allowed to incubate at 25ºC for 5 minutes. From this, a 2 µL aliquot was
taken and pipetted onto a square of Parafilm®, a generic glucose oxidase based test
strip (TruePoint, OK Biotech) was inserted into a OneTouch® Ultra2® blood glucose
monitor (PGM) adjusted to calibration setting 49 (as directed on the TruePoint box),
and the reservoir tip was touched to the aliquot allowing the sample to wick up into
the test strip and held in place until a reading was displayed on the PGM. This
process was repeated for the thio-glucose calibration control and the no ESBL
negative control. The experiment was also performed for the following pH ranges:
9.0, 9.5, 10.0, 10.5, 11.0, 11.5.
Results. All pH values tested gave consistent results similar to pH 8.5 (but contributed
to greater error range ± 5 mg/ dL) for the ESBL-positive experimental condition, with
no ESBL registering in the PGM as “ERROR 4” or “low glucose”, and with the
addition of 40 U/ mL ESBL registering just above the 20 mg/ dL displayed limit of
detection. The 2.5 mM thio-glucose positive calibration control (used to compare the
performance of thio-glucose to D-glucose for which the PGM is designed to detect)
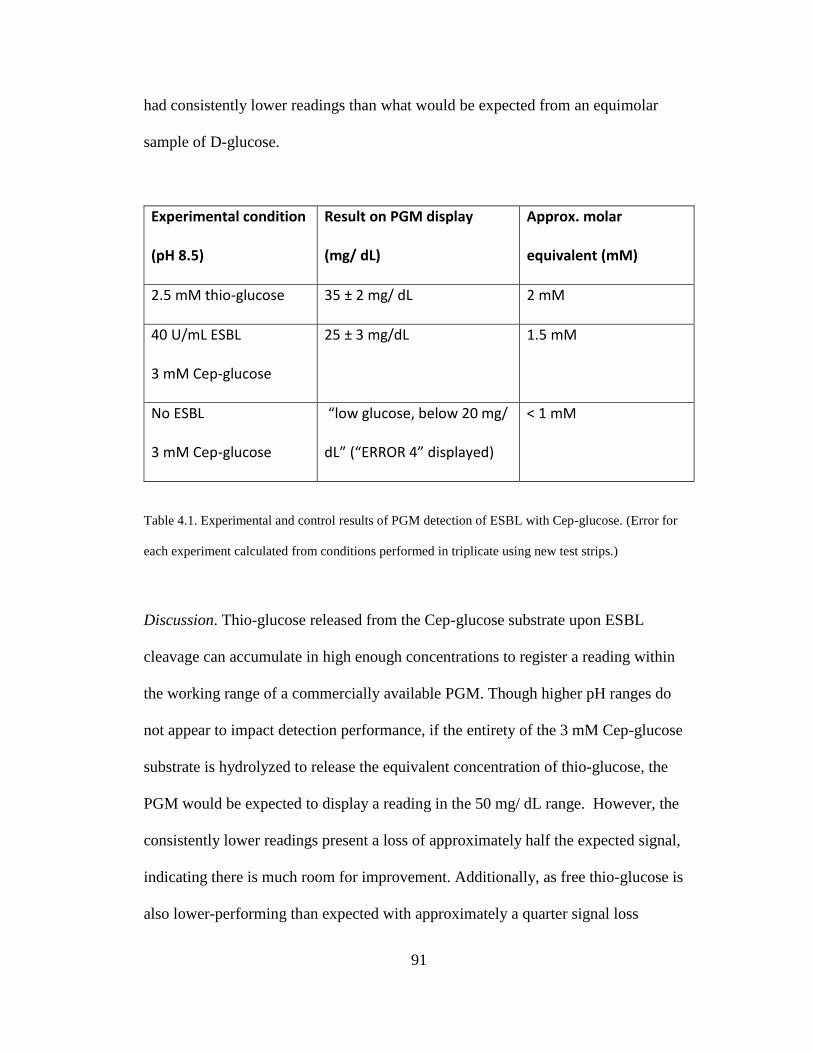
91
had consistently lower readings than what would be expected from an equimolar
sample of D-glucose.
Experimental condition
(pH 8.5)
Result on PGM display
(mg/ dL)
Approx. molar
equivalent (mM)
2.5 mM thio-glucose 35 ± 2 mg/ dL 2 mM
40 U/mL ESBL
3 mM Cep-glucose
25 ± 3 mg/dL 1.5 mM
No ESBL
3 mM Cep-glucose
“low glucose, below 20 mg/
dL” (“ERROR 4” displayed)
< 1 mM
Table 4.1. Experimental and control results of PGM detection of ESBL with Cep-glucose. (Error for
each experiment calculated from conditions performed in triplicate using new test strips.)
Discussion. Thio-glucose released from the Cep-glucose substrate upon ESBL
cleavage can accumulate in high enough concentrations to register a reading within
the working range of a commercially available PGM. Though higher pH ranges do
not appear to impact detection performance, if the entirety of the 3 mM Cep-glucose
substrate is hydrolyzed to release the equivalent concentration of thio-glucose, the
PGM would be expected to display a reading in the 50 mg/ dL range. However, the
consistently lower readings present a loss of approximately half the expected signal,
indicating there is much room for improvement. Additionally, as free thio-glucose is
also lower-performing than expected with approximately a quarter signal loss
92
(expected reading for 2.5 mM glucose is 35 mg/ dL), it may be an inherent property
of thio-glucose as a poor substrate for glucose oxidase. Other strong considerations
are the limiting rate of thio-glucose release from the ring-opened Cep-glucose
intermediate, and if the released free thiol exerts any inhibitory effects in the
TruePoint test strips that would impact electrochemical readout.
4.3.5 Detection of ESBL-producing E. coli.
SHV-4 ESBL-producing E. coli (strain J53-2 pUD21, ATCC product number BAA-
200) were initially streaked onto tryptic soy agar (Difco) plates containing 10 µg/mL
ceftazidime as a selection agent and allowed to incubate overnight at 37 ºC to produce
single colonies. From this, one colony was selected and allowed to grow overnight
(16 hours, shaking at 37 ºC) in liquid tryptic soy broth (10 mL volume) containing 10
µg/mL ceftazidime. CFU dilutions were prepared directly in PBS from the turbid
culture. In a 96-well microplate, various conditions were prepared in 100 µL total
volume of 0.1 M PBS (pH = 7.4): bacteria only, bacteria with 250 µM Ellman’s
reagent, and ten-fold dilutions of bacteria (including a no bacteria control) with 250
µM Cep-glucose detection substrate and 250 µM Ellman’s reagent. Samples were
incubated in the microplate at 25 ºC and absorbance measurements at 412 nm were
taken at 2 hours and 4 hours using a microplate reader.
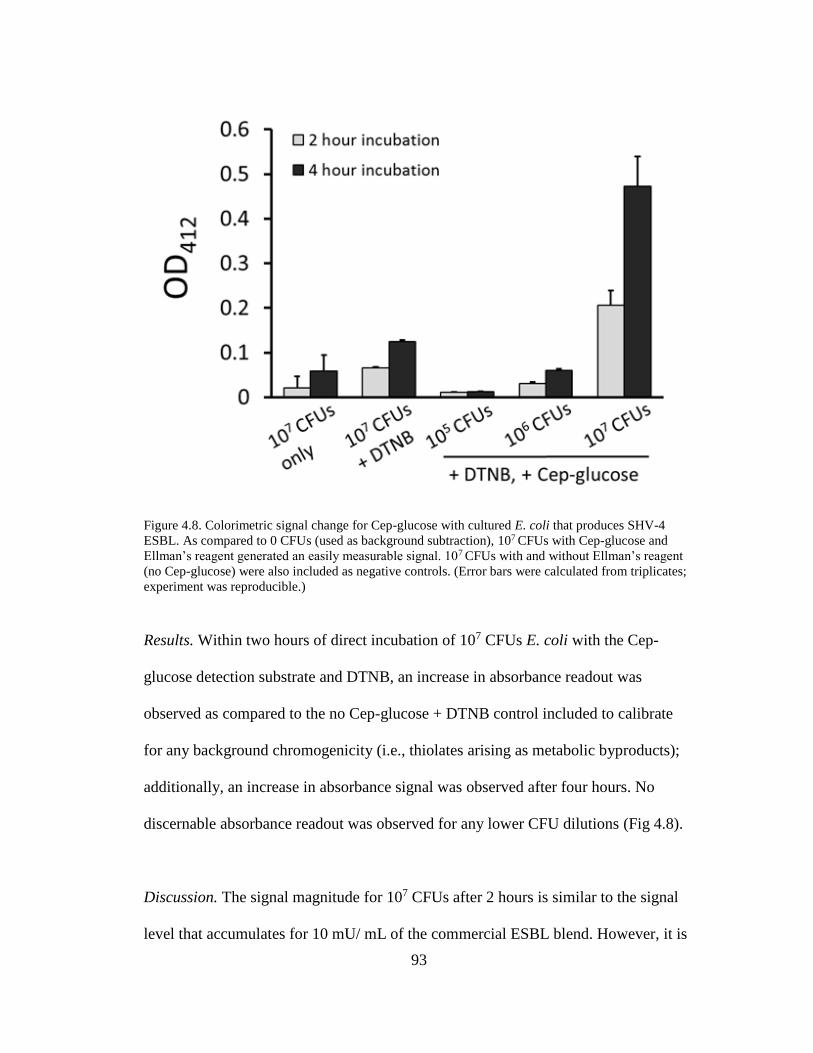
93
Figure 4.8. Colorimetric signal change for Cep-glucose with cultured E. coli that produces SHV-4
ESBL. As compared to 0 CFUs (used as background subtraction), 107 CFUs with Cep-glucose and
Ellman’s reagent generated an easily measurable signal. 107 CFUs with and without Ellman’s reagent
(no Cep-glucose) were also included as negative controls. (Error bars were calculated from triplicates;
experiment was reproducible.)
Results. Within two hours of direct incubation of 107 CFUs E. coli with the Cep-
glucose detection substrate and DTNB, an increase in absorbance readout was
observed as compared to the no Cep-glucose + DTNB control included to calibrate
for any background chromogenicity (i.e., thiolates arising as metabolic byproducts);
additionally, an increase in absorbance signal was observed after four hours. No
discernable absorbance readout was observed for any lower CFU dilutions (Fig 4.8).
Discussion. The signal magnitude for 107 CFUs after 2 hours is similar to the signal
level that accumulates for 10 mU/ mL of the commercial ESBL blend. However, it is
94
unclear how the onset of observable ESBL activity with live cells compares with our
previous experiments using the commercial ESBL enzyme blend. Considerations to
take into account are the Cep-glucose substrate’s diffusion behavior across the outer
membrane into the periplasmic space where β-lactamases are localized. On a
chemical level, this behavior may be impacted by Cep-glucose’s possession of many
more hydroxyl groups as compared to previously established chromogenic substrates.
Furthermore, the two-step disulfide exchange with DTNB to produce color may
require diffusion of the TNB chromogen or released thio-glucose back out of the cell
to contribute to readout. Exploration of sample preparation steps to include lysis by
either chemical (detergents) or mechanical (sonication) means could help elucidate
methods for improving detection performance at lower CFUs.
4.4 Conclusion
In this study we have shown that our new detection substrate Cep-glucose can enable
three different readout modalities (colorimetric, fluorimetric, amperometric) for the
detection of varying levels of ESBL spanning at least three orders of magnitude. Our
colorimetric detection scheme using Ellman’s reagent allows for use of common
absorbance spectrophotometry techniques. Our fluorescence detection scheme using
Amplex red, despite greater assay complexity, provided lower limits of detection for
greater sensitivity. Additionally, we engineered an amperometric means of detection to
illustrate the possibility of antibiotic resistance testing outside of the central laboratory.
95
4.4.1. Future work: Optimizing HRP activity.
Protein engineering of the HRP enzyme to be less susceptible to inhibition by thiols
could provide a more robust enzyme for more efficient oxidation of Amplex red to
resorufin and thus increase the sensitivities measured by fluorimetric readout.
Alternatively, development of a synthetic protocol to achieve Cep-glucose adduct by
way of an oxygen moiety in place of the sulfur as the C-3 position alkyl halide could
produce a normal glucose molecule that undergoes more efficient oxidation by GOx,
as well as eliminating the release of HRP-inhibitory thiols into solution, thereby
resulting in an overall improvement in assay performance.
4.4.2 Future work. Detection using commercial personal glucose meter.
Optimization studies of either the assay (to increase release of thio-glucose from the
Cep-glucose ring open intermediate through studies in buffer elements that may
increase concerted expulsion of the leaving group) or the electrochemical detector
(“hacked” glucometer for lower limits of detection) could result in sensitivities
allowing for readout of glucose release by way of a portable glucose meter.
96
Chapter 5: Cep-pNTP and Cep-diNTP, SERS-active reporters
5.1 Introduction
Previously we have described one detection substrate capable of reporting ESBL
activity. However, given the various classes of β-lactamase as well as the ever-
expanding sub-classes as new permutations appear, it would be of great advantage to
have a collection of reporter substrates corresponding to various β-lactamases from
classical non-ESBL types to ESBL types, metallo-β-lactamases, and carbapenemases.
Even more advantageous would be the capability of assaying for these different
resistance enzyme evolutions in a single sample with a single measurement. Cep-
glucose and the currently developed chromogenic substrates (Nitrocefin, etc.) are
unable to do this; however, as Raman spectroscopy is capable of single-sample
multiplexing due to its narrow band optical properties, creation of a suite of detection
substrates that release Raman-active reporter molecules—each with a unique optical
fingerprint—would provide a resistance detection toolkit of immense benefit.
Moreover, our use of sulfur/ thiol chemistry for the assembly and disassembly of our
reporter molecule is compatible with surface-enhanced Raman spectroscopy (SERS),
which utilizes metal nanostructures for signal enhancement. Thus, we investigated the
synthesis of new ESBL sensing molecules for use with SERS.
Here we will overview a basic explanation of the physics behind the theory of Raman
scattering, its enhancement on appropriate nanometal surfaces, and how this allows
for multiplex spectral monitoring of ESBL resistance using our reporter substrates.
97
5.1.1. Raman spectroscopy.
Photons from incident light can interact with a molecule in different ways. The vast
majority of interaction is in the form of an elastic scattering event, in which the
molecule absorbs the energy, is raised to a virtual state (a temporarily stable
vibrational mode), and emits the energy with no net change, falling back to its ground
state in what is known as Rayleigh scattering. In a much rarer phenomenon, the
excited molecule may fall back to a vibrational (real phonon) state higher than its
ground state, emitting energy that is less than that of the incoming photon; this is
known as Stokes shifted Raman scattering. In yet an even rarer third phenomenon, if
the molecule is already in a vibrational energy (excited phonon) state when it is
excited by another incident photon to a virtual energy state, it releases more energy
than that of the incident photon in relaxing back to its ground state, a behavior known
as anti-Stokes Raman scattering. Because anti-Stokes scattering is so rare, typical
Raman measurements are only performed using Stokes shifted light (Fig. 5.1).
Raman scattering behavior is highly dependent on and unique to the molecule’s
underlying arrangement, thereby giving it a spectral signature “fingerprint”. It is also
independent of virtual energy state, only depending on wavenumber to describe its
Raman shift (the difference in energy between initial and final vibrational states).
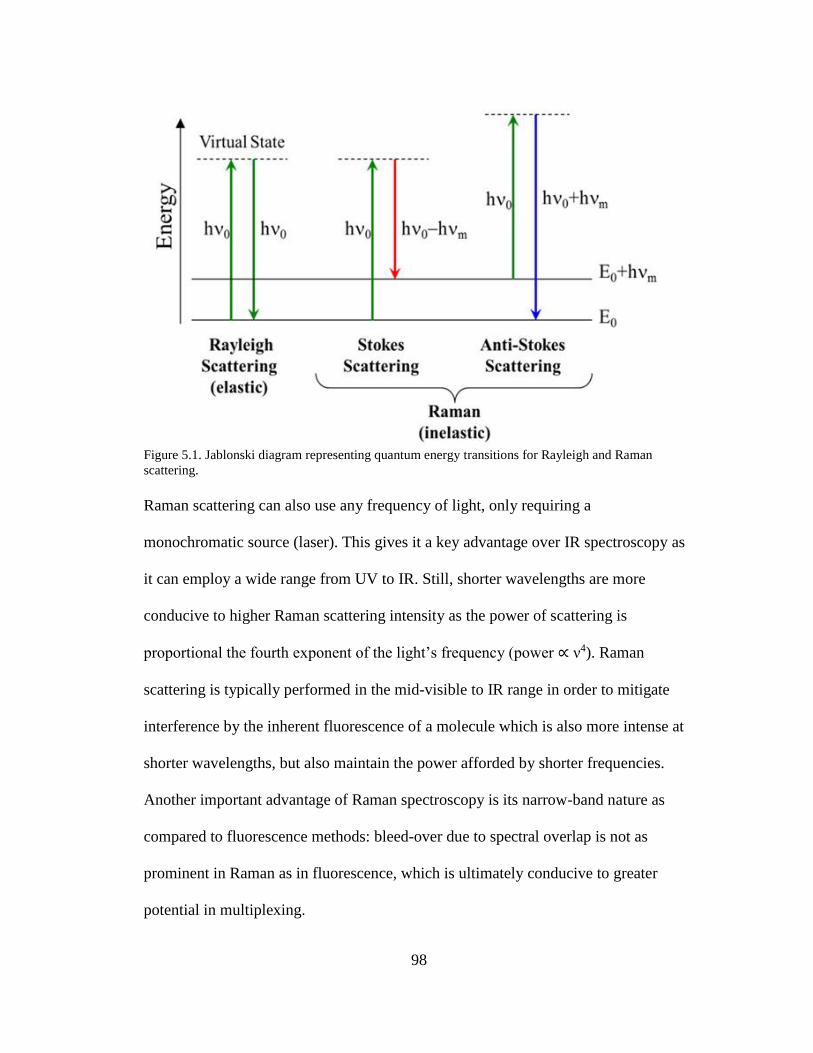
98
Figure 5.1. Jablonski diagram representing quantum energy transitions for Rayleigh and Raman
scattering.
Raman scattering can also use any frequency of light, only requiring a
monochromatic source (laser). This gives it a key advantage over IR spectroscopy as
it can employ a wide range from UV to IR. Still, shorter wavelengths are more
conducive to higher Raman scattering intensity as the power of scattering is
proportional the fourth exponent of the light’s frequency (power ∝ ν4). Raman
scattering is typically performed in the mid-visible to IR range in order to mitigate
interference by the inherent fluorescence of a molecule which is also more intense at
shorter wavelengths, but also maintain the power afforded by shorter frequencies.
Another important advantage of Raman spectroscopy is its narrow-band nature as
compared to fluorescence methods: bleed-over due to spectral overlap is not as
prominent in Raman as in fluorescence, which is ultimately conducive to greater
potential in multiplexing.
99
The most effective identification of analytes using Raman spectroscopy is achieved
with pure samples, or when the analyte’s spectral behavior is represented by the most
dominant portion of the recorded spectral range (i.e., the analyte is a particularly
Raman-active molecule). However, Raman by itself is not particularly sensitive for
most applications. As Raman was initially confined to high purity concentration
samples, the enhancement discovery from SERS increased the effectiveness of
Raman spectroscopy as an analytical technique by many orders of magnitude.
5.1.2 Surface enhancement.
Surface enhancement is carried out through the use of noble metal nanostructures. In
these materials the Raman signal is enhanced by many orders of magnitude.225–228
This enhancement due to two phenomena known as surface plasmon resonance (SPR)
and chemical effects, the former of which is responsible for the majority of
enhancement effects.229–231 Research advancing the enhancement properties of SERS
through the engineering of nanostructures has led to the attainment of detection and
identification on the single molecule level.231–233 A phenomenon known as “localized
surface plasmon resonance (LSPR)” enables the generation of SERS enhancement on
the surfaces of metal nanostructures. LSPR occurs when the oscillations of free
surface electrons (“plasmons”) replete on the surfaces of appropriately-sized
nanostructures couples with the excitation wavelength of incident light that is on the
same order as the oscillations, generating “resonance”. LSPR accounts for the vast
majority of total SERS enhancement factor (104 to 108); the lesser part of the
100
enhancement factor (≤ 104) is attributed to chemical enhancement which arises from
direct bond coordination with the metal surface.
In the current work, silver nanoparticles (AgNPs) are used as SERS surface materials
thanks to their high resonance as compared to other noble metals such as copper,
nickel, platinum, and aluminum.234 (Note that due to their similar resonance
characteristics, gold nanoparticles can just as easily be employed in these studies.
Both gold and silver based nanoparticles with diameters smaller than 5 nm exhibit
high surface enhancement properties. However, gold has better stability properties
than silver, giving it a longer shelf life and greater commercial potential.)
The enhancement effect of SERS can be described by the following equation:
Enhancement ∝ (1
𝑎+𝑑)12
,
where a is the average molecular radius of the nanoparticle and d is the analyte’s
distance from the metal nanostructure surface. As evidenced by the distance
relationship in this equation, critical to the effectiveness of SERS is the proximity of
the analyte to the metal nanostructure surface.235–237 The above equation describes the
diminishment of enhancement effects as to the twelfth power of total distance a+d.
As a result, adsorption of target analytes to the metal surface is an advantageous
strategy for the effective detection of rarer species in a sample volume (low
concentration analyte). Further, as the rapid diminishment of SERS begins at the
101
unitary nanometer scale (i.e., over 50% decrease in enhancement at 2 nm from the
surface), infeasibilies arising in the detection of bulkier biomolecules in the
nanometer range constrain SERS based detection to small molecules as the ideal
substrate class due to their diminutive size range.
Advantages of SERS as a bioanalytical technique. Compared with UV-vis absorption
spectroscopy and infrared spectroscopy, SERS gives a fingerprint vibrational
information of the adsorbates on the metal surfaces, and the added advantage of its
enormous enhancement factor of up to 1014, which brings the limit of detection down
to the level of single molecules.232,238,239 SERS is additionally suitable for aqueous
environments thanks to the transparency of water that allows the use of laser light as
in Raman spectroscopy. This makes SERS based detection ideal for our biological
matrix based assays, or in idealized aqueous media containing buffer salts. Thanks to
its increased sensitivity, surface enhancement makes Raman ultimately a more
feasible means as an analytical technique, and can be considered on par with
fluorescence spectroscopy but superior multiplexing density.232,240,241 SERS is
additionally advantageous over fluorescence in its label-free nature as it directly
detects a molecular fingerprint without any additional treatment necessary. In
comparing SERS to other highly sensitive spectroscopic techniques such as mass
spectrometry, especially when paired with chromatographic separation methods (LC,
GC) which provides extremely high resolution, the advent of portable SERS has now
made this spectroscopic technique field accessible, giving SERS a distinct advantage
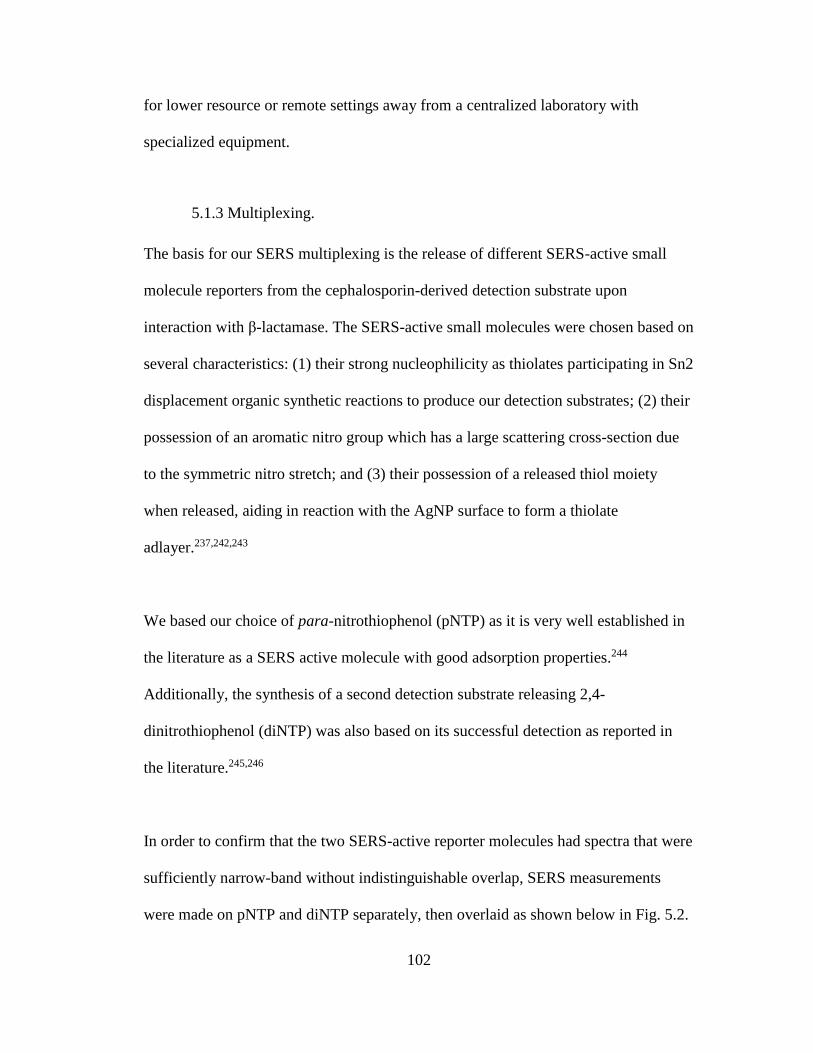
102
for lower resource or remote settings away from a centralized laboratory with
specialized equipment.
5.1.3 Multiplexing.
The basis for our SERS multiplexing is the release of different SERS-active small
molecule reporters from the cephalosporin-derived detection substrate upon
interaction with β-lactamase. The SERS-active small molecules were chosen based on
several characteristics: (1) their strong nucleophilicity as thiolates participating in Sn2
displacement organic synthetic reactions to produce our detection substrates; (2) their
possession of an aromatic nitro group which has a large scattering cross-section due
to the symmetric nitro stretch; and (3) their possession of a released thiol moiety
when released, aiding in reaction with the AgNP surface to form a thiolate
adlayer.237,242,243
We based our choice of para-nitrothiophenol (pNTP) as it is very well established in
the literature as a SERS active molecule with good adsorption properties.244
Additionally, the synthesis of a second detection substrate releasing 2,4-
dinitrothiophenol (diNTP) was also based on its successful detection as reported in
the literature.245,246
In order to confirm that the two SERS-active reporter molecules had spectra that were
sufficiently narrow-band without indistinguishable overlap, SERS measurements
were made on pNTP and diNTP separately, then overlaid as shown below in Fig. 5.2.
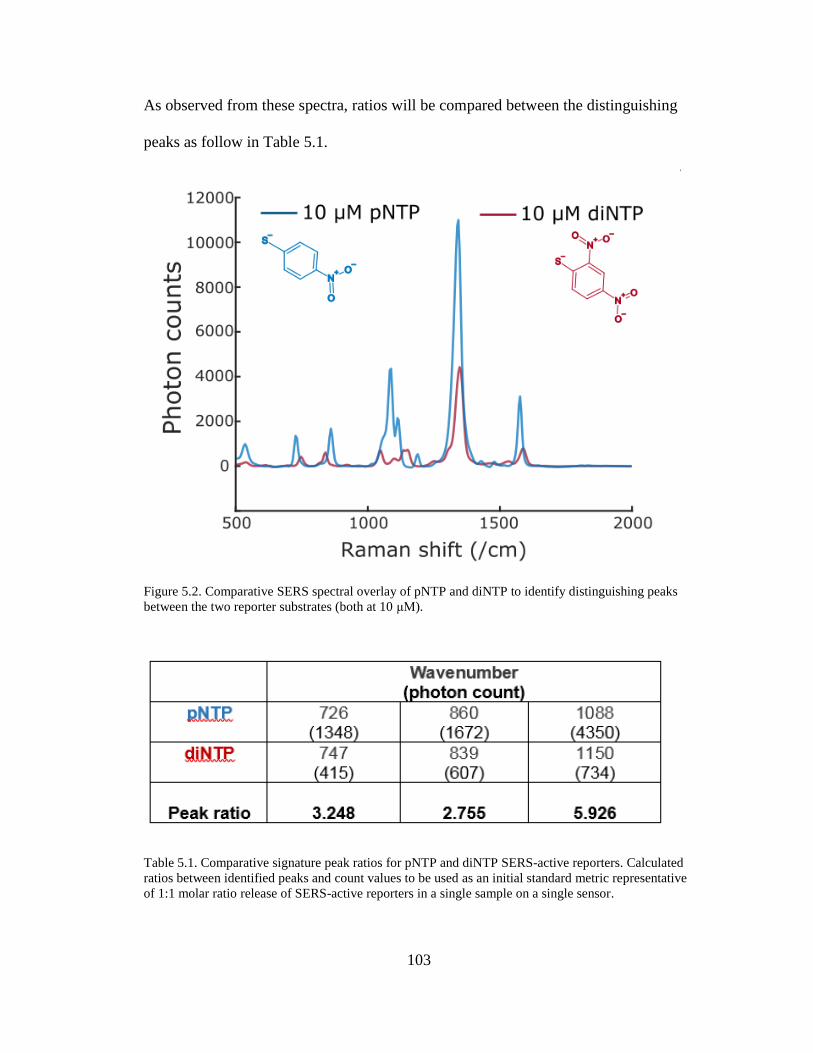
103
As observed from these spectra, ratios will be compared between the distinguishing
peaks as follow in Table 5.1.
Figure 5.2. Comparative SERS spectral overlay of pNTP and diNTP to identify distinguishing peaks
between the two reporter substrates (both at 10 μM).
Table 5.1. Comparative signature peak ratios for pNTP and diNTP SERS-active reporters. Calculated
ratios between identified peaks and count values to be used as an initial standard metric representative
of 1:1 molar ratio release of SERS-active reporters in a single sample on a single sensor.
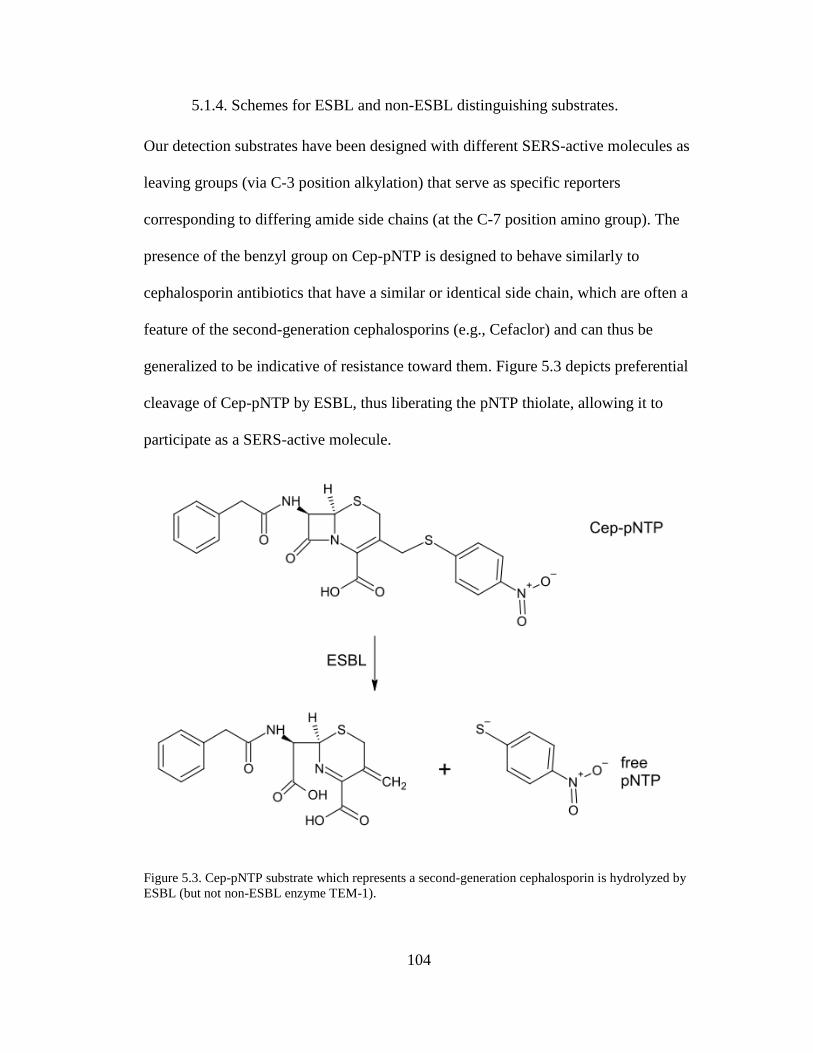
104
5.1.4. Schemes for ESBL and non-ESBL distinguishing substrates.
Our detection substrates have been designed with different SERS-active molecules as
leaving groups (via C-3 position alkylation) that serve as specific reporters
corresponding to differing amide side chains (at the C-7 position amino group). The
presence of the benzyl group on Cep-pNTP is designed to behave similarly to
cephalosporin antibiotics that have a similar or identical side chain, which are often a
feature of the second-generation cephalosporins (e.g., Cefaclor) and can thus be
generalized to be indicative of resistance toward them. Figure 5.3 depicts preferential
cleavage of Cep-pNTP by ESBL, thus liberating the pNTP thiolate, allowing it to
participate as a SERS-active molecule.
Figure 5.3. Cep-pNTP substrate which represents a second-generation cephalosporin is hydrolyzed by
ESBL (but not non-ESBL enzyme TEM-1).
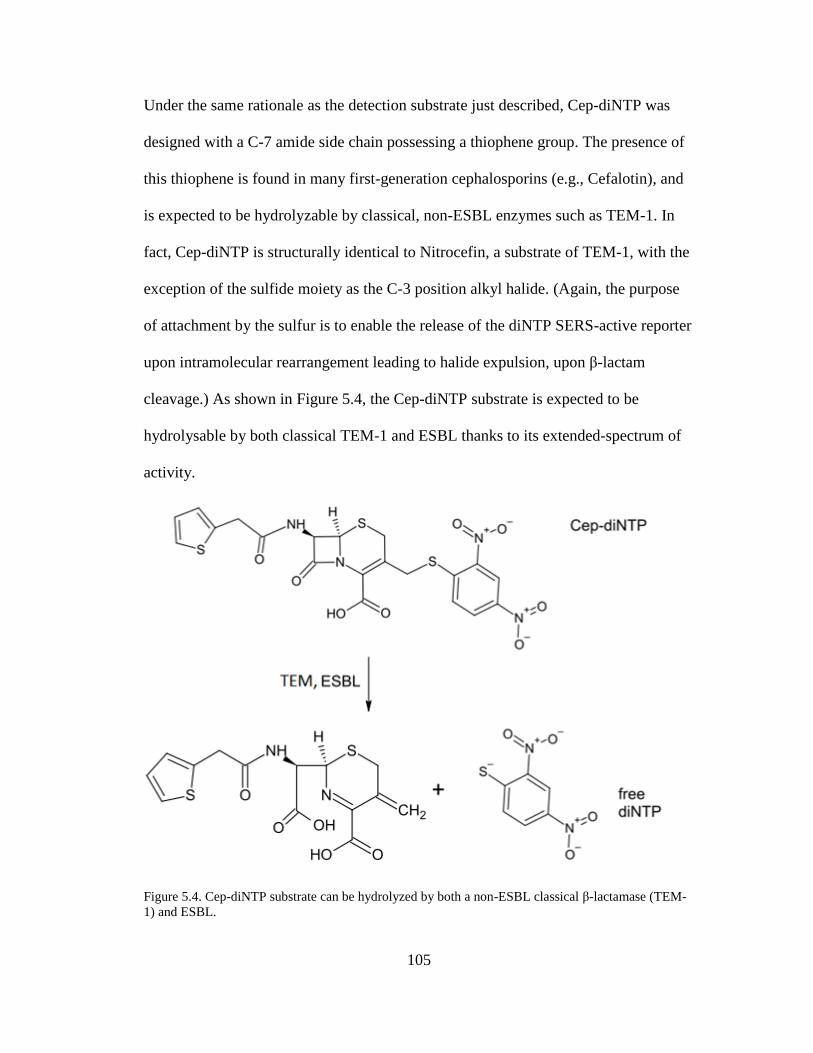
105
Under the same rationale as the detection substrate just described, Cep-diNTP was
designed with a C-7 amide side chain possessing a thiophene group. The presence of
this thiophene is found in many first-generation cephalosporins (e.g., Cefalotin), and
is expected to be hydrolyzable by classical, non-ESBL enzymes such as TEM-1. In
fact, Cep-diNTP is structurally identical to Nitrocefin, a substrate of TEM-1, with the
exception of the sulfide moiety as the C-3 position alkyl halide. (Again, the purpose
of attachment by the sulfur is to enable the release of the diNTP SERS-active reporter
upon intramolecular rearrangement leading to halide expulsion, upon β-lactam
cleavage.) As shown in Figure 5.4, the Cep-diNTP substrate is expected to be
hydrolysable by both classical TEM-1 and ESBL thanks to its extended-spectrum of
activity.
Figure 5.4. Cep-diNTP substrate can be hydrolyzed by both a non-ESBL classical β-lactamase (TEM-
1) and ESBL.
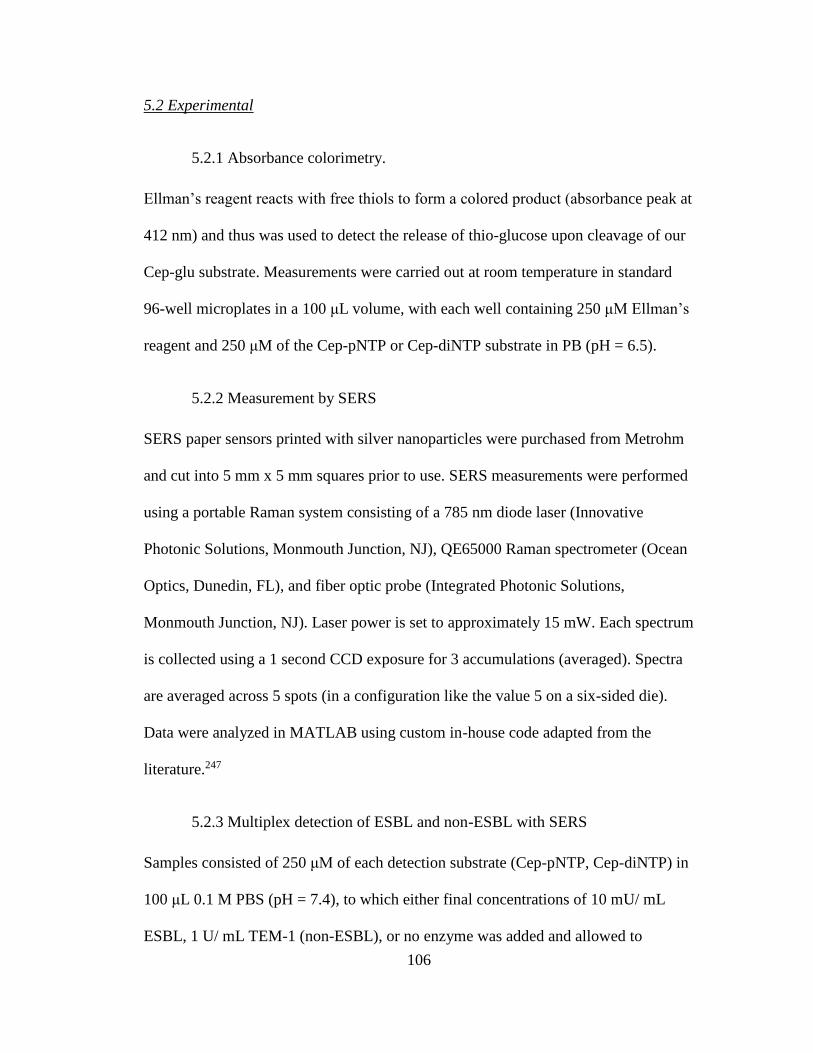
106
5.2 Experimental
5.2.1 Absorbance colorimetry.
Ellman’s reagent reacts with free thiols to form a colored product (absorbance peak at
412 nm) and thus was used to detect the release of thio-glucose upon cleavage of our
Cep-glu substrate. Measurements were carried out at room temperature in standard
96-well microplates in a 100 μL volume, with each well containing 250 μM Ellman’s
reagent and 250 μM of the Cep-pNTP or Cep-diNTP substrate in PB (pH = 6.5).
5.2.2 Measurement by SERS
SERS paper sensors printed with silver nanoparticles were purchased from Metrohm
and cut into 5 mm x 5 mm squares prior to use. SERS measurements were performed
using a portable Raman system consisting of a 785 nm diode laser (Innovative
Photonic Solutions, Monmouth Junction, NJ), QE65000 Raman spectrometer (Ocean
Optics, Dunedin, FL), and fiber optic probe (Integrated Photonic Solutions,
Monmouth Junction, NJ). Laser power is set to approximately 15 mW. Each spectrum
is collected using a 1 second CCD exposure for 3 accumulations (averaged). Spectra
are averaged across 5 spots (in a configuration like the value 5 on a six-sided die).
Data were analyzed in MATLAB using custom in-house code adapted from the
literature.247
5.2.3 Multiplex detection of ESBL and non-ESBL with SERS
Samples consisted of 250 μM of each detection substrate (Cep-pNTP, Cep-diNTP) in
100 μL 0.1 M PBS (pH = 7.4), to which either final concentrations of 10 mU/ mL
ESBL, 1 U/ mL TEM-1 (non-ESBL), or no enzyme was added and allowed to
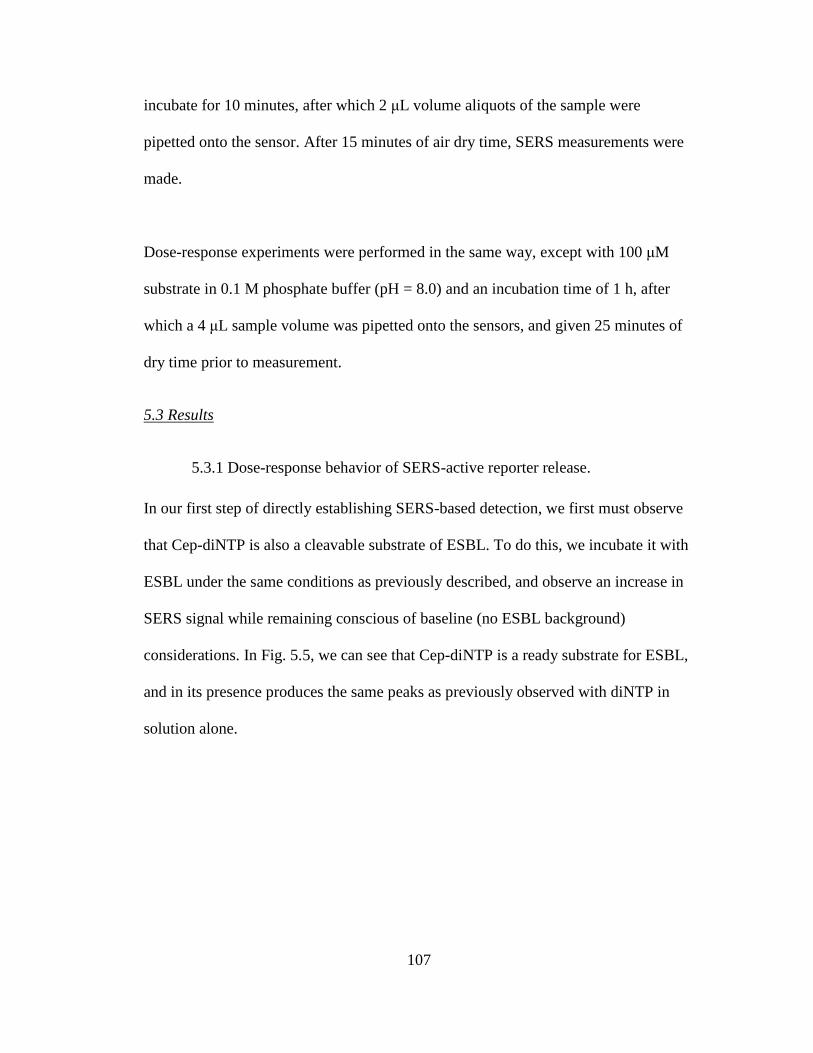
107
incubate for 10 minutes, after which 2 μL volume aliquots of the sample were
pipetted onto the sensor. After 15 minutes of air dry time, SERS measurements were
made.
Dose-response experiments were performed in the same way, except with 100 μM
substrate in 0.1 M phosphate buffer (pH = 8.0) and an incubation time of 1 h, after
which a 4 μL sample volume was pipetted onto the sensors, and given 25 minutes of
dry time prior to measurement.
5.3 Results
5.3.1 Dose-response behavior of SERS-active reporter release.
In our first step of directly establishing SERS-based detection, we first must observe
that Cep-diNTP is also a cleavable substrate of ESBL. To do this, we incubate it with
ESBL under the same conditions as previously described, and observe an increase in
SERS signal while remaining conscious of baseline (no ESBL background)
considerations. In Fig. 5.5, we can see that Cep-diNTP is a ready substrate for ESBL,
and in its presence produces the same peaks as previously observed with diNTP in
solution alone.
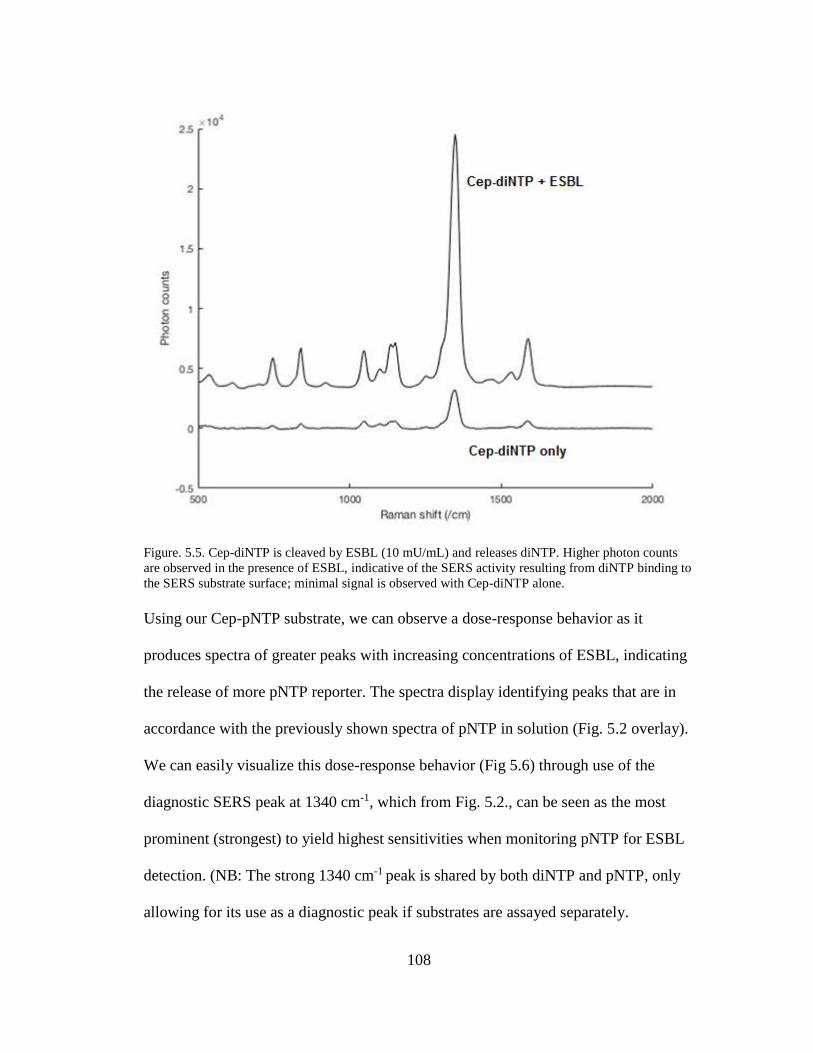
108
Figure. 5.5. Cep-diNTP is cleaved by ESBL (10 mU/mL) and releases diNTP. Higher photon counts
are observed in the presence of ESBL, indicative of the SERS activity resulting from diNTP binding to
the SERS substrate surface; minimal signal is observed with Cep-diNTP alone.
Using our Cep-pNTP substrate, we can observe a dose-response behavior as it
produces spectra of greater peaks with increasing concentrations of ESBL, indicating
the release of more pNTP reporter. The spectra display identifying peaks that are in
accordance with the previously shown spectra of pNTP in solution (Fig. 5.2 overlay).
We can easily visualize this dose-response behavior (Fig 5.6) through use of the
diagnostic SERS peak at 1340 cm-1, which from Fig. 5.2., can be seen as the most
prominent (strongest) to yield highest sensitivities when monitoring pNTP for ESBL
detection. (NB: The strong 1340 cm-1 peak is shared by both diNTP and pNTP, only
allowing for its use as a diagnostic peak if substrates are assayed separately.
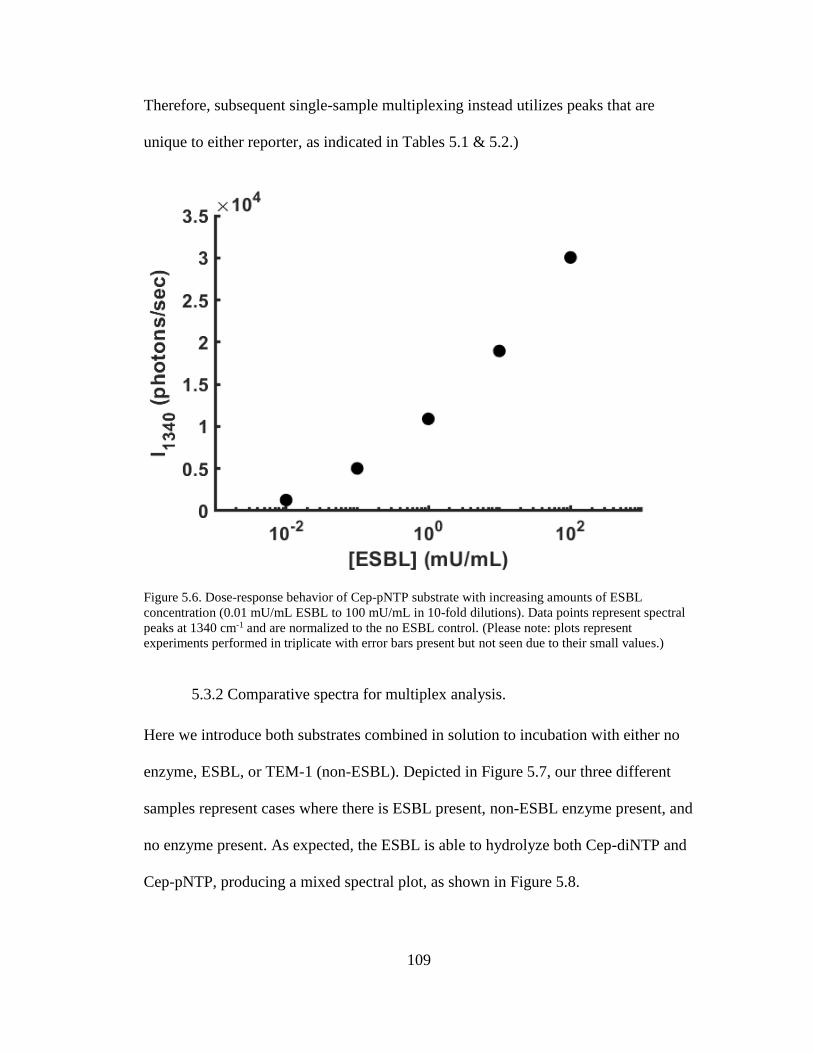
109
Therefore, subsequent single-sample multiplexing instead utilizes peaks that are
unique to either reporter, as indicated in Tables 5.1 & 5.2.)
Figure 5.6. Dose-response behavior of Cep-pNTP substrate with increasing amounts of ESBL
concentration (0.01 mU/mL ESBL to 100 mU/mL in 10-fold dilutions). Data points represent spectral
peaks at 1340 cm-1 and are normalized to the no ESBL control. (Please note: plots represent
experiments performed in triplicate with error bars present but not seen due to their small values.)
5.3.2 Comparative spectra for multiplex analysis.
Here we introduce both substrates combined in solution to incubation with either no
enzyme, ESBL, or TEM-1 (non-ESBL). Depicted in Figure 5.7, our three different
samples represent cases where there is ESBL present, non-ESBL enzyme present, and
no enzyme present. As expected, the ESBL is able to hydrolyze both Cep-diNTP and
Cep-pNTP, producing a mixed spectral plot, as shown in Figure 5.8.
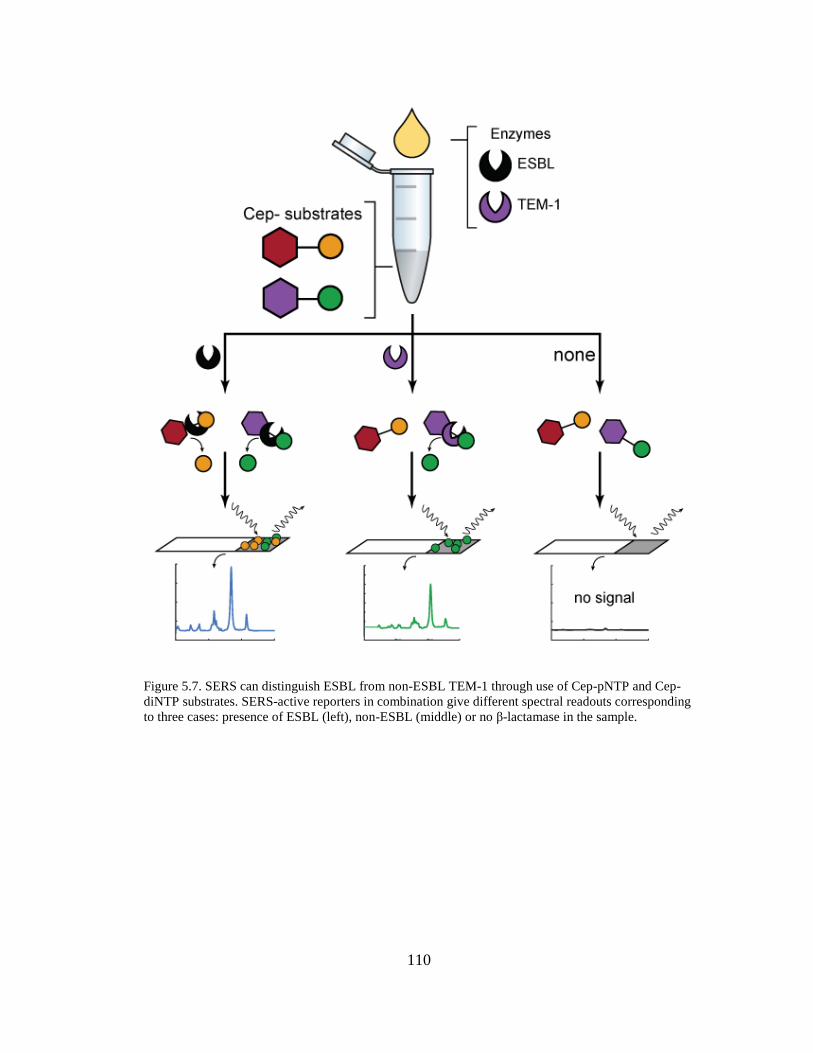
110
Figure 5.7. SERS can distinguish ESBL from non-ESBL TEM-1 through use of Cep-pNTP and Cep-
diNTP substrates. SERS-active reporters in combination give different spectral readouts corresponding
to three cases: presence of ESBL (left), non-ESBL (middle) or no β-lactamase in the sample.
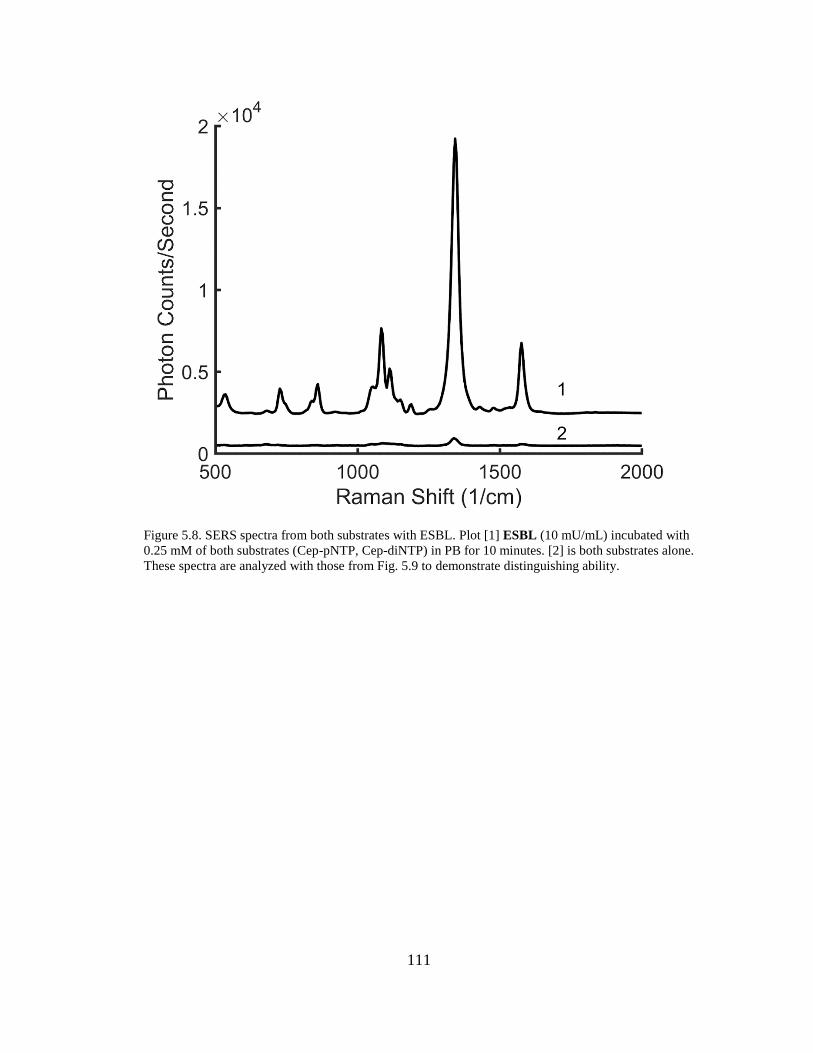
111
Figure 5.8. SERS spectra from both substrates with ESBL. Plot [1] ESBL (10 mU/mL) incubated with
0.25 mM of both substrates (Cep-pNTP, Cep-diNTP) in PB for 10 minutes. [2] is both substrates alone.
These spectra are analyzed with those from Fig. 5.9 to demonstrate distinguishing ability.
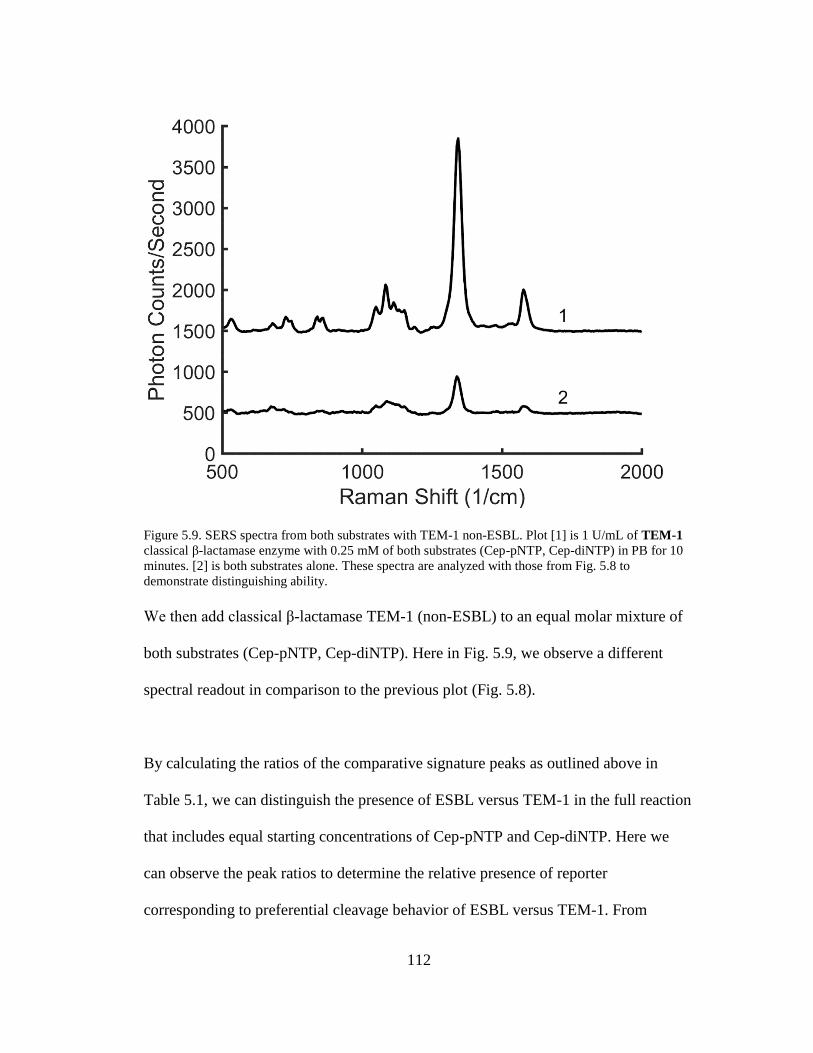
112
Figure 5.9. SERS spectra from both substrates with TEM-1 non-ESBL. Plot [1] is 1 U/mL of TEM-1
classical β-lactamase enzyme with 0.25 mM of both substrates (Cep-pNTP, Cep-diNTP) in PB for 10
minutes. [2] is both substrates alone. These spectra are analyzed with those from Fig. 5.8 to
demonstrate distinguishing ability.
We then add classical β-lactamase TEM-1 (non-ESBL) to an equal molar mixture of
both substrates (Cep-pNTP, Cep-diNTP). Here in Fig. 5.9, we observe a different
spectral readout in comparison to the previous plot (Fig. 5.8).
By calculating the ratios of the comparative signature peaks as outlined above in
Table 5.1, we can distinguish the presence of ESBL versus TEM-1 in the full reaction
that includes equal starting concentrations of Cep-pNTP and Cep-diNTP. Here we
can observe the peak ratios to determine the relative presence of reporter
corresponding to preferential cleavage behavior of ESBL versus TEM-1. From
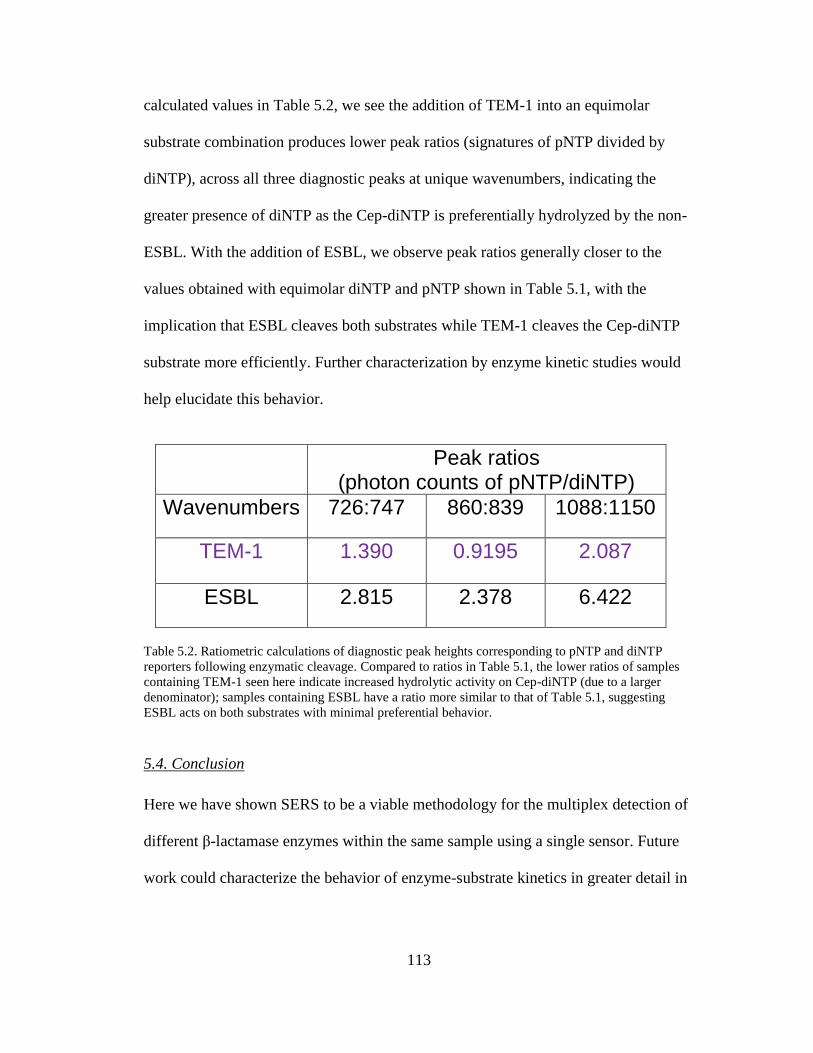
113
calculated values in Table 5.2, we see the addition of TEM-1 into an equimolar
substrate combination produces lower peak ratios (signatures of pNTP divided by
diNTP), across all three diagnostic peaks at unique wavenumbers, indicating the
greater presence of diNTP as the Cep-diNTP is preferentially hydrolyzed by the non-
ESBL. With the addition of ESBL, we observe peak ratios generally closer to the
values obtained with equimolar diNTP and pNTP shown in Table 5.1, with the
implication that ESBL cleaves both substrates while TEM-1 cleaves the Cep-diNTP
substrate more efficiently. Further characterization by enzyme kinetic studies would
help elucidate this behavior.
Peak ratios (photon counts of pNTP/diNTP)
Wavenumbers 726:747 860:839 1088:1150
TEM-1 1.390 0.9195 2.087
ESBL 2.815 2.378 6.422
Table 5.2. Ratiometric calculations of diagnostic peak heights corresponding to pNTP and diNTP
reporters following enzymatic cleavage. Compared to ratios in Table 5.1, the lower ratios of samples
containing TEM-1 seen here indicate increased hydrolytic activity on Cep-diNTP (due to a larger
denominator); samples containing ESBL have a ratio more similar to that of Table 5.1, suggesting
ESBL acts on both substrates with minimal preferential behavior.
5.4. Conclusion
Here we have shown SERS to be a viable methodology for the multiplex detection of
different β-lactamase enzymes within the same sample using a single sensor. Future
work could characterize the behavior of enzyme-substrate kinetics in greater detail in
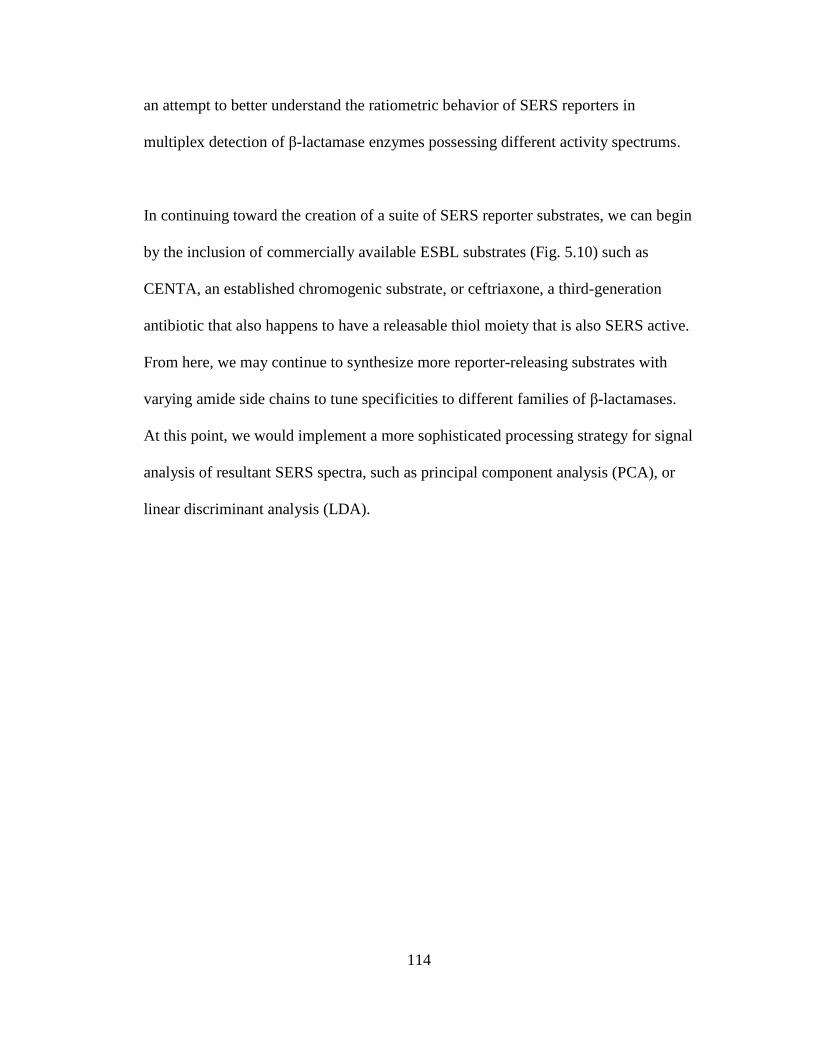
114
an attempt to better understand the ratiometric behavior of SERS reporters in
multiplex detection of β-lactamase enzymes possessing different activity spectrums.
In continuing toward the creation of a suite of SERS reporter substrates, we can begin
by the inclusion of commercially available ESBL substrates (Fig. 5.10) such as
CENTA, an established chromogenic substrate, or ceftriaxone, a third-generation
antibiotic that also happens to have a releasable thiol moiety that is also SERS active.
From here, we may continue to synthesize more reporter-releasing substrates with
varying amide side chains to tune specificities to different families of β-lactamases.
At this point, we would implement a more sophisticated processing strategy for signal
analysis of resultant SERS spectra, such as principal component analysis (PCA), or
linear discriminant analysis (LDA).
115
Figure 5.10. Two commercially available substrates that may serve as SERS reporters. SERS-active
groups are labeled in magenta. CENTA is a first-generation cephalosporin with the corresponding side
chain shown in red; ceftriaxone is a third-generation, with the corresponding side chain shown in
green.
116
Chapter 6: Conclusion
6.1: Summary of findings
In the previous reports, we have established the chemical synthesis and
characterization of detection substrates capable of reporting β-lactamase enzymatic
activity. In this toolkit, we present Cep-glucose, a completely novel ESBL detection
substrate, that releases glucose as a reporter that can be coupled into biochemical
assay schemes enabling readout by three different modalities (absorbance
colorimetry, fluorescence, electrochemical). We then elect the use of SERS as a
readout modality with multiplexing capability, and detail the synthesis and behavior
of two more previously undescribed detection substrates that can distinguish ESBL
from non-ESBL in a single sample, single sensor format. Furthermore, we validate
the great potential of our engineered assays by demonstrating successful performance
with live bacterial cultures, as well as demonstrating drug resistance readout using
unmodified store-bought personal glucose meters.
6.2: Contributions to the field and potential impact
6.2.1. Potential for direct impact on patient outcome
As our work directly detects the resistance activity conferred by the most common
survival strategy employed by microbes associated with nosocomial infection, it lays
the foundation for direct testing of patient clinical samples. Especially important in
the interrogation of a clinical sample is multiplex detection, as the same pathogen is
likely to produce a variety of beta-lactamases; therefore, the multiplex strategy
offered by SERS offers a critical starting basis for expansion into practical use.
117
Though not directly addressed by this work as it also requires populational studies to
assess accuracy rates, it is clear the application of our previously described assays to
real clinical samples would yield results regarding bacterial susceptibility to
cephalosporin treatment, directly informing the course of patient care, and therefore
also health outcomes.
6.2.2. Potential impacts on public health
Antibiograms provide overall antimicrobial susceptibility profiles in order to serve as
a treatment guide for regional hospital or healthcare systems. CLSI recommends the
compilation of aggregate data at least annually with a minimum of 30 test isolates
within the period analyzed. As our work aims to provide a diagnostic tool that is a
rapid, post-culture test for resistance enzymes that is both inexpensive and can be
performed in a standard lab, integration of our tool into the antibiogram workflow can
speed compilation efforts by acting as an initial confirmatory test for clinical
specimens regarding cephalosporin susceptibilities. This speed has the potential
added benefit of facilitating more frequent antibiogram updates in order to more
closely track cephalosporin resistance trends on the population scale especially as it
pertains to this most commonly prescribed antibiotic class. Follow-up confirmatory
tests can focus on any “hot spots” of resistance emergence to better allocate efforts in
high-throughput susceptibility screenings for more efficient use of more resource-
intense methodologies performed at central laboratories.
118
6.2.3. Supporting higher accessibility to healthcare
As our work has demonstrated resistance readout methodologies requiring simpler
tools with lower technical expertise requirements than gold standard testing, we
expect that it would make AST more commonplace. As optical plate readers are a
standard unit of lab equipment, patient samples need not be shipped to central testing
laboratories prior to days-long turnaround for results. Portable SERS instruments also
brings additional multiplex capability to resistance testing outside of the central
laboratory. If established as an AST methodology, even more isolated populations
with the potential for bottlenecking of bacterial genetics can be profiled to trace the
origins of resistance dissemination.
Our electrochemical testing proof-of-concept lays the real potential for finer
adaptation of our Cep-glucose based ESBL assay for use with highly portable and
commercially available personal blood glucose monitors (PGMs) that have been FDA
approved for home use, making AST as quick and readily available as hourly blood-
sugar testing for type 1 diabetics. Viability of PGMs as an AST method would follow
a two-pronged approach: the further optimization assay conditions to maximize the
release of glucose in our Cep-glucose scheme, and the customization of PGMs to
have lower limits of detection for increased sensitivity.
Overall, the methodologies described in this work aim to lower the barrier of access
to AST by implementing less time and labor-intensive assay strategies aimed at
detection of the most common bacterial resistance strategy to the most commonly
prescribed class of antibiotics.
119
6.3: Future work
6.3.1. Studies with mock matrices
Systematic testing the robustness of our assays in controlled matrices to include
potential interferents (e.g., residual glucose, hydrogen peroxide, contaminating
proteins, ions, reductants, oxidizers, etc.) would provide a first necessary step in
adapting the assays for use in the clinic.
6.3.2. Studies with live bacteria
As all standard phenotypic detection methodologies are performed post-culture, our
assays should be performed with various other strains of live bacteria from resistant
isolates to confirm feasibility in clinical use.
6.3.3. Studies with clinical human samples.
Once the prior two future work goals are completed, robustness testing using real
clinical samples from human patients on a population level would provide the
necessary reliability data to determine precision, accuracy, etc. required prior to FDA
approval.
6.3.4. Furthering SERS based multiplex detection
As discussed in Chapter 5, the synthesis of a suite of detection substrates each with
unique SERS reporters (leaving group) that correspond to different cephalosporin
generations (amide side chain) would provide an ultimate single-sample, single-
sensor screen for cephalosporin resistance. Additionally, development of multiplex
spectral analysis by way of signal processing methods could be then implemented in a
120
software format to automate analysis for easier user interpretation. Ultimately, this
would pair with a sample workflow that integrates patient sample application into a
single-package device, thus providing a powerful tool for resistance analysis beyond
the central laboratory.
6.3.5. Ultra-convenient and pervasive resistance detection
Similar to creation of a suite of SERS-active reporter substrates, side chain
modifications could provide a suite of glucose-releasing ESBL detection substrates
for detection using the PGM. Because of its high portability and FDA approval, PGM
repurposing for AST holds a huge potential for the sensing of specific resistance
mechanisms, in our case the hydrolytic activity of ESBL. Studies to compare different
levels of resistance corresponding to MIC would be useful in validating PGM
performance; accordingly, as PGMs have already been optimized to report
quantifiable levels of glucose in blood, the amount of resistance activity can in theory
be quantified from a given patient sample, particularly pertaining to cases of sepsis.
Immobilization of glucose oxidase and catalase in collection tubes could provide a
streamlined sample preparation strategy to reduce background glucose levels. In
considering other sample types, new sample prep methods could be engineered,
custom test strips be designed, and custom glucometers could be adapted for
dedicated use in the clinic or bedside. In the hospital, attachment of a device
containing the Cep-glucose substrate to standard tubing equipment could be a
potential strategy to monitor for the presence of ESBL producing organisms. Overall,
enabling drug resistance detection in PGMs holds immense potential for simple and
widespread AMR monitoring.

121
122
Appendices
Appendix 1. Verification spectra for PMB-Cep-glucose (Compound 1 and 2).
Prepared by Dr. Shweta Ganapati, University of Maryland College Park (Chemistry
& Biochemistry).
Cephem 1: IR (ATR, cm-1): 3327(w, br), 2981 (s), 1776 (m), 1717 (m), 1669 (w), 1516
(s), 1512 (m), 1454 (m), 1382 (m), 1248 (m), 1161 (m), 1030 (m), 907 (m), 823 (w),
7569 (m), 730 (s).1H NMR (600 MHz, CDCl3): 7.44 (d, J = 8.9, 1H), 7.28 - 7.20 (m,
7H), 6.83 (d, J = 8.6, 4H), 5.71 (dd, J = 4.7, 8.9, 1H), 5.17 (d, J = 11.7, 1H), 5.10 (d, J
= 11.7, 1H), 4.97 (d, J = 9.9, 1H), 4.90 (d, J = 4.7, 1H), 4.28 (d, J = 13.7, 1H), 3.81 -
3.72 (m, 5H), 3.56 – 3.27 (m, 12 H), 2.96 (d, J = 13.7, 1H). 13C NMR (150 MHz,
CDCl3): δ 172.0, 164.8, 162.3, 160.2, 134.4, 131.0, 129.6, 129.0, 128.0, 127.5, 126.8,
124.1, 114.3, 86.0, 79.8, 78.4, 72.8, 71.1, 68.6, 63.2, 59.7, 58.1, 55.5, 53.6, 43.5, 33.7,
31.1, 26.4. High-Res MS (ESI): m/z 669.1554 ([M + Na]+), calculated for
C30H34N2O10S2Na+ 669.1553.
Summary: The 1H NMR shows coupling between Ha 7.44 ppm (d, J = 8.9, 1H) and Hb
5.71 ppm (dd, J = 4.7, 8.9, 1H), Hb 5.71 ppm (dd, J = 4.7, 8.9, 1H) and He 4.90 ppm
(d, J = 4.7, 1H), Hc’ 5.17 ppm (d, J = 11.7, 1H) and Hc 5.10 ppm (d, J = 11.7, 1H), and
Hf’ 4.28 ppm (d, J = 13.7, 1H) and Hf 2.96 ppm (d, J = 13.7, 1H), labeled in Figure 1.
The splitting patterns of these peaks and their integrals are consistent with these
assignments. Both systems, Hc’, Hc and Hf’, Hf have large coupling constants, 11.7
Hz and 13.7 Hz, respectively, due to germinal coupling. All the correlations inferred
from coupling constants in the 1H NMR spectrum are also observed in the COSY data
shown in Figure 3. The COSY data also shows that proton Hd, the anomeric proton,
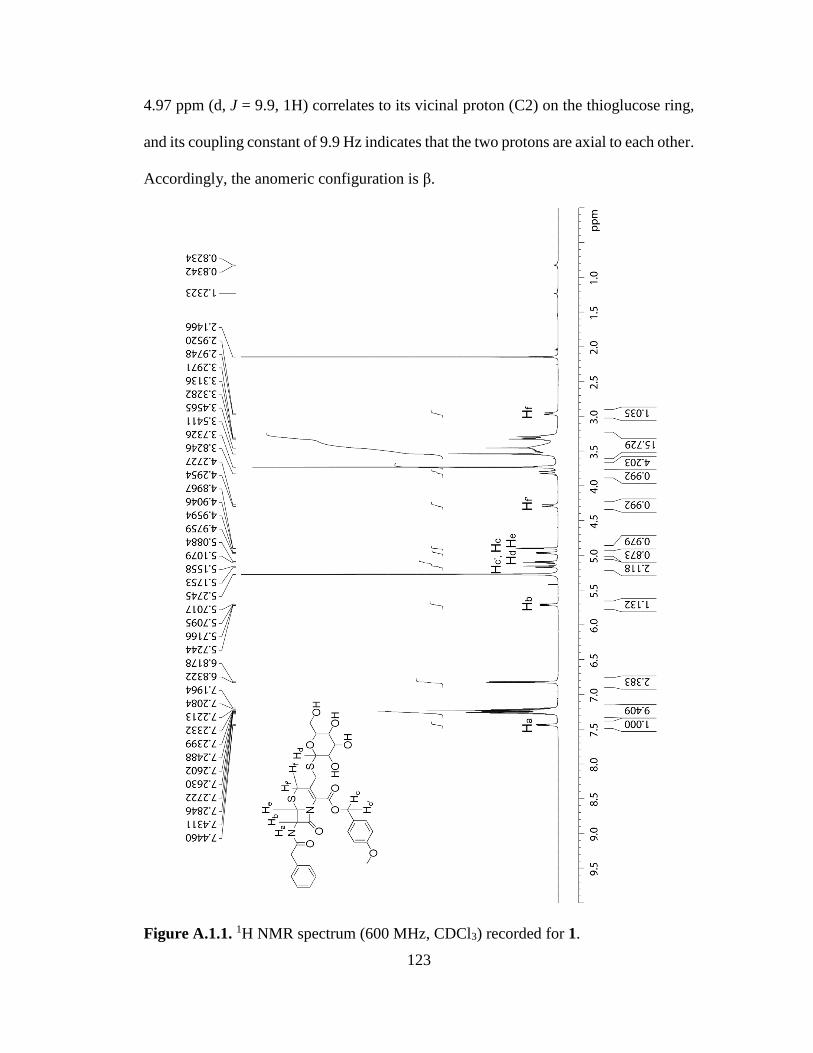
123
4.97 ppm (d, J = 9.9, 1H) correlates to its vicinal proton (C2) on the thioglucose ring,
and its coupling constant of 9.9 Hz indicates that the two protons are axial to each other.
Accordingly, the anomeric configuration is β.
Figure A.1.1. 1H NMR spectrum (600 MHz, CDCl3) recorded for 1.
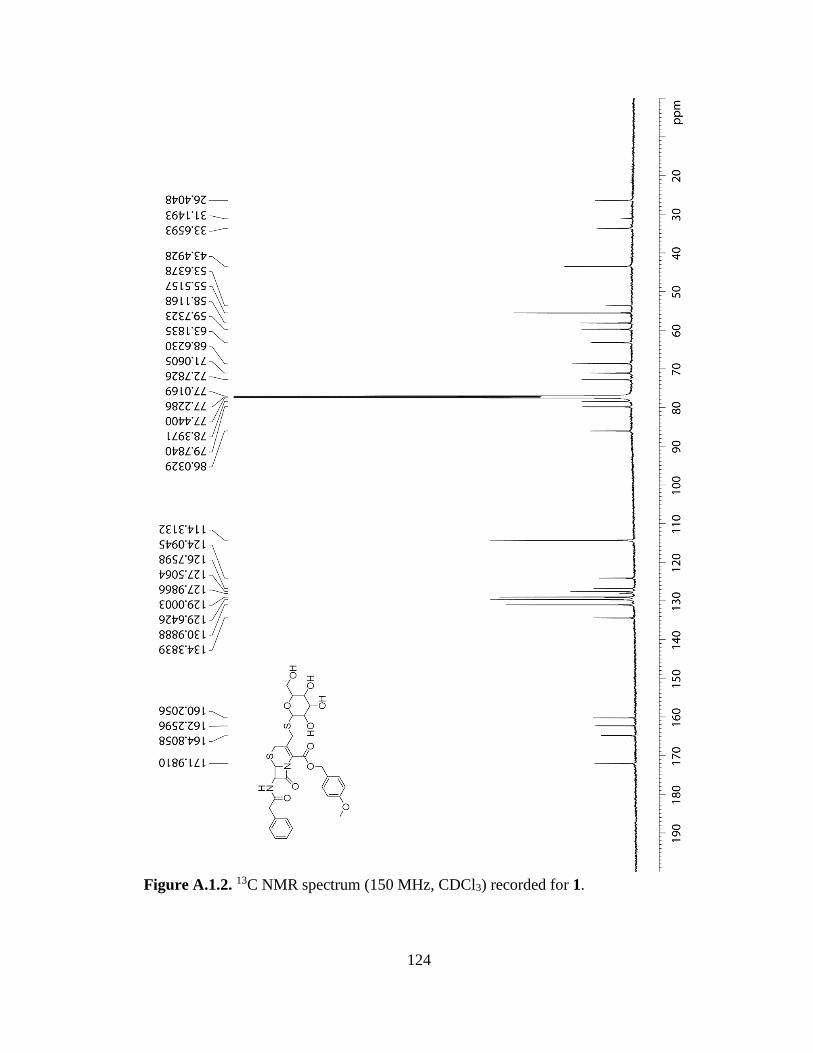
124
Figure A.1.2. 13C NMR spectrum (150 MHz, CDCl3) recorded for 1.
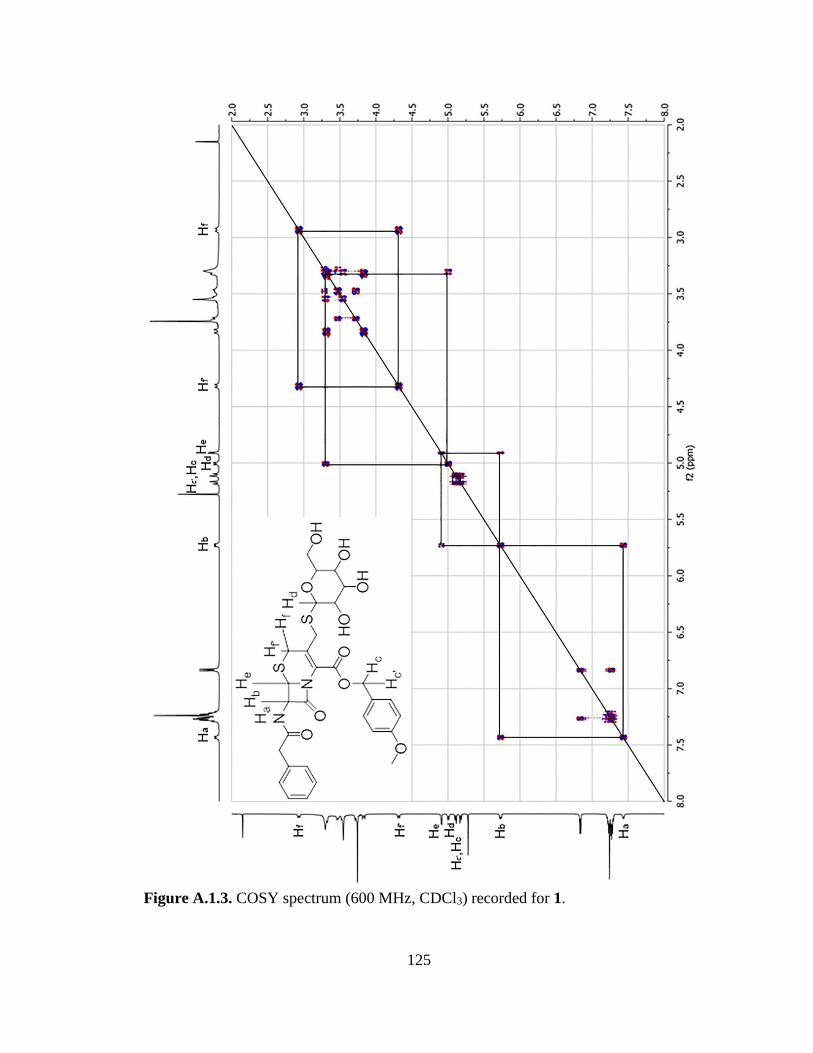
125
Figure A.1.3. COSY spectrum (600 MHz, CDCl3) recorded for 1.
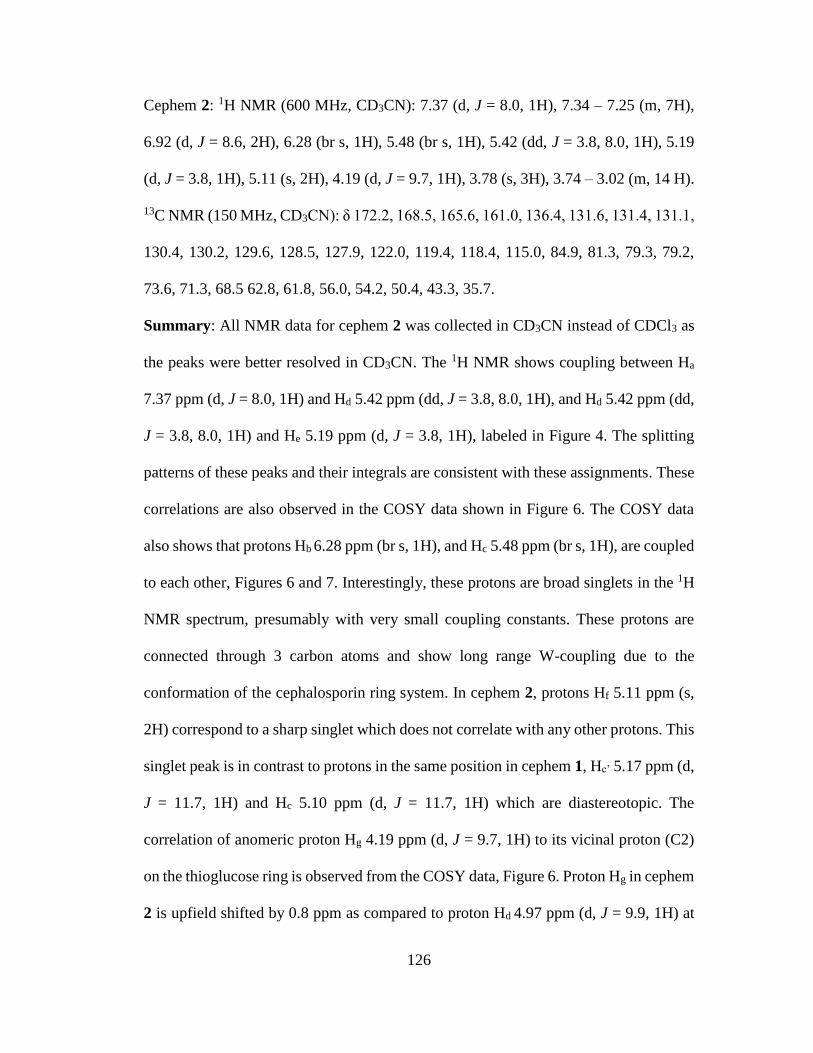
126
Cephem 2: 1H NMR (600 MHz, CD3CN): 7.37 (d, J = 8.0, 1H), 7.34 – 7.25 (m, 7H),
6.92 (d, J = 8.6, 2H), 6.28 (br s, 1H), 5.48 (br s, 1H), 5.42 (dd, J = 3.8, 8.0, 1H), 5.19
(d, J = 3.8, 1H), 5.11 (s, 2H), 4.19 (d, J = 9.7, 1H), 3.78 (s, 3H), 3.74 – 3.02 (m, 14 H).
13C NMR (150 MHz, CD3CN): δ 172.2, 168.5, 165.6, 161.0, 136.4, 131.6, 131.4, 131.1,
130.4, 130.2, 129.6, 128.5, 127.9, 122.0, 119.4, 118.4, 115.0, 84.9, 81.3, 79.3, 79.2,
73.6, 71.3, 68.5 62.8, 61.8, 56.0, 54.2, 50.4, 43.3, 35.7.
Summary: All NMR data for cephem 2 was collected in CD3CN instead of CDCl3 as
the peaks were better resolved in CD3CN. The 1H NMR shows coupling between Ha
7.37 ppm (d, J = 8.0, 1H) and Hd 5.42 ppm (dd, J = 3.8, 8.0, 1H), and Hd 5.42 ppm (dd,
J = 3.8, 8.0, 1H) and He 5.19 ppm (d, J = 3.8, 1H), labeled in Figure 4. The splitting
patterns of these peaks and their integrals are consistent with these assignments. These
correlations are also observed in the COSY data shown in Figure 6. The COSY data
also shows that protons Hb 6.28 ppm (br s, 1H), and Hc 5.48 ppm (br s, 1H), are coupled
to each other, Figures 6 and 7. Interestingly, these protons are broad singlets in the 1H
NMR spectrum, presumably with very small coupling constants. These protons are
connected through 3 carbon atoms and show long range W-coupling due to the
conformation of the cephalosporin ring system. In cephem 2, protons Hf 5.11 ppm (s,
2H) correspond to a sharp singlet which does not correlate with any other protons. This
singlet peak is in contrast to protons in the same position in cephem 1, Hc’ 5.17 ppm (d,
J = 11.7, 1H) and Hc 5.10 ppm (d, J = 11.7, 1H) which are diastereotopic. The
correlation of anomeric proton Hg 4.19 ppm (d, J = 9.7, 1H) to its vicinal proton (C2)
on the thioglucose ring is observed from the COSY data, Figure 6. Proton Hg in cephem
2 is upfield shifted by 0.8 ppm as compared to proton Hd 4.97 ppm (d, J = 9.9, 1H) at

127
the same position in cephem 1. However, their coupling constants with the
corresponding vicinal protons on the thioglucose rings are comparable (9.7 Hz and 9.9
Hz respectively), indicating that the anomeric conformation is β in both compounds.
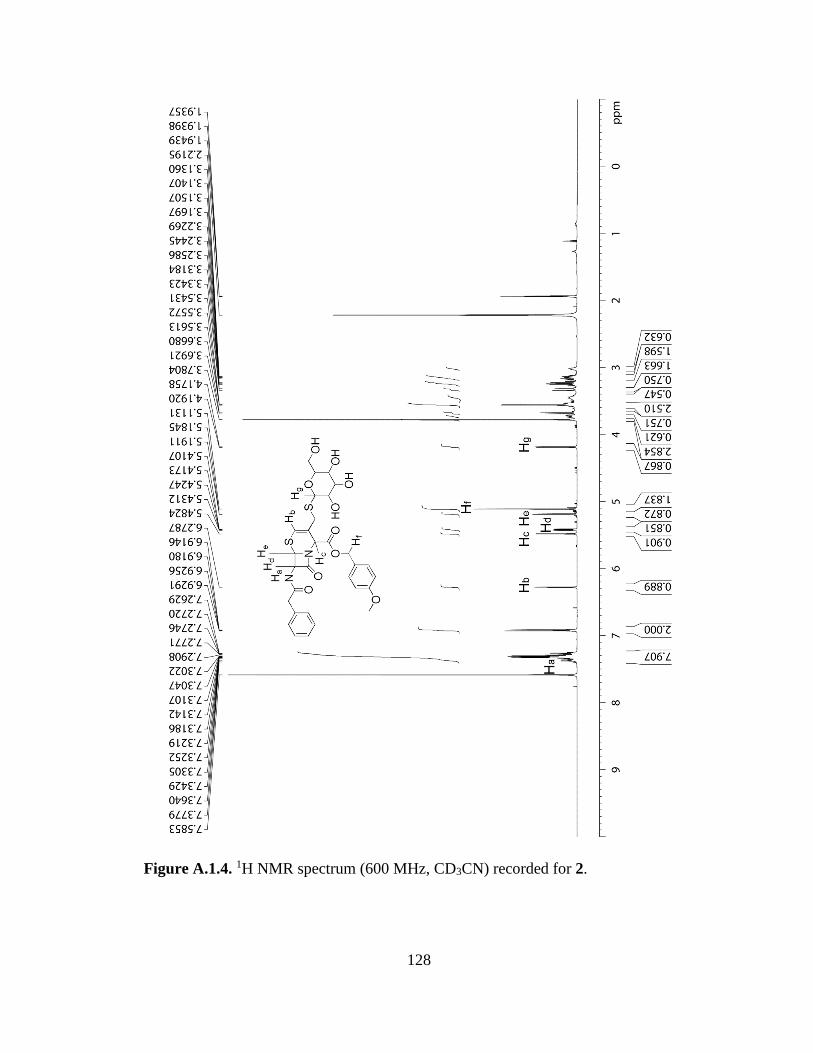
128
Figure A.1.4. 1H NMR spectrum (600 MHz, CD3CN) recorded for 2.
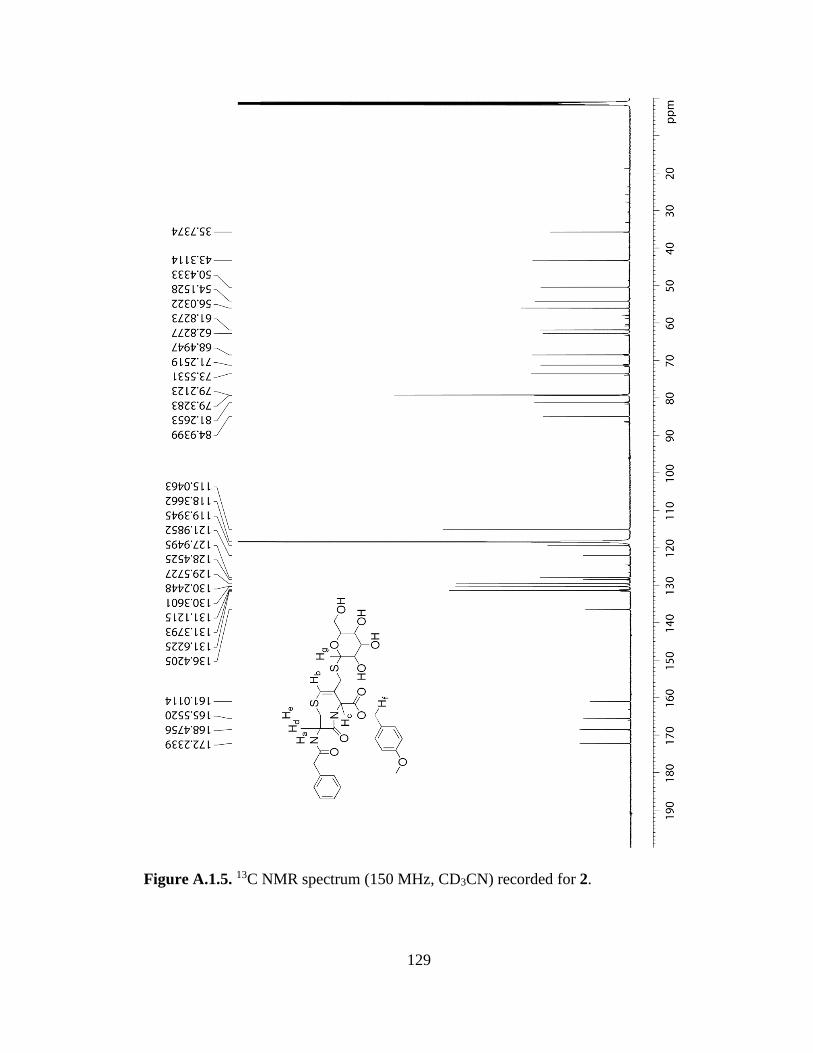
129
Figure A.1.5. 13C NMR spectrum (150 MHz, CD3CN) recorded for 2.
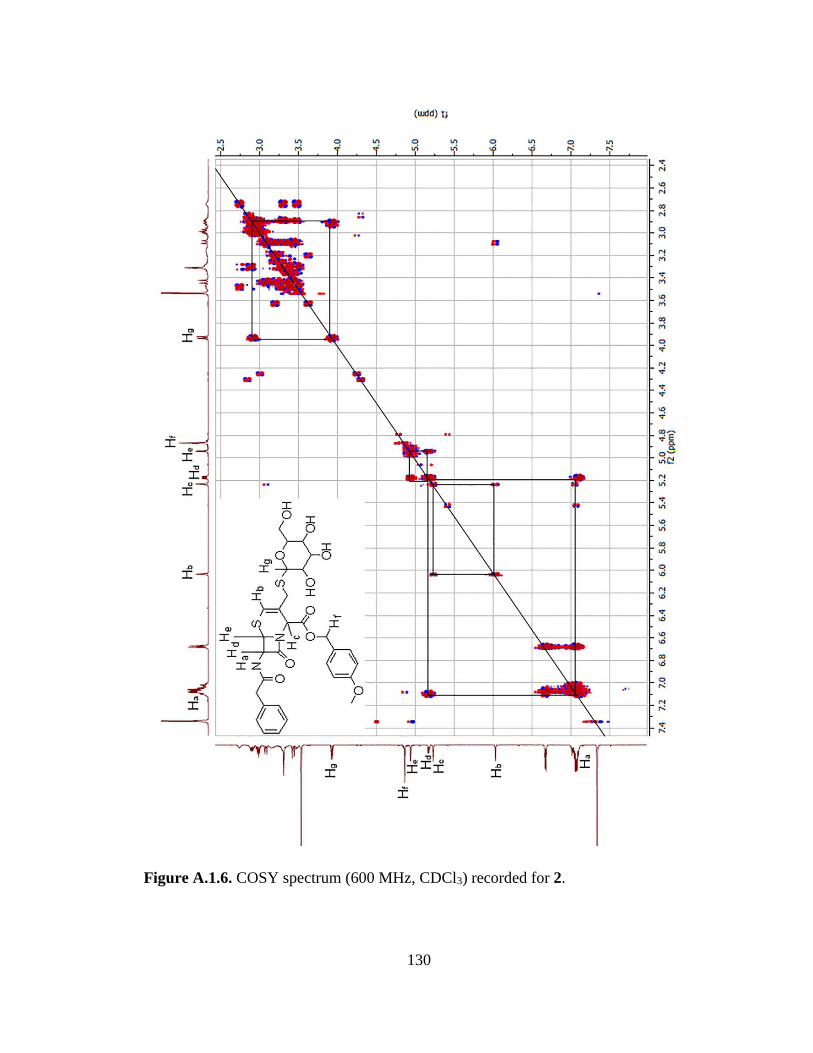
130
Figure A.1.6. COSY spectrum (600 MHz, CDCl3) recorded for 2.
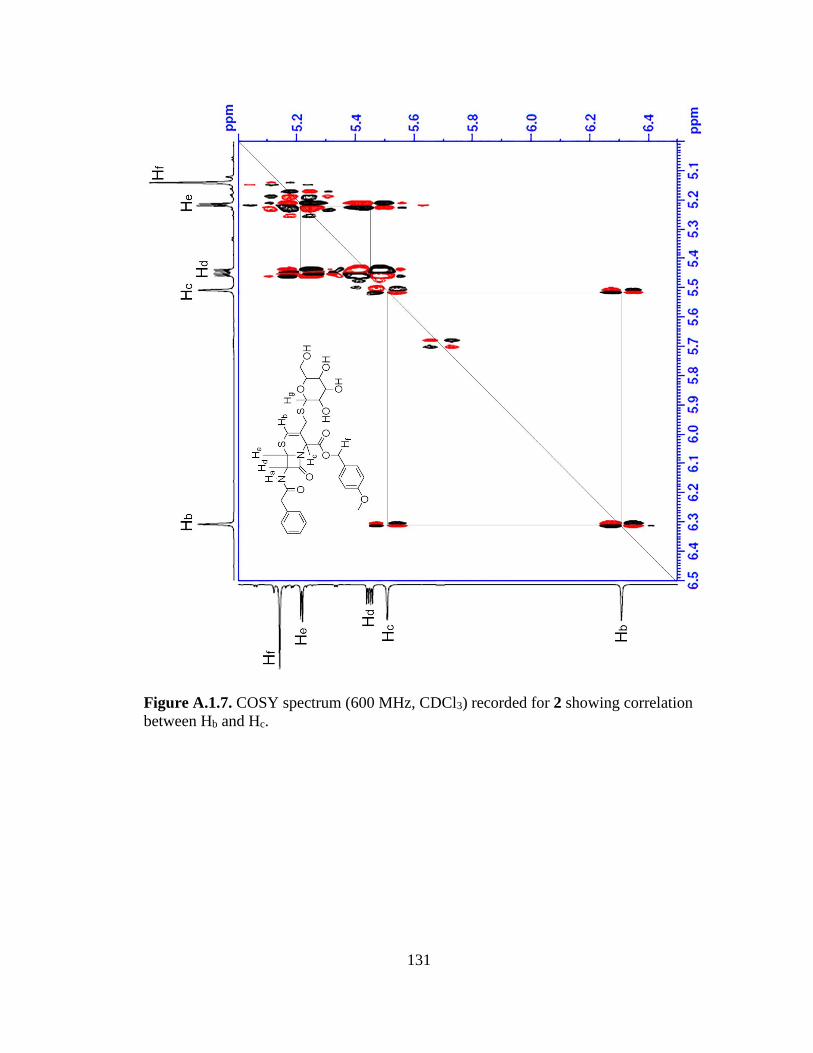
131
Figure A.1.7. COSY spectrum (600 MHz, CDCl3) recorded for 2 showing correlation
between Hb and Hc.
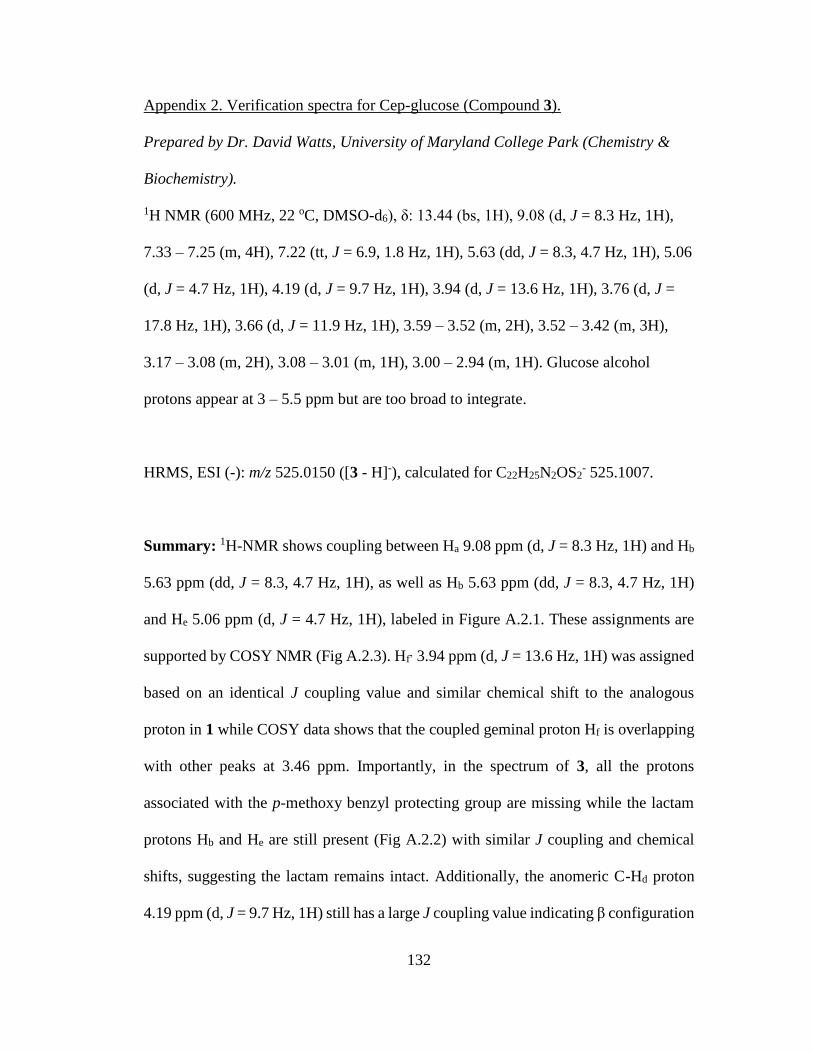
132
Appendix 2. Verification spectra for Cep-glucose (Compound 3).
Prepared by Dr. David Watts, University of Maryland College Park (Chemistry &
Biochemistry).
1H NMR (600 MHz, 22 oC, DMSO-d6), δ: 13.44 (bs, 1H), 9.08 (d, J = 8.3 Hz, 1H),
7.33 – 7.25 (m, 4H), 7.22 (tt, J = 6.9, 1.8 Hz, 1H), 5.63 (dd, J = 8.3, 4.7 Hz, 1H), 5.06
(d, J = 4.7 Hz, 1H), 4.19 (d, J = 9.7 Hz, 1H), 3.94 (d, J = 13.6 Hz, 1H), 3.76 (d, J =
17.8 Hz, 1H), 3.66 (d, J = 11.9 Hz, 1H), 3.59 – 3.52 (m, 2H), 3.52 – 3.42 (m, 3H),
3.17 – 3.08 (m, 2H), 3.08 – 3.01 (m, 1H), 3.00 – 2.94 (m, 1H). Glucose alcohol
protons appear at 3 – 5.5 ppm but are too broad to integrate.
HRMS, ESI (-): m/z 525.0150 ([3 - H]-), calculated for C22H25N2OS2- 525.1007.
Summary: 1H-NMR shows coupling between Ha 9.08 ppm (d, J = 8.3 Hz, 1H) and Hb
5.63 ppm (dd, J = 8.3, 4.7 Hz, 1H), as well as Hb 5.63 ppm (dd, J = 8.3, 4.7 Hz, 1H)
and He 5.06 ppm (d, J = 4.7 Hz, 1H), labeled in Figure A.2.1. These assignments are
supported by COSY NMR (Fig A.2.3). Hf’ 3.94 ppm (d, J = 13.6 Hz, 1H) was assigned
based on an identical J coupling value and similar chemical shift to the analogous
proton in 1 while COSY data shows that the coupled geminal proton Hf is overlapping
with other peaks at 3.46 ppm. Importantly, in the spectrum of 3, all the protons
associated with the p-methoxy benzyl protecting group are missing while the lactam
protons Hb and He are still present (Fig A.2.2) with similar J coupling and chemical
shifts, suggesting the lactam remains intact. Additionally, the anomeric C-Hd proton
4.19 ppm (d, J = 9.7 Hz, 1H) still has a large J coupling value indicating β configuration
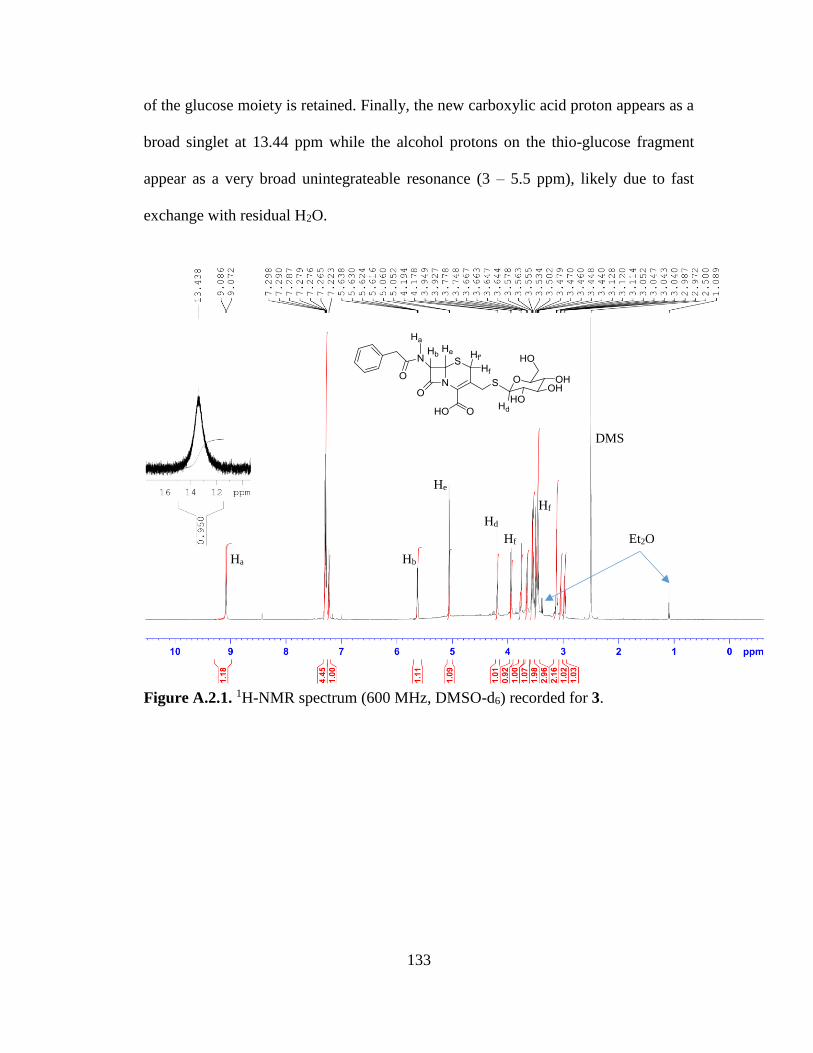
133
of the glucose moiety is retained. Finally, the new carboxylic acid proton appears as a
broad singlet at 13.44 ppm while the alcohol protons on the thio-glucose fragment
appear as a very broad unintegrateable resonance (3 – 5.5 ppm), likely due to fast
exchange with residual H2O.
Figure A.2.1. 1H-NMR spectrum (600 MHz, DMSO-d6) recorded for 3.
Ha Hb
He
Hd
Hf
’
Hf
Et2O
DMS
O
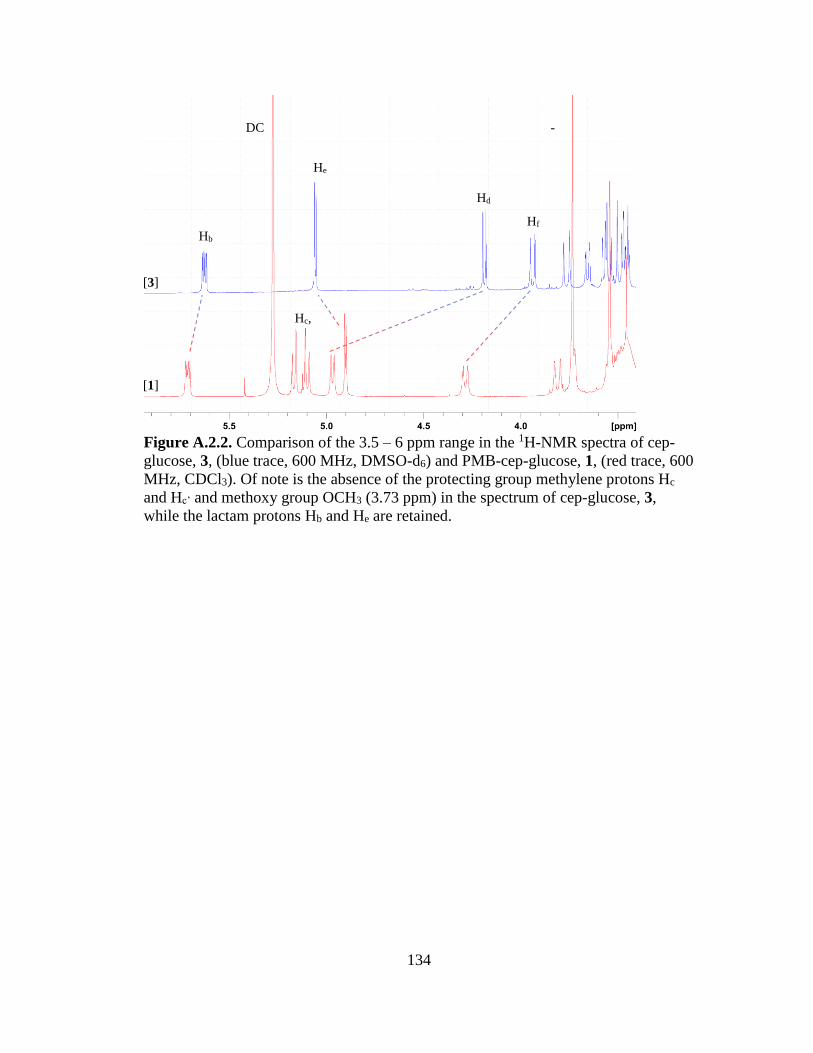
134
Figure A.2.2. Comparison of the 3.5 – 6 ppm range in the 1H-NMR spectra of cep-
glucose, 3, (blue trace, 600 MHz, DMSO-d6) and PMB-cep-glucose, 1, (red trace, 600
MHz, CDCl3). Of note is the absence of the protecting group methylene protons Hc
and Hc’ and methoxy group OCH3 (3.73 ppm) in the spectrum of cep-glucose, 3,
while the lactam protons Hb and He are retained.
[3]
[1]
Hb
Hd
He
Hf
Hc,
Hc’
DC
M
-
OCH3
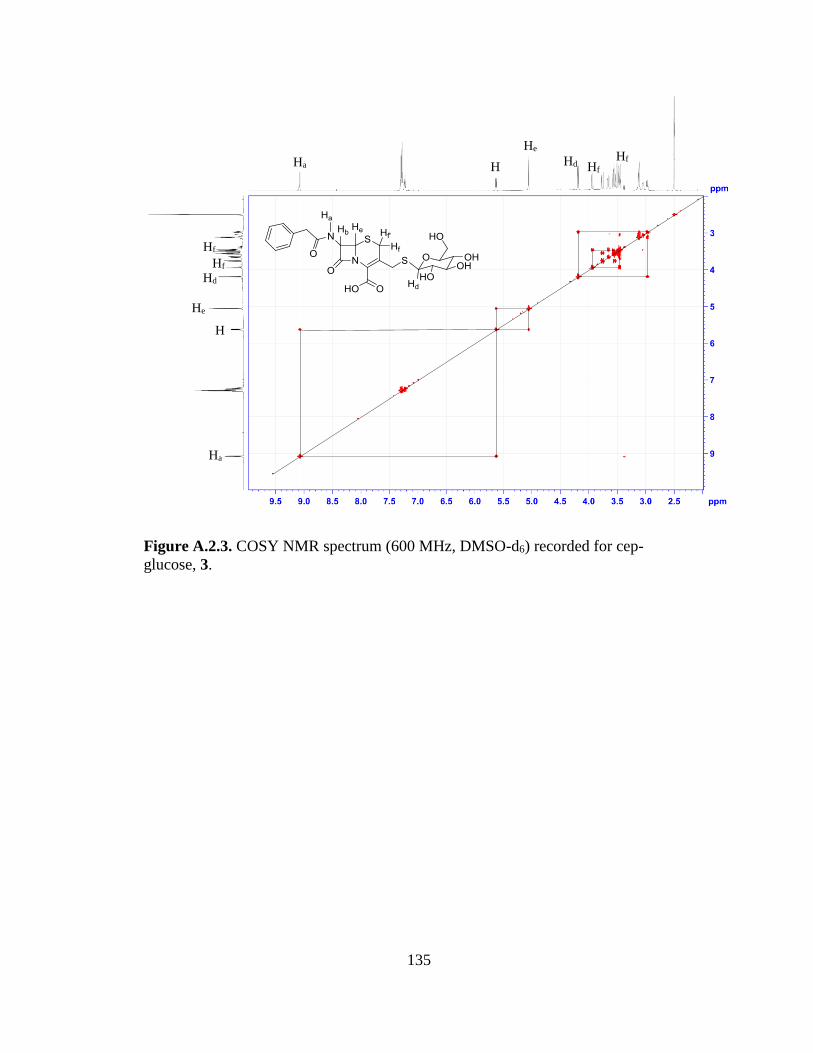
135
Figure A.2.3. COSY NMR spectrum (600 MHz, DMSO-d6) recorded for cep-
glucose, 3.
Ha H
b
He
Hd Hf
Hf
’
Ha
H
b
He
Hd
Hf
Hf
’
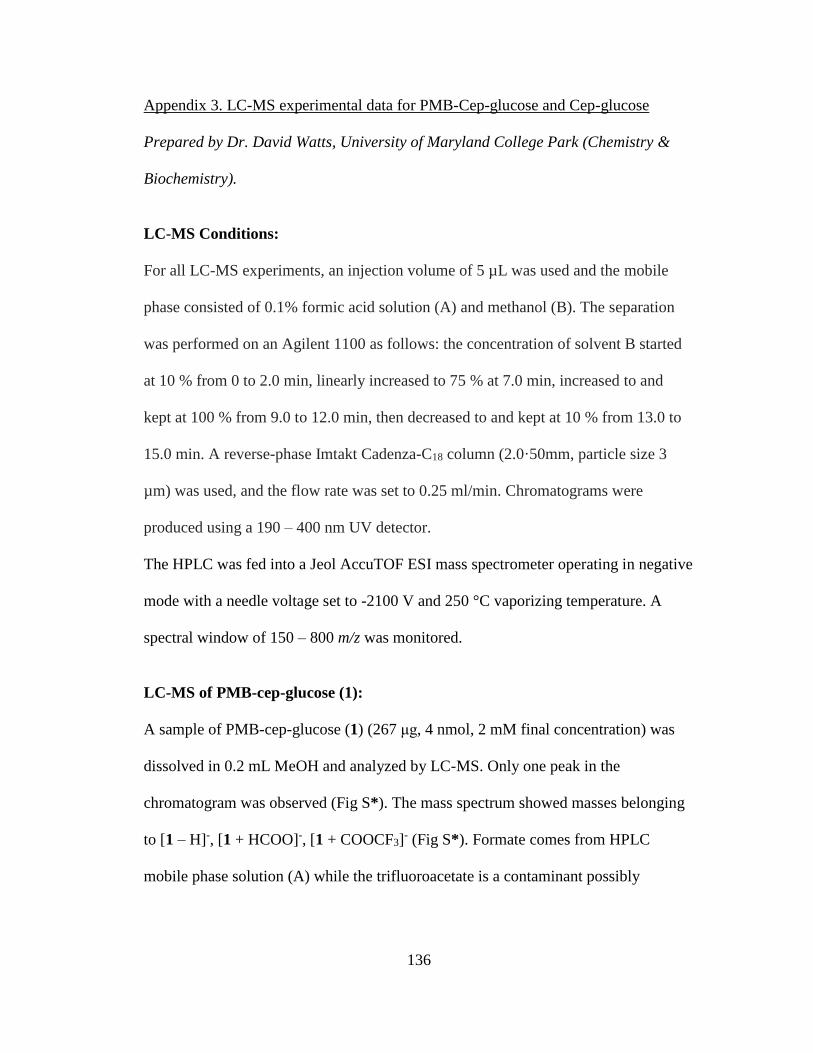
136
Appendix 3. LC-MS experimental data for PMB-Cep-glucose and Cep-glucose
Prepared by Dr. David Watts, University of Maryland College Park (Chemistry &
Biochemistry).
LC-MS Conditions:
For all LC-MS experiments, an injection volume of 5 µL was used and the mobile
phase consisted of 0.1% formic acid solution (A) and methanol (B). The separation
was performed on an Agilent 1100 as follows: the concentration of solvent B started
at 10 % from 0 to 2.0 min, linearly increased to 75 % at 7.0 min, increased to and
kept at 100 % from 9.0 to 12.0 min, then decreased to and kept at 10 % from 13.0 to
15.0 min. A reverse-phase Imtakt Cadenza-C18 column (2.0·50mm, particle size 3
µm) was used, and the flow rate was set to 0.25 ml/min. Chromatograms were
produced using a 190 – 400 nm UV detector.
The HPLC was fed into a Jeol AccuTOF ESI mass spectrometer operating in negative
mode with a needle voltage set to -2100 V and 250 °C vaporizing temperature. A
spectral window of 150 – 800 m/z was monitored.
LC-MS of PMB-cep-glucose (1):
A sample of PMB-cep-glucose (1) (267 μg, 4 nmol, 2 mM final concentration) was
dissolved in 0.2 mL MeOH and analyzed by LC-MS. Only one peak in the
chromatogram was observed (Fig S*). The mass spectrum showed masses belonging
to [1 – H]-, [1 + HCOO]-, [1 + COOCF3]- (Fig S*). Formate comes from HPLC
mobile phase solution (A) while the trifluoroacetate is a contaminant possibly
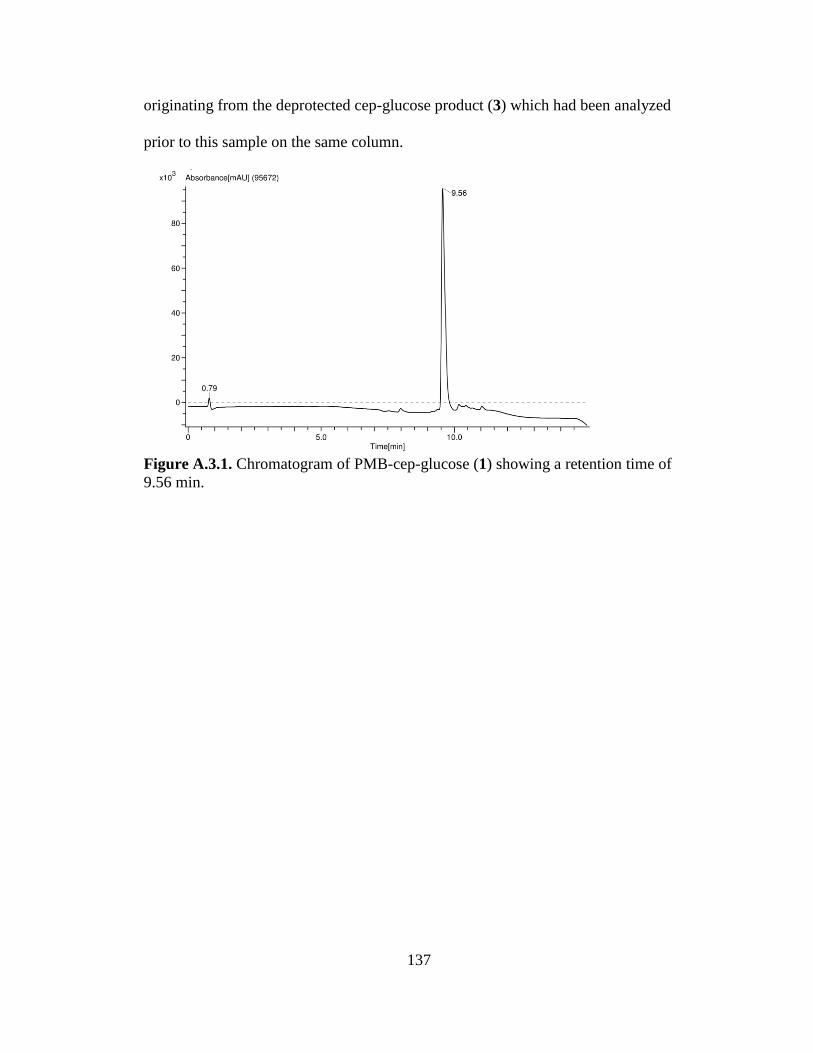
137
originating from the deprotected cep-glucose product (3) which had been analyzed
prior to this sample on the same column.
Figure A.3.1. Chromatogram of PMB-cep-glucose (1) showing a retention time of
9.56 min.
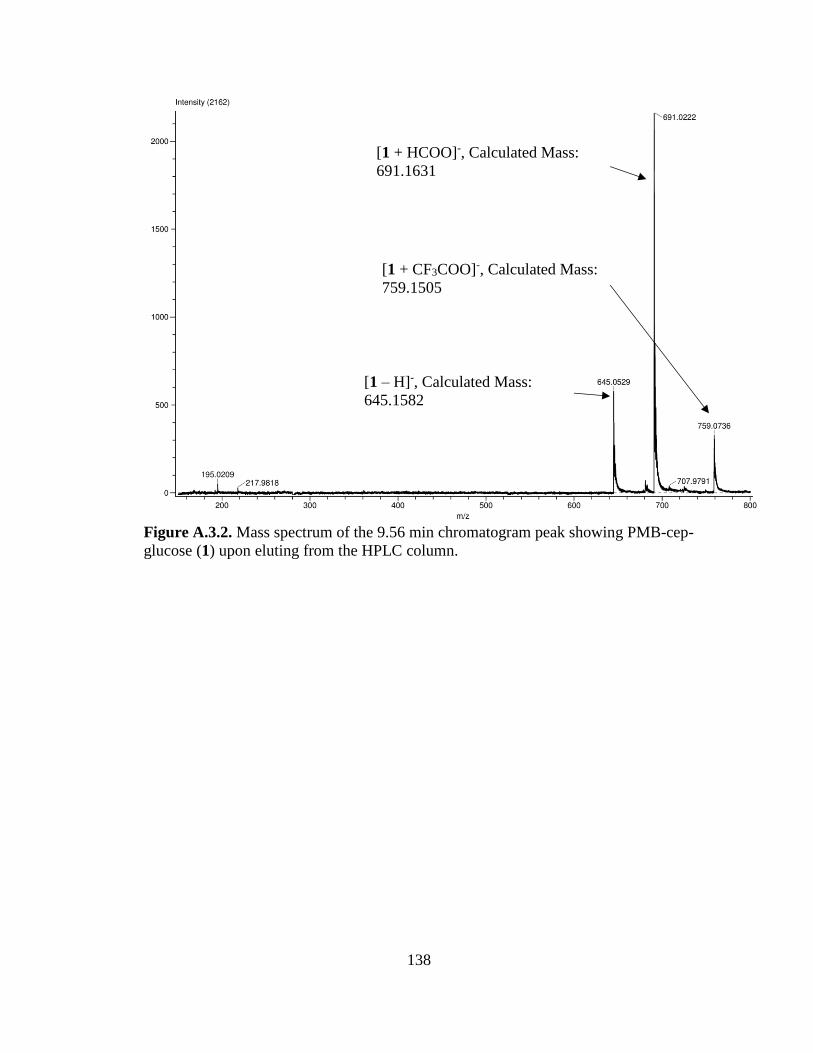
138
Figure A.3.2. Mass spectrum of the 9.56 min chromatogram peak showing PMB-cep-
glucose (1) upon eluting from the HPLC column.
[1 – H]-, Calculated Mass:
645.1582
[1 + HCOO]-, Calculated Mass:
691.1631
[1 + CF3COO]-, Calculated Mass:
759.1505
139
LC-MS of cep-glucose (3):
A sample of cep-glucose (3) (157 μg, 300 nmol, 1 mM final concentration) dissolved
in 0.15 mL 0.1 M phosphate buffer (pH 6.5) was analyzed by LC-MS. Only one peak
in the chromatogram was observed with a retention time of 8.06 min (Fig A.3.3). The
mass spectrum of this peak shows only one major species, belonging to [3 – H]- (Fig
A.3.4).
Figure A.3.3. Chromatogram of cep-glucose (3) showing a retention time of 8.06
min.
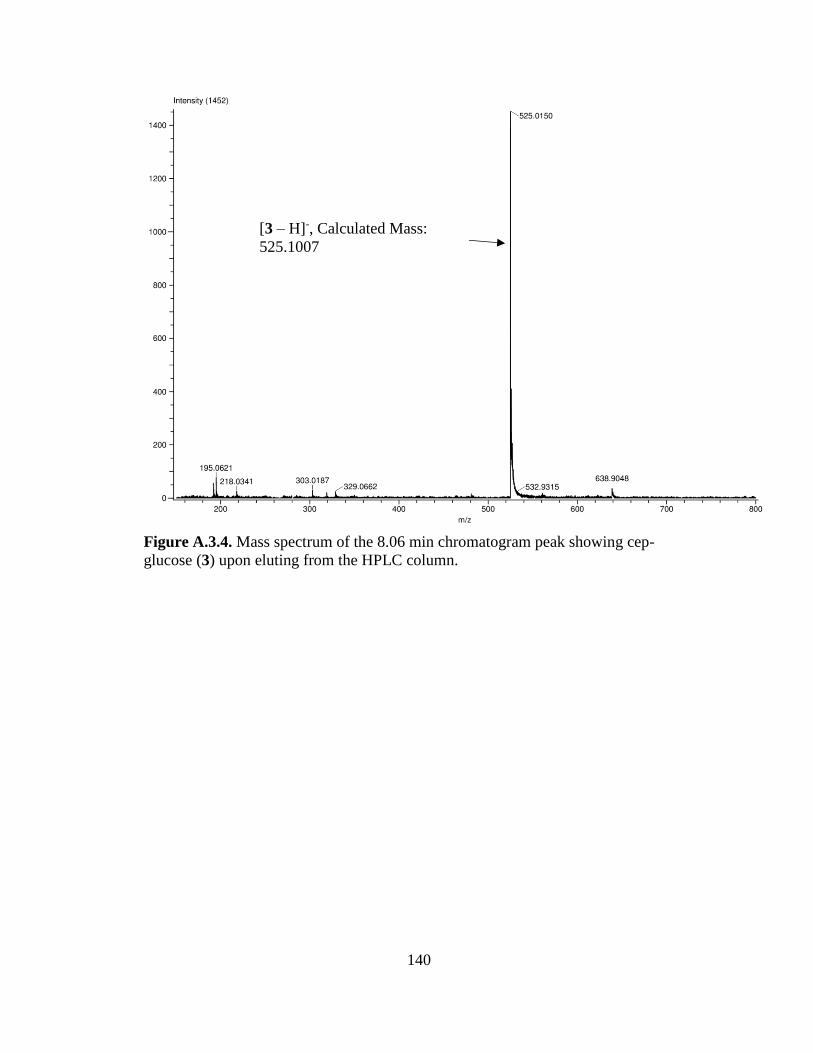
140
Figure A.3.4. Mass spectrum of the 8.06 min chromatogram peak showing cep-
glucose (3) upon eluting from the HPLC column.
[3 – H]-, Calculated Mass:
525.1007
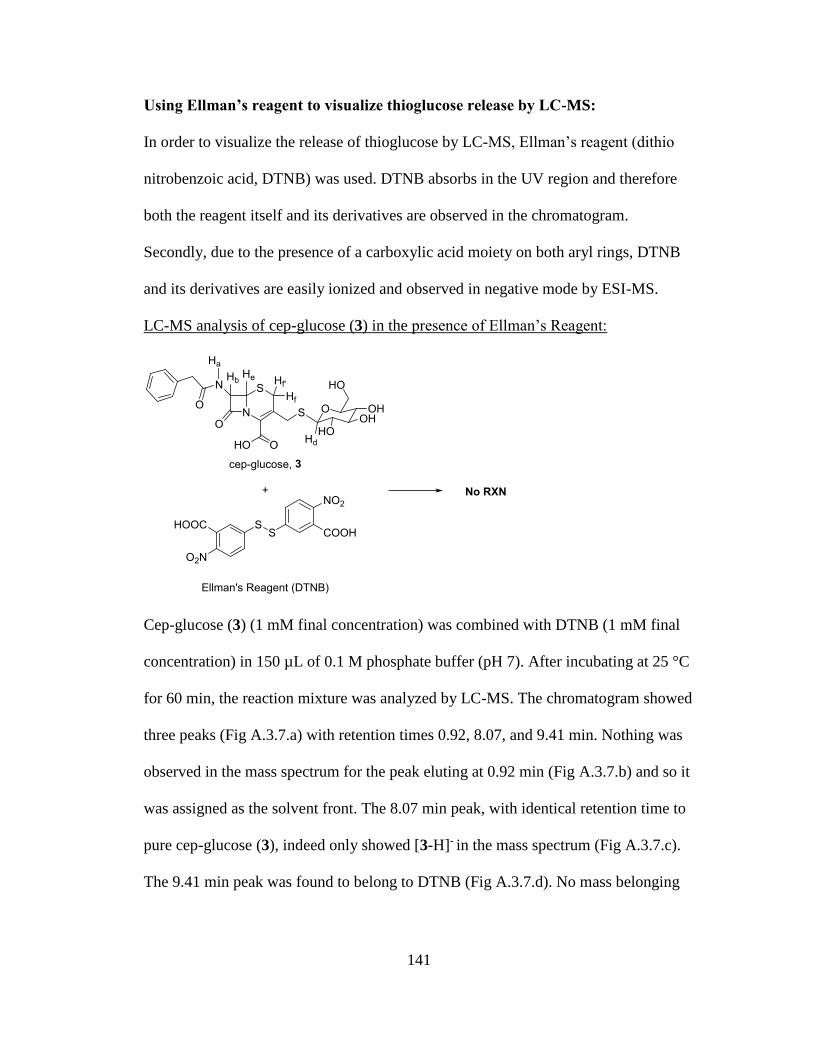
141
Using Ellman’s reagent to visualize thioglucose release by LC-MS:
In order to visualize the release of thioglucose by LC-MS, Ellman’s reagent (dithio
nitrobenzoic acid, DTNB) was used. DTNB absorbs in the UV region and therefore
both the reagent itself and its derivatives are observed in the chromatogram.
Secondly, due to the presence of a carboxylic acid moiety on both aryl rings, DTNB
and its derivatives are easily ionized and observed in negative mode by ESI-MS.
LC-MS analysis of cep-glucose (3) in the presence of Ellman’s Reagent:
Cep-glucose (3) (1 mM final concentration) was combined with DTNB (1 mM final
concentration) in 150 µL of 0.1 M phosphate buffer (pH 7). After incubating at 25 °C
for 60 min, the reaction mixture was analyzed by LC-MS. The chromatogram showed
three peaks (Fig A.3.7.a) with retention times 0.92, 8.07, and 9.41 min. Nothing was
observed in the mass spectrum for the peak eluting at 0.92 min (Fig A.3.7.b) and so it
was assigned as the solvent front. The 8.07 min peak, with identical retention time to
pure cep-glucose (3), indeed only showed [3-H]- in the mass spectrum (Fig A.3.7.c).
The 9.41 min peak was found to belong to DTNB (Fig A.3.7.d). No mass belonging
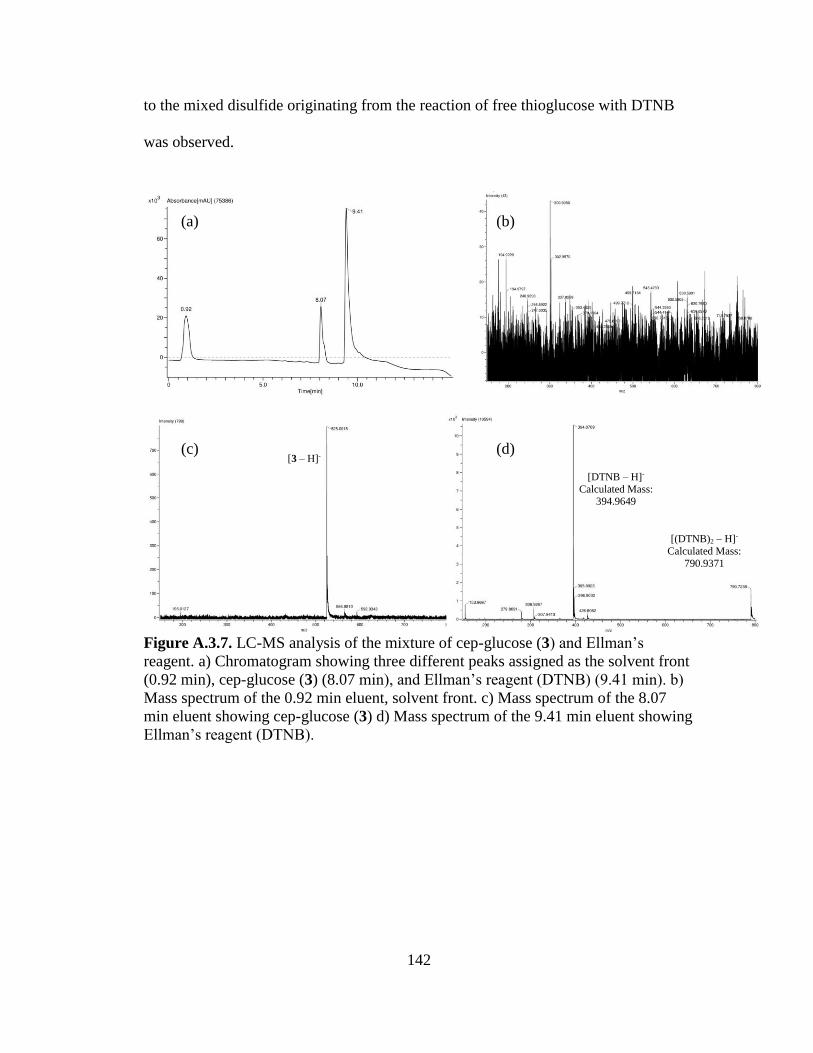
142
to the mixed disulfide originating from the reaction of free thioglucose with DTNB
was observed.
Figure A.3.7. LC-MS analysis of the mixture of cep-glucose (3) and Ellman’s
reagent. a) Chromatogram showing three different peaks assigned as the solvent front
(0.92 min), cep-glucose (3) (8.07 min), and Ellman’s reagent (DTNB) (9.41 min). b)
Mass spectrum of the 0.92 min eluent, solvent front. c) Mass spectrum of the 8.07
min eluent showing cep-glucose (3) d) Mass spectrum of the 9.41 min eluent showing
Ellman’s reagent (DTNB).
(a) (b)
(c) (d) [3 – H]-
[DTNB – H]-
Calculated Mass: 394.9649
[(DTNB)2 – H]-
Calculated Mass:
790.9371
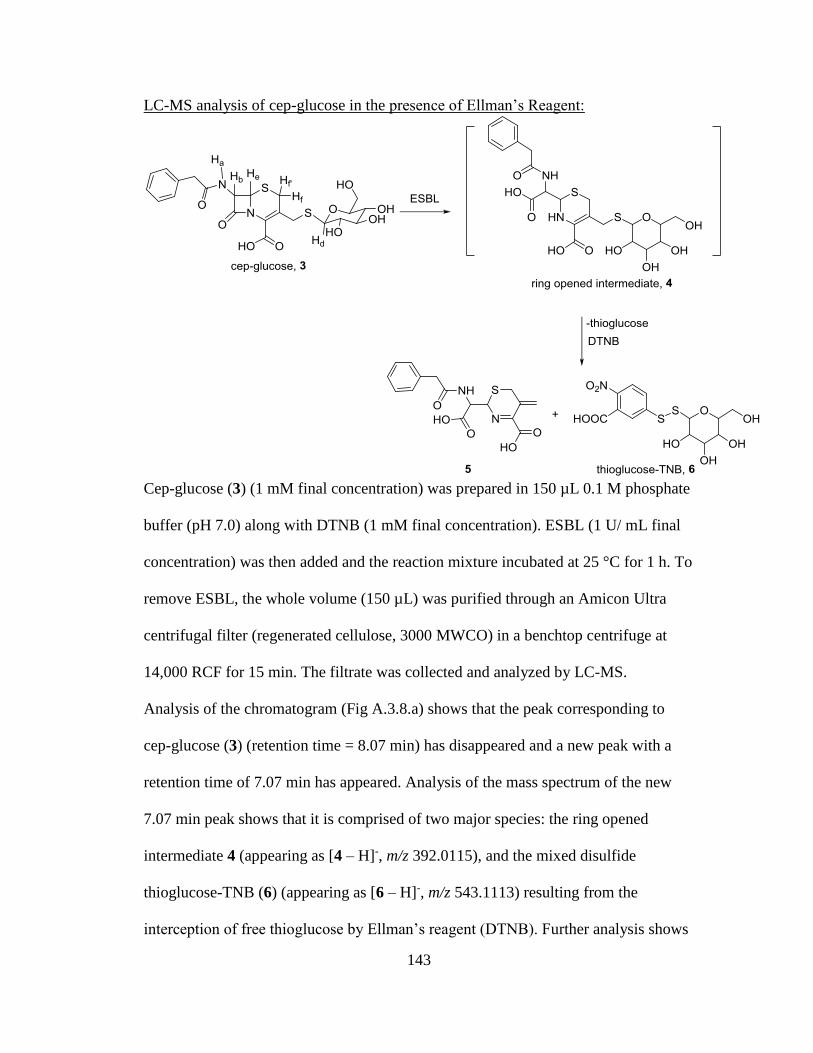
143
LC-MS analysis of cep-glucose in the presence of Ellman’s Reagent:
Cep-glucose (3) (1 mM final concentration) was prepared in 150 µL 0.1 M phosphate
buffer (pH 7.0) along with DTNB (1 mM final concentration). ESBL (1 U/ mL final
concentration) was then added and the reaction mixture incubated at 25 °C for 1 h. To
remove ESBL, the whole volume (150 µL) was purified through an Amicon Ultra
centrifugal filter (regenerated cellulose, 3000 MWCO) in a benchtop centrifuge at
14,000 RCF for 15 min. The filtrate was collected and analyzed by LC-MS.
Analysis of the chromatogram (Fig A.3.8.a) shows that the peak corresponding to
cep-glucose (3) (retention time = 8.07 min) has disappeared and a new peak with a
retention time of 7.07 min has appeared. Analysis of the mass spectrum of the new
7.07 min peak shows that it is comprised of two major species: the ring opened
intermediate 4 (appearing as [4 – H]-, m/z 392.0115), and the mixed disulfide
thioglucose-TNB (6) (appearing as [6 – H]-, m/z 543.1113) resulting from the
interception of free thioglucose by Ellman’s reagent (DTNB). Further analysis shows
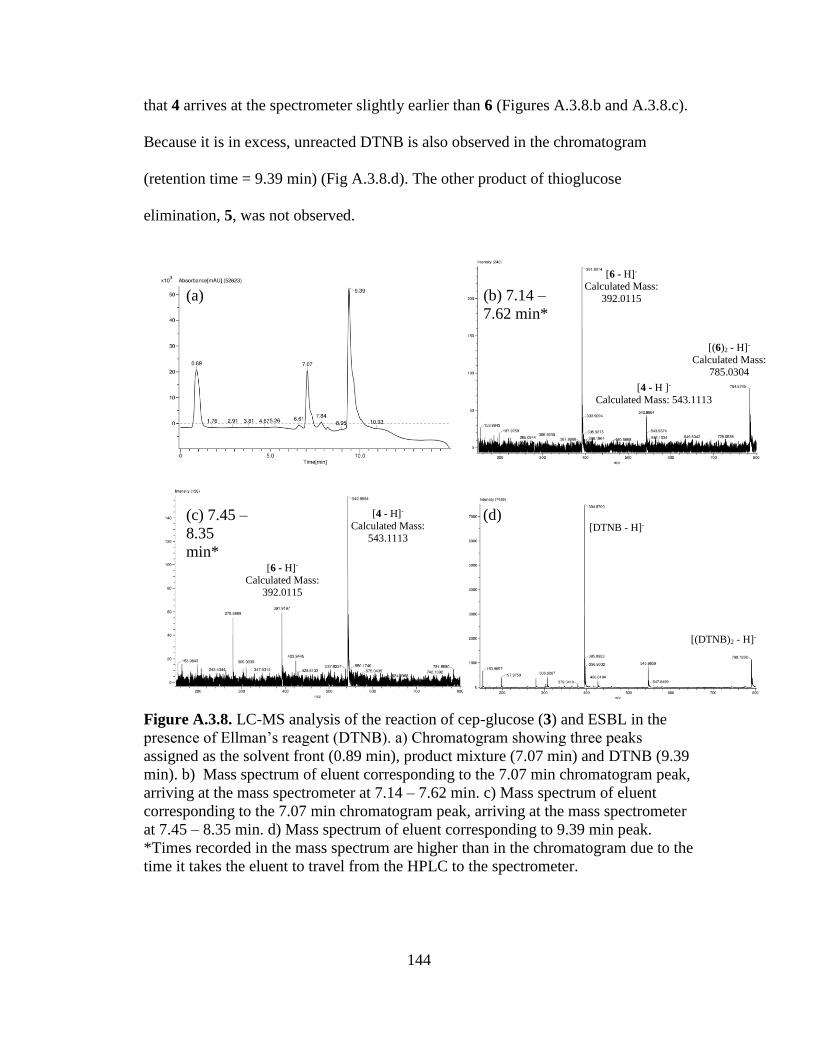
144
that 4 arrives at the spectrometer slightly earlier than 6 (Figures A.3.8.b and A.3.8.c).
Because it is in excess, unreacted DTNB is also observed in the chromatogram
(retention time = 9.39 min) (Fig A.3.8.d). The other product of thioglucose
elimination, 5, was not observed.
Figure A.3.8. LC-MS analysis of the reaction of cep-glucose (3) and ESBL in the
presence of Ellman’s reagent (DTNB). a) Chromatogram showing three peaks
assigned as the solvent front (0.89 min), product mixture (7.07 min) and DTNB (9.39
min). b) Mass spectrum of eluent corresponding to the 7.07 min chromatogram peak,
arriving at the mass spectrometer at 7.14 – 7.62 min. c) Mass spectrum of eluent
corresponding to the 7.07 min chromatogram peak, arriving at the mass spectrometer
at 7.45 – 8.35 min. d) Mass spectrum of eluent corresponding to 9.39 min peak.
*Times recorded in the mass spectrum are higher than in the chromatogram due to the
time it takes the eluent to travel from the HPLC to the spectrometer.
(a) (b) 7.14 –
7.62 min*
(c) 7.45 –
8.35
min*
(d)
[4 - H ]-
Calculated Mass: 543.1113
[6 - H]- Calculated Mass:
392.0115
[6 - H]-
Calculated Mass: 392.0115
[4 - H]-
Calculated Mass:
543.1113 [DTNB - H]-
[(6)2 - H]-
Calculated Mass:
785.0304
[(DTNB)2 - H]-
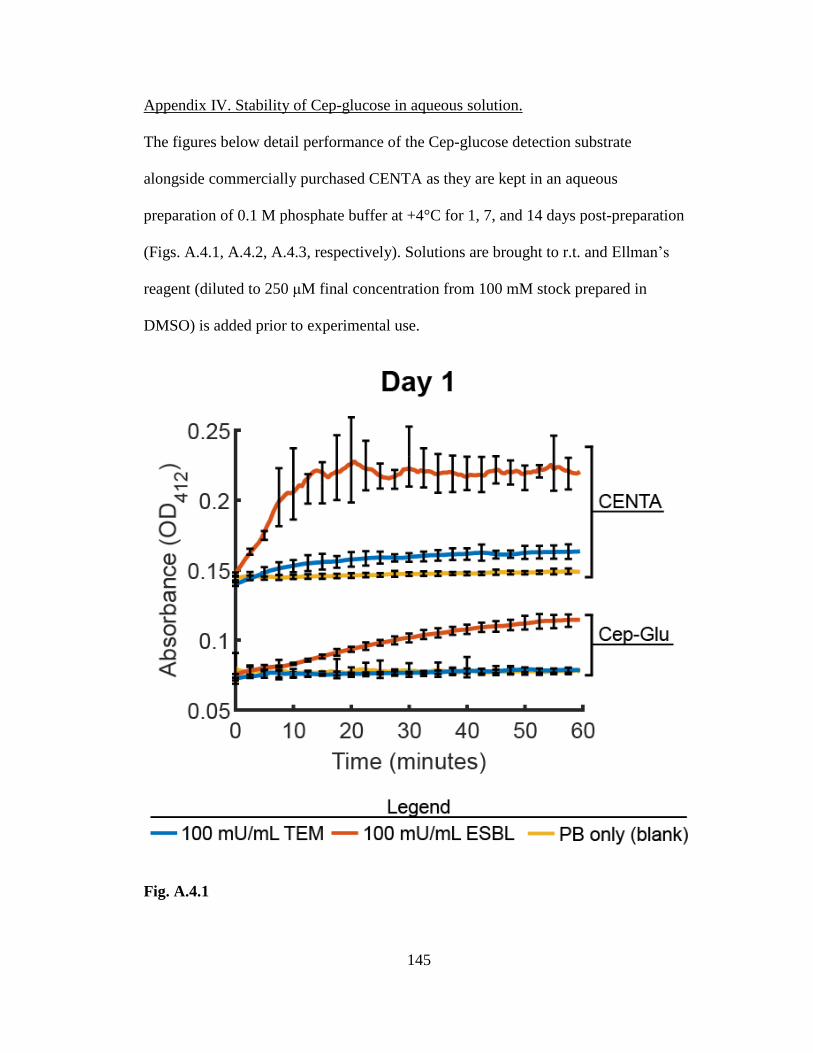
145
Appendix IV. Stability of Cep-glucose in aqueous solution.
The figures below detail performance of the Cep-glucose detection substrate
alongside commercially purchased CENTA as they are kept in an aqueous
preparation of 0.1 M phosphate buffer at +4°C for 1, 7, and 14 days post-preparation
(Figs. A.4.1, A.4.2, A.4.3, respectively). Solutions are brought to r.t. and Ellman’s
reagent (diluted to 250 μM final concentration from 100 mM stock prepared in
DMSO) is added prior to experimental use.
Fig. A.4.1
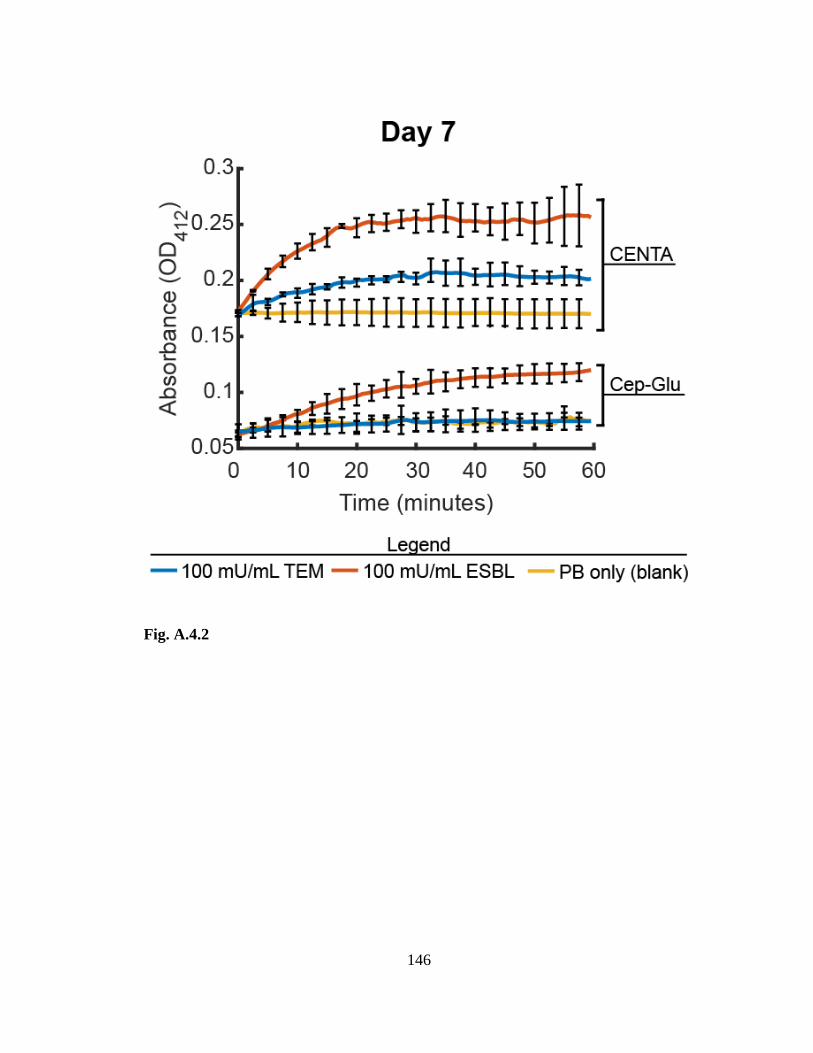
146
Fig. A.4.2
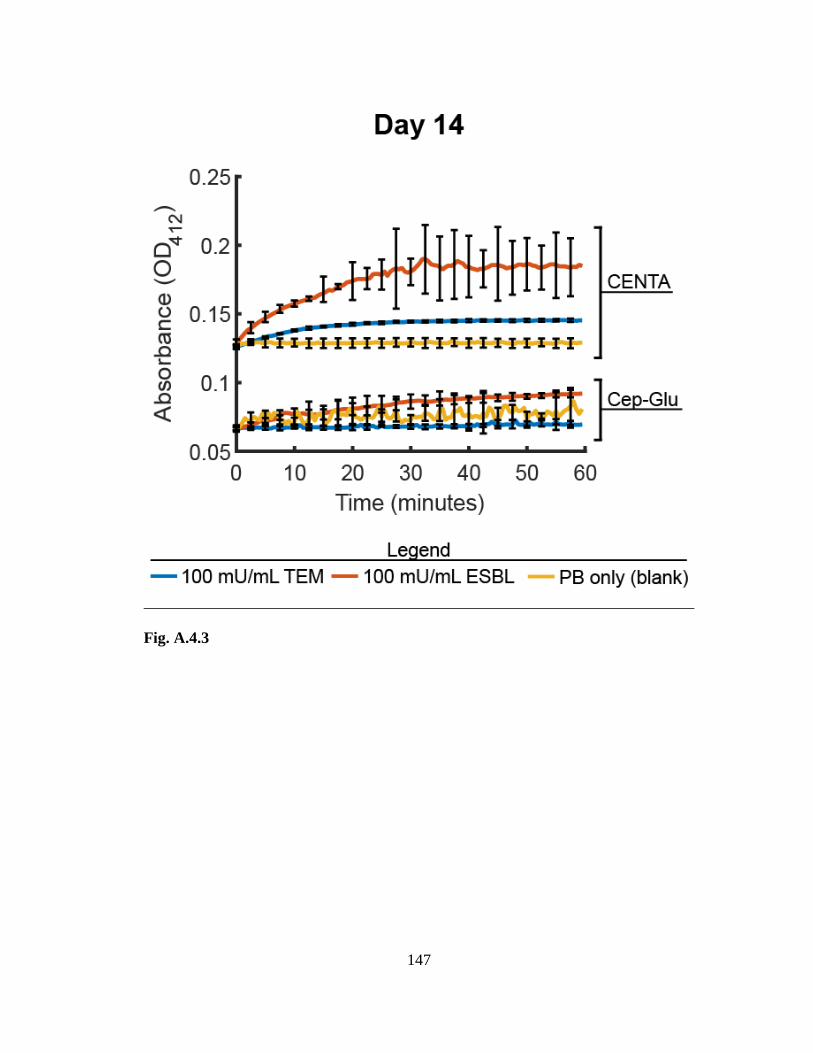
147
Fig. A.4.3
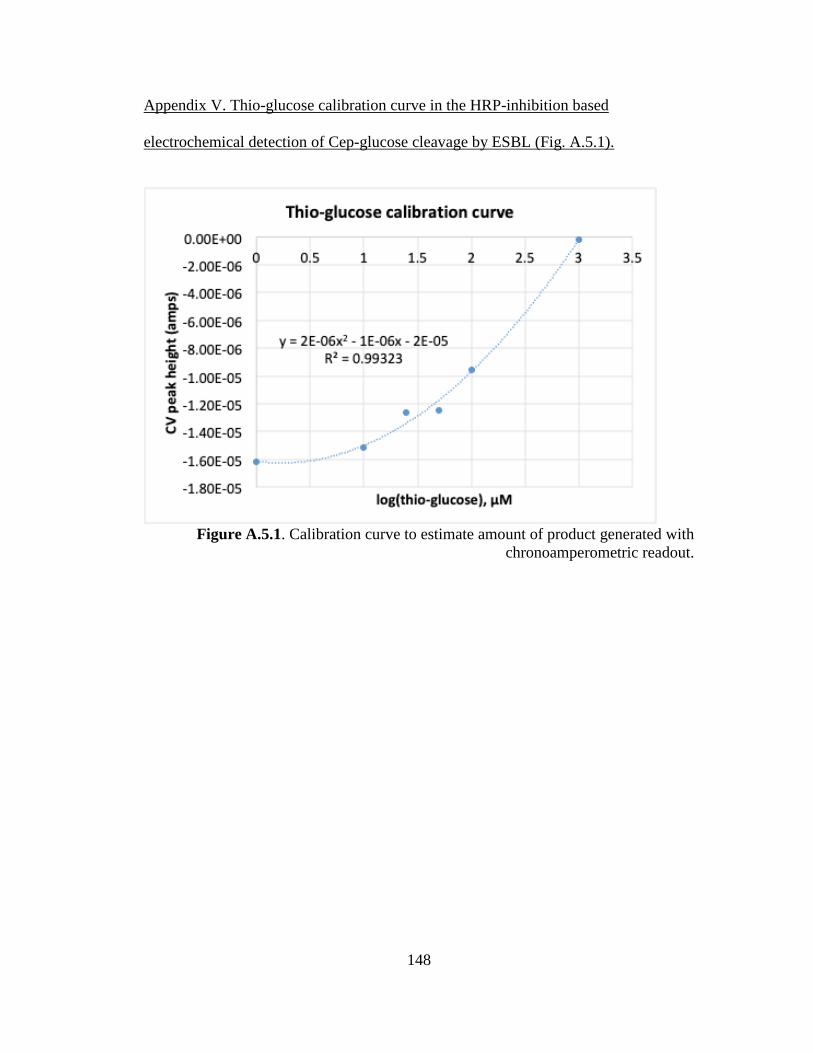
148
Appendix V. Thio-glucose calibration curve in the HRP-inhibition based
electrochemical detection of Cep-glucose cleavage by ESBL (Fig. A.5.1).
Figure A.5.1. Calibration curve to estimate amount of product generated with
chronoamperometric readout.
149
Bibliography
1. Antibiotic Resistance Threats in the United States, 2013 |
Antibiotic/Antimicrobial Resistance | CDC. Available at:
https://www.cdc.gov/drugresistance/threat-report-2013/. (Accessed: 13th March
2017)
2. CDC. The biggest antibiotic-resistant threats in the U.S. Centers for Disease
Control and Prevention (2018). Available at:
https://www.cdc.gov/drugresistance/biggest_threats.html. (Accessed: 3rd
December 2018)
3. Jorgensen, J. H., Hindler, J. F., Reller, L. B. & Weinstein, M. P. New Consensus
Guidelines from the Clinical and Laboratory Standards Institute for
Antimicrobial Susceptibility Testing of Infrequently Isolated or Fastidious
Bacteria. Clin. Infect. Dis. 44, 280–286 (2007).
4. Dellit, T. H. et al. Infectious Diseases Society of America and the Society for
Healthcare Epidemiology of America Guidelines for Developing an Institutional
Program to Enhance Antimicrobial Stewardship. Clin. Infect. Dis. 44, 159–177
(2007).
5. Reller, L. B., Weinstein, M., Jorgensen, J. H. & Ferraro, M. J. Antimicrobial
Susceptibility Testing: A Review of General Principles and Contemporary
Practices. Clin. Infect. Dis. 49, 1749–1755 (2009).
6. Wintermans, B. B., Reuland, E. A., Wintermans, R. G. F., Bergmans, A. M. C.
& Kluytmans, J. A. J. W. The cost-effectiveness of ESBL detection: towards
molecular detection methods? Clin. Microbiol. Infect. 19, 662–665 (2013).
7. LaPlante, K., Cunha, C., Morrill, H., Rice, L. & Mylonakis, E. Antimicrobial
Stewardship: Principles and Practice. (CABI, 2016).
8. Jorgensen, J. H., Lee, J. C. & Alexander, G. A. Rapid Penicillinase Paper Strip
Test for Detection of Beta-Lactamase-Producing Haemophilus influenzae and
Neisseria gonorrhoeae. Antimicrob. Agents Chemother. 11, 1087–1088 (1977).
9. Catlin, B. W. Iodometric Detection of Haemophilus influenzae Beta-Lactamase:
Rapid Presumptive Test for Ampicillin Resistance. Antimicrob. Agents
Chemother. 7, 265–270 (1975).
10. Livermore, D. M. & Brown, D. F. J. Detection of β-lactamase-mediated
resistance. J. Antimicrob. Chemother. 48, 59–64 (2001).
11. Bebrone, C. et al. CENTA as a Chromogenic Substrate for Studying β-
Lactamases. Antimicrob. Agents Chemother. 45, 1868–1871 (2001).
150
12. Orenga, S., James, A. L., Manafi, M., Perry, J. D. & Pincus, D. H. Enzymatic
substrates in microbiology. J. Microbiol. Methods 79, 139–155 (2009).
13. HardyDisks - disk diffusion susceptibility test procedure - Kirby Bauer -
HardyDiskASTProceduresandChart.pdf. Available at:
https://catalog.hardydiagnostics.com/cp_prod/Content/hugo/HardyDiskASTProc
eduresandChart.pdf. (Accessed: 13th March 2017)
14. Réglier-Poupet, H. et al. Performance of chromID ESBL, a chromogenic
medium for detection of Enterobacteriaceae producing extended-spectrum β-
lactamases. J. Med. Microbiol. 57, 310–315 (2008).
15. Gao, W., Xing, B., Tsien, R. Y. & Rao, J. Novel Fluorogenic Substrates for
Imaging β-Lactamase Gene Expression. J. Am. Chem. Soc. 125, 11146–11147
(2003).
16. Zlokarnik, G. et al. Quantitation of Transcription and Clonal Selection of Single
Living Cells with β-Lactamase as Reporter. Science 279, 84–88 (1998).
17. Xing, B., Khanamiryan, A. & Rao, J. Cell-Permeable Near-Infrared Fluorogenic
Substrates for Imaging β-Lactamase Activity. J. Am. Chem. Soc. 127, 4158–
4159 (2005).
18. Watanabe, S., Mizukami, S., Hori, Y. & Kikuchi, K. Multicolor Protein
Labeling in Living Cells Using Mutant β-Lactamase-Tag Technology.
Bioconjug. Chem. 21, 2320–2326 (2010).
19. Kong, Y. et al. Imaging tuberculosis with endogenous β-lactamase reporter
enzyme fluorescence in live mice. Proc. Natl. Acad. Sci. 107, 12239–12244
(2010).
20. Jiang, J., Zhang, J. & Li, S. Detecting protein interactions in live cellsvia
complementation of a hydrolysis-deficient β-lactamase. Chem. Commun. 47,
182–184 (2010).
21. Zhang, J., Shen, Y., May, S. L., Nelson, D. C. & Li, S. Ratiometric Fluorescence
Detection of Pathogenic Bacteria Resistant to Broad-Spectrum β-Lactam
Antibiotics. Angew. Chem. 124, 1901–1904 (2012).
22. da Silva, E. T. S. G. et al. Electrochemical Biosensors in Point-of-Care Devices:
Recent Advances and Future Trends. ChemElectroChem 4, 778–794 (2017).
23. Lan, T., Zhang, J. & Lu, Y. Transforming the blood glucose meter into a general
healthcare meter for in vitro diagnostics in mobile health. Biotechnol. Adv. 34,
331–341 (2016).
24. Xu, J. et al. Sensitive point-of-care monitoring of HIV related DNA sequences
with a personal glucometer. Chem. Commun. 48, 10733–10735 (2012).
151
25. Gu, C., Lan, T., Shi, H. & Lu, Y. Portable Detection of Melamine in Milk Using
a Personal Glucose Meter Based on an in Vitro Selected Structure-Switching
Aptamer. Anal. Chem. 87, 7676–7682 (2015).
26. Rochelet, M. et al. Amperometric detection of extended-spectrum β-lactamase
activity: application to the characterization of resistant E. coli strains. Analyst
140, 3551–3556 (2015).
27. ND4BB | IMI - Innovative Medicines Initiative. Available at:
http://www.imi.europa.eu/content/nd4bb. (Accessed: 13th March 2017)
28. IDSA : Antibiotic Development: The 10 x ’20 Initiative. Available at:
http://www.idsociety.org/10x20/. (Accessed: 13th March 2017)
29. Joshi, S. Hospital antibiogram: a necessity. Indian J. Med. Microbiol. 28, 277–
280 (2010).
30. CDC. Antibiotic Prescribing Putting Patients at Risk. Centers for Disease
Control and Prevention (2014). Available at:
http://www.cdc.gov/media/dpk/antibiotic-resistance/safer-healthcare/dpk-vs-
safer-health-care.html. (Accessed: 13th March 2017)
31. Dancer, S. J. The problem with cephalosporins. J. Antimicrob. Chemother. 48,
463–478 (2001).
32. Nordmann, P. & Guibert, M. Extended-spectrum beta-lactamases in
Pseudomonas aeruginosa. J. Antimicrob. Chemother. 42, 128–131 (1998).
33. McNulty, C. et al. Successful control of Clostridium difficile infection in an
elderly care unit through use of a restrictive antibiotic policy. J. Antimicrob.
Chemother. 40, 707–711 (1997).
34. Slimings, C. & Riley, T. V. Antibiotics and hospital-acquired Clostridium
difficile infection: update of systematic review and meta-analysis. J. Antimicrob.
Chemother. 69, 881–891 (2014).
35. Chen, H. Y., Yuan, M. & Livermore, D. M. Mechanisms of resistance to beta-
lactam antibiotics amongst Pseudomonas aeruginosa isolates collected in the UK
in 1993. J. Med. Microbiol. 43, 300–309 (1995).
36. Zeng, X. & Lin, J. Beta-lactamase induction and cell wall metabolism in Gram-
negative bacteria. Front. Microbiol. 4, 128 (2013).
37. Fountain, R. H. & Russell, A. D. Studies on the Mode of Action of Some
Cephalosporin Derivatives. J. Appl. Bacteriol. 32, 312–321 (1969).
38. Jacoby, G. A. AmpC β-Lactamases. Clin. Microbiol. Rev. 22, 161–182 (2009).
152
39. Knox, J. R., Moews, P. C. & Frere, J.-M. Molecular evolution of bacterial β-
lactam resistance. Chem. Biol. 3, 937–947 (1996).
40. Oates, J. A., Wood, A. J., Donowitz, G. R. & Mandell, G. L. Drug Therapy:
Beta-Lactam Antibiotics. N. Engl. J. Med. Boston 318, 419–426 (1988).
41. Neu, H. C. Factors that affect the in-vitro activity of cephalosporin antibiotics. J.
Antimicrob. Chemother. 10, 11–23 (1982).
42. Curtis, N. A., Orr, D., Ross, G. W. & Boulton, M. G. Affinities of penicillins
and cephalosporins for the penicillin-binding proteins of Escherichia coli K-12
and their antibacterial activity. Antimicrob. Agents Chemother. 16, 533–539
(1979).
43. Fu, K. P. & Neu, H. C. Beta-Lactamase Stability of HR 756, a Novel
Cephalosporin, Compared to That of Cefuroxime and Cefoxitin. Antimicrob.
Agents Chemother. 14, 322–326 (1978).
44. Stapley, E. O. et al. Cefoxitin and Cephamycins: Microbiological Studies. Rev.
Infect. Dis. 1, 73–87 (1979).
45. O’Callaghan, C. H. Description and classification of the newer cephalosporins
and their relationships with the established compounds. J. Antimicrob.
Chemother. 5, 635–671 (1979).
46. Bush, K. Alarming β-lactamase-mediated resistance in multidrug-resistant
Enterobacteriaceae. Curr. Opin. Microbiol. 13, 558–564 (2010).
47. Papp-Wallace, K. M., Endimiani, A., Taracila, M. A. & Bonomo, R. A.
Carbapenems: Past, Present, and Future. Antimicrob. Agents Chemother. 55,
4943–4960 (2011).
48. Sykes, R. B. & Bonner, D. P. Aztreonam: The first monobactam. Am. J. Med.
78, 2–10 (1985).
49. English, A. R., Retsema, J. A., Girard, A. E., Lynch, J. E. & Barth, W. E. CP-
45,899, a Beta-Lactamase Inhibitor That Extends the Antibacterial Spectrum of
Beta-Lactams: Initial Bacteriological Characterization. Antimicrob. Agents
Chemother. 14, 414–419 (1978).
50. Reading, C. & Cole, M. Clavulanic Acid: a Beta-Lactamase-Inhibiting Beta-
Lactam from Streptomyces clavuligerus. Antimicrob. Agents Chemother. 11,
852–857 (1977).
51. Reading, C. & Farmer, T. The inhibition of β-lactamases from Gram-negative
bacteria by clavulanic acid. Biochem. J. 199, 779–787 (1981).
153
52. Labia, R., Lelievre, V. & Peduzzi, J. Inhibition kinetics of three R-factor-
mediated β-lactamases by a new β-lactam sulfone (CP 45899). Biochim.
Biophys. Acta BBA - Enzymol. 611, 351–357 (1980).
53. Sawai, T. & Tsukamoto, K. CEFOXITIN, N-FORMIMIDOYL
THIENAMYCIN, CLAVULANIC ACID, AND PENICILLANIC ACID
SULFONE AS SUICIDE INHIBITORS FOR DIFFERENT TYPES OF β-
LACTAMASES PRODUCED BY GRAM-NEGATIVE BACTERIA. J.
Antibiot. (Tokyo) 35, 1594–1602 (1982).
54. Labia, R., Morand, A., Lelievre, V., Mattioni, D. & Kazmierczak, A. Sulbactam:
Biochemical Factors Involved in Its Synergy with Ampicillin. Rev. Infect. Dis.
8, S496–S502 (1986).
55. Drusano, G. L., Schimpff, S. C. & Hewitt, W. L. The Acylampicillins:
Mezlocillin, Piperacillin, and Azlocillin. Rev. Infect. Dis. 6, 13–32 (1984).
56. Parry, M. F. & Neu, H. C. Ticarcillin for Treatment of Serious Infections with
Gram-Negative Bacteria. J. Infect. Dis. 134, 476–485 (1976).
57. Winston, D. J., Murphy, W., Young, L. S. & Hewitt, W. L. Piperacillin therapy
for serious bacterial infections. Am. J. Med. 69, 255–261 (1980).
58. Brown, C. H., Natelson, E. A., Bradshaw, M. W., Alfrey, C. P. & Williams, T.
W. Study of the Effects of Ticarcillin on Blood Coagulation and Platelet
Function. Antimicrob. Agents Chemother. 7, 652–657 (1975).
59. Holt, H. A., Broughall, J. M., McCarthy, M. & Reeves, D. S. Interactions
between aminoglycoside antibiotics and carbenicillin or ticarcillin. Infection 4,
107–109 (1976).
60. Pickering, L. K. & Rutherford, I. Effect of concentration and time upon
inactivation of tobramycin, gentamicin, netilmicin and amikacin by azlocillin,
carbenicillin, mecillinam, mezlocillin and piperacillin. J. Pharmacol. Exp. Ther.
217, 345–349 (1981).
61. Brogden, R. N., Heel, R. C., Speight, T. M. & Avery, G. S. Ticarcillin: A
Review of its Pharmacological Properties and Therapeutic Efficacy. Drugs 20,
325–352 (1980).
62. Ervin, F. R. & Bullock, W. E. Clinical and Pharmacological Studies of
Ticarcillin in Gram-Negative Infections. Antimicrob. Agents Chemother. 9, 94–
101 (1976).
63. Pancoast, S. J., Jahre, J. A. & Neu, H. C. Mezlocillin in the therapy of serious
infections. Am. J. Med. 67, 747–752 (1979).
154
64. LeFrock, J. L. et al. In-vitro and in-vivo comparison of mezlocillin and
cefoxitin. J. Antimicrob. Chemother. 11, 83–90 (1983).
65. Ramirez-Ronda, C. H., Gutiérrez, J. & Bermúdez, R. H. Comparative
effectiveness, safety and tolerance of mezlocillin and ticarcillin: A prospective
randomized trial. J. Antimicrob. Chemother. 9, 125–129 (1982).
66. Madsen, P. O. & Nielsen, O. S. Treatment of complicated urinary tract
infections with mezlocillin and ticarcillin, a comparative study. J. Antimicrob.
Chemother. 9, 179–181 (1982).
67. Rolandi, E. et al. Comparison of mezlocillin and carbenicillin as therapy for
various infectious diseases. Clin. Ther. 4, 321–325 (1981).
68. Lewandowski, A., Orlowski, T. & Weuta, H. Mezlocillin and carbenicillin: A
clinical comparison of serious systemic infections in surgical patients. Infection
10, S121–S124 (1982).
69. Pancoast, S., Prince, A. S., Francke, E. L. & Neu, H. C. Clinical Evaluation of
Piperacillin Therapy for Infection. Arch. Intern. Med. 141, 1447–1450 (1981).
70. Lutz, B., Mogabgab, W., Holmes, B., Pollock, B. & Beville, R. Clinical
evaluation of the therapeutic efficacy and tolerability of piperacillin. Antimicrob.
Agents Chemother. 22, 10–14 (1982).
71. Eron, L. J., Goldenberg, R. I., Poretz, D. M. & Park, C. H. Piperacillin therapy
for Pseudomonas infections. South. Med. J. 76, 859–862 (1983).
72. Lavery, J. P. et al. Mezlocillin prophylaxis against infection after cesarean
section: a comparison of techniques. South. Med. J. 79, 1248–1251 (1986).
73. Cartwright, P. S., Pittaway, D. E., Jones, H. W. I. & Entman, S. S. The Use of
Prophylactic Antibiotics in Obstetrics and Gynecology. A Review. Obstet.
Gynecol. Surv. 39, 537 (1984).
74. Gruber, U. F., Elke, R. & Widmer, M. Mezlocillin prophylaxis in biliary tract
surgery. Results of a retrospective and a prospective trial. Infection 10, S144–
S147 (1982).
75. Baker, R. J. et al. A prospective double-blind comparison of piperacillin,
cephalothin and cefoxitin in the prevention of postoperative infections in
patients undergoing intra-abdominal operations. Surg. Gynecol. Obstet. 161,
409–415 (1985).
76. Benigno, B. B. et al. A comparison of piperacillin, cephalothin and cefoxitin in
the prevention of postoperative infections in patients undergoing vaginal
hysterectomy. Surg. Gynecol. Obstet. 163, 421–427 (1986).
155
77. Wallace, R. L. & Yonekura, M. L. The use of prophylactic antibiotics in patients
undergoing emergency primary cesarean section. Am. J. Obstet. Gynecol. 147,
533–536 (1983).
78. Lewis, R. T. et al. A single preoperative dose of cefazolin prevents
postoperative sepsis in high-risk biliary surgery. Can. J. Surg. J. Can. Chir. 27,
44–47 (1984).
79. Woodford, N. & Ellington, M. J. The emergence of antibiotic resistance by
mutation. Clin. Microbiol. Infect. 13, 5–18 (2007).
80. Lewis, D. A. The Gonococcus fights back: is this time a knock out? Sex.
Transm. Infect. 86, 415–421 (2010).
81. Rossolini, G. M., Arena, F., Pecile, P. & Pollini, S. Update on the antibiotic
resistance crisis. Curr. Opin. Pharmacol. 18, 56–60 (2014).
82. Babic, M., Hujer, A. M. & Bonomo, R. A. What’s new in antibiotic resistance?
Focus on beta-lactamases. Drug Resist. Updat. 9, 142–156 (2006).
83. Jacoby, G. A., Chow, N. & Waites, K. B. Prevalence of Plasmid-Mediated
Quinolone Resistance. Antimicrob. Agents Chemother. 47, 559–562 (2003).
84. Mammeri, H., Loo, M. V. D., Poirel, L., Martinez-Martinez, L. & Nordmann, P.
Emergence of Plasmid-Mediated Quinolone Resistance in Escherichia coli in
Europe. Antimicrob. Agents Chemother. 49, 71–76 (2005).
85. Martinez-Martinez, L., Pascual, A. & Jacoby, G. A. Quinolone resistance from a
transferable plasmid. Lancet 351, 797–799 (1998).
86. Wang, M., Sahm, D. F., Jacoby, G. A. & Hooper, D. C. Emerging Plasmid-
Mediated Quinolone Resistance Associated with the qnr Gene in Klebsiella
pneumoniae Clinical Isolates in the United States. Antimicrob. Agents
Chemother. 48, 1295–1299 (2004).
87. Martínez-Martínez, L. et al. Energy-Dependent Accumulation of Norfloxacin
and Porin Expression in Clinical Isolates of Klebsiella pneumoniae and
Relationship to Extended-Spectrum β-Lactamase Production. Antimicrob.
Agents Chemother. 46, 3926–3932 (2002).
88. Shen, D., Winokur, P. & Jones, R. N. Characterization of extended spectrum β-
lactamase-producing Klebsiella pneumoniae from Beijing, China. Int. J.
Antimicrob. Agents 18, 185–188 (2001).
89. Baraniak, A., Sadowy, E., Hryniewicz, W. & Gniadkowski, M. Two Different
Extended-Spectrum β-Lactamases (ESBLs) in One of the First ESBL-Producing
Salmonella Isolates in Poland. J. Clin. Microbiol. 40, 1095–1097 (2002).
156
90. Bradford, P. A., Cherubin, C. E., Idemyor, V., Rasmussen, B. A. & Bush, K.
Multiply resistant Klebsiella pneumoniae strains from two Chicago hospitals:
identification of the extended-spectrum TEM-12 and TEM-10 ceftazidime-
hydrolyzing beta-lactamases in a single isolate. Antimicrob. Agents Chemother.
38, 761–766 (1994).
91. Babini, G. S. & Livermore, D. M. Antimicrobial resistance amongst Klebsiella
spp. collected from intensive care units in Southern and Western Europe in
1997–1998. J. Antimicrob. Chemother. 45, 183–189 (2000).
92. Crowley, B. D. Extended-spectrum beta-lactamases in blood culture isolates of
Klebsiella pneumoniae: seek and you may find! J. Antimicrob. Chemother. 47,
728–729 (2001).
93. Kim, Y.-K. et al. Bloodstream Infections by Extended-Spectrum β-Lactamase-
Producing Escherichia coli and Klebsiella pneumoniae in Children:
Epidemiology and Clinical Outcome. Antimicrob. Agents Chemother. 46, 1481–
1491 (2002).
94. Paterson, D. L. et al. Outcome of Cephalosporin Treatment for Serious
Infections Due to Apparently Susceptible Organisms Producing Extended-
Spectrum β-Lactamases: Implications for the Clinical Microbiology Laboratory.
J. Clin. Microbiol. 39, 2206–2212 (2001).
95. Ambrose, P. G., Bhavnani, S. M. & Jones, R. N. Pharmacokinetics-
Pharmacodynamics of Cefepime and Piperacillin- Tazobactam against
Escherichia coli and Klebsiella pneumoniae Strains Producing Extended-
Spectrum β-Lactamases: Report from the ARREST Program. Antimicrob.
Agents Chemother. 47, 1643–1646 (2003).
96. Paterson, D. L. et al. Antibiotic Therapy for Klebsiella pneumoniae Bacteremia:
Implications of Production of Extended-Spectrum β-Lactamases. Clin. Infect.
Dis. 39, 31–37 (2004).
97. Zanetti, G. et al. Cefepime versus Imipenem-Cilastatin for Treatment of
Nosocomial Pneumonia in Intensive Care Unit Patients: a Multicenter,
Evaluator-Blind, Prospective, Randomized Study. Antimicrob. Agents
Chemother. 47, 3442–3447 (2003).
98. Bedenić, B., Beader, N. & Žagar, Ž. Effect of inoculum size on the antibacterial
activity of cefpirome and cefepime against Klebsiella pneumoniae strains
producing SHV extended-spectrum β-lactamases. Clin. Microbiol. Infect. 7,
626–635 (2001).
99. Jett, B. D., Ritchie, D. J., Reichley, R., Bailey, T. C. & Sahm, D. F. In vitro
activities of various beta-lactam antimicrobial agents against clinical isolates of
157
Escherichia coli and Klebsiella spp. resistant to oxyimino cephalosporins.
Antimicrob. Agents Chemother. 39, 1187–1190 (1995).
100. Thomson, K. S. & Moland, E. S. Cefepime, Piperacillin-Tazobactam, and the
Inoculum Effect in Tests with Extended-Spectrum β-Lactamase-Producing
Enterobacteriaceae. Antimicrob. Agents Chemother. 45, 3548–3554 (2001).
101. Bonnet, R. et al. A Novel CTX-M β-Lactamase (CTX-M-8) in Cefotaxime-
ResistantEnterobacteriaceae Isolated in Brazil. Antimicrob. Agents Chemother.
44, 1936–1942 (2000).
102. Elkhaïli, H. et al. In vitro time-kill curves of cefepime and cefpirome combined
with amikacin, gentamicin or ciprofloxacin against Klebsiella pneumoniae
producing extended-spectrum beta-lactamase. Chemotherapy 43, 245–253
(1997).
103. Paterson, D. L. Recommendation for treatment of severe infections caused by
Enterobacteriaceae producing extended-spectrum β-lactamases (ESBLs). Clin.
Microbiol. Infect. 6, 460–463 (2000).
104. Pangon, B. et al. In Vivo Selection of a Cephamycin-Resistant, Porin-Deficient
Mutant of Klebsiello pneumoniae Producing a TEM-3 β-Lactamase. J. Infect.
Dis. 159, 1005–1006 (1989).
105. Bradford, P. A. et al. Imipenem resistance in Klebsiella pneumoniae is
associated with the combination of ACT-1, a plasmid-mediated AmpC beta-
lactamase, and the foss of an outer membrane protein. Antimicrob. Agents
Chemother. 41, 563–569 (1997).
106. Siu, L. K. et al. Bacteremia Due to Extended-Spectrum β-Lactamase-Producing
Escherichia coli andKlebsiella pneumoniae in a Pediatric Oncology Ward:
Clinical Features and Identification of Different Plasmids Carrying both SHV-5
and TEM-1 Genes. J. Clin. Microbiol. 37, 4020–4027 (1999).
107. Karadenizli, A., Mutlu, B., Okay, E., Kolayli, F. & Vahaboglu, H. Piperacillin
with and without Tazobactam against Extended-Spectrum Beta-Lactamase-
Producing Pseudomonas aeruginosa in a Rat Thigh Abscess Model.
Chemotherapy 47, 292–296 (2001).
108. Burgess, D. S., Hall, R. G., Lewis, J. S., Jorgensen, J. H. & Patterson, J. E.
Clinical and Microbiologic Analysis of a Hospital’s Extended-Spectrum β-
Lactamase-Producing Isolates Over a 2-Year Period. Pharmacother. J. Hum.
Pharmacol. Drug Ther. 23, 1232–1237 (2003).
109. Du, B. et al. Extended-spectrum beta-lactamase-producing Escherichia coli and
Klebsiella pneumoniae bloodstream infection: risk factors and clinical outcome.
Intensive Care Med. 28, 1718–1723 (2002).
158
110. Endimiani, A. et al. Bacteremia Due to Klebsiella pneumoniae Isolates
Producing the TEM-52 Extended-Spectrum β-Lactamase: Treatment Outcome
of Patients Receiving Imipenem or Ciprofloxacin. Clin. Infect. Dis. 38, 243–251
(2004).
111. Kang, C.-I. et al. Bloodstream Infections Due to Extended-Spectrum β-
Lactamase-Producing Escherichia coli and Klebsiella pneumoniae: Risk Factors
for Mortality and Treatment Outcome, with Special Emphasis on Antimicrobial
Therapy. Antimicrob. Agents Chemother. 48, 4574–4581 (2004).
112. Massova, I. & Mobashery, S. Kinship and Diversification of Bacterial
Penicillin-Binding Proteins and β-Lactamases. Antimicrob. Agents Chemother.
42, 1–17 (1998).
113. Livermore, D. M. beta-Lactamases in laboratory and clinical resistance. Clin.
Microbiol. Rev. 8, 557–584 (1995).
114. Jacoby, G. A. & Medeiros, A. A. More extended-spectrum beta-lactamases.
Antimicrob. Agents Chemother. 35, 1697–1704 (1991).
115. Martínez-Martínez, L. et al. In vivo selection of porin-deficient mutants of
Klebsiella pneumoniae with increased resistance to cefoxitin and expanded-
spectrum-cephalosporins. Antimicrob. Agents Chemother. 40, 342–348 (1996).
116. Vatopoulos, A. C., Philippon, A., Tzouvelekis, L. S., Komninou, Z. & Legakis,
N. J. Prevalence of a transferable SHV-5 type β-lactamase in clinical isolates of
Klebsiella pneumoniae and Escherichia coli in Greece. J. Antimicrob.
Chemother. 26, 635–648 (1990).
117. Chambers, H. F. Methicillin resistance in staphylococci: molecular and
biochemical basis and clinical implications. Clin. Microbiol. Rev. 10, 781–791
(1997).
118. Jacoby, G. A., Mills, D. M. & Chow, N. Role of β-Lactamases and Porins in
Resistance to Ertapenem and Other β-Lactams in Klebsiella pneumoniae.
Antimicrob. Agents Chemother. 48, 3203–3206 (2004).
119. Otero, F. et al. Rapid Detection of Antibiotic Resistance in Gram-Negative
Bacteria Through Assessment of Changes in Cellular Morphology. Microb.
Drug Resist. 23, 157–162 (2016).
120. Unemo, M. & Nicholas, R. A. Emergence of multidrug-resistant, extensively
drug-resistant and untreatable gonorrhea. Future Microbiol. 7, 1401–1422
(2012).
159
121. Lee, N.-Y. et al. Cefepime Therapy for Monomicrobial Bacteremia Caused by
Cefepime-Susceptible Extended-Spectrum Beta-Lactamase–Producing
Enterobacteriaceae: MIC Matters. Clin. Infect. Dis. 56, 488–495 (2013).
122. Nordmann, P., Poirel, L., Walsh, T. R. & Livermore, D. M. The emerging NDM
carbapenemases. Trends Microbiol. 19, 588–595 (2011).
123. Gould, I. M. & Bal, A. M. New antibiotic agents in the pipeline and how they
can help overcome microbial resistance. Virulence 4, 185–191 (2013).
124. Ambler R. P., Baddiley James & Abraham Edward Penley. The structure of β-
lactamases. Philos. Trans. R. Soc. Lond. B Biol. Sci. 289, 321–331 (1980).
125. Medeiros, A., Mayer, K. H. & Opal, S. M. Plasmid-mediated beta-lactamases.
Antimicrob. Newsl. 5, 61–65 (1988).
126. Bush, K., Jacoby, G. A. & Medeiros, A. A. A functional classification scheme
for beta-lactamases and its correlation with molecular structure. Antimicrob.
Agents Chemother. 39, 1211–1233 (1995).
127. Sougakoff, W., Goussard, S. & Courvalin, P. The TEM-3 β-lactamase, which
hydrolyzes broad-spectrum cephalosporins, is derived from the TEM-2
penicillinase by two amino acid substitutions. FEMS Microbiol. Lett. 56, 343–
348 (1988).
128. Tzouvelekis, L. S. & Bonomo, R. A. SHV-type beta-lactamases. Curr. Pharm.
Des. 5, 847–864 (1999).
129. Ishii, Y. et al. Cloning and sequence of the gene encoding a cefotaxime-
hydrolyzing class A beta-lactamase isolated from Escherichia coli. Antimicrob.
Agents Chemother. 39, 2269–2275 (1995).
130. Ma, L., Ishii, Y., Ishiguro, M., Matsuzawa, H. & Yamaguchi, K. Cloning and
Sequencing of the Gene Encoding Toho-2, a Class A β-Lactamase Preferentially
Inhibited by Tazobactam. Antimicrob. Agents Chemother. 42, 1181–1186
(1998).
131. Tzouvelekis, L. S., Tzelepi, E., Tassios, P. T. & Legakis, N. J. CTX-M-type β-
lactamases: an emerging group of extended-spectrum enzymes. Int. J.
Antimicrob. Agents 14, 137–142 (2000).
132. Humeniuk, C. et al. β-Lactamases of Kluyvera ascorbata, Probable Progenitors
of Some Plasmid-Encoded CTX-M Types. Antimicrob. Agents Chemother. 46,
3045–3049 (2002).
133. Lobkovsky, E. et al. Evolution of an enzyme activity: crystallographic structure
at 2-A resolution of cephalosporinase from the ampC gene of Enterobacter
160
cloacae P99 and comparison with a class A penicillinase. Proc. Natl. Acad. Sci.
90, 11257–11261 (1993).
134. Bradford, P. A. Extended-spectrum beta-lactamases in the 21st century:
characterization, epidemiology, and detection of this important resistance threat.
Clin. Microbiol. Rev. 14, 933–951, table of contents (2001).
135. Canton, R., Gonzalez-Alba, J. M. & Galán, J. C. CTX-M Enzymes: Origin and
Diffusion. Front. Microbiol. 3, (2012).
136. Bradford, P. A. et al. CTX-M-5, a Novel Cefotaxime-Hydrolyzing β-Lactamase
from an Outbreak of Salmonella typhimuriumin Latvia. Antimicrob. Agents
Chemother. 42, 1980–1984 (1998).
137. Sabaté, M. et al. Cloning and Sequence of the Gene Encoding a Novel
Cefotaxime-Hydrolyzing β-Lactamase (CTX-M-9) fromEscherichia coli in
Spain. Antimicrob. Agents Chemother. 44, 1970–1973 (2000).
138. Hall, L. M., Livermore, D. M., Gur, D., Akova, M. & Akalin, H. E. OXA-11, an
extended-spectrum variant of OXA-10 (PSE-2) beta-lactamase from
Pseudomonas aeruginosa. Antimicrob. Agents Chemother. 37, 1637–1644
(1993).
139. Danel, F., Hall, L. M. C., Duke, B., Gur, D. & Livermore, D. M. OXA-17, a
Further Extended-Spectrum Variant of OXA-10 β-Lactamase, Isolated from
Pseudomonas aeruginosa. Antimicrob. Agents Chemother. 43, 1362–1366
(1999).
140. Palzkill, T. Metallo-β-lactamase structure and function. Ann. N. Y. Acad. Sci.
1277, 91–104 (2013).
141. Drawz, S. M. & Bonomo, R. A. Three Decades of β-Lactamase Inhibitors. Clin.
Microbiol. Rev. 23, 160–201 (2010).
142. Bou, F. J. P.-L. and G. β-Lactamase Inhibitors: The Story so Far. Current
Medicinal Chemistry (2009). Available at:
http://www.eurekaselect.com/70025/article. (Accessed: 11th July 2019)
143. Stachyra, T. et al. Mechanistic Studies of the Inactivation of TEM-1 and P99 by
NXL104, a Novel Non-β-Lactam β-Lactamase Inhibitor. Antimicrob. Agents
Chemother. 54, 5132–5138 (2010).
144. Lim, H. M., Pène, J. J. & Shaw, R. W. Cloning, nucleotide sequence, and
expression of the Bacillus cereus 5/B/6 beta-lactamase II structural gene. J.
Bacteriol. 170, 2873–2878 (1988).
161
145. Walsh, T. R. et al. Sequence analysis of the L1 metallo-β-lactamase from
Xanthomonas maltophilia. Biochim. Biophys. Acta BBA - Gene Struct. Expr.
1218, 199–201 (1994).
146. Lauretti, L. et al. Cloning and Characterization of bla VIM, a New Integron-
Borne Metallo-β-Lactamase Gene from a Pseudomonas aeruginosa Clinical
Isolate. Antimicrob. Agents Chemother. 43, 1584–1590 (1999).
147. Laraki, N. et al. Structure of In31, abla IMP-Containing Pseudomonas
aeruginosa Integron Phyletically Related to In5, Which Carries an Unusual
Array of Gene Cassettes. Antimicrob. Agents Chemother. 43, 890–901 (1999).
148. Cornaglia, G., Giamarellou, H. & Rossolini, G. M. Metallo-β-lactamases: a last
frontier for β-lactams? Lancet Infect. Dis. 11, 381–393 (2011).
149. Bennett, P. M. Plasmid encoded antibiotic resistance: acquisition and transfer of
antibiotic resistance genes in bacteria. Br. J. Pharmacol. 153, S347–S357
(2008).
150. Yong, D. et al. Characterization of a New Metallo-β-Lactamase Gene, blaNDM-
1, and a Novel Erythromycin Esterase Gene Carried on a Unique Genetic
Structure in Klebsiella pneumoniae Sequence Type 14 from India. Antimicrob.
Agents Chemother. 53, 5046–5054 (2009).
151. Blazquez, J., Morosini, M.-I., Negri, M.-C. & Baquero, F. Selection of Naturally
Occurring Extended-Spectrum TEM β-Lactamase Variants by Fluctuating β-
Lactam Pressure. Antimicrob. Agents Chemother. 44, 2182–2184 (2000).
152. Jacoby, G. A. Genetics of extended-spectrum beta-lactamases. Eur. J. Clin.
Microbiol. Infect. Dis. 13, S2–S11 (1994).
153. Christensen, H., Martin, M. T. & Waley, S. G. Beta-lactamases as fully efficient
enzymes. Determination of all the rate constants in the acyl-enzyme mechanism.
Biochem. J. 266, 853–861 (1990).
154. Bush, K. & Singer, S. B. Biochemical characteristics of extended broad
spectrum β-lactamases. Infection 17, 429–433 (1989).
155. Jacoby, G. A. & Carreras, I. Activities of beta-lactam antibiotics against
Escherichia coli strains producing extended-spectrum beta-lactamases.
Antimicrob. Agents Chemother. 34, 858–862 (1990).
156. Petit, A., Ben Yaghlane-Bouslama, H., Sofer, L. & Labia, R. Does high level
production of SHV-type penicillinase confer resistance to ceftazidime in
enterobacteriaceae? FEMS Microbiol. Lett. 92, 89–94 (1992).
162
157. Darfeuille-Michaud, A. et al. R-plasmid-encoded adhesive factor in Klebsiella
pneumoniae strains responsible for human nosocomial infections. Infect. Immun.
60, 44–55 (1992).
158. Mabilat, C. & Courvalin, P. Development of ‘oligotyping’ for characterization
and molecular epidemiology of TEM beta-lactamases in members of the family
Enterobacteriaceae. Antimicrob. Agents Chemother. 34, 2210–2216 (1990).
159. Prinarakis, E. E., Miriagou, V., Tzelepi, E., Gazouli, M. & Tzouvelekis, L. S.
Emergence of an inhibitor-resistant beta-lactamase (SHV-10) derived from an
SHV-5 variant. Antimicrob. Agents Chemother. 41, 838–840 (1997).
160. Bradford, P. A. et al. SHV-7, a novel cefotaxime-hydrolyzing beta-lactamase,
identified in Escherichia coli isolates from hospitalized nursing home patients.
Antimicrob. Agents Chemother. 39, 899–905 (1995).
161. Harrif-Heraud, Z. E., Arpin, C., Benliman, S. & Quentin, C. Molecular
epidemiology of a nosocomial outbreak due to SHV-4-producing strains of
Citrobacter diversus. J. Clin. Microbiol. 35, 2561–2567 (1997).
162. Naas, T., Philippon, L., Poirel, L., Ronco, E. & Nordmann, P. An SHV-Derived
Extended-Spectrum β-Lactamase in Pseudomonas aeruginosa. Antimicrob.
Agents Chemother. 43, 1281–1284 (1999).
163. Rasheed, J. K. et al. Evolution of extended-spectrum beta-lactam resistance
(SHV-8) in a strain of Escherichia coli during multiple episodes of bacteremia.
Antimicrob. Agents Chemother. 41, 647–653 (1997).
164. Marchandin, H., Carriere, C., Sirot, D., Pierre, H. J.- & Darbas, H. TEM-24
Produced by Four Different Species ofEnterobacteriaceae, Including
Providencia rettgeri, in a Single Patient. Antimicrob. Agents Chemother. 43,
2069–2073 (1999).
165. Morosini, M. I. et al. New extended-spectrum TEM-type beta-lactamase from
Salmonella enterica subsp. enterica isolated in a nosocomial outbreak.
Antimicrob. Agents Chemother. 39, 458–461 (1995).
166. Palzkill, T. et al. New variant of TEM-10 beta-lactamase gene produced by a
clinical isolate of proteus mirabilis. Antimicrob. Agents Chemother. 39, 1199–
1200 (1995).
167. Perilli, M. et al. TEM-72, a New Extended-Spectrum β-Lactamase Detected in
Proteus mirabilis and Morganella morganii in Italy. Antimicrob. Agents
Chemother. 44, 2537–2539 (2000).
163
168. Tessier, F., Arpin, C., Allery, A. & Quentin, C. Molecular Characterization of a
TEM-21 β-Lactamase in a Clinical Isolate of Morganella morganii. Antimicrob.
Agents Chemother. 42, 2125–2127 (1998).
169. Milatovic, D. & Braveny, I. Development of resistance during antibiotic
therapy. Eur. J. Clin. Microbiol. 6, 234–244 (1987).
170. Hancock, R. E. W. & Speert, D. P. Antibiotic resistance in Pseudomonas
aeruginosa: mechanisms and impact on treatment. Drug Resist. Updat. 3, 247–
255 (2000).
171. Vu, H. & Nikaido, H. Role of beta-lactam hydrolysis in the mechanism of
resistance of a beta-lactamase-constitutive Enterobacter cloacae strain to
expanded-spectrum beta-lactams. Antimicrob. Agents Chemother. 27, 393–398
(1985).
172. Mah, T.-F. et al. A genetic basis for Pseudomonas aeruginosa biofilm antibiotic
resistance. Nature 426, 306 (2003).
173. Nüesch-Inderbinen, M. T., Hächler, H. & Kayser, F. H. Detection of genes
coding for extended-spectrum SHV beta-lactamases in clinical isolates by a
molecular genetic method, and comparison with the E test. Eur. J. Clin.
Microbiol. Infect. Dis. 15, 398–402 (1996).
174. M’Zali, F.-H., Gascoyne-Binzi, D. M., Heritage, J. & Hawkey, P. M. Detection
of mutations conferring extended-spectrum activity on SHV β-lactamases using
polymerase chain reaction single strand conformational polymorphism (PCR-
SSCP). J. Antimicrob. Chemother. 37, 797–802 (1996).
175. M’Zali, F. H., Heritage, J., Gascoyne-Binzi, D. M., Snelling, A. M. & Hawkey,
P. M. PCR single strand conformational polymorphism can be used to detect the
gene encoding SHV-7 extended-spectrum beta-lactamase and to identify
different SHV genes within the same strain. J. Antimicrob. Chemother. 41, 123–
125 (1998).
176. Chanawong, A., M’Zali, F. H., Heritage, J., Lulitanond, A. & Hawkey, P. M.
Characterisation of extended-spectrum β-lactamases of the SHV family using a
combination of PCR-single strand conformational polymorphism (PCR-SSCP)
and PCR-restriction fragment length polymorphism (PCR-RFLP). FEMS
Microbiol. Lett. 184, 85–89 (2000).
177. Bradford, P. A. Automated Thermal Cycling Is Superior to Traditional Methods
for Nucleotide Sequencing ofbla SHV Genes. Antimicrob. Agents Chemother.
43, 2960–2963 (1999).
178. Veenemans, J. et al. Next-Generation Sequencing for Typing and Detection of
Resistance Genes: Performance of a New Commercial Method during an
164
Outbreak of Extended-Spectrum-Beta-Lactamase-Producing Escherichia coli. J.
Clin. Microbiol. 52, 2454–2460 (2014).
179. Sundsfjord, A. et al. Genetic methods for detection of antimicrobial resistance.
APMIS 112, 815–837 (2004).
180. Arlet, G. et al. Molecular characterisation by PCR-restriction fragment length
polymorphism of TEM β-lactamases. FEMS Microbiol. Lett. 134, 203–208
(1995).
181. Edelstein, M., Pimkin, M., Palagin, I., Edelstein, I. & Stratchounski, L.
Prevalence and Molecular Epidemiology of CTX-M Extended-Spectrum β-
Lactamase-Producing Escherichia coli and Klebsiella pneumoniae in Russian
Hospitals. Antimicrob. Agents Chemother. 47, 3724–3732 (2003).
182. Kirkland, K. B. & Weinstein, J. M. Adverse effects of contact isolation. The
Lancet 354, 1177–1178 (1999).
183. Shibata, N. et al. PCR Typing of Genetic Determinants for Metallo-β-
Lactamases and Integrases Carried by Gram-Negative Bacteria Isolated in
Japan, with Focus on the Class 3 Integron. J. Clin. Microbiol. 41, 5407–5413
(2003).
184. Cockerill, F. R. Genetic Methods for Assessing Antimicrobial Resistance.
Antimicrob. Agents Chemother. 43, 199–212 (1999).
185. Clinical and Laboratory Standards Institute. (2006). Methods for dilution
antimicrobial susceptibility tests for bacteria that grow aerobically. Approved
standard, 26, 14-16.
186. Clinical and Laboratory Standards Institute. Performance standards for
antimicrobial susceptibility testing. Supplement M100-S16. Clinical and
Laboratory Standards Institute: Wayne, PA: Clinical and Laboratory Standards
Institute, 2006.
187. NCCLS. Methods for antimicrobial susceptibility testing of anaerobic bacteria.
Approved standard M11-A6. Wayne, PA: NCCLS, 2004.
188. Jarlier, V., Nicolas, M.-H., Fournier, G. & Philippon, A. Extended Broad-
Spectrum β-Lactamases Conferring Transferable Resistance to Newer β-Lactam
Agents in Enterobacteriaceae: Hospital Prevalence and Susceptibility Patterns.
Rev. Infect. Dis. 10, 867–878 (1988).
189. Drieux, L., Brossier, F., Sougakoff, W. & Jarlier, V. Phenotypic detection of
extended-spectrum β-lactamase production in Enterobacteriaceae: review and
bench guide. Clin. Microbiol. Infect. 14, 90–103 (2008).
165
190. Hall, M. A. L. et al. Evaluation of the Etest ESBL and the BD Phoenix, VITEK
1, and VITEK 2 Automated Instruments for Detection of Extended-Spectrum
Beta-Lactamases in Multiresistant Escherichia coli and Klebsiella spp. J. Clin.
Microbiol. 40, 3703–3711 (2002).
191. Brun-Buisson, C. et al. TRANSFERABLE ENZYMATIC RESISTANCE TO
THIRD-GENERATION CEPHALOSPORINS DURING NOSOCOMIAL
OUTBREAK OF MULTIRESISTANT KLEBSIELLA PNEUMONIAE. The
Lancet 330, 302–306 (1987).
192. Rice, L. B., Yao, J. D. C., Klimm, K., Eliopoulos, G. M. & Moellering, R. C.
Efficacy of Different β-Lactams against an Extended-Spectrum β-Lactamase-
Producing Klebsiella pneumoniae Strain in the Rat Intra-Abdominal Abscess
Model. Antimicrob. Agents Chemother. 35, 1243–1244 (1991).
193. Fast, W. & Sutton, L. D. Metallo-β-lactamase: Inhibitors and reporter substrates.
Biochim. Biophys. Acta BBA - Proteins Proteomics 1834, 1648–1659 (2013).
194. Jones, R. N., Wilson, H. W., Novick, W. J., Barry, A. L. & Thornsberry, C. In
vitro evaluation of CENTA, a new beta-lactamase-susceptible chromogenic
cephalosporin reagent. J. Clin. Microbiol. 15, 954–958 (1982).
195. Schindler, P. & Huber, G. Chromophoric cephalosporins. (1982).
196. Bieniarz, C., Young, D. F. & Cornwell, M. J. Chromogenic redox assay for β-
lactamases yielding water-insoluble products: I. Kinetic behavior and redox
chemistry. Anal. Biochem. 207, 321–328 (1992).
197. Bieniarz, C., Cornwell, M. J. & Young, D. F. Beta-lactamase assay employing
chromogenic precipitating substrates. (1990).
198. Boyd, D. B. & Lunn, W. H. W. Electronic structures of cephalosporins and
penicillins. 9. Departure of a leaving group in cephalosporins. J. Med. Chem. 22,
778–784 (1979).
199. Faraci, W. S. & Pratt, R. F. Elimination of a good leaving group from the 3’-
position of a cephalosporin need not be concerted with .beta.-lactam ring
opening: TEM-2 .beta.-lactamase-catalyzed hydrolysis of pyridine-2-azo-4’-
(N’,N’-dimethylaniline) cephalosporin (PADAC) and of cephaloridine. J. Am.
Chem. Soc. 106, 1489–1490 (1984).
200. Toney, J. H. et al. Succinic Acids as Potent Inhibitors of Plasmid-borne IMP-1
Metallo-β-lactamase. J. Biol. Chem. 276, 31913–31918 (2001).
201. Toney, J. H. et al. Antibiotic sensitization using biphenyl tetrazoles as potent
inhibitors of Bacteroides fragilis metallo-β-lactamase. Chem. Biol. 5, 185–196
(1998).
166
202. Minond, D. et al. Inhibitors of VIM-2 by screening pharmacologically active
and click-chemistry compound libraries. Bioorg. Med. Chem. 17, 5027–5037
(2009).
203. Thomas, P. W. et al. An altered zinc-binding site confers resistance to a covalent
inactivator of New Delhi metallo-beta-lactamase-1 (NDM-1) discovered by
high-throughput screening. Bioorg. Med. Chem. 21, 3138–3146 (2013).
204. Minond, D. et al. HTS Assay for Discovery of Novel Metallo-Beta-lactamase
(MBL) Inhibitors. in Probe Reports from the NIH Molecular Libraries Program
(National Center for Biotechnology Information (US), 2010).
205. Gazin, M., Paasch, F., Goossens, H. & Malhotra-Kumar, S. Current Trends in
Culture-Based and Molecular Detection of Extended-Spectrum-β-Lactamase-
Harboring and Carbapenem-Resistant Enterobacteriaceae. J. Clin. Microbiol. 50,
1140–1146 (2012).
206. Overdevest, I. T. M. A., Willemsen, I., Elberts, S., Verhulst, C. & Kluytmans, J.
A. J. W. Laboratory Detection of Extended-Spectrum-Beta-Lactamase-
Producing Enterobacteriaceae: Evaluation of Two Screening Agar Plates and
Two Confirmation Techniques. J. Clin. Microbiol. 49, 519–522 (2011).
207. Färber, J. et al. Extended-Spectrum Beta-Lactamase Detection with Different
Panels for Automated Susceptibility Testing and with a Chromogenic Medium.
J. Clin. Microbiol. 46, 3721–3727 (2008).
208. Huang, T.-D., Bogaerts, P., Berhin, C., Guisset, A. & Glupczynski, Y.
Evaluation of Brilliance ESBL Agar, a Novel Chromogenic Medium for
Detection of Extended-Spectrum-Beta- Lactamase-Producing
Enterobacteriaceae. J. Clin. Microbiol. 48, 2091–2096 (2010).
209. Randall, L. P. et al. Evaluation of CHROMagar CTX, a novel medium for
isolating CTX-M-ESBL-positive Enterobacteriaceae while inhibiting AmpC-
producing strains. J. Antimicrob. Chemother. 63, 302–308 (2009).
210. Oliver, A. et al. Mechanisms of Decreased Susceptibility to Cefpodoxime in
Escherichia coli. Antimicrob. Agents Chemother. 46, 3829–3836 (2002).
211. Hancock, R. E. W. The bacterial outer membrane as a drug barrier. Trends
Microbiol. 5, 37–42 (1997).
212. Bellido, F., Pechère, J. C. & Hancock, R. E. Novel method for measurement of
outer membrane permeability to new beta-lactams in intact Enterobacter cloacae
cells. Antimicrob. Agents Chemother. 35, 68–72 (1991).
167
213. Sabath, L. D., Jago, M. & Abraham, E. P. Cephalosporinase and penicillinase
activities of a β-lactamase from Pseudomonas pyocyanea. Biochem. J. 96, 739–
752 (1965).
214. Hamilton-Miller, J. M. T., Newton, G. G. F. & Abraham, E. P. Products of
aminolysis and enzymic hydrolysis of the cephalosporins. Biochem. J. 116, 371–
384 (1970).
215. Lowe, J. P. Is this a concerted reaction? J. Chem. Educ. 51, 785 (1974).
216. P. Laws, A. & I. Page, M. The effect of the carboxy group on the chemical and
β-lactamase reactivity of β-lactam antibiotics. J. Chem. Soc. Perkin Trans. 2 0,
1577–1581 (1989).
217. Ivama, V. M., Rodrigues, L. N. C., Guaratini, C. C. I. & Zanoni, M. V. B.
Spectrophotometric determination of cefaclor in pharmaceutical preparations.
Quím. Nova 22, 201–204 (1999).
218. Quotadamo, A. et al. An Improved Synthesis of CENTA, a Chromogenic
Substrate for β-Lactamases. Synlett 27, 2447–2450 (2016).
219. van Berkel, S. S. et al. Assay Platform for Clinically Relevant Metallo-β-
lactamases. J. Med. Chem. 56, 6945–6953 (2013).
220. Hrbac, J., Halouzka, V., Trnkova, L. & Vacek, J. eL-Chem Viewer: a freeware
package for the analysis of electroanalytical data and their post-acquisition
processing. Sensors 14, 13943–13954 (2014).
221. Ellman’s reagent: 5,5′-dithiobis(2-nitrobenzoic acid)—a reexamination -
ScienceDirect. Available at:
https://www.sciencedirect.com/science/article/pii/0003269779907929.
(Accessed: 11th December 2018)
222. Saa, L. & Pavlov, V. Enzymatic Growth of Quantum Dots: Applications to
Probe Glucose Oxidase and Horseradish Peroxidase and Sense Glucose. Small 8,
3449–3455 (2012).
223. Zhou, M., Diwu, Z., Panchuk-Voloshina, N. & Haugland, R. P. A Stable
Nonfluorescent Derivative of Resorufin for the Fluorometric Determination of
Trace Hydrogen Peroxide: Applications in Detecting the Activity of Phagocyte
NADPH Oxidase and Other Oxidases. Anal. Biochem. 253, 162–168 (1997).
224. Savizi, I. S. P., Kariminia, H.-R., Ghadiri, M. & Roosta-Azad, R. Amperometric
sulfide detection using Coprinus cinereus peroxidase immobilized on screen
printed electrode in an enzyme inhibition based biosensor. Biosens. Bioelectron.
35, 297–301 (2012).
168
225. Fleischmann, M., Hendra, P. J. & McQuillan, A. J. Raman spectra of pyridine
adsorbed at a silver electrode. Chem. Phys. Lett. 26, 163–166 (1974).
226. Albrecht, M. G. & Creighton, J. A. Anomalously intense Raman spectra of
pyridine at a silver electrode. J. Am. Chem. Soc. 99, 5215–5217 (1977).
227. Jeanmaire, D. L. & Van Duyne, R. P. Surface raman spectroelectrochemistry:
Part I. Heterocyclic, aromatic, and aliphatic amines adsorbed on the anodized
silver electrode. J. Electroanal. Chem. Interfacial Electrochem. 84, 1–20 (1977).
228. Moskovits, M. Surface roughness and the enhanced intensity of Raman
scattering by molecules adsorbed on metals. J. Chem. Phys. 69, 4159–4161
(1978).
229. Moskovits, M. Surface-enhanced spectroscopy. Rev. Mod. Phys. 57, 783–826
(1985).
230. Kneipp, K., Kneipp, H., Itzkan, I., Dasari, R. R. & Feld, M. S. Ultrasensitive
Chemical Analysis by Raman Spectroscopy. Chem. Rev. 99, 2957–2976 (1999).
231. Michaels, A. M., Nirmal, M. & Brus, L. E. Surface Enhanced Raman
Spectroscopy of Individual Rhodamine 6G Molecules on Large Ag
Nanocrystals. J. Am. Chem. Soc. 121, 9932–9939 (1999).
232. Nie, S. & Emory, S. R. Probing Single Molecules and Single Nanoparticles by
Surface-Enhanced Raman Scattering. Science 275, 1102–1106 (1997).
233. Mosier-Boss, P. A. Review of SERS Substrates for Chemical Sensing.
Nanomaterials 7, 142 (2017).
234. Tian, Z.-Q., Ren, B. & Wu, D.-Y. Surface-Enhanced Raman Scattering: From
Noble to Transition Metals and from Rough Surfaces to Ordered
Nanostructures. J. Phys. Chem. B 106, 9463–9483 (2002).
235. Weaver, M. J., Zou, S. & Chan, H. Y. H. Peer Reviewed: The New Interfacial
Ubiquity of Surface-Enhanced Raman Spectroscopy. Anal. Chem. 72, 38 A-47
A (2000).
236. Campion, A. & Kambhampati, P. Surface-enhanced Raman scattering. Chem.
Soc. Rev. 27, 241–250 (1998).
237. Kennedy, B. J., Spaeth, S., Dickey, M. & Carron, K. T. Determination of the
Distance Dependence and Experimental Effects for Modified SERS Substrates
Based on Self-Assembled Monolayers Formed Using Alkanethiols. J. Phys.
Chem. B 103, 3640–3646 (1999).
238. Yan, X., Li, J. & Möhwald, H. Templating Assembly of Multifunctional Hybrid
Colloidal Spheres. Adv. Mater. 24, 2663–2667 (2012).
169
239. Su, Y. et al. Peptide Mesocrystals as Templates to Create an Au Surface with
Stronger Surface-Enhanced Raman Spectroscopic Properties. Chem. – Eur. J.
17, 3370–3375 (2011).
240. Cao, Y. C., Jin, R. & Mirkin, C. A. Nanoparticles with Raman Spectroscopic
Fingerprints for DNA and RNA Detection. Science 297, 1536–1540 (2002).
241. Faulds, K., Smith, W. E. & Graham, D. Evaluation of Surface-Enhanced
Resonance Raman Scattering for Quantitative DNA Analysis. Anal. Chem. 76,
412–417 (2004).
242. McCall, S. L. & Platzman, P. M. Raman scattering from chemisorbed molecules
at surfaces. Phys. Rev. B 22, 1660–1662 (1980).
243. Gersten, J. & Nitzan, A. Electromagnetic theory of enhanced Raman scattering
by molecules adsorbed on rough surfaces. J. Chem. Phys. 73, 3023–3037
(1980).
244. Skadtchenko, B. O. & Aroca, R. Surface-enhanced Raman scattering of p-
nitrothiophenol: Molecular vibrations of its silver salt and the surface complex
formed on silver islands and colloids. Spectrochim. Acta. A. Mol. Biomol.
Spectrosc. 57, 1009–1016 (2001).
245. Sharma, B., Frontiera, R. R., Henry, A.-I., Ringe, E. & Van Duyne, R. P. SERS:
Materials, applications, and the future. Mater. Today 15, 16–25 (2012).
246. Sylvia, J. M., Janni, J. A., Klein, J. D. & Spencer, K. M. Surface-Enhanced
Raman Detection of 2,4-Dinitrotoluene Impurity Vapor as a Marker To Locate
Landmines. Anal. Chem. 72, 5834–5840 (2000).
247. Mazet, V., Carteret, C., Brie, D., Idier, J. & Humbert, B. Background removal
from spectra by designing and minimising a non-quadratic cost function.
Chemom. Intell. Lab. Syst. 76, 121–133 (2005).