abstract dissertation: enhancement of spray cooling …
TRANSCRIPT

ABSTRACT
Title of Dissertation: ENHANCEMENT OF SPRAY COOLING
HEAT TRANSFER USING EXTENDED SURFACES AND NANOFLUIDS
Johnathan Stuart Coursey, Ph.D., 2007 Directed By: Associate Professor, Jungho Kim, Department of
Mechanical Engineering
Spray cooling is a powerful heat transfer technique in which an atomizing nozzle
provides a flow of liquid droplets directed towards a hot surface. This dissertation
explores two potentially powerful techniques capable of improving traditional spray
cooling: nanofluids and extended surfaces.
Nanofluids were experimentally studied in a pool boiling system to elucidate the
underlying mechanisms of critical heat flux (CHF) enhancement. Dilute suspensions of
nanoparticles were found to have a degrading or no effect on boiling performance.
Greater concentrations (≥ 0.5 g/L) lead to modest (up to ~37%) increase in the CHF. The
results were highly dependent on the working fluid/substrate combination, specifically
wetting characteristics. Poorly wetting systems (e.g. water on copper) could be enhanced
by nanofluids, whereas better wetting systems (e.g. ethanol on glass) showed no
improvement. This conclusion was re-enforced when nanofouling caused by dryout of
nanofluid was found to improve wetting as shown by a reduction in the advancing three-

phase contact angle. Interestingly, similar CHF enhancement was achieved without
nanofluids using an oxidized surface, which is easily wetted with pure fluids. In fact,
surface treatment alone resulted in similar CHF enhancement at ~20°C less wall
superheat than required using nanofluids. Spray cooling was found to be adversely
affected by the addition of nanoparticles due to changing thermophysical properties
and/or nozzle clogging due to particle deposition.
The addition of high aspect ratio open microchannels to the sprayed surface
resulted in significant enhancement at all wall superheats and over 200% enhancement in
the low temperature single-phase regime. The two-phase regime began at lower
temperatures with microchannels, which lead to heat transfer enhancements of up to
181%. The onset of two-phase effects was found to be a strong function of channel
depth. However, the onset of two-phase effects was found to occur at a temperature that
was independent of nozzle pressure/mass flow rate. Therefore, nucleation and two-phase
effects are likely triggered by the unique liquid distribution caused by the extended
structures. Using high aspect ratio open microchannels, these mechanisms resulted in
spray efficiencies approaching one, indicating almost complete utilization of the spray’s
ability to absorb heat.

ENHANCEMENT OF SPRAY COOLING HEAT TRANSFER USING EXTENDED SURFACES AND NANOFLUIDS
By
Johnathan Stuart Coursey
Dissertation submitted to the Faculty of the Graduate School of the University of Maryland, College Park, in partial fulfillment
of the requirements for the degree of Doctor of Philosophy
2007 Advisory Committee: Professor Jungho Kim, Chair Professor Avram Bar-Cohen Professor Kenneth Kiger Professor James Quintiere Professor Reinhard Radermacher

© Copyright by Johnathan Stuart Coursey
2007

ii
To my wife, Derya

iii
ACKNOWLEDGEMENTS
First and foremost, I would like to acknowledge the guidance and support of my
advisor, Dr. Jungho Kim. Without his valuable suggestions throughout, this dissertation
would not have been possible. Furthermore, without the valuable experience I gained
during my M.S. under Dr. Kim, I would likely have not considered returning to school to
complete my Ph.D. I also appreciate the advice and guidance of my dissertation
committee members: Dr. Avram Bar-Cohen, Dr. Kenneth Kiger, Dr. James Quintiere,
and Dr. Reinhard Radermacher. In particular, I appreciate the guidance and assistance of
Dr. Kiger, who has helped me for many years from undergraduate fluid mechanics and on
to the present dissertation.
I have been very fortunate to work side by side with a number of distinguished
current and former students (Chris Henry, Eric Silk, Greg Anderson, Payam Delgoshaei,
Rishi Raj, Thierry Some, Kevin Moores, William Michie, Dennis Gordt, Eckhard
Lehmann, Alexander Walzenbach, and Martin Karch) who are wonderful friends and
invaluable colleagues. I owe a particular debt of gratitude to Chris and Greg for
countless, and often spirited, discussions about heat transfer phenomena. Similarly, I am
also indebted to Dr. Hitoshi Sakamoto, who is also a great friend and former colleague.
His suggestions and daily consultation were dearly appreciated.
This dissertation also significantly benefited from the assistance of many people
across the greater university community: Jack Touart (Physics); Lisa Lucas, Scott Horst,
and Dan Hinkel (Laboratory of Physical Sciences); Al Aaron (ENME), and Howie
Grossenbacher (ENAE). These talented professionals aided in construction of a number
of parts used in this work and taught my many lessons around the lab and machine shop.

iv
I would also not ever have been in a position to complete this dissertation without
the support of my family. My parents and brothers have motivated me, listened to me,
and encouraged me throughout my life, and I continue to be forever grateful. Finally, this
endeavor would not have been possible without the support and encouragement of my
wife, Derya. I appreciate the many sacrifices she has made from waking up early to
make me sandwiches to listening to my dissertation ideas late into the evening.

v
TABLE OF CONTENTS CHAPTER 1. INTRODUCTION 1
1.1. Motivation 1 1.2. Background 2 1.3. Research Objectives 7
CHAPTER 2. LITERATURE REVIEW 9
2.1. Boiling Heat Transfer 9 2.1.1. Nucleate Boiling 9 2.1.2. Critical Heat Flux 12 2.1.3. Surface Wettability 13
2.2. Spray Cooling 14 2.2.1. Droplet Features 14 2.2.2. Parameters Affecting Spray Cooling 16 2.2.3. Models of Spray Cooling 19 2.2.4. Spray Cooling Correlations 22
2.3. Nanofluids 24 2.3.1. Thermal Conductivity Enhancement 24 2.3.2. Boiling of Nanofluids 28
2.4. Extended Structures 34 CHAPTER 3. EXPERIMENTAL SETUP AND METHODOLOGY 37
3.1. Nanofluids Boiling and Spray Cooling Setups 37 3.1.1. Nanofluids Test Rig 37 3.1.2. Thick-film Resistive Heater 39 3.1.3. Copper Block Heater 42 3.1.4. Working Fluids and Nanofluid Preparation 46 3.1.5. Test Conditions 48 3.2. Contact Angle Measurements 50 3.2.1. Contact Angle Measurement Algorithm 52 3.3. High Aspect Ratio Open Microchannel Spray Cooling Experiments 53 3.3.1. Test Rig 54 3.3.2. Heater Assembly 55 3.3.3. Working Fluid and Spray Characteristics 57 3.3.4. Data Acquisition and Control 60
CHAPTER 4. UNCERTAINTY AND DATA ANALYSIS 63
4.1. Thick-film Resistive Heater 63 4.2. Copper Block Heaters 66
4.2.1. Boiling Heater 68 4.2.2. High Aspect Ratio Open Microchannel Spray Cooling Heater 70
4.3. Contact Angle Measurements 72 CHAPTER 5. NANOFLUID POOL BOILING & SPRAY COOLING 73
5.1. Boiling Ethanol Based Nanofluids 73

vi
5.1.1. Glass Surface 73 5.1.2. Gold Surface 75 5.1.3. Copper Surface 76
5.2. Boiling Water Based Nanofluids 82 5.2.1. Concentration Effects 83 5.2.2. Surface Wettability Effects 87
5.3. Nanofluid’s Contact Angle Modification 93 5.3.1. Advancing Droplets on Copper 93 5.3.2. Advancing Droplets on Copper Oxide 97
5.4. Spray Cooling with Nanofluids 98 5.4.1. Spray Cooling Curves 99 5.4.2. Scaling Analysis 101
5.5. Summary of Nanofluid Research 104 CHAPTER 6. EXTENDED STRUCTURE SPRAY COOLING 107
6.1. Results of Spray Cooling High Aspect Ratio Open Microchannels 107 6.1.1. Single-Phase Results 109 6.1.2. Two-Phase Results 112 6.1.3. Critical Heat Flux Results 114
6.2. Spray Efficiency Improvement 115 6.3. One-Dimensional Model for Single-Phase Heat Transfer 120
6.3.1. Model Development 120 6.3.2. Results and Implications 121
CHAPTER 7. CONTRIBUTIONS AND CONCLUSIONS 124
7.1. Conclusions 124 7.2. Contributions to the State of the Art 126 7.3. Suggestions for Future Work 128
APPENDIX A: SURFACE WETTABILITY AND CONTACT ANGLE DEFINITIONS 130 APPENDIX B: LIBRARY OF COMPUTER PROGRAMS 132 APPENDIX C: MONTE CARLO UNCERTAINTY CALCULATIONS 133 APPENDIX D: CALCULATION OF PF-5060 VAPOR SPECIFIC HEAT 136 APPENDIX E: NUMERICAL MODEL OF FIN HEAT TRANSFER 141
E.1. Model Development 142 E.2. Model Results 145 E.3. Conclusions and Implications 149
REFERENCES 151

vii
LIST OF TABLES Table 1. Nondimensional parameters in the correlations of Stephan and Abdelsalam (1980). 11 Table 2. Various definitions of mean diameter. 15 Table 3. Important parameters affecting spray cooling. 16 Table 4. Summary of nanofluid boiling studies. 33 Table 5. Oxidation parameters used to increase the surface energy. 45 Table 6. Thermal properties at saturation (P=101325 Pa) (* Incropera & DeWitt, 1996; ** 3M, 2000; † Dillion & Penoncello, 2003; ‡ Yaws, 1999). 47 Table 7. Channel aspect ratio and surface areas of test surfaces. 56 Table 8. Fluid flow rate incident on top surface of heat sinks. 60 Table 9. Test matrix in the order in which it was run. 87 Table 10. Temperatures required for dominant two-phase effects. 114 Table 11. List of data acquisition and analysis programs. 132 Table 12. Steps in specific heat calculation for C6F14. 137

viii
LIST OF FIGURES Fig. 1. Swirl atomizer schematic. 3 Fig. 2. Illustration of spray cooling into a continuous liquid film. 4 Fig. 3. Typical boiling curve and associated boiling regimes. 5 Fig. 4. Simplified illustration of nucleate boiling heat transfer mechanisms. 10 Fig. 5. Thermal conductivity enhancements for various nanofluids (based on Eastman et al., 1997). 26 Fig. 6. CHF enhancement for alumina/water nanofluids (based on Moreno et al., 2005). 30 Fig. 7. Test rig. 38 Fig. 8. Thick-film resistor assembly (Courtesy of Alexander Walzenbach). 39 Fig. 9. Data acquisition and control diagram for thick-film resistor heater. 41 Fig. 10. Wheatstone bridge circuit to prevent burnout of the thick-film resistor. 42 Fig. 11. Wheatstone bridge circuit schematic. 42 Fig. 12. Copper heating block and stainless steel sealing plate. 43 Fig. 13. Typical temperature history of the copper block during the oxidation process. 44 Fig. 14. Data acquisition and control diagram for copper block boiling heater. 46 Fig. 15. Alumina-in-ethanol nanofluid samples (from left to right: 200 proof ethanol, 0.005 g/L, 0.01 g/L, 0.05 g/L, 0.1 g/L, 0.5 g/L, and 30.84 wt.%). 48 Fig. 16. Experimental test matrix for nanofluid boiling studies. 49 Fig. 17. Infusion pump setup. 51 Fig. 18. Advancing water droplet on a copper surface. 51 Fig. 19. Results of edge detection on the image of an advancing water droplet. 53 Fig. 20. Curve fitting results (the two other points on the interface are on the other side of the droplet). 53

ix
Fig. 21. Experimental setup for microchannel spray cooling. 54 Fig. 22. Heating block assembly (Courtesy of William Michie). 56 Fig. 23. Heater necks with 5 mm (left) and 1 mm (right) long fins. 57 Fig. 24. Illustration of overspray and incident flux increasing with fin length. 59 Fig. 25. Incident flow measurement system. 60 Fig. 26. Data acquisition and control diagram for microchannel spray cooling. 62 Fig. 27. Histogram of Monte Carlo results with input from an RTD measurement that corresponds to a nominal temperature prediction of 50 °C. 65 Fig. 28. Finite element model of a quarter section of thick-film heater. 66 Fig. 29. Typical temperature profiles in the neck of the copper heater block (data from 0.05 g/L alumina-in-water nanofluid boiling on well oxidized copper). 68 Fig. 30. Finite element model results for copper block with boiling at the top of the neck and free convection heat losses. 70 Fig. 31. Finite element model of a quarter section of the heater, silicone adhesive, and ceramic insulation showing the temperature distribution. 71 Fig. 32. Steady-state boiling curves for subcooled (Tsat = 51.7 °C, Tbulk = 30.6 °C) alumina/ethanol nanofluid over a range of concentrations on glass. 74 Fig. 33. Photographs of static droplets on a glass substrate (water on the left, ethanol on the right). 75 Fig. 34. Steady-state boiling curves for subcooled (Tsat = 51.7 °C, Tbulk = 30.6 °C) alumina/ethanol nanofluid on gold. 76 Fig. 35. Steady-state boiling curves for near saturated (Tsat = 28.9 °C, Tbulk = 28.8 °C) alumina/ethanol nanofluid on copper. 77 Fig. 36. Superheat required for a given heat flux for various alumina-in-ethanol nanofluids on copper. 79 Fig. 37. CHF enhancement as a function of nanoparticle concentration for near saturated ethanol suspensions on copper. 80

x
Fig. 38. Thermal conductivity enhancement of alumina nanofluids at room temperature. 81 Fig. 39. Steady-state boiling curves for near saturated (Tsat = 29.8 °C , Tbulk = 29.3 °C) alumina/water nanofluid on copper. 84 Fig. 40. CHF enhancement as a function of nanoparticle concentration for near saturated water suspensions on copper. 84 Fig. 41. Surface tension of water/ethylene glycol mixtures at 20 °C (after Horibe et al., 1996). 86 Fig. 42. Photographs of the advancing contact angle on polished copper (left) and copper oxide (right). 88 Fig. 43. Steady-state boiling curves (Tsat = 29.8 °C, Tbulk = 29.3 °C) illustrating the effect of surface oxidation. 90 Fig. 44. CHF as a function of advancing contact angle for pure water on copper and copper oxide. 90 Fig. 45. Boiling curves (Tsat = 29.8 °C, Tbulk = 29.3 °C) illustrating the CHF degradation caused by the addition of nanofluid. 92 Fig. 46. Comparison of nanofluid and oxidation enhancement techniques. 93 Fig. 47. Advancing contact angle of 1.02 g/L alumina-in-water nanofluid on copper. 95 Fig. 48. Second trial for advancing contact angle of 1.02 g/L alumina-in-water nanofluid on copper. 96 Fig. 49. Bubble growth leaving nanoparticles on the surface (left) and bubble detachment when liquid advances to cover the nanofouled dry patch (right). 97 Fig. 50. Advancing contact angle of 1.02 g/L alumina-in-water nanofluid on copper oxide. 98 Fig. 51. Spray cooling curves for subcooled (Tsat = 51.7 °C, Tspray = 30.5 °C) ethanol sprays (∆P=69 kPa) at various alumina nanoparticle concentrations. 99 Fig. 52. Spray cooling curves for subcooled (Tsat = 51.7 °C, Tspray = 30.5 °C) ethanol sprays (∆P=345 kPa) at various alumina nanoparticle concentrations. 101 Fig. 53. Relative viscosity increase for alumina nanofluids with linear fit that excludes the Pak & Cho data. † These authors report viscosity varying as a function

xi
of shear rate. Their results at the highest shear rates were used. Note that the viscosity increases are greater at lower shear rates. 102 Fig. 54. Relative heat transfer coefficient for jet impingement determined through scaling analysis as a function of nanoparticle volume fraction. 104 Fig. 55. Spray cooling curves for open microchannel surfaces at nozzle pressure of 138 kPa (20 psig). 108 Fig. 56. Spray cooling curves for open microchannel surfaces at nozzle pressure of 276 kPa (40 psig). 108 Fig. 57. Spray cooling curves for open microchannel surfaces at nozzle pressure of 413 kPa (60 psig). 109 Fig. 58. Heat flux as a function of nozzle pressure difference for Twall = 60°C (similar results are obtained at other wall temperatures). Heat fluxes are based on the 2 cm2 projected area. 111 Fig. 59. Area and heat flux enhancement as a function of fin length for Twall = 60°C (similar results are obtained at other wall temperatures). Heat fluxes are based on the 2 cm2 projected area. 112 Fig. 60. Spray efficiency as a function of fin length in the “single-phase” regime. 116 Fig. 61. Spray efficiency as a function of wall temperature for 138 kPa (20 psig) nozzle pressure difference. 118 Fig. 62. Spray efficiency as a function of wall temperature for 276 kPa (40 psig) nozzle pressure difference. 118 Fig. 63. Spray efficiency as a function of wall temperature for 413 kPa (60 psig) nozzle pressure difference. 119 Fig. 64. One-dimensional model results as a function of fin length for Twall = 60°C, ∆P=4.08 atm (60 psig) normalized by hflat = 9784 W/(m2·K). 122 Fig. 65. Predicted temperature profile on 5 mm fins using 1-D model for Twall = 60°C, ∆P=4.08 atm (60 psig). 123 Fig. 66. Nonwetting (left) and wetting (right) liquid droplets. 130 Fig. 67. Schematic of advancing and receding contact angles. 131 Fig. 68. Monte Carlo error estimation technique. 134

xii
Fig. 69. Finite difference model of the fin tip region. The solid fin and liquid are shown as shaded and unshaded, respectively. Heat is conducted within the fin and convected to the local liquid, which moves down the fin. 142 Fig. 70. Finite difference model showing liquid temperature increase due to local convection between rows n+1 and n. The solid fin and liquid are shown as shaded and unshaded, respectively. 143 Fig. 71. Finite difference model showing liquid temperature increase due to convection at the tip. The solid fin and liquid are shown as shaded and unshaded, respectively. 144 Fig. 72. Temperature profiles for various mass flow rates. Plots a) – d) show mass flow rates of 1000 m& , 10 m& , 2 m& , and m& , respectively, where m& is the average per fin mass flow rate used in the experiment. h = 10,000 W/m2·K. 146 Fig. 73. Local heat flux as a function of position on fin. Solid symbols show heat flux off the top surface of the fin (rather than the top node in the model). h = 10,000 W/m2·K. 147 Fig. 74. Single fin heat transfer as a function of heat transfer coefficient. 149

xiii
NOMENCLATURE A Area [m2]
Ac Cross-sectional area of the fin [m2]
Aflat Area of the flat (unenhanced) surface [m2]
b Laplace constant = ( )vlg ρρσ−
2 [m]
32OAlc Concentration of alumina [g/L]
cgas Concentration of gas [mol/mol]
cp Constant pressure specific heat [J/kg·K]
cp,l Constant pressure specific heat of the liquid [J/kg·K]
cp,v Constant pressure specific heat of the vapor [J/kg·K]
C Constant in boiling correlations
Channel width [m]
Cs,f Constant in Rohsenow’s (1952) correlation
CHF Critical heat flux [W/m2]
CHFnanofluid Critical heat flux with nanofluid [W/m2]
CHFZuber Critical heat flux predicted by Zuber’s correlation [W/m2]
CNT Carbon nanotube
d Diameter [m]
Equilibrium break-off diameter in the correlation of Stephan & Abdelsalam (1980) = 0.146θ·b [m]
d10 Arithmetic mean diameter [m]
d20 Surface area mean diameter [m]
d30 Volume mean diameter [m]

xiv
d32 Volume-to-surface area (Sauter) mean diameter [m]
dmax Maximum diameter in distribution [m]
dmin Minimum diameter in distribution [m]
dn Orifice diameter [m]
do Orifice diameter [m]
dp Mass median diameter [m]
dpq Mean diameter based on arbitrary orders p and q [m]
Deq Equivalent diameter based on area affected by a single impinging jet [m]
g Acceleration due to gravity [m/s2]
h Heat transfer coefficient [W/m2·K]
hbasefluid Heat transfer coefficient when using base fluid [W/m2·K]
hfg Latent heat of vaporization [J/kg]
hflat Heat transfer coefficient of the flat (unenhanced) surface [W/m2·K]
hnanofluid Heat transfer coefficient when using nanofluids [W/m2·K]
H Henry’s constant [atm-1]
HX Heat exchanger
k Thermal conductivity [W/m·K]
kbasefluid Thermal conductivity of the base fluid [W/m·K]
kl Thermal conductivity of the liquid [W/m·K]
knanofluid Thermal conductivity of the nanofluid [W/m·K]
kparticle Thermal conductivity of the particle [W/m·K]
ksuspension Thermal conductivity of the suspension[W/m·K]

xv
l Liquid
L Fin length [m]
m Fin constant = c
f
kAhP
[m-1]
m& Mass flow rate [kg/s]
m& Average per fin mass flow rate [kg/s]
n Constant in Rohsenow’s (1952) correlation
Probability density function
Number of measurements taken
Number of fins on the microstructured surface
Nu Nusselt number
Nud32 Nusselt number based on Sauter mean diameter
OD Outer diameter
P Pressure [Pa]
Pa Ambient pressure [Pa]
Pf Perimeter of the fin [m]
Ps Stagnation pressure [Pa]
Psat Saturation pressure [atm]
PT Total pressure [atm]
Pr Prandtl number
Prl Prandtl number of the liquid
q Heat transfer [W]
qCHF,nanofluid Heat transfer at CHF with nanofluid [W]

xvi
qCHF,basefluid Heat transfer at CHF with base fluid [W]
qflat Heat transfer from the flat (unenhanced) surface [W]
qheatsink Heat transfer from the entire microstructured surface [W]
qsides+tip Heat transfer from the sides and tip of a single fin [W]
q ′′ Heat flux [W/m2]
CHFq ′′ Critical heat flux [W/m2]
flatq ′′ Heat flux of a flat (unenhanced) surface [W/m2]
Q ′′ Mean volumetric flow flux [m/s]
R Resistance [Ω]
R0 Resistance at reference temperature [Ω]
Rheater Heater resistance [Ω]
RaL Rayleigh number based on plate length
32dRe Reynolds number based on Sauter mean diameter
ndRe Reynolds number based on nozzle diameter and velocity of the jet at the nozzle
odRe Reynolds number based on orifice diameter
s Solid
tdwell Dwell time at peak temperature [min]
T Temperature [K]
Tbulk Bulk fluid temperature [K]
Tinlet Temperature immediately upstream of the nozzle [K]
Tl Local liquid temperature [K]
Tl,n Nodal temperature of the liquid [K]

xvii
Tn Nodal temperature of the fin [K]
Tpeak Peak temperature reached during oxidation [°C]
Ttip Fin tip temperature [K]
Tsat Saturation temperature [K]
Tspray Spray temperature [K]
Twall Wall temperature [K]
TC Thermocouple
v Vapor
vbreakup Droplet breakup velocity [m/s]
vupstream Velocity of flow upstream of the nozzle [m/s]
V Voltage [V]
Vi Supply voltage [V]
W Fin width [m]
odWe Weber number based on orifice diameter
x Position [m]
Arbitrary variable
X1 Non-dimensional parameter in Stephan & Abdelsalam’s (1980) correlation defined in Table 1
X3 Non-dimensional parameter in Stephan & Abdelsalam’s (1980) correlation defined in Table 1
X4 Non-dimensional parameter in Stephan & Abdelsalam’s (1980) correlation defined in Table 1
X5 Non-dimensional parameter in Stephan & Abdelsalam’s (1980) correlation defined in Table 1
X13 Non-dimensional parameter in Stephan & Abdelsalam’s (1980) correlation defined in Table 1

xviii
y Arbitrary function
32 OAly Mass fraction of alumina
α Linear temperature coefficient of resistance [K-1]
αl Thermal diffusivity of the liquid [m2/s]
∆a Constant group contribution [J/mol·K]
∆b Linear group contribution [J/mol·K2]
∆c Quadratic group contribution [J/mol·K3]
∆P Nozzle pressure difference [Pa]
∆T Temperature difference [K]
∆Tsat Twall – Tsat [K]
∆Tsub Tsat – Tspray [K]
φ Volume fraction
32OAlφ Volume fraction of alumina
glycolethyleneφ Volume fraction of ethylene glycol
particleφ Volume fraction of the solid particles
η Spray efficiency as typically defined
η' Spray efficiency including all thermodynamic potential for heat transfer
µ Dynamic viscosity [Pa·s]
µbasefluid Dynamic viscosity of the base fluid [Pa·s]
µl Dynamic viscosity of the liquid [Pa·s]
µnanofluid Dynamic viscosity of the nanofluid [Pa·s]

xix
θ Full-cone spray angle [degrees]
Liquid/solid contact angle [degrees]
Temperature difference (T – Tspray) [K]
θa Advancing contact angle [degrees]
θpost Advancing contact angle after the experiment [degrees]
θprior Advancing contact angle prior to the experiment [degrees]
θr Receding contact angle [degrees]
θwall Twall – Tspray [K]
32OAlρ Density of solid alumina [kg/m3]
ρl Liquid density [kg/m3]
ρmix Density of the mixture
ρpure liquid Density of the base fluid
ρv Vapor density [kg/m3]
σ Surface tension [N/m]
Standard deviation [varies]
Aσ Standard deviation of the area [m2]
dxdTσ Standard deviation of the temperature gradient [K/m]
fitellipseσ Standard deviation of ellipse fit [degrees]
kσ Standard deviation of the thermal conductivity [W/m·K]
lvσ Liquid-vapor surface tension [N/m]
q ′′σ Standard deviation of the heat flux [W/m2]
Rσ Standard deviation of the resistance [Ω]

xx
slσ Solid-liquid surface tension [N/m]
svσ Solid-vapor surface tension [N/m]
Vσ Standard deviation of the voltage [V]
θσ Standard deviation of the average contact angle [degrees]

1
CHAPTER 1. INTRODUCTION
This dissertation was developed to improve the state of knowledge of spray
cooling and advanced multi-phase heat transfer technologies. To begin, the specific
motivation for this work, a brief review of background material, and the objectives of the
research are discussed. A detailed review of the literature follows in Chapter 2.
1.1. Motivation
Modern technology demands power and in an ever decreasing package size. As
functions are increased and devices shrink, heat density increases. For example, the high
heat fluxes created by high performance electronics offer great challenges to the
engineering community. Advanced liquid immersion cooling techniques such as boiling
and spray cooling are particularly effective for addressing these types of high heat density
problems.
Two-phase systems utilizing boiling or liquid evaporation have long been
recognized as having the potential to remove large amounts of heat at low temperature
difference. One such system is spray cooling, in which an atomizing nozzle provides a
flow of liquid droplets directed at a hot surface. The primary disadvantages of spray
cooling systems include large weight, cost, and complexity. However, exceptionally high
heat transfer rates can be achieved because vapor removal from the surface is much easier
than with other two-phase systems.
Spray cooling technology has been applied in a variety of applications including:
metal quenching, reducing scarring during medical procedures (e.g., port-wine scar
removal), cooling multichip modules within supercomputers, and cooling Commercial
Off-The-Shelf (COTS) based military electronics. It is also being considered for

2
application to advanced defense systems, computer processor test and evaluation, and
automotive systems.
Given the many applications of high heat flux technology, there is always a desire
to increase the thermal performance of existing technologies. This thesis explores two
potentially powerful techniques that may be capable of improving traditional spray
cooling: nanofluids and extended surfaces. These techniques are reviewed, tested,
analyzed, and modeled.
1.2. Background
Sprays in general find wide use in applications including agriculture, food
processing, painting, combustion, fire suppression, and metal quenching as well as high
heat flux electronics. The methods of atomization and resulting spray profiles are equally
diverse. Pressure atomization can be achieved by forcing a liquid at high velocity
through a small orifice. This can be a simple orifice or a more complex design. Many
designs exist including those that cause the liquid to impact specially designed structures
as well as those utilizing complex liquid injection and diverging liquid streamlines. The
most common design is the pressure swirl atomizer, which works by tangentially
injecting liquid to generate a vortex in the swirl chamber that draws ambient air into the
nozzle (Nasr et al., 2002) (see Fig. 1). This causes the liquid to emerge from the nozzle
as an unstable cylindrical sheet with axial and tangential velocity. A pressure atomizing
nozzle was used in the present work, although many other types of atomizers exist such
as gas-assisted and ultrasonic. Nozzles can be designed to create many different spray
profiles including circular, square, or flat. In spray cooling, the nozzles are typically

3
manufactured to create: 1) a hollow cone in which the majority of the droplets land along
the perimeter or 2) a full cone with nominally uniform droplet distribution.
Fig. 1. Swirl atomizer schematic.
The basic mechanisms by which heat is removed during spray cooling are poorly
understood because it is a technology that combines a number of fundamentally complex
thermo/fluid dynamics processes. Furthermore, the heat transfer is highly dependent on
the amount of liquid on the surface. At one extreme, the liquid flow rate is sufficient to
create a continuous liquid film. This film is subject to mixing caused by incoming
droplets, gas entrainment, boiling, and evaporation (see Fig. 2). At the opposite extreme,
a relatively dry surface can result from a sparse spray (low volume flow rate) and/or high
surface temperature. With a dry surface, boiling in a traditional sense may be of less
importance than dropwise evaporation and droplet impact effects (see di Marzo (1996)
for a detailed discussion of heat transfer in this regime). In this case, the distribution of
droplet sizes and velocities due to the atomization method strongly affect the heat transfer
rate. These droplets may splash, rebound, and coalesce on the surface. Individual
droplets and droplet pools are then free to evaporate as they are pushed off the heated
surface by the liquid’s radial momentum.
Liquid sheet A
A
A-A
Tangential injection
Conical convergence

4
Fig. 2. Illustration of spray cooling into a continuous liquid film.
One aspect of spray cooling is basic boiling phenomena, which should be
considered as a prerequisite to the more complex process of spray cooling. Therefore,
consider boiling in the absence of an incoming spray. Boiling is a highly efficient means
of heat transport in which liquid is vaporized due to the temperature of the liquid
exceeding the saturation vapor pressure. Many people might also add the requirement
that bubbles be present to make a distinction with non-boiling evaporation (but no such
distinction will be made here). In boiling, heat can be removed by increasing the
temperature of the liquid (sensible heating) as well as the vaporization process (latent
heating). Typically, a large amount of heat can be removed at relatively low temperature
difference. Boiling heat transfer is usually characterized by a boiling curve (Fig. 3) with
various boiling regimes.
Bubbles entrained by impinging droplets
Growing vapor bubble Rising vapor bubble

5
Fig. 3. Typical boiling curve and associated boiling regimes.
In the first regime (Fig. 3, I), free convection occurs when no vapor can be
generated due to low wall superheat and insufficient nucleation sites. This single-phase
regime can be treated analytically or with correlations such as Churchill and Chu (1975).
This regime ends when bubble generation begins. Even this simple regime will be quite
complicated in spray cooling because of the motion of the liquid film and the mixing
caused by impinging droplets.
The nucleate boiling regime (Fig. 3, II - III) begins once bubbles are generated
and is characterized by two sub-regimes. The first is the isolated bubble regime (Fig. 3,
II), where bubbles form at their own nucleation sites and depart distinctly. Following this
sub-regime, at higher wall superheat, the departure frequency is so great that bubbles
I II III IV V
CHF
Leidenfrost
I II III IV
V

6
immediately begin to coalesce both horizontally and vertically. This is the regime of
slugs and columns (Fig. 3, III).
Following the nucleate boiling regime, the boiling curve continues to the local
maximum heat flux termed critical heat flux (CHF) or the burnout heat flux. This occurs
due to vapor generation that is so great that liquid can no longer come into contact with
the heater surface. With insufficient supply of cold liquid to cool the surface, heat must
be transported through the vapor. Heat transfer through the vapor is less efficient (due to
its lower thermal conductivity) and results in a decrease in the heat flux. It represents a
thermal design limit for many applications since at this point the heat flux declines as the
temperature rises, which ultimately causes device failure.
The transition boiling regime (Fig. 3, IV) follows CHF and is characterized by
increasing wall temperature and decreasing heat flux. This is due to an increase in the
dry area covering the heater. This regime is of little practical interest because it is
unstable and quickly results in the film boiling regime. However, it is important to note
that any constant heat flux experiment that drives the heater to CHF will inevitably drive
the heater into the transition boiling regime. The higher temperatures and exposure to
dissolved gases may cause changes to the surface microstructure.
Eventually, a local minimum in the boiling curve is reached, the Leidenfrost
point. At this point, the surface enters the film boiling regime (Fig. 3, V). In the film
boiling regime, heat must be conducted across a continuous vapor film before it can be
transferred to the liquid. This inefficient process can result in large heat fluxes, but the
temperatures required are very high. The film boiling regime is therefore unpractical as a
means of cooling many practical devices, but it is important in spray quenching of metals.
7
Boiling, like spray cooling, is also incompletely understood by the research
community. While this dissertation has focused on enhancing spray cooling, this goal
can only be achieved given thorough understanding of basic boiling phenomena. The
preceding background will be extended in the next chapter when the relevant literature
concerning boiling, spray cooling, nanofluids, and extended structure are reviewed in
detail.
1.3. Research Objectives
This thesis sheds light on the fundamental mechanisms responsible for two
powerful heat transfer enhancement techniques: nanofluids and extended surfaces. The
primary objectives of this research were as follows:
1. Determine the mechanisms by which heat transfer is enhanced during spray
cooling of extended surfaces.
2. Determine whether nanofluids improve or degrade boiling heat transfer.
3. Determine the suitability of nanofluids for spray cooling.
4. Determine the mechanisms by which nanofluids improve/degrade heat
transfer.
These objectives were met through a systematic experimental approach that investigated
the fundamental mechanisms underlying the boiling and spray cooling processes.
First, the mechanisms behind the performance enhancement provided by spray
cooling heat sinks with straight fins were studied. Straight fins are known to improve
spray cooling heat transfer (Silk et al., 2004, 2005, 2006), but the precise mechanisms
underlying the enhancement remained elusive. The heat sinks used in this study were

8
electric discharge machined (EDM) to have a channel width of 0.36 mm, fin width of
0.50 mm, and lengths of 0.25 mm, 0.50 mm, 1.0 mm, 3.0 mm, and 5.0 mm. The high
aspect ratio of these channels provided an increase in surface area of up to 13 times the
baseline. With such a large increase in area, the spray was utilized more effectively. In
fact, one goal of this study was to add enough fin area that the entire spray could be
evaporated as droplets flowed down the long channels. Furthermore, varying only the fin
length provided an opportunity to study the relative spray utilization provided by the
increased area. The effect of increased fin length is discussed in detail along with its
pronounced effect of the spray efficiency.
Second, experiments were designed to test whether nanofluids are truly capable of
enhancing boiling heat transfer. The literature contains a diverse range of conclusions,
and as of yet, no consensus has emerged. This thesis has specifically investigated the
role of surface wetting on the nanofluid boiling system. A water-based nanofluid was
tested on copper and copper oxide surfaces. Surface wetting was systematically
improved by increasing the thermal oxide layer on the copper surface. Ethanol-based
nanofluids with better wetting characteristics were also used over a concentration range
of 0.001 g/L to 10 g/L on glass, gold coated, and copper surfaces. These experimental
results were compared to the literature and the effect of surface wettability is discussed in
detail.
Finally, spray cooling of nanofluid was considered. A scaling analysis was
developed to illustrate the challenges of nanofluid spray cooling and experimental results
are presented.

9
CHAPTER 2. LITERATURE REVIEW The literature review for this dissertation is divided into four sections. The first
two sections concern the general features of boiling and spray cooling, respectively.
These sections provide the necessary background information as well as describing the
state of the art in spray cooling technology. The third section reviews the literature
regarding nanofluids, including their synthesis, properties, and application to evaporative
heat transfer systems. The final section reviews enhanced and extended surfaces in both
boiling and spray cooling systems.
2.1. Boiling Heat Transfer
Boiling provides very high heat transfer rates and has been studied for many years
in both stagnant pool and flow boiling configurations, yet it remains poorly understood.
Much of the confusion is directly related to the stochastic nature of the nucleation
process.
2.1.1. Nucleate Boiling
Nucleate boiling is affected by many parameters, the most important being heat
flux, saturation pressure, and thermophysical properties (Pioro et al., 2004). Other
properties such as surface material, finish, and microstructure are also known to affect
pool boiling but the precise functional form of these effects remains unknown (Pioro et
al., 2004). These surface properties and the ability of the liquid to wet the surface are key
to determining the number of active nucleation sites (micro sized gaps in the surface that
trap gas/vapor to serve as bubble embryos). The nucleation site density then largely

10
determines the amount of latent heat transport and the degree of mixing caused by bubble
departure.
Some of the dominant heat transport mechanisms occurring during the nucleate
boiling regime are shown in Fig. 4. Conduction from the heated surface into the bulk
fluid creates a superheated liquid layer (Fig. 4, left) , which in turn drives evaporation
near the base of the bubble (Fig. 4, middle). In a saturated pool, there would be
evaporation around the entire bubble. In a subcooled pool, the colder bubble cap would
serve as a condensation region, which would allow the bubble to serve as a kind of heat
pump. Bubble detachment will occur when the buoyancy force (in combination with
external body forces) exceeds the surface tension force holding the bubble on the surface.
Then, the heated surface will be rewetted by fresh cold liquid (Fig. 4, right). Following
rewetting, the superheated liquid layer must be regrown, which begins the heat transfer
cycle anew. The specifics of each of these mechanisms and the relative contribution of
each remains a topic of debate (Henry, 2005; Moghaddam, 2006) and are beyond the
scope of the present work.
Fig. 4. Simplified illustration of nucleate boiling heat transfer mechanisms.
Despite incomplete understanding and much disagreement, pool boiling heat
transfer is often estimated using the Rohsenow (1952) correlation:
Rewetting by cold liquid
Evaporation
Conduction into bulk

11
(1)
In addition to the numerous thermophysical properties that appear in Eq. 1, two
parameters, Cs,f and n, account for surface-liquid combination. While errors as large as
±100% are not uncommon (Incropera & Dewitt, 1996), it is a useful estimate of
magnitude and captures the important dependence of wall superheat.
Another set of nucleate boiling correlations were developed by Stephan and
Abdelsalam (1980). They used nearly 5000 data points available from the literature in a
regression analysis that determined Nusselt number as a function of various non-
dimensional parameters that varied depending on the working fluid. For water they
suggested:
(2)
where the non-dimensional parameters are defined in Table 1. For hydrocarbons such as
ethanol, they suggested:
(3)
Since these correlations were developed based on a large experimental dataset, the
expected errors are much smaller: The authors quoted mean absolute errors of 11.3% and
12.2% for water and hydrocarbons, respectively.
Table 1. Nondimensional parameters in the correlations of Stephan and Abdelsalam
(1980). Non-dimensional Parameter Definition
X1 ( )satlTkdq /′′ (4) X3 22
, / lsatlp dTc α (5) X4 22 / lfg dh α (6) X5 lv ρρ / (7) X13 ( ) lvl ρρρ /− (8)
( )3
,
,2/1
∆
−=′′
nlfgfs
satlpvlfgl PrhC
Tcghq
σρρµ
,10246.0 22.513
26.13
58.14
673.01
7 XXXXNu −⋅=
( ) 248.04
33.413
67.01
5.050546.0 XXXXNu −=

12
2.1.2. Critical Heat Flux
CHF marks the turning point when heat transfer starts to decline due to high wall
superheat. It also remains a poorly understood phenomena, in part due to difficulties in
observing the near wall region which likely controls the dry-out mechanism. Suggested
CHF mechanisms include the hydrodynamic instability model (Zuber, 1959), the bubble-
packing model (Rohsenow & Griffith, 1956), and the macrolayer model (Haramura &
Katto, 1983). However, these models neglect many factors that have been shown to affect
CHF such as gravity, surface finish and wettability, heater dimensions, and heater
thermal properties among others.
Despite these shortcomings, a need to predict CHF has resulted in a number of
correlations. Based on dimensional analysis and hydrodynamic instability analysis,
Kutateladze (1952) and Zuber (1959) respectively developed correlations of the
following form:
(9)
The constant C varies depending on the model. Kutateladze (1952) showed that values of
0.13 – 0.19 could correlate the data from various studies available at the time. In the
most widely used form, the Zuber (1959) correlation, the constant is equal to π/24. The
Zuber correlation is of particular importance in the present research because so much of
the nanofluid research reported in the literature has been analyzed in light of this
correlation. However, it is important to note that Zuber neglected surface wettability
effects, which will be shown to be of great importance in nanofluid boiling.
( ) 2/14/1
2
+
−=′′
l
vl
v
vlvfgCHF
gChq
ρρρ
ρρρσ
ρ

13
2.1.3. Surface Wettability
The importance of the surface microstructure mentioned above is in part a result
of surface wettability effects (note: Appendix A gives some background information on
wettability and defines the various contact angles of interest). Both the advancing and
receding contact angles are important throughout much of the boiling curve. The initial
nucleation site density is determined in part by the liquid’s ability to trap vapor/gas nuclei
in the microstructure of the boiling surface. Highly wetting fluids like R-113 and FC-72
can result in fewer nucleation sites and large superheat excursions at boiling incipience
(You et al., 1990). This effect is governed by the advancing contact angle. The
advancing angle is again important during rewetting of dry surfaces as bubbles lift off the
boiling surface (Demiray & Kim, 2004).
The receding contact angle is important during the bubble growth period as the
vapor pushes liquid away to create a larger dry patch. With a smaller contact angle, a
thinner wedge of liquid is created between the heater and the liquid-vapor bubble
interface, which promotes evaporation. The receding contact angle may also be
important in determining when CHF occurs since CHF may occur when vapor blankets
the surface due to a pushing back of the liquid (Kandlikar, 2001).
Metallic oxides in particular are known to improve CHF by increasing the
wettability of the surface (Tachibana et al., 1967; Liaw & Dhir, 1989; Takata et al.,
2005). Tachibana et al. (1967) tested over 400 metallic plates in saturated water pool
boiling at atmospheric pressure. They heated the plates to physical destruction and found
aluminum to have a much higher CHF due to a native oxide film that developed soon
after the initiation of boiling and spread throughout the experiment. Furthermore,

14
stainless steel that was coated with aluminum was found to have a similar enhancement.
They believed this higher CHF was due to the oxide’s “good affinity” for water. Liaw
and Dhir (1989) measured CHF on a vertical copper surface in a saturated water pool at 1
atm. They systematically decreased the static contact angle by heating the copper surface
in air to create a thermal oxide. By varying the peak temperature and the amount of time
the surface was subjected to heating, the contact angle was decreased from 90° to 14°.
CHF was observed to increase by ~90% as the contact angle was decreased.
2.2. Spray Cooling
As previously mentioned spray cooling is comprised of many complex
thermo/fluid dynamics processes. It begins when flow instabilities shatter the liquid into
many fine droplets of varying size.
2.2.1. Droplet Features
Atomization creates an array of droplet sizes, which can be measured with laser
diffraction or phase Doppler anemometry (PDA). However, it is often more convenient
to use an average droplet size to characterize the spray. A general expression for mean
diameter is given by Nasr et al. (2002):
, (10) where n(d) is the probability density function and p and q are orders (e.g. 1, 2, or 3).
Using this framework various definitions of mean diameter can be used as different
applications dictate (see Table 2).
)/(1
)(
)(
max
min
max
min
qp
d
d
q
d
d
p
pq
ddnd
ddnd
d
−
=
∫
∫
δ
δ

15
Table 2. Various definitions of mean diameter. Description Equation Arithmetic mean diameter
ddnddd
d
δ)(max
min
10 ∫= (11)
Surface area mean diameter 2/1
220 )(
max
min
= ∫ ddndd
d
d
δ (12)
Volume mean diameter 3/1
330 )(
max
min
= ∫ ddndd
d
d
δ (13)
Volume-to-surface area mean diameter (Sauter mean diameter)
ddnd
ddnd
dd
d
d
d
δ
δ
)(
)(
max
min
max
min
2
3
32
∫
∫= (14)
In spray cooling, it has been common to use the Sauter mean diameter (SMD),
perhaps because it captures both the volume and surface area characteristics of the spray.
Estes and Mudawar (1995) developed a SMD correlation for FC-72, FC-87, and water:
, (15)
where the Weber and Reynolds numbers are defined as: (16)
(17) Eq. 15 was used in the present work because it was developed with similar working
fluids, although many more SMD correlations are available (see Liu, 2000).
Another key feature of droplets is velocity. The distribution of droplet velocities
obviously depends on the method and degree of atomization. Ghodbane and Holman
(1991) used an energy balance to determine the break-up velocity, Eq. 18.
( ) 259.02/132 67.3−
=oo dd
oReWe
dd
σρ
ρ ol
v
d
dP
Weo
∆
=
2
l
ol
l
d
dP
Reo µ
ρρ
2/12
∆
=

16
(18) However, the differential pressure term usually dominates. Therefore, in the present
work, the droplet velocity has been estimated while neglecting the other two terms.
2.2.2. Parameters Affecting Spray Cooling
There are many important parameters that control spray cooling heat transfer
(Table 3). One of the greatest challenges in the study of spray cooling is the inability to
independently and precisely control these parameters. For example, mass flux can be
increased by increasing the differential pressure in a pressure atomizing spray. However,
this increase in pressure strongly affects droplet breakup; completely altering droplet size,
number, and velocity.
Table 3. Important parameters affecting spray cooling.
Droplet size & distribution Droplet number flux Droplet velocity & distribution Mass flux & distribution
Spray properties
Spray angle Thermal conductivity of liquid Surface tension of liquid Specific heat of liquid Fluid properties
Latent heat of vaporization Superheat Thermal conductivity of substrate Substrate properties Substrate finish Subcooling Foreign nuclei Gravity Ambient gas density
Environmental properties
Ambient gas viscosity
2/12 122
−∆+=
pllupstreambreakup d
Pvvρ
σρ

17
Of these parameters, spray properties have received the most attention. Chen et
al. (2002) studied the relative importance of mean droplet size, droplet flux, and droplet
velocity on CHF. They used more than 20 full cone nozzles at a variety of nozzle
pressures and standoff distances to systematically vary one of the above parameters while
holding the other two constant. Over 3000 combinations of the three spray parameters
were generated, although only a small subset of these satisfied the criteria of two
parameters being constant. They found that the mean droplet velocity had the greatest
effect on CHF, followed by the droplet number flux. Both the CHF and heat transfer
coefficient increased as these parameters were increased. The Sauter mean diameter was
found to be of little importance.
The effect of mass flow rate appears to be completely dependent on the total
amount of liquid supplied. Thermodynamically, heat transfer is limited to:
(19) In a sufficiently dilute spray, most of the mass supplied can be heated and vaporized. In
these cases, heat transfer increases as the mass flow rate increases. With a dense spray,
much of the liquid flows off the surface and heat transfer may be insensitive to increases
in the mass flow rate (Sehmbey et al., 1994). Yang et al. (1996) found that in the
nucleate boiling regime the heat transfer increased with increasing flow rate until a limit
of 3 L/hr, when the improvement ceased. Tilton et al. (1992) found that heat transfer
increased as the coolant flow rate was increased, provided the module was not flooded.
Many others have also found that heat transfer increased as mass flow increases (e.g.,
Pais et al., 1992; Mudawar & Estes, 1996; Lin & Ponnappan, 2004; Pautsch & Shedd,
2005; Rybicki & Mudawar, 2006; Sakamoto et al., 2006).
( )fgp hTcm +∆&

18
Subcooling also has been found to increase CHF because more sensible heat is
required to heat the liquid to the saturation temperature (Estes & Mudawar, 1995a;
Horacek et al., 2005; Rybicki & Mudawar, 2006). However, the increase in CHF comes
at the expense of a lower heat transfer coefficient (Tilton et al., 1992; Horacek et al.,
2005).
Surface finish is an important parameter affecting spray cooling and of particular
importance in the present work. It has been argued that increasing the surface roughness
decreases the heat transfer by increasing the thickness of the liquid film on the surface
(Pais et al., 1992). Pais et al. note that a roughened surface will have regions that are too
deep and those which are too high. In the deep troughs of the surface, impinging drops
will have to penetrate further to disturb growing bubbles and mix the fluid. Additionally,
troughs suffer from a larger conduction resistance through the thick film to the free
surface where evaporation is occurring. Peaks in the surface may suffer from having too
thin a liquid film causing these regions to prematurely dry out. In their experimental
investigation of spray cooling a copper block with water, they showed that a 0.3 µm grit
roughened surface greatly outperformed 14 µm or 22 µm grit roughened surfaces.
However, their conclusions may only be applicable in systems that are primarily
governed by thin film evaporation; and depending on the spray parameters, this may not
be the most important mechanism governing heat transfer.
For example, Kim et al. (2004b) investigated air-assisted spray cooling of a
microporous surface with water. They found performance enhancements ~50% at CHF
for the microporous surface, which the authors attribute to capillary pumping of liquid on
top and within the surface. However, they used very modest flow rates of 1.25 mL/min -

19
3 mL/min, and it is not clear whether this enhancement would transfer to the higher flow
rates that are of greater industrial significance.
2.2.3. Models of Spray Cooling The simplest (and often quite accurate) model of spray cooling is that of single-
phase convection. Numerous researchers have observed that spray cooling heat transfer
can be linear with respect to wall-to-spray temperature difference (particularly when the
superheat is modest) (e.g. Pautsch & Shedd, 2005; Estes & Mudawar, 1995a). This
indicates negligible two-phase effects. Heat transfer is enhanced by maximizing the
sensible heating of the spray and preventing vaporization, which leads to CHF (Pautsch
& Shedd, 2005). In these studies the flow rate is often very large and as the flow rate is
increased, the heat transfer improves and the model becomes more accurate. However,
this results in an inefficient system that requires large pumps and fluid inventory.
Indeed, these systems are very similar in performance to impinging jets. For example,
Fabbri et al. (2003) compared sprays to microjets and found that sprays outperformed jets
only at low flow rates and were inferior when considering both systems at constant
pumping power. However, Estes and Mudawar (1995a) found that sprays usually
outperformed jets given a constant flow rate, but the performance enhancement at larger
subcooling was modest. They attributed the spray cooling performance to a more secure
liquid film.
In many cases, better heat transfer can be achieved by utilizing multiphase effects.
The simplest two-phase model of spray cooling heat transfer is that the spray creates a
thin-film on the surface of the heater. Heat is then conducted through the film and
evaporation occurs at the free surface. The impinging droplets are thought to increase the
20
conductance of this layer through improved mixing (Sehmbey et al., 1994). To maximize
heat transfer, the liquid film must be made as thin as possible. Pautsch and Shedd (2006)
used a four nozzle array and found that the regions with the poorest thermal performance
had the thickest films. Pais et al. (1992) illustrated the effect clearly by studying surfaces
with different surface roughness. They found that with a roughness greater than 1 µm,
nucleation is primarily responsible for performance. However, when the liquid film was
of order 0.1 µm, heat was primarily transferred through film evaporation. They observed
up to 1200 W/cm2 with a water spray that created such a thin film.
The thicker films mentioned above leads to the second basic model, which is
nucleation dominated flow boiling. If the spray creates a thick enough liquid film, then
the performance may be similar to that of typical boiling systems. In these systems, the
heat transfer may be dominated by the nucleation site density on the solid surface.
However, there is evidence to suggest that the impinging drops make the nucleation
process very different.
In the secondary nucleation model, the large nucleate and convective heat
transfers observed are attributed to so called “secondary nuclei” (Yang et al., 1996; Rini
et al., 2002). When droplets enter the liquid film they are thought to entrain vapor, which
serves as an additional nucleation site. Also, if a droplet breaks up a growing bubble, the
nucleation site density is further increased. Rini et al. (2002) found that the heat transfer
increases as the droplet number flux increases, which they attribute to a corresponding
increase in the number of secondary nuclei. Furthermore, the ratio of nucleate to
convective heat transfer was unaffected by the droplet number flux, which suggests that

21
secondary nuclei and turbulent mixing of the droplets enhances nucleate boiling and
convection similarly.
Horacek et al. (2004, 2005) proposed another mechanism for two-phase spray
cooling heat transfer: contact line heat transfer. They used the total internal reflectance
(TIR) technique to determine the wet and dry portions of the heated surface. They then
calculated the wetted area fraction and the contact line length. The heat flux (once
corrected for sensible heat) was found to be well correlated with the contact line length,
which also increased to a local maximum like CHF. Interestingly, wetted area fraction
was found to decrease monotonically as superheat increased and could not be correlated
with heat flux. This suggests that contact line heat transfer and not wetted area is
responsible for two-phase portion of the heat transfer.
Critical heat flux mechanisms in spray cooling may be slightly different than in
typical boiling systems. It is generally agreed that CHF begins with dryout around the
perimeter of the heater (Sehmbey et al., 1994; Kim, 2006). However, Pautsch and Shedd
(2006) noticed that CHF occurred first at the center of their heater due to it having the
largest local film thickness.
No validated model of CHF for spray cooling exists, but there are some possible
mechanisms. With a sufficiently sparse spray, CHF will occur when the liquid supply is
exhausted due to evaporation. Droplets hitting dry surface will quickly evaporate. Those
droplets forming pools will boil like a typical pool. This is consistent with the visual
observations of Hsieh et al. (2004).
If liquid is in sufficient supply, then CHF may be caused by a “choking” of the
liquid supply by bubbles generated in the liquid film as suggested by Sehmbey et al.

22
(1994). This could be due to escaping vapor preventing drops from hitting the surface or
the ejection of liquid from the surface caused by the bursting of bubbles. Chow et al.
(1995) developed a CHF model of spray cooling based in part on the macrolayer dry-out
model of Haramura and Katto (1983). In this spray cooling model, increasing bubble
production in the liquid film leads to a larger vapor bubble. This large bubble is then
broken by an impinging drop (or due to its own internal pressure) causing the liquid
above the bubble to be ejected from the surface. If fresh droplets cannot replenish the
surface before the remaining macrolayer evaporates, then CHF will be triggered.
With all of these models in mind it is important to note that the applicability of the
model may vary significantly with mass flux. Dilute sprays may appropriately be
considered mere extensions of discrete droplets. In these cases, evaporative effects may
dominate. The opposite extreme, with large mass flow, may create such a thick liquid
film that the process more closely resembles single-phase impinging jet flow. Between
these two extremes lies the complex mechanisms of spray boiling.
2.2.4. Spray Cooling Correlations
A number of correlations have been developed to predict the heat transfer of
sprays. Rybicki and Mudawar (2006) developed the following single-phase correlation
based on their own PF-5052 data and the water spray data of Mudawar and Valentine
(1989):
, (20) where the Nusselt and Reynolds numbers are defined in Eq. 21 and 22, respectively. (21)
32.061.0 Pr70.43232 ldd ReNu =
( ) linletwalld kTT
dqNu
−′′
= 3232

23
(22) They found that the correlation fit the data with an overall mean absolute error of 13.1%. Shedd and Pautsch (2005) developed a correlation for the heat transfer coefficient
based on energy transfer. For a single nozzle they gave the following equation:
(23)
where the units are h (W/cm2·K), ρl (kg/m3), cp,l (kJ/kg·K), Q ′′ (mL/s·cm2), and ∆Tsat (K).
Their correlation is based on summing a sensible heat contribution with a two-phase
contribution that is linearly proportional to the superheat. This is in part based on the
thermodynamic limits to heat transfer given in Eq. 19. This obviously simplified relation
captures two important effects: flow rate dependence and the linear effect of wall
temperature. However, most thermophysical properties are not included in Eq. 23, with
their effect being included in the constants. This correlation is probably only appropriate
over a limited range of flow rates, subcoolings, heater sizes. In fact, the authors had to
develop another correlation with an additional constant to fit their multiple-nozzle data.
A general CHF correlation for pressure and air-atomizing sprays was developed
by Chow et al. (1995). The maximum deviation of the seven datasets they used from the
correlation was ~30%.
(24)
Another CHF correlation was proposed by Mudawar and Estes (1996). They
varied the nozzle-to-surface distance and found that CHF was maximized when the spray
impact cone just inscribed the heater surface. With too short a nozzle spacing, droplet
impingement was limited to a small portion of the heater and CHF was lower.
l
ld
dQRe
µρ 32
32
′′=
4/12/13/1
322
38.0
′′=
′′′′
a
s
l
v
lfgl
CHF
PP
dQhQq
ρρ
ρσ
ρ
,01612.04627.0 , satlpl TQQch ∆′′+′′= ρ

24
Conversely, when the spacing was too large, much of the liquid was wasted due to
overspray. Based on these observations, they developed a correlation based on the
average volumetric flux over the spray impact area:
(25)
2.3. Nanofluids
The term nanofluid refers to heat transfer fluids developed by suspending
nanocrystalline particles in conventional liquids (Eastman et al., 1997). Two common
procedures for producing nanofluid include the dispersion of nanocrystalline powders and
evaporation of a precursor material that condenses directly into the base liquid. The
dispersion technique is particularly common since nanoparticle powders have for many
years been routinely created for traditional applications such as cosmetics, abrasives, and
coatings. However, nanoparticles are naturally unstable due to the reduction in Gibbs
free energy associated with coalescence and the loss of surface area (Friedlander, 2000).
Therefore, complicated and often proprietary additions to the base fluid are required to
maintain suspension. Even with these additives the suspensions are prone to settle due to
gravity, in the absence of other dispersive forces. Furthermore, particles will coagulate if
the suspension is vaporized or the dispersant is thermally degraded.
2.3.1. Thermal Conductivity Enhancement
Nanofluids have attracted much recent attention because of what many
researchers have called “anomalously high” thermal conductivity. Traditionally, the
( )[ ]
∆+
′′
+=
′′′′
−
fgv
sublpll
v
l
fgv
CHF
hTcdQ
Qhq
ρρ
σρ
ρρθθ
ρ,
35.032
23.03.0 0019.01)2/cos()2/cos(1467.1

25
Hamilton-Crosser (1962) equation† has been used to predict the thermal conductivity of
suspensions:
(26)
Equation 26 can be greatly simplified by making two assumptions. First, assume that the
particle has a much larger thermal conductivity than the base fluid (kparticle >> kbasefluid).
Then, Eq. 26 simplifies to:
(27) Then, making the dilute suspension assumption (φ << 1), the enhancement reduces to a
simple linear relation:
(28) The Hamilton-Crosser equation was verified for microscale particles but clearly includes
no dependence on particle size. Therefore, it could theoretically be applied to
nanoparticle suspensions. However, recent experimental work has shown that it often
underpredicts the thermal conductivity of nanofluids (Gandhi, 2007).
A number of investigators have used the transient hot-wire technique to determine
the thermal conductivity enhancement of nanofluid. In one such study, Eastman et al.
(1997) determined the thermal conductivity enhancement of the following nanofluids:
Al2O3/water, CuO/water, Cu/HE-200 oil, and Cu/Duo-seal oil (see Fig. 5). The water
based suspensions were found to have linear enhancements, but the enhancements were
† Note that the often cited Eq. 26 is based on Maxwell’s (1873) work on electricity and magnetism and
is only valid for spherical particles, or non-spherical particles when the conductivity ratio is not too large (kparticle/kbasefluid < 100). In fact, the majority of Hamilton and Crosser’s 1962 paper is about predicting the thermal conductivity of a mixture with non-spherical particles. In that case, the 3 and 2 in Eq. 26 should be replaced by n and n-1, respectively, where n is equal to 3 divided by the sphericity of the particle.
φ
φ
−−
++=
basefluidparticle
basefluidparticlebasefluid
suspension
kkkkk
k231
φφ
−+=
121
basefluid
suspension
kk
φ31+=basefluid
suspension
kk

26
greater than would be predicted by Hamilton-Crosser. The alumina and copper oxide,
respectively, enhanced the thermal conductivity by 2 times and 4 times as much as
predicted by the Hamilton-Crosser equation. The copper in oil enhancements were
similar in magnitude but were achieved with approximately 1/100th the volume fraction.
43% enhancement with 0.053 vol.% copper was reported. These results generated much
interest within the research community given the large enhancements at low volume
fractions.
Fig. 5. Thermal conductivity enhancements for various nanofluids (based on Eastman et al., 1997).
Eastman et al. (2001) measured the enhancement provided by copper
nanoparticles in ethylene glycol, which improved the thermal conductivity by up to 40%
with as little as 0.3 vol.%. This improvement was also larger than observed with CuO or

27
Al2O3 nanoparticles. They also found a slight sensitivity to sample age and were able to
significantly improve performance by adding thioglycolic acid as a stabilizing agent. In
another impressive study, Choi et al. (2001) investigated oil with suspended carbon
nanotubes, which had very high aspect ratios (~2000) and thermal conductivity (~2000
W/m·K). They found 160% enhancement with 1 vol.% of nanoparticles. They attributed
the anomalous improvement to layering or some other form of organization at the
solid/liquid interface.
Considering only the effect of the particle’s thermal conductivity one would be
driven toward high thermal conductivity materials such as diamond (k=2000 W/m·K).
Wang et al. (2002) tested the following nanofluids: diamond, Al2O3, and ZnO in oils and
ethylene glycol. Diamond suffered from poor suspendability and would not form a stable
suspension in transformer oil. They observed ~9% enhancement with diamond in typical
transformer oil, ~2% in ethylene glycol, but ~48% with a soy-based transformer oil.
Clearly, surface chemistry and suspension properties determine the enhancement more
than particle thermal conductivity. Wang et al. also reported enhancements ~12-20% for
metal oxides (Al2O3, CeO2, TiO2, CuO, Fe2O3, and ZnO) in ethylene glycol for volume
fractions of 4%. They attributed part of the enhancement to the Brownian motion of the
nanoparticles.
While there have been many other studies reporting thermal conductivity
enhancement (Wang et al., 1999; Chon et al. 2005; Yang et al. 2005; Ding et al., 2006;
Murshed et al., 2005; Murshed et al., 2006; Putnam et al., 2006; Han et al., 2007), there
exists no accepted theory to explain the experimental results. Uncovering the details
behind the thermal conductivity enhancement is beyond the scope of this thesis. This

28
work instead has focused on two-phase heat transfer and the unique properties of two-
phase systems using nanofluids.
2.3.2. Boiling of Nanofluids
Given the enhancement in thermal conductivity that has been observed, it was
natural to consider using nanofluid in a boiling heat transfer system. Boiling has been
studied for many years because of the high heat transfer rates that can be achieved at low
temperature difference. However, it remains poorly understood due to the many
parameters that affect the thermal performance. In particular, there is still no accepted
and verified model of the CHF phenomena. This lack of understanding of the
mechanisms responsible presents a significant challenge to modern research efforts aimed
at enhancing CHF. Furthermore, the lack of verified boiling models presents a specific
challenge to the interpretation of the numerous conflicting nanofluid boiling studies
reported to date.
While the term “nanofluid” is new, nucleate boiling of nanoparticle suspensions is
not. Over 20 years ago, Yang and Maa (1984) studied nucleate pool boiling with
suspensions of alumina micro or nanoparticles. It is interesting to note that they did not
call their suspension a “nanofluid” or even measure their particles in nanometers. They
studied “0.05, 0.3, and 1.0 µm” powders. They observed that the heat transfer coefficient
increased with the addition of particles, both micro and nano. The only possible
mechanism for enhancement cited though was a disturbance of the thermal boundary
layer by the motion of the particles.
More recent studies regarding nanofluid boiling has yielded contradictory results.
Das et al. (2003) studied boiling of alumina-water nanofluids on a 20 mm diameter

29
cartridge heater. They studied suspensions with alumina volume concentrations from
0.1% – 4%. The boiling curve was found to shift to the right as the nanoparticle
concentration was increased, meaning higher wall temperature for the same heat flux.
They showed that the nanofluid exhibited a significant viscosity increase along with its
thermal conductivity increase. However, they suggested that the deterioration in heat
transfer coefficient was due to a change in surface characteristics due to particles trapped
on the surface.
A group at the University of Texas, Arlington (You et al., 2003; Kim et al.,
2004a; Moreno et al., 2005) used water with various Al2O3 particle loadings in a flat plate
nucleate pool boiling system. They found little to no change in the heat transfer
coefficient but found dramatic improvement in CHF (see Fig. 6). You et al. (2003)
followed up their flat plate measurements with photographs of the same nanofluid but
this time boiling off a 390 µm diameter platinum wire. CHF was enhanced by 160% for
0.025 g/L particle loading. Surprisingly, bubbles grew much larger in the nanofluid
system and had a lower departure frequency. Moreno et al. (2005) increased the types of
nanofluids studied by including ZnO/water and Al2O3/water+ethylene glycol. All were
found to increase CHF, but high concentrations were also sometimes responsible for
nucleate boiling degradation. Additionally, they found no significant dependence on
particle size in the alumina/water data. Furthermore, the water/ethylene glycol based
nanofluid showed linearly decreasing enhancement as the volume fraction of ethylene
glycol was increased.

30
Fig. 6. CHF enhancement for alumina/water nanofluids (based on Moreno et al., 2005).
Vassalo et al. (2004) also studied pool boiling with 0.5 vol.% micro and nano-
solutions. They used 15 nm, 50 nm, and 3 µm silica particles in water on a 0.4 mm
diameter NiCr wire. All suspensions were observed to increase CHF by ~60%, but the
nucleate boiling regime was unaffected. However, the nanofluids had another interesting
effect in that they allowed the wire to continue into the transition and film boiling modes.
The pure fluid and micro-suspension resulted in wire failure immediately following CHF,
while the nanofluids resulted in heat fluxes almost 3 times that of pure water, albeit at
1000 °C. The authors observed that this may be due to silica coating the wire.
Bang and Chang (2005) investigated boiling of alumina-water nanofluids on
smooth, horizontal flat heaters. They observed a degradation in the heat transfer
coefficient in the natural convection and nucleate boiling regimes. CHF was enhanced by

31
51% with the heater in the horizontal configuration (1 vol.%), and 13% in the vertical
configuration (0.5 vol.% - 4 vol.%). They attributed the change in CHF to deposition of
the nanoparticles onto the surface and the following two effects. First, nucleation site
density is changed as the surface is smoothed (at least locally). Second, the particle
deposition causes a fouling effect resulting in poor conduction heat transfer at the surface.
The work of Das et al. (2003) and Bang and Chang (2005) was contradicted by
the work of Wen and Ding (2005) who used alumina/water nanofluids and observed
improved nucleate boiling heat transfer. The enhancement was up to ~40% at 1.25 wt.%.
They attributed the contradiction to the stability of their nanofluids. They did not observe
particle deposition on the surface, and they prepared their suspension without the use of
surfactants that are known to affect the boiling process.
Xue et al. (2006) used carbon nanotubes/water in a closed loop thermospyhon and
found that the suspension decreased boiling performance and increased the total thermal
resistance of the system. The surface tension of the suspension was found to increase
compared to water, which would have an effect opposite to that of adding a surfactant.
The increase in surface tension would be manifested in larger bubbles with decreased
departure frequency. This is consistent with the visual observations of You et al. (2003),
although the heat transfer result is opposite. Xue et al. went further by measuring the
contact angle of sessile drops. Interestingly, the nanofluids had much smaller contact
angles. This should improve boiling heat transfer (Liaw & Dhir, 1989; Kandlikar, 2001),
but this decreased contact angle was accompanied by a increase in contact line hysteresis
and greater susceptibility to surface imperfections.

32
The surface wettability modification was discussed by a group at MIT (Kim et al.,
2006a). They found that “nano-particle fouled” surfaces significantly improved
wettability as measured by the reduction in static contact angle. They suggested that the
buildup of a porous layer of nanoparticles on the heated surface during boiling improved
surface wettability and promoted liquid rewetting. This they suggested could explain the
enhancement in CHF observed by numerous researchers.
This mechanism was specifically probed by the Pohang University (Korea) group
of Kim et al. (2006b) during their investigation of titania-water and alumina-water
nanofluids on a 0.2 mm diameter NiCr wire. They used particle volume concentrations
from 10-5% to 10-1% and observed CHF to increase with nanoparticle concentration.
CHF was enhanced by up to 100% when nanofluids were boiled on a bare wire.
Scanning electron micrograph pictures taken of the heater surface after boiling revealed
that the surface was covered by nanoparticles. Interestingly, when the nanofluid was
drained from the chamber and pure water was boiled on the nanoparticle coated wire,
CHF was increased up to 2.75 times the baseline. This clearly demonstrated that
nanofluids were increasing CHF through surface modification. Furthermore, they
demonstrated that nanofluids could actually be worse than pure fluids given the
appropriate surface treatment.
The literature cited above presents many contradictions with some groups
reporting enhancement and other degradation. Table 4 summarizes the findings of these
studies.

33
Tabl
e 4.
Sum
mar
y of
nan
oflu
id b
oilin
g st
udie
s. St
udy
Part
icle
Siz
e [n
m]
Part
icle
C
once
ntra
tion
Part
icle
T
ype
Bas
e Fl
uid
Hea
ter
Surf
ace
Nuc
leat
e B
oilin
g
CH
F
Yan
g &
Maa
, 19
84
50, 3
00, 1
000
1 w
t.%
Al 2O
3 W
ater
St
ainl
ess s
teel
tube
Im
prov
ed
-
Das
et a
l., 2
003
38
0.1
– 4
vol.%
A
l 2O3
Wat
er
Cyl
indr
ical
car
tridg
e he
ater
D
egra
ded
-
You
et a
l., 2
003
“nan
opar
ticle
s”
0.00
1 –
0.05
g/L
A
l 2O3
Wat
er
Cu
plat
e, P
t wire
U
ncha
nged
Impr
oved
K
im e
t al.,
200
4a
32
0.00
1 –
0.05
g/L
A
l 2O3
Wat
er
Cu
plat
e, P
t wire
U
ncha
nged
Impr
oved
V
assa
lo e
t al.,
20
04
15, 5
0, 3
000
0.5
vol.%
Si
O2
Wat
er
NiC
r wire
U
ncha
nged
Impr
oved
Ban
g &
Cha
ng,
2005
47
0.
5 –
4 vo
l.%
Al 2O
3 W
ater
H
oriz
onta
l & v
ertic
al
plan
es
Deg
rade
d Im
prov
ed
Wen
& D
ing,
20
05
168
0.32
– 1
.25w
t.%
Al 2O
3 W
ater
St
ainl
ess s
teel
pla
te
Impr
oved
-
Mor
eno
et a
l.,
2005
69
, 139
, 224
, 34
6 (A
l 2O3)
24
– 7
1 (Z
nO)
0.1
– 0.
5 g/
L (A
l 2O3)
0.
001
– 0.
5 g/
L (Z
nO)
Al 2O
3 Zn
O
Wat
er,
Wat
er/E
thyl
ene
Gly
col
Cu
plat
e U
ncha
nged
or
D
egra
ded
Impr
oved
Xue
et a
l., 2
006
15 x
10,
000
1 vo
l.%
CN
T W
ater
C
u th
erm
osyp
hon
Deg
rade
d -
Kim
et a
l.,
2006
b “n
anop
artic
les”
0.
0000
1 –
0.1v
ol %
A
l 2O3
TiO
2 W
ater
N
iCr w
ire
- Im
prov
ed
(Pur
e w
ater
als
o im
prov
ed
CH
F on
na
nofo
uled
su
rfac
e)
34
2.4. Extended Structures
Surface enhancement in the form of surface roughening, pore creation, or
extended surfaces has long been known to be an effective way of increasing thermal
performance of nucleate boiling systems. Kurihara and Myers (1960) showed that
roughening of the surface resulted in increased nucleation site density, which results in
greater bubble agitation and increased latent heat transport. Others have extended this
technique by creating porous structures on the heater surface. Nakayama et al. (1980,
1982) created interconnected internal cavities consisting of microscale tunnels and pores.
Using R-11, water, and nitrogen they found that 80 – 90% less wall superheat was
required to transfer the same heat load due to liquid being sucked into the surface and
subsequent evaporation inside the tunnel. This technique of providing interconnected
pores was extended by adding stacked layers of microporous structures to form an
extended surface (Nakayama et al., 1984; Ramaswamy et al., 2003), which increases the
total heat transfer by increasing the area available. This is an effective method of
improving performance for electronics applications, since large heat loads (over 100 W
with FC-72) are removed from the small projected area of the chip. Mudawar and
Anderson (1993) studied more fin-like extended surfaces using microgrooves, square
microstuds, and pin fin arrays. These structures improved the total heat transfer up to
159 W/cm2 on a projected area basis compared to ~20 W/cm2 with a bare surface.
Spray cooling an extended surface might also dramatically improve thermal
performance, however the analysis will be further complicated. Add to the inherent
complexity of an extended surface with nucleate boiling the addition of radially and
axially varying mass flux, droplet size and velocity distribution, shading of parts of the

35
surface from impinging drops, liquid pooling in parts the structure, capillary effects,
splashing, hot vapor condensing on incoming droplets, thin film evaporation, mixing and
possible secondary nucleation caused by incoming drops. Furthermore, with all of these
phenomena in concert, the system is likely to exhibit different boiling regimes on
different parts of the heater. Despite the daunting complexity, spray cooling of extended
surfaces has garnered some attention.
Sodtke and Stephan (2005) used water to spray cool a porous surface as well as
ones with triangular microgrooves and micro pyramids (width = pitch = 150µm, height =
75µm). They found no improvement with the microporous structure. However, with
microgrooves and micro pyramids they observed a 2 – 5 fold enhancement when the
superheat exceeded 6 °C and no enhancement at lower superheats. They posited that the
higher superheat ruptures the liquid film, allowing capillary forces to distribute a thin
film equally between the fin troughs and tips.
Other investigations have shown the potential of extended surfaces to transfer as
much as 50% more heat than comparable flat surfaces. Silk et al. (2004, 2005, 2006)
investigated spraying gassy (1 atm) PF-5060 on a flat surface and enhanced surfaces
including straight fins, square pin fins, and pyramidal fins. All of their enhanced surfaces
improved performance in the nucleate boiling regime and significantly increased the
critical heat flux. Surprisingly, they also found that straight fins outperformed the other
two types of surface enhancements, despite the fact that the straight and pin fins had the
same areas and the straight fins would have a larger conduction resistance. In fact, the
pyramidal fins showed the worst performance despite being designed to account for the
conduction resistance. This lead the authors to speculate that the enhancement was due

36
to channeling of the liquid into the space between the fins, resulting in much higher CHF.
Silk et al. (2006) noted that since the fin width and pitch were held constant, the pin fins
had twice the drainage area of the straight fins, which results in half the liquid velocity.
This higher velocity with the straight fins could have resulted in a higher heat transfer
coefficient in the channels.

37
CHAPTER 3. EXPERIMENTAL SETUP AND METHODOLOGY
Numerous experiments were designed and constructed to study nanofluids and
extended surfaces. In particular, the nanofluid studies required multiple experimental
setups as the effect of liquid/surface interaction in pool boiling was investigated. The
various experimental apparatuses, procedures, and methodologies used in these studies
are described below.
3.1. Nanofluids Boiling and Spray Cooling Setups The experimental investigation of nanofluids boiling and spray cooling required
the use of various heated surfaces. Two basic heater assemblies were used: a thick-film
resistive heater and a copper block heater. These experiments shared a common chamber
and much of the associated instrumentation but required different data acquisition and
control. The common elements are discussed below, while the unique elements of the
two different systems are discussed later in their own sub-sections.
3.1.1. Nanofluids Test Rig
The stainless steel boiling and spray chamber is shown in Fig. 7. The rig
consisted of two 20.3 cm (8 in.) diameter ConFlat® flanges. The upper flange (33.3 cm
long full nipple) housed a copper condensing coil. The lower flange (4-way reducing
cross) housed the boiling surface (not visible). The four ports of the bottom flange
allowed for two view ports, connection to the upper flange, and a bottom port that
facilitated the insertion of various test surfaces.

38
Fig. 7. Test rig.
The copper condensing coil (6.35 mm OD, 4.4 mm ID, ~7.5 m long) was cooled
by chilled (15 ± 0.2 °C) water provided by a constant temperature bath (NESLAB
RTE17). The 475 ± 11 mL/min flow of the chilled water was measured with a turbine
flow meter (Omega FLR1009BR). Chamber pressure was measured using a 0 – 2 atm
thin-film pressure transducer (Omega PX212-030AV). Chamber temperature was
measured with a Type K thermocouple probe. The chamber temperature was controlled
by a proportional integral derivative (PID) temperature controller along with Kapton
surface heaters that were attached to the outside walls of the lower flange.
Condensing section
View ports
Chamber heaters
Pressure transducers
Fill port
Drain
Boiling section
Chilled water outlet
Chilled water inlet

39
Boiling movies were recorded with a high speed digital camera (Vision Research
Phantom V4) capable of 512 x 512 pixel resolution at 1000 frames per second. A Sigma
50 mm macro lens was used, and light was provided by a 300 W projection lamp.
3.1.2. Thick-film Resistive Heater
The first heater assembly (Fig. 8) used for nanofluid boiling and spray cooling
was based on a thick-film resistor. An 18 Ω ruthenium-based thick-film resistor on an
alumina substrate was obtained from Mini-systems, Inc. The heater was fixed to the G-
10 substrate using electronic grade silicone (GE RTV162). The average surface
temperature was measured with a surface mount, platinum resistance temperature
detector (RTD) (Omega Engineering SRTD-2) that was bonded with heat sink compound
to the backside of the heater. To ensure good thermal contact between the heater and the
RTD, the heater was pressed against the RTD by aluminum plates (with silicone sealant
between to insulate the heater). This assembly was then placed on a two-axis traverse
that was mounted to the bottom flange of the chamber.
Fig. 8. Thick-film resistor assembly (Courtesy of Alexander Walzenbach).

40
The thick-film heater was supplied with a glass topcoat. The bond pads of the
resistor were covered with a layer of silicone to prevent boiling and maintain a uniform
boiling surface at the center of the resistor. With only the glass exposed, the surface area
was 0.93 ± 0.02 cm2. This heater was subsequently coated with 100 nm of gold through
an evaporative physical vapor deposition process. The gold surface decreased the surface
energy of the boiling surface, which was done as the first step in the study of surface
wettability effects.
The data acquisition (DAQ) and control of the thick-film resistor experiments are
shown schematically in Fig. 9. A Fluke Hydra Data Acquisition Unit logged data from
all thermocouples as well as recorded the flow rate of the spray, chamber pressure, RTD
resistance, and heater supply voltage. Data was then transferred though a general
programming interface bus (GPIB) data link (ICS Electronics 488-USB) to a laptop
computer. A custom MATLAB program (DAQ_menu2.m) was developed to save the
results and chart the data as it was acquired (see Appendix B).

41
Fig. 9. Data acquisition and control diagram for thick-film resistor heater.
An important component of the DAQ/control system was the burnout control
circuit (Fig. 10). The small mass (0.4 g) of the alumina substrate resistor would have
made the resistor highly susceptible to burnout post CHF. A Wheatstone bridge circuit
(Fig. 11) was designed to prevent burnout of the heater post CHF by cutting off power.
The theory behind the circuit’s operation is as follows. At room temperature, the heater
resistance was nominally 18 Ω. However, as the heater increased in temperature, its
resistance increased according to Eq. 29:
, (29)
where α is the linear temperature coefficient of resistance. When the heater resistance
reached ~18.3 Ω the bridge became balanced. At this point, the comparator (LTC1150)
Turbine Flow Meter
Pressure Transducer
RTD
Chamber Temp.
Spray Temp.
Temperature Controller
Chamber Wall Heater
Fluke Hydra DAQ
GPIB Datalink
Burnout Control Circ.
Thick-film Heater
Power Supply
( )TRTR ∆+= α1)( 0

42
sensed the balancing of the bridge and output a signal to open two redundant mechanical
relays (Struthers Dunn 219BBX-P), cutting off power to the heater.
Fig. 10. Wheatstone bridge circuit to prevent burnout of the thick-film resistor.
Fig. 11. Wheatstone bridge circuit schematic. 3.1.3. Copper Block Heater
For the experiments using a copper or copper oxide surface, heat was provided by
two 250 W cartridge heaters embedded within an oxygen free high conductivity (OFHC)
copper heating block (Fig. 12). This block was then inserted through a stainless steel
plate, which was sealed by two #16 Viton o-rings. The stainless plate was then bolted to
the bottom flange of the boiling chamber and sealed with a 1.6 mm (1/16th inch) neoprene
Rheater 183k
1k0.1
Relay Relay
Comparator
Vi

43
flat gasket. The heater block featured a neck with a circular cross-section that terminated
with a polished surface on which the boiling occurred. The neck of the heating block
contained holes (1 mm diameter, 1 cm deep) for four thermocouples spaced 1 cm apart
along its length.
Fig. 12. Copper heating block and stainless steel sealing plate.
The horizontal boiling surface was 2 cm2 and was polished using emery paper up
to 1200 grit, which provided a mirror-like finish. However, a thin region above the o-
rings and around the perimeter was also wetted, which increased the total wetted area to
2.7 cm2. Baseline, unoxidized, surfaces were created by using a cotton swab to wipe the
surface with dilute nitric acid (1 M HNO3), which removed the oxidation†. Various
levels of surface oxidation were then systematically created by heating the copper heating
block in air.
To oxidize the surface, the copper block was separated from the stainless steel
sealing plate and instrumented with thermocouples and cartridge heaters. This assembly
† Dilute nitric acid reacts with copper oxide according to the following balanced chemical equation: CuO + 2HNO3 → Cu(NO3)2 + H2O. This reaction reduces the oxide and renders the copper into the aqueous solution. Note that elemental copper reacts similarly with dilute nitric acid: 3Cu + 8HNO3 → 3Cu(NO3)2 + 2NO + 4H2O (Battey et al., 1988).
o-ring groove
thermocouple holes
cartridge heater holes

44
was then placed on fiberglass insulation. The ramp function of a PID controller was then
used to linearly increase the temperature of the block from room temperature to the
desired temperature at a rate of 5 K/min. Dwell times of 32 to 132 minutes were used to
get the desired oxidation (see Table 5), then the power was cut off and the block was
allowed to cool through free convection. The temperature of the block was recorded
approximately every 6 seconds by a Fluke Hydra Data Acquisition Unit. A typical
temperature history is shown Fig. 13. This oxidation process produced surfaces with
similar microstructure yet variable contact angle (the contact angle measurements are
described later in this chapter).
Fig. 13. Typical temperature history of the copper block during the oxidation process.
Dwell time
Ramp heating
Cool down

45
Table 5. Oxidation parameters used to increase the surface energy. Relative Degree of Oxidation Tpeak [°C] tdwell [min]
Light 200 33 Medium/light 234 32
Medium 253 61 Heavy 281 132
The data acquisition and control used for the copper block heater experiments are
shown schematically in Fig. 14. The cartridge heaters within the copper heating block
were powered with a variable voltage level set by the operator and regulated by a variable
transformer. Cutoff of power to the heaters to prevent burnout was controlled by two
redundant On/Off temperature controllers with temperature input from the two
thermocouples that were farthest from the heaters (i.e., nearest the boiling surface). The
Fluke Hydra Data Acquisition Unit logged data from all thermocouples as well as
recorded the flow through the condenser, chamber pressure, and heater supply voltage.
Data was then transferred though the general programming interface bus data link to a
laptop computer. A custom MATLAB program (DAQ_menu4.m) was developed to save
the results and chart the data as it was acquired (see Appendix B).
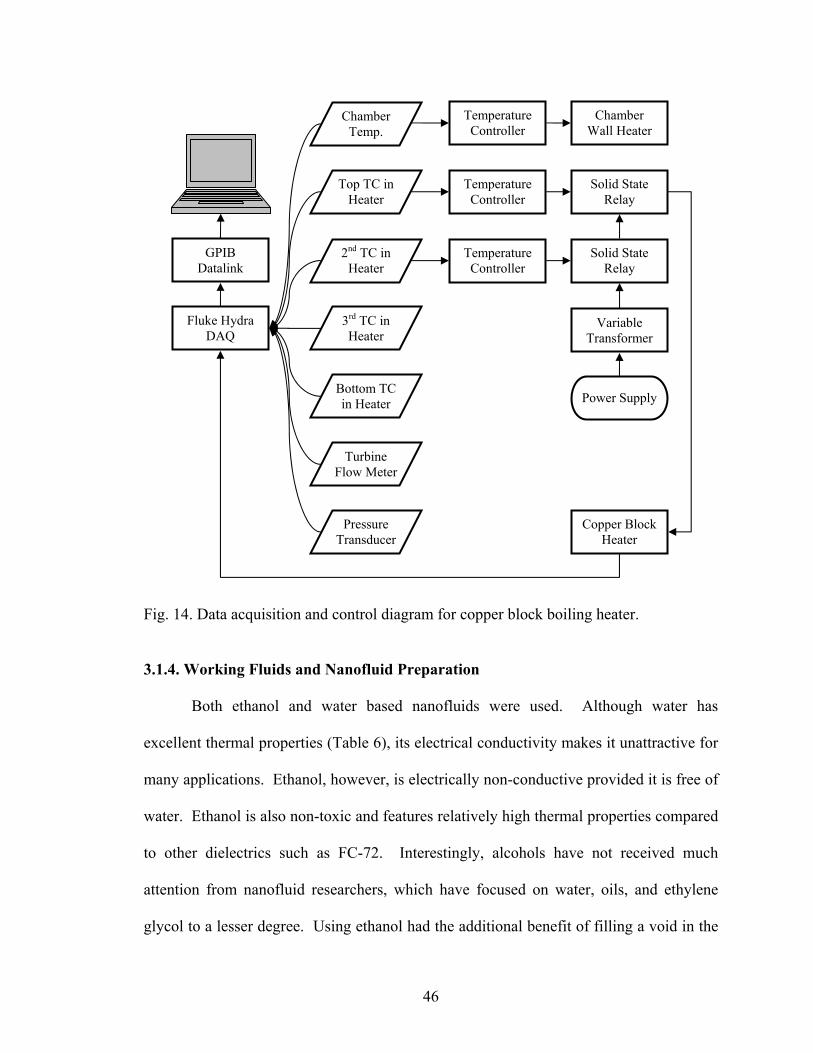
46
Fig. 14. Data acquisition and control diagram for copper block boiling heater.
3.1.4. Working Fluids and Nanofluid Preparation
Both ethanol and water based nanofluids were used. Although water has
excellent thermal properties (Table 6), its electrical conductivity makes it unattractive for
many applications. Ethanol, however, is electrically non-conductive provided it is free of
water. Ethanol is also non-toxic and features relatively high thermal properties compared
to other dielectrics such as FC-72. Interestingly, alcohols have not received much
attention from nanofluid researchers, which have focused on water, oils, and ethylene
glycol to a lesser degree. Using ethanol had the additional benefit of filling a void in the
Turbine Flow Meter
Pressure Transducer
Bottom TC in Heater
2nd TC in Heater
3rd TC in Heater
Temperature Controller
Solid State Relay
Fluke Hydra DAQ
GPIB Datalink
Variable Transformer
Copper Block Heater
Power Supply
Chamber Temp.
Top TC in Heater
Temperature Controller
Solid State Relay
Temperature Controller
Chamber Wall Heater

47
literature concerning nanofluid boiling since nearly all studies reported have been
performed with water based nanofluids.
Table 6. Thermal properties at saturation (P=101325 Pa) (* Incropera & DeWitt, 1996;
** 3M, 2000; † Dillion & Penoncello, 2003; ‡ Yaws, 1999). Property Water* Ethanol FC-72** Tsat [°C] 100 78 † 56 Latent heat of vaporization [kJ/kg] 2257 849 † 88 Liquid thermal conductivity [W/m·K] 0.680 0.216 ‡ 0.054 Liquid specific heat [kJ/kg] 4.217 3.130 † 1.101 Liquid dynamic viscosity [N·s/m2] 0.000279 0.000448 ‡ 0.00043 Molecular weight [g/mol] 18.02 46.07 338
Two concentrated nanofluid suspensions were obtained from Nanophase
Technologies Inc.: a 30.84 wt.% alumina-in-ethanol suspension, and a 49.5 wt.%
alumina-in-water suspension. The surface area average diameter and specific surface
area of these particles were given by the manufacturer to be 45 nm and 35 m2/g,
respectively (Nanophase Technologies Inc., 2003).
The ethanol based nanofluid was diluted to a variety of concentrations ranging
from 0.001 g/L to 10.07 g/L. Figure 15 shows some of the suspensions used. The
concentrated suspension provided by the manufacturer was vigorously shaken and then
small samples were extracted to be added to 200 proof ethanol (99.98 vol.% ethanol, 0.02
vol.% water). Volume fraction, mass fraction, and concentration were calculated using
Eqs. 30 - 32.
(30) (31) (32)
−
−−=
32
32
321
OAlliquidpure
OAlmixOAl ρρ
ρρφ
32
32
32 OAlmix
OAlOAly φ
ρρ
=
323232 OAlOAlOAlc φρ=

48
Fig. 15. Alumina-in-ethanol nanofluid samples (from left to right: 200 proof ethanol, 0.005 g/L, 0.01 g/L, 0.05 g/L, 0.1 g/L, 0.5 g/L, and 30.84 wt.%).
The water based nanofluids were prepared by using a pipette to extract 10 mL of
the concentrated solution provided by the manufacturer. Fluid was drawn from the
middle of the concentrated sample to obtain suspended particles rather than those that had
coagulated and settled. The solution was then weighed to determine the density, ρmix, of
the sample to be used. Then, the volume fraction, mass fraction, and concentration were
calculated using Eqs. 30 - 32, respectively. This suspension was then diluted with
distilled water to concentrations of 0.026 g/L to 1.02 g/L.
3.1.5. Test Conditions
Nanofluids were used in both boiling and spray cooling systems. Boiling was
tested on four different surfaces with two different base working fluids at concentrations
ranging across five orders of magnitude. The test matrix for nanofluid boiling is shown
in Fig. 16.

49
Fig. 16. Experimental test matrix for nanofluid boiling studies.
Boiling experiments were conducted with reduced pressure under saturated and
subcooled conditions. The system pressure was reduced prior to each experiment by
repeatedly pulling a partial vacuum on the liquid. For the subcooled experiments,
dissolved gas (air) remained in the working fluid. In the thick-film heater experiments,
the pool temperature was maintained at 30.6 ± 0.5 ° C, while the saturation temperature
was 51.7 ± 0.4 °C. With the copper block heater, the pool temperature was maintained at
28.8 ± 0.3°C (with ethanol) or 29.3 ± 0.7°C (with water). These experiments were run at
near saturated conditions with a saturation temperature of 28.9 ± 1.0°C (with ethanol) or
29.8 ± 0.7°C (with water).
Pure
ba
se fl
uid
0.01
g/L
1 g/
L
0.1
g/L
CuO 0.
001
g/L
Cu
Au
SiO2
Alumina/Ethanol Alumina/Water
10 g
/L
Surf
aces
Concentrations

50
Spray cooling experiments were conducted at two different nozzle pressure
differences and four different concentrations. With a nozzle pressure difference of 69
kPa (10 psi), the flow rate was 18 ± 1 mL/min. For a higher flow rate and better
atomization, a nozzle pressure difference of 345 kPa (50 psi) was also used: the flow rate
was 52 ± 1 mL/min. The nozzle-to-heater distance was 10.1 ± 0.5 mm. The saturation
and spray temperature were 51.7 ± 0.4 °C and 30.5 ± 0.3 °C, respectively. In all cases,
ethanol based nanofluids were used on a glass substrate. Nanofluid concentrations
ranged from 0.001 g/L – 0.5 g/L.
3.2. Contact Angle Measurements
To determine the effect of surface wettability on nanofluid boiling, the contact
angle needed to be quantified. As discussed in Appendix A, the advancing contact angle
is much larger than the receding angle† and is easier to measure accurately. Both angles
are also affected by the liquid’s affinity for the solid surface, and, therefore, only the
advancing contact angle was measured in the present work as an indication of the
wettability of the surface. An advancing contact angle was created by dispensing liquid
onto a horizontal surface. A screw driven syringe pump (Harvard Apparatus PHD 2000)
was used to infuse liquid onto the surface at a constant rate resulting in a gradually
growing liquid droplet. The infusion pump setup is shown schematically in Fig. 17.
Liquid was delivered at a rate of 0.125 mL/min through a 305 µm ID microneedle. The
measurements were made in an open environment and at room temperature.
† In one case, the receding angle for water on copper was measured to be ~10° – 20° compared to the
advancing angle of ~90°.

51
Fig. 17. Infusion pump setup.
Two different photographic techniques were used to record the advancing droplet.
A series of high resolution (3008 x 2000 pixels) digital still photographs were captured by
a Nikon D50 camera with a Sigma 50 mm macro lens. Photographs were taken with a
shutter speed of 1/5th of a second, allowing the aperture to be minimized and the depth of
field to be maximized. Using delayed shutter release (2 s), camera shake was minimized
and the resulting photographs were sufficiently sharp for image analysis. A typical
photograph is shown in Fig. 18. Movies were also recorded using a digital video camera
(Vision Research Phantom V4) and the above lens.
Fig. 18. Advancing water droplet on a copper surface.
Copper block
60 mL syringe

52
3.2.1. Contact Angle Measurement Algorithm
Contact angles were then measured from the digital still photographs using the
following algorithm implemented in MATLAB (see Appendix B):
1. Convert the image to grayscale.
2. Perform edge detection using the Canny (1986) method, which finds local
maxima in the gradient of the image.
3. Choose six points along the droplet/air interface and one on the horizontal
heater surface.
4. Fit an ellipse through the points on the droplet/air interface using the Halif and
Flusser (1998) method.
5. Calculate the tangent at the intersection between this ellipse and the
horizontal.
6. Determine the contact angle from the inverse tangent.
Fig. 19 illustrates the edges of the image detected using the above algorithm.
After zooming in on the digital image, points were selected along the interface and the
curve fitting was performed. The resulting curve fit and tangent determination that
followed are shown in Fig. 20.

53
Fig. 19. Results of edge detection on the image of an advancing water droplet.
Fig. 20. Curve fitting results (the two other points on the interface are on the other side of the droplet). 3.3. High Aspect Ratio Open Microchannel Spray Cooling Experiments
To elucidate the mechanisms behind spray cooling extended structures, a series of
experiments involving high aspect ratio open microchannels was performed. The
experimental apparatus, data acquisition and control, as well as the test conditions used
are described below.

54
3.3.1. Test Rig
A schematic diagram of the experimental setup and flow loop is shown in Fig. 21.
A spray chamber was formed by attaching polycarbonate discs to a large diameter acrylic
tube. The top plate included feedthroughs for the nozzle and a condensing coil. A brass
spray nozzle from Isothermal Systems Research (ISR) was insulated with 5 mm of
neoprene to minimize temperature increases due to vapor condensation on the nozzle
housing. The copper coil (with 30°C water flowing inside) provided the primary
condensation location. The chamber base featured a drain and another opening which
allowed the insertion of the test surfaces. Each test surface was surrounded by ceramic
insulation (OD=10 cm, 6 mm thick, Cotronics 914 machinable glass ceramic), which was
sealed to the chamber base with a neoprene o-ring.
Fig. 21. Experimental setup for microchannel spray cooling.

55
3.3.2. Heater Assembly
Heat was provided by two 250 W cartridge heaters (0.635 cm OD, 3.8 cm long)
embedded within an OFHC copper heating block. The top of the heating block featured a
female threaded hole into which different heating necks could be screwed (see Fig. 22).
The necks were surrounded by air, which provided sufficient insulation to effectively
create a one-dimensional heat flux along their axes. This was verified by the
measurement of a linear temperature gradient along their length. This heat flux and the
wall temperature were measured with a sheathed thermocouple probe (type K) that was
dry-fit into each of four close-fit holes (1.2 mm-diameter, 7.1 mm deep, 10 mm
separation) located in the heating necks. Heat losses from the thermocouple probes were
negligible due to the small diameter and low thermal conductivity of the probe†. Heat
losses from the neck in the instrumented region were also negligible, as indicated by the
good agreement between the electric power input (after accounting for losses from the
base) and the heat flux calculated using one-dimensional conduction through the neck of
the heater–see Chapter 4 for further details.
† A 1-D finite difference fin analysis of the thermocouple probe was performed in which the free
convection from the probe was modeled using Morgan’s (1975) long horizontal cylinder correlation. For a heat flux of 100 W/cm2 and wall temperature of 87.5 °C, the heat loss due to the probes was found to be ~0.25% of the 1-D heat flux attributed to the spray.

56
Fig. 22. Heating block assembly (Courtesy of William Michie).
Six different heaters with 1.41 × 1.41 cm2 profiles were used. Square rather than
circular profiles were used to better simulate the cooling of an electronic device. One
heater featured a simple flat surface for baseline comparisons. Five heaters featured
electric discharge machined (EDM) straight fins with a channel width (C) of 360 µm; fin
width (W) of 500 µm; and fins lengths (L) of 0.25 mm, 0.50 mm, 1.0 mm, 3.0 mm, and
5.0 mm (see Table 7 and Fig. 23). These heaters were then bonded to the ceramic
insulation described above using an electronic grade silicone (GE RTV162).
Table 7. Channel aspect ratio and surface areas of test surfaces.
Fin Length (L) [mm]
Channel Aspect Ratio (L/C)
Total Surface Area [mm2] Area Enhancement
0 - 200 1 0.25 0.7 320 1.6 0.5 1.4 440 2.2 1 2.8 681 3.4 3 8.3 1642 8.2 5 13.9 2604 13

57
Fig. 23. Heater necks with 5 mm (left) and 1 mm (right) long fins. 3.3.3. Working Fluid and Spray Characteristics
PF-5060 (3M performance fluid composed of perfluoro compounds with
primarily 6 carbons) was chosen as the working fluid because its chemical stability and
dielectric nature make it suitable for direct cooling of electronics. Furthermore, its
boiling point of 56°C at 1 atm is low enough to allow for two-phase cooling at a
temperature that is appropriate for high reliability electronics. Note that PF-5060 is
essentially a less pure (and less costly) form of 3M’s FC-72. According to their
datasheets, their thermal properties are the same (3M, 2000 & 2003).
Flow was provided by a magnetically coupled gear pump (Cole Palmer 75211-
10), and the flow rate through the nozzle was measured with a digital turbine flow meter
(Omega FLR1000BR). The working fluid was filtered using a 2 µm borosilicate glass
filter. The pressure immediately upstream of the nozzle housing was measured with a
Bourdon tube gauge (Omega PGS-25L-160). The chamber pressure was maintained at
one atmosphere through use of a vent on the fluid reservoir. The fluid was not degassed

58
and had a dissolved gas concentration that was estimated using Henry’s Law for ideal
solutions:
(33) where H is Henry’s constant, 0.005438 atm-1 for FC-72 (You, 1990). With Eq. 33, the
gas concentration, cgas, was estimated to be 3420 ppm. Nozzle pressure differences
ranged from 138 kPa – 413 kPa (20 – 60 psig).
The upstream spray temperature was measured with a type T thermocouple inside
the nozzle housing body. The temperature directly upstream of the nozzle was 30.4 ±
0.9°C. The temperature of the droplets actually striking the heater was measured with
four separate downstream thermocouples (OD=500 µm) that were placed within and
around the spray cone. Repeated trials indicated that the addition of the downstream
thermocouples had a negligible impact on thermal performance, and therefore they were
included in all data presented in this work. Although the upstream spray temperature,
copper cooling coil, and external heat exchanger were all maintained at nominally 30 °C,
hot spent gas leaving the heated surface resulted in an increase in the downstream
temperature. The downstream temperature ranged from 30.6 °C (for the bare surface at
its lowest heat flux) to 40.8 °C (for the 3 mm long fins at its highest spray efficiency).
This downstream thermocouple within the spray cone was considered the most accurate
measure of the average spray temperature and was used in all calculations below.
A nominally full cone spray nozzle was used. This pressure atomizing nozzle had
an orifice diameter of 404 ± 14 µm. The nozzle was fixed 18 ± 1 mm above the heated
wall (i.e. the base of the fins for the finned surfaces), which resulted in a spray that
appeared to approximately inscribe the square test surface at the smooth-wall elevation.
( ) ,satTgas PPHc −=

59
The nominal flow rate through the nozzle ranged from 69 - 123 ± 1 mL/min, however the
amount of fluid incident on the test surface was less due to some overspray. Since the
nozzle height was fixed with respect to the heated wall, the incident flux on the top of the
fins increased with fin length due to decreased overspray (Fig. 24).
Fig. 24. Illustration of overspray and incident flux increasing with fin length.
The amount of fluid incident on the top of the fins was measured by removing the
heaters and replacing them with rapid prototyped collection funnels that were shaped as
hollow, truncated, square pyramids. The top lip of the funnel was placed at the same
height as the upper surface of the finned heat sinks and featured a 2 cm2 opening that
allowed incident fluid to be collected into a graduated cylinder. The collection system
(Fig. 25) was sealed from the ambient and vented to the spray chamber to prevent
evaporation. The amount of fluid incident on each of the heat sinks is given in Table 8.
18 mm

60
Fig. 25. Incident flow measurement system.
Table 8. Fluid flow rate incident on top surface of heat sinks. Fin Length
[mm] Fraction of Total Flow Rate
Incident on Top Surface (±0.02) 0 0.75
0.25 0.76 0.5 0.77 1 0.78 3 0.85 5 0.91
The Sauter mean diameter (SMD) of the droplets was estimated using the
correlation of Estes and Mudawar (1995), Eq. 15. The SMD varied from 54 to 72 µm
over the range of pressures used. The droplet breakup velocity was estimated using
Ghodbane and Holman’s (1991) expression, Eq. 18, and was found to range from 13 to
22 m/s.
3.3.4. Data Acquisition and Control
Data acquisition and heating control (Fig. 26) were provided by a custom Visual
C++ program implemented through a general programming interface bus (GPIB) on a

61
Pentium III personal computer. An HP6675A DC power supply provided a controllable
power source, while a Fluke Hydra Data Acquisition Unit acquired data every six
seconds. Power was initially set at 30 W and thermocouple temperatures were monitored
to determine when steady state occurred. Once the time- and space-averaged temperature
in the heater neck changed by less than 0.1°C over a 60 second period, 60 seconds of
steady-state data were recorded. Power was then incremented by 10 W, and system
monitoring resumed. Experiments were concluded when the temperature of the heating
block (monitored with two separate thermocouple probes) reached a temperature limit of
260°C, set to ensure safe operation of the test apparatus or when the surface temperature
increased rapidly indicating CHF.

62
Fig. 26. Data acquisition and control diagram for microchannel spray cooling.
Over Temp. Cutoff TC
Over Temp. TC #2
Bottom TC in Heater
2nd TC in Heater
3rd TC in Heater
Fluke Hydra DAQ
Copper Block Heaters
Power Supply
Spray Temp.
Top TC in Heater
Temperature Controller
Reservoir Heater
Reservoir Temp.
Turbine Flow Meter
Pressure Transducer

63
CHAPTER 4. UNCERTAINTY AND DATA ANALYSIS The majority of the quantitative results of this dissertation are spray cooling and
boiling curves. This chapter, therefore, describes the methods used to calculate heat flux
and surface temperatures. The uncertainties in these calculations were estimated using
both standard propagation of uncertainty techniques and Monte Carlo methods (the basics
of this method are described in Appendix C). Furthermore, finite element models were
developed to investigate heat losses and verify the validity of the heat flux calculations.
Finally, this chapter reviews the methods used to determine the uncertainty of the contact
angle measurements. Unless otherwise noted, all error bars shown in figures are based on
twice the standard deviation (i.e., 95.5% confidence).
4.1. Thick-film Resistive Heater
The power dissipation of the thick-film resistor was obtained by dividing the
square of the measured voltage drop by the resistance. The error in the heat flux was then
calculated using the standard propagation of uncertainty technique (Lyons, 1996):
(34) Errors in heat flux were found to be 4% (with 95% confidence), due in large part to the
error in the exposed heater area.
The average temperature of the boiling surface was measured by an RTD bonded
to the backside of the heater. The RTD had approximately the same area as the heater.
Furthermore, the relatively high thermal conductivity of the alumina substrate (k=36
W/m·K) and the insulation provided by the G-10 base (k=0.25 W/m·K) ensured that there
was negligible temperature difference between the front and backside of the heater. The
2
2
22
2
222
+
+
=′′ ARVq
RAV
ARV
RAV σσσσ

64
RTD was calibrated with a NIST traceable liquid-in-glass mercury thermometer
producing a linear calibration curve. To estimate the errors in RTD measurements, a
two-part Monte Carlo simulation was used (this was an extension of the basic method
described in Appendix C).
The first step in the simulation process involved simulating the calibration. The
actual calibration involved 5 separate measurements of resistance and temperature. For
each iteration of the simulation, 5 sets of random measurements (resistance and
temperature) were used to create a linear calibration curve. The inputs were based on the
nominal values (recorded during the calibration) plus random normally distributed errors
(based on DAQ accuracy and thermometer reading error)†. Running 10,000 iterations
produced the statistical equivalent of calibrating 10,000 times. This yielded 10,000 pairs
of coefficients (constant and linear terms).
In the second step, the use of the calibration was simulated. In typical practice, a
resistance measurement would be input into the calibration curve to determine the
temperature. For the Monte Carlo simulation, additional random data were input into the
simulated calibrations. The inputs were based on typical RTD resistances that were added
to random normally distributed errors (again based on DAQ accuracy). The random RTD
measurement was simulated once for each of the 10,000 simulated calibrations, making a
total of 10,000 different estimates. Figure 27 shows a histogram of typical results. The
estimated error in the RTD measurement was then determined by taking twice the
standard deviation of all 10,000 results. In this manner, the error in surface temperature
was estimated to be 0.1 °C.
† Reading errors are uncorrelated, but DAQ accuracy is correlated (i.e., the same for each
measurement) since all measurements are made with the same device. Uncorrelated errors are based on unique random numbers. Correlated errors are based on the same random number.

65
Fig. 27. Histogram of Monte Carlo results with input from an RTD measurement that corresponds to a nominal temperature prediction of 50 °C.
To determine the heat losses, the heater assembly was modeled using commercial
finite element software (FEMLAB). Natural convection from the G-10 base, silicone,
and aluminum press were modeled using the Lloyd and Moran (1974) correlation:
(35)
The natural convection heat transfer coefficient was found to be 225 – 325 W/(m2·K).
The chip power and temperature measured during the experiment were input into the
model. Then, the boiling heat transfer coefficient was determined iteratively by assuming
a value and verifying the modeled power dissipation against the measured chip power. A
representative surface temperature plot for a quarter section of the heater assembly is
shown in Fig. 28. Up to 28% of the applied power was lost to the insulation in the
4/154.0 LRaNu =
-2σ +2σ

66
natural convection regime of the boiling curve. This heat loss dropped to 12.8% by the
onset of nucleate boiling and continued to decrease as the wall temperature increased. At
CHF the heat loss was only 3 – 4%. Results from nine simulations (from the natural
convection regime through CHF) were used to determine the heat losses as a function of
applied heat load. The estimated heat loss was then subtracted from the raw power
dissipations measured during the experiment for all the results presented in Chapter 5.
Fig. 28. Finite element model of a quarter section of thick-film heater. 4.2. Copper Block Heaters
Copper block heaters were instrumented with thermocouples along the length of
their necks to measure the temperature gradient. Since the necks of the heaters were
insulated by air (free convection losses were small), the heat applied at the bottom of the
heater traveled primarily in the axial dimension (the assumption of 1-D conduction is
explored later in this section). From the measured temperature gradient, the heat flux was
calculated using Fourier’s Law.
G-10 base
Silicone
Aluminum press
Heater
2-axis Traverse
Temperature

67
(36)
The thermal conductivity of pure copper is known to be 391 W/m·K (ASM International,
2001). The temperature gradient was determined from a least squares fit of the
temperature measurements:
(37)
The error in the heat flux was again calculated using the standard propagation of
uncertainty technique:
(38) To calculate the heat flux error, the error in the thermal conductivity was assumed to be
5%, and the error in the temperature gradient was calculated using a Monte Carlo
simulation. This simulation was similar to the one described above in the thick-film
heater section. In this case, the measured temperatures from the neck of the copper
block, thermocouple positions, and random normally distributed errors were input into
the simulation and 10,000 temperature gradients were determined. The error was again
determined by taking twice the standard deviation of all 10,000 temperature gradients.
The temperature of the boiling/sprayed surface was determined by extrapolating
the linear temperature profile out to the wall. If the boiling/sprayed surface is defined as
x=0 in the least squares fitting process, then the wall temperature is given by the constant
determined with the fit:
(39)
The error in wall temperature was also determined using the Monte Carlo technique.
dxdTkq −=′′
( )22
kdx
dTq dxdTk σσσ +
=′′
xdxdTTTwall −=
( )( )
( )∑
∑
=
=
−
−−= 4
1
2
4
1
ii
iii
xx
TTxx
dxdT

68
4.2.1. Boiling Heater The method described above was used to calculate the errors associated with the
copper/copper oxide boiling experiments. Figure 29 shows an example of the linear least
squares fit compared to actual temperature measurements. The absolute value of the
residuals averaged 0.1°C, and the largest deviation from the fit was 0.7°C. Figure 29
shows the temperature distribution to be very linear proving the assumption of 1-D
conduction to be a valid one.
Fig. 29. Typical temperature profiles in the neck of the copper heater block (data from 0.05 g/L alumina-in-water nanofluid boiling on well oxidized copper).
Using the analysis described above, the heat flux error was estimated to be 5%.
The wall temperature error was dependent on temperature gradient and ranged from 0.3
to 0.7 °C (95% confidence estimates). The average wall temperature error was 0.4 °C.

69
By measuring the power delivered to the cartridge heaters and comparing to the
heat transfer calculated assuming 1-D conduction, the fraction of heat lost was found to
be 0.21 ± 0.02. To verify that this heat loss was reasonable, a heat loss prediction was
made based on a 3-D finite element model developed in FEMLAB. The entire copper
block was modeled, and heat transfer coefficients were applied to the external
boundaries. The boiling heat transfer coefficient was assumed to be 10,000 W/(m2·K)
based on the boiling curves presented in Chapter 5. The free convection heat transfer
coefficient was assumed to equal 10 W/(m2·K), which is in good agreement (within 10%)
with Lloyd and Moran (1974), Eq. 35. The resulting false-color temperature plot is
shown in Fig. 30. The heat loss was estimated to be only 7%. Varying the boiling heat
transfer coefficient from half to twice the default value changed the heat loss from 10%
to 5%, respectively. Therefore, the difference between the modeled and measured heat
loss is likely due to the cartridge heaters, which extended outside their holes. Due to their
poor fit into the copper block, the heaters would be hotter than the copper block and
could contribute significantly to the heat loss through natural convection. Unfortunately,
this portion of the heat loss cannot be modeled because the contact resistance between the
heaters and the copper block is unknown. However, the modeling results confirm that the
measured heat lost is reasonable.

70
Fig. 30. Finite element model results for copper block with boiling at the top of the neck and free convection heat losses. 4.2.2. High Aspect Ratio Open Microchannel Spray Cooling Heater
The copper block heater used in the extended surface studies was similar to the
boiling block described above. Therefore, the analyses used to calculate the heat flux and
wall temperature were the same. Using the same procedure outlined above, the error in
the heat flux was estimated to be 5%. The wall temperature error ranged from 0.3 °C –
0.7 °C, with an average of 0.4 °C.
Heat transfer calculated assuming 1-D conduction was 0.87 ± 0.02 times the
power supplied to the cartridge heaters, depending on ambient conditions and the contact
resistance of the threaded heating neck. This heat loss was consistent with losses
expected due to natural convection from the base, verified using the Lloyd and Moran
(1974) correlation, Eq. 35.
Temperature

71
Another potential for heat losses was to the ceramic insulation, which was also
modeled in FEMLAB. For the spray impacted heater, the heat transfer coefficient was
estimated based on the data presented in Chapter 6. However, the heat transfer
coefficient outside the spray impact region would be much lower as noted by Sakamoto
et al. (2006). Therefore, the heat transfer coefficient in the region just outside (within 2
mm) of the heater was assumed to be only 10% of the heat transfer in the impacted
region. The far-stream region where there was essentially no flow was assumed to have a
heat transfer coefficient of 100 W/(m2·K). In this manner, losses from the heater to the
insulation were found to be about 1 – 2% depending on the experimental data point being
modeled. A false-color temperature plot of the modeling results is shown in Fig. 31.
Fig. 31. Finite element model of a quarter section of the heater, silicone adhesive, and ceramic insulation showing the temperature distribution.
The spray cooling results that are presented in the following chapter have been
corrected to account for this modeled heat loss (i.e., the heat loss was subtracted from the
original flux calculated using Fourier’s Law).
Copper neck
Silicone Adhesive
Ceramic
Temperature

72
4.3. Contact Angle Measurements
Contact angle measurements are notoriously difficult to reproduce due to surface
irregularities (de Gennes, 1985) and a variety of measurement techniques available to
investigators. In this study the measurements were made using consistent surface
preparation, infusion rate, lighting, and imaging. However, contact line pinning caused
individual still photographs of the contact angle to differ. Therefore, all angles reported
in the present work are averages of all the measurements made for a particular surface.
Furthermore, the ellipse fitting technique described in Chapter 3 resulted in ± 1.3°
variability due to the author’s choice of points along the droplet interface. The standard
deviation of advancing contact angles was determined by adding these two sources of
variability using the standard square root sum of squares technique:
(40) After combining these two sources of uncertainity, the standard deviation of advancing
contact angles were found to range from 2° to 9°.
( )2/1
21
2
1
+−
−
=∑
=fitellipse
n
ii
nσ
θθσ θ

73
CHAPTER 5. NANOFLUID POOL BOILING & SPRAY COOLING
A literature review of nanofluids properties indicates some promise for two-phase
heat transfer improvement. Pool boiling systems are considered first as a prerequisite to
utilization in more complex spray cooling.
5.1. Boiling Ethanol Based Nanofluids
Due to the lack of prior research, little is known of how ethanol based nanofluids
differ from water based nanofluids. Ethanol is unlike water in that it is highly wetting:
the three-phase (liquid-vapor-substrate) contact angle is very small. Therefore, it is
possible that the mechanisms responsible for heat transfer enhancement are quite
different with ethanol than with water. This thesis has focused on the relationship
between wetting characteristics and nanofluid performance. To that end, ethanol based
nanofluids were used with three different substrates: glass, gold, and copper.
5.1.1. Glass Surface
The steady-state boiling curves for the ethanol based nanofluid on glass are shown
in Fig. 32. The nanofluid concentration was varied from 0.001 g/L to 0.5 g/L and no
enhancement or degradation in CHF was observed. The nucleate boiling heat transfer
coefficient was also unaffected by the nanofluid concentration. This seems to contradict
the findings of other researchers such as You et al. (2003) and Vassalo et al. (2004), who
observed significant CHF enhancement. It also seems to contradict the work of Yang and
Maa (1984) who found significant nucleate boiling enhancement. Furthermore, this also
seems to contradict the work of Das et al. (2003) who observed nucleate boiling
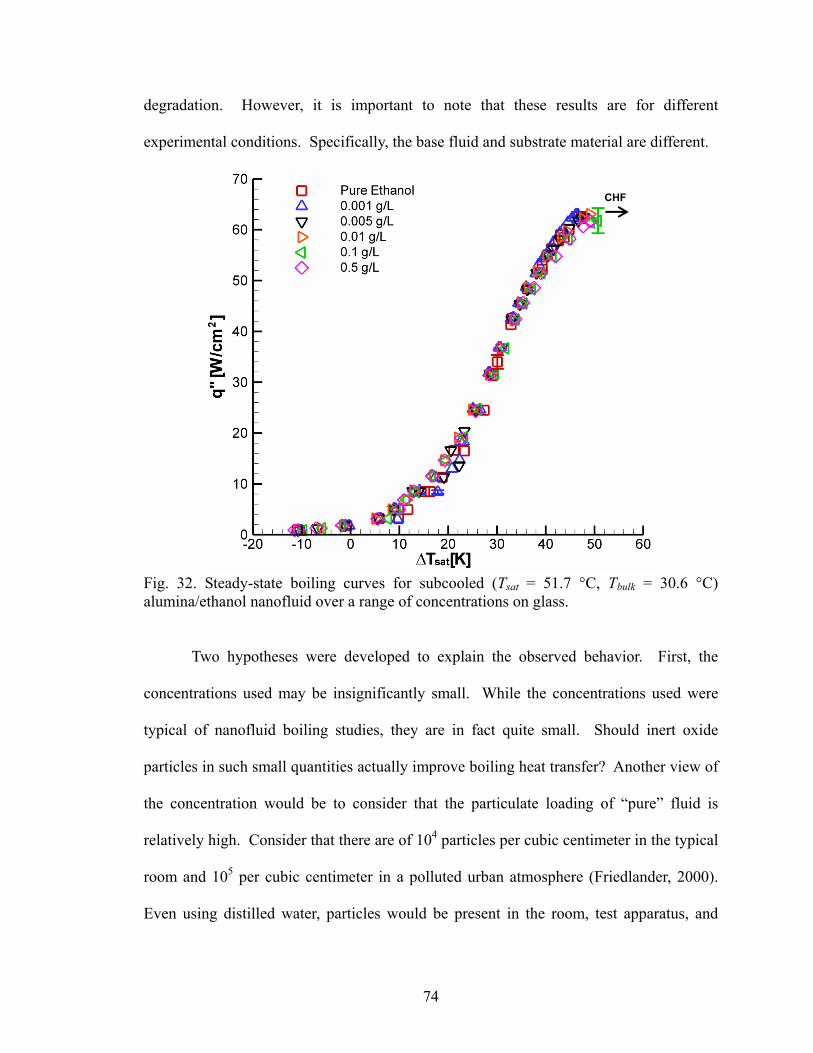
74
degradation. However, it is important to note that these results are for different
experimental conditions. Specifically, the base fluid and substrate material are different.
Fig. 32. Steady-state boiling curves for subcooled (Tsat = 51.7 °C, Tbulk = 30.6 °C) alumina/ethanol nanofluid over a range of concentrations on glass.
Two hypotheses were developed to explain the observed behavior. First, the
concentrations used may be insignificantly small. While the concentrations used were
typical of nanofluid boiling studies, they are in fact quite small. Should inert oxide
particles in such small quantities actually improve boiling heat transfer? Another view of
the concentration would be to consider that the particulate loading of “pure” fluid is
relatively high. Consider that there are of 104 particles per cubic centimeter in the typical
room and 105 per cubic centimeter in a polluted urban atmosphere (Friedlander, 2000).
Even using distilled water, particles would be present in the room, test apparatus, and
CHF

75
ultimately the working fluid. The nanofluid concentrations used may have been too
similar to the particulate loading of the “pure” fluid to observe an effect on boiling
performance.
The second hypothesis was that the lack of a nanofluid effect might be due to the
highly wetting nature of the ethanol/glass system. The above mentioned CHF
enhancement studies were with water based nanofluid, and water is less wetting than
ethanol (see Fig. 33). If the nanofluid served to increase the liquid’s affinity for the
surface, then the ethanol/glass system might have little need for improved wettability.
Nanofluid systems including metal surfaces and water like those studied by You et al.
(2003), Vassalo et al. (2004), and others might indeed have benefited from increased
wetting.
Fig. 33. Photographs of static droplets on a glass substrate (water on the left, ethanol on the right). 5.1.2. Gold Surface
The glass substrate used in the above study was then coated with a 100 nm gold
layer to decrease the surface energy and surface wettability. The steady-state boiling
curves for the alumina-in-ethanol nanofluid on gold are shown in Fig. 34. Tests were
performed with pure fluid, as well as nanofluid concentrations of 0.01 g/L and 0.1 g/L.
Effects on CHF enhancement and the nucleate boiling heat transfer coefficient were again
minimal. While this test does provide support for the theory that dilute nanofluids are

76
insignificant, it is not definitive since the working fluid used (ethanol) is still highly
wetting. A better test would be to systematically change the surface wettability to
determine if nanofluids improve heat transfer through a surface wettability modification.
This kind of surface wettability experiment was done with water based nanofluid on
copper surfaces with various levels of oxidation and will be discussed later. However,
ethanol based nanofluids were also tested on a copper surface, specifically a pure copper
block.
Fig. 34. Steady-state boiling curves for subcooled (Tsat = 51.7 °C, Tbulk = 30.6 °C) alumina/ethanol nanofluid on gold. 5.1.3. Copper Surface
The final surface used with ethanol based nanofluids was a copper substrate. This
time the nanofluid concentration was varied over four orders of magnitude from 0.06 g/L
CHF

77
to 10.07 g/L. The pool was not subcooled in these tests unlike the previous tests because
the large thermal mass of the heater resulted in long experiments and a large heat load
that proved difficult for the condenser to handle. With the higher heat fluxes of
subcooled boiling it was not possible to keep the pool at a nominally constant
temperature. However, under near saturated conditions, with a lower heat flux, the pool
could be maintained at nominally 30°C. The steady-state boiling curves for near
saturated boiling of alumina-in-ethanol nanofluids is shown in Fig. 35.
Fig. 35. Steady-state boiling curves for near saturated (Tsat = 28.9 °C, Tbulk = 28.8 °C) alumina/ethanol nanofluid on copper.
This system illustrates vastly different phenomena than were previously observed.
First, the nucleate boiling regime is marked by a decrease in superheat required to
achieve a given heat flux. Second, there is a CHF enhancement at high particle loadings,
CHF

78
while very dilute suspensions (like those reported by You et al. (2003)) produced no
significant CHF enhancement. Third, there is a very slow dryout or transition to film
boiling at high particle loadings.
The nucleate boiling results appear to agree with Yang and Maa (1984) and Wen
and Ding (2005). They are also contrary to the findings of Das et al. (2003). The
decrease in superheat required to achieve a certain heat flux was determined for three
different fluxes (by interpolation of the data) and was plotted as a function of particle
concentration (see Fig. 36). At low concentrations, the superheat required decreased
linearly. However, the highest concentration, 10.07 g/L, was very similar to the next
lower concentration. The precise reasons for this behavior is unknown but could be
explained by particles depositing onto the surface and increasing the nucleation site
density. This may also help explain the CHF enhancement.

79
Fig. 36. Superheat required for a given heat flux for various alumina-in-ethanol nanofluids on copper.
The CHF enhancement is shown as a function of concentration in Fig. 37. CHF
was enhanced up ~25% at the highest particle loading. This enhancement is significantly
less than that reported by You et al. (2003) or Vassalo et al. (2004). Furthermore, the
concentrations required to see an enhancement were about 1000 times as large as those
used by You et al. (2003), although about half that used by Vassalo et al. (2004). The
fact that very dilute solutions provided little or no enhancement and that 10 g/L provided
~25% enhancement in CHF may provide insight into the mechanisms responsible.

80
Fig. 37. CHF enhancement as a function of nanoparticle concentration for near saturated ethanol suspensions on copper.
First, consider the thermal conductivity, which will need to be estimated since
there is no reliable theory for the thermal conductivity of nanofluid. Figure 38 shows the
thermal conductivity enhancement measured at room temperature by various research
groups. There are clearly differences due to preparation method, particle size, and base
fluid. However, there is a linear trend with respect to particle volume fraction. Using
this linear fit, the thermal conductivity of the 10 g/L suspension is estimated to be 1%
higher than the base fluid. The more dilute suspensions provide a negligible increase in
thermal conductivity. Given that CHF is a weak function of thermal conductivity, this
difference is insufficient to account for the CHF enhancement.

81
Fig. 38. Thermal conductivity enhancement of alumina nanofluids at room temperature.
A second possible explanation for the observed enhancement in both nucleate
boiling and CHF is nucleation theory. Lowery and Westwater (1957) showed that small
quantities of additives could affect all aspects of the boiling curve. They tested cationic,
anionic, and nonionic agents in methanol with a variety of concentrations from 0.001 – 1
wt.%. They measured both the surface tension and the receding contact angle (from
photographs of growing bubbles). Both were found to be nominally constant across the
different test liquids. Therefore, they speculated that nucleation theory provided a
possible explanation. With the addition of small particles or large molecules, additional
interfacial tensions become important, namely the particle-liquid-vapor system. This
could create a “synthetic nucleus” promoting vapor generation on the hot solid and/or in
surrounding superheated liquid. Such a mechanism might be necessary for one to

82
observe an increase in boiling heat transfer. Those systems lacking nucleation sites might
be improved with nanofluid, while a different mechanism such as fouling may degrade a
system with sufficient pre-existing nuclei. This would also explain the importance of
nanoparticle concentration, with higher concentrations leading to more nuclei and higher
heat transfer.
A third possible explanation for the behavior observed is the effect of the
proprietary dispersant that was used in the preparation of the commercial nanofluid.
According to the manufacturer’s Materials Safety Data Sheet (MSDS), as provided the
nanofluid contains 0.5 – 20% dispersant (Nanophase Technologies Corporation, 2003).
As mentioned above, additives are known to affect the boiling process. One particular
type of additive that has been shown to affect nucleate boiling is surfactants. Ammerman
and You (1996) showed that the addition of the surfactant sodium dodecyl sulfate (SDS)
to water resulted in a significant increase in the heat transfer coefficient. They correlated
this with an increase in the convective component of heat transfer and a decrease in the
latent heat component. Since the exact nature of the dispersant used in the preparation of
the nanofluid is unknown, it is possible that the decrease in superheat observed in this
work is due to the increase in dispersant concentration. Unfortunately, the two effects are
difficult to separate since a dispersant is required to make a stable nanofluid.
5.2. Boiling Water Based Nanofluids
With the novel findings from the ethanol based nanofluids research discussed
above, an attempt was made to verify the work of other researchers by using water based
nanofluids. This section discusses the follow-on work on boiling with alumina-in-water
on copper and copper oxide surfaces. The surface wettability was systematically varied

83
by increasing the oxidation of the copper surface as well as varying the nanofluid
concentration.
5.2.1. Concentration Effects
Using the same copper surface as discussed in the previous section, alumina-in-
water nanofluids were used in near saturated pool boiling. The steady-state boiling
curves are shown in Fig. 39. No discernable effect was observed in the nucleate boiling
regime due to scatter in the data. However, the CHF varied with concentration. Again,
different trends were observed with dilute suspensions than with more concentrated ones.
Specifically, dilute suspensions actually decreased the CHF slightly, while the higher
concentrations resulted in significant CHF enhancement. The CHF enhancement is
shown as a function of alumina concentration in Fig. 40. The reasons for this unique
dependence of CHF on concentration is not completely understood. If the addition of
foreign nuclei were to explain these results, then an increase in the nucleate boiling
regime would be expected. If the nucleate boiling regime is at all affected by the addition
of nanofluid, then it is much smaller than that observed with the ethanol based nanofluids
discussed above.

84
Fig. 39. Steady-state boiling curves for near saturated (Tsat = 29.8 °C , Tbulk = 29.3 °C) alumina/water nanofluid on copper.
Fig. 40. CHF enhancement as a function of nanoparticle concentration for near saturated water suspensions on copper.
CHF

85
Another possible explanation might be fouling. Moreno et al. (2005) observed
impressive CHF enhancement, up to ~240%, but they also noticed that higher
concentrations (≥ 0.025 g/L) resulted in the deposition of a thin film on the heater
surface. At even higher concentration (0.5 g/L), they observed a decrease in nucleate
boiling heat transfer, which may have been caused by the particulate film. This kind of
particle deposition could easily affect all aspects of the boiling curve. The deposition of
the film would change the nucleation site density. Das et al. (2003) theorized that
surfaces with large roughness scales could be plugged by nanoparticles resulting in a
smoother surface. The particulate film would also add conduction and contact resistances
which would depress heat transfer. At what point the degradation mechanisms outweigh
any enhancement remains unclear. This may explain the complex dependence on particle
concentration observed in this study.
The CHF enhancement observed with water based nanofluids was larger than with
ethanol (~37% compared to ~25%) for the same heater. Furthermore, lower nanoparticle
concentrations were required for CHF enhancement with water based fluids. This
apparent discrepancy may be due to the poorer wetting characteristics of water. This is
explored in some detail later because there is some evidence to suggest that surface
wettability is responsible for the observed CHF enhancement. Consider the
water/ethylene glycol results of Moreno et al. (2005), who observed that the CHF
enhancement caused by nanofluids decreased as the volume fraction of ethylene glycol
increased. The authors provided no explanation for the observed behavior, but detailed
consideration of the thermophysical properties can provide insight. For instance, the
surface tension of water/ethylene glycol mixtures has been shown to decrease as the

86
ethylene glycol fraction is increased (see Fig. 41). If the nanofluid is depositing particles
that increase wettability, then liquids with lower surface tensions should be less affected.
The data of Moreno et al. (2005) shows this precisely. As they increased the amount of
ethylene glycol, the surface tension would decrease. This then makes the surface easier
to wet and nanoparticles less significant. The result is that the CHF enhancement
disappeared as the concentration of ethylene glycol was increased.
Fig. 41. Surface tension of water/ethylene glycol mixtures at 20 °C (after Horibe et al., 1996).
The unexpected degradation/enhancement of CHF observed with water based
nanofluids indicates that the effect of nanofluids on boiling remains ambiguous.
However, the present data in concert with the literature indicates that it is likely that the
ultimate mechanism for heat transfer augmentation is a change in surface microstructure.

87
5.2.2. Surface Wettability Effects
To test the hypothesis that nanofluids augment boiling heat transfer through a
modification of the surface microstructure and an improvement in surface wetting, the
wetting of the copper surface was systematically improved by growing a native oxide.
Pure water was tested on the same copper heater oxidized to five different surface
oxidation levels. Nanofluid then was used on both the least and most oxidized of these
surfaces. To isolate the effect of the surface oxidation, its wettability was characterized
prior to the experiment by measuring the advancing contact angle with pure water. In
many cases, the contact angle was also measured after the experiment to determine if
further oxidation occurred during the run. Again, this measurement was made with pure
water to isolate the effect of the surface alone. The test matrix is shown in Table 9.
Table 9. Test matrix in the order in which it was run. † These angles were measured after
the surface was rinsed with water. Trial No. Oxidation Level Fluid θprior [degrees] θpost [degrees] 1 None Pure Water 83±3 63±3 2 None Pure Water 79±4 64±2 3 Light Pure Water 56±3 36±4 4 None Pure Water 65±9 60±4 5 Medium/light Pure Water 62±8 43±5 6 Medium Pure Water 97±5 41±4 7 Heavy Pure Water 25±6 - 8 Heavy Nanofluid - 43±6† 9 Heavy Nanofluid 43±6 41±4† 10 None Nanofluid 84±7 - 11 None Nanofluid - 52±3† 12 None Pure Water 75±5 72±7
As expected based on the work of Liaw and Dhir (1989), the oxidation reduced
the advancing contact angle. Figure 42 shows the contact angle on an unoxidized surface
(left) and a well oxidized surface (right), both prior to the boiling run. There was

88
however some variation in the contact angle measurements. In particular, Trial 6 had an
unexplainably large contact angle prior to the experiment. The reason(s) for this remain
undetermined. However, its CHF enhancement (discussed below) is in line with
expectations given its level of oxidation. Table 9 also shows that the contact angle prior
to the experiment varied considerably for the four unoxidized surfaces. This may be due
to the cleaning technique which involved dilute nitric acid, which contains a considerable
amount of water that could quickly produce some oxidation. However, as will be noted
in the results section below, the unoxidized surface had very repeatable CHF. The
repeatability with which CHF could be measured on these surfaces may be due to the fact
that the surface was oxidized by the time it approached CHF. As Tachibana et al. (1967)
observed, a native oxide may develop during the experiment. They believed that this
native oxide growth may be responsible for the high CHF observed with aluminum. For
this reason, the post-CHF contact angle was measured in this study for a number of trials
to estimate the contact angle just prior to CHF. The unoxidized surfaces were clearly
affected by the boiling process as seen in Table 9.
Fig. 42. Photographs of the advancing contact angle on polished copper (left) and copper oxide (right).

89
Boiling curves that illustrate the effect of surface oxidation are shown in Fig. 43,
where the working fluid was pure water. No effect of oxidation was discernable in the
nucleate boiling regime due to scatter in the data. Oxidation, however, tended to increase
CHF. This confirms the results of Liaw and Dhir (1989). For this study, the baseline
unoxidized surface was run four times with pure water and CHF was repeatedly
measured to be 61±1 W/cm2. The medium/light oxidized surface did not have the
enhancement one might expect. Noting Table 9, its contact angle was actually higher
than the lightly oxidized surface. This information could perhaps have been used to
predict its anomalously low CHF. Figure 44 shows the CHF enhancement versus the
advancing contact angle, as measured before and after the boiling experiment, and the
trend is clear: lower contact angle (i.e., oxidation) increases CHF. The well oxidized
surface had 141% the CHF of the baseline surface. These results were in good agreement
with those of Liaw and Dhir (1989), who measured the static contact angle and observed
up to ~90% enhancement.

90
Fig. 43. Steady-state boiling curves (Tsat = 29.8 °C, Tbulk = 29.3 °C) illustrating the effect of surface oxidation.
Fig. 44. CHF as a function of advancing contact angle for pure water on copper and copper oxide. Error bars represent standard deviation estimates.
CHF
baselines

91
Alumina/water nanofluid was then used as the working fluid for the unoxidized
surface as well as the well oxidized surface. Boiling curves that illustrate the effect of the
nanofluid are shown in Fig. 45. In both cases, nanofluid decreased CHF: by 22% for the
oxidized surface and 13% for the unoxidized surface. Initially, these results were
unexpected since nanofluids are known to improve surface wetting (Kim et al., 2006a),
which tends to increase CHF. Furthermore, note that with the easily wetted copper oxide
CHF was more degraded than with the less wettable unoxidized surface. This indicates
that an increase in CHF due to improved wettability may be negated by another
mechanism such as fouling. Each nanofluid test was immediately repeated, with similar
results. The nanofluid was then removed from the chamber, the chamber was thoroughly
cleaned and filled with pure water, and a final trial was run. This test yielded a CHF of
62 W/cm2 compared to the previous three baseline CHF measurements of 61±1 W/cm2.
This provided a valuable check on the integrity of the experimental technique and
illustrates the consistency of the CHF measurements.

92
Fig. 45. Boiling curves (Tsat = 29.8 °C, Tbulk = 29.3 °C) illustrating the CHF degradation caused by the addition of nanofluid.
Another interesting aspect of these oxidation experiments to note is that the oxide
provided a more controllable and significant CHF enhancement (see Fig. 46). The well
oxidized surface increased CHF by 41% at a superheat of 49 K. In contrast, it required
~0.5 g/L of alumina to increase CHF by 37% on a plain surface, and this required ~20 K
higher superheat. Thus, even with comparable heat fluxes, the higher superheat required
with nanofluids makes their use significantly less desirable. Furthermore, the oxidation is
a simple and controllable process that does not rely on expensive precursor materials.
CHF

93
Fig. 46. Comparison of nanofluid and oxidation enhancement techniques. 5.3. Nanofluid’s Contact Angle Modification The data presented above, indicate that surface wettability is key in determining
whether nanofluids enhance boiling heat transfer. To test the ability of nanofluid to
improve surface wetting, the advancing contact angle of water based nanofluid (1.02 g/L)
was compared to that of pure water on two different types of surfaces: copper and copper
oxide.
5.3.1. Advancing Droplets on Copper
For the first run, pure water was advanced across a copper surface and the
advancing contact angle was found to be 88.6 ± 5.4°. Then, 1.02 g/L alumina-in-water
was advanced across the surface four times. Nothing was done to the surface between
CHF

94
runs: the surface was only dried with nitrogen gas. The advancing contact angle is shown
as a function of distance from the tip of the syringe in Fig. 47. The first time the
nanofluid advanced across the surface, the advancing contact angle was indistinguishable
from pure water. However, in subsequent trials, after the surface had been fouled by the
nanoparticles, the advancing contact angle decreased. Since the advancing contact angle
decreased with each run, it is posited that more particles were coating the surface during
each advance. Furthermore, when the contact angle is plotted as a function of distance
from the tip of the syringe, the area closest to the tip of the syringe is found to have the
lowest contact angle, which increases almost linearly as the distance from the needle
increases. One reason for this behavior may be that the area closest to the needle is
exposed to every particle that exits the needle. Whereas, the area of the substrate that is
farthest from the needle is only exposed to particles that are yet to deposit.

95
Fig. 47. Advancing contact angle of 1.02 g/L alumina-in-water nanofluid on copper. Pure water error bands show the standard deviation of a series of measurements, but the other error bars represent the standard deviation based on a single photograph.
Two months later, this experiment was repeated on a similarly prepared copper
surface (see Fig. 48). While the magnitude of the contact angle was slightly different, the
behavior was essentially the same: nanofluid on a clean surface was indistinguishable
from pure water, but with each subsequent run the contact angle decreased. Still the near
needle region had a lower contact angle than the region farthest from the needle, however
the trend was not linear.

96
Fig. 48. Second trial for advancing contact angle of 1.02 g/L alumina-in-water nanofluid on copper. Pure water error bands show the standard deviation of a series of measurements, but the other error bars represent the standard deviation based on a single photograph.
Figures 47 and 48 clearly point to a possible boiling enhancement mechanism
since they illustrate that nanofluid decreases the advancing contact angle only after dry
out. Consider bubble growth and detachment (Fig. 49). As a bubble grows, the dry patch
beneath it would grow as the liquid around the bubble’s perimeter recedes (Fig. 49, left).
The dryout process would leave nanoparticles on the surface of the heater. Then during
detachment (Fig. 49, right), as the bubble is pinched off the surface, the dry patch is
rewetted by advancing bulk liquid. However, the nanofouled surface will be more easily
wetted as shown above in Figs. 47 and 48. The thinner wedge of liquid caused by the

97
smaller advancing contact angle would improve heat transfer from the substrate through
improved evaporation efficiency (Liaw & Dhir, 1989).
Fig. 49. Bubble growth leaving nanoparticles on the surface (left) and bubble detachment when liquid advances to cover the nanofouled dry patch (right).
5.3.2. Advancing Droplets on Copper Oxide
The boiling results presented in sections 5.1 and 5.2 demonstrated that highly
wetting fluid/surface combinations were less likely to benefit from the use of nanofluid.
Since nanofluid on nanofouled copper was found to reduce the advancing contact angle,
the same advancing contact angle experiment was performed on a more easily wetted
copper oxide surface.
The copper heating block was oxidized as described in Chapter 3 (see Table 5,
medium oxidation). For the first run, pure water was advanced across a copper surface
and the advancing contact angle was found to be 41.2 ± 4.8°. Then, 1.02 g/L alumina-in-
water was advanced across the surface four times (see Fig. 50). Again, the nanofluid only
reduced the advancing contact angle on the nanofouled surface. However, since the
contact angle of pure water on oxide is lower than on unoxidized copper, the effect of the
nanofluid was reduced. On the oxidized surface the angle was only reduced ~10 – 15°.
This is consistent with the enhancement mechanism and the boiling results discussed
above. With highly wetting fluid/surface combinations, the advancing contact angle is
lv
s
v

98
reduced less by the nanofouling. The lower reduction in contact angle would decrease
the enhancement in evaporation seen during rewetting. This results in less CHF
enhancement with highly wetting fluid/surface combinations.
Fig. 50. Advancing contact angle of 1.02 g/L alumina-in-water nanofluid on copper oxide. Pure water error bands show the standard deviation of a series of measurements, but the other error bars represent the standard deviation based on a single photograph. 5.4. Spray Cooling with Nanofluids
While boiling with nanofluids is complicated and still not completely understood,
there appears to be some hope of enhancing heat transfer, most likely through a modest
increase in CHF. Like boiling, a spray cooled surface will also be affected by the wetting
characteristics of the working fluid (Sehmbey et al., 1994). In addition to the processes
such as bubble growth and liquid rewetting that affect boiling, spray cooling is
complicated by the addition of droplet evaporation. Droplets with smaller contact angles
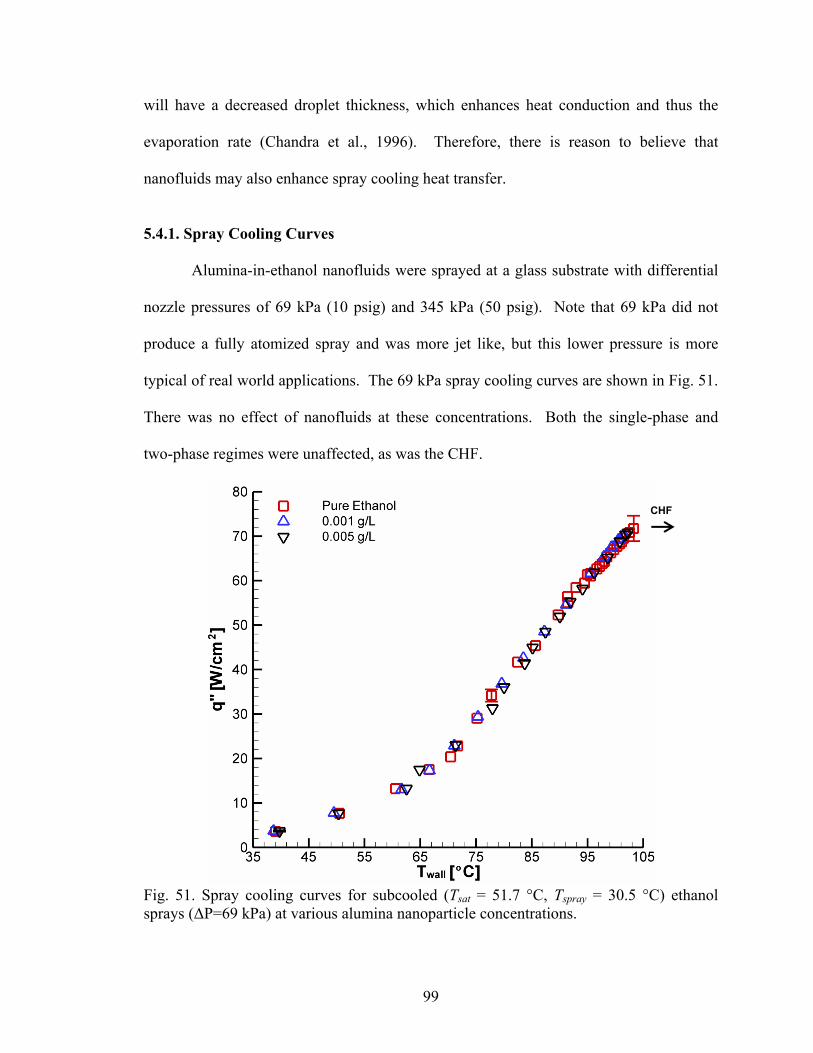
99
will have a decreased droplet thickness, which enhances heat conduction and thus the
evaporation rate (Chandra et al., 1996). Therefore, there is reason to believe that
nanofluids may also enhance spray cooling heat transfer.
5.4.1. Spray Cooling Curves
Alumina-in-ethanol nanofluids were sprayed at a glass substrate with differential
nozzle pressures of 69 kPa (10 psig) and 345 kPa (50 psig). Note that 69 kPa did not
produce a fully atomized spray and was more jet like, but this lower pressure is more
typical of real world applications. The 69 kPa spray cooling curves are shown in Fig. 51.
There was no effect of nanofluids at these concentrations. Both the single-phase and
two-phase regimes were unaffected, as was the CHF.
Fig. 51. Spray cooling curves for subcooled (Tsat = 51.7 °C, Tspray = 30.5 °C) ethanol sprays (∆P=69 kPa) at various alumina nanoparticle concentrations.
CHF

100
The results of the 345 kPa tests are shown in Fig. 52. Again, low concentrations
had no effect on performance. However, 0.5 g/L resulted in a significant degradation in
all regions of the spray cooling curve. The CHF decreased by 49%. This disappointing
result was due to partial clogging of the spray nozzle, which was visually observed to
drastically alter the spray cone’s shape.† Two additional aspects of the data point to
partial clogging of the spray. First, note that this spray cooling curve has a clear
transition from the single-phase to two-phase regimes around 70°C. Whereas, the pure
fluid and low concentration sprays remain single-phase because the spray velocity was
too great to allow for the development of superheated liquid. The appearance of the two-
phase regime is indicative of lower flow rate. Also, note that the shape of this curve is
qualitatively similar to the lower flow rate, 69 kPa, data presented above. Second, the
volume flow rate of the spray was measured upstream with a digital turbine flow meter.
In the 0.5 g/L test, the volume flow rate decreased from 52 mL/min to 18 mL/min.
The nozzle clogging was likely due to particle deposition on the brass nozzle. As
provided by the manufacturer, the alumina particles were ~45 nm in diameter (Nanophase
Technologies Corporation, 2003). At this scale, the particles should easily pass through
the nozzle. However, nanoparticles are known to be unstable in the vapor phase
(Friedlander, 2000), and therefore are likely to agglomerate in a spray cooled system. By
design, the spray nozzle creates many fine droplets that easily evaporate. If the particles
lose their suspension properties in the vapor phase, then agglomerates would be created at
every point that experiences droplet evaporation. This mechanism could have been
† The possibility that poor spray atomization was due to an increase in viscosity was considered.
However, since the nanoparticle’s volume fraction was of order 10-5, the viscosity increase was expected to be of order 10-4 (see Fig. 53), which should have a negligible effect on atomization.

101
responsible for clogging the outside of the nozzle, or the inside could have been clogged
by simple particle deposition in the liquid phase.
Fig. 52. Spray cooling curves for subcooled (Tsat = 51.7 °C, Tspray = 30.5 °C) ethanol sprays (∆P=345 kPa) at various alumina nanoparticle concentrations. 5.4.2. Scaling Analysis
Given the poor initial results with spray cooling nanofluids, the prospect of
enhancing spray cooling with nanofluids was reconsidered. Recall that Shedd and
Pautsch (2005) have shown that spray cooling is essentially a single-phase phenomenon.
This was confirmed for the high pressure/flow rate (∆P=345 kPa) data presented above.
Therefore, the addition of nucleation sites may be of little importance. The dominant
factor known to affect spray cooling is volumetric flow flux (Estes & Mudawar, 1995),
and flow rate is clearly impacted by nozzle plugging and increases in viscosity.
CHF

102
Along with the anomalous increase in thermal conductivity (recall Fig. 38)
nanofluids exhibit a large increase in viscosity. In most cases, the viscosity increases
faster than the thermal conductivity and in some extreme cases the viscosity has been
found to increase by over 100%. A survey of reported viscosity increases is shown as a
function of particle volume fraction in Fig. 53. Even excluding the study by Pak and Cho
(1998), this viscosity increase is significant.
Fig. 53. Relative viscosity increase for alumina nanofluids with linear fit that excludes the Pak & Cho data. † These authors report viscosity varying as a function of shear rate. Their results at the highest shear rates were used. Note that the viscosity increases are greater at lower shear rates.
To get a sense of how this would affect spray cooling, consider the single-phase
impinging jet correlation of Fabbri, Jiang, and Dhir (2003):
†
†

103
(41)
The heat transfer coefficient can be seen to be proportional to k0.57 and µ-0.38. Then, using
the linear approximations to the thermal conductivity and viscosity increases from Figs.
38 and 53, respectively, the relative heat transfer coefficient can be calculated. The
degradation in heat transfer coefficient based on this scaling analysis is shown in Fig. 54.
The increase in viscosity is enough to completely offset the thermal conductivity
enhancement and result in a slight decrease in heat transfer coefficient as the volume
fraction of nanoparticles is increased. This indicates that using higher concentrations of
nanofluid in a jet or spray system would likely cause decreased thermal performance,
even if nozzle clogging could be overcome. Also note that this degradation would be
even worse in some instances if the viscosity increase was even larger as in Pak and
Cho’s (1998) study.
48.482.043.081.0 0385.01055.0
−
+=
n
eqd d
DPrReNu
n

104
Fig. 54. Relative heat transfer coefficient for jet impingement determined through scaling analysis as a function of nanoparticle volume fraction. 5.5. Summary of Nanofluid Research
Nanofluid boiling was experimentally investigated with alumina-in-water and
alumina-in-ethanol nanofluids. Four different types of surfaces were used to study the
surface wetting aspect of nanofluid boiling. The following major conclusions were
made:
• Ethanol based nanofluids were found to have no effect on glass or gold over
the range of concentrations used.
• Water based nanofluids increased CHF modestly on copper but at higher
particle concentrations than some reports in the literature.

105
• Dilute water based nanofluids could degrade performance. This degradation
was larger with a copper oxide surface than with pure copper.
• Oxidizing a copper surface and using pure water proved more effective at
enhancing CHF than using nanofluids because of the high superheat required
for nanofluid CHF enhancement.
• Ethanol based nanofluids could increase CHF on a copper heater but greater
concentrations were required than with water and the CHF enhancement was
more modest.
• All the above results indicate nanofluid CHF enhancement is strongly linked
to poor wettability. When surfaces are easily wetted by base fluid, nanofluids
are less useful and sometimes more degrading.
• The advancing contact angle of alumina-in-water nanofluid was found to be
indistinguishable from pure water on clean surfaces (both copper and copper
oxide). However, after the surface had been coated with nanoparticles, the
advancing contact angle of nanofluids was reduced. This lead to a possible
boiling enhancement mechanism in which dryout during bubble growth leaves
particles on the surface, which reduces the contact angle during the
subsequent rewetting process. The lower contact angle (and thinner liquid
wedge) then enhances evaporation.
• The contact angle reduction measured for nanofouled surfaces was smaller for
highly wetting fluid/surface combinations such as copper oxide. Since contact
angle is known to affect CHF, the lower contact angle reduction is likely

106
responsible for the poorer boiling enhancements observed with highly wetting
fluid/surface combinations.
Nanofluid spray cooling was also experimentally investigated and was found to
be detrimental to thermal performance. In one case, CHF was found to decrease by 49%
due to a significant deterioration of spray atomization (perhaps due to a partial plugging
of the nozzle). This could be due to the instability of the nanoparticles in the vapor
phase. Furthermore, a scaling analysis was performed to illustrate that the expected
enhancement due to an improvement in thermal conductivity is negated by the dramatic
rise in viscosity.
The observed experimental results can be explained by considering the
modification of a solid surface. Given the uncertainty involved with nanofluids due to
agglomeration, settling, and fouling; a more appropriate method of spray cooling
enhancement would be direct surface modification such as the addition of microstructures
or fins.

107
CHAPTER 6. EXTENDED STRUCTURE SPRAY COOLING Review of the recent literature suggests that surface modification, specifically
straight channels, provides a significant enhancement in spray cooling heat transfer.
However, the mechanisms behind the enhancement are not yet fully understood. This
chapter presents the results of a systematic study of the spray cooling of high aspect ratio
open microchannels. The channel depth was varied to explore the relative spray
utilization, which was investigated in detail. Furthermore, a one-dimensional fin analysis
was developed to interpret the results.
6.1. Results of Spray Cooling High Aspect Ratio Open Microchannels
Spray cooling curves for the six test surfaces at three nozzle pressures are shown
in Figs. 55 – 57. A significant performance enhancement over the flat surface is
observed for each of the five enhanced surfaces at all nozzle pressures. As expected,
increasing the nozzle pressure (and mass flux) resulted in higher heat transfer. This is in
agreement with the literature (e.g., Estes & Mudawar, 1995a; Pautsch & Shedd, 2005).
Furthermore, there were also distinctly different trends in the single-phase and two-phase
regimes, where there is a sharp increase in heat transfer. In particular, the finned surfaces
showed a significant enhancement in the total heat flux once two-phase effects became
dominant.

108
Fig. 55. Spray cooling curves for open microchannel surfaces at nozzle pressure of 138 kPa (20 psig).
Fig. 56. Spray cooling curves for open microchannel surfaces at nozzle pressure of 276 kPa (40 psig).
CHF
CHF

109
Fig. 57. Spray cooling curves for open microchannel surfaces at nozzle pressure of 413 kPa (60 psig).
6.1.1. Single-Phase Results
The single-phase regime is defined as the linear portion of the cooling curve
where the wall temperature is not high enough to cause any significant amount of boiling,
which would cause the heat transfer coefficient to increase dramatically as it does in
nucleate pool boiling. The bare surface performance was typical and a comparison with
the single-phase correlation of Rybicki and Mudawar (2006) is shown on Figs. 55 – 57.
This correlation was developed from two data sets using PF-5050 and water, and the
claimed error in the correlation is 13.1%. The current data is found to lie just outside of
this expected error with a mean deviation of -15% with respect to the predicted value.
CHF

110
The slight deviation from linearity in the present data that was observed in the
“single-phase” regime is due to at least some evaporation from the top of the liquid film.
Note that the relatively low temperature of the incoming spray, spray chamber, and
coiling coil promote evaporation from the wall even when the wall temperature is below
the saturation temperature (56°C). This is due to the relatively higher vapor pressure of
the warm liquid on the heater. While the evaporative effect is significant, as will be
discussed below in greater detail, the heat transfer coefficient is nearly constant in this
region of the spray cooling curve and drastically different than in the two-phase or
boiling regime.
The effect of nozzle pressure difference on heat transfer over the range of
conditions explored is illustrated on Fig. 58. As expected, a larger ∆P resulted in
significant improvement in heat transfer, most likely due to the higher mass flow rate,
finer droplets, and higher droplet velocity that accompany an increasing ∆P.

111
Fig. 58. Heat flux as a function of nozzle pressure difference for Twall = 60°C (similar results are obtained at other wall temperatures). Heat fluxes are based on the 2 cm2 projected area.
Longer fins always provided more enhancement than shorter ones as illustrated in
Figs. 55 – 57. The relative performance enhancement as a function of fin length is shown
on Fig. 59. While the total surface area increases linearly with fin length, the heat
transfer enhancement appears to be asymptotically approaching an optimum value. The
dependence of heat transfer enhancement on fin length is rather insensitive to changes in
flow rate and well within the experimental uncertainty. The results observed in the
single-phase regime were due to a number of competing mechanisms. Adding fin length
not only increased the wetted area, but also increased the amount of fluid incident on the
surface (note Table 8). These two positive effects were offset by the addition of
conduction resistance within the fin, less uniform distribution of liquid due to more

112
channeling, and heating of the fluid as it traveled down the fins (thus lower local ∆T near
the bottoms of the fins). While longer fins showed improvement, the addition of
conduction resistance should eventually decrease performance by adding a temperature
drop between the base of the fins and the top of the fins where the liquid is the coolest.
Fig. 59. Area and heat flux enhancement as a function of fin length for Twall = 60°C (similar results are obtained at other wall temperatures). Heat fluxes are based on the 2 cm2 projected area.
6.1.2. Two-Phase Results
In many spray cooling studies, heat transfer has been found to be primarily a
single-phase phenomenon (Pautsch & Shedd, 2005). The supply of cold liquid is so high
(in order to maximize heat transfer) that there is little time for the heater to increase the
local liquid temperature. Liquid is swept away by fresh cold liquid before it can heat up
enough to generate a bubble. This suppression of nucleation due to the convective effect

113
of liquid sweeping across a flat surface has also been observed in flow boiling by many
researchers (Chen, 1966). As a result, very high wall temperatures are required to begin
significant bubble nucleation. This phenomenon was also observed in this study–the flat
surface remained essentially single-phase up to almost 20°C above the saturation
temperature of 56°C.
The finned surfaces entered the two-phase regimes at temperatures closer to the
saturation temperature (see Figs. 55 – 57 and Table 10). Four possible mechanisms
responsible for this effect were considered:
i) An increase in the number of potential nucleation sites due to increased area
might result in increased ebullition, mixing, and latent heat contribution.
ii) A longer residence time as liquid must travel down the fin and out of the
channel before leaving the hot structure allows more energy to be transferred
from the wall. This may create the superheated liquid needed for nucleation.
iii) Channeling of the liquid by the fins would leave the inner channels with
sufficient liquid but the outer channels partially starved. The liquid starved
regions would more easily develop superheated liquid and begin boiling.
iv) Conversely, liquid pooling may have occurred on portions of the fin that were
shaded from the impinging droplets. These shaded regions would have seen
no cool drops and only be cooled by preheated liquid draining from
somewhere else. These regions might form thicker pools, allowing nucleation
to occur more easily.

114
Table 10. Temperatures required for dominant two-phase effects. Fin Length [mm] Approx. Temp. at Onset of Boiling [°C]
0 77 0.25 66 0.5 65 1 63 3 62 5 61
One aspect of the boiling onset data is particularly revealing: the sharp transition
to the two-phase regime occurred at a temperature that was independent of nozzle
pressure difference. The liquid velocity in the channels (or on the flat surface) would
scale with the pressure. This indicates that the onset of two-phase effects (which is
almost entirely responsible for the observed enhancement) is not due to an increase in
liquid velocity. This supports enhancement mechanisms that are not based on flow rate,
such as mechanisms iii and iv based on dryout and pooling, respectively.
6.1.3. Critical Heat Flux Results
Although CHF was observed for the flat surface, CHF was not reached for most
of the finned surfaces due to the heating block reaching temperatures greater than the safe
temperature limit of the test apparatus. The correlation of Estes and Mudawar (1995) for
spray cooling CHF is indicated in Figs. 55 – 57, and is shown to consistently overpredict
the observed CHF magnitude. However, the uncertainty in their correlation was ± 30%.
Another interesting aspect of the ∆P = 1.36 atm (20 psig) tests was the delayed
transition toward CHF. The finned surfaces began to show a decrease in their heat
transfer coefficients around 71°C even though CHF is not reached until over 90°C,
indicating that dryout occurred gradually. This may have been due to channeling of the
115
spray, which allowed the outer channels with less liquid to begin drying out before the
fluid rich center channels.
6.2. Spray Efficiency Improvement
Calculating the spray efficiency as defined in Eq. 42 yields further support for the
notion of an increasing liquid temperature.
(42) The latent heat term is included in the denominator of Eq. 42 despite its application in the
single-phase regime because evaporation occurs when the environment surrounding the
heater is at a lower temperature than the heater itself. In fact, during the experiment,
condensation was observed on the 30°C copper coiling coil at all reported wall
temperatures. Additionally, a spray efficiency calculation that excludes the latent heat
term results in efficiencies greater than 100% for much of the data, indicating the
importance of the latent heat term. The spray efficiency as defined in Eq. 42 is shown as
a function of fin length in Fig. 60. Lower nozzle pressure resulted in a higher spray
efficiency most likely due to a reduced impact velocity generating an increased residence
time of the droplets on the surface. This increased the evaporative heat transfer despite
any reduction in the convective heat transfer due to lower droplet velocity. The spray
efficiency also shows the same trend at a wall temperature of 50°C as at 60°C, which
further supports the notion that boiling had yet to begin, even though the wall
temperature had elevated past the saturation temperature of 56°C. Furthermore, the spray
efficiency, like the heat transfer enhancement, is seen to asymptotically approach an
optimum for a given wall temperature and nozzle pressure difference.
( )[ ]fgspraywalllp hTTcmq
+−=
,&η

116
Fig. 60. Spray efficiency as a function of fin length in the “single-phase” regime.
Greater insight into the significance of the two-phase regime can also be gained
by considering the spray efficiency. Typically, the spray efficiency is defined as in Eq.
43, however this makes no allowance for superheating of the liquid or vapor.
(43) The experimental data of this study indicate significant vapor production within the
confines of the microchannels, and this vapor may have been heated by dry portions of
the channels as it escapes. A more appropriate definition of spray efficiency would
include the sensible heat required to increase the vapor temperature from the saturation
temperature to the wall temperature as follows.
(44) ( ) ( )[ ]fgsatwallvpspraysatlp hTTcTTcm
q+−+−
=′,,&
η
( )[ ]fgspraysatlp hTTcmq
+−=
,&η

117
The vapor specific heat was estimated using the Yoneda (1979) method for organic
compounds in the ideal gas state (see Appendix D for details on this calculation). Also
note that the liquid and vapor specific heats are similar (cp,l = 1102 J/kg⋅K, cp,v = 912
J/kg⋅K at Tsat), so the state of the fluid being superheated is of little importance as long as
a superheating term is included in the efficiency definition.
The spray efficiencies are shown as a function of temperature in Figs. 61 - 63.
The mass flow rates used are based on the flow incident on the top surface of the finned
structure (see Table 8). While the spray efficiencies of the flat surface are
characteristically low, the efficiencies with microchannels appear to asymptotically
approach the theoretical limit of unity. This trend is particularly evident in the 138 kPa
data, while data at higher temperatures is required at higher nozzle pressure differences.
In the single-phase regime, spray efficiencies are low and monotonically increase along
with fin length. The onset of boiling corresponds to a large increase in the spray
efficiency and since the onset occurs at different temperatures for different channel
heights, the optimum fin length varies with temperature.

118
Fig. 61. Spray efficiency as a function of wall temperature for 138 kPa (20 psig) nozzle pressure difference.
Fig. 62. Spray efficiency as a function of wall temperature for 276 kPa (40 psig) nozzle pressure difference.

119
Fig. 63. Spray efficiency as a function of wall temperature for 413 kPa (60 psig) nozzle pressure difference.
These findings indicate some important results. The efficiencies of the finned
surfaces for the 138 kPa (20 psig) pressure difference collapse onto a single curve as
CHF is approached, and this single curve indicates almost total evaporation of the
incident spray. By channeling the spray and forcing liquid to travel down the fins and
through the microchannels, it has sufficient residence time to heat up to the wall
temperature in the single-phase regime, or to the saturation temperature and completely
evaporate in the two-phase regime. The very high spray efficiencies observed in this
study are likely due to the small scale of the microchannels along with the relative
sparseness of the spray. It may likely be confirmed that given a greater flow rate, the
heat transfer could be improved at the expense of a decreased spray efficiency as shown

120
by Pautsch and Shedd (2005) with flat surfaces and Silk et al. (2004, 2005, 2006) with
enhanced surfaces. However, spraying microchannels with a sparse spray may be one
way of improving thermal performance without merely increasing the mass flow rate,
which can be expensive in terms of pump power, cost, and weight.
6.3. One-Dimensional Model for Single-Phase Heat Transfer
A simple, one-dimensional fin model is proposed to gain better understanding of
the underlying mechanisms.
6.3.1. Model Development
The heat transfer coefficient on a typical fin was determined by solving the
convection tip fin equation (Incropera & DeWitt, 2002), Eq. 45, using one of two
different values for the fin heat transfer.
(45)
1) In the first case, the heat transfer from the bottom of the channels was
neglected. The entire heat transfer observed in the experiment was then
attributed to the sides and tip of the fin according to Eq. 46, where n=17 is the
number of fins on the heat sink. Since heat transfer from the bottom of the
channels was neglected, this method yielded an upper limit for the average
heat transfer coefficient for the sides and tip.
(46)
2) In the second case, the heat transfer from the bottom of the channels was
assumed to be unchanged from the flat surface experimental result. Since the
)sinh()cosh(
)cosh()sinh(
mLmkhmL
mLmkhmL
kAhPq wcftipsides+
+=+ θ
tipsidesheatsink q
nq
+=

121
model assumes the flat surface was impacted by fresh cold liquid (the liquid is
actually pre-heated by the upstream area), the bottom surface heat transfer is
overestimated yielding a lower limit for the heat transfer coefficient on the
sides/tip. The average sides/tip heat transfer is then given by Eq. 47, where
the 0.41 factor on the last term is required because the bottom surface has a
total area of 0.81 cm2 whereas the flat surface has an area of 2 cm2.
(47)
These two cases were used to determine the heat transfer coefficient with Eq. 45, which
is then used to predict the temperature profile with Eq. 48 (Incropera & DeWitt, 2002).
(48)
Note that while Figs. 55 - 57 show heat fluxes based on the 2 cm2 projected area, the heat
transfer coefficient discussed here is based on the wetted area.
6.3.2. Results and Implications
Figure 64 shows the lower and upper limit heat transfer coefficients (normalized
by the bare surface heat transfer coefficient) calculated using the above method. The heat
transfer coefficients are significantly lower than the bare surface heat transfer coefficient,
which is expected since the enhancement in heat transfer observed with the channeled
surfaces is not as great as the area enhancement (recall Fig. 59). Furthermore, both the
lower and upper limits predict similar heat transfer coefficients for the sides/tip as the fins
become long, indicating the decreasing significance of the troughs.
nq
qn
q flattipsides
heatsink 41.0+= +
( )[ ] ( )[ ]
)sinh()cosh(
sinhcosh
mLmkhmL
xLmmkhxLm
wall +
−+−=
θθ

122
Fig. 64. One-dimensional model results as a function of fin length for Twall = 60°C, ∆P=4.08 atm (60 psig) normalized by hflat = 9784 W/(m2·K).
In both limiting cases, this model predicts a temperature profile that is
qualitatively similar (Fig. 65). The temperature profile predicted by the model shows a
modest temperature drop along the length of the fin, suggesting that heat transfer is not
limited by the fin temperature. Given the increased area of the channeled surfaces and
the modest temperature drop along the fin suggested by this model, it is more likely that
heat transfer is limited by an increase in liquid temperature which lowers the local ∆T
(see Appendix E for an independent numerical model that illustrates the rise in liquid
temperature). Heat transfer limited by liquid that has increased in temperature is
consistent with the spray efficiency plots, Figs. 61- 63, which show that the extended

123
structures allow for utilization of most of the spray’s thermodynamic potential for heat
removal.
Fig. 65. Predicted temperature profile on 5 mm fins using 1-D model for Twall = 60°C, ∆P=4.08 atm (60 psig).

124
CHAPTER 7. CONTRIBUTIONS AND CONCLUSIONS
This dissertation was designed to shed light on important and topical heat transfer
enhancement techniques. Spray cooling with nanofluids and extended surfaces have been
reviewed, experimentally investigated, analyzed, and modeled. The specific conclusions,
contributions, and suggestions for future work are as follows.
7.1. Conclusions
Nanofluid boiling was experimentally investigated with alumina-in-water and
alumina-in-ethanol nanofluids on four different types of surfaces: glass, gold, copper, and
copper oxide. The results were found to be highly dependent on the fluid/surface
combination, specifically wetting characteristics. Poorly wetting systems (e.g. water on
copper) could be enhanced by nanofluids, whereas better wetting systems (e.g. ethanol on
glass) showed little or no improvement. Generally, critical heat flux was unchanged or
even sometimes degraded at small particle loadings, contrary to some reports in the
literature (e.g. You et al., 2003). Greater concentrations (≥ 0.5 g/L) lead to modest (up to
~37%) increase in the CHF, but direct comparisons with the same heater indicated that
greater particle concentrations were required for highly wetting base fluids. In another
comparison, dilute water based nanofluid was used on copper (less wetting) and copper
oxide (more wetting) and the CHF degradation due to nanofluids was worse for the more
wetting surface. Interestingly, oxidizing a copper surface and using pure water proved
more effective at enhancing CHF than using any concentration of nanofluids because of
the high superheat required for nanofluid CHF enhancement.
All the experimental results indicate that nanofluid CHF enhancement is strongly
linked to poor wettability. When surfaces are easily wetted by base fluid, nanofluids are

125
less useful and sometimes more degrading. The boiling results lead to experiments in
which the three-phase contact angle was measured for droplets advancing across copper
and copper oxide surfaces. Nanofluids alone were found to have no effect on the
advancing contact angle. However, nanofouling that resulted after the dryout of
nanofluid could significantly reduce the advancing contact angle. This reduction in
advancing contact angle can improve evaporation during the rewetting following bubble
detachment. However, the reduction in contact angle due to nanofouling is decreased for
highly wetting systems. This may explain the observation that the CHF of highly wetting
systems such as ethanol on glass is more difficult to enhance.
Nanofluids spray cooling was found to be ineffectual because of poor particle
stability and fluid properties. Dilute suspensions were found to have no effect on spray
cooling heat transfer. However, a suspension of 0.5 g/L alumina-in-ethanol was found to
degrade CHF by 49% due to a reduction in volumetric flow rate. Scaling analysis based
on impinging jet flow correlations indicated that improvements in the heat transfer
coefficient due to increases in the thermal conductivity with nanofluid are offset by more
dramatic degradation due to increases in viscosity. More simple, robust, and cost
effective spray cooling enhancement is possible by direct surface modification such as
the addition of microstructures.
Spray cooling enhancement due to surface modification was studied with a series
of high aspect ratio open microchannels. The microchanneled surfaces were found to
enhance both the single-phase and two-phase regimes of spray cooling. Single-phase
enhancement was found to be non-linear and approach an optimum just past the longest
fins (5 mm) tested. Heat transfer enhancement was significantly less than the linear area

126
enhancement suggesting another and/or additional mechanisms. A one-dimensional
model was developed, which indicated that heat transfer was not limited by the
conduction resistance of the fin. Rather, it appears that heat transfer is limited by the
amount of sensible heat that can be absorbed by the liquid.
With microchanneled surfaces, the greatest increase in heat transfer occurred
when two-phase effects were triggered. The onset of two-phase effects was earlier (lower
temperature) with finned surfaces resulting in up to 181% enhancement. In fact, the two-
phase regime began earlier as the fin length increased. Interestingly, while the onset
temperature was a function of fin length, it was unaffected by changes in the nozzle
pressure/flow rate (for both finned and the flat surfaces). This indicates that the velocity
of the liquid film inside the channel is not responsible for the onset of two-phase effects
and therefore not responsible for the large heat transfer enhancement observed with
microchanneled surfaces. Instead, the most likely mechanisms responsible are liquid
pooling or starvation in channels that are shaded from the impinging droplets.
Finally, the spray efficiency was calculated for enhanced surfaces and was found
to be much higher than for bare surfaces. In fact, spraying structured surfaces was found
to result in spray efficiencies that approached the theoretical maximum because of the
greater heater area and earlier onset of two-phase effects.
7.2. Contributions to the State of the Art
Spray cooling and nanofluids are current, important, and controversial topics in
heat transfer. This dissertation is based on carefully designed experiments that provide
novel data that answers open questions posed in the literature and allows for the
development of models based on previously unforeseen mechanisms. The major

127
conclusions have been discussed above but the specific contributions to the state of the
art are as follows:
• Nanofluids based on highly wetting base fluids have been shown to be less
effective at enhancing CHF in pool boiling.
• Similarly, high energy surfaces such as metal oxides were also shown to be
less susceptible to nanofluid CHF enhancement.
• The advancing contact angle of nanofluid was found to be indistinguishable
from pure fluid on clean surfaces. However, the advancing contact angle was
significantly reduced following nanofluid dryout due to nanofouling.
• These observations lead to the proposed boiling enhancement mechanism:
nanoparticle deposition from dryout during bubble growth reduces the
advancing contact angle of the rewetting liquid during bubble detachment.
The thinner liquid wedge rewetting the surface has improved evaporation
efficiency.
• Spray cooling of nanofluids was found to be detrimental due to the poor
stability of the particles in the vapor phase as well as the fluid viscosity
increasing faster than the thermal conductivity.
• High aspect ratio open microchannels were found to be a very efficient and
effective means of enhancing spray cooling since the microchannels triggered
the onset of two-phase effects at lower temperatures. Spray efficiencies were
found to approach unity for fins of moderate (1 – 3 mm) length.
• The onset of two-phase effects was found to occur earlier as the depth of the
channel increased suggesting that liquid distribution was key to the

128
enhancement. Further, the onset of two-phase effects was found to be
independent of flow rate, which suggests that geometry and not the velocity of
liquid in the channel is responsible for the heat transfer enhancement.
7.3. Suggestions for Future Work
The first major thrust of this research was to determine if boiling CHF could be
enhanced by nanofluids and by what mechanism. Any effort such as this that is aimed at
enhancing CHF is clearly hampered by a lack of a validated model of the basic
phenomena. This study as well as many others has shown that contact angle plays an
important role in determining CHF, and this fundamental topic merits further
investigation.
While the fundamental mechanism underlying boiling nanofluids is now known,
the study of nanofluids boiling could be continued by using different suspensions such as
those based on carbon nanotubes (CNT), preferably suspensions whose thermal
conductivity rises faster than the viscosity. The high aspect ratio of CNT’s may provide
greater thermal transport, particularly in the nucleate boiling regime. Alternatively, this
work could be extended through the study of surfaces that have been pretreated with
nanostructures. Micro-structuring is known to enhance boiling, and the nanofouling
observed in the present work was found to be beneficial in some cases. A systematic
study of boiling on nanostructures offers an exciting new area of research with significant
potential for CHF enhancement.
The second major thrust of this research was aimed at understanding the
mechanisms underlying spray cooling enhancement with microchannels. The discovery
that the greatest enhancement was caused by early onset of two-phase effects suggests

129
future research topics. First, what is the fundamental cause of the onset of two-phase
effects in spray cooling? What roles do nucleation suppression, secondary nuclei, and
film thickness play in the onset of two-phase effects?
To better understand spray cooling of microstructured surfaces, future research
could be targeted towards direct observation of the spatial temperature distribution on the
microstructures. The present work has shown that the onset of two-phase effects is key to
the enhancement. By looking at the heat transfer in regions of the structure that are
shaded from the impinging droplets, this phenomena could be better understood. Then
by changing the shape and distribution of the spray, the heat flux could be further
enhanced.

130
APPENDIX A: SURFACE WETTABILITY AND CONTACT ANGLE DEFINITIONS
Wettability refers to the affinity between a liquid and a solid, and it is a function
of the various inter- and intramolecular bond strengths. This is typically quantified by
measuring the liquid/solid contact angle, θ (see Fig. 66). The two extremes of wettability
are completely wetting surfaces with θ = 0° and completely nonwetting when θ = 180°.
Between these two extremes the liquid/surface combination is said to wetting when 0° ≤ θ
≤ 90° and nonwetting when 90° < θ ≤ 180°. For instance, liquids with strong
intramolecular bonds (i.e., high surface tension) will tend to be nonwetting and form
more spherical droplets on surfaces. Similarly, solid surfaces with low surface free
energy (e.g., Teflon) will also tend to be difficult to wet. Conversely, surfaces with high
surface energy, like glass, will tend to be wetted easily.
Fig. 66. Nonwetting (left) and wetting (right) liquid droplets.
For a smooth surface, the equilibrium contact angle can be determined using
Young’s equation:
(49)
Young’s equation is a force balance between the various interfacial tensions, which need
to be determined.
θ θ
θσσσ coslvslsv +=

131
However, the physics of how liquids spread across real solid surfaces remains
difficult and poorly understood (de Gennes, 1985). Surface irregularities and chemical
contamination result in different contact angles even with similar experiments. At least
part of the problem is due to the difference between equilibrium and dynamic contact
angles.
The equilibrium contact angle is often measured using the sessile drop method in
which a liquid droplet is placed on a solid surface. The angle between the base of the
droplet and the solid surface is then optically measured. This is a simple and convenient
method. However, one problem with this method is that if performed in an open
environment, the droplet is free to evaporate. During evaporation the angle is not at
equilibrium and will change as the droplet shrinks in base diameter.
Dynamic contact angles vary depending on the motion history of the
liquid/solid/vapor contact line. As a liquid moves across a dry surface, the angle is
termed an advancing contact angle. If liquid retreats from a previously wet portion of the
surface, then the angle formed is termed a receding contact angle. The two angles are
shown schematically in Fig. 67, where the advancing contact angle is generally larger
than the receding. The hysteresis effect is likely due to surface inhomogenity, surface
roughness, and/or impurities on the surface (Carey, 1992).
Fig. 67. Schematic of advancing and receding contact angles.
θrθal lv s

132
APPENDIX B: LIBRARY OF COMPUTER PROGRAMS
The data acquisition and analysis programs developed for this dissertation are
listed in Table 11. Soft copies of the codes are available on CDROM from the author.
Table 11. List of data acquisition and analysis programs.
Filename Function angle_proc5a.m Perform edge detection on advancing drops angle_proc5b.m Calculate contact angle DAQ_menu2.m Data acquisition for thick-film heater DAQ_menu4.m Data acquisition for copper block heater ethanol_data.m Data reduction of boiling ethanol data (main) fin_liquid_temperature_rise.m Finite-difference solver used in Appendix E MonteCarlo_LSQ_tempgrad.m Monte Carlo error analysis of temperature
gradient data MonteCarlo_sprayeff.m Monte Carlo error analysis for spray efficiencies postDAQ_2pt1.m Data reduction of boiling water data (function) postDAQ_2pt2.m Data reduction of boiling ethanol data (function) spray7.m Data reduction for extended surfaces data
(function) spray7_master.m Data reduction for extended surfaces data (main) water_data.m Data reduction of boiling water data (main)

133
APPENDIX C: MONTE CARLO UNCERTAINTY CALCULATIONS
Monte Carlo methods are used to solve physical problems through a series of
statistical experiments based on applying mathematical operations to random numbers
(“Monte-Carlo Method,” 1956). In this dissertation, the Monte Carlo method has been
used in lieu of standard propagation of uncertainty techniques† (Lyons, 1996) when the
quantity of interest is affected by correlated errors (e.g. multiple measurements made
with the same instrument as occurs during calibration). Brown et al. (1996) reviewed this
problem and noted that historically these types of problems have been dealt with by
assuming either no correlation or perfect correlation. Both assumptions can be
mathematically intensive (specifically when there are many parameters) and can result in
erroneous error estimates. Alternatively, the Monte Carlo method can be applied to
create a database of possible results where each run of the simulation is based on nominal
values plus or minus random errors, including correlated and uncorrelated errors as
required. The final error estimate can then be determined from this database of possible
results. The Monte Carlo method used in the present work was based in part on Brown et
al. (1996). Consider the following simple example as an illustration of the technique.
A 10,000 run simulation (outlined in Fig. 68) is used to estimate the error in an
arbitrary data reduction equation (DRE) based on two variables:
(50)
† Standard propagation of uncertainty techniques are usually based on the first-order Taylor expansion.
If the function is non-linear, then the errors must be small for this model to be appropriate. Furthermore, when variables are correlated the covariance term must be retained. For complex non-linear functions of many variables, this method can be unwieldy involving many terms; and attempts to verify the validity of the first-order model necessitates even greater complexity.
)1( 21 xxy +=

134
Fig. 68. Monte Carlo error estimation technique.
Assuming there are only two independent sources of error, the error in y depends
on four inputs: x1 and x2 (the nominal measurements) and σ1 and σ2 (the estimated errors).
Error Estimate σ1
Nominal Measurement x1
Increment i
DRE yi = x1,i(1+x2,i)
Error Estimate σ2
σ1,i Nominal Measurement x2
Begin Iterationi = 1 to 10,000
NO If i = 10,000
Calculate Error
( )
9999
10000
1
2∑=
−
= ii
y
yy
σ
YES
Random Numbern1,i
σ2,i
Random Numbern2,i
x1,i x2,i
yi

135
Each step in the simulation involves creating random errors to be added to the nominal
measurements. Actually, a pseudo-random number generator will be used, but the term
random is used for convenience. To generate random errors, MATLAB is first used to
generate normally distributed random numbers (n1,i and n2,i) with a mean of 0 and a
standard deviation of 1. Then, the random numbers are multiplied by the estimated errors
(σ1 and σ2) to obtain a random errors (σ1,i and σ2,i). Then, these random error are added to
the nominal measurements (x1 and x2) to obtain random measurements (x1,i and x2,i). In
this example, σ1 and σ2 have been assumed to be uncorrelated and were therefore based
on different random numbers. If they had been correlated, then the same random error
would be added to each of the nominal measurements. For each iteration of the
simulation, the random measurements (x1,i and x2,i) are used in the DRE to obtain a
simulated resultant, yi. Running the simulation 10,000 times is the statistical equivalent
of repeating the experiment 10,000 times, each time resulting in a slightly different result
due to random measurement errors. After all 10,000 simulations, the standard deviation
of y is determined, σy.
The above example could have been treated with the standard propagation of
uncertainty technique (if the errors are small) since the errors are uncorrelated and the
partial derivatives can be easily determined. However, consider least-squares fitting,
where the fitting coefficients are dependent on many variables and the errors can be
correlated. It is for these types of problems, specifically calibration, for which this
technique has been applied in this dissertation. The specific calculations are discussed in
Chapter 4.

136
APPENDIX D: CALCULATION OF PF-5060 VAPOR SPECIFIC HEAT
The vapor specific heat of PF-5060 (C6F14) was estimated using the Yoneda
(1979) method for organic compounds in the ideal gas state. This estimate is based on
the principle of group contribution in which the molecule is decomposed into atom
groups, called functional groups. The inclusion of each functional group results in a
contribution to the specific heat. Each contribution includes a constant, linear and
quadratic term. The temperature dependent specific heat is then estimated by summing
all group contributions as in Eq. 51.
(51)
The original database was created by deconstructing molecules with known
properties into functional groups. Only the effects of nearest-neighbor atoms and
geminal effects (the effects of atoms separated by one atom) were included since more
complicated molecular interactions are usually insignificant. This method is extremely
useful in estimating thermophysical properties since countless different organic
compounds exist in nature as well as in the lab. Their properties are determined by
constructing the molecule of interest from the original set of functional groups. The
specific steps used in calculating the specific heat of PF-5060 (C6F14) are given in Table
12. Following these steps, the specific heat as a function of temperature was estimated to
be:
(52)
[ ]2
10001000/
∆+∆+∆=⋅ ∑∑∑ TcTbaKmolJc
I
ii
I
ii
I
iip
[ ] [ ] [ ]2, 0013041.04998.238.229/ KTKTKkgJc vp −+=⋅

13
7
Tabl
e 12
. Ste
ps in
spec
ific
heat
cal
cula
tion
for C
6F14
.
Step
D
escr
iptio
n
Num
ber
of
Tim
es
Step
is
App
lied
Res
ultin
g M
olec
ule
∆a
[J/(m
ol·K
)]
∆b
[J/(m
ol·K
2 )]∆c
[J
/(mol
·K3 )]
Met
hane
ba
se g
roup
1
HC
H
H H
16.7
1 65
.65
-9.9
6
Prim
ary
met
hyl
subs
titut
ion
1
CC
HH
H H
H H
-9.9
2 10
3.87
-4
3.54
Seco
ndar
y m
ethy
l su
bstit
utio
n (ty
pe 1
,1)
1
CC
HCH
HH
HH
H
H
-3.6
8 98
.22
-42.
29
Seco
ndar
y m
ethy
l su
bstit
utio
n (ty
pe 1
,2)
1
CC H
H
CC
HH
HH
HHH
H
1.47
81
.48
-31.
48
Seco
ndar
y m
ethy
l su
bstit
utio
n (ty
pe 1
,2)
1
CC
CC
C HH
HH
H
HH
H
H
HH
H
1.47
81
.48
-31.
48

13
8
Seco
ndar
y m
ethy
l su
bstit
utio
n (ty
pe 1
,2)
1
CC
CC
CC
HH
H H
H H
H H
H H
H H
H H
1.47
81
.48
-31.
48
Seco
ndar
y m
ethy
l su
bstit
utio
n (ty
pe 1
,2)
1
CC
CC
CC
CH
H H
H H
H H
H H
H H
H H
H
H
H
1.47
81
.48
-31.
48
Seco
ndar
y m
ethy
l su
bstit
utio
n (ty
pe 1
,2)
1
HC
CC
CC
CC
CH
H
H
H H
H H
H H
H H
H H
H H
H H
1.47
81
.48
-31.
48
Seco
ndar
y m
ethy
l su
bstit
utio
n (ty
pe 2
,2)
3
-0.6
3 90
.73
-37.
56
Seco
ndar
y m
ethy
l su
bstit
utio
n (ty
pe 3
,2)
3
-6.9
1 11
1.79
-5
1.71
C
CC
CC
CC
CC
CH
H
H
H
H
H
H
H
H
H
H
H
C
H
H
H
HH
HH
HH H
HH
C
CC
CC
CC
CC
C CC
CH
H
H
H
H
HH
H
H
H
HH
H
H
H
H
H
H
H
H
H
C
H
H
H
H H
H H
H H

13
9
Seco
ndar
y m
ethy
l su
bstit
utio
n (ty
pe 2
,4)
3
-1.2
1 92
.11
-38.
02
Seco
ndar
y m
ethy
l su
bstit
utio
n (ty
pe 3
,4)
3
-4.1
9 12
9.62
-6
6.36
Fluo
rine
fund
amen
tal
repl
acem
ent
14
CC
CC
CC
FF
F F
F F
F F
F F
F F
F F
4.23
-7
6.62
24
.58
Type
nu
mbe
r co
rrec
tion
42
1.
59
-0.5
4 1.
59
Mul
tiple
su
bstit
utio
n co
rrec
tion
10
-2
.01
-0.7
5 -1
.76
C
CC
CC
CC
CC
CC
C CC
CH
H
H
H
H
HH
H
HH
H
HH
H
H
H
HH
H
H
H
H
H
H
H
H
H
C
C
H
H
H
HH
H HH
H
C
CC
CC
CC
CC
CC
C CC
CC
CH
H
H
H
H
HH
H
HH
H
HH
H
H
H
HH
H
H
H
H
H
H
H
H
HH
H
HH
H
H
C C
C
H
H
H
HH
H
HH
H

140
Yoneda (1979) estimated a 4% standard deviation for the specific heat estimation
of fluorine compounds. However, an independent test of uncertainty was performed.
Following the same procedure as outlined above for C6F14 , the specific heat of C5F12 was
determined and compared to NIST Standard Reference Database 69 (2005). This
resulted in agreement within 2.1%.
141
APPENDIX E: NUMERICAL MODEL OF FIN HEAT TRANSFER
The analytical model presented in Chapter 6 indicated that even long (5 mm) fins
did not exhibit large temperature drops (i.e., the fin temperature profile was almost flat).
However, the heat transfer of the microchanneled surfaces was found to be much less
than one would expect based on the area enhancement. Therefore, the likely limiting
mechanism was the finite liquid supply. To verify this conclusion, a numerical model
was developed in which all of the heat transfer from the fin was absorbed by the finite
liquid supply provided by the spray. Specifically, convection heat transfer was balanced
by sensible heat transfer as shown in Eq. 53.
(53)
The following assumptions were made in the present model:
• One-dimensional (no variations along the length of the channel or through the
thickness of the fin)
• Steady-state
• No phase-change of the liquid or dryout
• No liquid splashing
• Mass flow rate from the spray is distributed uniformly throughout the
microchanneled surface
• Local heat transfer coefficient is constant (only the local liquid temperature is
variable)
• Convection from the fin’s tip (top surface only) is based on the unheated
liquid temperature, Tspray
( ) lpl TcmTThA ∆=− &

142
E.1. Model Development
A coupled (set of two) one-dimensional finite difference approach was used to
model the heat transfer within the fin as well as the heat transfer from the fin to the liquid
supplied by the spray. The tip region of the fin is shown schematically in Fig. 69. The
fin’s energy balance is a balance between conduction within the fin and convection to the
local liquid. However, all of the heat lost by the fin must be absorbed by the liquid,
which is flowing down the fin. To determine how much the liquid has heated up, the
liquid was discretized into differential control volumes. The mass of liquid in each
control volume was determined by dividing the total mass flow rate (provided by the
spray) by the number of fins on the surface (i.e., the mass was assumed to be uniformly
distributed).
Fig. 69. Finite difference model of the fin tip region. The solid fin and liquid are shown as shaded and unshaded, respectively. Heat is conducted within the fin and convected to the local liquid, which moves down the fin.
Tl,n+1 Tl,n Tl,n-1 Tl,n-2
Tspray
Tn+1 Tn Tn-1 Tn-2
symmetry

143
The nodal energy balance equations were developed as follows. Consider row n:
The local convection is determined by the solid to liquid temperature difference Tn – Tl,n.
The temperature of the solid, Tn, is then determined by summing this local convection
along with conduction into and out of the solid differential control volume, as shown in
Eq. 54.
(54)
The local liquid temperature, Tl,n, is determined by how much heat transfer has occurred
upstream. Specifically, Tl,n is determined by Tl,n+1 and the convection heat transfer
occurring between rows n+1 and n. This is shown schematically in Fig. 70. Specifically,
the temperature of the liquid at row n is given by Eq. 55.
(55)
Fig. 70. Finite difference model showing liquid temperature increase due to local convection between rows n+1 and n. The solid fin and liquid are shown as shaded and unshaded, respectively.
Tl,n+1 Tl,n
Tn+1 Tn
( )
( )c
f
nnc
nlf
n
kAxhP
TTkA
TxhP
T2
11,
2
2∆
+
++∆
=−+
xhPcm
xhPcm
TTT
T
f
p
f
pnlnn
nl
∆+
−
∆−+
=++
&
&
21
12
1,1
,

144
Different nodal equations were required for the fin’s tip since the model was
developed assuming that the top surface is cooled by fresh liquid at Tspray. However,
since the differential control volume associated with the tip node includes side area, the
local liquid temperature must also be determined. The tip temperature and local liquid
temperatures are given by Eqs. 56 and 57, respectively.
(56)
(57)
Fig. 71. Finite difference model showing liquid temperature increase due to convection at the tip. The solid fin and liquid are shown as shaded and unshaded, respectively.
As is often the case in finite difference models, the nodal equations are
interdependent and must be solved iteratively. The code was developed in MATLAB and
solved iteratively with a grid size of 51 x 2. The convergence criteria was 10-5 °C per
iteration.
c
f
nlc
fsprayn
tip
kAxhP
kxh
TkA
xhPT
kxhT
T
21
22
,
2
1
∆+∆+
∆+∆+
=−
( ) sprayspraytipp
cnl + T - TT
cmhA
T&
=,
Tl,n Tl,n-1
Tspray
Tn Tn-1

145
E.2. Model Results
The first step required to use the above described model was model validation. If
the liquid supply is infinite, then the present model should revert to the conventional
analytical solution for a convection cooled fin, Eq. 45. Temperature profiles for various
mass flow rates are shown in Fig. 72. For high mass flow rates, the liquid supply is
effectively infinite and the analytical solution is approximated. As the flow rate
decreases, the liquid begins to heat up as it flows down the fin. This causes the
temperature profile to depart from the analytical solution (specifically, the fin profile
shifts upward toward the base temperature). At very low flow rates (like those used in
the experiment) the liquid approaches the same temperature as the fin, which greatly
reduces the local heat transfer.

146
Fig. 72. Temperature profiles for various mass flow rates. Plots a) – d) show mass flow rates of 1000 m& , 10 m& , 2 m& , and m& , respectively, where m& is the average per fin mass flow rate used in the experiment. h = 10,000 W/m2·K.
Heat transfer from a conventional fin (with an infinite fluid supply) is highest near
the base, where the temperature difference is the greatest. However, with a low mass
flow rate, the local temperature difference is greatest at the tip of the fin. The local heat
flux is shown as a function of position along the fin for various mass flow rates in Fig.
73. Again, the highest mass flow rate approximates the analytical solution, with heat
transfer decreasing along the length of the fin. However, as the mass flow rate is
decreased, the tip heat transfer increases. Then, at very low flow rates (like those used in
a) b) c) d)

147
the experiments), the heat transfer monotonically increases along the length of the fin.
Not only is the tip heat transfer relatively higher than the base heat transfer at low mass
flow rates, but the tip heat transfer is absolutely higher for low mass flow rates because
the fin tip is hotter (note the flattened temperature profile in Fig. 72).
Fig. 73. Local heat flux as a function of position on fin. Solid symbols show heat flux off the top surface of the fin (rather than the top node in the model). h = 10,000 W/m2·K.
With the average per fin mass flow rate used in the experiments (0.000146 kg/s),
this model indicates that over 35% of the total heat transfer is occurring through the tip
because of the high local liquid temperature difference. In contrast, the trough (not
modeled directly) would only add about 1% more to the total heat transfer since the local
liquid temperature at the base is so low. This supports the “upper limit” assumption
made in Chapter 6, in which the heat transfer from the trough is neglected.
m&m&
m&m&
m&

148
The above results were for a heat transfer coefficient of 10,000 W/m2·K, which is
consistent with the unenhanced surface spray cooling curves presented in Chapter 6.
However, for the conditions modeled, the total heat transfer from the enhanced surface
was determined to be 70 W. This compares to 104 W observed in the experiment. To
explore the origin of this discrepancy, the heat transfer coefficient was varied. The
results of heat transfer coefficient variation are shown in Fig. 74. Increasing the heat
transfer coefficient, increases the rate at which the liquid temperature increases. This has
a negative feedback effect in the sense that raising the heat transfer coefficient should
increase heat transfer, but it results in lower local temperature difference. The modeled
heat transfer was never observed to reach the experimentally observed value. The
discrepancy is therefore likely due to the assumptions inherent in the model such as
uniform mass distribution and possibly the no phase-change assumption.

149
Fig. 74. Single fin heat transfer as a function of heat transfer coefficient.
E.3. Conclusions and Implications
A two-dimensional finite difference model was developed independently of the
analytical model described in Chapter 6. The numerical model was based on the
convection heat transfer driven by local temperature differences. The local liquid
temperature was found to increase rapidly for low mass flow rates like those used in the
experiments. In fact, using the average per channel mass flow rate that was used in the
experiments, the liquid was found to heat up almost to the fin temperature. If one
considers the variation in mass flow rate due to the full-cone spray pattern, the outer
channels (with their low flow rates) could be expected to suffer very large liquid
temperature rises. One could speculate that this is responsible for the early onset of two-
m&m&
m&m&

150
phase effects described in Chapter 6. Conversely, the fluid rich inner channels would
experience a more modest but still very significant liquid temperature rise. The result of
the liquid temperature increase is a flattening of the fin temperature profile, consistent
with the analytical model presented in Chapter 6.
The liquid temperature rise has important implications to the local and total heat
transfers. Since the local liquid temperature is significant hotter when it reaches the base
of the fins, the troughs’ contribution to heat transfer is negligible despite it having the
highest local surface temperature. Conversely, the numerical model indicates that the fin
tips dominant the heat transfer process because of the cold local liquid supplied by the
spray. This model may explain why the pyramidal pin fins used by Silk et al. (2004)
resulted in poorer performance than the cubic pin fins despite having similar surface area.

151
REFERENCES 3M, 2000, “Fluorinert Electronic Liquid FC-72 Product Literature.” 3M, 2003, “Performance Fluid PF-5060 Product Literature.” Ammerman, C.N., and You, S.M., 1996, “Determination of the Boiling Enhancement Mechanism Caused by Surfactant Addition to Water,” Journal of Heat Transfer, 118, pp. 429-435. ASM International, 2001, ASM Specialty Handbook: Copper and Copper Alloys, Ed. J.R. Davis, ASM International: Materials Park, OH, p. 453. Bang, I.C., and Chang, S.H., 2005, “Boiling Heat Transfer Performance and Phenomena of Al2O3-Water Nano-fluids from a Plain Surface in a Pool,” International Journal of Heat and Mass Transfer, 48, pp. 2407-2419. Battey, J.F., Nelson, N.J., and Barnett, D.J., 1988, “Copper Etching Process and Product,” US Patent Number 4,767,662. Brown, K.K., Coleman, H.W., Steele, W.G., and Taylor, R.P., 1996, “Evaluation of Correlated Bias Approximations in Experimental Uncertainty Analysis,” AIAA Journal, 34(5), pp. 1013-1018. Canny, J., 1986, “A Computational Approach to Edge Detection,” IEEE Transactions on Pattern Analysis and Machine Intelligence, 8(6), pp. 679-698. Chandra, S., di Marzo, M., Qiao, Y.M., and Tartarini, P., “Effect of Liquid-Solid Contact Angle on Droplet Evaporation,” Sparse Water Sprays in Fire Protection, M. di Marzo, Ed., United States Department of Commerce, NIST-GCR-96-687, pp. 168-194. Chen, J.C., 1966, “Correlation for Boiling Heat Transfer to Saturated Fluids in Convective Flow,” Industrial & Engineering Chemistry Process Design and Development, 5(3), pp. 322-339. Chen, R.-H., Chow, L.C., and Navedo, J.E., 2002, “Effects of Spray Characteristics on Critical Heat Flux in Subcooled Water Spray Cooling,” International Journal of Heat and Mass Transfer, pp. 4033-4043. Choi, S.U.S., Zhang, Z.G., Yu, W., Lockwood, F.E., and Grulke, E.A., 2001, “Anomalous Thermal Conductivity Enhancement in Nanotube Suspensions,” Applied Physics Letters,79(14), pp. 2252-2254. Chon, C.H., Kihm, K.D., Lee, S.P., and Choi, S.U.S., 2005, “Empirical Correlation Finding the Role of Temperature and Particle Size for Nanofluid (Al2O3) Thermal Conductivity Enhancement,” Applied Physics Letters, 87, paper no. 153107.

152
Chow, L.C., Sehmbey, M.S., and Pais, M.R., 1995, “Critical Heat Flux in High Heat Flux Spray Cooling,” The Symposium on Thermal Science and Engineering in Honor of Chancellor Chang-Lin Tien, Editors: R. O. Buckius., University of California, Berkeley, Berkeley, CA. pp. 407-413. Das, S.K, Putra, N, and Roetzel, W., 2003, “Pool Boiling Characteristics of Nano-fluids,” International Journal of Heat and Mass Transfer, 46, pp. 851-862. Demiray, F., and Kim, J., 2004, “Microscale Heat Transfer Measurements During Pool Boiling of FC-72: Effect of Subcooling,” International Journal of Heat and Mass Transfer, 47, pp. 3257-3268. Dillion, H.E., and Penoncello, S.G., 2003, “A Fundamental Equation for the Calculation of the Thermodynamic Properties of Ethanol,” Fifteenth Symposium on Thermophysical Properties, June 22-27, 2003, Boulder, Colorado, U.S.A. As Cited In: Klein, S.A., 2006, Engineering Equation Solver. Computer Software, F-Chart Software, Version 7.693. di Marzo, M., 1996, Sparse Water Sprays in Fire Protection, United States Department of Commerce, NIST-GCR-96-687. Ding, Y., Alias, H., Wen, D., and Williams, R.A., 2006, “Heat Transfer of Aqueous Suspensions of Carbon Nanotubes (CNT Nanofluids),” International Journal of Heat and Mass Transfer, 49, pp. 240-250. Eastman, J.A., Choi, U.S., Li, S., Thompson, L.J., and Lee, S., 1997, “Enhanced Thermal Conductivity through the Development of Nanofluids,” Proc. of the Materials Research Society Symposium, 457, pp. 3-11. Eastman, J.A., Choi, S.U.S., Li, S., Yu, W., and Thompson, L.J., 2001, “Anomalously Increased Effective Thermal Conductivities of Ethylene Glycol-Based Nanofluids Containing Copper Nanoparticles,” Applied Physics Letters, 78(6), pp. 718-720. Estes, K.A., and Mudawar, I., 1995a, “Comparison of Two-Phase Electronic Cooling Using Free Jets and Sprays,” Journal of Electronic Packaging, 117, pp. 323-332. Estes, K. A. and Mudawar, I., 1995b, “Correlation of Sauter Mean Diameter and Critical Heat Flux for Spray Cooling of Small Surfaces,” International Journal of Heat and Mass Transfer, 38(16), pp. 2985-2996. Fabbri, M., Jiang, S., and Dhir, V.K., 2003, “Experimental Investigation of Single-Phase Micro Jets Impingment Cooling for Electronic Applications,” Proc. of the 2003 ASME Summer Heat Transfer Conference, July 21-23, 2003, Las Vegas, Nevada, paper no. HT2003-47162. Friedlander, S.K., 2000, Smoke, Dust, and Haze: Fundamentals of Aerosol Dynamics, 2nd Ed., Oxford University Press, New York.

153
Gandhi, K.S., 2007, “Thermal Properties of Nanofluids: Controversy in the Making?” Current Science, 92(6), pp. 717-718. Halif, R., and Flusser, J., 1998, “Numerically Stable Direct Least Squares Fitting of Ellipses,” Proceedings of the Sixth International Conference on Computer Graphics and Visualization, 1, pp. 125 – 132. Hamilton, R.L., and Crosser, O.K., 1962, “Thermal Conductivity of Heterogeneous Two-Component Systems,” Industrial and Engineering Chemistry Fundamentals, 1(3), pp. 187-191. Han, Z.H., Yang, B., Kim, S.H., and Zachariah, M.R., 2007, “Application of Hybrid Sphere/Carbon Nanotube Particles in Nanofluids,” Nanotechnology, 18, paper no. 105701 . Haramura, Y., and Katto, Y., 1983, “New Hydrodynamic Model of Critical Heat Flux Applicable Widely to Both Pool and Forced Convection Boiling on Submerged Bodies in Saturated Liquids,” International Journal of Heat and Mass Transfer, 26, pp. 389–399. Henry, C.D., 2005, Nucleate Pool Boiling Characteristics from a Horizontal Microheater Array, Ph.D. dissertation, University of Maryland, College Park. Horacek, B., Kiger, K.T., and Kim, J., 2005, “Single Nozzle Spray Cooling Heat Transfer Mechanisms,” International Journal of Heat and Mass Transfer, 48, pp. 1425-1438. Horacek, B., Kim, J., and Kiger, K.T., 2004, “Spray Cooling Using Multiple Nozzles: Visualization and Wall Heat Transfer Measurements,” IEEE Transactions on Device and Materials Reliability, 4(4), pp. 614-625. Horibe, A., Fukusako, S., and Yamada, M., 1996, “Surface Tension of Low-Temperature Aqueous Solutions,” International Journal of Thermophysics, 17(2), pp. 483-493. Hsieh, S.S., Fan, T.-C., and Tsai, H.-H., 2004, “Spray Cooling Characteristics of Water and R-134a. Part I: Nucleate Boiling,” International Journal of Heat and Mass Transfer, 47, pp. 5703-5712. Incropera, F.P., and DeWitt, D.P., 2002, Fundamentals of Heat and Mass Transfer, 5th Ed., John Wiley & Sons, New York, p. 133. Kandlikar, S.G., 2001, “A Theoretical Model to Predict Pool Boiling CHF Incorporating Effects of Contact Angle and Orientation,” Journal of Heat Transfer, 123, pp. 1071-1079. Kim, H., Kim, J., and Kim, M., 2006b, “Experimental Study on the Characteristics and Mechanism of Pool Boiling CHF Enhancement Using Nano-Fluids,” Proceedings of ECI International Conference on Boiling Heat Transfer, Spoleto, May 7-12, 2006. No pagination.

154
Kim, J., 2006, “Spray Cooling Heat Transfer: The State of the Art,” Proceedings of the 6th International Conference on Boiling Heat Transfer, May 7-12, Spoleto, Italy. No pagination. Kim, J.H., Kim, K.H., and You, S.M., 2004a, “Pool Boiling Heat Transfer in Saturated Nanofluids,” Proceedings of IMECE04 2004 ASME International Mechanical Engineering Congress and Exposition, November 13-20, 2004, Anaheim, California, paper no. IMECE2004-61108. Kim, J.H., You, S.M., and Choi, S.U.S., 2004b, “Evaporative Spray Cooling of Plain and Microporous Coated Surfaces,” International Journal of Heat and Mass Transfer, 47, pp. 3307–3315. Kim, S.J., Bang, I.C., Buongiorno, J., and Hu, L.W., 2006a, “Effects of Nanoparticle Deposition on Surface Wettability Influencing Boiling Heat Transfer in Nanofluids”, Applied Physics Letters, 89, paper no. 153107. Kurihara, H.M., and Myers, J.E., 1960, “The Effects of Superheat and Surface Roughness on Boiling Coefficients,” AIChE Journal, 6(1), pp. 83-91. Kutateladze, S.S., 1952, Heat Transfer in Condensation and Boiling, 2nd Ed., Atomic Energy Commission Report, AEC-TR-3770. Lemmon, E. W., McLinden, M. O., and Friend, D. G., 2005, “Thermophysical Properties of Fluid Systems” in NIST Chemistry WebBook, NIST Standard Reference Database Number 69, Eds. P.J. Linstrom and W.G. Mallard, June 2005, National Institute of Standards and Technology, Gaithersburg MD, 20899 (http://webbook.nist.gov). Liaw, S.P., and Dhir, V.K., 1989, “Void Fraction Measurements During Saturated Pool Boiling of Water on Partially Wetted Vertical Surfaces,” Journal of Heat Transfer, 111, pp. 731-738. Lin, L., and Ponnappan, R., 2004, “Critical Heat Flux of Multi-Nozzle Spray Cooling,” Journal of Heat Transfer, 126(3), pp. 482-485. Liu, H., 2000, Science and Engineering of Droplets: Fundamentals and Applications, William Andrew Publishing, Norwich, NY. Lloyd, J.R., and Moran, W.R., 1974, “Natural Convection Adjacent to Horizontal Surfaces of Various Planforms,” ASME Paper 74-WA/HT-66. Lowery, A.J., Jr., and Westwater, J.W., 1957, “Heat Transfer to Boiling Methanol – Effect of Added Agents,” Industrial and Engineering Chemistry, 49(9), pp. 1445-1448. Lyons, L., 1996, A Practical Guide to Data Analysis for Physical Science Students, Cambridge University Press, Cambridge, Great Britain.

155
Maxwell, J.C., 1873, A Treatise on Electricity and Magnetism, Clarendon Press, Oxford. Moghaddam, S., 2006, Microscale Study of Nucleation Process in Boiling of Low-Surface-Tension Liquids, Ph.D. dissertation, University of Maryland, College Park. “Monte-Carlo Method,” 1956, The International Dictionary of Physics and Electronics, D. Van Nostrand Company, Inc., Princeton, NJ., pp. 591-592. Moreno, G., Jr., Oldenburg, S.J., You, S.M., and Kim, J.H., 2005, “Pool Boiling Heat Transfer of Alumina-Water, Zinc Oxide-Water and Alumina-Water+Ethylene Glycol Nanofluids,” Proc. of HT2005 2005 ASME Summer Heat Transfer Conference, July 17-22, 2005, San Francisco, California, USA. Morgan, V.T., 1975, “The Overall Convective Heat Transfer from Smooth Circular Cylinders,” in T.F. Irvine and J.P. Hartnett, Eds., Advances in Heat Transfer, Vol. 11, Academic Press, NY. As Cited In: Incropera, F.P., and DeWitt, D.P., 2002, Fundamentals of Heat and Mass Transfer, 5th Ed., John Wiley & Sons, New York, p. 517. Mudawar, I., and Anderson, T.M., 1993, “Optimization of Enhanced Surfaces for High Flux Chip Cooling by Pool Boiling,” Journal of Electronic Packaging, 115, pp. 89-100. Mudawar, I., and Valentine, W.S., 1989, “Determination of the Local Quench Curve for Spray-Cooled Metallic Surfaces,” Journal of Heat Treating, 7, pp. 107-121. Murshed, S.M.S., Leong, K.C., and Yang, C., 2006, “Thermal Conductivity of Nanoparticle Suspensions (Nanofluids),” Proc. of the 2006 IEEE Conference on Emerging Technologies - Nanoelectronics, January 10-13, 2006, pp. 155- 158. Nakayama, W., Daikoku, T., Kuwahara, H., and Nakajima, T., 1980, “Dynamic Model of Enhanced Boiling Heat Transfer on Porous Surfaces,” Journal of Heat Transfer, 102, pp. 445-450. Nakayama, W., Daikoku, T., and Nakajima, T., 1982, “Effects of Pore Diameters and System Pressure on Saturated Pool Nucleate Boiling Heat Transfer from Porous Surfaces,” Journal of Heat Transfer, 104, pp. 286-291. Nakayama, W., Nakajima, T., and Hirasawa, S., 1984, “Heat Sink Studs Having Enhanced Boiling Surfaces For Cooling Microelectronic Components,” ASME Paper No. 84-WA/HT-89. Nanophase Technologies Corporation, 2003, “NanoTek Aluminum Oxide Product Literature.” Nasr, G.G., Yule, A.J., and Bendig, L., 2002, Industrial Sprays and Atomization: Design, Analysis, and Applications, Springer-Verlag, London, UK.

156
Pais, M.R., Chow, L.C., and Mahefkey, E.T., 1992, “Surface Roughness and Its Effects on the Heat Transfer Mechanism in Spray Cooling,” Journal of Heat Transfer, 114, pp. 211-219. Pak, B.C., and Cho, Y.I., 1998, “Hydrodynamic and Heat Transfer Study of Dispersed Fluids with Submicron Metallic Oxide Particles,” Experimental Heat Transfer, 11(2), pp. 151-170. Pautsch, A. G., and Shedd, T. A., 2005, “Spray Impingement Cooling with Single- and Multiple-nozzle Arrays. Part I: Heat Transfer Data Using FC-72,” International Journal of Heat and Mass Transfer, 48, pp. 3167-3175. Pautsch, A.G., and Shedd, T.A., 2006, “Adiabatic and Diabatic Measurements of the Liquid Film Thickness during Spray Cooling with FC-72,” International Journal of Heat and Mass Transfer, 49, pp. 2610-2618. Potash, M., Jr. and Wayner, P. C., Jr., 1972, “Evaporation from a Two-Dimensional Extended Meniscus,” International Journal of Heat and Mass Transfer, 15, pp. 1851-1863. Putnam, S.A., Cahill, D.G., Braun, P.V., Ge, Z., and Shimmin, R.G., 2006, “Thermal Conductivity of Nanoparticle Suspensions,” Journal of Applied Physics, 99, paper no. 084308. Prasher, R., Song, D., Wang, J., and Phelan, P., 2006, “Measurements of Nanofluid Viscosity and Its Implications for Thermal Applications,” Applied Physics Letters, 89, paper no. 133108. Ramaswamy, C., Joshi, Y., Nakayama, W., and Johnson, W.B., 2003, “Effects of Varying Geometrical Parameters on Boiling from Microfabricated Enhanced Structures,” Journal of Heat Transfer, 125, pp. 103-109. Rini, D.P., Chen, R.-H., and Chow, L.C., 2002, “Bubble Behavior and Nucleate Boiling Heat Transfer in Saturated FC-72 Spray Cooling,” Journal of Heat Transfer, 124, pp. 63-72. Rybicki, J.R., and Mudawar, I., 2006, “Single-phase and Two-Phase Cooling Characteristics of Upward-facing and Downward-facing Sprays,” International Journal of Heat and Mass Transfer, 49, pp. 5-16. Sakamoto, H., Kim, J., Kiger, K., and Steinthorsson, E., 2006, “Multi-Nozzle Spray Cooling: Effects of Spray Interaction,” Proceedings of the Thirteenth International Heat Transfer Conference, August 13-18, 2006, Sydney, Australia.

157
Sehmbey, M.S., Chow, L.C., Pais, M.R., and Mahefkey, T., 1994, “High Heat Flux Spray Cooling: A Review,” in Heat Transfer in High Heat Flux Systems, HTD-Vol. 301, ASME Publishing, pp. 39-46. Shedd, T.A., and Pautsch, A.G., 2005, “Spray Impingement Cooling with Single- and Multiple-Nozzle Arrays. Part II: Visualization and Empirical Models,” International Journal of Heat and Mass Transfer, 48, pp. 3176-3184. Silk, E.A., Kim, J., and Kiger, K., 2004, “Investigation of Enhanced Surface Spray Cooling,” Proceedings of IMECE04 2004 ASME International Mechanical Engineering Congress and Exposition, November 13-20, 2004, Anaheim, California, paper no. IMECE2004-61753. Silk, E.A., Kim, J., and Kiger, K., 2005, “Spray Cooling Trajectory Angle Impact Upon Heat Flux Using a Straight Finned Enhanced Surface,” Proceedings of HT2005: ASME 2005 Heat Transfer Summer Conference, July 17–22, San Francisco, ASME, New York, ASME Paper No. HT2005-72634. Silk, E.A., Kim, J., and Kiger, K., 2006, “Spray Cooling of Enhanced Surfaces: Impact of Structured Surface Geometry and Spray Axis Inclination,” International Journal of Heat and Mass Transfer, 49, pp. 4910-4920. Sodtke, C., and Stephan, P., 2005, “Spray Cooling Heat Transfer on Micro Structured Surfaces,” Proc. of 6th World Conference on Experimental Heat Transfer, Fluid Mechanics, and Thermodynamics, April 17–21, Matsushima, Miyagi, Japan. Stephan, K., and Abdelsalam, M., 1980, “Heat-Transfer Correlations for Natural Convection Boiling,” International Journal of Heat and Mass Transfer, 23, pp. 73-87. Tachibana, F., Akiyama, M., and Kawamura, H., 1967, “Non-Hydrodynamic Aspects of Pool Boiling Burnout,” Journal of Nuclear Science and Technology, 4(3), pp. 121-130. Takata, Y., Hidaka, S., Cao, J.M., Nakamura, T., Yamamoto, H., Masuda, M., and Ito, T., 2005, “Effect of Surface Wettability on Boiling and Evaporation,” Energy, 30, pp. 209-220. Tilton, D.E., Tilton, C.L., Pais, M.R., and Morgan, M.J., 1992, “High-Flux Spray Cooling in a Simulated Multichip Module,” in Topics in Heat Transfer, Vol. 2, HTD-Vol. 206-2, ASME Publishing. Vassalo, P., Kumar, R., and D’Amico, S.D., 2004, “Pool boiling heat transfer experiments in silica-water nano-fluids,” International Journal of Heat and Mass Transfer, 47, pp. 407-411.

158
Wang, Y., Fisher, T.S., Davidson, J.L., and Jiang, L., 2002, “Thermal Conductivity of Nanoparticle Suspensions,” Proc. of the 8th AIAA/ASME Joint Thermophysics and Heat Transfer Conference, June 24-26, 2002, St. Louis, Missouri, paper no. AIAA 2002-3345. Wang, X., Xu, X., and Choi, S.U.S., 1999, “Thermal Conductivity of Nanoparticle-Fluid Mixture,” Journal of Thermophysics and Heat Transfer, 13(4), pp. 474-480. Wen, D., and Ding, Y., 2005, “Experimental Investigation into the Pool Boiling Heat Transfer of Aqueous Based γ-Alumina Nanofluids,” Journal of Nanoparticle Research, 7, pp. 265-274. Xue, H.S., Fan, J.R., Hu, Y.C., Hong, R.H., and Cen, K.F., 2006, “The Interface Effect of Carbon Nanotube Suspension on the Thermal Performance of a Two-Phase Closed Thermosyphon,” Journal of Applied Physics, 100, paper no. 104909. Yang, J., Chow, L.C., and Pais, M.R., 1996, “Nucleate Boiling Heat Transfer in Spray Cooling,” Journal of Heat Transfer, 118, pp. 668-671. Yang, Y., Zhang, Z.G., Grulke, E.A., Anderson, W.B., and Wu, G., 2005, “Heat Transfer Properties of Nanoparticle-in-Fluid Dispersions (Nanofluids) in Laminar Flow,” International Journal of Heat and Mass Transfer, 48, pp. 1107-1116. Yang, Y.M., and Maa, J.R., 1984, “Boiling of Suspension of Solid Particles in Water,” International Journal of Heat and Mass Transfer, 27(1), pp. 145-147. Yaws, C.L, 1999, Chemical Properties Handbook, McGraw-Hill Handbooks. As Cited In: Klein, S.A., 2006, Engineering Equation Solver. Computer Software, F-Chart Software, Version 7.693. You, S.M., 1990, “Pool Boiling Heat Transfer with Highly-Wetting Dielectric Fluids,” Ph.D. thesis, University of Minnesota. As Cited In: Wu, P.S., and Simon, T.W., 1994, “Effects of Dissolved Gases on Subcooled Flow Boiling from Small Heated Regions with and without Streamwise Concave Curvature,” Proceedings of the 1994 Intersociety Conference on Thermal Phenomena, Washington, DC, May 4-7, 1994. You, S.M., Bar-Cohen, A., and Simon, T.W., 1990, “Boiling Incipience and Nucleate Boiling Heat Transfer of Highly Wetting Dielectric Fluids from Electronic Materials,” IEEE Transactions on Components, Hybrids, and Manufacturing Technology, 13(4), pp. 1032-1039. You, S.M., Kim, J.H., and Kim, K.H., 2003, “Effect of Nanoparticles on Critical Heat Flux of Water in Pool Boiling Heat Transfer,” Applied Physics Letters, 83(16), pp. 3374-3376.