abstract document: the effect of ambient n:p ratio and
TRANSCRIPT
ABSTRACT
Title of Document: THE EFFECT OF AMBIENT N:P RATIO AND
LIGHT ON THE NITROGEN UPTAKE AND GROWTH OF SELECT ESTUARINE AND OCEANIC DINOFLAGELLATES
Ji Li, Doctor of Philosophy, 2011
Directed By: Patricia M. Glibert, Professor
Marine Estuarine Environmental Science
Increasing frequency of harmful algal blooms (HABs) have been observed in
eutrophic coastal ecosystems. The relationship between environmental factors
(nutrients and light) and bloom-forming dinoflagellates were explored in this
dissertation by both historical data analysis and laboratory experiments. The growth
and nitrogen (N) acquisition of the HAB dinoflagellates Prorocentrum minimum, P.
donghaiense, Karlodinium veneficum and Karenia brevis, were studied. It is
hypothesized that estuarine species Prorocentrum spp. develops blooms in relative
high N:P ratio water, while K. veneficum blooms near or lower than the Redfield
ratio; these species will grow faster in the N:P ratio in which they develop blooms,
even when these nutrients are not at limiting levels; Prorocentrum spp. preferentially
take up more DIN in high DIN:DIP ratio water, while Karlodinium can better use

other source of N in the low DIN water; low-light-adapted nitrogen acquisition by
Prorocentrum spp. serves as an adaptive advantage to grow in low light waters.
Historical data analysis showed that P. minimum generally develops blooms in
high DIN, high N:P ratio, but turbid water in Chesapeake Bay, while K. veneficum
blooms near or lower than the Redfield ratio, when DIN was depleted, but organic N
sources were still available. Following these results, the effects of ambient N:P ratio
and light on the growth and N acquisition of P. minimum and P. donghaiense were
studied in both batch and continuous culture (turbidistat). Prorocentrum spp. were
grown in a wide range of N:P ratios, and across a wide range of light intensities in
turbidistat. Experiments to determine rates of N acquisition of different N sources
were conducted using 15N tracer techniques at each N:P ratio and light treatment.
However, in culture, the growth of the Prorocentrum species was not
regulated by the ambient N:P ratio. When nutrients were sufficient, light, instead of
ambient N:P ratio, regulated the algal ability to acquire N. The adaptive strategies of
the two types of dinoflagellates, Prorocentrum spp. and Karlodinium/Karenia spp.,
are different. Prorocentrum minimum was shown to take up N in the dark. This light
independent N uptake allows it to be more competitive in the relative low light near-
shore water. Karlodinium/Karenia spp. apparently only takes up N in the light phase,
but it can be mixotrophic and directly use organic sources, and thus may be more
competitive after DIN was depleted.
The Droop model, which describes the growth rate regulated by the cell quota,
was used to interpret the relationship between N acquisition and the growth rate over
the diel cycle of growth. Prorocentrum spp. continuously take up nitrogen at night to

supplement the cell quota, and reaches the maximum cell quota at the beginning of
light phase, when they reach the higher growth rate in a diel cycle.
In eutrophic coastal systems (e.g., Chesapeake Bay), the ambient N:P ratio, as
well as light may be critical factors for HAB growth. The dinoflagellates studied here
have different adaptive strategies to grow in low light and to take advantage of high
nutrients in the eutrophic waters. Prorocentrum spp. may dominant the high DIN
water, while Karlodinium/Karenia spp. prefers organic nutrients.
THE EFFECT OF AMBIENT N:P RATIO AND LIGHT ON THE NITROGEN UPTAKE AND GROWTH OF SELECT ESTUARINE AND OCEANIC
DINOFLAGELLATES
By
Ji Li
Dissertation submitted to the Faculty of the Graduate School of the University of Maryland, College Park, in partial fulfillment
of the requirements for the degree of Doctor of Philosophy
2011 Advisory Committee: Professor Patricia M. Glibert, Chair Research Associate Professor Jeffrey C. Cornwell Professor Ming Li Dr. Peter Tango Professor Daniel Terlizzi, Dean’s Representative

© Copyright by Ji Li 2011

ii
Dedication
I dedicate this dissertation to my loving and supportive family.

iii
Acknowledgements
I would like to thank all people who have helped and inspired me during my
study.
I especially want to thank my advisor, Dr. Patricia M. Glibert, for her hard
work and guidance throughout this entire study and for believing in my abilities. Her
perpetual energy and enthusiasm in research had greatly motivated me. In addition,
she was always accessible and willing to help my research.
I would like to express my gratitude to Dr. Jeffrey Cornwell, Dr. Ming Li, Dr.
Peter Tango and Dr. Daniel Terlizzi as my academic committee members and
advisors. Their suggestions and encouragement helped me throughout the research
and writing of this thesis.
I like to express my thanks to Jeff Alexander, Cindy Shoemaker and Caroline
Solomon. Without their support in both lab and life, this dissertation would not have
been written.
I am appreciative for the support from Horn Point Laboratory fellowship and
student small grant.
Especially, I would like to give my special thanks to my wife Yonghui whose
patient love enabled me to complete this work.

iv
Table of Contents
Dedication ..................................................................................................................... ii Acknowledgements ...................................................................................................... iii Table of Contents ......................................................................................................... iv List of Tables .............................................................................................................. vii List of Figures ............................................................................................................ viii Chapter 1: Introduction ............................................................................................... 1
Eutrophication and Harmful Algal Blooms .......................................................... 1 N:P Ratio and Nutrient Limitation ........................................................................ 2 N:P Ratio Regulating Dinoflagellate Blooms ....................................................... 4 Light Dependence of Photosynthesis and Nutrient Uptake .................................. 6 Perspective of N:P ratio and Light - the Matrix ................................................... 8
Hypothesis............................................................................................................... 10 Research Objectives ................................................................................................ 10 References ............................................................................................................... 12 Figures..................................................................................................................... 19
Chapter 2: An Exploratory Analysis of Nutrients and Other Related Variables Related to Select Harmful Algal Bloom Events, in the Chesapeake Bay 1991-2008 .............. 21
Abstract ................................................................................................................... 21 Introduction ............................................................................................................. 22 Methods................................................................................................................... 25 Results ..................................................................................................................... 25
Eutrophic Level and Bloom Events .................................................................... 25 Spatial Distribution ............................................................................................. 27 Salinity ................................................................................................................ 28 Seasonal Records and Temperature .................................................................... 28 Secchi Depths and TSS ....................................................................................... 29 Dissolved Oxygen ............................................................................................... 30 Dissolved Carbon and Nutrients ......................................................................... 31 Components of Particulate Matter ...................................................................... 33
Discussion ............................................................................................................... 34 A Comparison with Ecosystems with Similar Nutrient Dynamics ..................... 34 A Comparison with Spatial Historical Data ........................................................ 36 The Spatial Variation of Nutrients and HAB Events .......................................... 39 The Environmental Factors and HAB Species ................................................... 41
References ............................................................................................................... 45 Figures..................................................................................................................... 54
Chapter 3: Effects of Ambient DIN : DIP Ratio on the Nitrogen Uptake of Harmful Dinoflagellate Prorocentrum minimum and Prorocentrum donghaiense in Turbidistat* ................................................................................................................. 90
Abstract ................................................................................................................... 90 Introduction ............................................................................................................. 91

v
Materials and Methods ............................................................................................ 93 Algae Culture ...................................................................................................... 93 Continuous Culture Design ................................................................................. 94 Experimental Design and Algal Growth ............................................................. 95 Nitrogen Uptake and Assimilation Experiments ................................................ 96 Analytical Methods ............................................................................................. 97 Data Analysis ...................................................................................................... 98
Results ..................................................................................................................... 98 Ambient Parameters and Cell Counts ................................................................. 98 Culture Growth in the Turbidistat ....................................................................... 99 Nitrogen Uptake Experiments ........................................................................... 100 Application of Droops Model ........................................................................... 103
Discussion ............................................................................................................. 104 Value of Tubidostat Approach .......................................................................... 105 Value of Droop’s Model Approach .................................................................. 108 The N:P Ratios in the Coastal Ecosystems ....................................................... 109
References ............................................................................................................. 112 Tables .................................................................................................................... 120 Figures................................................................................................................... 122
Chapter 4: Effects of Light on Growth and Nitrogen Uptake of Prorocentrum minimum and Prorocentrum donghaiense ................................................................ 133
Abstract ................................................................................................................. 133 Introduction ........................................................................................................... 134 Materials and Methods .......................................................................................... 136
Algal Culture ..................................................................................................... 136 Continuous Culture Design ............................................................................... 137 Experimental Design and Algal Growth ........................................................... 138 Nitrogen Uptake and Assimilation Experiments .............................................. 139 Analytical Methods ........................................................................................... 140 Data Analysis .................................................................................................... 141
Results ................................................................................................................... 142 Ambient Parameters .......................................................................................... 142 Growth Rate in the Turbidistat ......................................................................... 142 Nitrogen Uptake Experiments ........................................................................... 143
Discussion ............................................................................................................. 145 Growth Regulation in Turbidistat ..................................................................... 145 N Uptake versus Irradiance ............................................................................... 149 Light Condition and Prorocentrum Blooms ...................................................... 151
References ............................................................................................................. 153 Tables .................................................................................................................... 161 Figures................................................................................................................... 163
Chapter 5: Growth and Competition of Several Harmful Dinoflagellates under Different Nutrient and Light Condition .................................................................... 173
Abstract ................................................................................................................. 173 Introduction ........................................................................................................... 174 Materials and Methods .......................................................................................... 177
vi
Algae Cultures and Methods of Growth ........................................................... 177 Experimental Design ......................................................................................... 178 Analytical Protocols .......................................................................................... 180 Data Analysis and Simulation ........................................................................... 181
Results ................................................................................................................... 181 Experiment 1 ..................................................................................................... 181 Experiment 2 ..................................................................................................... 183 Experiment 3 ..................................................................................................... 183 Experiment 4 ..................................................................................................... 184 Experiment 5 ..................................................................................................... 185 Experiment 6 ..................................................................................................... 185
Discussion ............................................................................................................. 186 Growth Rate ...................................................................................................... 186 Nutrient Strategy – Autotrophy and Mixotrophy.............................................. 188
References ............................................................................................................. 196 Tables .................................................................................................................... 205 Figures................................................................................................................... 208
Chapter 6: Research Conclusions ............................................................................. 222 Dinoflagellate Blooms and the Matrix of Nutrients and Light ............................. 222 The Application of Cell Quota Model .................................................................. 226 The Improvement of Cell Quota Model ................................................................ 229 References ............................................................................................................. 230 Figure .................................................................................................................... 232
Complete References ................................................................................................ 233
vii
List of Tables
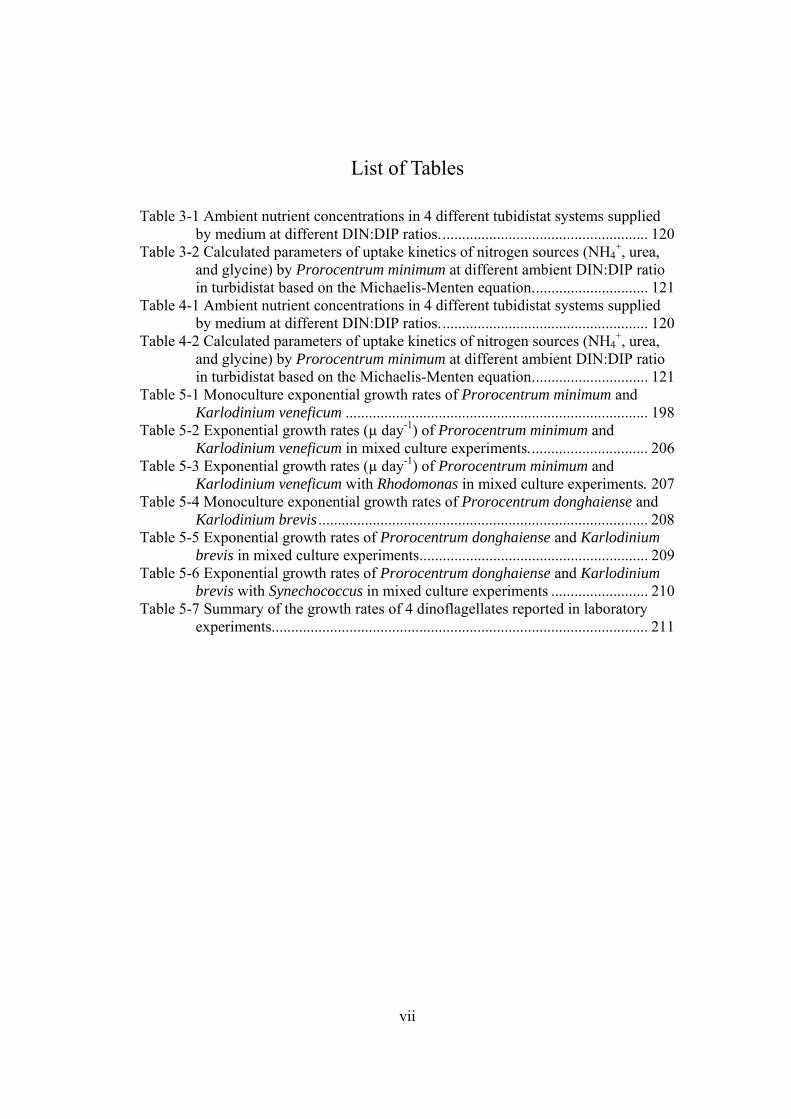
Table 3-1 Ambient nutrient concentrations in 4 different tubidistat systems supplied by medium at different DIN:DIP ratios. ..................................................... 120
Table 3-2 Calculated parameters of uptake kinetics of nitrogen sources (NH4+, urea,
and glycine) by Prorocentrum minimum at different ambient DIN:DIP ratio in turbidistat based on the Michaelis-Menten equation. ............................. 121
Table 4-1 Ambient nutrient concentrations in 4 different tubidistat systems supplied by medium at different DIN:DIP ratios. ..................................................... 120
Table 4-2 Calculated parameters of uptake kinetics of nitrogen sources (NH4+, urea,
and glycine) by Prorocentrum minimum at different ambient DIN:DIP ratio in turbidistat based on the Michaelis-Menten equation. ............................. 121
Table 5-1 Monoculture exponential growth rates of Prorocentrum minimum and Karlodinium veneficum .............................................................................. 198
Table 5-2 Exponential growth rates (µ day-1) of Prorocentrum minimum and Karlodinium veneficum in mixed culture experiments. .............................. 206
Table 5-3 Exponential growth rates (µ day-1) of Prorocentrum minimum and Karlodinium veneficum with Rhodomonas in mixed culture experiments. 207
Table 5-4 Monoculture exponential growth rates of Prorocentrum donghaiense and Karlodinium brevis ..................................................................................... 208
Table 5-5 Exponential growth rates of Prorocentrum donghaiense and Karlodinium brevis in mixed culture experiments ........................................................... 209
Table 5-6 Exponential growth rates of Prorocentrum donghaiense and Karlodinium brevis with Synechococcus in mixed culture experiments ......................... 210
Table 5-7 Summary of the growth rates of 4 dinoflagellates reported in laboratory experiments. ................................................................................................ 211
viii
List of Figures Figure 1-1 Comparison of the range in ambient nitrogen: phosphorus ratios during
different phases of the blooms in the East China Sea and in different phytoplankton assemblages among the southwest Florida shelf during May 2005.. ............................................................................................................ 19
Figure 1-2 Predominant dinoflagellate life-form Types associated with the turbulence-nutrient matrix along an onshore–offshore continuum characterizing pelagic habitats . ................................................................... 20
Figure 2-1 The routinely sampled stations in the Chesapeake Bay and its tributaries by Maryland Departments of Natural Resources ......................................... 54
Figure 2-2 a. samples of different type of eutrophic level chlorophyll a recorded at Chesapeake Bay area (1991-2008); b, samples of different type of Prorocentrum minimum cell density level recorded; c, samples of different type of Karlodinium veneficum cell density level recorded; d, the number of samples of different type of cyanobacteria cell density level recorded ........ 55
Figure 2-3 The spatial distribution of Chl a samples in the Chesapeake Bay and its tributaries 1991-2008. ................................................................................... 56
Figure 2-4 The spatial distribution of Prorocentrum minimum in the Chesapeake Bay and its tributaries 1991-2008. ....................................................................... 57
Figure 2-5 The spatial distribution of Karlodinium veneficum in the Chesapeake Bay and its tributaries 2003-2008. ....................................................................... 58
Figure 2-6 The spatial distribution of cyanobacteria in the Chesapeake Bay and its tributaries 1991-2008. ................................................................................... 59
Figure 2-7 The salinity of samples with different eutrophic levels of Chl a and harmful algae densities: Prorocentrum minimum, Karlodinium veneficum and cyanobacteria in the Chesapeake Bay .................................................... 60
Figure 2-8 The ambient parameters of Prorocentrum minimum (PM), Karlodinium veneficum (KV) and cyanobacteria (Cyn) in blooms in the Chesapeake Bay ...................................................................................................................... 61
Figure 2-9 The month number of samples with different eutrophic levels of Chl a and harmful algae densities: Prorocentrum minimum, Karlodinium veneficum and cyanobacteria in the Chesapeake Bay .................................................... 62
Figure 2-10 The water temperature of samples with different eutrophic levels of Chl a and harmful algae densities: Prorocentrum minimum, Karlodinium veneficum and cyanobacteria in the Chesapeake Bay .................................. 63
Figure 2-0-11 The secchi depth of samples with different eutrophic levels of Chl a and harmful algae densities: Prorocentrum minimum, Karlodinium veneficum and cyanobacteria in the Chesapeake Bay .................................. 64
Figure 2-12 The total suspended solids (TSS) of samples with different eutrophic levels of Chl a and harmful algae densities: Prorocentrum minimum, Karlodinium veneficum and cyanobacteria in the Chesapeake Bay ............. 65
Figure 2-13 The dissolved oxygen (DO) of samples with different eutrophic levels of Chl a and harmful algae densities: Prorocentrum minimum, Karlodinium veneficum and cyanobacteria in the Chesapeake Bay .................................. 66
ix
Figure 2-14 The dissolved organic carbon (DOC) of samples with different eutrophic levels of Chl a and harmful algae densities: Prorocentrum minimum, Karlodinium veneficum and cyanobacteria in the Chesapeake Bay ............. 67
Figure 2-15 The dissolved organic nitrogen (DIN) concentration of samples with different eutrophic levels of Chl a and harmful algae densities: Prorocentrum minimum, Karlodinium veneficum and cyanobacteria in the Chesapeake Bay ............................................................................................ 68
Figure 2-16 The phosphate (PO43-) concentration of samples with different eutrophic
levels of Chl a and harmful algae densities: Prorocentrum minimum, Karlodinium veneficum and cyanobacteria in the Chesapeake Bay ............. 69
Figure 2-17 The dissolved inorganic nitrogen (DIN) to dissolved inorganic phosphorus (DIP) ratios of samples with different eutrophic levels of Chl a and harmful algae densities: Prorocentrum minimum, Karlodinium veneficum and cyanobacteria in the Chesapeake Bay .................................. 70
Figure 2-18 The ambient carbon, nitrogen and phosphorus rates of Prorocentrum minimum (PM), Karlodinium veneficum (KV) and cyanobacteria (Cyn) in blooms in the Chesapeake Bay ..................................................................... 71
Figure 2-19 The particle carbon (PC) concentration of samples with different eutrophic levels of Chl a and harmful algae densities: Prorocentrum minimum, Karlodinium veneficum and cyanobacteria in the Chesapeake Bay ...................................................................................................................... 72
Figure 2-20 The particle nitrogen (PN) concentration of samples with different eutrophic levels of Chl a and harmful algae densities: Prorocentrum minimum, Karlodinium veneficum and cyanobacteria in the Chesapeake Bay ...................................................................................................................... 73
Figure 2-21 The particle phosphorus (PP) concentration of samples with different eutrophic levels of Chl a and harmful algae densities: Prorocentrum minimum, Karlodinium veneficum and cyanobacteria in the Chesapeake Bay ...................................................................................................................... 74
Figure 2-22 The particle carbon (PC) to particle phosphorus (PP) ratios of samples with different eutrophic levels of Chl a and harmful algae densities: Prorocentrum minimum, Karlodinium veneficum and cyanobacteria in the Chesapeake Bay ............................................................................................ 75
Figure 2-23The particle carbon (PC) to particle phosphorus (PP) ratios of samples with different eutrophic levels of Chl a and harmful algae densities: Prorocentrum minimum, Karlodinium veneficum and cyanobacteria in the Chesapeake Bay ............................................................................................ 76
Figure 2-24 The particle nitrogen (PN) to particle phosphorus (PP) ratios of samples with different eutrophic levels of Chl a and harmful algae densities: Prorocentrum minimum, Karlodinium veneficum and cyanobacteria in the Chesapeake Bay ............................................................................................ 77
Figure 2-25 Comparison of the range in ambient N:P ratios during different phase of the blooms in the East China Sea (ECS) during May 2005, in different phytoplankton assemblages along the southwest Florida Shelf (SFS) during May 2003 and different phase of blooms in the Chesapeake Bay from 1991 to 2008. ......................................................................................................... 78
x
Figure 2-26 The spatial distribution of salinities in surface waters along the length of Chesapeake Bay major axis in May and August in the time range of 2000-2008, 1991-1999, and 1982-1987. ................................................................ 79
Figure 2-27 The spatial distribution of dissolved inorganic nitrogen (DIN) in surface waters along the length of Chesapeake Bay major axis in May and August in the time range of 2000-2008, 1991-1999, and 1982-1987 ........................... 80
Figure 2-28 The spatial distribution of phosphate (PO43-) in surface waters along the
length of Chesapeake Bay major axis in May and August in the time range of 2000-2008, 1991-1999, and 1982-1987 ................................................... 81
Figure 2-29 The spatial distribution of dissolved organic nitrate: dissolved organic phosphate (N:P) ratio in surface waters along the length of Chesapeake Bay major axis in May and August in the time range of 2000-2008, 1991-1999, and 1982-1987. ............................................................................................. 82
Figure 2-30 The spatial distribution of chlorophyll a in surface waters along the length of Chesapeake Bay major axis in May and August in the time range of 2000-2008, 1991-1999, and 1982-1987. .................................................. 83
Figure 2-31. The summer surface water salinity in the Chesapeake Bay ................... 84 Figure 2-32 The seasonal variation of monthly average dissolved inorganic nitrogen
(DIN) concentrations in 3 zones of Chesapeake Bay. .................................. 85 Figure 2-33 The seasonal variation of monthly average phosphate (PO4
3-) concentrations in 3 zones of Chesapeake Bay. ............................................. 86
Figure 2-34 The seasonal variation of ambient dissolved inorganic nitrogen (N): phosphate (P) ratios in 3 zones of Chesapeake Bay. .................................... 87
Figure 2-35 The seasonal variation of monthly average chlorophyll a concentrations in 3 zones of Chesapeake Bay. ..................................................................... 88
Figure 2-36 The seasonal variation of monthly maximum cell densities of cyanobacteria in Zone I and Prorocentrum minimum and Karlodinium veneficum in Zone II of Chesapeake Bay. .................................................... 89
Figure 3-1 The setup of a turbidistat system ............................................................ 122 Figure 3-2 Diurnal growth rates of Prorocentrum donghaiense in turbidistat system
for 4 constant 12 h: 12 h light dark cycles (96 hrs). ................................... 123 Figure 3-3 a. Diurnal growth rates of Prorocentrum minimum in turbidistat system at
14: 10 h light dark cycle. b. Diurnal growth rates of Prorocentrum donghaiense in turbidistat system at 12: 12 h light dark cycle ................... 124
Figure 3-4 a. Average growth rates of Prorocentrum minimum in a 14h: 10h light dark cycle at different ambient N:P ratios. b. Average growth rates of P. minimum in the light phase of 14h: 10h light dark cycle at different ambient N:P ratios. c. Average growth rates of P. donghaiense in a 12h: 12h light dark cycle at different ambient N:P ratios. d. Average growth rates of P. donghaiense in the light phase of 12h: 12h light dark cycle at different ambient N:P ratios ...................................................................................... 125
Figure 3-5 Kinetic relationships between nitrogen specific uptake rates V (h-1, upper panels) and assimilation rates A (h-1, lower panels) of NH4
+, urea, and glycine with 15N substrate concentration (µM-N) by Prorocentrum minimum at different DIN:DIP ratio cultures. ............................................................ 126

xi
Figure 3-6 Nitrate specific uptake rates V (h-1) and assimilation rates A (h-1) of NH4+,
urea, and glycine with 15N substrate concentration (µM-N) by Prorocentrum minimum grown at different DIN:DIP ratios. ............................................. 127
Figure 3-7 a. The NO3− specific uptake rates (V, h-1) of Prorocentrum donghaiense
grown at different ambient N:P ratios; b. The NO3− specific assimilation
rates (A, h-1) of P. donghaiense grown at different ambient N:P ratios. c. The NH4
+ uptake rates of P. donghaiense grown at different ambient N:P ratios; d. The NH4
+ assimilation rates of P. donghaiense grown at different ambient N:P ratios. ................................................................................................... 128
Figure 3-8 The assimilation efficiencies % (assimilation rate/ uptake rate) of NO3− by
Prorocentrum donghaiense grown at different ambient N:P ratios; b. The assimilation efficiencies % (assimilation rate/ uptake rate) of NH4
+ by P. donghaiense grown at different ambient N:P ratios ................................... 129
Figure 3-9 The ratio of specific N assimilation rate/ growth rate (A/µ) of Prorocentrum minimum for major N sources at different DIN:DIP ratios 130
Figure 3-10 The ratio of specific N uptake rate/ growth rate (V/µ) of Prorocentrum donghaiense for NO3
- (a) and NH4+ (b) at different ambient N:P ratios; the
ratio of specific N assimilation rate/ growth rate (A/µ) of P. donghaiense for NO3
- (c) and NH4+ (d) at different ambient N:P ratios ............................... 131
Figure 3-11 The conceptual model of the diel cell nutrient quota variation in a light-dark cycle. ................................................................................................... 132
Figure 4-1 Diurnal growth rates of Prorocentrum donghaiense in turbidistat system for 4 constant 12 h: 12 h light dark cycles (96 hrs).. .................................. 163
Figure 4-2 a. Diurnal growth rates based on changes in optical signals of Prorocentrum minimum in turbidistat system at 14 h: 10 h light dark cycle. b. Diurnal growth rates of Prorocentrum donghaiense in turbidistat system at 14 h: 10 h light dark cycle. ..................................................................... 164
Figure 4-3 a. Average growth rates of Prorocentrum minimum in a 14 h: 10 h light dark cycle at different ambient N:P ratios. b. Average growth rates of P. minimum in the light phase of 14 h: 10 h light dark cycle at different ambient N:P ratios. ................................................................................................... 165
Figure 4-4 Diurnal growth rates based on changes in optical signals of Prorocentrum donghaiense in turbidistat systems in 12 h: 12 h light dark cycles at different light intensities ............................................................................................ 166
Figure 4-5 Average diurnal growth rates (●) and average growth rates based on changes in optical signals of Prorocentrum donghaiense in the light phase (○) in a 12 h: 12 h light dark cycle at different ambient light irradiance. .. 167
Figure 4-6 The relationship of N (Nitrate (NO3-), ammonium (NH4
+), urea and glycine) uptake rates of Prorocentrum minimum at different irradiances. . 168
Figure 4-7 Average specific uptake rates V (h-1) of 4 nitrogen substrates (Nitrate (NO3
-), ammonium (NH4+), urea and glycine) near ambient concentration by
Prorocentrum donghaiense in high light and low light incubation at different ambient N:P ratios. ..................................................................................... 169
Figure 4-8 Kinetic relationships between nitrogen specific uptake rates V (h-1) of NO3-
and NH4+ with 15N substrate concentration (µM-N) by Prorocentrum
donghaiense in different light irradiance. ................................................... 170

xii
Figure 4-9 Average specific uptake rates V (h-1) and assimilation rates A (h-1) of nitrogen substrates nitrate (NO3
-) and ammonium (NH4+) near ambient
concentration by Prorocentrum donghaiense growing in high light and low light treatments ........................................................................................... 171
Figure 4-10 Ratio of assimilation rates A : uptake rates V of nitrogen substrates nitrate (NO3
-) and ammonium (NH4+) by Prorocentrum donghaiense
growing in high light and low light treatments. ......................................... 172 Figure 5-1 Time course of growth of Prorocentrum minimum (a) and Karlodinium
veneficum (b) in monoculture with 2 nitrogen sources NO3- (a, c) and urea
(b, d) at high and low N:P ratios (HNP, LNP) and high and low light intensities (HL, LL) .................................................................................... 212
Figure 5-2 Time course of growth of Prorocentrum minimum and Karlodinium veneficum in mixed culture with 2 nitrogen sources at 2 N:P ratios and 2 light intensities ............................................................................................ 214
Figure 5-3 Time course of growth of Prorocentrum minimum and Karlodinium veneficum with Rhodomonas in mixed culture with NO3
- at 2 N:P ratios and 2 light intensities ......................................................................................... 215
Figure 5-4 Time course of growth of Prorocentrum donghaiense (a., b.) and Karenia brevis (c., d.) in monoculture with 2 nitrogen sources NO3
- (a., c.) and urea (b., d.) at high and low N:P ratios (HNP, LNP) and high and low light intensities (HL, LL) .................................................................................... 216
Figure 5-5 Time course of growth of Prorocentrum donghaiense and Karenia brevis in mixed culture with 2 nitrogen sources at 2 N:P ratios and 2 light intensities .................................................................................................... 218
Figure 5-6 Time course of growth of Prorocentrum donghaiense, Karenia brevis and Synechococcus in mixed culture at 2 N:P ratios and 2 light intensities ..... 219
Figure 5-7 The exponential grow rates of 4 harmful dinoflagellates Prorocentrum minimum (PM), P. donghaiense (PD), Karlodinium veneficum (KV) and Karenia brevis (KB) in 3 sets of culture setting with treatments of high light and low light; low N:P ratio and high N:P ratio ......................................... 221
Figure 6-1 The conceptual model of the bloom development in the Chesapeake Bay: Prorocentrum minimum developed blooms on DIN in the spring; Karlodinium veneficum developed blooms on DON or directly feeding on other microalgae as food sources. .............................................................. 232

1
Chapter 1: Introduction
Eutrophication and Harmful Algal Blooms
There has been a global increase in nutrient input to the coastal marine
ecosystem as a result of increasing population in coastal areas, more urbanization, and
increasing use of fertilizer for agriculture (Smith 2003, Smith et al. 2006, Andersen et
al. 2006, Glibert et al. 2008). Eutrophication, defined as “the enrichment of water by
nutrients, especially nitrogen (N) and/or phosphorus (P), causing an accelerated
growth of algae and higher forms of plant life to produce an undesirable disturbance
to the balance of organisms present in the water and to the quality of water
concerned” by European Commission Nitrates Directive (http://www.cearac-
project.org/2ndCEAWS/presen_PDF /Ulrich_CLAUSSEN.pdf), has been considered
as one of the major threats to health of marine ecosystems (Smith et al. 1999, Smith
2003, Andersen et al. 2006, Smith et al. 2006). Using this definition, eutrophication is
mostly concerned with the macronutrients (N and P) and the undesirable increases of
phytoplankton biomass. Human activities have been one of the most important
contributors to the increase in N and P loading to the coastal system. In the United
States, N fertilizer consumption has a four-fold increase from the 1960s and
phosphate (PO43-) fertilizer consumption also doubled (USDA 2008). As a result, N
and P enrichment to the coastal ecosystem by human activities has been increasing
(Howarth et al. 2002). One prominent example is that N fluxes have increased 10 to
15 fold or more in coastal areas in past few decades (Jaworski et al. 1997, Howarth
2008).

2
In the past several decades, there have also been global increases in harmful
algal blooms (HABs) in frequency, intensity and geographic distribution. HABs have
caused many ecological, economic and human health problems in coastal areas
(Hallegraeff 1993, Smayda 1997, Anderson et al. 2002, Glibert et al. 2005a, Glibert et
al. 2008a, Heisler et al. 2008). At least in part, the increases of HABs have been
strongly correlated to the global increase in eutrophication level (Paerl 1997,
Anderson et al. 2002, Anderson et al. 2008, Glibert et al. 2008a, Heisler et al. 2008).
Eutrophication caused by the high terrestrial nutrients input is one of the most
important mechanisms of HABs events (Hallegraeff 1993, Anderson et al. 2002,
Smayda 2002, Glibert and Burkholder 2006).
N:P Ratio and Nutrient Limitation
Even though phytoplankton biomass has shown strong positive
relationships with N and P enrichment all over the world (Anderson et al. 2002, Smith
2006, Anderson et al. 2008, Glibert et al. 2008a, Heisler et al. 2008), the linkages
between bulk quantities of nutrients (N, P) and algal blooms are complex (Anderson
et al. 2008, Glibert et al. 2008a). The ratios of these nutrients could be very critical to
regulate phytoplankton communities (Smayda 1990, Hodgkiss and Ho 1997, Flynn
2002, Li et al. 2009b). There have been many studies on N:P ratios and their effect on
the phytoplankton biomass (Radach et al. 1990, Smayda 1990, Riegman 1995,
Burkholder and Glasgow 1997). N:P ratios have been used as an important
determinant in the question of whether N or P is the more limiting nutrient. The
Redfield ratio (N:P = 16:1, Redfield 1934, 1958) has been used successfully to define

3
the limiting nutrient in many ecosystems (Hecky et al. 1993, Doering et al. 1995,
Justic et al. 1995, Koerselman and Meuleman 1996, Lee et al. 1996). However, N and
P load in the coastal water is complicated and does not always keep a close
stoichometric balance in most ecosystems. While the total N and P load to the coastal
environments has increased in the past several decades, the increases of N and P to
coastal ecosystems have not necessarily been proportionate. For example, while both
N and P fertilizer consumption has increased in USA since the 1960s, N fertilizer
consumption has increased over 4 fold , but P fertilizer consumption only increased
80% up to 2006 (USDA 2008). Actually, the consumption of P fertilizer reached its
peak in 1979 and has slightly decreased after that year (USDA 2008). One of reasons
is that the principal source of effluent P was from P in laundry detergent, and the use
of P detergent has been gradually replaced by P-free detergent since the late 1970s
(Doemel and Brooks 1975, Sharfstein et al. 1977, Hartig and Horvath 1982,
Berthouex et al. 1983, Maki et al. 1984, Hoffman and Bishop 1994, Lee and Joneslee
1995). This unbalanced increase of N and P nutrients loading could change the N: P
ratio in the coastal water and subsequently change the ecosystem structure. This shift
could be from seasonal to decades. A shift in the N:P ratios in coastal waters could
result in an alteration in dominant species in the phytoplankton community (Phillips
and Tanabe 1989, Bulgakov and Levich 1999, Stelzer and Lamberti 2001, Lagus et
al. 2004, Paerl et al. 2004, Vrede et al. 2009). For example, the phytoplankton
community of downstream Neuse River, USA, shifted from an N-limited
cyanobacteria dominated freshwater phytoplankton community to a P-limited
community after the P detergent ban in 1988 in this area (Paerl et al. 2004). As a
4
result of P reduction, N substrates taken up by phytoplankton in the downstream
decreased and more N was delivered to the lower estuary and stimulated HABs
comprised of dinoflagellates, cryptomonads, and diatoms there (Paerl et al. 2004).
N:P Ratio Regulating Dinoflagellate Blooms
Changes in the N:P ratio in inorganic and organic forms were suggested to be
important in the bloom succession in the Chanjiang River estuary and East China Sea
(ECS, Li et al. 2009). The Changjiang River is the third longest river of the world.
Annual freshwater input is 9.32×10¹¹ m3, and annual input of N is 6.3×10⁶ tonne (t)
and P is 0.13×10⁶ t (Shen et al. 2003), representing roughly a doubling of nutrient
input in the past 20 years (Shen et al. 2003). While both N and P input by human
usage have increased, the recent increases have been far greater in N. In 2005, China
nitrogenous fertilizer production reached 36 ×106 t, including 20 ×106 t of urea
fertilizer, a 5-fold increase since 1989 (Shen et al. 2003). The annual dissolved
inorganic nitrogen (DIN) load to the coastal water from the Changjiang River has
reached 1.4 ×10⁶ t, which is higher than the Mississippi River and the Amazon River
(Goolsby and Battaglin 2000, Duan et al. 2008). The total N off Changjiang River
estuary has been shown to be about 70 to 110 µM-N, and is mostly in the form of
NO3--N (Shen et al. 2003). The total P is about 2 to 25 µM-P, mostly as particulate P;
PO43--P is only about 10% to 20% of the total P (Yan and Zhang 2003). As a result,
the N:P ratio is typically > 100 near the river mouth (Chai et al. 2006, Zhang et al.
2007), which is much higher than the Redfield ratio and suggests P limitation.
Large scale dinoflagellate blooms in these areas in late spring and early
summer have been recorded in the past decade (Zhou et al. 2003). These more

5
frequent and persistent algal blooms are thought to result from increasing nutrient
inputs to the ECS (Anderson et al. 2002, Zhou et al. 2003, Glibert et al. 2006). The
dinoflagellate Prorocentrum donghaiense has been found to be the dominant species
in this region since large-scale field studies began in 2000. During late spring and
early summer of 2005, large scale (> 15,000 km2) mixed dinoflagellate blooms
developed in the coastal ECS. Karenia mikimotoi was the dominant HAB species in
the first stage of the bloom from late May and was succeeded by P. donghaiense
approximately 2 weeks later. Samples were taken and experiments were conducted in
the bloom region during 3 cruises of the Chinese Ecology and Oceanography of
Harmful Algal Blooms (CEOHAB) Program during the bloom progression (Li et al.
2009). Experiment results supported that there was P limitation in these regions and
suggested that the dominant bloom species and their temporal and spatial distribution
were related to the ambient N:P ratios (Li et al. 2010). The uptake rates of N nutrients
were also related to the ambient N:P ratios (Li et al. 2009). These results suggested
ambient N:P ratio might be an important factor regulating the succession of dominant
blooms species from K. mikimotoi to P. donghaiense. Ambient N:P ratio was also
suggested to drive the phytoplankton community in the southwest Florida Shelf (Heil
et al. 2007), where the spatial distribution of dinoflagellates (Karenia brevis and
Prorocentrum minimum), cyanobacteria and diatom dominated communities reflected
the variation of N:P ratios. Therefore, the tolerance and preference to certain N:P
ratios might be an important regulator for the bloom expansion in these areas.
Furthermore, a direct comparison of the ambient N:P ratios during both the
Florida and East China Sea blooms shows considerable correspondence (Fig. 1-1). In

6
both systems, the diatom dominant community was found associated with a high
ambient DIN:DIP ratio (> 45), and the Karenia spp. dominant communities were
found associated with DIN:DIP ratios that were below the Redfield ratio (< 16). The
P. donghaiense community in the ECS and the mixed dinoflagellate assemblage off
Florida were both observed to be associated with DIN: DIP ratios that more closely
approximated the Redfield ratio. This comparison suggested there might be
interesting similar ambient N:P preference for similar species: P. donghaiense and P.
minimum or K. mikimotoi and K. brevis, and different N:P ratio preference between
Prorocentrum and Karenia spp.
Light Dependence of Photosynthesis and Nutrient Uptake
Light is a very important environmental parameter for the phytoplankton
community. Light is the essential source for the phytoplankton photosynthesis. Light
energy is utilized by the algae cell during the photosynthesis process, distributed to
ATP storage, and produced reductants for carbon fixation and nutrient reduction.
Photosynthesis is a highly integrated metabolic process which could be regulated by
both light and other environmental factors including nutrients.
There is always a periodic diel cycle in nature, and the photosynthesis
variation on the diel cycle among different phytoplankton species could be wide
(Behrenfeld et al. 2004). In coastal areas and adjacent oceans, the irradiance available
to phytoplankton is varying over a wide range, due to possible high turbidity and/or
high biomass in the water column. The vertical migration of many dinoflagellate
species also allows cells to live in different depth where the light irradiance is
different. In many cases, light is limiting factor of phytoplankton growth (Goldman et
7
al. 1979, Tett et al. 1985). Therefore, those bloom forming dinoflagellate species
might not only dominate and bloom in their favorable nutrient condition (N:P ratio),
but also have special strategy to dominate and bloom in their favorable light
condition.
Nitrogen uptake and assimilation are energy consuming process, and can be
regulated by light factors. Uptake rates varys over diel cycles, and the maximum
uptake rates occurred at noon for some species (Anderson and Roels 1981). The light
dependence of nutrient uptake has been studied in both laboratory cultures and in
field communities, and the response to light is varied among different species.
Numerous studies have shown that uptake of nutrient responding to light are different
among taxonomic groups (Eppley et al. 1971, Wheeler et al. 1983). For example, the
diatom Skeletonema costatum has lower dark uptake rates of NO3- and NH4
+, while
the coccolithophore Emiliania huxleyi was more uniform over a night range (Eppley
et al. 1971). The light dependence of N uptake rates also varies for different nutrients.
The ability of some cyanobacteria to uptake NH4+, a reduced N source, was relatively
unaffected by darkness (Mulholland et al. 1999). The NO3- uptake rates appeared to
be more limited at night than uptake of NH4+ (Cochlan et al. 1991). NO3
- needs to be
reduced before it can be assimilated by the algae, and it is an energy consuming
process. NO3- uptake generally shows stronger light dependence than reduced N
sources (NH4+ etc.) (Cochlan et al. 1991). However, for dinoflagellates, the light
dependence of NO3- uptake still varied. P. minimum can continuously take up NO3
- in
the dark; while K. mikimotoi has been found to show almost no NO3- uptake in the
8
dark (Paasche et al. 1984). The light dependence might be weakened with increasing
nutrient limitation (Healey 1977).
Irradiance-induced variation in nutrient uptake can alter the competitive
abilities of species: those capable of maintaining high uptake in the dark may have a
competitive advantage in light limiting environment. The different nutrient uptake
rates in the dark might be an ecological strategy. If a species can continuously take up
and assimilate N at high rates in darkness, it may be advantageous in low ambient
light.
The bloom regions of ECS, west Florida Shelf and Chesapeake Bay area are
under strong interaction of relative turbid terrestrial runoff and clear sea water, during
a HAB progression, the available light is limited by both turbidity and biomass,
therefore, the strategy of bloom forming dinoflagellates in different light condition is
also very important to be considered for bloom development.
Perspective of N:P ratio and Light - the Matrix
Smayda has suggested dinoflagellates have diverse habitat preferences and
adaptive strategies and characterized the dinoflagellate bloom species in coastal areas
as 5 types which fit to a nutrient-turbulence matrix (Smayda and Reynolds 2001,
Smayda 2002). Each dinoflagellate species has its specific niche for the bloom
expansion, and these niches are described by available nutrients and
turbulence/mixing intensity (Fig. 1-2). Based on Smayda’s model, Prorocentrum spp.
(length 15~22 μm width 9~14 μm) are described as Type II species which are small,
rapidly growing competitors blooming in nutrient rich near-shore regions.
Conversely, Karenia (length 18-37 µm, width 14-35 µm) are relatively slower

9
growing, larger, motile Type IV, V, VI species, which are generally considered to be
off-shore species. These 2 groups of algae have different adaptive strategies to the
ambient environment and have their own niches, described by different nutrient and
turbulence preferences. The ambient N:P ratio has been suggested to be an important
nutrient parameter regulating the Prorocentrum and Karenia spp. bloom progression
(Li et al. 2009, Li et al. 2010). Ambient N:P ratio could the key factor which make
the niches of these two type of algae different, as distinct N:P ratio variation
distributed between the near-shore and off-shore water in the high frequent bloom
area of these species (Heil et al. 2007, Li et al. 2009, Li et al. 2010). Moreover, near-
shore regions are generally considered higher turbidity and less light available for the
phytoplankton than clearer off-shore water. The light strategy of these 2 types of
algae might also be different. The physiology differences of these 2 types of algae
might determine their success in water column with different ambient N:P ratios and
light condition.
Among these 2 types of algae, K. mikimotoi bloomed with P. donghaiense in
the ECS (Li et al. 2009), K. brevis bloomed with P. minimum in the southwest Florida
coast (Heil et al. 2007), and Karlodinium veneficum bloomed with P. minimum in the
Chesapeake Bay (Zhang et al. 2008). Either temporal or spatial gradient existed when
two bloom species developed the blooms. The range of N:P ratios for bloom
expansion was different between Prorocentrum spp. and other species. The
dependence of light might also be different among these species.
Therefore, the range of N:P ratio and light irradiance preferred by each
dinoflagellate group could be critical for bloom development. In this dissertation, the

10
research is focused on, but not limited to, P. minimum and K. veneficum in
Chesapeake Bay area. Historical observational data were analyzed to obtain the
linkage between bloom-forming dinoflagellates and their ambient N:P ratios and light
condition. Laboratory experiments were conducted to test physiological
characteristics at specific ambient N:P ratios and light condition.
Hypothesis
The following hypotheses were tested.
• In Chesapeake Bay, P. minimum develops blooms in relative high DIN:DIP
ratio water; while K. veneficum blooms near or lower than the Redfield ratio.
• These species will grow faster in the N:P ratio in which they develop blooms,
even when these nutrients are not at limiting levels.
• Prorocentrum spp. preferentially take up more DIN in high DIN:DIP ratio
water, while Karlodinium can better use other source of N in the low DIN
water (e.g. DON, particulate N).
• Low-light-adapted nitrogen acquisition by Prorocentrum spp. serves as an
adaptive advantage to grow in low light waters
Research Objectives
Historical observational data were analyzed and laboratory experiments were
conducted to test the hypotheses and accomplish the following objectives:

11
1. Undertake a comprehensive analysis on decadal observational
data of major dinoflagellate bloom species and cyanobacteria with the changes
of ambient nutrient parameters (i.e., ambient N:P ratio) and related physical
variables (i.e., light) in the Chesapeake Bay. (Chapter II)
2. Identify the quantitative relationship between growth and
physiological characteristics of selected dinoflagellate, Prorocentrum
minimum and P. donghaiense, with ambient N:P ratio in laboratory
experiments; identify related parameters (growth rate, N uptake rate, etc.), and
compare the results between these two species. (Chapter III)
3. Evaluate the importance of light on the nitrogen uptake and
growth of Prorocentrum minimum and P. donghaiense and compare the
difference. (Chapter IV)
4. Simulate the interspecies competition between three near-shore
harmful dinoflagellates, Prorocentrum minimum, P. donghaiense and
Karlodinium veneficum, and one off-shore dinoflagellate, Karenia brevis, at
different ambient N:P ratio and light condition. (Chapter V)
5. Synthesize the findings in an overall conceptual framework,
leading to suggestions to further study. (Chapter VI)
The experimental results were combined with the long term
observational environmental data with statistical and mathematical approaches
to understand the ambient N:P ratio and light regulation on these harmful algal
bloom dynamics.

12
References
Andersen JH, Schluter L, Ærtebjerg G (2006) Coastal eutrophication: recent developments in definitions and implications for monitoring strategies. Journal of Plankton Research 28:621-628
Anderson DM, Burkholder JM, Cochlan WP, Glibert PM, Gobler CJ, Heil CA, Kudela RM, Parsons ML, Rensel JEJ, Townsend DW, Trainer VL, Vargo GA (2008) Harmful algal blooms and eutrophication: Examining linkages from selected coastal regions of the United States. Harmful Algae 8:39-53
Anderson DM, Glibert PM, Burkholder JM (2002) Harmful algal blooms and eutrophication: Nutrient sources, composition, and consequences. Estuaries 25:704-726
Anderson SM, Roels OA (1981) Effects of light-intensity on nitrate and nitrite uptake and excretion by Chaetoceros curvisetus. Marine Biology 62:257-261
Behrenfeld MJ, Prasil O, Babin M, Bruyant F (2004) In search of a physiological basis for covariations in light-limited and light-saturated photosynthesis. Journal of Phycology 40:4-25
Berthouex PM, Pallesen L, Booman K, Sedlack R (1983) A preliminary assessment of Michigan's phosphorus detergent ban. Journal Water Pollution Control Federation 55:323-325
Bulgakov NG, Levich AP (1999) The nitrogen : phosphorus ratio as a factor regulating phytoplankton community structure. Archiv Fur Hydrobiologie 146:3-22
Burkholder JM, Glasgow HB (1997) Pfiesteria piscicida and other Pfiesteria-like dinoflagellates: Behavior, impacts, and environmental controls. Limnology and Oceanography 42:1052-1075
Chai C, Yu ZM, Song XX, Cao XH (2006) The status and characteristics of eutrophication in the Yangtze River (Changjiang) estuary and the adjacent East China Sea, China. Hydrobiologia 563:313-328

13
Cochlan WP, Harrison PJ, Denman KL (1991) Diel periodicity of nitrogen uptake by marine-phytoplankton in nitrate-rich environments. Limnology and Oceanography 36:1689-1700
Doemel WN, Brooks AE (1975) Detergent phosphorus and algal growth. Water Research 9:713-719
Doering PH, Oviatt CA, Nowicki BL, Klos EG, Reed LW (1995) Phosphorus and nitrogen limitation of primary production in a simulated estuarine gradient. Marine Ecology-Progress Series 124:271-287
Duan SW, Liang T, Zhang S, Wang LJ, Zhang XM, Chen XB (2008) Seasonal changes in nitrogen and phosphorus transport in the lower Changjiang River before the construction of the Three Gorges Dam. Estuarine Coastal and Shelf Science 79:239-250
Eppley RW, Rogers JN, Mccarthy JJ, Sournia A (1971) Light/dark periodicity in nitrogen assimilation of marine phytoplankters Skeletonema costatum and Coccolithus huxleyi in N-limited chemostat culture. Journal of Phycology 7:150-154
Flynn KJ (2002) How critical is the critical N : P ratio? Journal of Phycology 38:961-970
Glibert PM, Anderson DM, Gentien P, Granéli E, Sellner KG (2005) The global, complex phenomena of harmful algal blooms. Oceanography 18 (2):136-147
Glibert PM, Burkholder JM (2006) The complex relationships between increasing fertilization of the earth, coastal eutrophication and proliferation of harmful algal blooms. In: Granéli E, Turner J (eds) Ecology of Harmful Algae. Springer, p 341-354
Glibert PM, Burkholder JM, Granéli E, Anderson DM (2008) Advances and insights in the complex relationships between eutrophication and HABs: Preface to the special issue. Harmful Algae 8:1-2
Goldman JC, Mccarthy JJ, Peavey DG (1979) Growth-rate influence on the chemical composition of phytoplankton in oceanic waters. Nature 279:210-215

14
Goolsby DA, Battaglin WA (2000) Nitrogen in the Mississippi basin-estimating sources and predicting flux to the Gulf of Mexico. USGS Fact Sheet 135-00
Hallegraeff GM (1993) A review of harmful algal blooms and their apparent global increase. Phycologia 32:79-99
Hartig JH, Horvath FJ (1982) A preliminary assessment of Michigan's phosphorus detergent ban. Journal Water Pollution Control Federation 54:193-197
Healey FP (1977) Ammonium and urea uptake by some freshwater algae. Canadian Journal of Botany-Revue Canadienne De Botanique 55:61-69
Hecky RE, Campbell P, Hendzel LL (1993) The stoichiometry of carbon, nitrogen, and phosphorus in particulate matter of lakes and oceans. Limnology and Oceanography 38:709-724
Heil CA, Revilla M, Glibert PM, Murasko S (2007) Nutrient quality drives differential phytoplankton community composition on the southwest Florida shelf. Limnology and Oceanography 52:1067-1078
Heisler J, Glibert PM, Burkholder JM, Anderson DM, Cochlan W, Dennison WC, Dortch Q, Gobler CJ, Heil CA, Humphries E, Lewitus A, Magnien R, Marshall HG, Sellner K, Stockwell DA, Stoecker DK, Suddleson M (2008) Eutrophication and harmful algal blooms: A scientific consensus. Harmful Algae 8:3-13
Hodgkiss IJ, Ho KC (1997) Are changes in N:P ratios in coastal waters the key to increased red tide blooms? Hydrobiologia 352:141-147
Hoffman FA, Bishop JW (1994) Impacts of a phosphate detergent ban on concentrations of phosphorus in the James River, Virginia. Water Research 28:1239-1240
Howarth RW (2008) Coastal nitrogen pollution: A review of sources and trends globally and regionally. Harmful Algae 8:14-20
Howarth RW, Boyer EW, Pabich WJ, Galloway JN (2002) Nitrogen use in the United States from 1961–2000 and potential future trends. AMBIO 32:88-96
15
Jaworski NA, Howarth RW, Hetling LI (1997) Atmospheric deposition of nitrogen oxides onto the landscape contributes to coastal eutrophication in the northeast United States. Environmental Science & Technology 31:1995-2004
Justic D, Rabalais NN, Turner RE (1995) Stoichiometric nutrient balance and origin of coastal eutrophication. Marine Pollution Bulletin 30:41-46
Koerselman W, Meuleman AFM (1996) The vegetation N:P ratio: A new tool to detect the nature of nutrient limitation. Journal of Applied Ecology 33:1441-1450
Lagus A, Suomela J, Weithoff G, Heikkila K, Helminen H, Sipura J (2004) Species-specific differences in phytoplankton responses to N and P enrichments and the N:P ratio in the Archipelago Sea, northern Baltic Sea. Journal of Plankton Research 26:779-798
Lee GF, Joneslee A (1995) Impacts of a phosphate detergent ban on concentrations of phosphorus in the James River, Virginia - comment. Water Research 29:1425-1426
Lee YS, Seiki T, Mukai T, Takimoto K, Okada M (1996) Limiting nutrients of phytoplankton community in Hiroshima Bay, Japan. Water Research 30:1490-1494
Li J, Glibert PM, Zhou MJ (2010) Temporal and spatial variability in nitrogen uptake kinetics during harmful dinoflagellate blooms in the East China Sea. Harmful Algae 9:531-539
Li J, Glibert PM, Zhou MJ, Lu SH, Lu DD (2009) Relationships between nitrogen and phosphorus forms and ratios and the development of dinoflagellate blooms in the East China Sea. Marine Ecology-Progress Series 383:11-26
Maki AW, Porcella DB, Wendt RH (1984) The impact of detergent phosphorus bans on receiving water-quality. Water Research 18:893-903
Mulholland MR, Ohki K, Capone DG (1999) Nitrogen utilization and metabolism relative to patterns of N2 fixation in cultures of Trichodesmium NIBB1067. Journal of Phycology 35:977-988

16
Paerl HW (1997) Coastal eutrophication and harmful algal blooms: Importance of atmospheric deposition and groundwater as ''new'' nitrogen and other nutrient sources. Limnology and Oceanography 42:1154-1165
Paerl HW, Valdes LM, Joyner AR, Piehler MF (2004) Solving problems resulting from solutions: Evolution of a dual nutrient management strategy for the eutrophying Neuse river estuary, North Carolina. Environmental Science & Technology 38:3068-3073
Phillips DJH, Tanabe S (1989) Aquatic pollution in the Far-East. Marine Pollution Bulletin 20:297-303
Radach G, Berg J, Hagmeier E (1990) Long-term changes of the annual cycles of meteorological, hydrographic, nutrient and phytoplankton time-series at Helgoland and at Lv Elbe 1 in the German Bight. Continental Shelf Research 10:305-328
Redfield A.C., On the proportions of organic derivations in sea water and their relation to the composition of plankton. In James Johnstone Memorial Volume. (ed. R.J. Daniel). University Press of Liverpool, pp. 177-192, 1934
Redfield, A.C., The biological control of chemical factors in the environment, American Scientist, 1958
Riegman R (1995) Nutrient-related selection mechanisms in marine phytoplankton communities and the impact of eutrophication on the planktonic food web. Water Science and Technology 32:63-75
Sharfstein B, Roels OA, Harris V, Lee V (1977) Effect of detergent legislation on phosphorus in effluent and receiving waters. Journal Water Pollution Control Federation 49:2017-2021
Shen ZL, Liu Q, Zhang SM, Miao H, Zhang P (2003) A nitrogen budget of the Changjiang River catchment. Ambio 32:65-69
Smayda T (1990) Novel and nuisance phytoplankton blooms in the sea: Evidence for a global epidemic. In: Granéli E, Sundstrom B, Edler L, Anderson DM (eds) Toxic Marine Phytoplankton. Elsevier, New York

17
Smayda TJ (1997) Harmful algal blooms: Their ecophysiology and general relevance to phytoplankton blooms in the sea. Limnology and Oceanography 42:1137-1153
Smayda TJ (2002) Adaptive ecology, growth strategies and the global bloom expansion of dinoflagellates. Journal of Oceanography 58:281-294
Smayda TJ, Reynolds CS (2001) Community assembly in marine phytoplankton: application of recent models to harmful dinoflagellate blooms. Journal of Plankton Research 23:447-461
Smith VH (2003) Eutrophication of freshwater and coastal marine ecosystems - A global problem. Environmental Science and Pollution Research 10:126-139
Smith VH (2006) Responses of estuarine and coastal marine phytoplankton to nitrogen and phosphorus enrichment. Limnology and Oceanography 51:377-384
Smith VH, Joye SB, Howarth RW (2006) Eutrophication of freshwater and marine ecosystems. Limnology and Oceanography 51:351-355
Smith VH, Tilman GD, Nekola JC (1999) Eutrophication: impacts of excess nutrient inputs on freshwater, marine, and terrestrial ecosystems. Environmental Pollution 100:179-196
Stelzer RS, Lamberti GA (2001) Effects of N : P ratio and total nutrient concentration on stream periphyton community structure, biomass, and elemental composition. Limnology and Oceanography 46:356-367
Tett P, Heaney SI, Droop MR (1985) The Redfield ratio and phytoplankton growth-rate. Journal of the Marine Biological Association of the United Kingdom 65:487-504
USDA (2008) Fertilizer consumption and use - By year. United States Department of Agriculture: http://www.ers.usda.gov/Data/FertilizerUse/
Vrede T, Ballantyne A, Mille-Lindblom C, Algesten G, Gudasz C, Lindahl S, Brunberg AK (2009) Effects of N:P loading ratios on phytoplankton

18
community composition, primary production and N fixation in a eutrophic lake. Freshwater Biology 54:331-344
Wheeler PA, Olson RJ, Chisholm SW (1983) Effects of photocycles and periodic ammonium supply on 3 marine-phytoplankton species .2. ammonium uptake and assimilation. Journal of Phycology 19:528-533
Yan WJ, Zhang S (2003) The composition and bioavailability of phosphorus transport through the Changjiang (Yangtze) River during the 1998 flood. Biogeochemistry 65:179-194
Zhang H, Litaker W, Vandersea MW, Tester P, Lin SJ (2008) Geographic distribution of Karlodinium veneficum in the US east coast as detected by ITS-ferredoxin real-time PCR assay. Journal of Plankton Research 30:905-922
Zhang J, Liu SM, Ren JL, Wu Y, Zhang GL (2007) Nutrient gradients from the eutrophic Changjiang (Yangtze River) Estuary to the oligotrophic Kuroshio waters and re-evaluation of budgets for the East China Sea Shelf. Progress in Oceanography 74:449-478

19
Figures
Figure 1-1 Comparison of the range in ambient nitrogen: phosphorus ratios during different phases of the blooms in the East China Sea and in different phytoplankton assemblages among the southwest Florida shelf during May 2005. The southwest Florida Shelf data are derived from Heil et al. (2007).

20
Figure 1-2 Predominant dinoflagellate life-form Types associated with the turbulence-nutrient matrix along an onshore–offshore continuum characterizing pelagic habitats (From Smayda 2001). Type I = gymnodinioids; Type II = peridinioids and prorocentroids; Type III = ceratians; Type IV = frontal zone species; Type V = upwelling relaxation taxa; Type VI = coastal current entrained taxa; Type VII = dinophysoids; Type VIII = tropical oceanic flora; Type IV = tropical shade flora. Consult text for Type species.

21
Chapter 2: An Exploratory Analysis of Nutrients and Other
Related Variables Related to Select Harmful Algal Bloom
Events in the Chesapeake Bay 1991-2008
Abstract
An exploratory analysis was conducted relating Chesapeake Bay nutrient
concentrations and other related water quality variables to the harmful algal bloom
events of select species: the dinoflagellates Prorocentrum minimum, Karlodinium
veneficum, and a composite density of freshwater cyanobacteria species. Chesapeake
Bay, especially the upper bay and its tributaries, is characterized as a turbid, low light
available, highly eutrophic system. Prorocentrum minimum, K. veneficum and
cyanobacteria blooms can further decreased the light availability, enrich particle
organic matter to the water column and carry the potential to be toxic. Prorocentrum
minimum and K. veneficum generally develop blooms in the mesohaline religions,
while freshwater cyanobacteria mostly bloomed in the tidal freshwater or oligohaline
endmembers of tributaries. In contrast to P. minimum concentrations that correlates
with high nitrogen (N) water, K. veneficum is associated with high phosphate (P)
concentrations and low DIN:DIP ratio water in the summer. K. veneficum may be less
limited by P in the low DIN:DIP ratio water after P. minimum blooms. The nutrients
ratios during dinoflagellates events were comparable to those previous reported for
analogous blooms in the East China Sea and southwest Florida Shelf.

22
Introduction
Chesapeake Bay is the largest estuarine system of the USA. Chesapeake Bay
extends over 300 km from the Susquehanna River at its north head, to the Atlantic
Ocean at its mouth, with an average depth of 8 m. The majority of freshwater flow
(64%) and nutrient-loading of Chesapeake Bay is from the Susquehanna River
(Boynton et al. 1995, Kemp et al. 2005), while there are several major tributaries on
both sides of the Chesapeake Bay, including the Patuxent River, Potomac River,
Rappahannock River and Choptank River. Extensive studies of nutrient loading and
its processing by primary producers have been conducted on the Chesapeake Bay
ecosystem (Fisher et al. 1990, Fisher et al. 1992, Boynton et al. 1995, Glibert et al.
1995, Cornwell et al. 1996, Malone et al. 1996, Harding and Perry 1997, Glibert et al.
2001, Glibert and Magnien 2004, Glibert et al. 2005b, Fisher et al. 2006). Massive
terrestrial loading results in excessive phytoplankton production in the Chesapeake
Bay (Malone et al. 1988, Malone et al. 1996, Glibert and Magnien 2004, Adolf et al.
2006c, Fisher et al. 2006). Generally, the peak biomass of Chesapeake Bay occurs
during the spring diatom blooms, while peak production occurs in the summer when
summer temperature reaches its maximum (Malone et al. 1988, Malone et al. 1996,
Harding et al. 2002). Even though there is a large amount of nutrient loading into the
Chesapeake Bay, phosphorus (P) and silica still tend to be limiting nutrients in spring,
while nitrogen (N) is the primary limiting nutrient in summer (Fisher et al. 1992,
Glibert et al. 1995, Malone et al. 1996, Fisher et al. 1999).
The Chesapeake Bay region has been subject to eutrophication which is linked
to the pressures of increasing human population, urbanization (e.g. Washington DC,

23
Baltimore area), development of animal and plant agriculture and non-point nutrient
pollution in its watershed (Glibert and Magnien 2004, Glibert et al. 2005b, Hagy et al.
2004, Kemp et al. 2005, Fisher et al. 2006). As a consequence of this eutrophication,
Chesapeake Bay has suffered from major harmful algal bloom problems for decades
(Glibert et al. 2001, Goshorn et al. 2004, Marshall et al. 2004, Tango et al. 2004,
Tango et al. 2005, Tango and Butler 2008). In the Chesapeake Bay, harmful algal
blooms have caused environmental damage including hypoxia, mortalities of fish and
shellfish, decline of submerged aquatic vegetation, illness and death of various
invertebrates, seabirds, and marine mammals (Deeds et al. 2002, Gallegos and
Bergstrom 2005, Heil et al. 2005, Tango et al. 2005, Adolf et al. 2006a, Tango and
Butler 2008).
Prorocentrum minimum is one of the major bloom forming harmful
dinoflagellates, both globally distributed in coastal waters (Heil et al. 2005, Glibert et
al. 2008b) and common in Chesapeake Bay (Glibert et al. 2001, Tango et al. 2005).
Karlodinium veneficum, formerly recorded as Gyrodinium galatheanum,
Gymnodinium galatheanum and Karlodinium micrum (Li et al. 2000, Adolf et al.
2006b, Deeds 2009), is also a widespread mixotrophic dinoflagellate which has
caused HABs since 1950 in coastal waters of Southwest Africa, Europe, United
States, Western Australia, and other temperate coastal environments, including
Chesapeake Bay (Li et al. 2000, Zhang et al. 2008, Deeds 2009). Karlodinium
veneficum is a toxigenic dinoflagellate, which can produce Karlotoxin and has been
implicated to cause fish-kill events in the Chesapeake Bay area (Deeds et al. 2006,

24
Adolf et al. 2008). High biomass blooms of K. veneficum have been recorded in
middle and upper Chesapeake Bay between May and September (Li et al. 2000).
Some toxic species of cyanobacteria, including Microcystis spp. and
Anabaena spp., have also been reported to cause cyanobacterial HAB events in the
Chesapeake Bay area (Marshall et al. 2005). Diverse toxic activity of cyanobacteria
has been recorded in the tidal waters of Chesapeake Bay and has caused
environmental problems in recent years (Tango and Butler 2008).
In this study, the occurrences of these two major bloom developing algae
(dinoflagellates P. minimum, K. veneficum) and a composite density of freshwater
cyanobacteria in Chesapeake Bay regions are described in terms of their relationship
with eutrophication indicators. This study provided interpretations of the relationships
between these HAB species and water quality and enabled consideration of questions
such as:
did the scale and frequency of HAB species in the Chesapeake Bay estuary
change over time?
how were biological changes related to water quality?
what water quality conditions best explain the success of HAB species that
developed blooms?
By addressing these questions, this study is helpful in gaining a better understanding
of the complex mechanisms that influence the development of HABs in eutrophic
ecosystem.

25
Methods
Long-term observational data on the surface dinoflagellate and cyanobacteria
abundance and water quality were acquired from the Chesapeake Bay Program
(http://www.chesapeakebay. net). These data were derived from routinely sampling in
the Chesapeake Bay and its tributaries for water chemistry and phytoplankton
community composition since the mid-1980s
(http://www.chesapeakebay.net/data_waterquality.aspx, Fig. 2-1). The dinoflagellate
data were derived from phytoplankton samples which were preserved with Lugol’s,
and subsequently counted by conventional light microscopy techniques. The
cyanobacteria data were also derived from phytoplankton samples which were
preserved with Lugol’s, and subsequently counted by conventional light microscopy
techniques. Picocyanobacteria (e.g. Synechococcus), which are generally smaller than
the resolution limit of light microscopy, were not identified or counted, and are not
involved in this anaylsis. Water quality and chemical analysis included ambient
parameters (salinity, temperature, secchi depth, particulate and dissolved nitrogen/
phosphorus and carbon) and biological variables (chlorophyll). Data are available
from samples which were conducted from biweekly to monthly.
Results
Eutrophic Level and Bloom Events
From 1991 to 2008, there were ~ 2830 records of P. minimum and ~ 4755
records of cyanobacteria sampled in the Chesapeake Bay and its tributaries. However,

26
the records of K. veneficum (~ 4755 records) were only available from 2003 in the
available Chesapeake Bay Program data sets. Each species was either documented as
mixed with other species or as population dominant in bloom conditions. Cell
densities varied across wide range. According to United States National Estuarine
Eutrophication Assessment (Bricker et al. 1999), Chlorophyll (Chl) a can be used as
an indicator of algal blooms to define estuarine eutrophic condition. The thresholds
and ranges are defined as: hypereutrophic: > 60 µg Chl a L-1; high eutrophic: > 20 but
≤ 60 µg Chl a L-1; medium eutrophic: > 5 but ≤ 20 µg Chl a L-1; low eutrophic: > 0
but ≤ 5 µg Chl a L-1. Of the Chesapeake Bay records, over half of the samples (3350)
were medium eutrophic when P. minimum, K. veneficum and cyanobacteria were
observed. Over 1000 samples were in hyper and high eutrophic condition (Fig. 2-2 a).
For this analysis, the bloom status of the two dinoflagellate species in the
water column was defined according to Tango et al (2005) and Maryland Eco-check
(http://www.eco-check.org/), and the thresholds are set as: Type I: bloom condition,
cell density > 5,000,000 cell L-1; Type II, sub-bloom condition, cell density >
1,000,000 but ≤ 5,000,000 cell L-1, dinoflagellates could be dominant species to
develop bloom, but have not reached bloom condition; Type III, cell density >1,000
but ≤ 1,000,000 cell L-1; Type IV, cell density > 0 but ≤ 1,000 cell L-1; Type V, cell
density = 0, dinoflagellates were not observed at this station. Similar types were
defined on cyanobacteria, however, the thresholds of each type are 10 times of
dinoflagellates, as cyanobacteria have much smaller cell size (e.g. Microcystis
aeruginosa cell size 2-3 µm; P. minimum 14-22 µm).

27
A total of 48 P. minimum Type I samples were recorded, with a maximum cell
density of 60,915,000 cell L-1, in the lower Potomac River database (Fig. 2-2b). There
were 133 Type II samples. Most of the records of P. minimum (2157) were Type III
level. Cell abundance data of K. veneficum were only available from 2003 in the
available Chesapeake Bay Program data sets. Since 2003, there were 10 Type I
records of K. veneficum and 38 Type II records, with a maximum cell density of
~16,000,000 cell L-1 in the lower Patuxent River (Fig. 2-2c). There were 196 Type III
samples recorded. For the composite density of freshwater cyanobacteria, there were
329 Type I samples recorded, with a maximum cell density of 632,000,000 cell L-1 in
the upper Sassafras River (Fig. 2-2d). There were 717 Type II records. Over 70% of
the cyanobacteria records (3521) were Type III level.
Spatial Distribution
Hyper and high eutrophic level Chl a samples were documented all over the
Chesapeake Bay (Fig. 2-3). However, most of these observations were from in the
upper part of the Chesapeake Bay and major tributaries. The Type I and II levels of P.
minimum have been also recorded throughout the Chesapeake Bay (Fig. 2-4), but
especially in the lower Potomac River, Patuxent River, Choptank River and the upper
Bay. Karlodinium veneficum were only recorded to have reached Type I and II level
in upper Chesapeake Bay and lower Potomac River and Patuxent River (Fig. 2-5).
High biomass of the cyanobacteria considered here were mostly found in the upper
river of major tributaries (Fig. 2-6).

28
Salinity
Approximately 80% of hyper and high eutrophic samples had salinities less
than 10, which represents the tidal freshwater and oligohaline regions of Chesapeake
Bay (Fig. 2-7). Over 50% of the Type I and II P. minimum samples were collected in
a narrow range of salinity of 6 - 10. Prorocentrum minimum cell densities decreased
to Type IV as salinity increased to 20. Over 50% of the Type I and II K. veneficum
samples were collected in a narrow range of salinity of 7.5 - 11. Of the K. veneficum
samples, 80% were observed in the salinity range of 5 - 13. 90% Type I and 75%
Type II levels of the cyanobacteria were recorded in salinity less than 10.
There was significant difference between the salinity where the dinoflagellate
and the cyanobacteria blooms formed (p < 0.001) (Fig. 2-8). More than 80% of the P.
minimum blooms (Type I) were developed in salinities of 5.5 and 11, while 80% of
the K. veneficum blooms developed in salinities between 7 and 12.7, and 75% of the
cyanobacterial blooms developed at stations where salinities were lower than 5.5.
Dinoflagellate blooms developed in the tidal mixing area, generally in the lower part
of the tributaries (Fig. 2-4 and 5), while cyanobacteria blooms developed in the non-
tidal and tidal freshwater area, generally in the upper part of the tributaries (Fig. 2-6).
Seasonal Records and Temperature
More than 50% of the hyper, high and medium eutrophic samples were
collected between May to August, and about 80% of these samples were collected
between April and October (Fig. 2-9). More than 50% of the hyper, high and medium
eutrophic conditions occurred when water temperature was in the range of 14.2 ˚C to
26.6 ˚C with a median over 21 ˚C (Fig. 2-10). Levels of Chl a dropped to Type IV

29
conditions when median temperatures were lower than 15 ˚C. Most of the Type I and
II P. minimum samples were recorded in April and May, when water temperatures
were in the range of 13.7 ˚C to 19.1 ˚C. Karlodinium veneficum reached Type II
levels mostly in May, June and July, when temperatures were higher than 17.1˚C.
However, 50% of the K. veneficum blooms developed in July, August and September.
Blooms developed when temperature were between 21 ˚C and 29.5 ˚C. Cyanobacteria
also bloomed mostly in July, August and September when water temperatures were
higher than 20 ˚C. Cyanobacteria reached Type II level from May, when water
temperatures were higher than 15 ˚C.
More than 80% of the P. minimum blooms developed when temperatures were
between 12 ˚C and 21.4 ˚C. 80% of the K. veneficum blooms developed in the
temperature range between 20.7 ˚C and 30 ˚C. The water temperature ranges of the
two dinoflagellates blooms were significantly different (p < 0.001). Therefore, even
though these two dinoflagellates typically bloom in similar area in the Chesapeake
Bay (Fig. 2-4 and 5), these two species bloomed at different time of the year.
Prorocentrum minimum blooms started from late spring, while K. veneficum bloomed
in summer and autumn.
Secchi Depths and TSS
The median secchi depths in the hyper and high eutrophic were less than 0.5
m (Fig. 2-11), which is lower than the thresholds (0.65 m) for underwater sea grass
growing in oligohaline and tidal freshwater of Chesapeake Bay area (Carter et al.
1994). Even though freshwater carries massive sediments and particles to the bay and
its tributaries, secchi depths in low eutrophic stations were still less than 1.5 m. For P.

30
minimum, K. veneficum and cyanobacteria, the median secchi depths decreased from
over 1 m to less than 0.5 m as the cell densities increased to bloom level (Fig. 2-11).
The median total suspended solids (TSS) increased from 10 mg L-1 in low and
medium eutrophic stations to about 26 mg L-1 in high and hyper eutrophic stations
(Fig. 2-12). TSS values were mostly around than 10 mg L-1, when the two
dinoflagellates were observed, except during P. minimum blooms, when the median
TSS was about 18 mg L-1. The median TSS also increased from 12 mg L-1 in stations
with Type IV cyanobacteria level to 22 mg L-1 in stations with Type I cyanobacteria
level.
Dissolved Oxygen
Dissolved oxygen in surface water was replete in most of the reported data.
Over 80% of the observations had DO higher than 6 mg L-1, and the median was over
8 mg L-1 (Fig. 2-13). This is likely due to the fact that all the samples were taken from
less than 0.5 m and wind influenced air-water exchange and the photosynthesis
activities kept the surface DO at a high level. All observations were also made during
the midday. The hyper eutrophic samples had even higher DO, as the results of high
photosynthesis activities of the blooming algae. When P. minimum was present, the
median DO was higher than 8 mg L-1. However, the median DO decreased to 5.5 mg
L-1, when K. veneficum bloomed. The median DO in Type I and II cyanobacteria-
dominated stations was about 7.5 mg L-1.

31
Dissolved Carbon and Nutrients
The median of dissolved organic carbon (DOC) in hyper and high eutrophic
samples was about 400 µM-C (Fig. 2-14), and 50% of the samples were in the range
of 310 - 450 µM-C, while the median of the low eutrophic samples decreased to 250
µM-C. The DOC concentration decreased from 400 µM-C to 230 µM-C as cell
densities of P. minimum and cyanobacteria species decreased from Type I to Type IV
level, but this decrease was not significant (p>0.05). The DOC concentrations of K.
veneficum were steady in a narrow range around 320 µM-C.
Dissolved inorganic nitrogen (DIN, sum of NO2-+ NO3
- and NH4+)
concentrations were higher in low eutrophic stations. The median was about 36 µM-N
in low eutrophic water, and 50% of the samples were in the range of 5 - 70 µM-N
(Fig. 2-15). DIN concentrations were lower in the samples characterized as more
eutrophic; more DIN was incorporated into biomass. The median decreased to 10-16
µM-N in medium and high eutrophic water, and 75% of the samples were less than
40 µM-N. When P. minimum was observed, the median DIN concentrations
decreased from ~ 20 µM-N in Type I and II level to 10 µM-N in Type III level, then
further decreased to less than 5 µM-N in Type IV level samples, which was
significantly lower than the Type VI condition (p<0.001). However, an opposite trend
was observed as K. veneficum cell densities increased, NO3- concentrations also
increased. The median DIN concentration increased from less than 5 µM in Type I
and II level samples to 10 µM-N in Type III, and continuously increased to over 40
µM in Type IV level, which was significantly higher than the Type V condition
32
(p<0.001). There was no significant difference in change of DIN when cyanobacteria
cell densities changed.
Dissolved inorganic phosphorus (DIP, ~PO43-) concentrations did not show a
significant trend among stations characterized as different eutrophic levels. About
70% of the samples had DIP concentrations less than 0.5 µM-P (Fig. 2-16). The
median concentration of hyper eutrophic stations was 0.4 µM-P, similar to the median
of low eutrophic stations. DIP concentrations were around 0.1 µM-P in Type I and II
P. minimum samples. In the K. veneficum samples, the median DIP concentrations
were also in the range of 0.1 - 0.2 µM-P. The DIP concentrations were higher when
cyanobacterial bloom developed. The median values were about 0.3 - 0.4 µM-P in the
Type I, II and III samples, which were significantly higher than the values of Type V
samples (0.2 µM-P, p<0.05).
Both P. minimum and cyanobacteria had significantly higher ambient DIN
concentrations than K. veneficum when blooms occurred (p<0.05). However, both K.
veneficum and cyanobacteria had significantly higher ambient DIP concentrations
than P. minimum when blooms occurred (p<0.05).
The DIN:DIP ratios of all eutrophic level samples were mostly higher than the
Redfield ratio (16), and the median values were in the range 40 to 60. The DIN:DIP
ratios varied in a much larger range for the dinoflagellate-dominated samples (Fig. 2-
17). The median values of Type I and Type II P. minimum samples were ~170, and
50% of DIN:DIP ratios were in the range of 10 - 370. The median value of Type III
samples decreased to ~50, and 50% of DIN:DIP ratios were in the range of 10 - 180.
The median value of Type IV samples decreased to around 16. An opposite trend was

33
observed in K. veneficum, as K. veneficum cell densities increased, DIN:DIP ratios
decreased to the Redfield ratio instead. The DIN:DIP ratios at which P. minimum
blooms were documented were significantly higher than those at which K. veneficum
and cyanobacteria blooms were documented (p<0.001), which had median DIN:DIP
values around the Redfield ratio. The median DIN:DIP ratio was about 16 and all the
values were under 110 in bloom condition. The median DIN:DIP ratios slightly
increased to 20-30 in Type II and III sample, and the upper range of 50% values
increased to 200. The median DIN:DIP ratio increased to 360 in Type IV sample,
and 50% of the values were in the range of 160 - 500. When cyanobacteria were
observed, the DIN:DIP ratios were relatively stable with median value around 16 and
75% of the ratios were less than 70 in all types of samples.
Components of Particulate Matter
Particulate carbon (PC) in the water samples increased with the eutrophic
level. The median PC concentrations significantly increased from 65 µM-C under low
eutrophic conditions to 380 µM-C (P<0.001) under hyper eutrophic conditions (Fig.
2-19). The values varied in a narrow range at each defined eutrophic level. Similar
trends were observed for all 3 target species or species groups. Particulate nitrogen
(PN) also increased with the eutrophic level. The median PN concentrations increased
from 12 µM-N under low eutrophic conations to 24 µM-N under hyper eutrophic
conditions (Fig. 2-20). There were no significantly different changes of PN for the
HABs, considered here. Particulate phosphorus (PP) also increased with the eutrophic
level. The median PP concentrations increased from 1.4 µM-P to 2.7 µM-P (Fig. 2-
34
21). However, the increase of PP in relation to cell density for each species or species
groups was not significant.
The PC:PN ratios of the particulate matter increased from near Redfield ratio
(6.6) in middle and low eutrophic observations to a median value of 15 in hyper
eutrophic observations (Fig. 2-22). The PC:PP values increased to over 200 in hyper
eutrophic samples (Fig. 2-23). A similar trend was observed for P. minimum. When
this species bloomed, the median of PC:PN increased to 20. Median PC:PP ratios also
increased to over 200, when P. minimum and K. veneficum bloomed. The PC:PP
ratios of the particulate matter were generally around 50 in low eutrophic water which
was lower than Redfield ratio (106). The PN:PP ratios were in similar range in all
eutrophic level samples. Most of the samples had ratios lower than Redfield ratio (16)
(Fig. 2-24). The median number of PN:PP were only higher than 16 in Type I, II and
III K. veneficum samples.
Discussion
A Comparison with Ecosystems with Similar Nutrient Dynamics
In a healthy Chesapeake Bay ecosystem, the most important event for the
primary production of the bay is the spring diatom bloom, when the N nutrients
accumulate during the winter and spring are consumed to support the production
(Malone et al. 1988, Glibert et al. 1995, Malone et al. 1996, Harding et al. 2002). Due
to the extensive terrestrial nutrient input in the past several decades (Glibert and
Magnien 2004, Hagy et al. 2004, Kemp et al. 2005), the upper bay and its tributaries
has been in high eutrophic condition indicated by Chl a level. Not only nutrient
35
concentrations, but also the nutrients ratios could be important for the succession of
phytoplankton assemblages (Smayda 1997, Bulgakov and Levich 1999, Stelzer and
Lamberti 2001, Vrede et al. 2009). Surveys conducted on the nutrients and
phytoplankton in the East China Sea (Li et al. 2009) and southwest Florida Shelf
(Heil et al. 2007) have suggested that ambient nutrients ratios may regulate the
dominant species of the phytoplankton community. In both systems, the diatom
dominated community was found associated the highest ambient DIN:DIP ratios, and
the Prorocentrum spp. (P. donghaiense in the East China Sea and P. minimum in
southwest Florida Shelf) dominant communities were associated with DIN:DIP ratios
approximated higher than, but still close to, Redfield ratio. The Karenia spp. (K.
mikimotoi in the East China Sea and K. minimum in southwest Florida Shelf)
dominant communities were found in association with DIN:DIP ratio less than
Redfield ratio. Remarkable correspondence of community succession was also
observed in the Chesapeake Bay (Fig. 2-25). Diatoms bloomed in the spring when the
ambient DIN:DIP ratios were the highest, followed by the P. minimum blooms when
the ambient DIN:DIP ratios began to decrease. K. veneficum bloomed in the late
summer when ambient DIN:DIP ratios decreased to the Redfield ratio. All three areas
appeared to display similar patterns in the species dominance relative to DIN:DIP
ratios, except the DIN:DIP ratios during the diatom and P. minimum blooms were
higher in the Chesapeake Bay, which was due to the relatively higher DIN
concentrations (compared to the southwest Florida Shelf) and lower PO43-
concentrations (compared to the East China Sea) in the Chesapeake Bay.

36
A Comparison with Spatial Historical Data
Fisher et al. (1992) presented the evidence of seasonal shifts from P to N as
the limiting nutrient of phytoplankton biomass based on the data collected in the
major axis of the Chesapeake Bay from 1982 to1987. Although the major axis is not
a high frequent HAB area compared to the near-shore and tributary areas, there were
still data collected along the stations in the same month along the major axis which
were associated with the HAB species in the 1990s and 2000s. The decadal variation
of salinity, nutrient and chlorophyll data from the 1980s (Fisher et al. 1992 ) were
directly compared with the data in the 1990s and 2000s, along the major axis of the
Chesapeake Bay.
The seasonal variation of salinity is significant. The fresh water river flow in
the Chesapeake Bay is dominated by the Susquehanna River. A salinity gradient
developed from the Susquehanna River mouth to the lower Chesapeake Bay. The
river flow in the late spring (May) is higher than late summer (August), and as a
result, the surface salinities in May are 3-5 lower than August. The salinity
distribution was almost the same over the past 3 decades, except the samples from the
2000s (Fig. 2-26), when the salinities of 2000-2008 in May and August dropped
about 10 at stations near the Potomac River mouth. The samples were likely taken
after large scale of rainfalls in the nearby watershed, which caused the dilution. River
flow from the major tributaries on both sides of the Chesapeake Bay also had
significantly dilution effects on the major axis. The dilution impact on the water
column was not only on salinity, but also on the water quality which is discussed
below.

37
The seasonal variation of DIN concentrations along the major axis of the
Chesapeake Bay is also significant (p < 0.05) and well documented (Fisher 1992). In
May, the DIN is highest near the head of the Chesapeake Bay (60-100 µM-N) and
gradually decreases to 10 µM-N at the mouth of the bay (Fig. 2-27). In August, DIN
decreases to 10 µM-N from 80 km away from the head of the bay, and is depleted
throughout the bay. However, decadal comparisons suggest that the DIN
concentrations in the upper river have increased, as previous study suggested (Hagy
et al. 2004, Kemp et al. 2005), which increased almost 20 µM-N every decade in May
(Fig. 2-27). In August, the DIN concentrations were 30-50 µM-N higher in recent
decades than 1980s. DIN concentration peaks match with the low salinity stations in
the 2000s data. The N input from the major tributaries on both sides of the
Chesapeake Bay could be important complement for the main channel. The PO43-
concentrations were slightly higher in the August than in the May. Near the head of
the Chesapeake Bay, the PO43- concentrations reached 0.7 µM-P in August, but only
0.4 µM in May. In the lower part of the Chesapeake Bay, the PO43- concentrations
were around 0.2 µM-P in August, but only slightly higher than 0.1 µM-P in May (Fig.
2-28). There was no significant difference among PO43- concentrations in three
decades (p > 0.05), except near the head of the Chesapeake Bay, where the peak value
of PO43- concentrations increased since 1980s.
Due to the different pattern of the DIN and PO43- concentrations, the seasonal
ambient DIN:DIP ratio variation is significant (Fig. 2-29). The DIN:DIP ratios are
mostly higher than 100 in May, but lower than 100 in August. The ambient DIN:DIP
ratios from the 1990s were significantly higher than those of 1980s (p < 0.01) in

38
August. In May, the DIN:DIP ratios only decreased to near Redfield ratio in the lower
bay in the 1980s. In August, most of the DIN:DIP ratios were low all three decades,
except the first 50 km near the head of the Chesapeake Bay. The DIN:DIP ratios
decreased to less than 10 and even less than 1 in the lower bay in the 1980s.
However, the DIN:DIP ratios in the past 2 decades only decreased to near Redfield
ratio, not as low as the 1980s. In May, the Chl a concentrations were highest in the
1980s, when Chl a peaks (~40 µg L-1) were observed in the stations about 40 km to
the head of the bay and near the mouth of the bay (Fig. 2-30). However, the Chl a
concentrations were generally lower than 40 µg L-1 in the recent two decades. In
August, high Chl a concentrations were only observed in the upper bay, and there was
no significant difference among the three decades.
As shown here and elsewhere (Hagy et al. 2004, Kemp et al. 2005), the DIN
concentrations have increased since 1980s, especially in the upper bay. As a result,
the overall ambient DIN:DIP ratios increased, which suggests that Chesapeake Bay
might be more P limited in the later spring and early summer than the 1980s. The
spring blooms depleted DIN (<1 µM-N) in summer in the 1980s, however, in recent
decades, DIN in the upper and middle bay remains high (20-50 µM-N). High PO43-
concentrations were also observed in the upper bay. These PO43- could be supplied by
P released from the hypoxia zone which has been increased in recent decades (Kemp
et al. 2005). Therefore, historical data comparison suggested the Chesapeake Bay is
more eutrophic now than the 1980s in the upper and middle bay (Hagy et al. 2004,
Kemp et al. 2005), which could provide more nutrients sources available for
dinoflagellate species to develop blooms in the summer and early autumn.

39
The Spatial Variation of Nutrients and HAB Events
Based on the ambient parameters (i.e., salinity and eutrophic level) and spatial
distributions of 3 types of harmful algal blooms, the Chesapeake Bay and its
tributaries can be divided to 3 zones (Fig. 2-31). Zone I: The tidal fresh water area of
the Chesapeake Bay, where surface salinity is generally less than 5, very eutrophic.
Zone II: the lower part of the tributaries, upper and middle Chesapeake Bay, where
surface salinity is generally between 5 and 15, and eutrophic. Zone III: the middle-
lower bay, where surface salinity is higher than 15, but low eutrophic.
Zone I is the area where most of the cyanobacteria blooms developed. This
area is characterized by significantly higher nutrient levels than the other 2 zones, due
to the terrestrial nutrients input. In winter and early spring, the DIN concentrations
accumulates to over 100 µM-N (Fig. 2-32), and the DIP concentration accumulates to
over 0.5 µM-P (Fig. 2-33). The ambient DIN:DIP ratios are over 200, suggesting P
limitation (Fig. 2-34). When the phytoplankton biomass begins to develop from
March (Fig. 2-35, 36), the ambient DIN is consumed and starts to decease, while DIP
concentrations are stable, and even slightly increase. As a result, the ambient
DIN:DIP ratios start to decrease. When cyanobacterial blooms develop in the summer
(Fig. 2-36), the ambient DIN:DIP ratios decrease to median value less than 40, which
is a factor of 2 of the Redfield ratio. Cyanobacterial blooms generally last until
October.
Zone II is the area where most of the P. minimum and K. veneficum blooms
were documented. This area has lower nutrients compared to Zone I. In winter and
early spring, the DIN concentrations are generally less than 50 µM-N (Fig. 2-32), and

40
the DIP concentrations accumulate to around 0.2 µM-P (Fig. 2-33). The ambient
DIN:DIP ratios can reach over 500, suggesting P limitation (Fig. 2-34). The peak of
P. minimum blooms occurred in April and May in both frequency and biomass, when
the ambient DIN:DIP ratios dropped to 200. When P. minimum biomass accumulates
in these high N low P environments, the ambient DIN further drops to ~ 20 µM-N in
June, but PO43- increases. When K. veneficum blooms develop in summer and autumn
(June to September), the ambient DIN:DIP ratios drop to near the Redfield ratio.
These changes are not only caused by the decrease of DIN, but also by the
significantly increased DIP concentrations, which increases from ~ 0.2 µM-P to ~ 1
µM-P.
Zone III is the area mostly under the influence of oceanic water of all 3 zones.
It is characterized as low DIN (mostly less than 10 µM-N), and low DIP (~ 0.1 µM-
P), even in the early spring (Fig. 2-32, 33). The Chl a concentrations are less than 20
µg L-1 most times of the year and there are generally no significant blooms of the
species groups considered here. The ambient DIN:DIP ratios drop from over 100 in
the spring to near the Redfield ratio in July. The low DIN:DIP ratios last until
November, even though there is no significant decrease in DIN concentrations.
The decrease of NO3- concentrations from spring to late summer was caused
by the consumption by phytoplankton communities. However, the maxima of DIP
were observed in the late summer. It has been suggested that the DIP is from the
remineralization of organic matter (Taft and Taylor 1976, Boynton and Kemp 1985,
Jordan et al. 2008). Spring and summer blooms and terrestrial input accumulate
massive organic matter in the bottom layer of the Chesapeake Bay and its tributaries.
41
DIP released from the remineralization may still not available to the primary producer
due to absorption of ferric (Fe3+) oxides (Jordan et al. 2008). Decomposition of
organic matter consumes the oxygen in the bottom layer after stratification develops
in the water column in summer, and hypoxia develops in the bottom layer. DIP
escapes precipitation when ferric oxides were reduced in the anoxic condition
(Boynton and Kemp 1985). This DIP can be vertically transported to the euphotic
layer and be available for the phytoplankton, or can be accessed by dinoflagellates
which can vertically immigrate to the deeper layer of the water column.
The Environmental Factors and HAB Species
In a eutrophic estuary like Chesapeake Bay, the potential relationship between
the frequency of HABs and increased anthropogenic nutrient inputs to coastal waters
is a particular concern (Glibert et al. 2005a), as the phytoplankton assemblages will
respond to excessive nutrient inputs with increased biomass and decreased diversity,
and nutrient enrichment generally promotes a shift in dominance from diatoms to
dinoflagellates and cyanobacteria (Pinckney et al. 2001, Anderson et al. 2008). The
variations in nutrient loadings and supply ratios can regulate algal growth rates and
community composition (Rudek et al. 1991, Smayda 1997, Heil et al. 2007).
Herein, species specific correspondences were found between selected HAB
species and nutrients and other related environmental variables. These
correspondences are consistent with the physiological characters of each species,
which are reported in previous field and laboratory studies.
Prorocentrum minimum blooms have been often linked to eutrophication and
occur in waters influenced by freshwater inputs (coastal waters and estuaries) and/or
42
anthropogenic loads (Heil et al. 2007, Glibert et al. 2001). In the lower part of the
tributaries and the upper Chesapeake Bay, nutrients accumulate in the winter and
early spring and DIN concentration can reach over 50 µM-N (Fig. 2-32).
Prorocentrum minimum may have competitive advantages over other phytoplankton
populations in such nutrient-enriched, but very turbid environments. Prorocentrum
minimum can survive in dark environment for months (Harding and Coats 1988), and
grow well under low light conditions (Grzebyk and Berland 1996). Prorocentrum
minimum also shows light independent N uptake ability (Fan and Glibert 2005).
Prorocentrum minimum appears to be a good competitor in such high turbidity
waters. Although the DIP concentrations are generally very low (~ 0.1 µM-P, Fig. 2-
16) during the P. minimum blooms, P. minimum is capable to induce alkaline
phosphatases and utilize organic phosphorus (Dyhrman 2005).
In contrast to P. minimum which bloomed in high DIN water, Karlodinium
veneficum were generally associated with high DIP concentrations and low DIN:DIP
ratio (lower than Redfield ratio) water in the summer. Karlodinium veneficum
developed blooms, even when ambient DIN has been depleted. Karlodinium
veneficum, known as a mixotrophic dinoflagellate, may have competitive advantages
in such waters. It can take up organic nitrogen to support growth, and ingest bacteria
and cryptophytes (e.g. Rhodomonas salina) (Nygaard and Tobiesen 1993, Li et al.
1996, Li et al. 1999, Li et al. 2000, Adolf et al. 2003, Adolf et al. 2006a, Adolf et al.
2007, Adolf et al. 2008). Growth rates of mixotrophic K. veneficum (0.52 - 0.75 day-1)
have been found to be comparable to or greater than maximum growth rate in
phototrophic mode (0.55 day-1) (Adolf et al. 2006b). Phagotrophy of K. veneficum has
43
been intensively studied in Chesapeake Bay (Li et al. 1996, Li et al. 1999, Li et al.
2000, Adolf et al. 2003, Adolf et al. 2006a, Adolf et al. 2007, Adolf et al. 2008).
From field and laboratory data, phagotrophy of K. veneficum was positively
correlated with prey density (Li et al. 2000). N and/or P deficiency, or N:P ratios that
were substantially higher or lower than the optimum N:P ratio (~10), also increased
phagotrophic activity, suggesting feeding as a supplement for major nutrients (N, P)
(Li et al., 2000). Phagotrophic activity might also supplement organic carbon sources
or assist in acquiring trace growth factors (Li et al., 2000). High cryptophyte
abundance in the summer has been suggested to trigger K. veneficum blooms as
additional nutrient source in the Chesapeake Bay area (Adolf et al. 2008).
Cyanobacterial blooms (not including the picocyanobacteria species) are most
common in the tidal freshwater of the Chesapeake Bay (Marshall et al. 2006), which
is spatial difference from the regions of maximum abundance of the two
dinoflagellates, which generally did not bloom in such fresh water. High frequent
cyanobacterial blooms are generally observed in the summer and associated with high
DIP, low DIN:DIP ratio water. Some cyanobacteria (e.g. Anabaena spp.) have been
reported to be capable of fixing N2 as a new N source in relative low N waters in the
Chesapeake Bay (Burns et al. 2002, Moisander et al. 2007). This N2-fixation ability
may an important competitive advantage for these cyanobacteria to develop blooms.
Cyanobacterial blooms are also associated with very turbid water (secchi dept
~ 0.5 m). Cyanobacteria can possess gas vesicles in the cell, or/and form filaments to
keep high buoyancy and stay in the surface water (Sellner 1997), where they can

44
reach light and N2. These characters make cyanobacteria excellent competitors in the
low N, high turbidity freshwater.
In summary, P. minimum blooms generally develop in high DIN water in the
spring and early summer in mesohaline water of Chesapeake Bay, while K. veneficum
blooms develop after DIN was depleted in similar areas. These trends were consistent
with East China Sea and west Florida shelf for analogous species. Cyanobacterial
blooms (not including the picocyanobacteria species) generally develop in the tidal
freshwater of the Chesapeake Bay in the summer. Each species has corresponding
physiological strategies that may provide completive advantages to the environments.
The eutrophic areas in the Chesapeake Bay are the high frequent bloom areas.
Prorocentrum minimum, K. veneficum and cyanobacterial blooms also further
decreased the light availability in the water column.

45
References
Adolf J, Bachvaroff T, Place AR (2007) Cryptophytes drive blooms of mixotrophic harmful algae: A testable hypothesis based on Karlodinium veneficum in Chesapeake Bay. Journal of Phycology 43:31-31
Adolf JE, Bachvaroff T, Place AR (2008) Can cryptophyte abundance trigger toxic Karlodinium veneficum blooms in eutrophic estuaries? Harmful Algae 8:119-128
Adolf JE, Bachvaroff TR, Krupatkina DN, Nonogaki H, Brown PJP, Lewitus AJ, Harvey HR, Place AR (2006a) Species specificity and potential roles of Karlodinium micrum toxin. African Journal of Marine Science 28:415-419
Adolf JE, Stoecker DK, Harding LW (2003) Autotrophic growth and photoacclimation in Karlodinium micrum (Dinophyceae) and Storeatula major (Cryptophyceae). Journal of Phycology 39:1101-1108
Adolf JE, Stoecker DK, Harding LW (2006b) The balance of autotrophy and heterotrophy during mixotrophic growth of Karlodinium micrum (Dinophyceae). Journal of Plankton Research 28:737-751
Adolf JE, Yeager CL, Miller WD, Mallonee ME, Harding LW (2006c) Environmental forcing of phytoplankton floral composition, biomass, and primary productivity in Chesapeake Bay, USA. Estuarine Coastal and Shelf Science 67:108-122
Andersen JH, Schluter L, Ærtebjerg G (2006) Coastal eutrophication: recent developments in definitions and implications for monitoring strategies. Journal of Plankton Research 28:621-628
Anderson DM, Burkholder JM, Cochlan WP, Glibert PM, Gobler CJ, Heil CA, Kudela RM, Parsons ML, Rensel JEJ, Townsend DW, Trainer VL, Vargo GA (2008) Harmful algal blooms and eutrophication: Examining linkages from selected coastal regions of the United States. Harmful Algae 8:39-53
Anderson DM, Glibert PM, Burkholder JM (2002) Harmful algal blooms and eutrophication: Nutrient sources, composition, and consequences. Estuaries 25:704-726
46
Anderson SM, Roels OA (1981) Effects of light-intensity on nitrate and nitrite uptake and excretion by Chaetoceros curvisetus. Marine Biology 62:257-261
Behrenfeld MJ, Prasil O, Babin M, Bruyant F (2004) In search of a physiological basis for covariations in light-limited and light-saturated photosynthesis. Journal of Phycology 40:4-25
Berthouex PM, Pallesen L, Booman K, Sedlack R (1983) A preliminary assessment of Michigan's phosphorus detergent ban. Journal Water Pollution Control Federation 55:323-325
Bricker, S.B., C.G. Clement, D.E. Pirhalla, S.P. Orlando, and D.R.G. Farrow. 1999. National Estuarine Eutrophication Assessment: Effects of Nutrient Enrichment in the Nation's Estuaries. Silver Spring, MD: National Oceanic and Atmospheric Administration (NOAA), National Ocean Service. 71
Bulgakov NG, Levich AP (1999) The nitrogen : phosphorus ratio as a factor regulating phytoplankton community structure. Archiv Fur Hydrobiologie 146:3-22
Burkholder JM, Glasgow HB (1997) Pfiesteria piscicida and other Pfiesteria-like dinoflagellates: Behavior, impacts, and environmental controls. Limnology and Oceanography 42:1052-1075
Burns JA, Zehr JP, Capone DG (2002) Nitrogen-fixing phylotypes of Chesapeake Bay and Neuse River estuary sediments. Microbial Ecology 44:336-343
Chai C, Yu ZM, Song XX, Cao XH (2006) The status and characteristics of eutrophication in the Yangtze River (Changjiang) estuary and the adjacent East China Sea, China. Hydrobiologia 563:313-328
Cochlan WP, Harrison PJ, Denman KL (1991) Diel periodicity of nitrogen uptake by marine-phytoplankton in nitrate-rich environments. Limnology and Oceanography 36:1689-1700
Doemel WN, Brooks AE (1975) Detergent phosphorus and algal growth. Water Research 9:713-719

47
Doering PH, Oviatt CA, Nowicki BL, Klos EG, Reed LW (1995) Phosphorus and nitrogen limitation of primary production in a simulated estuarine gradient. Marine Ecology-Progress Series 124:271-287
Duan SW, Liang T, Zhang S, Wang LJ, Zhang XM, Chen XB (2008) Seasonal changes in nitrogen and phosphorus transport in the lower Changjiang River before the construction of the Three Gorges Dam. Estuarine Coastal and Shelf Science 79:239-250
Dyhrman, S., 2005. Ectoenzymes in Prorocentrum minimum: alkaline phosphatase and leucine aminopeptidase. Harmful Algae 4, 619–627
Eppley RW, Rogers JN, Mccarthy JJ, Sournia A (1971) Light/dark periodicity in nitrogen assimilation of marine phytoplankters Skeletonema costatum and Coccolithus huxleyi in N-limited chemostat culture. Journal of Phycology 7:150-154
Flynn KJ (2002) How critical is the critical N : P ratio? Journal of Phycology 38:961-970
Glibert PM, Anderson DM, Gentien P, Granéli E, Sellner KG (2005) The global, complex phenomena of harmful algal blooms. Oceanography 18 (2):136-147
Glibert PM, Burkholder JM (2006) The complex relationships between increasing fertilization of the earth, coastal eutrophication and proliferation of harmful algal blooms. In: Granéli E, Turner J (eds) Ecology of Harmful Algae. Springer, p 341-354
Glibert PM, Burkholder JM, Granéli E, Anderson DM (2008) Advances and insights in the complex relationships between eutrophication and HABs: Preface to the special issue. Harmful Algae 8:1-2
Glibert PM, Magnien R, Lomas MW, Alexander J, Fan CL, Haramoto E, Trice M, Kana TM (2001) Harmful algal blooms in the Chesapeake and Coastal Bays of Maryland, USA: Comparison of 1997, 1998, and 1999 events. Estuaries 24:875-883
Goldman JC, Mccarthy JJ, Peavey DG (1979) Growth-rate influence on the chemical composition of phytoplankton in oceanic waters. Nature 279:210-215
48
Goolsby DA, Battaglin WA (2000) Nitrogen in the Mississippi basin-estimating sources and predicting flux to the Gulf of Mexico. USGS Fact Sheet 135-00
Hagy JD, Boynton WR, Keefe CW, Wood KV (2004) Hypoxia in Chesapeake Bay, 1950-2001: Long-term change in relation to nutrient loading and river flow. Estuaries 27:634-658Hallegraeff GM (1993) A review of harmful algal blooms and their apparent global increase. Phycologia 32:79-99
Hartig JH, Horvath FJ (1982) A preliminary assessment of Michigan's phosphorus detergent ban. Journal Water Pollution Control Federation 54:193-197
Healey FP (1977) Ammonium and urea uptake by some freshwater algae. Canadian Journal of Botany-Revue Canadienne De Botanique 55:61-69
Hecky RE, Campbell P, Hendzel LL (1993) The stoichiometry of carbon, nitrogen, and phosphorus in particulate matter of lakes and oceans. Limnology and Oceanography 38:709-724
Heil CA, Revilla M, Glibert PM, Murasko S (2007) Nutrient quality drives differential phytoplankton community composition on the southwest Florida shelf. Limnology and Oceanography 52:1067-1078
Heisler J, Glibert PM, Burkholder JM, Anderson DM, Cochlan W, Dennison WC, Dortch Q, Gobler CJ, Heil CA, Humphries E, Lewitus A, Magnien R, Marshall HG, Sellner K, Stockwell DA, Stoecker DK, Suddleson M (2008) Eutrophication and harmful algal blooms: A scientific consensus. Harmful Algae 8:3-13
Hodgkiss IJ, Ho KC (1997) Are changes in N:P ratios in coastal waters the key to increased red tide blooms? Hydrobiologia 352:141-147
Hoffman FA, Bishop JW (1994) Impacts of a phosphate detergent ban on concentrations of phosphorus in the James River, Virginia. Water Research 28:1239-1240
Howarth RW (2008) Coastal nitrogen pollution: A review of sources and trends globally and regionally. Harmful Algae 8:14-20

49
Howarth RW, Boyer EW, Pabich WJ, Galloway JN (2002) Nitrogen use in the United States from 1961–2000 and potential future trends. AMBIO 32:88-96
Jaworski NA, Howarth RW, Hetling LI (1997) Atmospheric deposition of nitrogen oxides onto the landscape contributes to coastal eutrophication in the northeast United States. Environmental Science & Technology 31:1995-2004
Jordan TE, Cornwell JC, Boynton WR, Anderson JT (2008) Changes in phosphorus biogeochemistry along an estuarine salinity gradient: The iron conveyer belt. Limnology and Oceanography 53:172-184
Justic D, Rabalais NN, Turner RE (1995) Stoichiometric nutrient balance and origin of coastal eutrophication. Marine Pollution Bulletin 30:41-46
Koerselman W, Meuleman AFM (1996) The vegetation N:P ratio: A new tool to detect the nature of nutrient limitation. Journal of Applied Ecology 33:1441-1450
Lagus A, Suomela J, Weithoff G, Heikkila K, Helminen H, Sipura J (2004) Species-specific differences in phytoplankton responses to N and P enrichments and the N:P ratio in the Archipelago Sea, northern Baltic Sea. Journal of Plankton Research 26:779-798
Lee GF, Joneslee A (1995) Impacts of a phosphate detergent ban on concentrations of phosphorus in the James River, Virginia - comment. Water Research 29:1425-1426
Lee YS, Seiki T, Mukai T, Takimoto K, Okada M (1996) Limiting nutrients of phytoplankton community in Hiroshima Bay, Japan. Water Research 30:1490-1494
Li AS, Stoecker DK, Adolf JE (1999) Feeding, pigmentation, photosynthesis and growth of the mixotrophic dinoflagellate Gyrodinium galatheanum. Aquatic Microbial Ecology 19:163-176
Li AS, Stoecker DK, Coats DW (2000) Spatial and temporal aspects of Gyrodinium galatheanum in Chesapeake Bay: distribution and mixotrophy. Journal of Plankton Research 22:2105-2124
50
Li AS, Stoecker DK, Coats DW, Adam EJ (1996) Ingestion of fluorescently labeled and phycoerythrin-containing prey by mixotrophic dinoflagellates. Aquatic Microbial Ecology 10:139-147
Li J, Glibert PM, Zhou MJ (2010) Temporal and spatial variability in nitrogen uptake kinetics during harmful dinoflagellate blooms in the East China Sea. Harmful Algae 9:531-539
Li J, Glibert PM, Zhou MJ, Lu SH, Lu DD (2009) Relationships between nitrogen and phosphorus forms and ratios and the development of dinoflagellate blooms in the East China Sea. Marine Ecology-Progress Series 383:11-26
Maki AW, Porcella DB, Wendt RH (1984) The impact of detergent phosphorus bans on receiving water-quality. Water Research 18:893-903
Moisander PH, Morrison AE, Ward BB, Jenkins BD, Zehr JP (2007) Spatial-temporal variability in diazotroph assemblages in Chesapeake Bay using an oligonucleotide nifH microarray. Environmental Microbiology 9:1823-1835
Mulholland MR, Ohki K, Capone DG (1999) Nitrogen utilization and metabolism relative to patterns of N2 fixation in cultures of Trichodesmium NIBB1067. Journal of Phycology 35:977-988
Nygaard K, Tobiesen A (1993) Bacterivory in algae - a survival strategy during nutrient limitation. Limnology and Oceanography 38:273-279
Paerl HW (1997) Coastal eutrophication and harmful algal blooms: Importance of atmospheric deposition and groundwater as ''new'' nitrogen and other nutrient sources. Limnology and Oceanography 42:1154-1165
Paerl HW, Valdes LM, Joyner AR, Piehler MF (2004) Solving problems resulting from solutions: Evolution of a dual nutrient management strategy for the eutrophying Neuse river estuary, North Carolina. Environmental Science & Technology 38:3068-3073
Phillips DJH, Tanabe S (1989) Aquatic pollution in the Far-East. Marine Pollution Bulletin 20:297-303
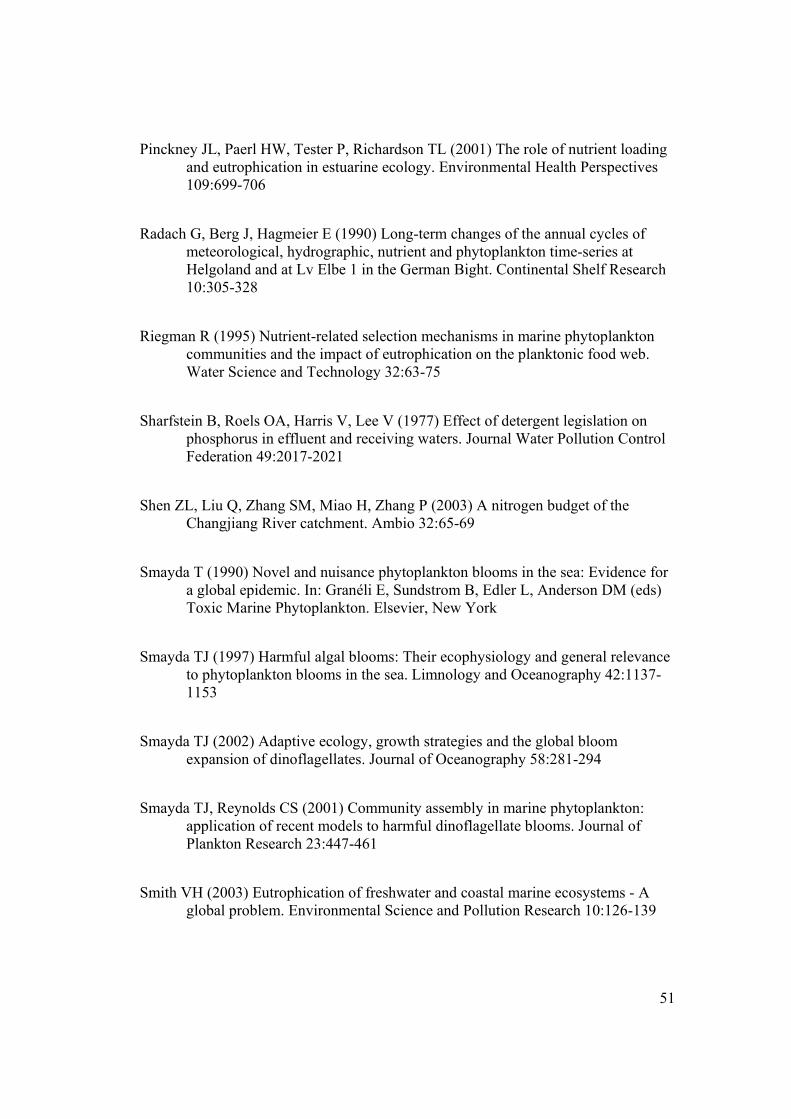
51
Pinckney JL, Paerl HW, Tester P, Richardson TL (2001) The role of nutrient loading and eutrophication in estuarine ecology. Environmental Health Perspectives 109:699-706
Radach G, Berg J, Hagmeier E (1990) Long-term changes of the annual cycles of meteorological, hydrographic, nutrient and phytoplankton time-series at Helgoland and at Lv Elbe 1 in the German Bight. Continental Shelf Research 10:305-328
Riegman R (1995) Nutrient-related selection mechanisms in marine phytoplankton communities and the impact of eutrophication on the planktonic food web. Water Science and Technology 32:63-75
Sharfstein B, Roels OA, Harris V, Lee V (1977) Effect of detergent legislation on phosphorus in effluent and receiving waters. Journal Water Pollution Control Federation 49:2017-2021
Shen ZL, Liu Q, Zhang SM, Miao H, Zhang P (2003) A nitrogen budget of the Changjiang River catchment. Ambio 32:65-69
Smayda T (1990) Novel and nuisance phytoplankton blooms in the sea: Evidence for a global epidemic. In: Granéli E, Sundstrom B, Edler L, Anderson DM (eds) Toxic Marine Phytoplankton. Elsevier, New York
Smayda TJ (1997) Harmful algal blooms: Their ecophysiology and general relevance to phytoplankton blooms in the sea. Limnology and Oceanography 42:1137-1153
Smayda TJ (2002) Adaptive ecology, growth strategies and the global bloom expansion of dinoflagellates. Journal of Oceanography 58:281-294
Smayda TJ, Reynolds CS (2001) Community assembly in marine phytoplankton: application of recent models to harmful dinoflagellate blooms. Journal of Plankton Research 23:447-461
Smith VH (2003) Eutrophication of freshwater and coastal marine ecosystems - A global problem. Environmental Science and Pollution Research 10:126-139
52
Smith VH (2006) Responses of estuarine and coastal marine phytoplankton to nitrogen and phosphorus enrichment. Limnology and Oceanography 51:377-384
Smith VH, Joye SB, Howarth RW (2006) Eutrophication of freshwater and marine ecosystems. Limnology and Oceanography 51:351-355
Smith VH, Tilman GD, Nekola JC (1999) Eutrophication: impacts of excess nutrient inputs on freshwater, marine, and terrestrial ecosystems. Environmental Pollution 100:179-196
Stelzer RS, Lamberti GA (2001) Effects of N : P ratio and total nutrient concentration on stream periphyton community structure, biomass, and elemental composition. Limnology and Oceanography 46:356-367
Tango P, Butler W, Lacouture R, Goshorn D, Magnien R, Michael B, Hall H, Browhawn K, Wittman R, Betty W (2004) An unprecedented bloom of Dinophysis acuminata in Chesapeake Bay. In: Steidinger KA, Landsberg JA, Tomas CR, Vargo GA (eds) Proceedings of the Xth International Conference on Harmful Algae, St. Petersburg, Florida, p 358–363
Tango PJ, Butler W (2008) Cyanotoxins in tidal waters of Chesapeake Bay. Northeastern Naturalist 15:403-416
Tango PJ, Magnien R, Butler W, Luckett C, Luckenbach M, Lacouture R, Poukish C (2005) Impacts and potential effects due to Prorocentrum minimum blooms in Chesapeake Bay. Harmful Algae 4:525-531
Tett P, Heaney SI, Droop MR (1985) The Redfield ratio and phytoplankton growth-rate. Journal of the Marine Biological Association of the United Kingdom 65:487-504
USDA (2008) Fertilizer consumption and use. United States Department of Agriculture. http://www.ers.usda.gov/Data/FertilizerUse/
Vrede T, Ballantyne A, Mille-Lindblom C, Algesten G, Gudasz C, Lindahl S, Brunberg AK (2009) Effects of N:P loading ratios on phytoplankton community composition, primary production and N fixation in a eutrophic lake. Freshwater Biology 54:331-344
53
Wheeler PA, Olson RJ, Chisholm SW (1983) Effects of photocycles and periodic ammonium supply on 3 marine-phytoplankton species .2. ammonium uptake and assimilation. Journal of Phycology 19:528-533
Yan WJ, Zhang S (2003) The composition and bioavailability of phosphorus transport through the Changjiang (Yangtze) River during the 1998 flood. Biogeochemistry 65:179-194
Zhang H, Litaker W, Vandersea MW, Tester P, Lin SJ (2008) Geographic distribution of Karlodinium veneficum in the US east coast as detected by ITS-ferredoxin real-time PCR assay. Journal of Plankton Research 30:905-922
Zhang J, Liu SM, Ren JL, Wu Y, Zhang GL (2007) Nutrient gradients from the eutrophic Changjiang (Yangtze River) Estuary to the oligotrophic Kuroshio waters and re-evaluation of budgets for the East China Sea Shelf. Progress in Oceanography 74:449-478

54
Figures
-77.5 -77 -76.5 -76
37
37.5
38
38.5
39
39.5
Figure 2-1 The routinely sampled stations (all the triangles) in the Chesapeake Bay and its tributaries by Maryland Departments of Natural Resources. Black triangles: the stations where Prorocentrum minimum, Karlodinium veneficum and cyanobacteria were recorded (cyanobacteria only include the species which could be counted in the resolution limit of light microscopy).
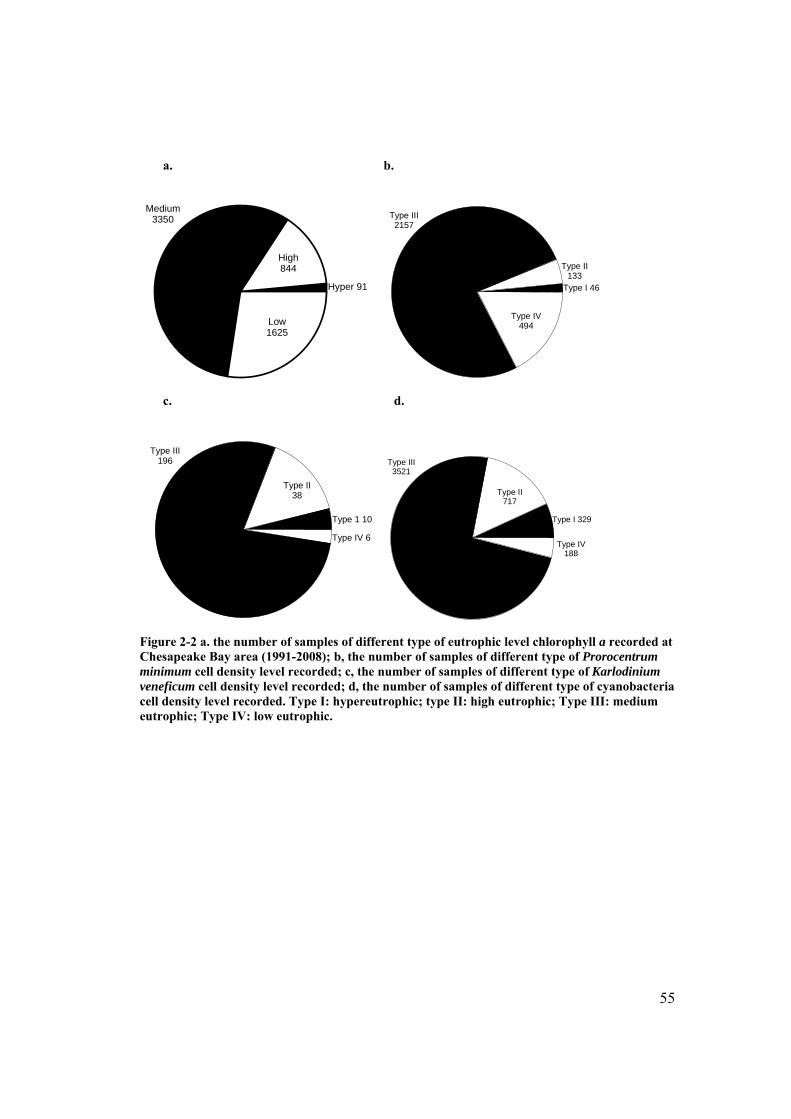
55
a. b.
Hyper 91
High844
Medium3350
Low1625
Type I 46
Type II133
Type III2157
Type IV494
c. d.
Type 1 10
Type II38
Type III196
Type IV 6
Type I 329
Type II717
Type III3521
Type IV188
Figure 2-2 a. the number of samples of different type of eutrophic level chlorophyll a recorded at Chesapeake Bay area (1991-2008); b, the number of samples of different type of Prorocentrum minimum cell density level recorded; c, the number of samples of different type of Karlodinium veneficum cell density level recorded; d, the number of samples of different type of cyanobacteria cell density level recorded. Type I: hypereutrophic; type II: high eutrophic; Type III: medium eutrophic; Type IV: low eutrophic.

56
-77 -76.5 -76
37
37.5
38
38.5
39
39.5
20 ug Chl a L-1
60 ug Chl a L-1
200 ug Chl a L-1
Figure 2-3 The spatial distribution of Chlorophyll a samples (> 10 mg L-1) in the Chesapeake Bay and its tributaries 1991-2008. Data were derived from routinely sampling by Maryland Department of Natural Resources. Each circle stands for one sample, and the diameters of the circles are propositional to the Chlorophyll a concentrations according to the scale in the inset. The circles overlap at stations where high Chlorophyll a concentrations were frequently recorded.
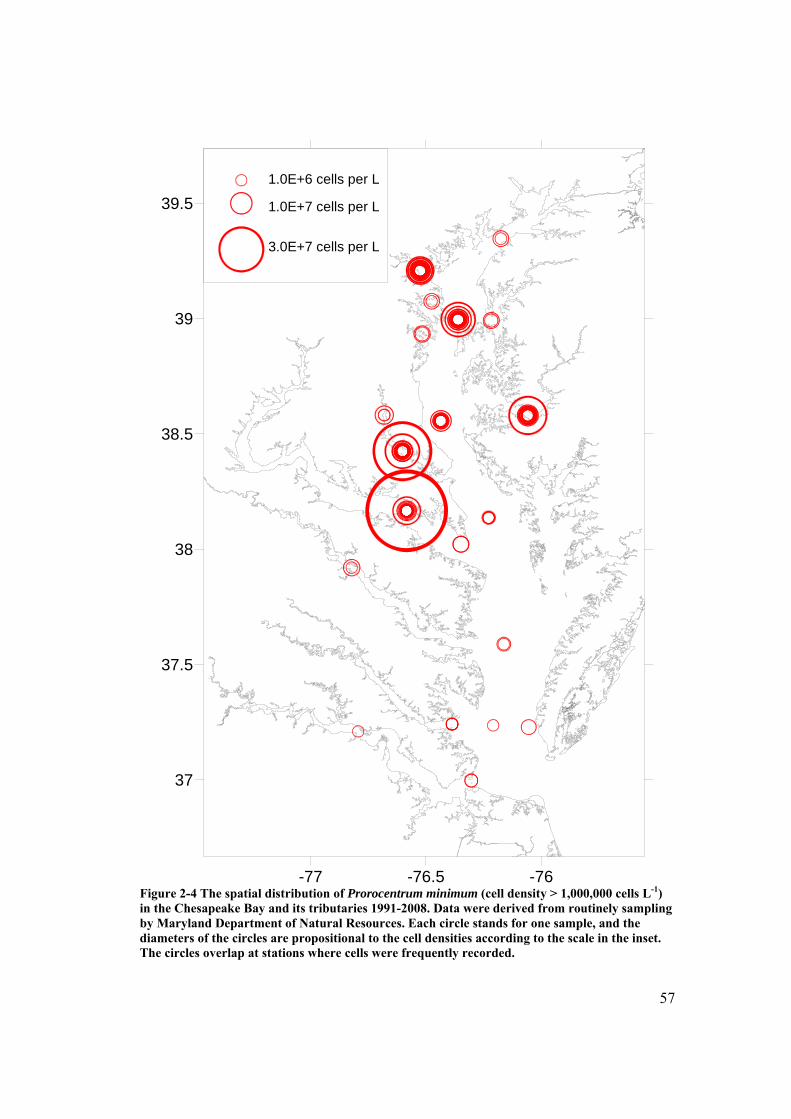
57
-77 -76.5 -76
37
37.5
38
38.5
39
39.5
1.0E+6 cells per L
1.0E+7 cells per L
3.0E+7 cells per L
Figure 2-4 The spatial distribution of Prorocentrum minimum (cell density > 1,000,000 cells L-1) in the Chesapeake Bay and its tributaries 1991-2008. Data were derived from routinely sampling by Maryland Department of Natural Resources. Each circle stands for one sample, and the diameters of the circles are propositional to the cell densities according to the scale in the inset. The circles overlap at stations where cells were frequently recorded.

58
-77 -76.5 -76
37
37.5
38
38.5
39
39.5
1.0E+6 cells per L
5.0E+6 cells per L
1.0E+7 cells per L
Figure 2-5 The spatial distribution of Karlodinium veneficum (cell density > 1,000,000 cells L-1) in the Chesapeake Bay and its tributaries 2003-2008. Data were derived from routinely sampling by Maryland Department of Natural Resources. Each circle stands for one sample, and the diameters of the circles are propositional to the cell densities according to the scale in the inset. The circles overlap at stations where cells were frequently recorded.
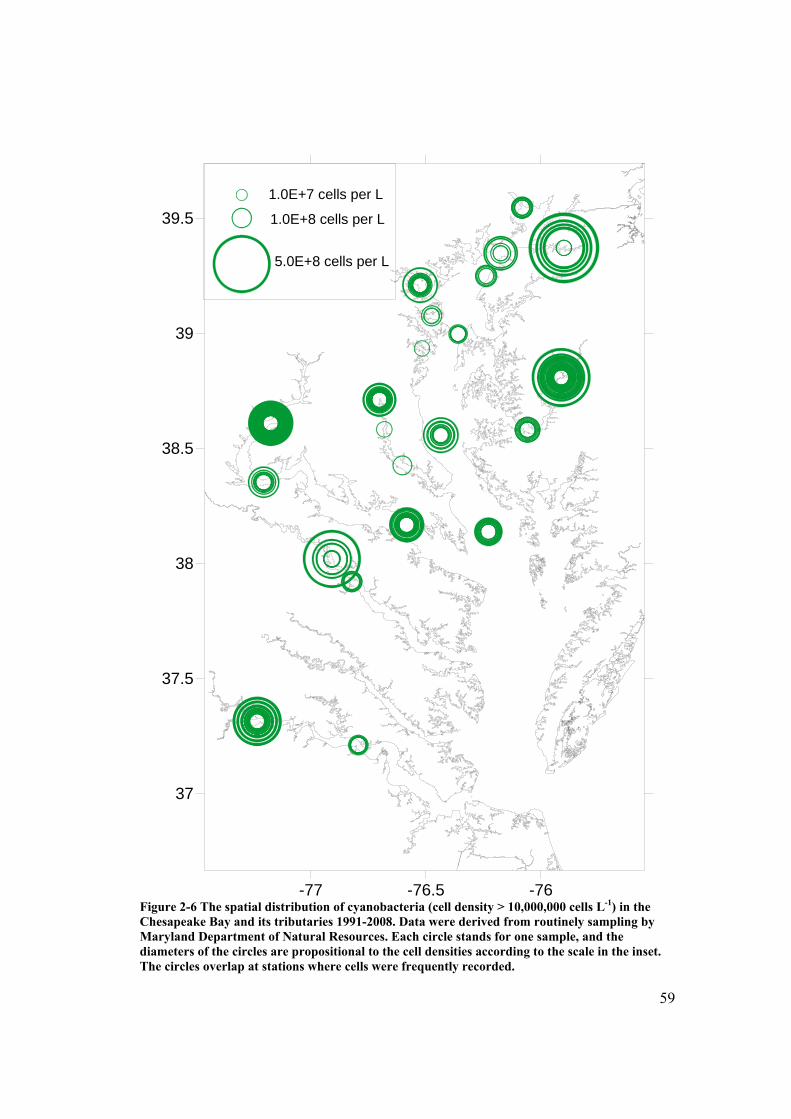
59
-77 -76.5 -76
37
37.5
38
38.5
39
39.5
1.0E+7 cells per L
1.0E+8 cells per L
5.0E+8 cells per L
Figure 2-6 The spatial distribution of cyanobacteria (cell density > 10,000,000 cells L-1) in the Chesapeake Bay and its tributaries 1991-2008. Data were derived from routinely sampling by Maryland Department of Natural Resources. Each circle stands for one sample, and the diameters of the circles are propositional to the cell densities according to the scale in the inset. The circles overlap at stations where cells were frequently recorded.
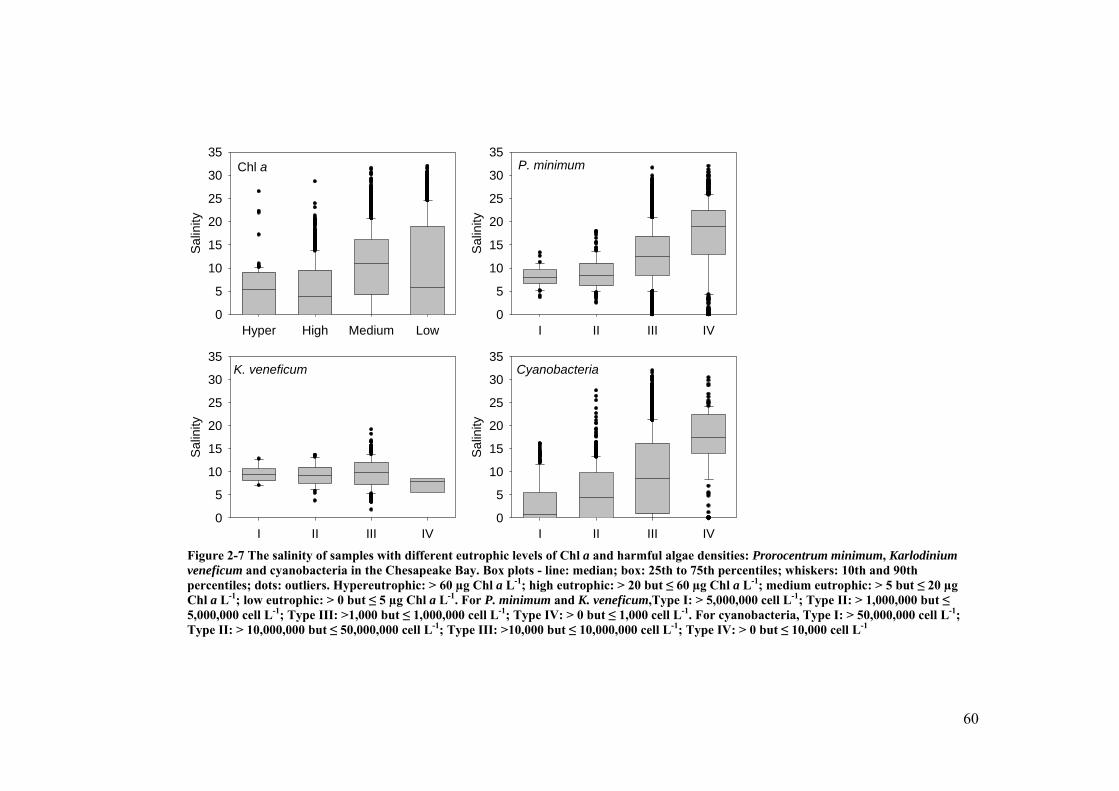
60
Chl a
Hyper High Medium Low
Sal
inity
0
5
10
15
20
25
30
35P. minimum
I II III IV
Sal
inity
0
5
10
15
20
25
30
35
K. veneficum
I II III IV
Sal
inity
0
5
10
15
20
25
30
35Cyanobacteria
I II III IV
Sal
inity
0
5
10
15
20
25
30
35
Figure 2-7 The salinity of samples with different eutrophic levels of Chl a and harmful algae densities: Prorocentrum minimum, Karlodinium veneficum and cyanobacteria in the Chesapeake Bay. Box plots - line: median; box: 25th to 75th percentiles; whiskers: 10th and 90th percentiles; dots: outliers. Hypereutrophic: > 60 µg Chl a L-1; high eutrophic: > 20 but ≤ 60 µg Chl a L-1; medium eutrophic: > 5 but ≤ 20 µg Chl a L-1; low eutrophic: > 0 but ≤ 5 µg Chl a L-1. For P. minimum and K. veneficum,Type I: > 5,000,000 cell L-1; Type II: > 1,000,000 but ≤ 5,000,000 cell L-1; Type III: >1,000 but ≤ 1,000,000 cell L-1; Type IV: > 0 but ≤ 1,000 cell L-1. For cyanobacteria, Type I: > 50,000,000 cell L-1; Type II: > 10,000,000 but ≤ 50,000,000 cell L-1; Type III: >10,000 but ≤ 10,000,000 cell L-1; Type IV: > 0 but ≤ 10,000 cell L-1
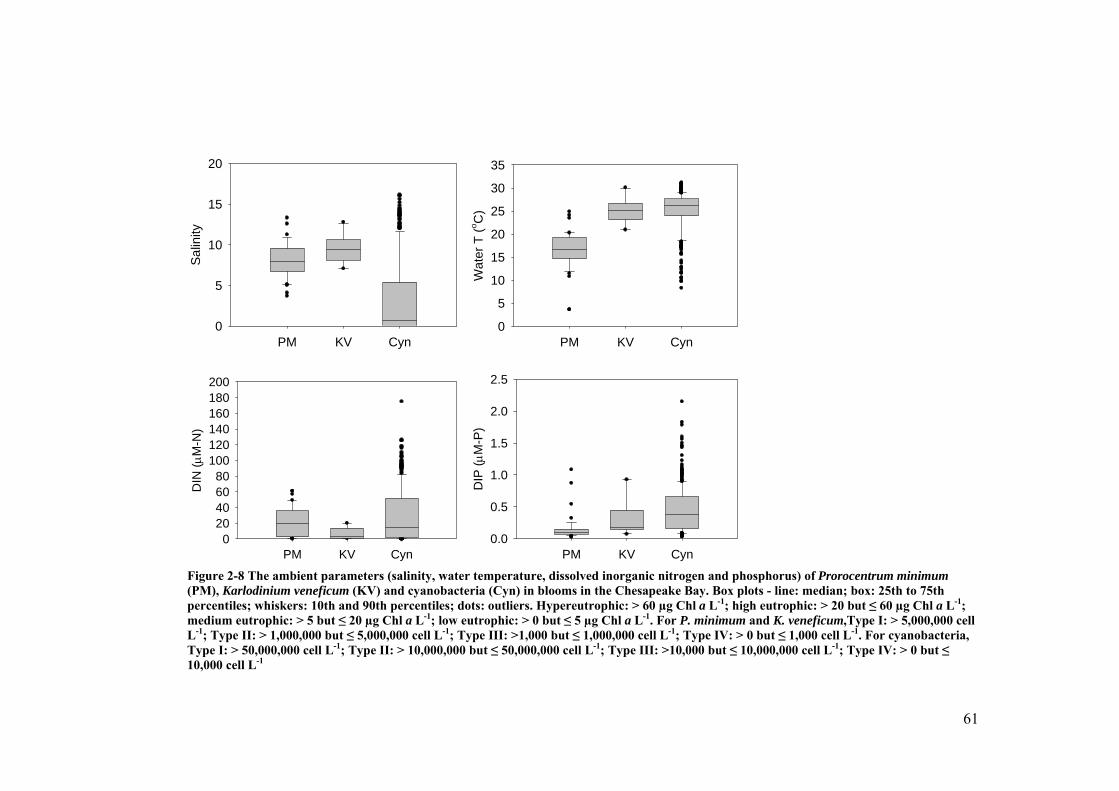
61
PM KV Cyn
Sa
linity
0
5
10
15
20
PM KV Cyn
Wa
ter
T (
oC
)
0
5
10
15
20
25
30
35
PM KV Cyn
DIN
(M
-N)
020406080
100120140160180200
PM KV Cyn
DIP
( M
-P)
0.0
0.5
1.0
1.5
2.0
2.5
Figure 2-8 The ambient parameters (salinity, water temperature, dissolved inorganic nitrogen and phosphorus) of Prorocentrum minimum (PM), Karlodinium veneficum (KV) and cyanobacteria (Cyn) in blooms in the Chesapeake Bay. Box plots - line: median; box: 25th to 75th percentiles; whiskers: 10th and 90th percentiles; dots: outliers. Hypereutrophic: > 60 µg Chl a L-1; high eutrophic: > 20 but ≤ 60 µg Chl a L-1; medium eutrophic: > 5 but ≤ 20 µg Chl a L-1; low eutrophic: > 0 but ≤ 5 µg Chl a L-1. For P. minimum and K. veneficum,Type I: > 5,000,000 cell L-1; Type II: > 1,000,000 but ≤ 5,000,000 cell L-1; Type III: >1,000 but ≤ 1,000,000 cell L-1; Type IV: > 0 but ≤ 1,000 cell L-1. For cyanobacteria, Type I: > 50,000,000 cell L-1; Type II: > 10,000,000 but ≤ 50,000,000 cell L-1; Type III: >10,000 but ≤ 10,000,000 cell L-1; Type IV: > 0 but ≤ 10,000 cell L-1

62
Chl a
Hyper High Medium Low
Mon
th
0
2
4
6
8
10
12
P. minimum
I II III IV
Mon
th
0
2
4
6
8
10
12
K. veneficum
I II III IV
Mo
nth
0
2
4
6
8
10
12
Cyanobacteria
I II III IV
Mo
nth
0
2
4
6
8
10
12
Figure 2-9 The month number of samples with different eutrophic levels of Chl a and harmful algae densities: Prorocentrum minimum, Karlodinium veneficum and cyanobacteria in the Chesapeake Bay. Box plots - line: median; box: 25th to 75th percentiles; whiskers: 10th and 90th percentiles; dots: outliers. Hypereutrophic: > 60 µg Chl a L-1; high eutrophic: > 20 but ≤ 60 µg Chl a L-1; medium eutrophic: > 5 but ≤ 20 µg Chl a L-1; low eutrophic: > 0 but ≤ 5 µg Chl a L-1. For P. minimum and K. veneficum,Type I: > 5,000,000 cell L-1; Type II: > 1,000,000 but ≤ 5,000,000 cell L-1; Type III: >1,000 but ≤ 1,000,000 cell L-1; Type IV: > 0 but ≤ 1,000 cell L-1. For cyanobacteria, Type I: > 50,000,000 cell L-1; Type II: > 10,000,000 but ≤ 50,000,000 cell L-1; Type III: >10,000 but ≤ 10,000,000 cell L-1; Type IV: > 0 but ≤ 10,000 cell L-1

63
Chl a
Hyper High Medium Low
Wat
er T
(oC
)
0
10
20
30
40
P. minimum
I II III IV
Wat
er T
(oC
)
0
10
20
30
40
K. veneficum
I II III IV
Wat
er T
(oC
)
0
10
20
30
40
Cyanobacteria
I II III IV
Wat
er T
(oC
)
0
10
20
30
40
Figure 2-10 The water temperature of samples with different eutrophic levels of Chl a and harmful algae densities: Prorocentrum minimum, Karlodinium veneficum and cyanobacteria in the Chesapeake Bay. Box plots - line: median; box: 25th to 75th percentiles; whiskers: 10th and 90th percentiles; dots: outliers. Hypereutrophic: > 60 µg Chl a L-1; high eutrophic: > 20 but ≤ 60 µg Chl a L-1; medium eutrophic: > 5 but ≤ 20 µg Chl a L-1; low eutrophic: > 0 but ≤ 5 µg Chl a L-1. For P. minimum and K. veneficum,Type I: > 5,000,000 cell L-1; Type II: > 1,000,000 but ≤ 5,000,000 cell L-1; Type III: >1,000 but ≤ 1,000,000 cell L-1; Type IV: > 0 but ≤ 1,000 cell L-1. For cyanobacteria, Type I: > 50,000,000 cell L-1; Type II: > 10,000,000 but ≤ 50,000,000 cell L-1; Type III: >10,000 but ≤ 10,000,000 cell L-1; Type IV: > 0 but ≤ 10,000 cell L-1

64
Chl a
Hyper High Medium Low
secc
hi (
m)
0
1
2
3
4P. minimum
I II III IV
secc
hi (
m)
0
1
2
3
4
K. veneficum
I II III IV
secc
hi (
m)
0
1
2
3
4
Cyanobacteria
I II III IV
secc
hi (
m)
0
1
2
3
4
Figure 2-11 The secchi depth of samples with different eutrophic levels of Chl a and harmful algae densities: Prorocentrum minimum, Karlodinium veneficum and cyanobacteria in the Chesapeake Bay. Box plots - line: median; box: 25th to 75th percentiles; whiskers: 10th and 90th percentiles; dots: outliers. Hypereutrophic: > 60 µg Chl a L-1; high eutrophic: > 20 but ≤ 60 µg Chl a L-1; medium eutrophic: > 5 but ≤ 20 µg Chl a L-1; low eutrophic: > 0 but ≤ 5 µg Chl a L-1. For P. minimum and K. veneficum,Type I: > 5,000,000 cell L-1; Type II: > 1,000,000 but ≤ 5,000,000 cell L-1; Type III: >1,000 but ≤ 1,000,000 cell L-1; Type IV: > 0 but ≤ 1,000 cell L-1. For cyanobacteria, Type I: > 50,000,000 cell L-1; Type II: > 10,000,000 but ≤ 50,000,000 cell L-1; Type III: >10,000 but ≤ 10,000,000 cell L-1; Type IV: > 0 but ≤ 10,000 cell L-1

65
Chl a
Hyper High Medium Low
TS
S (
mg
L-1)
0
20
40
60
80
100
P. minimum
I II III IV
TS
S (
mg
L-1)
0
20
40
60
80
100
K. veneficum
I II III IV
TS
S (
mg
L-1
)
0
20
40
60
80
100
Cyanobacteria
I II III IV
TS
S (
mg
L-1
)
0
20
40
60
80
100
Figure 2-12 The total suspended solids (TSS) of samples with different eutrophic levels of Chl a and harmful algae densities: Prorocentrum minimum, Karlodinium veneficum and cyanobacteria in the Chesapeake Bay. Box plots - line: median; box: 25th to 75th percentiles; whiskers: 10th and 90th percentiles; dots: outliers. Hypereutrophic: > 60 µg Chl a L-1; high eutrophic: > 20 but ≤ 60 µg Chl a L-1; medium eutrophic: > 5 but ≤ 20 µg Chl a L-1; low eutrophic: > 0 but ≤ 5 µg Chl a L-1. For P. minimum and K. veneficum,Type I: > 5,000,000 cell L-1; Type II: > 1,000,000 but ≤ 5,000,000 cell L-1; Type III: >1,000 but ≤ 1,000,000 cell L-1; Type IV: > 0 but ≤ 1,000 cell L-1. For cyanobacteria, Type I: > 50,000,000 cell L-1; Type II: > 10,000,000 but ≤ 50,000,000 cell L-1; Type III: >10,000 but ≤ 10,000,000 cell L-1; Type IV: > 0 but ≤ 10,000 cell L-1

66
Chl a
Hyper High Medium Low
DO
(m
g L
-1)
0
2
4
6
8
10
12
14
16
18
P. minimum
I II III IV
DO
(m
g L
-1)
0
2
4
6
8
10
12
14
16
18
K. veneficum
I II III IV
DO
(m
g L
-1)
0
2
4
6
8
10
12
14
16
18
Cyanobacteria
I II III IV
DO
(m
g L
-1)
0
2
4
6
8
10
12
14
16
18
Figure 2-13 The dissolved oxygen (DO) of samples with different eutrophic levels of Chl a and harmful algae densities: Prorocentrum minimum, Karlodinium veneficum and cyanobacteria in the Chesapeake Bay. Box plots - line: median; box: 25th to 75th percentiles; whiskers: 10th and 90th percentiles; dots: outliers. Hypereutrophic: > 60 µg Chl a L-1; high eutrophic: > 20 but ≤ 60 µg Chl a L-1; medium eutrophic: > 5 but ≤ 20 µg Chl a L-1; low eutrophic: > 0 but ≤ 5 µg Chl a L-1. For P. minimum and K. veneficum,Type I: > 5,000,000 cell L-1; Type II: > 1,000,000 but ≤ 5,000,000 cell L-1; Type III: >1,000 but ≤ 1,000,000 cell L-1; Type IV: > 0 but ≤ 1,000 cell L-1. For cyanobacteria, Type I: > 50,000,000 cell L-1; Type II: > 10,000,000 but ≤ 50,000,000 cell L-1; Type III: >10,000 but ≤ 10,000,000 cell L-1; Type IV: > 0 but ≤ 10,000 cell L-1

67
Chl a
Hyper High Medium Low
DO
C ( M
-C)
0
200
400
600
800
1000
P. minimum
I II III IV
DO
C ( M
-C)
0
200
400
600
800
1000
.
K. veneficum
I II III IV
DO
C ( M
-C)
0
200
400
600
800
1000
Cyanobacteria
I II III IV
DO
C ( M
-C)
0
200
400
600
800
1000
Figure 2-14 The dissolved organic carbon (DOC) of samples with different eutrophic levels of Chl a and harmful algae densities: Prorocentrum minimum, Karlodinium veneficum and cyanobacteria in the Chesapeake Bay. Box plots - line: median; box: 25th to 75th percentiles; whiskers: 10th and 90th percentiles; dots: outliers. Hypereutrophic: > 60 µg Chl a L-1; high eutrophic: > 20 but ≤ 60 µg Chl a L-1; medium eutrophic: > 5 but ≤ 20 µg Chl a L-1; low eutrophic: > 0 but ≤ 5 µg Chl a L-1. For P. minimum and K. veneficum,Type I: > 5,000,000 cell L-1; Type II: > 1,000,000 but ≤ 5,000,000 cell L-1; Type III: >1,000 but ≤ 1,000,000 cell L-1; Type IV: > 0 but ≤ 1,000 cell L-1. For cyanobacteria, Type I: > 50,000,000 cell L-1; Type II: > 10,000,000 but ≤ 50,000,000 cell L-1; Type III: >10,000 but ≤ 10,000,000 cell L-1; Type IV: > 0 but ≤ 10,000 cell L-1

68
Chl a
Hyper High Medium Low
DIN
( M
-N)
0
20
40
60
80
100
P. minimum
I II III IV
DIN
( M
-N)
0
20
40
60
80
100
K. veneficum
I II III IV
DIN
( M
-N)
0
20
40
60
80
100
Cyanobacteria
I II III IV
DIN
( M
-N)
0
20
40
60
80
100
Figure 2-15 The dissolved inorganic nitrogen (DIN) concentration of samples with different eutrophic levels of Chl a and harmful algae densities: Prorocentrum minimum, Karlodinium veneficum and cyanobacteria in the Chesapeake Bay. Box plots - line: median; box: 25th to 75th percentiles; whiskers: 10th and 90th percentiles; dots: outliers. Hypereutrophic: > 60 µg Chl a L-1; high eutrophic: > 20 but ≤ 60 µg Chl a L-1; medium eutrophic: > 5 but ≤ 20 µg Chl a L-1; low eutrophic: > 0 but ≤ 5 µg Chl a L-1. For P. minimum and K. veneficum,Type I: > 5,000,000 cell L-1; Type II: > 1,000,000 but ≤ 5,000,000 cell L-1; Type III: >1,000 but ≤ 1,000,000 cell L-1; Type IV: > 0 but ≤ 1,000 cell L-1. For cyanobacteria, Type I: > 50,000,000 cell L-1; Type II: > 10,000,000 but ≤ 50,000,000 cell L-1; Type III: >10,000 but ≤ 10,000,000 cell L-1; Type IV: > 0 but ≤ 10,000 cell L-1

69
Chl a
Hyper High Medium Low
PO
43-
( M
-P)
0.0
.5
1.0
1.5
2.0
P. minimum
I II III IV
PO
43
- ( M
-P)
0.0
0.5
1.0
1.5
2.0
K. veneficum
I II III IV
PO
43-
( M
-P)
0.0
.5
1.0
1.5
2.0
Cyanobacteria
I II III IV
PO
43-
( M
-P)
0.0
.5
1.0
1.5
2.0
Figure 2-16 The phosphate (PO4
3-) concentration of samples with different eutrophic levels of Chl a and harmful algae densities: Prorocentrum minimum, Karlodinium veneficum and cyanobacteria in the Chesapeake Bay. Box plots - line: median; box: 25th to 75th percentiles; whiskers: 10th and 90th percentiles; dots: outliers. Hypereutrophic: > 60 µg Chl a L-1; high eutrophic: > 20 but ≤ 60 µg Chl a L-1; medium eutrophic: > 5 but ≤ 20 µg Chl a L-1; low eutrophic: > 0 but ≤ 5 µg Chl a L-1. For P. minimum and K. veneficum,Type I: > 5,000,000 cell L-1; Type II: > 1,000,000 but ≤ 5,000,000 cell L-1; Type III: >1,000 but ≤ 1,000,000 cell L-1; Type IV: > 0 but ≤ 1,000 cell L-1. For cyanobacteria, Type I: > 50,000,000 cell L-1; Type II: > 10,000,000 but ≤ 50,000,000 cell L-1; Type III: >10,000 but ≤ 10,000,000 cell L-1; Type IV: > 0 but ≤ 10,000 cell L-1
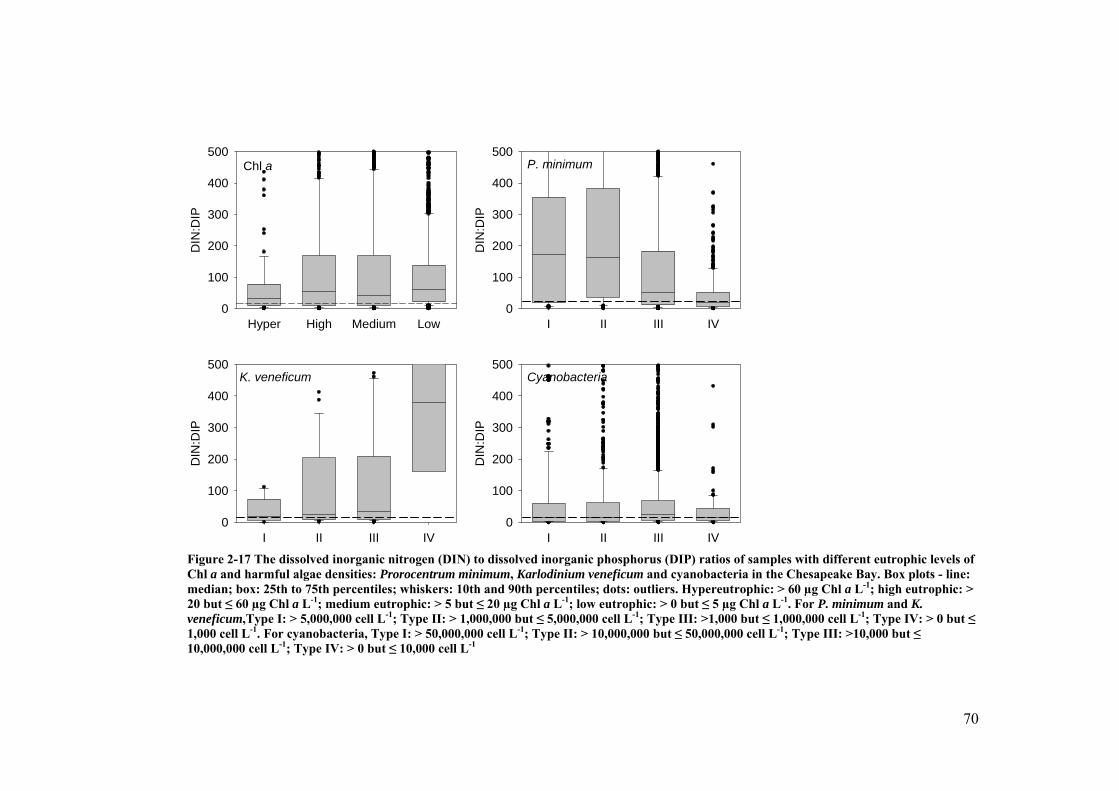
70
Chl a
Hyper High Medium Low
DIN
:DIP
0
100
200
300
400
500
P. minimum
I II III IV
DIN
:DIP
0
100
200
300
400
500
K. veneficum
I II III IV
DIN
:DIP
0
100
200
300
400
500
Cyanobacteria
I II III IV
DIN
:DIP
0
100
200
300
400
500
Figure 2-17 The dissolved inorganic nitrogen (DIN) to dissolved inorganic phosphorus (DIP) ratios of samples with different eutrophic levels of Chl a and harmful algae densities: Prorocentrum minimum, Karlodinium veneficum and cyanobacteria in the Chesapeake Bay. Box plots - line: median; box: 25th to 75th percentiles; whiskers: 10th and 90th percentiles; dots: outliers. Hypereutrophic: > 60 µg Chl a L-1; high eutrophic: > 20 but ≤ 60 µg Chl a L-1; medium eutrophic: > 5 but ≤ 20 µg Chl a L-1; low eutrophic: > 0 but ≤ 5 µg Chl a L-1. For P. minimum and K. veneficum,Type I: > 5,000,000 cell L-1; Type II: > 1,000,000 but ≤ 5,000,000 cell L-1; Type III: >1,000 but ≤ 1,000,000 cell L-1; Type IV: > 0 but ≤ 1,000 cell L-1. For cyanobacteria, Type I: > 50,000,000 cell L-1; Type II: > 10,000,000 but ≤ 50,000,000 cell L-1; Type III: >10,000 but ≤ 10,000,000 cell L-1; Type IV: > 0 but ≤ 10,000 cell L-1

71
PM KV Cyn
DIN
:DIP
0
100
200
300
400
500
600
PM KV Cyn
PC
:PN
0
20
40
60
80
100
120
140
`
PM KV Cyn
PC
:PP
0
200
400
600
800
1000
PM KV Cyn
PN
:PP
0
20
40
60
80
100
120
Figure 2-18 The ambient carbon, nitrogen and phosphorus rates of Prorocentrum minimum (PM), Karlodinium veneficum (KV) and cyanobacteria (Cyn) in blooms in the Chesapeake Bay. Box plots - line: median; box: 25th to 75th percentiles; whiskers: 10th and 90th percentiles; dots: outliers. Hypereutrophic: > 60 µg Chl a L-1; high eutrophic: > 20 but ≤ 60 µg Chl a L-1; medium eutrophic: > 5 but ≤ 20 µg Chl a L-1; low eutrophic: > 0 but ≤ 5 µg Chl a L-1. For P. minimum and K. veneficum,Type I: > 5,000,000 cell L-1; Type II: > 1,000,000 but ≤ 5,000,000 cell L-1; Type III: >1,000 but ≤ 1,000,000 cell L-1; Type IV: > 0 but ≤ 1,000 cell L-1. For cyanobacteria, Type I: > 50,000,000 cell L-1; Type II: > 10,000,000 but ≤ 50,000,000 cell L-1; Type III: >10,000 but ≤ 10,000,000 cell L-1; Type IV: > 0 but ≤ 10,000 cell L-1

72
Chl a
Hyper High Medium Low
PC
( M
-C)
0
200
400
600
800
1000
P. minimum
I II III IV
PC
( M
-C)
0
200
400
600
800
1000
K. veneficum
I II III IV
PC
( M
-C)
0
200
400
600
800
1000
Cyanobacteria
I II III IV
PC
( M
-C)
0
200
400
600
800
1000
Figure 2-19 The particle carbon (PC) concentration of samples with different eutrophic levels of Chl a and harmful algae densities: Prorocentrum minimum, Karlodinium veneficum and cyanobacteria in the Chesapeake Bay. Box plots - line: median; box: 25th to 75th percentiles; whiskers: 10th and 90th percentiles; dots: outliers. Hypereutrophic: > 60 µg Chl a L-1; high eutrophic: > 20 but ≤ 60 µg Chl a L-1; medium eutrophic: > 5 but ≤ 20 µg Chl a L-1; low eutrophic: > 0 but ≤ 5 µg Chl a L-1. For P. minimum and K. veneficum,Type I: > 5,000,000 cell L-1; Type II: > 1,000,000 but ≤ 5,000,000 cell L-1; Type III: >1,000 but ≤ 1,000,000 cell L-1; Type IV: > 0 but ≤ 1,000 cell L-1. For cyanobacteria, Type I: > 50,000,000 cell L-1; Type II: > 10,000,000 but ≤ 50,000,000 cell L-1; Type III: >10,000 but ≤ 10,000,000 cell L-1; Type IV: > 0 but ≤ 10,000 cell L-1
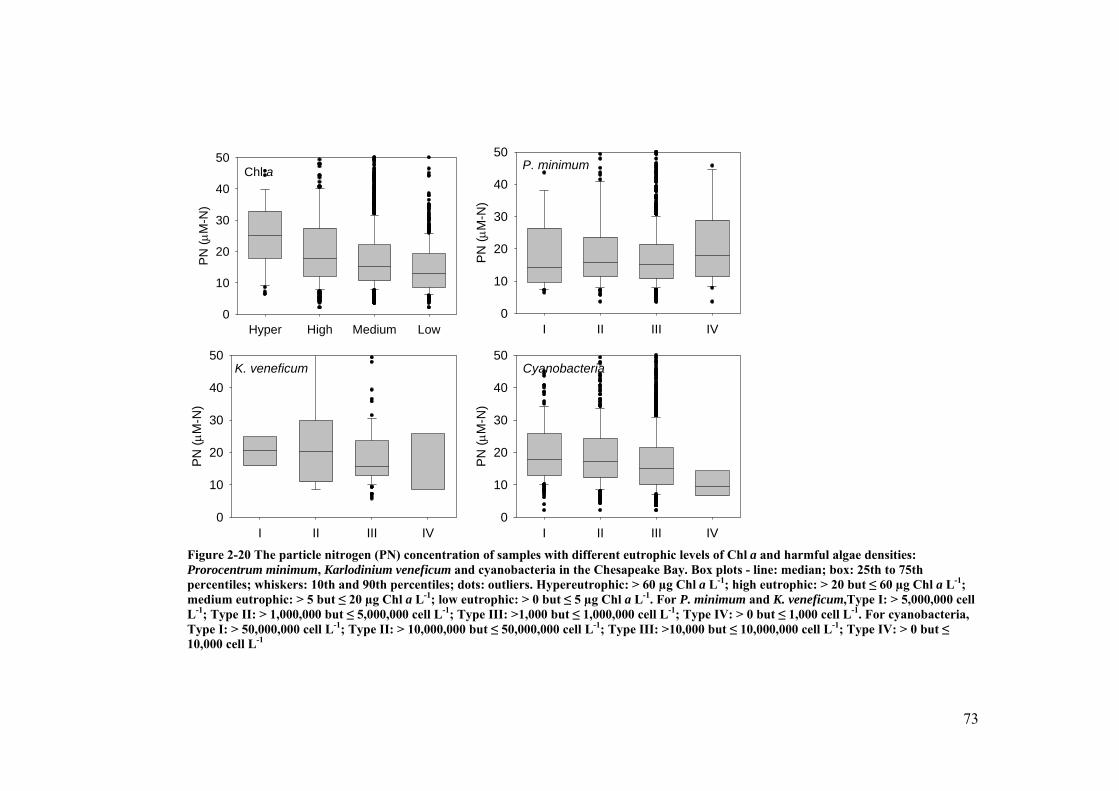
73
Chl a
Hyper High Medium Low
PN
( M
-N)
0
10
20
30
40
50
P. minimum
I II III IV
PN
( M
-N)
0
10
20
30
40
50
K. veneficum
I II III IV
PN
( M
-N)
0
10
20
30
40
50
Cyanobacteria
I II III IV
PN
( M
-N)
0
10
20
30
40
50
Figure 2-20 The particle nitrogen (PN) concentration of samples with different eutrophic levels of Chl a and harmful algae densities: Prorocentrum minimum, Karlodinium veneficum and cyanobacteria in the Chesapeake Bay. Box plots - line: median; box: 25th to 75th percentiles; whiskers: 10th and 90th percentiles; dots: outliers. Hypereutrophic: > 60 µg Chl a L-1; high eutrophic: > 20 but ≤ 60 µg Chl a L-1; medium eutrophic: > 5 but ≤ 20 µg Chl a L-1; low eutrophic: > 0 but ≤ 5 µg Chl a L-1. For P. minimum and K. veneficum,Type I: > 5,000,000 cell L-1; Type II: > 1,000,000 but ≤ 5,000,000 cell L-1; Type III: >1,000 but ≤ 1,000,000 cell L-1; Type IV: > 0 but ≤ 1,000 cell L-1. For cyanobacteria, Type I: > 50,000,000 cell L-1; Type II: > 10,000,000 but ≤ 50,000,000 cell L-1; Type III: >10,000 but ≤ 10,000,000 cell L-1; Type IV: > 0 but ≤ 10,000 cell L-1

74
Chl a
Hyper High Medium Low
PP
( M
-P)
0
5
10
15
20
P. minimum
I II III IV
PP
( M
-P)
0
5
10
15
20
P. minimum
I II III IV
PP
( M
-P)
0
2
4
6
8
10
Cyanobacteria
I II III IV
PP
( M
-P)
0
2
4
6
8
10
Figure 2-21 The particle phosphorus (PP) concentration of samples with different eutrophic levels of Chl a and harmful algae densities: Prorocentrum minimum, Karlodinium veneficum and cyanobacteria in the Chesapeake Bay. Box plots - line: median; box: 25th to 75th percentiles; whiskers: 10th and 90th percentiles; dots: outliers. Hypereutrophic: > 60 µg Chl a L-1; high eutrophic: > 20 but ≤ 60 µg Chl a L-1; medium eutrophic: > 5 but ≤ 20 µg Chl a L-1; low eutrophic: > 0 but ≤ 5 µg Chl a L-1. For P. minimum and K. veneficum,Type I: > 5,000,000 cell L-1; Type II: > 1,000,000 but ≤ 5,000,000 cell L-1; Type III: >1,000 but ≤ 1,000,000 cell L-1; Type IV: > 0 but ≤ 1,000 cell L-1. For cyanobacteria, Type I: > 50,000,000 cell L-1; Type II: > 10,000,000 but ≤ 50,000,000 cell L-1; Type III: >10,000 but ≤ 10,000,000 cell L-1; Type IV: > 0 but ≤ 10,000 cell L-1

75
Chl a
Hyper High Medium Low
PC
:PN
0
20
40
60
80
100
P. minimum
I II III IV
PC
:PN
0
20
40
60
80
100
K. veneficum
I II III IV
PC
:PN
0
20
40
60
80
100
Cyanobacteria
I II III IV
PC
:PN
0
20
40
60
80
100
Figure 2-22 The particle carbon (PC) to particle phosphorus (PP) ratios of samples with different eutrophic levels of Chl a and harmful algae densities: Prorocentrum minimum, Karlodinium veneficum and cyanobacteria in the Chesapeake Bay. Box plots - line: median; box: 25th to 75th percentiles; whiskers: 10th and 90th percentiles; dots: outliers. Hypereutrophic: > 60 µg Chl a L-1; high eutrophic: > 20 but ≤ 60 µg Chl a L-1; medium eutrophic: > 5 but ≤ 20 µg Chl a L-1; low eutrophic: > 0 but ≤ 5 µg Chl a L-1. For P. minimum and K. veneficum,Type I: > 5,000,000 cell L-1; Type II: > 1,000,000 but ≤ 5,000,000 cell L-1; Type III: >1,000 but ≤ 1,000,000 cell L-1; Type IV: > 0 but ≤ 1,000 cell L-1. For cyanobacteria, Type I: > 50,000,000 cell L-1; Type II: > 10,000,000 but ≤ 50,000,000 cell L-1; Type III: >10,000 but ≤ 10,000,000 cell L-1; Type IV: > 0 but ≤ 10,000 cell L-1

76
Chl a
Hyper High Medium Low
PC
:PP
0
200
400
600
800
1000
P. minimum
I II III IV
PC
:PP
0
200
400
600
800
1000
K. veneficum
I II III IV
PC
:PP
0
200
400
600
800
1000
Cyanobacteria
I II III IV
PC
:PP
0
200
400
600
800
1000
Figure 2-23 The particle carbon (PC) to particle phosphorus (PP) ratios of samples with different eutrophic levels of Chl a and harmful algae densities: Prorocentrum minimum, Karlodinium veneficum and cyanobacteria in the Chesapeake Bay. Dash line: PC:PP = 106. Box plots - line: median; box: 25th to 75th percentiles; whiskers: 10th and 90th percentiles; dots: outliers. Hypereutrophic: > 60 µg Chl a L-1; high eutrophic: > 20 but ≤ 60 µg Chl a L-1; medium eutrophic: > 5 but ≤ 20 µg Chl a L-1; low eutrophic: > 0 but ≤ 5 µg Chl a L-1. For P. minimum and K. veneficum,Type I: > 5,000,000 cell L-1; Type II: > 1,000,000 but ≤ 5,000,000 cell L-1; Type III: >1,000 but ≤ 1,000,000 cell L-1; Type IV: > 0 but ≤ 1,000 cell L-1. For cyanobacteria, Type I: > 50,000,000 cell L-1; Type II: > 10,000,000 but ≤ 50,000,000 cell L-1; Type III: >10,000 but ≤ 10,000,000 cell L-1; Type IV: > 0 but ≤ 10,000 cell L-1
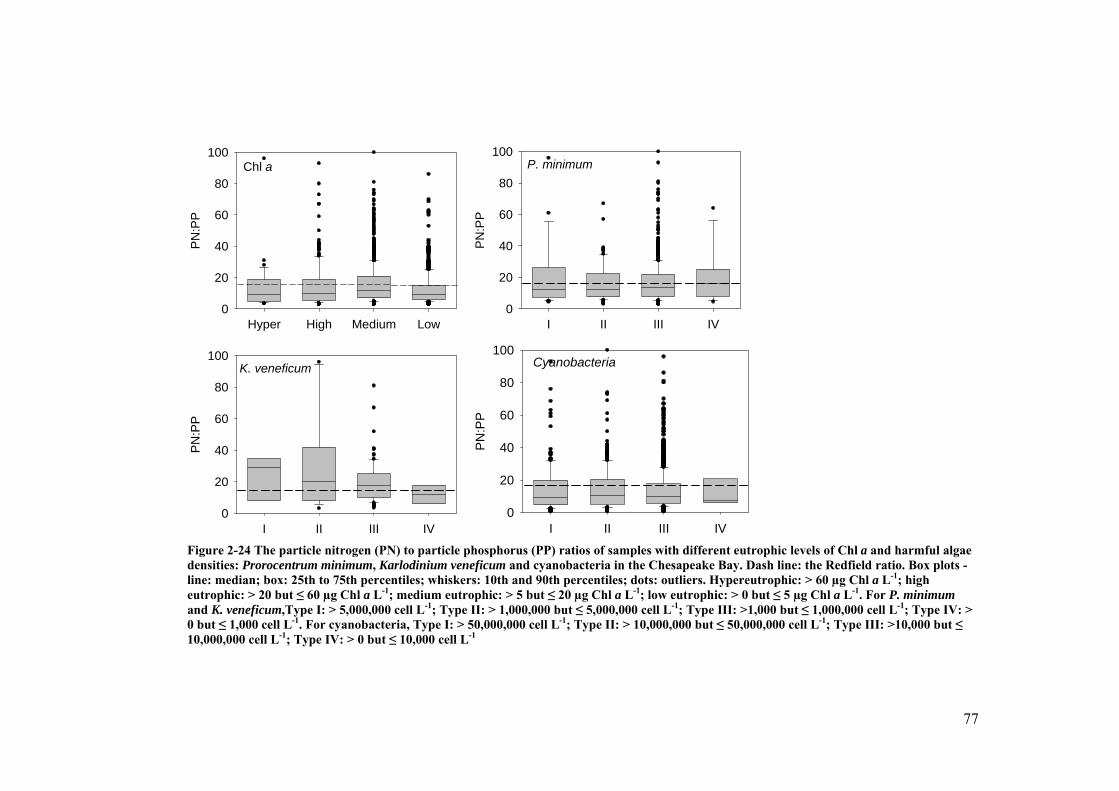
77
Chl a
Hyper High Medium Low
PN
:PP
0
20
40
60
80
100
P. minimum
I II III IV
PN
:PP
0
20
40
60
80
100
K. veneficum
I II III IV
PN
:PP
0
20
40
60
80
100
Cyanobacteria
I II III IV
PN
:PP
0
20
40
60
80
100
Figure 2-24 The particle nitrogen (PN) to particle phosphorus (PP) ratios of samples with different eutrophic levels of Chl a and harmful algae densities: Prorocentrum minimum, Karlodinium veneficum and cyanobacteria in the Chesapeake Bay. Dash line: the Redfield ratio. Box plots - line: median; box: 25th to 75th percentiles; whiskers: 10th and 90th percentiles; dots: outliers. Hypereutrophic: > 60 µg Chl a L-1; high eutrophic: > 20 but ≤ 60 µg Chl a L-1; medium eutrophic: > 5 but ≤ 20 µg Chl a L-1; low eutrophic: > 0 but ≤ 5 µg Chl a L-1. For P. minimum and K. veneficum,Type I: > 5,000,000 cell L-1; Type II: > 1,000,000 but ≤ 5,000,000 cell L-1; Type III: >1,000 but ≤ 1,000,000 cell L-1; Type IV: > 0 but ≤ 1,000 cell L-1. For cyanobacteria, Type I: > 50,000,000 cell L-1; Type II: > 10,000,000 but ≤ 50,000,000 cell L-1; Type III: >10,000 but ≤ 10,000,000 cell L-1; Type IV: > 0 but ≤ 10,000 cell L-1
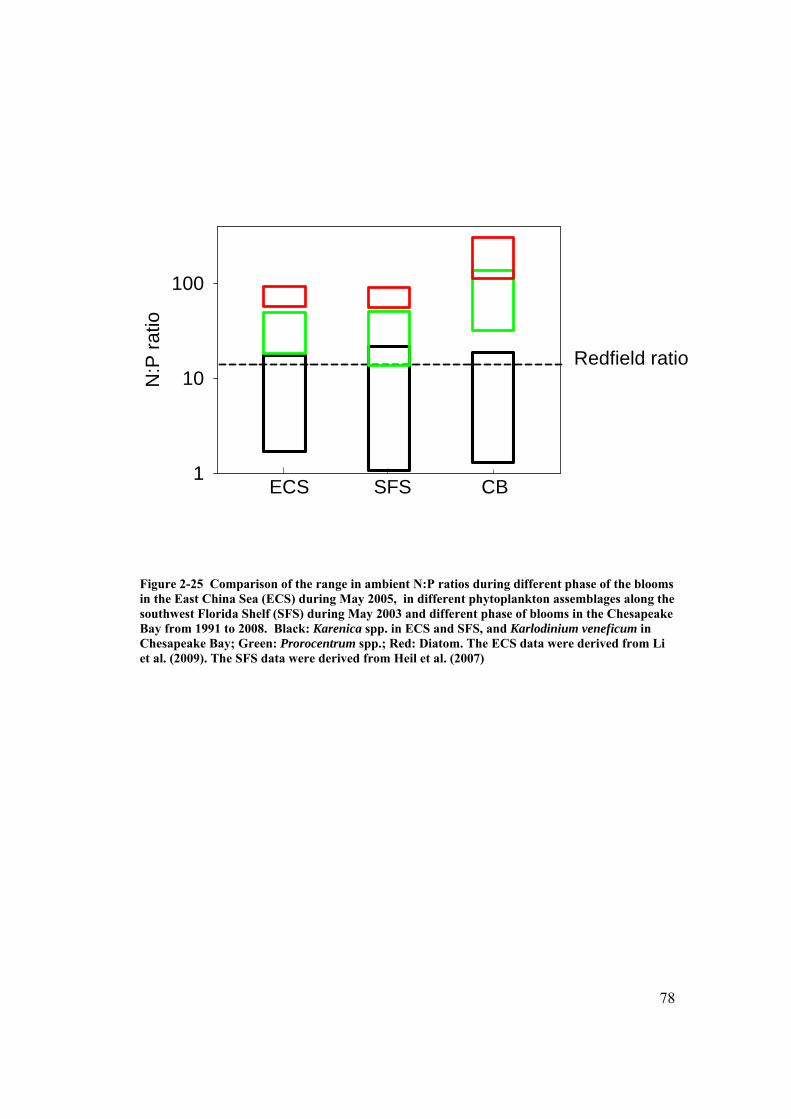
78
N:P
rat
io
1
10
100
ECS SFS CB
Redfield ratio
Figure 2-25 Comparison of the range in ambient N:P ratios during different phase of the blooms in the East China Sea (ECS) during May 2005, in different phytoplankton assemblages along the southwest Florida Shelf (SFS) during May 2003 and different phase of blooms in the Chesapeake Bay from 1991 to 2008. Black: Karenica spp. in ECS and SFS, and Karlodinium veneficum in Chesapeake Bay; Green: Prorocentrum spp.; Red: Diatom. The ECS data were derived from Li et al. (2009). The SFS data were derived from Heil et al. (2007)
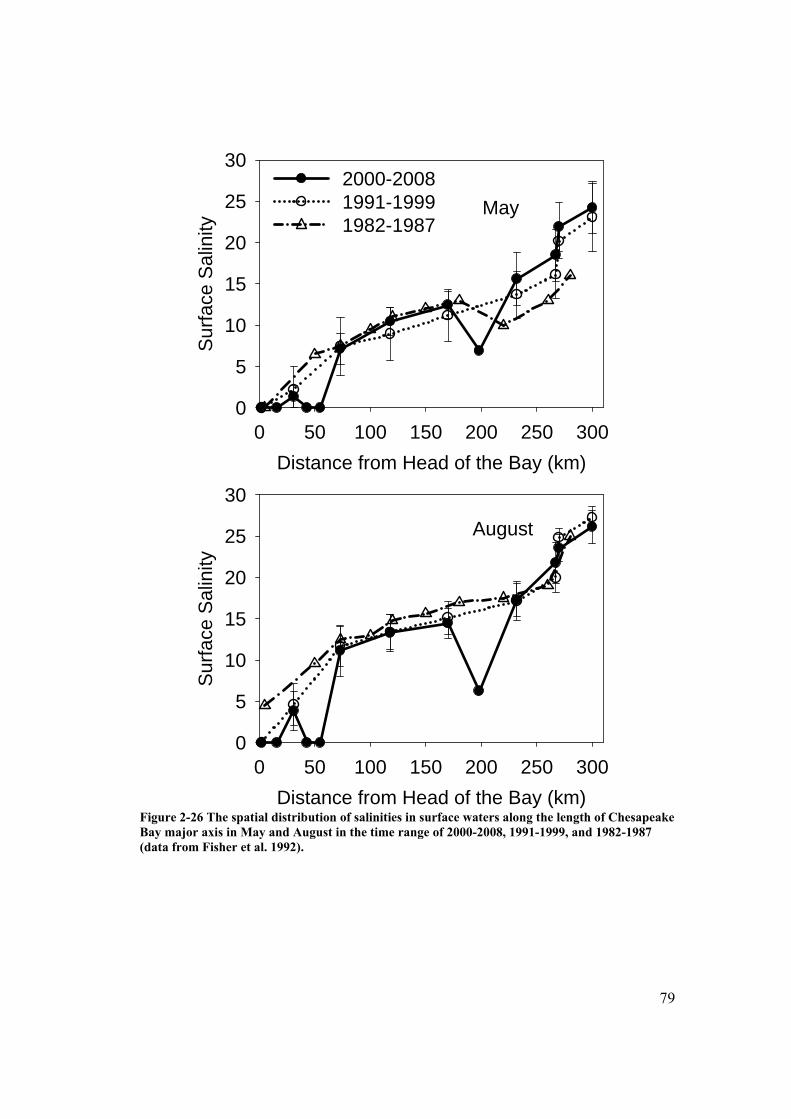
79
May
Distance from Head of the Bay (km)
0 50 100 150 200 250 300
Sur
face
Sal
inity
0
5
10
15
20
25
302000-20081991-19991982-1987
August
Distance from Head of the Bay (km)
0 50 100 150 200 250 300
Sur
face
Sal
inity
0
5
10
15
20
25
30
Figure 2-26 The spatial distribution of salinities in surface waters along the length of Chesapeake Bay major axis in May and August in the time range of 2000-2008, 1991-1999, and 1982-1987 (data from Fisher et al. 1992).

80
May
Distance from Head of the Bay (km)
0 50 100 150 200 250 300
DIN
( M
)
0
20
40
60
80
100
120
1402000-20081991-19991982-1987
August
Distance from Head of the Bay (km)
0 50 100 150 200 250 300
DIN
( M
)
0
20
40
60
80
100
120
140
Figure 2-27 The spatial distribution of dissolved inorganic nitrogen (DIN) in surface waters along the length of Chesapeake Bay major axis in May and August in the time range of 2000-2008, 1991-1999, and 1982-1987 (data from Fisher et al. 1992).

81
May
Distance from Head of the Bay (km)
0 50 100 150 200 250 300
PO
43- (M
)
0.0
0.2
0.4
0.6
0.8
1.02000-20081991-19991982-1987
August
Distance from Head of the Bay (km)
0 50 100 150 200 250 300
PO
43
- (M
)
0.0
0.2
0.4
0.6
0.8
1.0
Figure 2-28 The spatial distribution of phosphate (PO4
3-) in surface waters along the length of Chesapeake Bay major axis in May and August in the time range of 2000-2008, 1991-1999, and 1982-1987 (data from Fisher et al. 1992).

82
May
Distance from Head of the Bay (km)
0 50 100 150 200 250 300
N:P
rat
io
0.1
1
10
100
1000
2000-20081991-19991982-1987
August
Distance from Head of the Bay (km)
0 50 100 150 200 250 300
N:P
rat
io
0.1
1
10
100
1000
Figure 2-29 The spatial distribution of dissolved inorganic nitrate: dissolved inorganic phosphate (N:P) ratio in surface waters along the length of Chesapeake Bay major axis in May and August in the time range of 2000-2008, 1991-1999, and 1982-1987 (data from Fisher et al. 1992).

83
May
Distance from Head of the Bay (km)
0 50 100 150 200 250 300
Chl
a (g
ml-1
)
0
10
20
30
40
50
602000-20081991-19991982-1987
August
Distance from Head of the Bay (km)
0 50 100 150 200 250 300
Ch
l a (g
ml-1
)
0
10
20
30
40
50
Figure 2-30 The spatial distribution of chlorophyll a in surface waters along the length of Chesapeake Bay major axis in May and August in the time range of 2000-2008, 1991-1999, and 1982-1987 (data from Fisher et al. 1992).

84
Figure 2-31. The summer surface water salinity in the Chesapeake Bay (modified from http://www.ncnr.nist.gov/programs/CHRNS/pdf/salinity_fall.png)

85
DIN - Zone I
Month of year
1 2 3 4 5 6 7 8 9 10 11 12
M
0
50
100
150
DIN - Zone II
Month of year
1 2 3 4 5 6 7 8 9 10 11 12
M
0
50
100
DIN - Zone III
Month of year
1 2 3 4 5 6 7 8 9 10 11 12
M
0
10
20
30
40
50
Figure 2-32 The seasonal variation of monthly average dissolved inorganic nitrogen (DIN) concentrations in 3 zones of Chesapeake Bay. Box plots - line: median; box: 25th to 75th percentiles; whiskers: 10th and 90th percentiles; dots: outliers.

86
PO43- - Zone I
Month of year
1 2 3 4 5 6 7 8 9 10 11 12
M
0.0
0.5
1.0
1.5
2.0
PO43- - Zone II
Month of year
1 2 3 4 5 6 7 8 9 10 11 12
M
0.0
0.5
1.0
1.5
2.0
PO43- - Zone III
Month of year
1 2 3 4 5 6 7 8 9 10 11 12
M
0.0
0.5
1.0
1.5
2.0
Figure 2-33 The seasonal variation of monthly average phosphate (PO4
3-) concentrations in 3 zones of Chesapeake Bay. Box plots - line: median; box: 25th to 75th percentiles; whiskers: 10th and 90th percentiles; dots: outliers.

87
N:P ratio - Zone I
Month of year
1 2 3 4 5 6 7 8 9 10 11 120
100
200
300
400
500
N:P ratio - Zone II
Month of year
1 2 3 4 5 6 7 8 9 10 11 120
100
200
300
400
500
N:P ratio - Zone III
Month of year
1 2 3 4 5 6 7 8 9 10 11 120
100
200
300
400
500
Figure 2-34 The seasonal variation of ambient dissolved inorganic nitrogen (N): phosphate (P) ratios in 3 zones of Chesapeake Bay. Dash line: the Redfield ratio. Box plots - line: median; box: 25th to 75th percentiles; whiskers: 10th and 90th percentiles; dots: outliers.

88
Chl a - Zone I
Month of year
1 2 3 4 5 6 7 8 9 10 11 12
mg
L-1
0
10
20
30
40
50
Chl a - Zone II
Month of year
1 2 3 4 5 6 7 8 9 10 11 12
mg
L-1
0
10
20
30
40
50
Chl a - Zone III
Month of year
1 2 3 4 5 6 7 8 9 10 11 12
mg
L-1
0
10
20
30
40
50
Figure 2-35 The seasonal variation of monthly average chlorophyll a concentrations in 3 zones of Chesapeake Bay. Box plots - line: median; box: 25th to 75th percentiles; whiskers: 10th and 90th percentiles; dots: outliers.
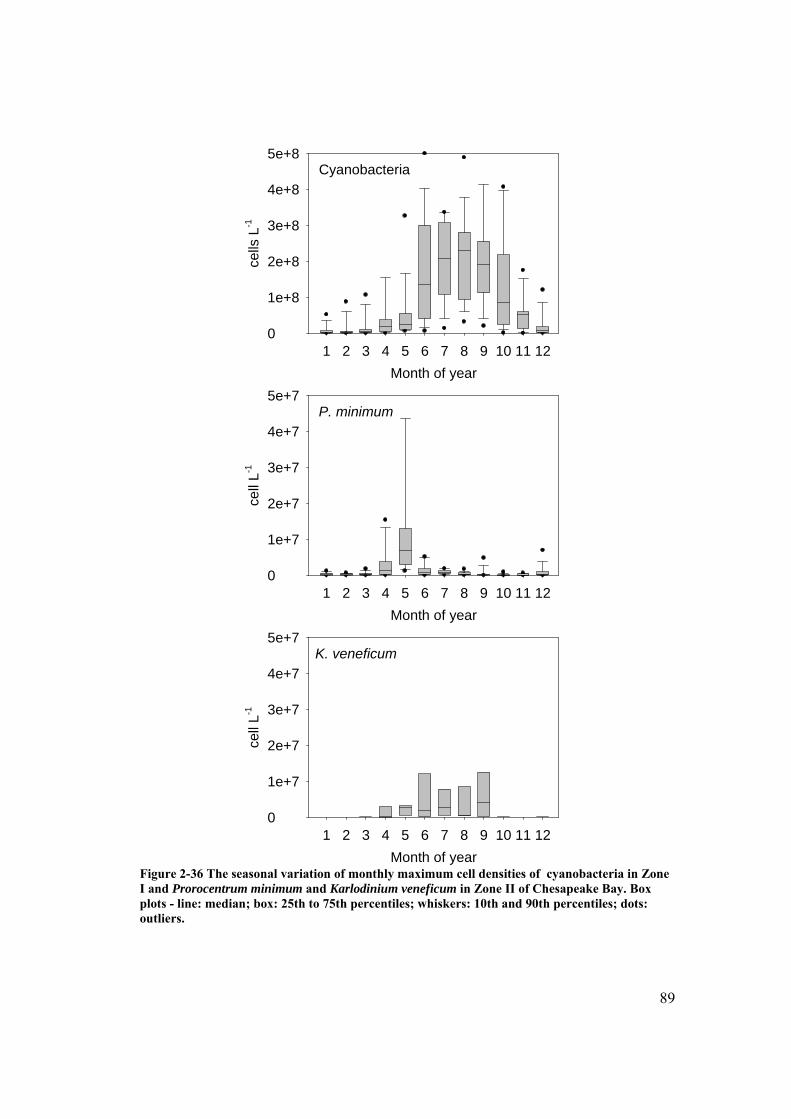
89
Cyanobacteria
Month of year
1 2 3 4 5 6 7 8 9 10 11 12
cells
L-1
0
1e+8
2e+8
3e+8
4e+8
5e+8
P. minimum
Month of year
1 2 3 4 5 6 7 8 9 10 11 12
cell
L-1
0
1e+7
2e+7
3e+7
4e+7
5e+7
K. veneficum
Month of year
1 2 3 4 5 6 7 8 9 10 11 12
cell
L-1
0
1e+7
2e+7
3e+7
4e+7
5e+7
Figure 2-36 The seasonal variation of monthly maximum cell densities of cyanobacteria in Zone I and Prorocentrum minimum and Karlodinium veneficum in Zone II of Chesapeake Bay. Box plots - line: median; box: 25th to 75th percentiles; whiskers: 10th and 90th percentiles; dots: outliers.

90
Chapter 3: Effects of Ambient DIN : DIP Ratio on the
Nitrogen Uptake of Harmful Dinoflagellate Prorocentrum
minimum and Prorocentrum donghaiense in Turbidistat*
Abstract
The effects of varying nitrogen (N): phosphorus (P) ratios on the growth and N-
uptake /assimilation of the harmful dinoflagellate Prorocentrum minimum and
Prorocentrum donghaiense were examined in turbidistat culture experiments. Algal
cultures were supplied with media containing PO43- in various concentrations to
obtain a wide range of N:P ratios. Experiments to determine rates of N uptake and
assimilation of different N sources (NO3−, NH4
+, urea and glycine by P. minimum and
NO3−, NH4
+ by P. donghaiense) were conducted using 15N tracer techniques at each
N:P ratio. The growth rates suggested nutrient limitation at both high and low N:P
ratios relative to the Redfield ratio. On a diel basis, the growth of both species was
regulated by the light-dark cycle, which may be a result of regulation of both light-
dependent growth and light-independent nutrient uptake. Maximum growth rates of
both species always occurred at the beginning of the light phase. In P-rich medium
(low N:P ratio), both species had higher N assimilation rates, suggesting N limitation.
Low assimilation coefficients at high N:P ratios suggested P limitation of N uptake
and assimilation. NO3− and NH4
+ contributed more than 90% of the total N uptake of
P. minimum. Reduced N sources were more quickly assimilated than NO3−. Highest
average daily growth rates were recorded near N:P ratio of 12 for both species. The N
uptake rates of cultures at N:P ratio near Redfield ratio were more balanced with the
* Li J, Glibert PM, Alexander JA Chinese Journal of Oceanology and Limnology (in press)
91
growth rates. The linkage between growth rates and N uptake/assimilation rates were
conceptually described by the variation of cell N quota. The N:P ratios affect the N
uptake and growth of Prorocentrum spp., and may regulate their bloom progression
in eutrophic ecosystems.
Introduction
Prorocentrum minimum, a bloom forming dinoflagellate, has been shown to be
widely distributed globally (Heil et al. 2005, Glibert et al. 2008b). Its expanding
geographical distribution is indicative of a strong relationship between both dissolved
inorganic nitrogen (DIN) export and dissolved organic nitrogen (DON) export into
coastal waters globally (Heil et al. 2005, Glibert and Burkholder 2006, Glibert et al.
2008a). A related pelagic Prorocentrum species, Prorocentrum donghaiense, has also
been suggested to be an eutrophication-related species, becoming one of the dominant
bloom species observed along coast of China in recent years (Lu and Goebel 2001,
Zhou et al. 2003, Li et al. 2009).
The nitrogen nutritional strategies of P. minimum have been well studied, and
the understanding of those of P. donghaiense are advancing. Both species can take up
a range of nitrogen substrates, including NO3-, NH4
+, and urea (Lomas and Glibert
1999a, b, Burns et al. 2000, Fan et al. 2003a, Li et al. 2010). The affinity for different
nitrogen substrates varies with growth condition (Fan et al. 2003b) and with the rate
of resupply (Sciandra 1991). Organic forms of nitrogen have also been found to be
taken up via a range of mechanisms. The protease leucine aminopeptidase (LAP), one
of the enzymes that liberates amino acids, has been found to be active in this species
92
in both laboratory and field studies (Stoecker and Gustafson 2003, Salerno and
Stoecker 2009). Moreover, P. minimum is mixotrophic and has been shown to graze
upon a wide range of organisms, from organic particles (Li et al. 1996) to other
microalgae (Stoecker et al. 1997, Heil et al. 2005, Jeong et al. 2005b). The nutrient
strategies of P. donghaiense are less well documented, but from what is currently
known, they appear to be similar to those of P. minimum. P. donghaiense has also
been shown to graze on cyanobacteria (Synechococcus etc.) and cryptophytes (Jeong
et al. 2005a, Jeong et al. 2005b).
The uptake of NO3- by P. minimum under varying light-dark regimes was
contrasted with that of several other dinoflagellates in studies by Paasche et al.
(1984). They found that P. minimum continuously took up NO3-, while many other
dinoflagellates stopped NO3- uptake at night. P. minimum also has been shown to
display considerable plasticity in its photosynthetic parameters and can adapt to low
light and be sustained for long periods of darkness (Tyler and Seliger 1978, Harding
et al. 1983, Harding and Coats 1988). However, mixotrophy, as an adaptive strategy,
is more likely to be a response to nutrient limitation than to carbon limitation
(Stoecker et al. 1997). Less is known about P. donghaiense either in terms of
photosynthetic adaption or its mixotrophic tendencies.
As with many other flagellate species, both P. minimum and P. donghaiense are
more commonly observed when inorganic N:P ratios are at the Redfield ratio or
below due to their relatively high requirement for P (Fan and Glibert 2005, Heil et al.
2007, Li et al. 2009). A key question that has not been addressed is whether N
93
nutritional strategies vary across a spectrum of N:P ratios. In order to assess this
question, a series of laboratory experiments were conducted on both species.
The conceptual framework for these experiments is the cell quota equation of
Droop (Droop 1968, 1973), who described the growth of phytoplankton growing
under a nutrient limited environment using the equation:
where the cell quota (Q) is the intracellular content of the limiting chemical element
(N, P etc.), µ is the growth rate, and µmax is the maximum growth rate for a given set
of environmental conditions. In this model framework, cells can not grow if the cell
quota is lower than the minimum quota (Qmin), which defines the minimum
requirement of the cells. Nutrients are taken up, then subsequently assimilated into
the nitrogenous components of the cell. P. minimum has previously been shown to
have a large, but varying cell quota (Sciandra 1991).
In this study, cells of P. minimum and P. donghaiense were grown across an N:P
spectrum in order to achieve a range of growth rates and a range of physiological
states. The rates of uptake of different forms of nitrogen were compared, as were the
comparative rates of uptake and assimilation.
Materials and Methods
Algae Culture
Cultures of Prorocentrum minimum were isolated from Choptank River, a
tributary of Chesapeake Bay in spring 1995 and were maintained in f/2 medium
minmax (1 )Q
Q
94
(Guillard and Ryther 1962) in the Horn Point Laboratory culture collection. For the
experiments, P. minimum cells were first transferred to f/20 batch cultures for 2
weeks, then grown in turbidistat, an automatic continuous culture system, as
described below.
Cultures of Prorocentrum donghaiense were obtained from University of
Connecticut Department of Marine Sciences, USA. These cultures were originally
isolated from the East China Sea. They, too, were transferred to f/2 batch cultures for
several weeks, then grown in turbidistat.
Continuous Culture Design
A continuous turbidistat culturing device (Fig. 3-1) was used to grow the
Prorocentrum cultures. A modulated infrared (880 mm) LED beam was directed
though the culture vessel (a 2 L glass carboy) to a photosensor, the analog signal
output of which was related to optical transmission (i.e., turbidity). Real time
turbidity signals were sent to a computer that controlled a peristaltic pump which
diluted the culture based on attaining a threshold value. The system was programmed
to dilute the culture by 5% in terms of the optical signal. This corresponds to a
volume dilution of approx. 10%, based on calibrations using a volumetric dilution.
The threshold was set to a turbidity that represented a P. minimum cell density of ~
16,000 cell ml-1 and a P. donghaiense cell density of ~ 30,000 cell ml-1. The culture
was stirred at a speed of ~ 60 rpm and generally bubbled with air to keep the culture
well mixed and aerated. In this condition, the cells grew at a maximum rate of growth
as set by the environmental conditions of the culture. The specific growth rate over a
20 minute period was calculated from the optical signal and recorded every minute.
95
The use of growth rate, in this study, refers to the rate calculated based on the change
in the optical signals.
Experimental Design and Algal Growth
Unialgal, but not axenic, P. minimum were grown in the turbidistats in filtered
Choptank River water, at a salinity of 15, a temperature of 22 ◦C and a 14: 10 h light
dark cycle at 430 µmol photons m-2 sec-1. Modified f/2-medium without silicate was
used, modified by reducing nitrate (NO3-) to 40 µM-N, but by adding PO4
3- in varying
concentration from 0.2 to 10 µM-P in different turbidistats, therefore providing N:P
ratios of 5, 16, 40 and 200. The cells were thus grown in a N:P gradient from
relatively low P to low N conditions.
Unialgal, but not axenic, cultures of P. donghaiense cells were grown in the
turbidistats, in filtered Choptank River water, at a salinity of 30, a temperature of 22
◦C and a 12: 12 h light dark cycle at 430 µmol photons m-2 sec-1. Modified f/2-
medium without silicate was used. The turbidistats were supplied with media NO3- at
80 µM and PO43- at 8 µM. Then, the media N:P ratios were gradually changed
following day 20. In one treatment, media NO3- concentrations were enriched to ~
220 µM-N and PO43- concentrations were gradually decreased to 2 µM-P. In the
second treatment, media NO3- concentrations were enriched to 200 µM-N and PO4
3-
concentrations were gradually enriched to 140 µM-P by adding additional PO43- every
3 days.
The volume of each turbidistat culture was kept about 1.6 L in the 2 L glass
carboys. Before each day of experiments, 100 ml water samples were collected from
each tubidostat culture carboy and filtered though pre-combusted (2 h at 400 °C)

96
Whatman GF/F filters for ambient nutrients analysis. The filtrates were stored frozen
at -20°C for later analysis as described below. Subsamples (10 ml) were taken each
day of experiments and preserved in 4% glutaraldehyde for algae cell counts. Cells
were manually counted by optical microscopy.
Nitrogen Uptake and Assimilation Experiments
N Uptake Kinetics and Rates of P. minimum
P. minimum cells were grown in turbidistat at each N:P ratio for at least 3 days to
get a steady growth state before the N uptake experiments were initiated. 15N
isotopically-labeled dissolved N substrates were used to measure the culture uptake
and assimilation rates (Glibert and Capone 1993) at each N:P ratio. Experiments were
conducted around 10 am. Culture samples of 40 ml were dispensed into a series of
acid-clean 50 ml incubation cuvettes to which 15N substrates (Cambridge Isotope
Laboratories, Inc.) were added respectively. Different experiments involved different
substrates and/or concentrations of 15N. Due to high background NO3− concentration
in the media, 15N labelled NO3− was only added at a concentration of 5 µM-N,
representing ~ 8% of NO3− media concentration. For the kinetic experiments, 15N
labelled NH4+, urea and glycine were added in a gradient of 0.2, 0.5, 1, 5, 20 µM-N.
All the cuvettes were incubated for 0.5 h at 430 µmol photons m-2 sec-1, and then the
incubations were terminated by filtration onto pre-combusted GF/F filters. A 20 ml
aliquot for each treatment was filtered directly onto one filter, which was treated with
10% ice-cold Tri-Chloroacetic Acid (TCA) for 10 seconds after filtration. For
samples with incoming media at N:P ratio 16 and 200, an extra 20 ml aliquot was
filtered to a second filter without further treatment. The TCA-treated filter represents

97
the N substrate assimilated into proteinaceous material, while the untreated filter
represents the total N substrate which was taken into the cell. The filters were stored
frozen until dried at 50 ˚C for 48 h, then analyzed as described below.
N Uptake Kinetics and Rates of P. donghaiense
Similar to the P. minimum experiments, for P. donghaiense at each N:P ratio,
culture samples of 40 ml were dispensed into acid-clean 50 ml incubation cuvettes to
which 15N substrates were added. These experiments only involved 15N labelled NO3−
and NH4+ added at a concentration of 20 µM. All the cuvettes were incubated for 0.5
h at 430 µmol photons m-2 sec-1, and then the incubations were terminated as
described above, with one filter untreated and one treated with 10% ice-cold TCA for
10 seconds after filtration. The filters were stored frozen until dried at 50 ˚C for 48 h,
then subsequently analyzed as described below.
Analytical Methods
Concentrations of ambient inorganic nutrients (NO3−+NO2
−-N, NH4+-N, PO4
3--
P) were determined using a Technicon Auto-Analyzer (Lane et al. 2000).
Concentrations of dissolved free amino acid (DFAA) were determined by
fluorometric analysis according to Lindroth and Mopper (1979) and urea was
analyzed using the method of Revilla et al. (2005). DFAA concentrations were used
to approximate the glycine concentrations in the N uptake rate calculations. Glycine
is generally considered to be a dominant amino acid (Degens and Mopper 1976), but
their rates of uptake should be considered potential rates based on the uncertainty of
their contribution to the DFAA pool. All the 15N sample filters were analyzed for

98
isotope enrichment using a Sercon Mass Spectrometer. Rates of 15N uptake and
assimilation were calculated according to Glibert and Capone (1993).
Data Analysis
The nitrogen uptake parameters were plotted and fitted to the Michaelis-Menten
formulation:
maxs
SA A
K S
or
SK
SVV
s max
where A is the N specific assimilation rate (h-1), Amax is the maximal N specific uptake
rate, V is the N specific uptake rate (h-1), Vmax is the maximal N specific uptake rate
(h-1), S is the substrate concentration (µM-N) and Ks is the half-saturation constant
(µM-N) for the substrate. Amax, Vmax and Ks for each of 4 N sources during the blooms
were calculated by the regression of uptake dynamic by Sigmaplot software (Systat
Software, Inc.).
One way ANOVA analyses were conducted to compare the uptake and
assimilation data in the different N:P ratio and light intensity treatments.
Results
Ambient Parameters and Cell Counts
In the P. minimum culture, the ambient N:P ratios in the culture vessels at the
time of the experiments were 3.5, 12, 21, 300 (Table 3-1), which were slightly
different from the ratios of incoming media (5, 16, 40 and 200). NO3- became
depleted (< 2 µM-N) in the 2 relatively high P treatments (N:P ratio 3.5 and 12), but
99
high concentrations (>20 µM-N) remained in the two relatively low P treatments (N:P
ratio 21 and 300). PO43- was depleted in the treatment where N:P was 13. P.
minimum cell densities on the day of experiments were in the range of 14,000 to
18,000 cells ml-1.
In the P. donghaiense culture, the ambient NO3− concentration varied from 32.8
µM to 197 µM. NO3− concentration decreased with time when supplied with
relatively P rich media, and NO3− concentration increased with time when supplied
with relatively N rich media. Ambient PO43- concentration varied from 0.33 µM to
127 µM. PO43- concentration decreased with time when supplied with relatively N
rich media, and PO43- concentration increased with time when supplied with relatively
P rich media. The imbalance of N and P resulted in ambient N:P ratios from 0.9 to
600. P. donghaiense cell densities on the day of 15N experiments were relatively
constant in the range of 28, 000 to 33, 000 cells ml-1.
Culture Growth in the Turbidistat
When supplied with a constant media supply, the growth rates of both P.
minimum and P. donghaiense in turbidistat showed highly repeatable-diel cycles.
Figure 2 is an example of the high frequency, optical-signal growth rates of P.
donghaiense during 4 continuous light-dark cycles, supplied with a steady ambient
media in which the N:P ratio was 12. Both species showed a clear diel cycle (Fig. 3-
3). Growth rapidly increased at the beginning of the light period and the rates
increased to the highest value of the day in less than an hour. Growth rates decreased
rapidly when the light was off and the calculated rates were negative in the dark.
Similar diel growth cycles were observed for all treatments of both species.

100
In the P. minimum culture, at ambient N:P ratios of 3.5, 12, 21 and 300, the
average hourly growth rates averaged over the full day (rday) were 0.0085, 0.024,
0.013 and 0.012 h-1, respectively (Fig.4 a), while the average growth rates for only the
light phase (rL) were 0.016, 0.047, 0.027 and 0.026 h-1, respectively (Fig. 3-4 b). In
the P. donghaiense culture, the rday varied from ~ 0.004 h -1 to 0.021 h -1 (Fig. 3-4 c),
while the rL varied from ~ 0.017 h -1 to 0.052 h -1 (Fig. 3-4 d), when the ambient N:P
ratios varied from 0.9 to 600. The maximum rday was recorded at an N:P ratio of 12.0
(157 µM NO3−, 13.1 µM PO4
3-). The maximum rL was recorded at an N:P ratio of
5.8 (51 µM NO3−, 9.0 µM PO4
3-). Both the minimum rday and minimum rL were
recorded at an N:P ratio of 1.5 (135 µM NO3−, 94.0 µM PO4
3-), followed by the
values at N:P ratios of 264.5 (114 µM NO3−, 0.44 µM PO4
3-) and 288.4 (143 µM
NO3−, 0.5 µM PO4
3-).
For both species, relative high maximum growth rate (0.021 h-1) were recorded
near an N:P ratio of 12, and the maximum growth rates decreased to less than 0.01 h-1
at both very low and very high N:P ratios (Fig. 3-4 c, d). Both rday and rL of the high
N:P ratio cultures (N:P ratio > 50) were significantly lower than the lower N:P ratio
culture (P = 0.008).
Nitrogen Uptake Experiments
In the P. minimum experiments, both N uptake and assimilation rates of NH4+,
urea, and glycine at the N:P ratios of 12.5 and 300 (the only ratios at which full
kinetics were tested) displayed saturating-type kinetics in the concentration range of
the experiments (Fig. 3-5). Samples from the low P cultures (i.e., N:P ratio = 300)
had higher Vmax and higher Ks than samples from the culture where N:P ratio was 12.5

101
(Table 3-2). Samples from P-rich cultures (i.e., N:P ratio = 3.5) had highest rates of
Amax for all 3 N nutrients, but have the lowest Ks, except for glycine (Table 3-2).
Samples from the low P cultures had the lowest NH4+ Amax. There were no
significance differences between the rates of the 2 relatively N:P balanced cultures
(N:P ratio 12.5 and 20).
To further our understanding of the N uptake and assimilation rates at ambient
concentrations, the uptake and assimilation rates at the lowest 15N enrichment
concentration (NO3− 5 µM-N; other 3 N sources 0.2 µM-N) were compared (Fig. 3-6).
The NO3- uptake rate (V) at N:P ratio 300 (0.030 h-1) was higher than that at an N:P
ratio of 12.5 (0.021 h-1). Assimilation rates (A) of NO3- (0.021 h-1) in the relatively P-
rich cultures (i.e., N:P ratio = 3.5) were 3 - 4 times higher than the rates at the rest of
the N:P treatments. The ambient assimilation rates of the reduced N forms (NH4+,
urea and glycine) were also highest in the N:P ratio treatments of 3.5 in all 4
treatments.
When N uptake rates were measured at approximate ambient concentrations,
NO3- contributed more than 60% percent of the total of the 4 N substrates. In contrast,
NH4+ contributed more than 30% of total N uptake rate when N:P ratios were 12 and
300. However, when comparing the assimilation rates with uptake rates, relatively
less NO3- (50%), but more NH4
+ (over 40%), was assimilated of the 4 N sources. The
assimilation efficiencies (assimilation rate/ uptake rate) of all N substrates were
higher in P-rich cultures (N:P ratio = 12) relative to P-poor cultures (N:P ratio 300).
Also, the assimilation efficiencies of the reduced forms of N (NH4+, urea and glycine)
were higher than those of NO3-. The assimilation efficiencies of NO3
- were less than

102
40%. The assimilation efficiencies also showed evidence of P limitation, which were
lower in high N:P ratio cultures. The assimilation efficiencies of NH4+ in P-poor
cultures (21%) were less than half of those in culture with N:P ratio near Redfield
ratio.
All 4 N:P ratio treatments were supplied with the same concentration of NO3-
in the media, and were kept at similar biomass and all grew at their maximum growth
rates for the condition of the culture, but the ambient nutrient concentrations varied in
the 4 treatments at the time of experiments (Table 3-1). NO3- was the primary N
source in the media; however, NO3- must be reduced to NH4
+ before being assimilated
by the algae. This process requires NO3- reductase as well as ATP and NADPH for
energy supply (Lomas and Glibert 1999b, 2000). Phosphorus can be a critical limiting
nutrient for the assimilation of NO3-. Therefore, the assimilation of NO3
- in the high
N:P ratio cultures (i.e., N:P ratio = 300) showed more P limitation, and as a result,
there was high NO3- concentration remaining in this culture (Table 3-1). However, in
the P-rich cultures (i.e., N:P ratio 12.5 and 3.5), P. minimum took up the NO3- rapidly,
resulting in the depletion of ambient NO3- to ~ 1 µM-N, even though there was a
supply of new media during the daytime to dilute the culture as the cells grew. Cells
in the P-rich cultures (i.e., N:P ratio 3.5) had significantly higher (p < 0.05) N
assimilation rates at all concentrations, indicating that N limitation resulted in high P
residuals in the media (Fig. 3-6). Cells in the low N:P ratio cultures also had relative
higher assimilation efficiencies (A/V), especially for NO3- and NH4
+, indicating that
the N substrates were more quickly used by the cells in the P-rich media (Fig. 3-7).

103
There were no significant differences in the relative contributions of the 4 N
substrates to total N uptake and assimilation at different N:P ratios.
In the P. donghaiense experiments, the N-specific uptake rates (V, h-1) and
assimilation rates (A, h-1) varied over different ambient N:P ratios (Fig. 3-7). The
uptake rates of NO3− not only decreased from an average of 0.021 h-1 to 0.01 h-1 when
the ambient N:P ratios decreased from ~ 7 to ~ 1, but they also significantly
decreased to 0.006 h-1 (p < 0.05) when ambient N:P ratio increased from ~ 7 to over
100 (Fig. 3-7 a). The assimilation rates of NO3− were close to 0.01 h-1 where ambient
N:P ratio was <10, but they decreased to 0.003 h-1 when ambient N:P ratio were
between 10 and 50 (Fig. 3-7 b). They further decreased significantly to ~ 0.0007 h-1 at
higher N:P ratios (p < 0.05). The uptake rates of NH4+ varied from 0.046 h-1 to 0.080
h-1, and the assimilation rates of NH4+ varied from 0.028 h-1 to 0.058 h-1 (Fig. 3-7 c,
d). The assimilation efficiencies (assimilation rate/ uptake rate) of NO3− significantly
decreased from 70 % at low N:P ratios to ~ 6% at high N:P ratios (p < 0.05), while
the assimilation efficiencies varied from ~ 60 % to 88 % (Fig. 3-8).
Similar to the results in the P. minimum experiments, the uptake and assimilation
of NO3- in the high N:P ratio cultures were significantly lower than those in lower
N:P ratio cultures (p < 0.05), suggesting strong P control on the uptake and
assimilation of NO3-. However, the uptake and assimilation of NH4
+, which are less
energy costly processes, did not show evidence of N:P ratio regulation.
Application of Droops Model
The nutrient uptake and assimilation rates represent the processes whereby
nutrients are taken up from ambient water, which was measured as V in this

104
experiment, and then assimilated to build the cell, which measured as A. The balance
of nutrient uptake and assimilation further affects the growth rate. The ratio of these
processes to growth rate allows comparison across treatments. In the P. minimum
experiments, although growth rates were lower at highest and lowest N:P ratios
compared to near Redfield ratios, the patterns of how A/µ values for the 4 N
substrates varied at different N:P ratios was opposite (Fig. 3-9). A/µ values were
therefore higher at the highest and lowest N:P ratios. Under low N concentrations, P.
minimum quickly responded to the N pulse and assimilated more than their growth
needs in the N:P treatment of 3.5, where P. minimum had lowest growth rate, but
highest A/µ value. The growth of P. minimum at N:P ratio 12.5 were most balanced of
all N:P treatments with the highest average growth rates and lowest A/µ value. The
A/µ values increased when P was reduced.
In the P. donghaiense experiments, the N-poor treatments (low N:P ratios) also
had a significantly enhanced (p < 0.05) N uptake and assimilation relative to growth
rates (Fig. 3-10), and this enhancement decreased as the N:P ratios increased to near-
Redfield proportion. The V/µ values increased again at high N:P ratios (Fig. 3-10 a,
b). However, the A/µ values did not increase at the high N:P values, since N
assimilation was under a greater degree of P regulation (Fig.10 c, d).
Discussion
Herein we took an approach to examine the effect of different ambient N:P ratios
on the growth and N uptake kinetics of P. minimum and P. donghaiense in turbidistat.
For P. minimum, two relatively N-P balanced treatments (N:P ratio 12.5 and 21) and
105
two relatively N:P unbalanced treatments (N:P ratio 3.5 and 300) were tested. For P.
donghaiense, over 20 N:P ratio treatments were tested. For both species, the highest
growth rates were recorded near the Redfield ratio (16), and growth rate decreased
when ambient N:P ratios were more unbalanced, which suggested the regulation of
growth rate by the ambient N:P ratio. The N uptake and assimilation rates of the 2
species also showed a response to the different N:P ratio treatments.
Value of Tubidostat Approach
Batch culture and continuous culture are widely used in laboratory experiments
for microalgae culture. The growth of algae in a batch culture typically includes 4
phases: lag phase, exponential, stationary phase, and death phase. The physiology in
the exponential phase is very valuable to help understand algal growth. However, the
growth of batch cultures are regulated by the limiting nutrient, and batch cultures can
not provide a relatively long and steady exponential phase of growth without causing
significant change in irradiance caused by self-shading and nutrient depletion. In
continuous culture, cells can keep growing in exponential phase and the growth rate
can be calculated (Monod 1950). There are two common continuous culture devices,
chemostat and turbidistat. Both systems include a medium reservoir and a culture
incubator. New media can be pumped into the incubator to support the continuous
growth of the cells, and extra culture is removed from the incubator to keep a steady
culture volume. In chemostat, steady-state can be established at a fixed rate of
limiting nutrient inflow (Yoshida et al. 1979, Rhee and Gotham 1981). In another
words, the cell growth rate is equal to the culture dilution rate and nutrient uptake rate
is equal to the growth rate when steady state is established (Hirsbrunner 1981,

106
Goldman and Glibert 1982). The dilution rate must be set at a value less than the
maximum growth rate to avoid washout. The culture can reach steady state, and the
nutrient uptake and cell quota of limited nutrient are assumed to be invariant with
time (Rhee 1973, Rhee 1978, Gotham and Rhee 1981). Higher biomass can be
achieved by increasing the nutrient concentration of the media. Furthermore,
chemostat cultures are typically operated in continuous light (Falkowski et al. 1985),
which does not exist in natural condition. A cyclostat is a modified chemostat system
in which culture grows under light-dark cycles (Gotham and Frisch 1981, Gotham
and Rhee 1982). In cyclostats, nutrient uptake rate, growth rate, and cell quota are not
invariant, but have been demonstrated to have periodicities relating to light-dark
cycles (Eppley and Renger 1974, Chisholm et al. 1975, Malone et al. 1975, Frisch
and Gotham 1977). The culture can reach rhythmic steady state with a period of light-
dark cycle. Alternatively, turbidistats are run under turbidity control, and new
medium inflow only occurs in response to an increase in the culture biomass to a pre-
set value. Biomass is set by the optical threshold of dilution. Cell growth is limited by
light and temperature; nutrients are usually added in excess of demand (Watson 1972,
Skipnes et al. 1980, Fenaux et al. 1985, Hill et al. 1985, Kalyuzhin 1998). Light in
turbidistat can run in a light-dark cycle which is more close to real situations
(Falkowski et al. 1985).
The independent and dependent variables are opposite in chemostat and
turbidistat. For example, cell density is dependent and growth rate is independent in
chemostat, but cell density is independent and growth rate is dependent in turbidistat
(Bennett and Boraas 1989). Turbidistats are better than chemostats for the

107
experiments conducted which study cells growing near their maximum specific
growth rate. In the experiments conducted herein, both species achieved continuous
growth and repeatable diel cycle in turbidistat. The cells grew at their maximum
growth, which was regulated by the ambient nutrient condition (N:P ratios).
However, due to the dilution process, the mass balance in the turbidistats
changed due to the difference between N and P mass in the culture removed and the
new media pumped in. For example, a P. minimum cell in exponential phase has ~ 2.1
×10-6 µM-N per cell (Li unpublished data), which represents ~ 34 µM-N and ~ 2.1
µM-P mass of cells at a cell density of 16, 000 cell ml-1, with the assumption that the
N:P ratio of cells was near the Redfield ratio. The fastest growing culture (ambient
N:P ratio 12) took up ~1.6 µM-N h-1 in the light phase, based on an average growth
rate of 0.047 h-1. While the total ambient N (sum of 4 N sources) was only 3.2 µM-
N, which could only support the growth for 2 hrs, there was very limited residual N in
the culture, and the growth relied on the new media pumped into the culture. The total
N and P mass pumped from new media (enriched with 40 µM-N and 2.5 µM-P) was
approximately equal to the N removed from the culture in cells and media. The
growth of culture near the Redfield ratio was balanced. However, in the low N:P ratio
culture (N:P ratio 3.5), there were also very limited residual N and P in the culture.
The P in the new media was much higher than that in the culture and in the cells, as a
result, the culture became more N limited. In the culture growing at ambient N:P ratio
of 300, the residual N was high (over 40 µM-DIN), but the P was low (0.15 µM-DIP),
which supported the growth for less than 3 hrs. Furthermore, the P in the new media
was very low (0.2 µM-N), which was much less than the P in the cells. When the
108
dilution started, the P pumped in the culture was less than the P removed in the cells,
and the culture became more P limited.
Value of Droop’s Model Approach
Based on the growth rates recorded by the turbidistat, the growth of both species
showed strong light-regulated diel cycles. Cell growth, measured as the change of
turbidity in the culture vessel, started at the beginning of light cycle. Dinoflagellate
species have been reported to have a maximum growth limit of 1 division per day
(McDuff and Chisholm 1982), as a result of dark: light regulated diel synchrony. The
growth rates in the tubidistat system were consistent with these reports. The maxima
growth rates in the light phase were around 1 day-1. Maximum growth rate generally
occurred in the first hour at the beginning of the light phase, and growth rate
decreased during the day time.
The growth rate, in this study, refers to the rate of changing of the optical
signals, which attenuated with the turbidity of the culture. The turbidity was caused
by the total mass concentration in the culture. Therefore, the growth rate is interpreted
as the variation rate of total mass density of the culture, instead of cell density, which
was calibrated by diluted the culture by volume. During the dark phase, there were
negative growth rates, suggesting decreases in mass concentration in the culture.
When the photosynthesis activities stopped in the dark phase, the production rates of
these species were less than the respiration rate, causing the negative growth rate.
This state lasted until the start of the light cycle, when production rates increased
quickly over respiration and the turbidity of the culture increased again.

109
Based on Droop’s model, these Prorocentrum species had their maximum cell
quotas when they reached the highest growth rates at the beginning of light phase.
The decreasing growth rates during the day are indicative of decreasing cell quotas.
However, the low growth rates in the dark cycle were not necessary indicative of a
small cell quota, since the cells were light regulated instead of nutrient regulated. P.
minimum has been reported to continuously uptake the NO3- in the dark (Paasche et
al. 1984). Cells stopped growth at night due to light limitation, but nutrients were
likely continuously taken up into and stored in the cell, causing an increasing cell
nutrient quota (Fig. 3-11). The cell quota reached its maximum value of the day at the
beginning of light phase, as did growth rates. Since the experiments conducted here
were not focused on the diel cycle of Prorocentrum growth and nutrient uptake, the
conceptual model of diel cell quota variation (Fig. 3-11) needs to be tested by further
studies.
The N:P Ratios in the Coastal Ecosystems
There has been evidence of a global increase of harmful algal blooms (HABs),
which have increased not only in frequency, but also in intensity and geographic
distribution in the coastal area, and have caused ecological, economical and human
health problems (Smayda 1997, Anderson et al. 2002). In many cases, the increase in
HABs has been strongly correlated to the global increase of eutrophication
(Hallegraeff 1993, Glibert and Terlizzi 1999, Anderson et al. 2002, Smayda 2002,
Glibert et al. 2005a, Glibert and Burkholder 2006, Glibert et al. 2006, Anderson et al.
2008, Glibert et al. 2008a, Heisler et al. 2008). Growth of human population,
agriculture fertilization and urbanization has caused remarkable increase in N and P

110
loading to the coastal water. The progress toward controlling N loading has been
relatively slow, and N load to the coastal environments has been increasing in the past
several decades (NRC 2000). In the U.S., N fertilizer consumption has increased over
4 fold since 1960s, however, P fertilizer consumption only increased 80% up to 2006
(USDA 2008). Actually, the consumption of P fertilizer reached its peak in 1979 and
has slightly decreased after that year (USDA 2008). There were also downward
trends of P concentrations in many riverine sources (Litke 1999). One of reasons is
that the principal source of effluent P was from P in laundry detergent, which has
been gradually replaced by P-free detergent since the late 1970s (Doemel and Brooks
1975, Sharfstein et al. 1977, Hartig and Horvath 1982, Maki et al. 1984). Therefore,
the increases of N and P loading to coastal ecosystems have not been proportionate.
As the P-detergent banned expanded globally, export of dissolved inorganic P (DIP,
mostly in form of phosphate), the most important form of bio-available P source, did
not increase as much as N. This unbalanced increase of N and P nutrients loading has
contributed to the change of the N:P ratios in the coastal water.
Changes of ambient N:P ratios could regulate the phytoplankton community
composition and HAB developments (Hodgkiss and Ho 1997). In freshwater, N-
fixing cyanobacteria could dominate in a low N:P ratio water column by fixing its
own N source (Vrede et al. 2009). Good N competitors, including diatoms, may
dominate the low N:P ratio community, but good P competitors (e.g. Synechococcus)
may dominate the high N:P ratio community (Suttle and Harrison 1988). In seawater,
a shift of dominant species in the phytoplankton community caused by the alternation
of ambient N:P ratios could happen in time ranges of seasons to decades (Phillips and

111
Tanabe 1989, Bulgakov and Levich 1999, Lagus et al. 2004, Paerl et al. 2004). For
example, the phytoplankton community of downstream Neuse River, USA, shifted
from an N-limited cyanobacteria dominant freshwater phytoplankton community to a
P-limited community after the P-detergent ban in 1988 in this area (Paerl et al. 2004).
As a result of P loading reduction, N substrates taken up by phytoplankton decreased
and more N was delivered to the lower estuary which stimulated HABs comprised of
dinoflagellates, cryptomonads, and diatoms (Paerl et al. 2004). Spatially, high N:P
ratio runoff mixed with relatively low N:P ratio seawater can develop a gradient of
N:P ratio, which may regulate not only the HAB distribution and biomass, but also
dominant species and its nutrient uptake rates and preference (Fisher et al. 1992, Li et
al. 2009, Li et al. 2010).
In summary, the study of the growth and N uptake of P. minimum (a global HAB
species) and P. donghaiense (a regional HAB species) on different N:P ratios showed
evidence that N:P ratios could not only affect the growth, but also N uptake and
assimilation. Relatively N:P balanced cultures reached the highest growth rates. N-
poor cultures showed an enhanced N uptake in N enrichment experiments. Highest
average daily growth rates of both species were recorded near N:P ratios of 12.
Highest N assimilation rates for 4 N sources by P. minimum were recorded at N:P
ratio of 3.5. P. donghaiense also has highest N assimilation coefficient at low N:P
ratio. These results were consistent with the report that the optimal N:P ratio for P.
minimum was 4 - 13 (Hodgkiss and Ho 1997) and the field report of P. donghaiense
dominance under N:P ratios of 16 - 24 (Li et al. 2009).

112
References
Anderson DM, Burkholder JM, Cochlan WP, Glibert PM, Gobler CJ, Heil CA, Kudela RM, Parsons ML, Rensel JEJ, Townsend DW, Trainer VL, Vargo GA (2008) Harmful algal blooms and eutrophication: Examining linkages from selected coastal regions of the United States. Harmful Algae 8:39-53
Anderson DM, Glibert PM, Burkholder JM (2002) Harmful algal blooms and eutrophication: Nutrient sources, composition, and consequences. Estuaries 25:704-726
Bennett WN, Boraas ME (1989) Comparison of population-dynamics between slow-growing and fast-growing strains of the rotifer Brachionus calyciflorus pallas in continuous Culture. Oecologia 81:494-500
Bulgakov NG, Levich AP (1999) The nitrogen : phosphorus ratio as a factor regulating phytoplankton community structure. Archiv Fur Hydrobiologie 146:3-22
Burns CL, Pennock JR, Lores EM, R.M. G (2000) The effect of nitrogen source on the growth and toxicity of three potentially harmful dinoflagellates. Journal of Phycology 36
Chisholm SW, Nobbs PA, Stross RG (1975) Simulation of algal growth and competition in a phosphate-limited cyclostat. Abstracts of Papers of the American Chemical Society:42-42
Degens ET, Mopper K (1976) Factors controlling distribution and early diagenesis of organic marine sediments. In: Riley JP, Chester R (eds) Chemical oceanography, Vol 6. Academic London, New York, San Francisco, p 60-114
Doemel WN, Brooks AE (1975) Detergent phosphorus and algal growth. Water Research 9:713-719
Droop MR (1968) Vitamin B12 and marine ecology 4. kinetics of uptake growth and inhibition in Monochrysis lutheri. Journal of the Marine Biological Association of the United Kingdom 48:689-733

113
Droop MR (1973) Some thoughts on nutrient limitation in algae. Journal of Phycology 9:264-272
Eppley RW, Renger EH (1974) Nitrogen assimilation of an oceanic diatom in nitrogen-limited continuous culture. Journal of Phycology 10:15-23
Falkowski PG, Dubinsky Z, Wyman K (1985) Growth-irradiance relationships in phytoplankton. Limnology and Oceanography 30:311-321
Fan C, Glibert PM, Alexander J, Lomas MW (2003a) Characterization of urease activity in three marine phytoplankton species, Aureococcus anophagefferens, Prorocentrum minimum, and Thalassiosira weissflogii. Marine Biology 142:949-958
Fan CL, Glibert PM (2005) Effects of light on nitrogen and carbon uptake during a Prorocentrum minimum bloom. Harmful Algae 4:629-641
Fan CL, Glibert PM, Burkholder JM (2003b) Characterization of the affinity for nitrogen, uptake kinetics, and environmental relationships for Prorocentrum minimum in natural blooms and laboratory cultures. Harmful Algae 2:283-299
Fenaux R, Malara G, Claustre H (1985) A turbidostat driven and controlled by microcomputer. Aquaculture 48:91-95
Fisher TR, Peele ER, Ammerman JW, Harding LW (1992) Nutrient limitation of phytoplankton in Chesapeake Bay. Marine Ecology-Progress Series 82:51-63
Frisch HL, Gotham IJ (1977) Periodic algal cyclostat populations. Journal of Theoretical Biology 66:665-678
Glibert PM, Anderson DM, Gentien P, Granéli E, Sellner KG (2005) The global, complex phenomena of harmful algal blooms. Oceanography 18 (2):136-147
Glibert PM, Burkholder JM (2006) The complex relationships between increasing fertilization of the earth, coastal eutrophication and proliferation of harmful algal blooms. In: Granéli E, Turner J (eds) Ecology of Harmful Algae. Springer, p 341-354
114
Glibert PM, Burkholder JM, Granéli E, Anderson DM (2008a) Advances and insights in the complex relationships between eutrophication and HABs: Preface to the special issue. Harmful Algae 8:1-2
Glibert PM, Capone DG (1993) Mineralization and assimilation in aquatic, sediment, and wetland systems. In: Knowles R, Blackburn TH (eds) Nitrogen isotope techniques, Vol 243-272. Academic Press
Glibert PM, Harrison J, Heil C, Seitzinger S (2006) Escalating worldwide use of urea - a global change contributing to coastal eutrophication. Biogeochemistry 77:441-463
Glibert PM, Mayorga E, Seitzinger S (2008b) Prorocentrum minimum tracks anthropogenic nitrogen and phosphorus inputs on a global basis: Application of spatially explicit nutrient export models. Harmful Algae 8:33-38
Glibert PM, Terlizzi DE (1999) Cooccurrence of elevated urea levels and dinoflagellate blooms in temperate estuarine aquaculture ponds. Applied and Environmental Microbiology 65:5594-5596
Goldman JC, Glibert PM (1982) Comparative rapid ammonium uptake by 4 species of marine-phytoplankton. Limnology and Oceanography 27:814-827
Gotham IJ, Frisch HL (1981) A simple-model for cell-volume and developmental compartments in nutrient limited cyclostat cultures of algae. Journal of Theoretical Biology 92:435-467
Gotham IJ, Rhee GY (1981) Comparative kinetic-studies of phosphate-limited growth and phosphate-uptake in phytoplankton in continuous culture. Journal of Phycology 17:257-265
Gotham IJ, Rhee GY (1982) Effects of nitrate and phosphate limitation on cyclostat growth of 2 fresh-water diatoms. Journal of General Microbiology 128:199-205
Hallegraeff GM (1993) A review of harmful algal blooms and their apparent global increase. Phycologia 32:79-99

115
Harding LW, Coats DW (1988) Photosynthetic physiology of Prorocentrum mariae-lebouriae (Dinophyceae) during Its subpycnocline transport in Chesapeake Bay. Journal of Phycology 24:77-89
Harding LW, Meeson BW, Tyler MA (1983) Photoadaptation and diel periodicity of photosynthesis in the dinoflagellate Prorocentrum mariae-lebouriae. Marine Ecology-Progress Series 13:73-85
Hartig JH, Horvath FJ (1982) A preliminary assessment of Michigan's phosphorus detergent ban. Journal Water Pollution Control Federation 54:193-197
Heil CA, Glibert PM, Fan CL (2005) Prorocentrum minimum (Pavillard) Schiller - a review of a harmful algal bloom species of growing worldwide importance. Harmful Algae 4:449-470
Heil CA, Revilla M, Glibert PM, Murasko S (2007) Nutrient quality drives differential phytoplankton community composition on the southwest Florida shelf. Limnology and Oceanography 52:1067-1078
Heisler J, Glibert PM, Burkholder JM, Anderson DM, Cochlan W, Dennison WC, Dortch Q, Gobler CJ, Heil CA, Humphries E, Lewitus A, Magnien R, Marshall HG, Sellner K, Stockwell DA, Stoecker DK, Suddleson M (2008) Eutrophication and harmful algal blooms: A scientific consensus. Harmful Algae 8:3-13
Hill SH, Abbott MR, Denman KL (1985) A computer-controlled turbidostat for the culture of planktonic algae. Canadian Journal of Fisheries and Aquatic Sciences 42:744-753
Hirsbrunner M (1981) A chemostat-apparatus for continuous culture of agae. Schweizerische Zeitschrift Fur Hydrologie-Swiss Journal of Hydrology 43:370-376
Hodgkiss IJ, Ho KC (1997) Are changes in N:P ratios in coastal waters the key to increased red tide blooms? Hydrobiologia 352:141-147
Jeong HJ, Du Yoo Y, Park JY, Song JY, Kim ST, Lee SH, Kim KY, Yih WH (2005a) Feeding by phototrophic red-tide dinoflagellates: five species newly revealed and six species previously known to be mixotrophic. Aquatic Microbial Ecology 40:133-150

116
Jeong HJ, Park JY, Nho JH, Park MO, Ha JH, Seong KA, Jeng C, Seong CN, Lee KY, Yih WH (2005b) Feeding by red-tide dinoflagellates on the cyanobacterium Synechococcus. Aquatic Microbial Ecology 41:131-143
Kalyuzhin VA (1998) The growth of a turbidostat yeast culture in the presence of high concentrations of various compounds in a steady-state regime and under osmotic shock. Microbiology 67:499-503
Lagus A, Suomela J, Weithoff G, Heikkila K, Helminen H, Sipura J (2004) Species-specific differences in phytoplankton responses to N and P enrichments and the N:P ratio in the Archipelago Sea, northern Baltic Sea. Journal of Plankton Research 26:779-798
Lane L, Rhoades S, Thomas C, Van Heukelem L (2000) Analytical services laboratory standard operating procedures, University of Maryland Center for Environmental Science, Cambridge, Maryland.
Li AS, Stoecker DK, Coats DW, Adam EJ (1996) Ingestion of fluorescently labeled and phycoerythrin-containing prey by mixotrophic dinoflagellates. Aquatic Microbial Ecology 10:139-147
Li J, Glibert PM, Zhou M (2010) Temporal and spatial variability in nitrogen uptake kinetics during dinoflagellate blooms in the East China Sea. Harmful Algae 9:531-539
Li J, Glibert PM, Zhou M, Lu S, Lu D (2009) Relationships between nitrogen and phosphorus forms and ratios and the development of dinoflagellate blooms in the East China Sea. Marine Ecology Progress Series 383:11-26
Lindroth P, Mopper K (1979) High-performance liquid-chromatographic determination of subpicomole amounts of amino-acids by precolumn fluorescence derivatization with ortho-phthaldialdehyde. Analytical Chemistry 51:1667-1674
Litke DW (1999) Review of phosphorus control measures in the United States and their effects on water quality, U.S. Geological Survey
Lomas MW, Glibert PM (1999a) Interactions between NH4+ and NO3
- uptake and assimilation: comparison of diatoms and dinoflagellates at several growth temperatures. Marine Biology 133:541-551
117
Lomas MW, Glibert PM (1999b) Temperature regulation of nitrate uptake: A novel hypothesis about nitrate uptake and reduction in cool-water diatoms. Limnology and Oceanography 44:556-572
Lomas MW, Glibert PM (2000) Comparisons of nitrate uptake, storage, and reduction in marine diatoms and flagellates. Journal of Phycology 36:903-913
Lu DD, Goebel J (2001) Five red tide species in genus Prorocentrum including the description of Prorocentrum donghaiense Lu Sp. Nov. from the East China Sea. Chinese Journal of Oceanology and Limnology 4:337-344
Maki AW, Porcella DB, Wendt RH (1984) The impact of detergent phosphorus bans on receiving water-quality. Water Research 18:893-903
Malone TC, Garside C, Haines KC, Roels OA (1975) Nitrate Uptake and Growth of Chaetoceros Sp in Large Outdoor Continuous Cultures. Limnology and Oceanography 20:9-19
McDuff RE, Chisholm SW (1982) The calculation of in situ growth-rates of phytoplankton populations from fractions of cells undergoing mitosis - a clarification. Limnology and Oceanography 27:783-788
Monod J (1950) La technique de culture continue theorie et applications. Annales De L Institut Pasteur 79:390-410
NRC (2000) Clean coastal waters: Understanding and reducing the effects of nutrient pollution. National Academies Press.
Paasche E, Bryceson I, Tangen K (1984) Interspecific variation in dark nitrogen uptake by dinoflagellates. Journal of Phycology 20:394-401
Paerl HW, Valdes LM, Joyner AR, Piehler MF (2004) Solving problems resulting from solutions: Evolution of a dual nutrient management strategy for the eutrophying Neuse river estuary, North Carolina. Environmental Science & Technology 38:3068-3073
Phillips DJH, Tanabe S (1989) Aquatic pollution in the Far-East. Marine Pollution Bulletin 20:297-303

118
Revilla M, Alexander J, Glibert PM (2005) Urea analysis in coastal waters: comparison of enzymatic and direct methods. Limnology and Oceanography-Methods 3:290-299
Rhee G-Y (1978) The continuous culture in phytoplankton ecology. In: Droop MR, Jannasch HW (eds) Advances in Aquatic Microbiology
Rhee GY (1973) Continuous culture study of phosphate uptake, growth-rate and polyphosphate in Scenedesmus sp. Journal of Phycology 9:495-506
Rhee GY, Gotham IJ (1981) The effect of environmental-factors on phytoplankton growth - light and the interactions of light with nitrate limitation. Limnology and Oceanography 26:649-659
Salerno M, Stoecker DK (2009) Ectocellular glucosidase and peptidase activity of the mixotrophic dinoflagellate Prorocentrum minimum (Dinophyceae). Journal of Phycology 45:34-45
Sciandra A (1991) Coupling and uncoupling between nitrate uptake and growth rate in Prorocentrum minimum (Dinophyceae) under different frequencies of pulsed nitrate supply. Marine Ecology-Progress Series 72:261-269
Sharfstein B, Roels OA, Harris V, Lee V (1977) Effect of detergent legislation on phosphorus in effluent and receiving waters. Journal Water Pollution Control Federation 49:2017-2021
Skipnes O, Eide I, Jensen A (1980) Cage culture turbidostat - a device for rapid-determination of algal growth-rate. Applied and Environmental Microbiology 40:318-325
Smayda TJ (1997) Harmful algal blooms: Their ecophysiology and general relevance to phytoplankton blooms in the sea. Limnology and Oceanography 42:1137-1153
Smayda TJ (2002) Adaptive ecology, growth strategies and the global bloom expansion of dinoflagellates. Journal of Oceanography 58:281-294
Stoecker DK, Gustafson DE (2003) Cell-surface proteolytic activity of photosynthetic dinoflagellates. Aquatic Microbial Ecology 30:175-183

119
Stoecker DK, Li AS, Coats DW, Gustafson DE, Nannen MK (1997) Mixotrophy in the dinoflagellate Prorocentrum minimum. Marine Ecology-Progress Series 152:1-12
Suttle CA, Harrison PJ (1988) Ammonium and phosphate-uptake rates, N-P supply ratios, and evidence for N-limitation and P-limitation in some oligotrophic lakes. Limnology and Oceanography 33:186-202
Tyler MA, Seliger HH (1978) Annual subsurface transport of a red tide dinoflagellate to its bloom area - water circulation patterns and organism distributions in Chesapeake Bay. Limnology and Oceanography 23:227-246
USDA (2008) Fertilizer consumption and use. United States Department of Agriculture. http://www.ers.usda.gov/Data/FertilizerUse/
Vrede T, Ballantyne A, Mille-Lindblom C, Algesten G, Gudasz C, Lindahl S, Brunberg AK (2009) Effects of N:P loading ratios on phytoplankton community composition, primary production and N fixation in a eutrophic lake. Freshwater Biology 54:331-344
Watson TG (1972) Present status and future prospects of turbidostat. Journal of Applied Chemistry and Biotechnology 22:229
Yoshida T, Rao BSM, Ohasa S, Taguchi H (1979) Dynamic analysis of a mixed culture in chemostat. Journal of Fermentation Technology 57:546-553
Zhou M, Yan T, Zou J (2003) Preliminary analysis of the characteristics of red tide areas in Changjiang River estuary and its adjacent sea. Chinese Journal of Applied Ecology 14:1031-1038

120
Tables Table 3-1 Ambient nutrient concentrations in 4 different turbidistat systems supplied by media at different DIN:DIP ratios.
Medium Enriched N:P Ratio
NO3-
µM-N NH4
+
µM-N Urea
µM-N DFAA µM-N
DIPµM-P
Culture DIN:DIP Ratio
5 1.95 0.05 1.18 0.063 0.57 3.5
16 0.37 1.05 3.14 0.011 0.11 12.5
40 21.98 3.59 2.09 0.038 1.17 21
200 42.4 2.52 2.05 1.123 0.15 300

121
Table 3-2 Calculated parameters of uptake kinetics of nitrogen sources (NH4
+, urea, and glycine) by Prorocentrum minimum at different ambient DIN:DIP ratio in turbidistat based on the Michaelis-Menten equation. Vmax and Amax are the specific nitrogen uptake and assimilation rates. Ks is the Michaelis constant where uptake rates equal to ½ of maximum uptake rates.
Culture DIN:DIP NH4+ Urea Glycine NH4
+ Urea Glycine Ratio Vmax Ks Vmax Ks Vmax Ks Amax Ks Amax Ks Amax Ks
3.5 0.031 0.20 5E-04 0.43 0.004 1.27
12.5 0.046 1.248 3E-04 0.052 0.004 0.48 0.024 2.32 7E-04 16.50 0.001 0.04
21 0.02 1.43 4E-04 2.63 0.001 0.10
300 0.065 4.646 8E-04 5.43 0.007 3.54 0.016 2.70 4E-04 1.56 0.003 3.39

122
Figures
Figure 3-1 The setup of a turbidistat system

123
00:00 12:00 00:00 12:00 00:00 12:00 00:00 12:00 00:00
Gro
wth
Rat
e pe
r H
our
-0.10
-0.05
0.00
0.05
0.10
0.15
Figure 3-2 Diurnal growth rates of Prorocentrum donghaiense in turbidistat system for 4 constant 12 h: 12 h light dark cycles (96 hrs). Each point stands for the growth rate calculated based on the change in the optical signals over a 20-minute time period.

124
a. P. minimum
0 2 4 6 8 10 12 14 16 18 20 22 24
Gro
wth
Rat
e pe
r H
our
-0.10
-0.05
0.00
0.05
0.10
0.15
b. P. donghaiense
0 2 4 6 8 10 12 14 16 18 20 22 24
Gro
wth
Rat
e pe
r ho
ur
-0.10
-0.05
0.00
0.05
0.10
0.15
Figure 3-3 a. Diurnal growth rates of Prorocentrum minimum in turbidistat system at 14: 10 h light dark cycle. b. Diurnal growth rates of Prorocentrum donghaiense in turbidistat system at 12: 12 h light dark cycle. Box plots — line: median; box: 25th and 75th percentiles; whiskers: 10th and 90th percentiles; dots: outliers.

125
N:P ratio
3.5 12 21 300
Gro
wth
Rat
e pe
r H
our
0.00
0.01
0.02
0.03
0.04
0.05
0.06a. P. minimum b. P. minimum
N:P ratio
3.5 12 21 300
Gro
wth
Rat
e pe
r H
our
0.00
0.01
0.02
0.03
0.04
0.05
0.06
c. P. donghaiense
Lg (N:P ratio)
0.0 .5 1.0 1.5 2.0 2.5 3.0
Gro
wth
Rat
e pe
r ho
ur
0.00
.01
.02
.03
.04
.05
.06
d. P. donghaiense
Lg (N:P ratio)
0.0 .5 1.0 1.5 2.0 2.5 3.0
Gro
wth
Rat
e pe
r ho
ur
0.00
.01
.02
.03
.04
.05
.06
Figure 3-4 a. Average growth rates of Prorocentrum minimum in a 14h: 10h light dark cycle at different ambient N:P ratios. b. Average growth rates of P. minimum in the light phase of 14h: 10h light dark cycle at different ambient N:P ratios. c. Average growth rates of P. donghaiense in a 12h: 12h light dark cycle at different ambient N:P ratios. d. Average growth rates of P. donghaiense in the light phase of 12h: 12h light dark cycle at different ambient N:P ratios

126
NH4+
M-N
0 5 10 15 20 25
V h
our-
1
0.00
0.02
0.04
0.06
0.08
Urea
M-N
0 5 10 15 20 25
V h
our-
1
0.0000
0.0002
0.0004
0.0006
0.0008
Glycine
M-N
0 5 10 15 20 25
V h
our-
1
0.000
0.002
0.004
0.006
0.008
NH4+
M-N
0 5 10 15 20 25
A h
our-
1
0.00
0.02
0.04
0.06
0.08Urea
M-N
0 5 10 15 20 25
A h
our-
1
0.0000
0.0002
0.0004
0.0006
0.0008
Glycine
M-N
0 5 10 15 20 25
A h
our-
1
0.000
0.002
0.004
0.006
0.008
Figure 3-5 Kinetic relationships between nitrogen specific uptake rates V (h-1, upper panels) and assimilation rates A (h-1, lower panels) of NH4
+, urea, and glycine with 15N substrate concentration (µM-N) by Prorocentrum minimum at different DIN:DIP ratio cultures. All curves R2 > 0.6.
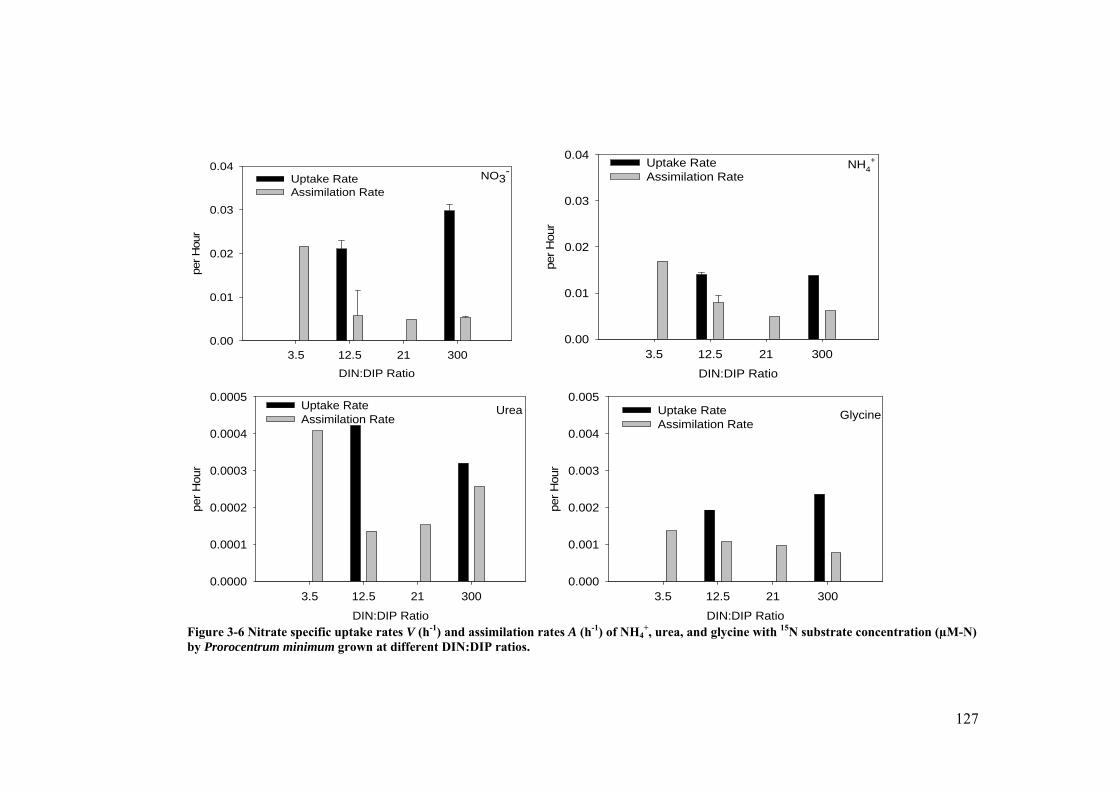
127
NO3-
DIN:DIP Ratio
3.5 12.5 21 300
per H
our
0.00
0.01
0.02
0.03
0.04Uptake RateAssimilation Rate
NH4+
DIN:DIP Ratio
3.5 12.5 21 300
per
Hou
r
0.00
0.01
0.02
0.03
0.04Uptake RateAssimilation Rate
Urea
DIN:DIP Ratio
3.5 12.5 21 300
per
Hou
r
0.0000
0.0001
0.0002
0.0003
0.0004
0.0005Uptake RateAssimilation Rate
Glycine
DIN:DIP Ratio
3.5 12.5 21 300
per
Hou
r
0.000
0.001
0.002
0.003
0.004
0.005Uptake RateAssimilation Rate
Figure 3-6 Nitrate specific uptake rates V (h-1) and assimilation rates A (h-1) of NH4
+, urea, and glycine with 15N substrate concentration (µM-N) by Prorocentrum minimum grown at different DIN:DIP ratios.

128
a. NO3-
Lg (N:P ratio)
0.0 0.5 1.0 1.5 2.0 2.5 3.0
Upt
ake
Rat
e p
er h
our
0.000
0.005
0.010
0.015
0.020
0.025
0.030
0.035
b. NO3-
Lg (N:P ratio)
0.0 0.5 1.0 1.5 2.0 2.5 3.0
Ass
imila
tion
Rat
e p
er h
our
0.000
0.005
0.010
0.015
0.020
0.025
c. NH4+
Lg (N:P ratio)
0.0 0.5 1.0 1.5 2.0 2.5 3.0
Upta
ke R
ate
per
hour
0.00
0.02
0.04
0.06
0.08
0.10
Lg (N:P ratio)
0.0 0.5 1.0 1.5 2.0 2.5 3.0
Ass
imila
tion
Ra
te p
er h
our
0.00
0.02
0.04
0.06
0.08
0.10
d. NH4+
Figure 3-7 a. The NO3
− specific uptake rates (V, h-1) of Prorocentrum donghaiense grown at different ambient N:P ratios; b. The NO3− specific
assimilation rates (A, h-1) of P. donghaiense grown at different ambient N:P ratios. c. The NH4+ uptake rates of P. donghaiense grown at
different ambient N:P ratios; d. The NH4+ assimilation rates of P. donghaiense grown at different ambient N:P ratios.

129
a.NO3-
Lg (N:P ratio)
0.0 .5 1.0 1.5 2.0 2.5 3.0
A/V
%
0
20
40
60
80
100b. NH4
+
Lg (N:P ratio)
0.0 .5 1.0 1.5 2.0 2.5 3.0
A/V
%
0
20
40
60
80
100
Figure 3-8 The assimilation efficiencies % (assimilation rate/ uptake rate) of NO3
− by Prorocentrum donghaiense grown at different ambient N:P ratios; b. The assimilation efficiencies % (assimilation rate/ uptake rate) of NH4
+ by P. donghaiense grown at different ambient N:P ratios

130
N:P Ratio
A/
0
1
2
3
4
NO3-
NH4+
Urea Glycine
3.5 12.5 20 300
Figure 3-9 The ratio of specific N assimilation rate/ growth rate (A/µ) of Prorocentrum minimum for major N sources at different DIN:DIP ratios

131
a.V/ NO3-
Log10(N:P ratio)
0.0 0.5 1.0 1.5 2.0 2.5 3.00
1
2
3
4
5
b. V/ NH4+
Log10(N:P)
0.0 0.5 1.0 1.5 2.0 2.5 3.00.0
0.5
1.0
1.5
2.0
c. A/ NO3-
Lg(N:P ratio)
0.0 0.5 1.0 1.5 2.0 2.5 3.00.0
0.5
1.0
1.5
2.0d. A/ NH4
+
Lg(N:P ratio)
0.0 0.5 1.0 1.5 2.0 2.5 3.0
0.0
0.1
0.2
0.3
0.4
0.5
0.6
Figure 3-10 The ratio of specific N uptake rate/ growth rate (V/µ) of Prorocentrum donghaiense for NO3
- (a) and NH4+ (b) at different ambient
N:P ratios; the ratio of specific N assimilation rate/ growth rate (A/µ) of P. donghaiense for NO3- (c) and NH4
+ (d) at different ambient N:P ratios

132
Figure 3-11 The conceptual model of the diel cell nutrient quota variation in a light-dark cycle. Q is the cell nutrient quota; the shading area stands for dark phase in a diel cycle; the filled arrows stand for the nutrients uptake from ambient water into the cell quota; the dash arrows stand for the process that nutrient in the cell quota is assimilated to build the cell.
133
Chapter 4: Effects of Light on Growth and Nitrogen Uptake
of Prorocentrum minimum and Prorocentrum donghaiense
Abstract
The effects of varying light irradiance on the growth, nitrogen (N) uptake and
assimilation of the harmful dinoflagellate Prorocentrum minimum and Prorocentrum
donghaiense were examined in turbidistat culture experiments. Algal cultures were
grown in a wide range of ambient light intensities from high light to dark, when their
growth rates and N acquisition were studied. Experiments to determine rates of N
uptake and assimilation of different N sources (NO3−, NH4
+, urea and glycine by P.
minimum and NO3−, NH4
+ by P. donghaiense) were conducted using 15N tracer
technique at each light irradiance. The growth rates suggested strong light regulation
on the growth of P. donghaiense. On a diel basis, the growth of both species was
regulated by the light-dark cycle, which may be a result of regulation of both light-
dependent growth and light-independent N nutrient uptake. Maximum growth rates
of both species always occurred at the beginning of light phase. N uptake by P.
minimum for all tested substrates showed no obvious light limitation on a short-term
basis. However, NH4+ uptake of P. donghaiense showed significant light limitation on
long-term basis. The light independent N uptake by P. minimum and P. donghaiense
allow them to be competitive in the relative low light available near-shore water.
However, the capability of light independent N uptake between the two Prorocentrum
species might be different.

134
Introduction
An increasing frequency and intensity of harmful algae blooms (HABs) has
been observed in coastal waters all over the world and these events threaten the
structure and function of coastal ecosystems (Smayda 1990, Hallegraeff 1993,
Anderson 1997, Moncheva et al. 2001, Heil et al. 2005, Wang and Wu 2009). It has
been suggested that many HABs are correlated with the acceleration of eutrophication
in coastal ecosystems (Hallegraeff 1993, Anderson et al. 2002, Glibert et al. 2005,
Glibert and Burkholder 2006, Glibert et al. 2006, Glibert et al. 2008a, Heisler et al.
2008). Smayda (2001) suggested that dinoflagellates, a major group of bloom-
forming algae, have diverse habitat preferences and adaptive strategies and
characterized dinoflagellate bloom species in coastal areas in a nutrient-turbulence
matrix (Smayda and Reynolds 2001, Smayda 2002). Each dinoflagellate species has
its specific niche for bloom expansion, and the niches are described by available
nutrients and turbulence/mixing intensity. In this matrix, Prorocentrum spp. (length
15~22 μm width 9~14 μm) are Type II species which are small, rapidly growing
competitors blooming in nutrient-rich near-shore regions.
Prorocentrum minimum has caused HAB problems in both tropical and
temperate coastal waters (Heil et al. 2005, Glibert et al. 2008b). It is a common HAB
species in coastal and estuarine systems in USA, and frequently develops blooms in
the Chesapeake Bay and southwest Florida shelf (Glibert et al. 2001, Tango et al.
2005, Heil et al. 2007). Prorocentrum donghaiense, is a major bloom species near the
Changjiang Estuary and in the coastal area of East China Sea. Large scale P.
donghaiense blooms have been observed in the past two decades (Zhou et al. 2006, Li

135
et al. 2009, Li et al. 2010). Prorocentrum minimum and P. donghaiense are very
similar species and can be classified in the same category in the Smayda’s model, and
their expanding geographical distribution is indicative of a strong relationship to
terrestrial nutrients discharge into coastal waters (Heil et al. 2005, Glibert and
Burkholder 2006, Glibert et al. 2008a). However, there are still differences between
the habitats of these two species. Prorocentrum donghaiense can only grow well in
high salinity (25 - 35) water (Xu et al. 2010). The high frequent bloom areas of P.
donghaiense have been documented mostly in the adjacent area of the Changjiang
River estuary, which is the largest river of the China (Zhou et al. 2003, Zhou et al.
2006). The Changjiang River water develops huge plumes from the river mouth, with
characteristically high nutrients, high turbidity, but low salinity water (Lie et al.
2003). The distribution of P. donghaiense is usually observed relatively off-shore
near the edge of the river plume, where these cells could access the riverine nutrients,
but still remain in the water column with high clarity (Li et al. 2009). On the other
hand, P. minimum can grow over a broad salinity range, and develops blooms in the
coastal water with salinity as low as 5 (Heil et al. 2005, Tango et al. 2005). In the
Chesapeake Bay, high frequent P. minimum were documented in the muddy
tributaries, where the secchi depth was only ~ 1m (Tango et al. 2005).
Considering these field observation, it is reasonable to suggest these two
species can be exposed to different light in these habitats, when they develop blooms.
Studying the effects of light on the growth and nutrient uptake of these two species
will be helpful to understand the mechanisms of bloom development. Previous studies
suggested that P. minimum grew well under low light conditions (Grzebyk and

136
Berland 1996), and show light-independent N uptake ability (Fan and Glibert 2005).
However, according to recent literature review, there is no information on the
influence of light on the N uptake of P. donghaiense.
Herein, the utilization of N nutrients by the phytoplankton are described as
two steps. Nitrogen uptake is the step in which N nutrients are transported across the
cell membrane into the nutrient pool inside the cell. When taken up into the cell,
NO3− and NO2
− are reduced to NH4+with the aid of NO3
−reductase or NO2−reductase,
or both (Lomas and Glibert 2000). Reduced forms of N nutrients can be utilized in
the synthesis of organic compounds, which is the step of assimilation (Conway 1977,
Glibert and McCarthy 1984).
In this study, cultures of P. minimum and P. donghaiense were grown across a
light irradiance spectrum in order to achieve a range of growth rates and a range of
physiological states. Ambient N:P ratio, which has been reported to be related to the
regulating growth and physiology of these two species (Li et al. 2009, Li et al. in
press), was also considered as a variable in the experiments of P. minimum. The
effect of light on these two species was tested on growth rate and the rates of uptake
of different forms of N, as were the comparative rates of uptake and assimilation.
Materials and Methods
Algal Culture
Cultures of Prorocentrum minimum were isolated from Choptank River, a
tributary of Chesapeake Bay in spring 1995 and were maintained in f/2 medium in the

137
Horn Point Laboratory culture collection. For the present experiments, P. minimum
cells were first transferred to f/2 batch cultures for 2 weeks, then grown in turbidistat,
an automatic continuous culture system, as described in Li et al. (in press), at a cell
density ~ 16,000 cell ml-1.
Cultures of Prorocentrum donghaiense were obtained from University of
Connecticut Department of Marine Sciences, USA. These cultures were originally
isolated from the East China Sea. They, too, were transferred to f/2 batch cultures for
several weeks, then grown in turbidistat at a cell density ~ 30,000 cell ml-1.
Continuous Culture Design
A continuous turbidistat culturing device was used to grow the Prorocentrum
cultures. A modulated infrared (880 mm) LED beam was directed though the culture
vessel (a 2 L glass carboy) to a photosensor, the analog signal output of which was
related to optical transmission (i.e., turbidity). Real time turbidity signals were sent to
a computer that controlled a peristaltic pump which diluted the culture based on
attaining a threshold value. The system was programmed to dilute the culture by 5%
in terms of the optical signal. This corresponds to a volume dilution of approx. 10%,
based on calibrations using a volumetric dilution. The threshold was set to a turbidity
that represented a P. minimum cell density of ~ 16,000 cell ml-1 and a P. donghaiense
cell density of ~ 30,000 cell ml-1. The culture was stirred at a speed of ~ 60 rpm and
generally bubbled with air to keep the culture well mixed and aerated. In this
condition, the cells grew at a maximum rate of growth as set by the environmental
conditions of the culture. The specific growth rate over each 20 minute period was

138
calculated from the optical signal and recorded every minute. The use of growth rate,
in this study, refers to the rate calculated based on the change in the optical signals.
Experimental Design and Algal Growth
Unialgal, but not axenic, P. minimum were grown in the turbidistats in filtered
Choptank River water, at a salinity of 15, a temperature of 22 ◦C and a 14 h: 10 h
light dark cycle at 430 µmol photons m-2 sec-1. Modified f/2-medium without silicate
was used, modified by reducing nitrate (NO3-) to 40 µM-N, but by adding PO4
3- in
varying concentrations from 0.2 to 10 µM-P in different turbidistats, therefore
providing N:P ratios of 5, 16, 40 and 200. The cells were thus grown in a N:P
gradient from relatively low P to low N conditions.
Unialgal, but not axenic, cultures of P. donghaiense cells were grown in the
turbidistats, in filtered Choptank River water, at a salinity of 30, a temperature of 22
◦C and a 12 h: 12 h light dark cycle at 500 µmol photons m-2 sec-1. Modified f/2-
medium without silicate was used. The turbidistat were supplied with media NO3- at
80 µM and PO43- at 5 µM.
The volume of each turbidistat culture was kept about 1.6 L in the 2 L glass
carboys. Before the initiation of experiments, 100 ml water samples were collected
from each turbidistat culture and filtered though pre-combusted (2 h at 400 °C)
Whatman GF/F filters for ambient nutrient analysis as described below.
139
Nitrogen Uptake and Assimilation Experiments
N Uptake of P. minimum
Prorocentrum minimum cells were grown in turbidistat at each N:P ratio for at
least 3 days to obtain a steady growth state before the N uptake experiments were
initiated. 15N isotopically labeled dissolved N substrates were used to measure the
culture uptake rates (Glibert and Capone 1993) across a light irradiance spectrum at
each N:P ratio. Experiments were conducted around 12 pm. Culture samples of 40 ml
were dispensed into a series of acid-clean 50 ml incubation cuvettes to which 15N
substrates (Cambridge Isotope Laboratories, Inc.) were added respectively.
Considering NO3− was the primary N nutrient in the media, 15N labelled NO3
− was
added at a concentration of 20 µM-N. 15N labelled NH4+, urea and glycine were added
at 2 µM-N. Each group of cuvettes, after adding the 4 substrates, were incubated for
0.5 h in a light irradiance gradient of 9, 35, 200, 430 µmol photons m-2 sec-1.
Irradiance was obtained by covering the cuvettes with different number layer of black
mesh screens. The incubations were terminated by filtration onto pre-combusted
GF/F filters. A 20 ml aliquot for each treatment was filtered directly onto one filter.
The filters were stored frozen until dried at 50 ˚C for 48 h, then analyzed as described
below.
N Uptake and Assimilation of P. donghaiense
Prorocentrum donghaiense cells were grown in turbidistats at a light
irradiance gradient of 500, 200, 66, 16, 5 µmol photons m-2 sec-1. Cells were grown at
each light irradiance for at least 3 days. Experiments were conducted around 10 am.
Culture samples of 40 ml were dispensed into acid-clean 50 ml incubation cuvettes to
140
which 15N substrates were added. These experiments only involved 15N labelled NO3−
and NH4+. NO3
− was added in a gradient of 1, 2, 5, 10, 25, 37.5, 50 µM-N. NH4+ was
added in a gradient of 0.1, 0.5, 2, 5, 10, 20 µM-N. All the cuvettes were incubated for
0.5 h at the same light irradiance which the cultures were grown at the time of
experiments. The incubations were terminated by filtration onto pre-combusted GF/F
filters. A 20 ml aliquot for each treatment was filtered directly onto one filter, which
was treated with 10% ice-cold Tri-Chloroacetic Acid (TCA) for 10 seconds after
filtration. An extra 20 ml aliquot was filtered to a second filter without further
treatment. The TCA-treated filter represents the N substrate assimilated into
proteinaceous material, while the untreated filter represents the total N substrate
which was taken into the cell. The filters were stored frozen until dried at 50 ˚C for 48
h, then analyzed as described below.
Analytical Methods
Concentrations of ambient inorganic nutrients (NO3−+NO2
−-N, NH4+-N, PO4
3-
-P) were determined using a Technicon Auto-Analyzer (Lane et al. 2000).
Concentrations of dissolved free amino acid (DFAA) were determined by
fluorometric analysis according to Lindroth and Mopper (1979) and urea was
analyzed using the method of Revilla et al. (2005). DFAA concentrations were used
to approximate the glycine concentrations in the N uptake rate calculations. Glycine
is generally considered to be a dominant amino acid (Degens and Mopper 1976), but
their rates of uptake should be considered potential rates based on the uncertainty of
their contribution to the DFAA pool. All the 15N sample filters were analyzed for
141
isotope enrichment using a Sercon Mass Spectrometer. Rates of 15N uptake and
assimilation were calculated according to Glibert and Capone (1993).
Data Analysis
The nitrogen uptake parameters relating to ambient N concentrations were
plotted and fitted to the Michaelis-Menten formulation:
SK
SVV
s max
where V is the N specific uptake rate (h-1), Vmax is the maximal N specific uptake rate
(h-1), S is the substrate concentration (µM-N) and Ks is the half-saturation constant
(µM-N) for the substrate. Vmax and Ks for each N source were calculated by using
Sigmaplot software (Systat Software, Inc.).
The growth rate parameters relating to ambient light irradiances were also
plotted and fitted to a modified formulation (Baly 1935, Aalderink and Jovin 1997):
maxI
Ir r D
K I
where r is the specific growth rate (h-1), rmax is the maximal growth rate, I is the
ambient light irradiance (µmol photons m-2 sec-1), KI is the half-saturation light
irradiance (µmol photons m-2 sec-1), and D is the specific dark respiration rate (h-1),
which is generally considered opposite to the growth process. rmax, KI and D for P.
donghaiense were also calculated by the regression of dynamic by Sigmaplot
software (Systat Software, Inc.).
Two way ANOVA analyses were conducted to compare the growth and
uptake and assimilation data in the different N:P ratio and light intensity treatments.

142
Results
Ambient Parameters
In the P. minimum culture, the ambient N:P ratios in the culture vessels at the
time of the experiments were 3.5, 12, 21, 300 (Table 4-1), which were slightly
different from the ratios of incoming media (5, 16, 40 and 200). NO3- became
depleted (< 2 µM-N) in the two relatively high P treatments (N:P ratios 3.5 and 12),
but high concentrations (>20 µM-N) remained in the two relatively low P treatments
(N:P ratios 21 and 300). PO43- was depleted in the treatment where N:P ratio was 13.
In the P. donghaiense culture, the ambient NO3- concentration varied from 1.9 µM-N
to 17.8 µM-N, and ambient NH4+ concentration varied from 0.72 µM-N to 2.57 µM-
N.
Growth Rate in the Turbidistat
When supplied with a constant media supply, the growth rates of both P.
minimum and P. donghaiense in turbidistats showed highly repeatable diel cycles, and
cells reached high frequency optical-signal continuous growth in light-dark cycles
(e.g. Fig. 4-1). Both species showed a clear diel cycle (Fig. 4-2). Growth rapidly
increased at the beginning of the light period and the rates increased to the highest
value of the day in less than an hour. Growth rates decreased rapidly when the light
was off and the calculated rates were negative in the dark, which indicated the
decrease of turbidity in the dark. Similar diel growth cycles were observed for all
treatments of both species.

143
In the P. minimum cultures, at ambient N:P ratios of 3.5, 12, 21 and 300, the
hourly growth rates averaged over the full day (rday) were 0.0085, 0.024, 0.013 and
0.012 h-1, respectively (Fig. 4-3 a), while the average growth rates for only the light
phase (rL) were 0.016, 0.047, 0.027 and 0.026 h-1, respectively (Fig. 4-3 b). The
maximum rday and rL was recorded at a N:P ratio of 12.0 (157 µM NO3−, 13.1 µM
PO43-). In the P. donghaiense cultures, the growth rates decreased as the ambient
irradiance decreased (Fig. 4-4). The rday decreased from ~ 0.022 h -1 at 500 µmol
photons m-2 sec-1 to ~ 0.011 h -1 at 5 µmol photons m-2 sec-1 (Fig. 4-5), while the rL
decreased from ~ 0.071 h -1 at 500 µmol photons m-2 sec-1 to -0.014 h -1 at 5 µmol
photons m-2 sec-1. There was no evidence of high light growth inhibition in the light
range of experiments. For P. donghaiense, the average rmax over one light-dark cycle
was 0.042 h -1, with half saturation coefficient (KI) of 34 µmol photons m-2 sec-1 and
respiration rate (D) of 0.017 h -1. The rmax averaged in the light phase was 0.097 h -1,
with KI of 56 µmol photons m-2 sec-1 and D of 0.021 h -1.
Nitrogen Uptake Experiments
In the P. minimum experiments, the N uptake rates did not show significant
light limitation in the irradiance range of experiments (Fig. 4-6). The uptake rates of
NO3- , NH4
+, urea and glycine in the relatively high-P culture (N:P ratio 3.5) were
significantly higher than in the low-P cultures (p< 0.05). There were no significant
differences among the NO3- , NH4
+ uptake rates in these higher N:P ratio cultures. A
significant light inhibition of N uptake rates was only observed when the average
uptake rates at relatively low light (9 and 35µmol photons m-2 sec-1) and relatively
high light (200 at 430 µmol photons m-2 sec-1) were compared for the culture growing
144
at ambient N:P ratio of 3.5 (Fig. 4-7). Although NO3- was the major N nutrient in the
total of the 4 N substrates in the culture, NH4+ contributed about 70% of total N
uptake rate (sum of uptake rate of 4 N nutrients), while NO3- contributed about 18%
of total N uptake rate. Glycine contributed about 11% of total N uptake rate. The
uptake rates of urea were very low.
In the P. donghaiense experiments, the VNO3- was about 0.002 h-1 near ambient
concentration, and increased to 0.005 - 0.01 h-1, when enriched with 50 µM-NO3-.
Although V NO3- did not saturate over the concentration range tested, Vmax values can
be estimated mathematically (Fig. 4-8). The highest calculated V maxNO3- was 0.032 h-
1, measured in lowest light. However, the second highest calculated V maxNO3- was
0.022 h-1, measured in highest light. The differences among NO3- uptake rates under
different light treatments were not significant. V NH4+ reached saturation over the
concentration range tested. The VNH4+ in the 2 highest light treatments were
significantly higher than the 2 lowest light treatments. V max NH4+ varied from 0.02 to
0.07 h-1.
The half-saturation constant Ks can be considered an index of competitive
ability of bloom species at low nutrient concentration. Since the measured rates of
NO3- uptake at some irradiance levels did not saturate over the concentration range
tested, the Ks values were also estimated mathematically to be very high. Calculated
Ks values of NO3- uptake were in range of 13.5 to 156.6 µM-N. The uptake rate curve
was almost linear with a high slope with high Ks (Table 4-2). The KsNH4+ values were
negatively correlated to the ambient light, and increased from ~1 to over 20 µM-N as
the ambient light irradiance decreased.

145
Not all the N substrate taken up into the cells was assimilated into
proteinaceous material during the incubation time. Here, the two highest light
irradiance, 500 and 200 µmol photons m-2 sec-1, were averaged, and the two lowest
light irradiance, 5 and 16 µmol photons m-2 sec-1, were also averaged to compare high
and low light rates. Near the ambient concentration level, P. donghaiense had higher
VNO3- (~ 0.003 h-1) and ANO3
- (~ 0.0007 h-1) in the low light than high light, however, it
had higher VNH4+ (~ 0.017 h-1) and ANH4
+ (~ 0.07 h-1) in the high light than low light
(Fig. 4-9). The VNH4+ and ANH4
+ is an order of magnitude higher than VNO3- and ANO3
-
respectively. The assimilation coefficients (assimilation rate : uptake rate) of NH4+
were also much higher than those of NO3-. Prorocentrum donghaiense growing in
high light could assimilate average 35% of the NH4+ taken up during the incubation,
but those in low light only assimilate less than 20%. Prorocentrum donghaiense
could only assimilate on average less than 10% of the NO3- taken up.
Discussion
Growth Regulation in Turbidistat
Turbidistat is run under turbidity control, and new medium inflow only occurs
in response to an increase in the culture biomass to a pre-set value. Biomass is set by
the optical threshold of dilution. Cell growth is limited by light and temperature;
nutrients are usually added in excess of demand (Watson 1972, Skipnes et al. 1980,
Fenaux et al. 1985, Hill et al. 1985, Kalyuzhin 1998). Light in turbidistat can run on a
light-dark cycle which is more close to real situations (Falkowski et al. 1985). Herein,
turbidistats provided a relatively long and steady exponential phase of growth without
146
causing significant change in irradiance caused by self-shading and nutrient
depletion, and also provided detailed records of real-time growth rates.
The growth rate, in this study, refers to the rate of changing of the optical
signals, which attenuate with the turbidity of the culture. The turbidity is caused by
the total mass concentration in the culture. Therefore, the growth rate is interpreted as
the variation rate of total mass density of the culture, instead of cell density, which is
calibrated by diluted the culture by volume. Based on the growth rates recorded by
the turbidistat, the growth of both species showed strong light-regulated diel cycles.
Cell growth, measured as the change of turbidity in the culture vessel, started at the
beginning of light cycle.
Dinoflagellate species have been reported to have a maximum growth limit of
1 division per day (McDuff and Chisholm 1982), as a result of dark-light regulated
diel synchrony. Here, the growth rates recorded in the high light treatments were
around 0.7 division per day. Maximum growth rate generally occurred in the first
hour at the beginning of the light phase, and growth rate decreased during the day
time. During the dark phase, the cultures were still mixed and gently bubbled and to
keep them well mixed. Therefore, the negative growth rates suggested decreases in
mass concentration in the culture. Negative growth rate, therefore, were not to due to
setting of cells. When the photosynthesis stopped in the dark phase, the production
rates of these species were less than the respiration rate, causing the negative growth
rate. This state lasted until the start of the light cycle, when production rates increased
quickly over respiration and the turbidity of the culture increased again.

147
Diel phasing of the cell cycle is common among photoautotrophic
dinoflagellates, although the precise temporal phasing varies in a species-specific or
environment-specific manner (Van Dolah et al. 1995, Van Dolah and Leighfield
1999, Leighfield and Van Dolah 2001). In one cell cycle Prorocentrum micans and P.
minimum divide (the M phase) during a narrow window of time in the early hours of
the light phase (Pan and Cembella 1998). The dark phase of the diel cycle of
Prorocentrum spp. may include the S and G2 phase of the cycle which is light
independent in dinoflagellates (Olson and Chisholm 1986). The entry of M phase is
suggested to be dictated by the time of S phase entry instead of light. However, the
G1 phase is suggested to be light dependent (Olson and Chisholm 1986). Incubation
in low light for multiple diel cycle could arrest cells in the G1 phase, instead of
entering the S phase and finishing a division cycle. As the result, the cell growth was
inhibited. Light limitation impacts ATP and reductant production, which is derived
from photosynthesis, and therefore affects N uptake, reduction and assimilation. In a
previous study, in contrast to tested a diatom (Thalassiosira weissflogii), in which the
N uptake and cell division were regulated by the new N pulses, the cell division of a
dinoflagellate (Amphidinium carteri) was strictly regulated by the light-dark cycle,
regardless the time of new N pulses (Wheeler et al. 1983). However, light-dark cycle
had a relatively weak effect on N uptake and assimilation. N was metabolized rapidly,
under conditions of N limitation. This light regulated dinoflagellate cell cycle led to a
large degree of uncoupling between N assimilation and cell division (Wheeler et al.
1983). In the present study, the culture was diluted by new media from 0 to 6 times a
day, depending on the growth rates. Each dilution could be considered as a N pulse.

148
However, there were no significant variations on the growth rate pattern after each
pulse, and the growth rates were still strictly regulated by the dark-light cycle, which
was measured as the change of turbidity.
Wheeler et al. (1989) also reported maximal N uptake during the daytime and
release (regeneration) of NH4+ exclusively at night, suggesting the capacity for large
internal N pools for the N. Cells were able to take up and assimilate N, but could not
proceed through the cell cycle until the correct portion of the dark-light cycle. At the
beginning of the photoperiod, this pool of intracellular N may allow the assimilation
process to proceed at an enhanced rate to support the fast growth, which was recorded
by the turbidistats. This uncoupled N uptake and cell growth can also be explained by
Droop’s model (Droop 1968, 1973), which describes the growth rate regulated by the
cell quota (intracellular content of the limiting chemical element). These
Prorocentrum species had their maximum cell quotas (internal N pool), and reached
the highest growth rates at the beginning of light phase. Decreasing growth rates
during the day are indicative of decreasing cell quotas. However, low growth rates in
the dark cycle were not necessary indicative of a small cell quota, since the cells were
light regulated instead of nutrient regulated. Prorocentrum minimum has been
reported to continuously uptake the NO3- in the dark (Paasche et al. 1984). Cell
stopped growth at night due to light limitation, but nutrients were likely continuously
taken up into and stored in the cell, causing an increasing cell nutrient quota. The cell
quota reached its maximum value of the day at the beginning of light phase, as did
growth rates.

149
The regulation of light on the growth of P. donghaiense was significant.
Based on the kinetics simulation, the half saturation coefficient (KI) was low (30 ~ 50
µmol photons m-2 sec-1) in the range of light tested growth rates. The growth rates
dropped rapidly when the ambient light was lower than the KI. The negative growth
rate in the dark phased indicated very low production, which could not compensate
the respiration lost, as a result, negative growth rates were recorded. In the low light
treatments, the growth activities of P. donghaiense were light limited.
N Uptake versus Irradiance
Nitrogen uptake by phytoplankton is an energy consuming process. Light
dependent nutrient uptake of phytoplankton has been studied in both laboratory
culture and field communities, and the responses to light are varied among different
species (Anderson and Roels 1981, Megard et al. 1985, Lomas et al. 1996, Kudela et
al. 1997, Sinclair et al. 2009). High light may enhance the rate of N uptake, as the
energy for N uptake and NO3- reduction is derived primarily from photosynthesis in
the light (Kanda et al. 1989). The uptake rates might be cyclic over diel cycles
(Anderson and Roels 1981). Numerous studies have shown that uptake of nutrient
responding to light were different among taxonomic groups (Eppley et al. 1971,
Wheeler et al. 1983). For example, the diatom Skeletonema costatum had lower dark
uptake rates of NO3- and NH4
+, and coccolithophore Emiliania huxleyi was more
consistent in both day and night (Eppley et al. 1971). Light dependent N uptake rates
have also been shown to be different for different nutrients. NO3- needs to be reduced
before it can be assimilated by the algae, and this process needs light, as an energy
consuming process. NO3- uptake rates have been shown to decrease more than uptake

150
of NH4+ in diatom dominant assemblages at night, suggesting higher light dependence
of NO3- uptake than reduced N sources (Cochlan et al. 1991). For dinoflagellates, the
light dependence of N uptake also varied with species. Prorocentrum minimum could
continuous uptake the NO3- in the dark; while Karenia mikimotoi showed almost no
NO3- uptake in the dark (Paasche et al. 1984). The light dependence might be weaken
with increasing nutrient limitation (Healey 1977).
In this experiment, the N uptake rates rate of P. minimum showed similar
results to those reported by as Fan and Glibert (2005), which suggested little or no
effect on N uptake during short term (~ half hour) incubations. Compared to the
growth rates measured in the turbidistat, which had quick response to light and which
decreased to near zero in 0.5 hour after the lights turned offs, the light independence
of N uptake of P. minimum suggested that N uptake was not affected by low light. In
this case, the growth stopped and but the cell N quota still increased.
However, after days of incubation in different irradiance levels, the regulation
of light on the N uptake of P. donghaiense was significant. Although the uptake and
assimilation rates of NO3- in the low light were even slightly higher than those in high
light treatments, the uptake and assimilation rates of NO3- were an order of magnitude
lower than those of NH4+. The contribution of NO3
- to the total N uptake and
assimilation was very limited. Both the uptake and uptake assimilation rates of NH4+
suggested significant light limitation when comparing the low and high light
treatments. This light limitation of N uptake was consistent with light limitation on
the growth rate (Fig. 4-9). The NH4+ uptake rates were less than the growth rate,

151
suggesting the contribution of other N nutrients to support growth (i.e., organic N, Li
et al. 2009).
Light Condition and Prorocentrum Blooms
The annual recirculation of cell transportation in the Chesapeake Bay has been
suggested as an important mechanism for the periodic outbreak of P. minimum
blooms (Tyler and Seliger 1978). P. minimum cells are transported to upper
Chesapeake Bay and its tributaries by the northward current from the bottom layer
from the mouth of the Chesapeake Bay in the winter and early spring. It could take
over a month before the P. minimum is transported to the tributaries, and more time to
reach the surface water. During this period, the cells are in near or total dark
environment. When P. minimum rises to the surface, the cells grow and develop
blooms. Dinoflagellates have multiple strategies to survive extended periods of
darkness. For example, both P. minimum and P. donghaiense have been reported to
be mixotrophic dinoflagellates, and may directly feed on a wide range of food
sources, including other algae, bacteria, and organic particles (Li et al. 1999, Stoecker
1999, Jeong et al. 2004, Burkholder et al. 2008, Jeong et al. 2010). Light independent
N uptake is another strategy for the cells to keep taking up N nutrients supply during
the dark phase in the bottom layer, which would allow them to be competitive in
turbid coastal waters where light is low. When cells are transported to the deeper
layer, although the growth may be light limited, cells can still take up N and keep a
large cell N quota. When they reach surface water, cells with large cell nutrient quota
can quickly reach high growth rate and develop blooms. When N is depleted in the
surface layer, cells can also obtain N sources in the dark deep layer by taking the
152
advantage of vertical migration (Holmes et al. 1967, Eppley et al. 1968, Haraguchi et
al. 2010, Rines et al. 2010). Dinoflagellates can access both the deep nutrient pool
and near-surface light required for photosynthesis, at different times of the day.
Bloom-forming dinoflagellates are capable of maintaining a relatively high nutrient
uptake rate in a low-light or even completely dark environment (Heaney and Eppley
1981, Paasche et al. 1984, Cullen et al. 1985, Olsson and Granéli 1991, Cloern 2001,
Fan and Glibert 2005), thus allowing them to store extra nutrients (especially
regenerated nutrient PO43- and NH4
+) by luxury uptake in the deep layer before
ascending to the surface for photosynthesis.
However, the regulation of light on N uptake between the two Prorocentrum
species might be different. Although the growth rate of P. donghaiense only
decreased about 40%, when ambient light decreased from 500 to 66 µmol photons m-
2 sec-1, there was significantly greater light limitation on NH4+ uptake rate.
Prorocentrum donghaiense also had significantly lower Ks for NH4+ in high light
treatments. These results suggested P. donghaiense might not adapt to low light as
well as P. minimum, which is consistent with the field observation that P. minimum
can bloom in very turbid near-shore estuarine waters, while P. donghaiense blooms
are relatively off-shore.

153
References
Aalderink RH, Jovin R (1997) Estimation of the photosynthesis/irradiance (P/I) curve parameters from light and dark bottle experiments. Journal of Plankton Research 19:1713-1742
Anderson DM (1997) Turning back the harmful red tide - Commentary. Nature 388:513-514
Anderson DM, Glibert PM, Burkholder JM (2002) Harmful algal blooms and eutrophication: Nutrient sources, composition, and consequences. Estuaries 25:704-726
Anderson SM, Roels OA (1981) Effects of light-intensity on nitrate and nitrite uptake and excretion by Chaetoceros curvisetus. Marine Biology 62:257-261
Baly E (1935) The kinetics of photosynthesis. Proceedings of the Royal Society B 117:218-239
Burkholder JM, Glibert PM, Skelton HM (2008) Mixotrophy, a major mode of nutrition for harmful algal species in eutrophic waters. Harmful Algae 8:77-93
Cloern JE (2001) Our evolving conceptual model of the coastal eutrophication problem. Marine Ecology-Progress Series 210:223-253
Cochlan WP, Harrison PJ, Denman KL (1991) Diel periodicity of nitrogen uptake by marine-phytoplankton in nitrate-rich environments. Limnology and Oceanography 36:1689-1700
Conway HL (1977) Interactions of inorganic nitrogen in uptake and assimilation by marine phytoplankton. Marine Biology 39:221-232
Cullen J, Zhu M, Davis R, Pierson D (1985) Vertical migration, carbohydrate synthesis, and nocturnal nitrate uptake during growth of Heterocapsa niei in a laboratory water column. In: Anderson D, White A, Baden D (eds) Toxic dinoflagellates. Elsevier, Amsterdam, p 189-194
154
Degens ET, Mopper K (1976) Factors controlling distribution and early diagenesis of organic marine sediments. In: Riley JP, Chester R (eds) Chemical oceanography, Vol 6. Academic London, New York, San Francisco, p 60-114
Droop MR (1968) Vitamin B12 and marine ecology 4. kinetics of uptake growth and inhibition in Monochrysis lutheri. Journal of the Marine Biological Association of the United Kingdom 48:689-733
Droop MR (1973) Some thoughts on nutrient limitation in algae. Journal of Phycology 9:264-272
Eppley RW, Holm-Hansen O, Strickland JD (1968) Some observations on vertical migration of dinoflagellates. Journal of Phycology 4:333-340
Eppley RW, Rogers JN, McCarthy JJ, Sournia A (1971) Light/dark periodicity in nitrogen assimilation of marine phytoplankters Skeletonema costatum and Coccolithus huxleyi in N-limited chemostat culture. Journal of Phycology 7:150-154
Falkowski PG, Dubinsky Z, Wyman K (1985) Growth-irradiance relationships in phytoplankton. Limnology and Oceanography 30:311-321
Fan CL, Glibert PM (2005) Effects of light on nitrogen and carbon uptake during a Prorocentrum minimum bloom. Harmful Algae 4:629-641
Fenaux R, Malara G, Claustre H (1985) A turbidostat driven and controlled by microcomputer. Aquaculture 48:91-95
Glibert PM, Anderson DM, Gentien P, Granéli E, Sellner KG (2005) The global, complex phenomena of harmful algal blooms. Oceanography 18 (2):136-147
Glibert PM, Burkholder JM (2006) The complex relationships between increasing fertilization of the earth, coastal eutrophication and proliferation of harmful algal blooms. In: Granéli E, Turner J (eds) Ecology of Harmful Algae. Springer, p 341-354
Glibert PM, Burkholder JM, Granéli E, Anderson DM (2008a) Advances and insights in the complex relationships between eutrophication and HABs: Preface to the special issue. Harmful Algae 8:1-2

155
Glibert PM, Capone DG (1993) Mineralization and assimilation in aquatic, sediment, and wetland systems. In: Knowles R, Blackburn TH (eds) Nitrogen isotope techniques, Vol 243-272. Academic Press
Glibert PM, Harrison J, Heil C, Seitzinger S (2006) Escalating worldwide use of urea - a global change contributing to coastal eutrophication. Biogeochemistry 77:441-463
Glibert PM, Magnien R, Lomas MW, Alexander J, Fan CL, Haramoto E, Trice M, Kana TM (2001) Harmful algal blooms in the Chesapeake and Coastal Bays of Maryland, USA: Comparison of 1997, 1998, and 1999 events. Estuaries 24:875-883
Glibert PM, Mayorga E, Seitzinger S (2008b) Prorocentrum minimum tracks anthropogenic nitrogen and phosphorus inputs on a global basis: Application of spatially explicit nutrient export models. Harmful Algae 8:33-38
Glibert PM, McCarthy JJ (1984) Uptake and assimilation of ammonium and nitrate by phytoplankton - Indexes of nutritional status for natural assemblages. Journal of Plankton Research 6:677-697
Grzebyk D, Berland B (1996) Influences of temperature, salinity and irradiance on growth of Prorocentrum minimum (Dinophyceae) from the Mediterranean Sea. Journal of Plankton Research 18:1837-1849
Hallegraeff GM (1993) A review of harmful algal blooms and their apparent global increase. Phycologia 32:79-99
Haraguchi K, Yamamoto T, Chiba S, Shimizu Y, Nagao M (2010) Effects of phytoplankton vertical migration on the formation of oxygen depleted water in a shallow coastal sea. Estuarine Coastal and Shelf Science 86:441-449
Healey FP (1977) Ammonium and urea uptake by some freshwater algae. Canadian Journal of Botany-Revue Canadienne De Botanique 55:61-69
Heaney S, Eppley R (1981) Light, temperature and nitrogen as interacting factors affecting diel vertical migrations of dinoflagellates in culture. Journal of Plankton Research 3:331-344

156
Heil CA, Glibert PM, Fan CL (2005) Prorocentrum minimum (Pavillard) Schiller - a review of a harmful algal bloom species of growing worldwide importance. Harmful Algae 4:449-470
Heil CA, Revilla M, Glibert PM, Murasko S (2007) Nutrient quality drives differential phytoplankton community composition on the southwest Florida shelf. Limnology and Oceanography 52:1067-1078
Heisler J, Glibert PM, Burkholder JM, Anderson DM, Cochlan W, Dennison WC, Dortch Q, Gobler CJ, Heil CA, Humphries E, Lewitus A, Magnien R, Marshall HG, Sellner K, Stockwell DA, Stoecker DK, Suddleson M (2008) Eutrophication and harmful algal blooms: A scientific consensus. Harmful Algae 8:3-13
Hill SH, Abbott MR, Denman KL (1985) A computer-controlled turbidostat for the culture of planktonic algae. Canadian Journal of Fisheries and Aquatic Sciences 42:744-753
Holmes RW, Williams PM, Eppley RW (1967) Red water in La Jolla Bay 1964-1966. Limnology and Oceanography 12:503-512
Jeong H, Yoo Y, Kim J, Seong K, Kang N, Kim T (2010) Growth, feeding, and ecological roles of the mixotrophic and heterotrophic dinoflagellates in marine planktonic food webs. Ocean Science Journal 45:65-91
Jeong HJ, Song JY, Lee CH, Kim ST (2004) Feeding by larvae of the mussel Mytilus galloprovincialis on red-tide dinoflagellates. Journal of Shellfish Research 23:185-195
Kalyuzhin VA (1998) The growth of a turbidostat yeast culture in the presence of high concentrations of various compounds in a steady-state regime and under osmotic shock. Microbiology 67:499-503
Kanda J, Ziemann DA, Conquest LD, Bienfang PK (1989) Light-dependency of nitrate uptake by phytoplankton over the spring bloom in Auke Bay, Alaska. Marine Biology 103:563-569
Kudela RM, Cochlan WP, Dugdale RC (1997) Carbon and nitrogen uptake response to light by phytoplankton during an upwelling event. Journal of Plankton Research 19:609-630
157
Lane L, Rhoades S, Thomas C, Van Heukelem L (2000) Analytical services laboratory standard operating procedures, University of Maryland Center for Environmental Science, Cambridge, Maryland.
Leighfield TA, Van Dolah FM (2001) Cell cycle regulation in a dinoflagellate Amphidinium operculatum: identification of the diel entraining cue and a possible role for cyclic AMP. Journal of Experimental Marine Biology and Ecology 262:177-197
Li AS, Stoecker DK, Adolf JE (1999) Feeding, pigmentation, photosynthesis and growth of the mixotrophic dinoflagellate Gyrodinium galatheanum. Aquatic Microbial Ecology 19:163-176
Li J, Glibert PM, Alexander JA (in press) Effects of ambient N:P ratio on the growth and nitrogen uptake of harmful dinoflagellate Prorocentrum minimum and Prorocentrum donghaiense in turbidistat. Chinese Journal of Oceanology and Limnology
Li J, Glibert PM, Zhou M (2010) Temporal and spatial variability in nitrogen uptake kinetics during dinoflagellate blooms in the East China Sea. Harmful Algae 9:531-539
Li J, Glibert PM, Zhou M, Lu S, Lu D (2009) Relationships between nitrogen and phosphorus forms and ratios and the development of dinoflagellate blooms in the East China Sea. Marine Ecology Progress Series 383:11-26
Lie HJ, Cho CH, Lee JH, Lee S (2003) Structure and eastward extension of the Changjiang River plume in the East China Sea. Journal of Geophysical Research-Oceans 108:-
Lindroth P, Mopper K (1979) High-performance liquid-chromatographic determination of subpicomole amounts of amino-acids by precolumn fluorescence derivatization with ortho-phthaldialdehyde. Analytical Chemistry 51:1667-1674
Lomas MW, Glibert PM (2000) Comparisons of nitrate uptake, storage, and reduction in marine diatoms and flagellates. Journal of Phycology 36:903-913
Lomas MW, Glibert PM, Berg GM, Burford M (1996) Characterization of nitrogen uptake by natural populations of Aureococcus anophagefferens

158
(Chrysophyceae) as a function of incubation duration, substrate concentration, light, and temperature. Journal of Phycology 32:907-916
McDuff RE, Chisholm SW (1982) The calculation of in situ growth-rates of phytoplankton populations from fractions of cells undergoing mitosis - a clarification. Limnology and Oceanography 27:783-788
Megard RO, Berman T, Curtis PJ, Vaughan PW (1985) Dependence of phytoplankton assimilation quotients on light and nitrogen-source - implications for oceanic primary productivity. Journal of Plankton Research 7:691-702
Moncheva S, Gotsis-Skretas O, Pagou K, Krastev A (2001) Phytoplankton blooms in Black Sea and Mediterranean coastal ecosystems subjected to anthropogenic eutrophication: Similarities and differences. Estuarine Coastal and Shelf Science 53:281-295
Olson RJ, Chisholm SW (1986) Effects of light and nitrogen limitation on the cell cycle of the dinoflagellate Amphidinium carteri. Journal of Plankton Research 8:785-793
Olsson P, Granéli E (1991) Observations on diurnal vertical migration and phased cell-division for 3 coexisting marine dinoflagellates. Journal of Plankton Research 13:1313-1324
Paasche E, Bryceson I, Tangen K (1984) Interspecific variation in dark nitrogen uptake by dinoflagellates. Journal of Phycology 20:394-401
Pan Y, Cembella AD (1998) Flow cytometric determination of cell cycles and growth rates in Prorocentrum spp. In: Reguera B, Blanco J, Fernandez ML, Wyatt T (eds) Harmful Algae, Xunta de Galicia and Intergovernmental Oceanic Commission of UNESCO, p 173-176
Revilla M, Alexander J, Glibert PM (2005) Urea analysis in coastal waters: comparison of enzymatic and direct methods. Limnology and Oceanography-Methods 3:290-299
Rines JEB, McFarland MN, Donaghay PL, Sullivan JM (2010) Thin layers and species-specific characterization of the phytoplankton community in Monterey Bay, California, USA. Continental Shelf Research 30:66-80

159
Sinclair G, Kamykowski D, Glibert PM (2009) Growth, uptake, and assimilation of ammonium, nitrate, and urea, by three strains of Karenia brevis grown under low light. Harmful Algae 8:770-780
Skipnes O, Eide I, Jensen A (1980) Cage culture turbidostat - a device for rapid-determination of algal growth-rate. Applied and Environmental Microbiology 40:318-325
Smayda TJ (1990) Novel and nuisance phytoplankton blooms in the Sea: Evidence for a global epidemic. In: Toxic Marine Phytoplankton, 4th International Conference. Elsevier, Amsterdam, p 29-40
Smayda TJ (2002) Adaptive ecology, growth strategies and the global bloom expansion of dinoflagellates. Journal of Oceanography 58:281-294
Smayda TJ, Reynolds CS (2001) Community assembly in marine phytoplankton: application of recent models to harmful dinoflagellate blooms. Journal of Plankton Research 23:447-461
Stoecker DK (1999) Mixotrophy among dinoflagellates. Journal of Eukaryotic Microbiology 46:397-401
Tango PJ, Magnien R, Butler W, Luckett C, Luckenbach M, Lacouture R, Poukish C (2005) Impacts and potential effects due to Prorocentrum minimum blooms in Chesapeake Bay. Harmful Algae 4:525-531
Tyler MA, Seliger HH (1978) Annual subsurface transport of a red tide dinoflagellate to its bloom area - water circulation patterns and organism distributions in Chesapeake Bay. Limnology and Oceanography 23:227-246
Van Dolah FM, Leighfield TA (1999) Diel phasing of the cell-cycle in the Florida red tide dinoflagellate, Gymnodinium breve. Journal of Phycology 35:1404-1411
Van Dolah FM, Leighfield TA, Sandel HD, Hsu CK (1995) Cell division in the dinoflagellate Gambierdiscus toxicus is phased to the diurnal cycle and accompanied by activation of the cell cycle regulatory protein, Cdc2 kinase. Journal of Phycology 31:395-400

160
Wang JH, Wu JY (2009) Occurrence and potential risks of harmful algal blooms in the East China Sea. Science of the Total Environment 407:4012-4021
Watson TG (1972) Present status and future prospects of turbidostat. Journal of Applied Chemistry and Biotechnology 22:229
Wheeler PA, Kirchman DL, Landry MR, Kokkinakis SA (1989) Diel periodicity in ammonium uptake and regeneration in the oceanic subarctic Pacific - implications for interactions in microbial food webs. Limnology and Oceanography 34:1025-1033
Wheeler PA, Olson RJ, Chisholm SW (1983) Effects of photocycles and periodic ammonium supply on 3 marine-phytoplankton species .2. ammonium uptake and assimilation. Journal of Phycology 19:528-533
Xu N, Duan SS, Li AF, Zhang CW, Cai ZP, Hu ZX (2010) Effects of temperature, salinity and irradiance on the growth of the harmful dinoflagellate Prorocentrum donghaiense Lu. Harmful Algae 9:13-17
Zhou M, Yan T, Zou J (2003) Preliminary analysis of the characteristics of red tide areas in Changjiang River estuary and its adjacent sea. Chinese Journal of Applied Ecology 14:1031-1038
Zhou W, Yin K, Zhu D (2006) Phytoplankton biomass and high frequency of Prorocentrum donghaiense harmful algal bloom in Zhoushan sea area in spring. Chinese Journal of Applied Ecology (In Chinese) 17:887-893

161
Table 4-1 Ambient nutrient concentrations in 4 different turbidistat systems supplied by medium at different DIN:DIP ratios.
Tables
Medium Enriched N:P Ratio
NO3-
µM-N NH4
+
µM-N Urea
µM-N DFAA µM-N
DIP µM-P
Culture DIN:DIP Ratio
5 1.95 0.05 1.18 0.063 0.57 3.5
16 0.37 1.05 3.14 0.011 0.11 12.5
40 21.98 3.59 2.09 0.038 1.17 21
200 42.4 2.52 2.05 1.123 0.15 300

162
Table 4-2 Calculated parameters of uptake kinetics of nitrogen sources (NH4+, urea, and glycine) by Prorocentrum minimum at different
ambient DIN:DIP ratio in turbidistat based on the Michaelis-Menten equation. Vmax and Amax are the specific nitrogen uptake and assimilation rates. Ks is the Michaelis constant where uptake rates equal to ½ of maximum uptake rates.
Culture DIN:DIP NH4+ Urea Glycine NH4
+ Urea Glycine Ratio Vmax Ks Vmax Ks Vmax Ks Amax Ks Amax Ks Amax Ks
3.5 0.031 0.20 5E-04 0.43 0.004 1.27
12.5 0.046 1.248 3E-04 0.052 0.004 0.48 0.024 2.32 7E-04 16.50 0.001 0.04
21 0.02 1.43 4E-04 2.63 0.001 0.10
300 0.065 4.646 8E-04 5.43 0.007 3.54 0.016 2.70 4E-04 1.56 0.003 3.39

163
Figures
00:00 12:00 00:00 12:00 00:00 12:00 00:00 12:00 00:00
Gro
wth
Rat
e pe
r H
our
-0.10
-0.05
0.00
0.05
0.10
0.15
Figure 4-1 Diurnal growth rates of Prorocentrum donghaiense in turbidistat system for 4 constant 12 h: 12 h light dark cycles (96 hrs). Each point stands for the growth rate calculated based on the change in the optical signals over a 20-minute time period.

164
P. minimum
0 2 4 6 8 10 12 14 16 18 20 22 24
Gro
wth
Rat
e pe
r H
our
-0.10
-0.05
0.00
0.05
0.10
0.15
P. donghaiense
0 2 4 6 8 10 12 14 16 18 20 22 24
Gro
wth
Rat
e pe
r ho
ur
-0.10
-0.05
0.00
0.05
0.10
0.15
Figure 4-2 a. Diurnal growth rates based on changes in optical signals of Prorocentrum minimum in turbidistat system at 14 h: 10 h light dark cycle. b. Diurnal growth rates of Prorocentrum donghaiense in turbidistat system at 14 h: 10 h light dark cycle. Box plots - line: median; box: 25th to 75th percentiles; whiskers: 10th and 90th percentiles; dots: outliers.

165
N:P ratio
3.5 12 21 300
Gro
wth
Rat
e pe
r H
our
0.00
0.01
0.02
0.03
0.04
0.05
0.06a. P. minimum
b. P. minimum
N:P ratio
3.5 12 21 300
Gro
wth
Rat
e pe
r H
our
0.00
0.01
0.02
0.03
0.04
0.05
0.06
Figure 4-3 a. Average growth rates of Prorocentrum minimum in a 14 h: 10 h light dark cycle at different ambient N:P ratios. b. Average growth rates of P. minimum in the light phase of 14h: 10h light dark cycle at different ambient N:P ratios.

166
00 06 12 18 00
Gro
wth
Rat
e pe
r H
our
-0.1
0.0
0.1
0.2
0.3a.
00 06 12 18 00
Gro
wth
Rat
e pe
r H
our
-0.1
0.0
0.1
0.2
0.3
b.
00 06 12 18 00
Gro
wth
Rat
e pe
r H
our
-0.1
0.0
0.1
0.2
0.3
c.
00 06 12 18 00
Gro
wth
Rat
e pe
r H
our
-0.1
0.0
0.1
0.2
0.3
d.
00 06 12 18 00
Gro
wth
Rat
e pe
r H
our
-0.1
0.0
0.1
0.2
0.3
e.
Figure 4-4 Diurnal (12 h: 12 h light dark cycle) growth rates based on changes in optical signals of Prorocentrum donghaiense in turbidistat systems at different light intensities. From 00 h to 00 h the next day, lights were on at 08 h and off at 20 h (X-axis). a. 500; b. 200; c. 66; d. 16; e. 5 (µmol photons m-2 sec-1). Each point stands for the growth rate calculated based on the change in the optical signals over a 20-minute time period.

167
Irradiance (mol photons m-2 sec-1)
0 100 200 300 400 500 600
Gro
wth
Rat
e pe
r H
our
-0.02
0.00
0.02
0.04
0.06
0.08
Figure 4-5 Average diurnal growth rates (●) and average growth rates based on changes in optical signals of Prorocentrum donghaiense in the light phase (○) in a 12 h: 12 h light dark cycle at different ambient light irradiance.

168
NO3-
Irradiance (mol photons m-2 s-1)
0 100 200 300 400 500
V p
er h
our
0.000
0.005
0.010
0.015
0.020
0.025DIN:DIP 3.5DIN:DIP 12.5DIN:DIP 21DIN:DIP 300
NH4+
Irradiance (mol photons m-2 s-1)
0 100 200 300 400 500
V p
er h
our
0.00
0.02
0.04
0.06
0.08
0.10
Urea
Irradiance (mol photons m-2 s-1)
0 100 200 300 400 500
V p
er h
our
0.0000
0.0002
0.0004
0.0006
0.0008
0.0010
Glycine
Irradiance (mol photons m-2 s-1)
0 100 200 300 400 500
V p
er
ho
ur
0.000
0.002
0.004
0.006
0.008
0.010
Figure 4-6 The relationship of N (Nitrate (NO3
-), ammonium (NH4+), urea and glycine) uptake
rates V (h-1) of Prorocentrum minimum at different irradiance levels (µmol photons m-2 sec-1) with different ambient DIN:DIP ratio treatments.
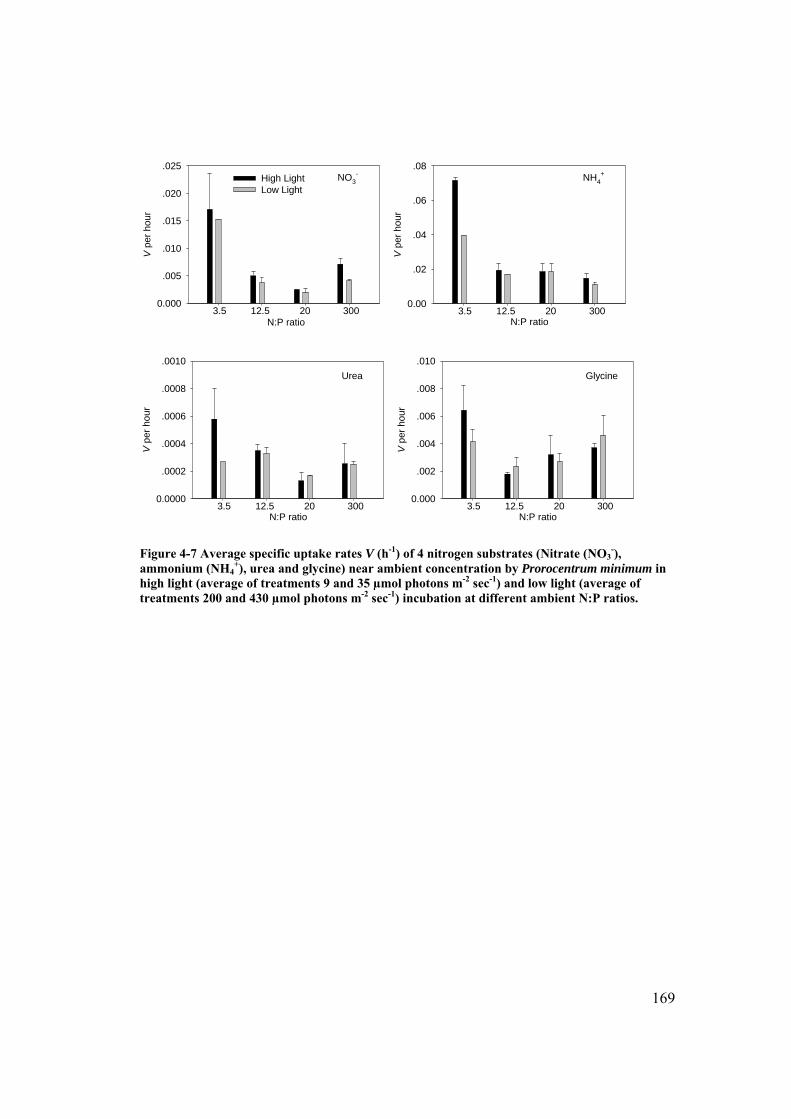
169
NO3-
N:P ratio
V p
er h
our
0.000
.005
.010
.015
.020
.025High LightLow Light
3.5 12.5 20 300
NH4+
N:P ratio
V p
er h
our
0.00
.02
.04
.06
.08
3.5 12.5 20 300
Urea
N:P ratio
V p
er h
our
0.0000
.0002
.0004
.0006
.0008
.0010
3.5 12.5 20 300
Glycine
N:P ratio
V p
er h
our
0.000
.002
.004
.006
.008
.010
3.5 12.5 20 300
Figure 4-7 Average specific uptake rates V (h-1) of 4 nitrogen substrates (Nitrate (NO3
-), ammonium (NH4
+), urea and glycine) near ambient concentration by Prorocentrum minimum in high light (average of treatments 9 and 35 µmol photons m-2 sec-1) and low light (average of treatments 200 and 430 µmol photons m-2 sec-1) incubation at different ambient N:P ratios.
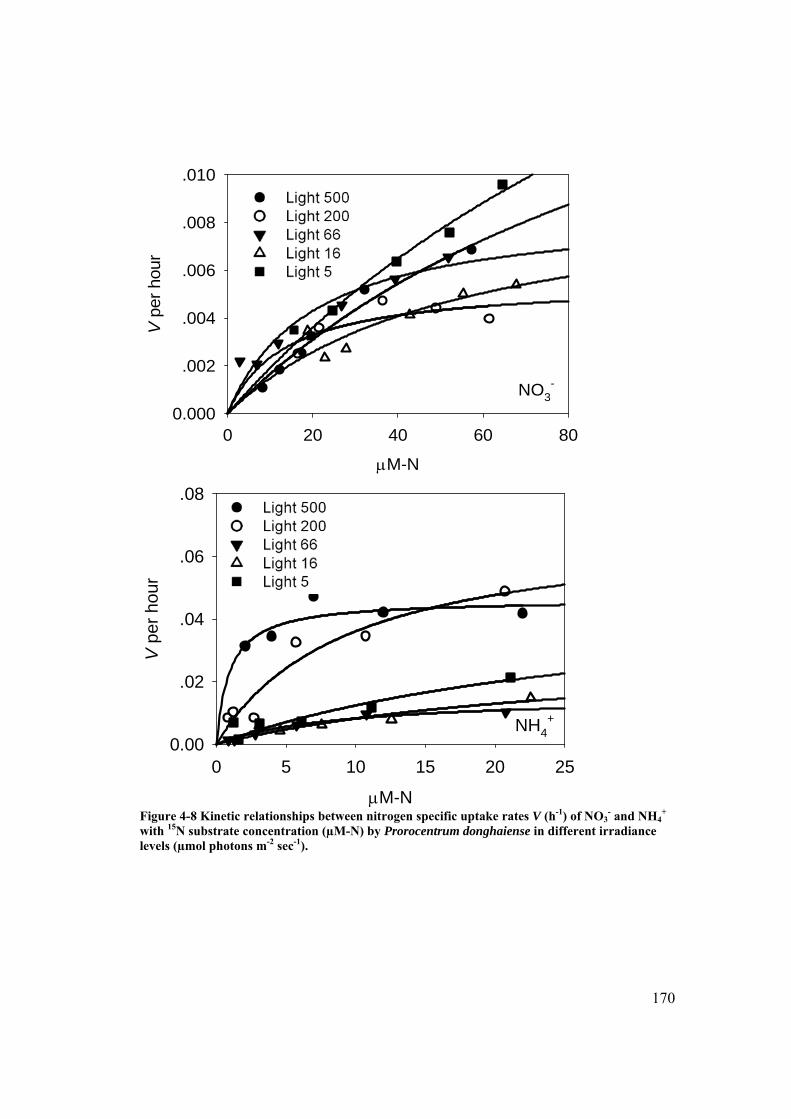
170
M-N
0 20 40 60 80
V p
er h
our
0.000
.002
.004
.006
.008
.010
NO3-
NH4+
M-N
0 5 10 15 20 25
V p
er h
our
0.00
.02
.04
.06
.08
Figure 4-8 Kinetic relationships between nitrogen specific uptake rates V (h-1) of NO3
- and NH4+
with 15N substrate concentration (µM-N) by Prorocentrum donghaiense in different irradiance levels (µmol photons m-2 sec-1).
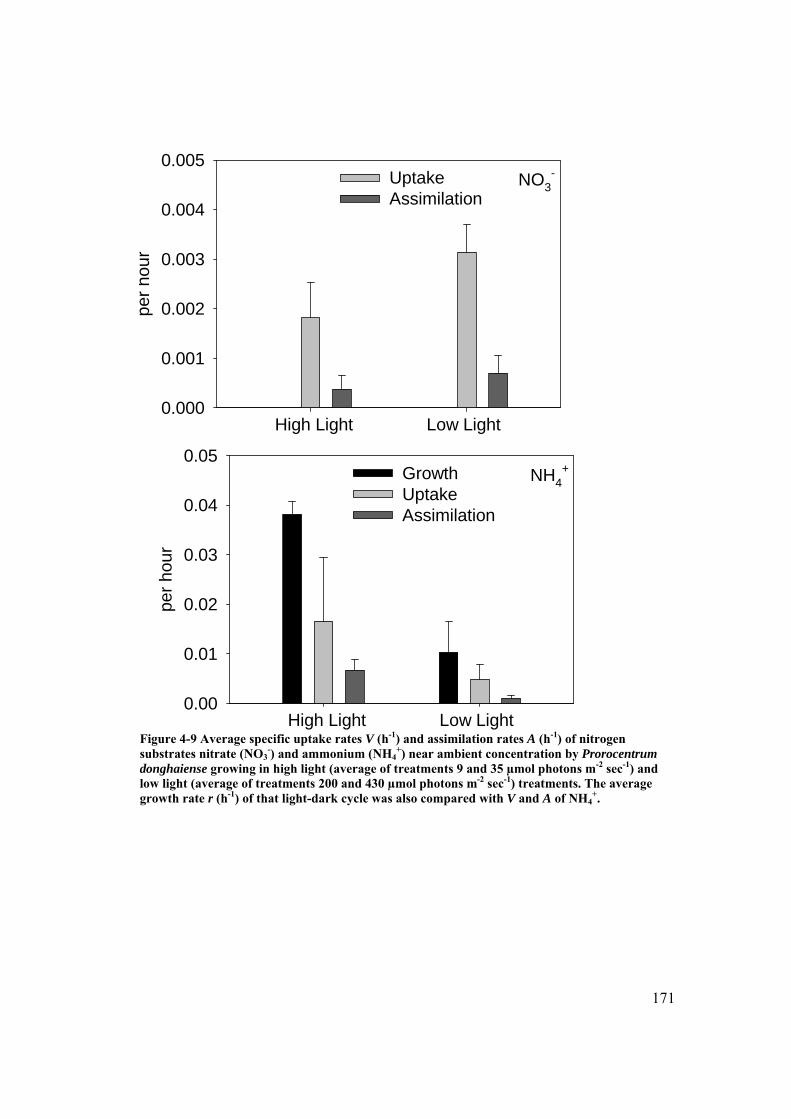
171
NO3-
per
hour
0.000
0.001
0.002
0.003
0.004
0.005UptakeAssimilation
High Light Low Light
NH4+
per
hour
0.00
0.01
0.02
0.03
0.04
0.05Growth UptakeAssimilation
High Light Low Light Figure 4-9 Average specific uptake rates V (h-1) and assimilation rates A (h-1) of nitrogen substrates nitrate (NO3
-) and ammonium (NH4+) near ambient concentration by Prorocentrum
donghaiense growing in high light (average of treatments 9 and 35 µmol photons m-2 sec-1) and low light (average of treatments 200 and 430 µmol photons m-2 sec-1) treatments. The average growth rate r (h-1) of that light-dark cycle was also compared with V and A of NH4
+.
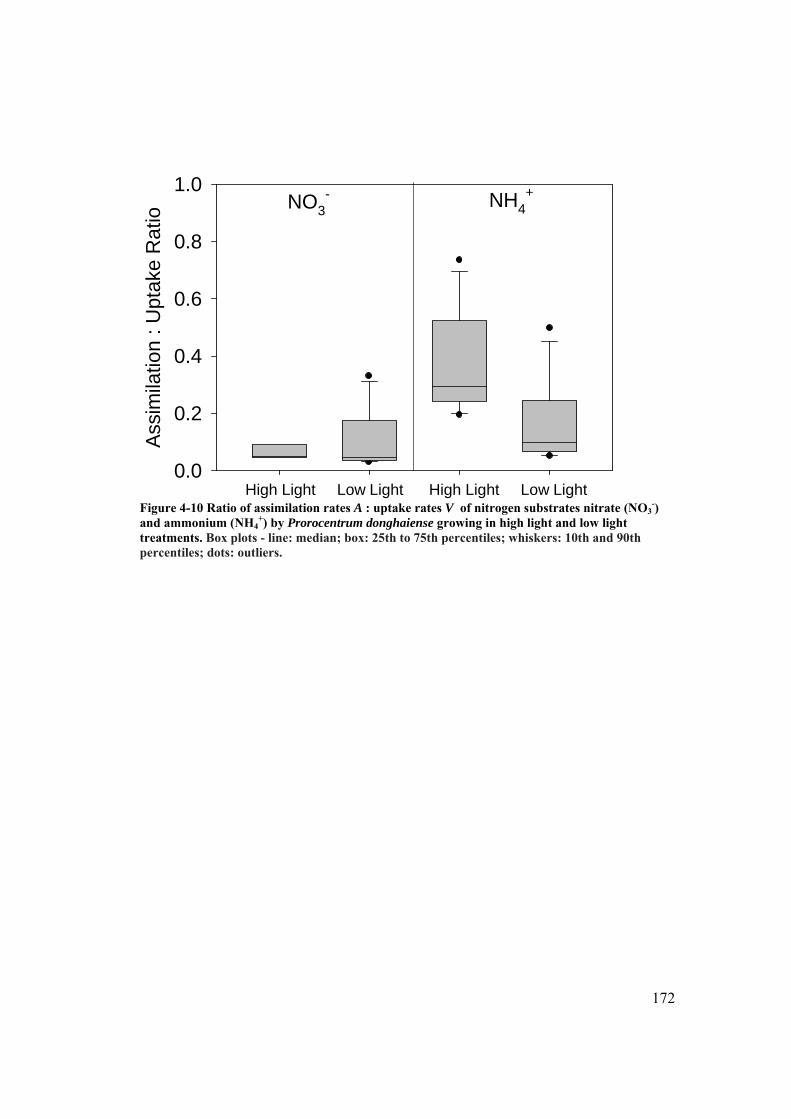
172
NO3-
Ass
imila
tion
: Upt
ake
Rat
io
0.0
0.2
0.4
0.6
0.8
1.0NH4
+
High Light Low Light High Light Low Light Figure 4-10 Ratio of assimilation rates A : uptake rates V of nitrogen substrates nitrate (NO3
-) and ammonium (NH4
+) by Prorocentrum donghaiense growing in high light and low light treatments. Box plots - line: median; box: 25th to 75th percentiles; whiskers: 10th and 90th percentiles; dots: outliers.

173
Chapter 5: Growth and Competition of Several Harmful
Dinoflagellates under Different Nutrient and Light
Condition
Abstract
Three near-shore type harmful dinoflagellates, Prorocentrum minimum, P.
donghaiense and Karlodinium veneficum, and one off-shore dinoflagellate, Karenia
brevis, were grown in laboratory monoculture and mixed batch cultures. The
dinoflagellate cultures were grown on treatments of two ambient nitrogen (N) :
phosphorus (P) ratios; two N substrates (nitrate and urea) and two light intensities.
The microalgae Rhodomonas and Synechococcus were also added in separate
treatments to the mixed culture treatments as potential food sources. All tested
species grew well on both N substrates. In mixed culture, P. minimum outgrew K.
veneficum, and P. donghaiense outgrew K. brevis in most treatments reaching higher
growth rates and higher biomass. However, when a third algal, Rhodomonas, was
added, the growth of P. minimum was inhibited relative to that of K. veneficum. In
contrast, when grown with K. brevis, the growth rate of P. donghaiense was not
significantly affected. K. brevis had a longer growth phase, and kept growing after P.
donghaiense reached stationary phase, suggesting better adaptation of K. brevis to
low inorganic nutrient conditions. The growth of K. brevis was also significantly
limited in the low light treatment. Karlodinium veneficum overgrew P. minimum with
the presence of Rhodomonas, a potential nutrient source. The growth of both K.
174
brevis and P. donghaiense were reduced with the presence of Synechococcus. Other
mechanisms (e.g. allelopathy), in addition to nutrient competition, should be
considered and may also play a role in determining the dominant species.
Introduction
Prorocentrum spp. are one of the major groups of bloom forming harmful
dinoflagellates that have been reported to develop harmful algal blooms (HABs) in
coastal waters worldwide, and to cause ecological damage by high biomass and to
have related effects (Heil et al. 2005, Glibert et al. 2008b). Prorocentrum minimum is
a common HAB species in coastal and estuarine systems in USA, and it is well
documented in the Chesapeake Bay and southwest Florida shelf among many other
parts of the world (Glibert et al. 2001, Tango et al. 2005, Heil et al. 2007, Glibert et
al. 2008b). In the past two decades, over 800 events of P. minimum with cell density
over 100, 000 cell L-1 were recorded in the Chesapeake Bay by the State of Maryland
Department of Natural Resources (MD DNR) monitoring program. Another
Prorocentrum species, P. donghaiense, is a major bloom species near the Changjiang
River estuary and in the coastal area of East China Sea. Large scale P. donghaiense
blooms have been observed in those waters in the past two decades (Zhou et al. 2006,
Li et al. 2009, Li et al. 2010).
Another HAB species, which is increasing in both frequency and abundance
in Chesapeake Bay, is Karlodinium veneficum. Karlodinium veneficum is a
potentially toxic dinoflagellate and has been implicated to cause fish kill events (Heil
et al. 2001, Deeds et al. 2002, Adolf et al. 2006a, Deeds et al. 2006). Both P.
minimum and K. veneficum are recognized as dominant late spring and summer

175
bloom species in the Chesapeake Bay area, and often co-occur (Glibert et al. 2001,
Tango et al. 2005). In the southwest Florida shelf, P. minimum has also been
recorded to bloom with Karenia brevis, a prevalent, potentially toxic dinoflagellate
(Heil et al. 2007, Vargo et al. 2008, Vargo 2009). In the East China Sea, the
dinoflagellate Karenia mikimotoi was reported to bloom just before or
contemporaneously with P. donghaiense blooms (Li et al. 2009). Thus, there are
numerous questions with regard to relative success of Prorocentrum species in the
presence of the competing dinoflagellates, Karlodinium or Karenia.
In all these cases, bloom areas were enriched by large terrestrial nutrient
inputs. The relationships between nutrient loading and bloom development are very
complex (Glibert et al. 2005a, Glibert and Burkholder 2006, Glibert et al. 2006,
Anderson et al. 2008, Glibert et al. 2008a). While dissolved inorganic nitrogen (DIN)
still is the major N sources enriched to the coastal systems, urea and other dissolved
organic N (DON) have became important N sources for many HAB species (Glibert
et al. 2004, Glibert et al. 2006, Heil et al. 2007, Li et al. 2009). The nutrient
composition might regulate the community composition of the blooms.
In addition to nutrient composition, the relative ambient N:P ratio may also
regulate the phytoplankton community composition and HAB development (Phillips
and Tanabe 1989, Hodgkiss and Ho 1997, Bulgakov and Levich 1999, Lagus et al.
2004). For P. minimum, P. donghaiense and K. brevis, the N:P ratio may not only
relate to the bloom distribution and biomass, but also may regulate dominant species
due to their differential nutrient uptake rates and preference (Fisher et al. 1992, Heil
et al. 2007, Li et al. 2009, Li et al. 2010). In both East China Sea and southwest

176
Florida shelf, the Prorocentrum spp. communities were observed to be associated
with DIN:DIP ratios that were slightly higher than the Redfield ratio (16), while the
Karenia spp. dominated communities were found in association with DIN:DIP ratios
that were below the Redfield ratio, but high DON:DOP ratio (>20), suggesting that
Karenia spp. in both environments may have been consuming the organic N source
(Heil et al. 2007, Li et al. 2009).
As an alternative nutrient strategy, mixotrophy, a combination of
phototrophic and phagotrophic nutrition, has been reported for P. minimum, P.
donghaiense, K. veneficum and K. brevis (Li et al. 1999, Stoecker 1999, Jeong et al.
2004, Jeong et al. 2005a, Adolf et al. 2007, Burkholder et al. 2008, Glibert et al.
2009, Jeong et al. 2010). Phagotrophy may provide mixotrophic dinoflagellates a
source of nutrients and/or carbon from other organisms that supplement that which
they assimilate from the water. Some dinoflagellates (e. g. K. veneficum and K.
brevis) approach a higher maximum growth rate when growing mixotrophically
(Adolf et al. 2006b, Glibert et al. 2009). Therefore, phagotrophy of dinoflagellates
could serve as a competition strategy during nutrient limitation and could be a means
of sustaining the growth of mixotrophic dinoflagellates. Mixotrophic activity may
play a substantial role in sustaining blooms (Glibert et al. 2009). Dinoflagellates feed
on a wide range of food sources, including other algae, bacteria, and organic particles
(Burkholder et al. 2008). In estuaries with high terrestrial input, organic particles and
their primary decomposers, heterotrophic bacteria, could be important food sources
for mixotrophic dinoflagellates.
177
The effects of various nutrient sources and growth conditions on the growth
competition of P. minimum, P. donghaiense, K. veneficum and K. brevis singly and in
combination were tested in the present study. The factors tested included different
type of N sources (nitrate and urea), different ambient N:P ratios (12 and 145),
different light availability (50 and 300 µmol photons m-2 s-2) and the potential of
mixotrophic food sources. The euryhaline cryptophyte, Rhodomonas, and
cyanobacteria, Synechococcus, were grown with the dinoflagellates as potential food
sources to test their contribution as a nutrient source in sustaining the growth of the
dinoflagellates.
Materials and Methods
Algae Cultures and Methods of Growth
Cultures of Prorocentrum minimum were isolated from Choptank River, a
tributary of Chesapeake Bay in spring 1995 and were maintained in f/2 medium in the
Horn Point Laboratory culture collection. Cultures of Prorocentrum donghaiense
were obtained from University of Connecticut Department of Marine Sciences, USA.
These cultures were originally isolated from the East China Sea. Cultures of
Karlodinium veneficum, Karenia brevis (CCMP 2229), Rhodomonas and
Synechococcus (CCMP 1768) were obtained from the Provasoli-Guillard National
Culture Collection, Bigelow Laboratory for Ocean Sciences, Maine, USA. The K.
brevis strain was originally isolated from Manasota Key, Florida. Synechococcus
strain CCMP1768 was originally isolated from the Gulf of Mexico. All the cultures in
the present study were unialgal, but not axenic.

178
The P. minimum and K. veneficum cultures were grown in modified f/2 media
at a salinity of 12; P. donghaiense and K. brevis cultures were grown in modified f/2
media at a salinity of 30. The N and P source concentration varied with the
experiments, as described below. Maintenance cultures were grown at 22 ˚C and on a
12 h light: 12 h dark cycle in a walk-in temperature-controlled incubator. The
seawater used in media preparation was artificial seawater. Fluorescent lights were set
to provide a range of light intensities, which varied by experiments. Cultures were not
axenic, but aseptic techniques were used to minimize additional bacterial
contamination during the growth periods.
Experimental Design
Experiment 1: Phototrophic growth of P. minimum and K. veneficum monoculture
with NO3- or urea at high or low light levels and 2 N:P ratios.
Prorocentrum minimum and K. veneficum were diluted by fresh media at
salinity of 12 to a final concentration of ~1.0 × 10⁴ cells ml-1 for each species.
Monocultures were grown in triplicate 50 ml glass cuvettes with the N substrate as
NO3- or urea and P substrate as PO4
3- at two N:P ratios (12 and 145) and two light
intensities (50 and 300 µmol photons m-2 s-2). One set of cultures was enriched to a
final nutrient concentrations of 42.8 µM-N and 3.56 µM-P to reach an N:P ratio of
12, and the other set was enriched to 224.9 µM-N and 1.55 µM-P to reach the N:P
ratio of 145.
Experiment 2: Phototrophic growth competition between P. minimum and K.
veneficum with NO3- or urea at high or low light levels and 2 N:P ratios.
179
Prorocentrum minimum and K. veneficum were mixed and diluted by fresh
media at a salinity of 12 to a final concentration of ~1.0 × 10⁴ cells ml-1 for each
species. Cells were grown in duplicate 1.5 L glass bottles with two N substrates (NO3-
and urea) at two N:P ratios (12 and 145) and two light intensities (50 and 300 µmol
photons m-2 s-2). Nutrients were added as in experiment 1. All bottles were gently
bubbled with air to keep the culture well mixed and aerated.
Experiment 3: Phototrophic/ mixotrophic growth competition between P. minimum
and K. veneficum with Rhodomonas as potential prey, and with NO3- or urea at high
or low light levels and 2 N:P ratios.
Prorocentrum minimum and K. veneficum were mixed and diluted by fresh
media at a salinity of 12 to a final concentration of ~2.5 × 10⁴ cells ml-1 for each
species. Rhodomonas were also added at a final concentration of ~7.5 × 10⁴ cells ml-
1. Cells were grown in duplicate 1.5 L glass bottles with NO3- at two N:P ratios (12
and 145) and two light intensities (50 and 300 µmol photons m-2 s-2). Nutrients were
added as in experiment 1. All bottles were gently bubbled with air to keep the culture
well mixed and aerated.
Experiment 4: Phototrophic growth of P. donghaiense and K. brevis with NO3- or
urea at high or low light levels and 2 N:P ratios.
Prorocentrum donghaiense and K. brevis were diluted by fresh media at
salinity of 30 to a final concentration of ~1.0 × 10³ cells ml-1 for each species.
Monocultures were grown in triplicate 50 ml glass cuvettes with two substrates (NO3-
and urea) at two N:P ratios (12 and 145) and two light intensities (50 and 300 µmol
photons m-2 s-2 ). Nutrients were added as in experiment 1.

180
Experiment 5: Phototrophic growth competition between P. donghaiense and K.
brevis with NO3- or urea at high or low light levels and 2 N:P ratios.
Prorocentrum donghaiense and K. brevis were mixed and diluted by fresh
media at salinity of 30 to a final concentration of ~1.0 × 10³ cells ml-1. Cells were
grown in duplicate 1.5 L glass bottles with 2 N substrates (NO3- and urea), at two N:P
ratios (15.5 and 145) and two light intensities (50 and 300 µmol photons m-2 s-2).
Nutrients were added as in experiment 1. All bottles were gently bubbled with air to
keep the culture well mixed and aerated.
Experiment 6: Phototrophic growth competition between P. donghaiense and K.
brevis with Synechococcus as potential prey, and with NO3- or urea at high or low
light levels and 2 N:P ratios.
Prorocentrum donghaiense and K. brevis were mixed and diluted by fresh
media at salinity of 30 to a final concentration of ~1.0 × 10³ cells ml-1. Synechococcus
were also added at a final concentration of ~7.5 × 10⁴ cells L-1. Cells were grown in
duplicate 1.5 L glass bottles with two forms of N sources (NO3- and urea), at two N:P
ratios (15.5 and 145) and two light intensities (50 and 300 µmol photons m-2 s-2).
Nutrients were added as in experiment 1. All bottles were gently bubbled with air to
keep the culture well mixed and aerated.
Analytical Protocols
The growth of each dinoflagellate monoculture was tracked by the change of
its fluorescence using a TD-700 Fluorometer. The growth of mixed dinoflagellates
and Rhodomonas in the mixed culture was tracked by optical microscopy. On an
approximate daily basis, 7 ml of culture were sampled from each bottle and fixed
181
with Lugol's solution for cell counting. The cell densities of Synechococcus were also
measured on a daily basis. To do so, fresh culture was added to a quartzose cuvette
and the fluorescence emission of 560 nm was recorded on a Jobin Yvon Fluoro Max-
3 spectrofluorometer according to Glibert et al. (2009). The results were calibrated by
microscopy cell counting.
Data Analysis and Simulation
Statistical comparisons between groups and treatments were compared and
analyzed using ANOVA and t-tests. All comparisons were made at a significance
level of 0.05.
The exponential growth rates of each culture in the early stage of the growth
phase were determined with Sigmaplot software (Systat Software, Inc.) by the
equation:
(1)
where µ is the specific growth rate (d-1); N0 is the initial cell density (cells ml-1); N(t)
is the cell density at time t. Herein, only the cell densities of the early exponential
phase were used for the growth rate regression to estimate the exponential growth
rate.
Results
Experiment 1
Prorocentrum minimum monocultures in NO3- media grew for about 3 weeks
before reaching the stationary phase, except for the treatment with low light and high
0( ) tN t N e

182
N:P ratio, which started to decrease in 2 weeks (Fig. 5-1 a). The growth rates were in
the range of 0.44 day-1 to 0.49 day-1 (Table 5-1) in high light, which were
significantly higher than the rates (~0.25 day-1) in low light (p<0.001). There was no
significant difference between growth rates with low and high N:P ratio treatments.
The P. minimum monocultures in urea media had a long lag phase, and rapid growth
started after one week of incubation and only lasted for a week, with a growth rate
about 0.39 day-1 in the high light treatment. In low light, exponential growth lasted
about 2 weeks; however, the growth rates (~0.24 day-1) were significantly lower than
those at high light (Fig. 5-1 b). There was no significant difference between growth
rates with low and high N:P ratio treatments.
Karlodinium veneficum monocultures in NO3- media also grew exponentially
for more than 3 weeks, except for the treatments with low light and high N:P ratio,
which started to decrease at day 18 (Fig. 5-1 c.). The growth rates were about 0.32
day-1 in high light, significantly higher than those in low light (0.19 day-1, p=0.004).
There was no significant difference in growth rates between the low and high N:P
ratio treatments. In NO3- media, the growth rates of P. minimum were significantly
higher than K. veneficum for all treatments (p<0.05). The K. veneficum monoculture
in urea media also had a long lag phase, and growth started after over one week of
incubation and only lasted for a week at a growth rate of ~ 0.24 day-1 in high light
treatment, and 0.16 day-1 in low light (Fig. 5-1 d.). There was no significant
difference between growth rates with low and high N:P ratio treatments.

183
Experiment 2
Prorocentrum minimum biomass in the mixed culture increased in the low
N:P ratio treatment for about 10 days (Fig. 5-2), while exponential growth lasted
more than 20 days in the high N:P ratio in low light. The growth rates in the low N:P
ratio treatment were in the range of 0.17 day-1 to 0.27 day-1 (Table 5-2). The growth
rates in the high N:P ratio treatment were in the range of 0.23 day-1 to 0.33 day-1,
which were significantly higher than those of the low N:P ratio treatment (p<0.001).
There was no significant difference between the P. minimum growth rates at high
light and low light treatments. Prorocentrum minimum grown in urea media in low
light had significantly higher growth rates than the comparable cultures growing on
NO3- (p<0.05). The exponential growth phase of K. veneficum in the mixed culture
lasted from a week to 10 days. The growth rates of K. veneficum were in the range of
0.06 day-1 to 0.28 day-1. However, the difference among growth rates of K. veneficum
was not significant among all treatments. The growth rates of K. veneficum were
significantly lower than those of P. minimum (p<0.001). As a result of a longer period
of exponential growth and faster growth rates, P. minimum reached significantly
higher cell densities than K. veneficum in most treatments, except for the culture in
urea at a N:P ratio of 12 in high light. Neither species grew well in the urea treatment
in high light.
Experiment 3
With the addition of Rhodomonas, the growth rate of P. minimum was very
low, only ~ 0.04 day-1, in high light (Table 5-3), and no significant growth was
observed in low light. The growth rate of K. veneficum was only ~ 0.085 day-1, and no

184
significant difference in growth rates was observed between light or N:P ratio
treatments. The increase in biomass for both species only lasted 4-5 days. However,
K. veneficum outgrew P. minimum. The cell densities of Rhodomonas decreased over
50% during first 2-3 days and were subsequently held at < 5% of the initial densities
(Fig. 5-3). There were no significant differences of growth rates among different
treatments for each species.
Experiment 4
Prorocentrum donghaiense in monoculture grew exponentially for about 20
days before reaching the stationary phase, except for the treatments in high N:P ratio,
which started to decrease in 10 days (Fig. 5-4). The highest growth rates were 0.37
day-1 in NO3- media at low N:P ratio and high light (Table 5-4). The lowest growth
rates were 0.16 day-1 in NO3- media at low N:P ratio and low light, but the high and
low light growth rates were not significantly different. The growth rates in the low
N:P ratio media were significantly higher than those in high N:P ratio media in high
light (p<0.001). The growth rates on urea were significantly higher than those in NO3-
media in low light (p<0.001). Karenia brevis biomass in monoculture increased for
about 10 days in high light, then started to decrease. However, K. brevis in low light
kept increasing during the entire study (Fig. 5-4). The growth rates in high light were
in the range of 0.22 day-1 to 0.28 day-1. The growth rates in low light were in the
range of 0.08 day-1 to 0.14 day-1, and were significantly lower than those in high light
(p<0.001). There were no significant differences in growth rates between the low and
high N:P ratio treatments. In monoculture, the growth rates of P. donghaiense were
significantly higher than K. brevis for all treatments (p=0.015).

185
Experiment 5
In high light, Prorocentrum donghaiense growth rates were in the range of
0.30 day-1 to 0.38 day-1 (Table 5-5). P. donghaiense biomass in the mixed culture kept
increasing at high light for about 7-10 days, and reached cell densities of ~ 40, 000
cell ml-1 (Fig. 5-5). Karenia brevis growth rates were in the range of 0.17 day-1 to 0.25
day-1in high light, and reached cell densities of ~ 20, 000 cell ml-1. However, at low
light, P. donghaiense grew in the range of 0.12 day-1 to 0.23 day-1, and the growth
lasted longer and reached maximal cell densities of ~ 80, 000 cell ml-1. Karenia
brevis only grew at 0.025 day-1 or lower, and only reached cell densities of ~ 4, 000
cell ml-1. Both species grew significantly faster in high light than low light (p<0.01).
There were no significant differences between NO3- and urea treatments. The growth
rates of P. donghaiense were significantly higher than K. brevis (p=0.004).
Experiment 6
In experiments 6 with addition of Synechococcus, the growth rates of P.
donghaiense in high light were in the range of 0.36 day-1 to 0.39 day-1, which were
significant higher than rates in low light (0.14 day-1, p=0.001). The growth rates of K.
brevis at low light were in the range of 0.019 day-1 to 0.055 day-1. The growth rates in
high light were about 0.17 day-1, which were significantly higher than those at low
light (p<0.001). The growth rates of P. donghaiense were significantly higher than K.
brevis (p<0.05). The Synechococcus growth rates were about 0.32 day-1 in high light
and 0.06 day-1 in low light. Synechococcus grew exponentially for a week before it
decreased at high light, but it continued growing at low light (Fig. 5-6).
186
Discussion
Growth Rate
Numerous studies have been conducted on the four dinoflagellate species
studied herein. The growth rates in the present study were compared with previous
work (Table 5-7).The growth rates of P. minimum monocultures (0.23-0.46 day-1) in
this study were within the range of the previous work, which mostly were in the range
of 0.13 to 1 day-1 except for one report of rates reaching 3.54 day-1 (Smayda 1996).
The growth rates of P. minimum in mixed culture with K. veneficum (0.17-0.32 day-1)
fell in the lower range of previous work, and the growth rates of P. minimum in
cultures mixed with K. veneficum and Rhodomonas (<0.05 day-1) were lower than
previous results. The growth rates of K. veneficum monoculture (0.19-0.33 day-1) in
this study were within the range of the previous work (< 0.75 day-1, Table 5-7). The
growth rates of K. veneficum in mixed culture with P. minimum (0.06-0.28 day-1)
were also in the in the range of previous work, and the growth rates of K. veneficum
with P. minimum and Rhodomonas (<0.09 day-1) were in the lower range of previous
results. The growth rates of P. donghaiense were in the range of 0.12-0.39 day-1,
which were within the range of the previous work (0.1-0.78 day-1). There was only
one report of growth rates reaching 1.40 day-1 (Wang and Tang 2008). The growth
rates of K. brevis monoculture (0.08-0.28 day-1) in this study were within the range of
the previous work (0-0.36 day-1, Table 5-7). The growth rates of K. brevis in mixed
culture with P. donghaiense (0.0-0.26 day-1) were in also in the range of previous
work, and the growth rates of K. brevis with P. donghaiense and Synechococcus
(0.02-0.15day-1) were in the lower range of previous results.

187
Dinoflagellates are one of the major groups of algae causing HABs in coastal
waters. Smayda suggested that dinoflagellates have diverse habitat preferences and
adaptive strategies. He characterized the dinoflagellate bloom species in coastal areas
as 5 types, which fit to a nutrient-turbulence matrix (Smayda and Reynolds 2001,
Smayda 2002). Each dinoflagellate species had its specific niche for bloom
expansion, and the niches were described by available nutrients and
turbulence/mixing intensities. In Smayda’s model, small, rapidly growing species
(e.g. Prorocentrum spp.) are better competitors in near-shore regions. Conversely,
relative slower growing, larger, motile species (e.g. Karenia spp.) are better suited to
off-shore regions. The near-shore regions are generally considered nutrient rich but
with high turbidity, while light might be the limiting factor for the phytoplankton.
The off-shore regions are generally considered to have relatively low nutrients but
with higher light availability. These two groups of algae have different adaptive
strategies to the environment. Therefore, not only are the nutrient preferences but also
light adaptation strategies of these two general genera of algae potentially differ.
In this study, the growth and competition between the near-shore
dinoflagellates (P. minimum and K. veneficum) and between near-shore and off-shore
species (P. donghaiense and K. brevis) were tested under different ambient
conditions, including variable nutrient conditions and light intensities. The two near-
shore dinoflagellate species, P. minimum and P. donghaiense, both had higher growth
rates in monoculture than their competitors in this study. When grown with K.
veneficum, the average growth rates of P. minimum were inhibited to about 40% of
the rates observed in monocultures. After adding Rhodomonas, K. veneficum outgrew
188
P. minimum, and reached higher cell densities than P. minimum. However, when
grown with a different type (off-shore) of dinoflagellate, K. brevis, the growth rate of
P. donghaiense was not significantly affected. Although K. brevis grew slower than
P. donghaiense, they still reached similar cell densities in mixed culture in high light
treatment. K. brevis had a longer growth phase, and kept growing after P.
donghaiense reached stationary phase, suggesting better adaptation of K. brevis to
low inorganic nutrient conditions. The growth of K. brevis was mostly limited by the
low light treatment of the four species. This off-shore species only had an advantage
at low ambient inorganic nutrient condition, and appeared to be more limited by light.
Nutrient Strategy – Autotrophy and Mixotrophy
All four tested dinoflagellates have developed HABs in eutrophic estuarine
and marine coastal waters. The increase of many HABs has been suggested to
correspond with high nutrient loading (Glibert et al. 2001, Anderson et al. 2002,
Glibert et al. 2005a). Dissolved inorganic nitrogen forms (DIN, i.e., NO3-, NH4
+) are
generally considered the principal N sources for phytoplankton. Diatoms are often
found to use NO3- at low temperatures and to develop blooms in the early spring
(Lomas and Glibert 1999a, b). Spring blooms also deplete the NO3- in the ambient
water in coastal systems, as often seen in the Changjiang River estuary (Li et al. 2009,
Li et al. 2010), and the Chesapeake Bay (Jordan et al. 1991, Fisher et al. 1992, Glibert
et al. 1995). Although the NO3-concentration decreases after the spring blooms, it is
still an important N source, and it has been widely used as N source in the media in
the culture experiments (Guillard and Ryther 1962).
189
The succession of dominant phytoplankton assemblages in eutrophic waters
has been associated with shifts in nutrient supply ratios, especially decreased
DIN:DIP ratios that reflect regional disproportionate P loading relative to N, which
relates to anthropogenic and regenerated inorganic sources (Suttle and Harrison 1988,
Jordan et al. 1991, Koerselman and Meuleman 1996, Bulgakov and Levich 1999,
Stelzer and Lamberti 2001, Heil et al. 2007, Vrede et al. 2009). All four tested
dinoflagellates have been documented to bloom in relatively lower DIN:DIP ratio
waters (close to the Redfield ratio) than diatom blooms (Jordan et al. 1991, Heil et al.
2007, Li et al. 2009).
For dinoflagellates, another important N source is dissolved organic nitrogen
(DON), which may represent 14 - 90% of the total N in lower river estuaries from
natural and anthropogenic sources (Glibert et al. 1991, Seitzinger et al. 2002, Glibert
et al. 2004). DON may also represent an important N source for phytoplankton in
eutrophic coastal waters (Bronk et al. 2004, Glibert et al. 2004, Wiegner et al. 2006,
Heil et al. 2007, Li et al. 2010). Urea has become a very important DON source
because of its accelerated global use, which has increased more than 100-fold in the
past 4 decades and contributes > 50% of global nitrogenous fertilizer usage (Glibert et
al. 2006). Urea is increasingly found to be an important N nutrient source for HAB
species and is positively correlated to some blooms (Glibert et al. 2004, Glibert et al.
2005b, Glibert et al. 2006). In Chesapeake Bay tributaries, high concentrations of
urea (> 10 µM-N) have been observed frequently, generally in late spring when urea
or poultry manure is applied to winter wheat and corn; this is also the time when high
frequent P. minimum blooms have been recorded (Glibert et al. 2005b). P. minimum

190
have been observed to follow heavy rainfall and fertilizer application which result in
short term increases of urea in the water column (Glibert et al. 2001). Urea can be
directly taken up by the dinoflagellates. A high affinity of P. minimum for urea has
previously been found (Fan et al. 2003). In the Western Florida Shelf, urea
concentrations were also significantly greater over the entire region adjacent to the
mouths of both the Shark and Caloosahatchee Rivers after hurricane flooding (Heil et
al. 2007). In the East China Sea, urea contributed to over 20% of reduced N (NH4+,
urea and glycine) uptake during the K. brevis and P. donghaiense bloom progression.
Urea has also been reported to increased toxicity in some harmful algae. Toxigenic
Pseudo-nitzschia australis assemblages have also been shown to double toxin
production when grown on urea compared to growth on NO3- and NH4
+ (Howard et
al. 2007). K. brevis in culture was observed to increase in toxin content up to 6-fold
after enrichment with urea compared to treatments without urea enrichment (Shimizu
et al. 1995).
All four tested dinoflagellates have been reported to have mixotrophic abilities
as a mechanism to supplement nutrient supplies (Jeong et al. 2005a, Stoecker et al.
2006, Burkholder et al. 2008, Jeong et al. 2010). This mechanism is suggested to be
important in nutrient acquisition and growth of these species for the development and
maintenance of their blooms in eutrophic waters (Burkholder et al. 2008). Although
the high frequent bloom areas of these tested dinoflagellates have variable nutrient
loads and concentrations, dissolved forms of nutrients still can be limiting factors in
bloom progression, due to high biomass of the algae and the disproportionate nature
of nutrient supply (e.g. very high DIN:DIP ratio). Light deficiency is also considered
191
common in eutrophic systems, especially in shallow water and estuarine systems,
where algal blooms, sediment from river input, precipitation, wind/river mixing
process and other disturbance can cause limiting light availability for the
phytoplankton (Hecky and Kilham 1988, Cloern and Jassby 2010). These low light
and/or nutrient deficiency habitats may promote the mixotrophy of algae. Mixotrophy
might be triggered by nutrient limitation (Granéli et al. 1999), light limitation (Caron
et al. 1993, Jones et al. 1995), or high prey densities (Sanders et al. 1990).
Stoecker (1998) proposed three physiological types of protistan mixotrophs:
Type I - ‘‘ideal’’ mixotrophs that can use phototrophy and phagotrophy equally well;
Type II - predominantly phototrophic algae, which included many of the harmful
algae in eutrophic estuarine and coastal waters; and Type III - predominantly
heterotrophic algae. The four tested dinoflagellates are generally considered type II
algae. Many Type II species become mixotrophic when DIN and/or DIP become
limiting, and their feeding rates can be directly related to available light (Stoecker
1998, 1999, Li et al. 2000).
Prorocentrum minimum can not only consume DON sources via osmotrophy
(Fan et al. 2003, Heil et al. 2005, Solomon and Glibert 2008), but also has been
reported to ingest cyanobacteria and cryptophytes, including Rhodomonas salina
(Stoecker et al. 1997, Jeong et al. 2005a, Jeong et al. 2005b, Jeong et al. 2010).
Mixotrophy by P. minimum was found to be higher in spring than the summer in the
Chesapeake Bay, when ingestion of cryptophytes was observed in over 50% of the
cells in natural assemblages (Stoecker et al. 1997). But, ingestion was low when the
cryptophyte densities were high. Ingestion was also inhibited after nutrient

192
enrichment (DIN or DIP), suggesting it a mechanism for obtaining organic nutrients
rather than organic carbon (Stoecker et al. 1997).
Karlodinium veneficum also takes up urea to support growth, and can ingest
eubacteria and cryptophytes Rhodomonas salina (Nygaard and Tobiesen 1993, Li et
al. 1996, Li et al. 1999, Li et al. 2000, Adolf et al. 2003, Adolf et al. 2006a, Adolf et
al. 2007, Adolf et al. 2008). Growth rates of mixotrophic K. veneficum (0.52 - 0.75
day-1) have been found to be comparable to or greater than maximum growth rate in
phototrophic mode (0.55 day-1) (Adolf et al. 2006b). Phagotrophy of K. veneficum has
been intensively studied in Chesapeake Bay (Li et al. 1996, Li et al. 1999, Li et al.
2000, Adolf et al. 2003, Adolf et al. 2006a, Adolf et al. 2007, Adolf et al. 2008).
From field and laboratory data, phagotrophy of K. veneficum was positively
correlated with prey density, and negatively correlated with depth, salinity, and PO43-
concentration (Li et al. 2000). N and/or P deficiency, or N:P ratios that were
substantially higher or lower than the optimum N:P ratio (~10), increased
phagotrophic activity, suggesting feeding as a supplement for major nutrients (N, P)
(Li et al., 2000). Phagotrophic activity might also supplement organic carbon sources
or assist in acquiring trace growth factors (Li et al., 2000).
Prorocentrum donghaiense also has been shown to ingest cyanobacteria,
cryptophytes and other dinoflagellates (P. minimum) (Jeong et al. 2005a, Jeong et al.
2010). In low ambient light (20 µmol photons m-2 sec-1), mixotrophic P. donghaiense
reached higher maximum growth rate (0.051 day-1) by feeding on cryptophytes than
in autotrophic mode (0.038 day-1) (Jeong et al. 2004, Jeong et al. 2005b).
193
Karenia brevis has been shown to take up DON from Trichodesmium blooms
(Mulholland et al. 2006), and also urea to support growth (Glibert et al. 2009). K.
brevis can ingest cyanobacteria Synechococcus (Jeong et al. 2005b, Glibert et al.
2009). K. brevis was observed grazing on Synechococcus at higher rate in low light
(43 µmol photons m-2 sec-1) when N-depleted (Glibert et al. 2009).
In the present study, the four tested dinoflagellates were grown on treatments
which promoted different growth strategies, from autotrophic growth on NO3- at high
light, to osmotrophic growth on urea and mixotrophic growth on eukaryote prey, the
co-cultured dinoflagellate, or phagotrophic growth on the prey, Rhodomonas or
Synechococcus. The initial ambient nutrients were replete. There were no significant
differences of the growth rate among the monocultures growing on NO3- and urea. A
significant light limitation on the growth rate was observed. All four species could
use these dissolved N sources well. When two dinoflagellates were grown together,
the growth of P. minimum and K. veneficum were both inhibited in high light, while
only the growth of K. brevis was inhibited when P. donghaiense was co-cultured.
After adding the Rhodomonas or Synechococcus, the cell densities of these potential
food sources either decreased at the beginning of the incubation or decreased when
the culture became more nutrient limited. The tested dinoflagellates could feed on the
prey, however, the competition between two dinoflagellates is more complicated and
needs further experimental study.
Both P. minimum and K. veneficum have been documented to bloom in the
Chesapeake Bay (Deeds et al. 2002, Glibert and Magnien 2004, Goshorn et al. 2004).
Prorocentrum minimum generally blooms in the late spring and early summer, when
194
ambient water N:P ratios are higher than the Redfield ratio, suggesting P limitation
(Fisher et al. 1992, Tango et al. 2005, Ptacnik et al. 2010). Prorocentrum minimum
outgrew K. veneficum in relative N-rich natural water, which was consistent with the
present study. In contrast, K. veneficum generally develops more blooms in the later
summer and autumn (Li et al. 2000, Glibert and Magnien 2004), when ambient
inorganic N is depleted, and ambient N:P ratios are lower than the Redfield ratio,
suggesting N limitation (Fisher et al. 1992, Ptacnik et al. 2010). High cryptophyte
abundance has been suggested to trigger K. veneficum blooms (Adolf et al. 2008).
Mixotrophic K. veneficum may feed on the cryptophyte as an N source. Herein, in the
experiments simulating this condition, K. veneficum outgrew P. minimum after
enrichment with Rhodomonas.
In the East China Sea, P. donghaiense has been the dominant bloom forming
dinoflagellate in recent years, even when the off-shore type species Karenia
mikimotoi and Alexandrium tamarense have been documented to mix with the P.
donghaiense (Zhou et al. 2006, Li et al. 2009). The only recent exception to this
pattern was in 2005, when K. mikimotoi developed blooms before the P. donghaiense
in the East China Sea. However, P. donghaiense still outgrew K. mikimotoi in
approximately two weeks (Li et al. 2009). Herein, Prorocentrum donghaiense also
outgrew the off-shore type K. brevis in present study.
In summary, dinoflagellates have multiple nutrient strategies to grow in
coastal waters, which depend on the nutrients and light availabilities. The
dinoflagellate species in present study have slightly different nutrient strategies,
which may drive the results of the growth competition. The effectiveness of utilizing

195
dissolved organic nutrients and prey appears to play important roles in determining
the competition between P. minimum and K. veneficum. It may be advantageous for
K. brevis to feed on Rhodomonas, but this needs further direct study. The growth of
off-shore type species K. brevis was mostly limited by the low light treatments.
However, K. brevis had longer growth phase, and kept growing after P. donghaiense
reached stationary phase, suggesting better adaptation of K. brevis to low nutrient (or
nutrient depleted) condition, because of its greater mixotrophic tendencies. The
laboratory experiment results were consistent with the field observation in waters
where the blooms of these species were documented. It must be noted, however, that
these experiments were still conducted in relatively nutrient-replete media, and the N
and P nutrients concentrations may not be limiting factors in the early growth phase.
Because of these high nutrient levels, the effect of N:P ratios on the growth of these
species were not significant.

196
References
Adolf J, Bachvaroff T, Place AR (2007) Cryptophytes drive blooms of mixotrophic harmful algae: A testable hypothesis based on Karlodinium veneficum in Chesapeake Bay. Journal of Phycology 43:31-31
Adolf JE, Bachvaroff T, Place AR (2008) Can cryptophyte abundance trigger toxic Karlodinium veneficum blooms in eutrophic estuaries? Harmful Algae 8:119-128
Adolf JE, Bachvaroff TR, Krupatkina DN, Nonogaki H, Brown PJP, Lewitus AJ, Harvey HR, Place AR (2006a) Species specificity and potential roles of Karlodinium micrum toxin. African Journal of Marine Science 28:415-419
Adolf JE, Stoecker DK, Harding LW (2003) Autotrophic growth and photoacclimation in Karlodinium micrum (Dinophyceae) and Storeatula major (Cryptophyceae). Journal of Phycology 39:1101-1108
Adolf JE, Stoecker DK, Harding LW (2006b) The balance of autotrophy and heterotrophy during mixotrophic growth of Karlodinium micrum (Dinophyceae). Journal of Plankton Research 28:737-751
Anderson DM, Burkholder JM, Cochlan WP, Glibert PM, Gobler CJ, Heil CA, Kudela RM, Parsons ML, Rensel JEJ, Townsend DW, Trainer VL, Vargo GA (2008) Harmful algal blooms and eutrophication: Examining linkages from selected coastal regions of the United States. Harmful Algae 8:39-53
Anderson DM, Glibert PM, Burkholder JM (2002) Harmful algal blooms and eutrophication: Nutrient sources, composition, and consequences. Estuaries 25:704-726
Bronk DA, Sanderson MP, Mulholland MR (2004) Organic and inorganic nitrogen uptake kinetics in field populations dominated by Karenia brevis. In: Steidinger KA, Landsberg JH, Tomas CR, Vargo GA (eds) Harmful Algae 2002, Florida Fish and Wildlife Conservation Commission, Florida Institute of Oceanography and Intergovernmental Oceanographic Commission of UNESCO, St. Petersberg, Florida, USA, p 80-82

197
Bulgakov NG, Levich AP (1999) The nitrogen : phosphorus ratio as a factor regulating phytoplankton community structure. Archiv Fur Hydrobiologie 146:3-22
Burkholder JM, Glibert PM, Skelton HM (2008) Mixotrophy, a major mode of nutrition for harmful algal species in eutrophic waters. Harmful Algae 8:77-93
Caron DA, Sanders RW, Lim EL, Marrase C, Amaral LA, Whitney S, Aoki RB, Porter KG (1993) Light dependent phagotrophy in the fresh water mixotrophic chrysophyte Dinobryon cylindricum. Microbial Ecology 25:93-111
Cloern JE, Jassby AD (2010) Patterns and scales of phytoplankton variability in estuarine-voastal ecosystems. Estuaries and Coasts 33:230-241
Deeds JR, Reimschuessel R, Place AR (2006) Histopathological effects in fish exposed to the toxins from Karlodinium micrum. Journal of Aquatic Animal Health 18:136-148
Deeds JR, Terlizzi DE, Adolf JE, Stoecker DK, Place AR (2002) Toxic activity from cultures of Karlodinium micrum (=Gyrodinium galatheanum) (Dinophyceae) – a dinoflagellate associated with fish mortalities in an estuarine aquaculture facility. Harmful Algae 1:169-189
Fan CL, Glibert PM, Burkholder JM (2003) Characterization of the affinity for nitrogen, uptake kinetics, and environmental relationships for Prorocentrum minimum in natural blooms and laboratory cultures. Harmful Algae 2:283-299
Fisher TR, Peele ER, Ammerman JW, Harding LW (1992) Nutrient limitation of phytoplankton in Chesapeake Bay. Marine Ecology-Progress Series 82:51-63
Glibert PM, Anderson DM, Gentien P, Granéli E, Sellner KG (2005a) The global, complex phenomena of harmful algal blooms. Oceanography 18 (2):136-147
Glibert PM, Burkholder JM (2006) The complex relationships between increasing fertilization of the earth, coastal eutrophication and proliferation of harmful algal blooms. In: Granéli E, Turner J (eds) Ecology of Harmful Algae. Springer, p 341-354

198
Glibert PM, Burkholder JM, Granéli E, Anderson DM (2008a) Advances and insights in the complex relationships between eutrophication and HABs: Preface to the special issue. Harmful Algae 8:1-2
Glibert PM, Burkholder JM, Kana TM, Alexander J, Skelton H, Shilling C (2009) Grazing by Karenia brevis on Synechococcus enhances its growth rate and may help to sustain blooms. Aquatic Microbial Ecology 55:17-30
Glibert PM, Conley DJ, Fisher TR, Harding LW, Malone TC (1995) Dynamics of the 1990 winter spring bloom in Chesapeake Bay. Marine Ecology-Progress Series 122:27-43
Glibert PM, Garside C, Fuhrman JA, Roman MR (1991) Time-dependent coupling of inorganic and organic nitrogen uptake and regeneration in the plume of the Chesapeake Bay Estuary and its regulation by large heterotrophs. Limnology and Oceanography 36:895-909
Glibert PM, Harrison J, Heil C, Seitzinger S (2006) Escalating worldwide use of urea - a global change contributing to coastal eutrophication. Biogeochemistry 77:441-463
Glibert PM, Heil CA, Hollander D, Revilla M, Hoare A, Alexander J, Murasko S (2004) Evidence for dissolved organic nitrogen and phosphorus uptake during a cyanobacterial bloom in Florida Bay. Marine Ecology-Progress Series 280:73-83
Glibert PM, Magnien R, Lomas MW, Alexander J, Fan CL, Haramoto E, Trice M, Kana TM (2001) Harmful algal blooms in the Chesapeake and Coastal Bays of Maryland, USA: Comparison of 1997, 1998, and 1999 events. Estuaries 24:875-883
Glibert PM, Magnien RE (2004) Harmful algal blooms in the Chesapeake Bay, USA: Common species, relationships to nutrient loading, management approaches, successes, and challenges. In: Hall S, Anderson D, Kleindinst J, Zhu M, Zou Y (eds) Harmful Algae Management and Mitigation. Asia-Pacific Economic Cooperation, Singapore
Glibert PM, Mayorga E, Seitzinger S (2008b) Prorocentrum minimum tracks anthropogenic nitrogen and phosphorus inputs on a global basis: Application of spatially explicit nutrient export models. Harmful Algae 8:33-38

199
Glibert PM, Trice TM, Michael B, Lane L (2005b) Urea in the tributaries of the Chesapeake and Coastal Bays of Maryland. Water Air and Soil Pollution 160:229-243
Goshorn D, Deeds J, Tango P, Poukish C, Place AR, McGinty M, Butler W, Luckett C, Magnien R (2004) Occurrence of Karlodinium micrum and its association with fish kills in Maryland estuaries. In: Steidinger KA, Landsberg JA, Tomas CR, Vargo GA (eds) Proceedings of Harmful Algae 2002. IOC-UNESCO, St. Petersberg, p 361–363
Granéli E, Carlsson P, Legrand C (1999) The role of C, N and P in dissolved and particulate organic matter as a nutrient source for phytoplankton growth, including toxic species. Aquatic Ecology 33:17-27
Guillard RR, Ryther JH (1962) Studies of marine planktonic diatoms 1. Cyclotella nana Hustedt, and Detonula confervacea (Cleve) Gran. Canadian Journal of Microbiology 8:229
Hecky RE, Kilham P (1988) Nutrient limitation of phytoplankton in fresh-water and marine environments - a review of recent evidence on the effects of enrichment. Limnology and Oceanography 33:796-822
Heil CA, Glibert PM, Al-Sarawl MA, Faraj M, Behbehani M, Husain M (2001) First record of a fish-killing Gymnodinium sp bloom in Kuwait Bay, Arabian Sea: chronology and potential causes. Marine Ecology-Progress Series 214:15-23
Heil CA, Glibert PM, Fan CL (2005) Prorocentrum minimum (Pavillard) Schiller - a review of a harmful algal bloom species of growing worldwide importance. Harmful Algae 4:449-470
Heil CA, Revilla M, Glibert PM, Murasko S (2007) Nutrient quality drives differential phytoplankton community composition on the southwest Florida shelf. Limnology and Oceanography 52:1067-1078
Hodgkiss IJ, Ho KC (1997) Are changes in N:P ratios in coastal waters the key to increased red tide blooms? Hydrobiologia 352:141-147
Howard MDA, Cochlan WP, Ladizinsky N, Kudela RM (2007) Nitrogenous preference of toxigenic Pseudo-nitzschia australis (Bacillariophyceae) from field and laboratory experiments. Harmful Algae 6:206-217

200
Jeong H, Yoo Y, Kim J, Seong K, Kang N, Kim T (2010) Growth, feeding, and ecological roles of the mixotrophic and heterotrophic dinoflagellates in marine planktonic food webs. Ocean Science Journal 45:65-91
Jeong HJ, Du Yoo Y, Park JY, Song JY, Kim ST, Lee SH, Kim KY, Yih WH (2005a) Feeding by phototrophic red-tide dinoflagellates: five species newly revealed and six species previously known to be mixotrophic. Aquatic Microbial Ecology 40:133-150
Jeong HJ, Park JY, Nho JH, Park MO, Ha JH, Seong KA, Jeng C, Seong CN, Lee KY, Yih WH (2005b) Feeding by red-tide dinoflagellates on the cyanobacterium Synechococcus. Aquatic Microbial Ecology 41:131-143
Jeong HJ, Song JY, Lee CH, Kim ST (2004) Feeding by larvae of the mussel Mytilus galloprovincialis on red-tide dinoflagellates. Journal of Shellfish Research 23:185-195
Jones HLJ, Durjun P, Leadbeater BSC, Green JC (1995) The relationship between photoacclimation and phagotrophy with Respect to Chlorophyll a, carbon and nitrogen content, and cell size of Chrysochromulina brevifilum (Prymnesiophyceae). Phycologia 34:128-134
Jordan TE, Correll DL, Miklas J, Weller DE (1991) Nutrients and chlorophyll at the interface of a watershed and an estuary. Limnology and Oceanography 36:251-267
Koerselman W, Meuleman AFM (1996) The vegetation N:P ratio: A new tool to detect the nature of nutrient limitation. Journal of Applied Ecology 33:1441-1450
Lagus A, Suomela J, Weithoff G, Heikkila K, Helminen H, Sipura J (2004) Species-specific differences in phytoplankton responses to N and P enrichments and the N:P ratio in the Archipelago Sea, northern Baltic Sea. Journal of Plankton Research 26:779-798
Li AS, Stoecker DK, Adolf JE (1999) Feeding, pigmentation, photosynthesis and growth of the mixotrophic dinoflagellate Gyrodinium galatheanum. Aquatic Microbial Ecology 19:163-176

201
Li AS, Stoecker DK, Coats DW (2000) Spatial and temporal aspects of Gyrodinium galatheanum in Chesapeake Bay: distribution and mixotrophy. Journal of Plankton Research 22:2105-2124
Li AS, Stoecker DK, Coats DW, Adam EJ (1996) Ingestion of fluorescently labeled and phycoerythrin-containing prey by mixotrophic dinoflagellates. Aquatic Microbial Ecology 10:139-147
Li J, Glibert PM, Zhou M (2010) Temporal and spatial variability in nitrogen uptake kinetics during dinoflagellate blooms in the East China Sea. Harmful Algae 9:531-539
Li J, Glibert PM, Zhou M, Lu S, Lu D (2009) Relationships between nitrogen and phosphorus forms and ratios and the development of dinoflagellate blooms in the East China Sea. Marine Ecology Progress Series 383:11-26
Lomas MW, Glibert PM (1999a) Interactions between NH4+ and NO3
- uptake and assimilation: comparison of diatoms and dinoflagellates at several growth temperatures. Marine Biology 133:541-551
Lomas MW, Glibert PM (1999b) Temperature regulation of nitrate uptake: A novel hypothesis about nitrate uptake and reduction in cool-water diatoms. Limnology and Oceanography 44:556-572
Mulholland MR, Bernhardt PW, Heil CA, Bronk DA, O'Neil JM (2006) Nitrogen fixation and release of fixed nitrogen by Trichodesmium spp. in the Gulf of Mexico. Limnology and Oceanography 51:1762-1776
Nygaard K, Tobiesen A (1993) Bacterivory in algae - a survival strategy during nutrient limitation. Limnology and Oceanography 38:273-279
Phillips DJH, Tanabe S (1989) Aquatic pollution in the Far-East. Marine Pollution Bulletin 20:297-303
Ptacnik R, Andersen T, Tamminen T (2010) Performance of the Redfield Ratio and a family of nutrient limitation indicators as thresholds for phytoplankton N vs. P limitation. Ecosystems 13:1201-1214

202
Sanders RW, Porter KG, Caron DA (1990) Relationship between phototrophy and phagotrophy in the mixotrophic chrysophyte Poterioochromonas malhamensis. Microbial Ecology 19:97-109
Seitzinger SP, Kroeze C, Bouwman AF, Caraco N, Dentener F, Styles RV (2002) Global patterns of dissolved inorganic and particulate nitrogen inputs to coastal systems: Recent conditions and future projections. Estuaries 25:640-655
Shimizu Y, Watanabe N, Wrensford G (1995) Biosynthesis of brevetoxins and heterotrophic metabolism in Gymnodinium breve. In: Watanabe N, Wrensford G, Lassus P, Arzul G, Erard-Le Denn E, Gentien P, Marcaillou C (eds) Harmful Marine Algal Blooms. Lavoisier Publishing Inc., New York, p 351-357
Smayda TJ (1996) Dinoflagellate bloom cycles: what is the role of cellular growth rate and bacteria? In: Yasumoto T, Oshima Y, Fukuyo Y (eds) Harmful and Toxic Algal Blooms. Intergovernmental Oceanographic Commission of UNESCO
Smayda TJ (2002) Adaptive ecology, growth strategies and the global bloom expansion of dinoflagellates. Journal of Oceanography 58:281-294
Smayda TJ, Reynolds CS (2001) Community assembly in marine phytoplankton: application of recent models to harmful dinoflagellate blooms. Journal of Plankton Research 23:447-461
Solomon CM, Glibert PM (2008) Urease activity in five phytoplankton species. Aquatic Microbial Ecology 52:149-157
Stelzer RS, Lamberti GA (2001) Effects of N : P ratio and total nutrient concentration on stream periphyton community structure, biomass, and elemental composition. Limnology and Oceanography 46:356-367
Stoecker DK (1998) Conceptual models of mixotrophy in planktonic protists and some ecological and evolutionary implications. European Journal of Protistology 34:281-290
Stoecker DK (1999) Mixotrophy among dinoflagellates. Journal of Eukaryotic Microbiology 46:397-401
203
Stoecker DK, Li AS, Coats DW, Gustafson DE, Nannen MK (1997) Mixotrophy in the dinoflagellate Prorocentrum minimum. Marine Ecology-Progress Series 152:1-12
Stoecker DK, Tillmann U, Granéli E (2006) Phagotrophy in harmful algae. In: Granéli E, Turner JT (eds) Ecology of Harmful Algae. Springer-Verlag, Berlin, p 177-187
Suttle CA, Harrison PJ (1988) Ammonium and phosphate-uptake rates, N-P supply ratios, and evidence for N-limitation and P-limitation in some oligotrophic lakes. Limnology and Oceanography 33:186-202
Tango PJ, Magnien R, Butler W, Luckett C, Luckenbach M, Lacouture R, Poukish C (2005) Impacts and potential effects due to Prorocentrum minimum blooms in Chesapeake Bay. Harmful Algae 4:525-531
Vargo GA (2009) A brief summary of the physiology and ecology of Karenia brevis Davis (G. Hansen and Moestrup comb. nov.) red tides on the West Florida Shelf and of hypotheses posed for their initiation, growth, maintenance, and termination. Harmful Algae 8:573-584
Vargo GA, Heila CA, Fanning KA, Dixon LK, Neely MB, Lester K, Ault D, Murasko S, Havens J, Walsh J, Bell S (2008) Nutrient availability in support of Karenia brevis blooms on the central West Florida Shelf: What keeps Karenia blooming? Continental Shelf Research 28:73-98
Vrede T, Ballantyne A, Mille-Lindblom C, Algesten G, Gudasz C, Lindahl S, Brunberg AK (2009) Effects of N:P loading ratios on phytoplankton community composition, primary production and N fixation in a eutrophic lake. Freshwater Biology 54:331-344
Wang Y, Tang XX (2008) Interactions between Prorocentrum donghaiense Lu and Scrippsiella trochoidea (Stein) Loeblich III under laboratory culture. Harmful Algae 7:65-75
Wiegner TN, Seitzinger SP, Glibert PM, Bronk DA (2006) Bioavailability of dissolved organic nitrogen and carbon from nine rivers in the eastern United States. Aquatic Microbial Ecology 43:277-287

204
Zhou W, Yin K, Zhu D (2006) Phytoplankton biomass and high frequency of Prorocentrum donghaiense harmful algal bloom in Zhoushan sea area in spring. Chinese Journal of Applied Ecology (In Chinese) 17:887-893

205
Table 5-1 Monoculture exponential growth rates (µ day-1) of Prorocentrum minimum and Karlodinium veneficum. R2 is the coefficient of determination of growth rate from the regression of daily cell counts.
N source Light N:P ratio
Prorocentrum minimum Karlodinium veneficum
µ day-1 p R2 µ day-1 p R2
NO3- high 12 0.485 0.0012 0.949 0.321 <0.0001 0.986
NO3- high 145 0.443 0.0003 0.969 0.312 <0.0001 0.990
Urea high 12 0.377 <0.0001 0.829 0.249 <0.0001 0.940
Urea high 145 0.405 <0.0001 0.898 0.237 <0.0001 0.960
NO3- low 12 0.277 <0.0001 0.999 0.187 <0.0001 0.984
NO3- low 145 0.232 <0.0001 0.993 0.185 <0.0001 0.982
Urea low 12 0.257 <0.0001 0.989 0.175 <0.0001 0.918
Urea low 145 0.235 <0.0001 0.958 0.150 <0.0001 0.844
Tables
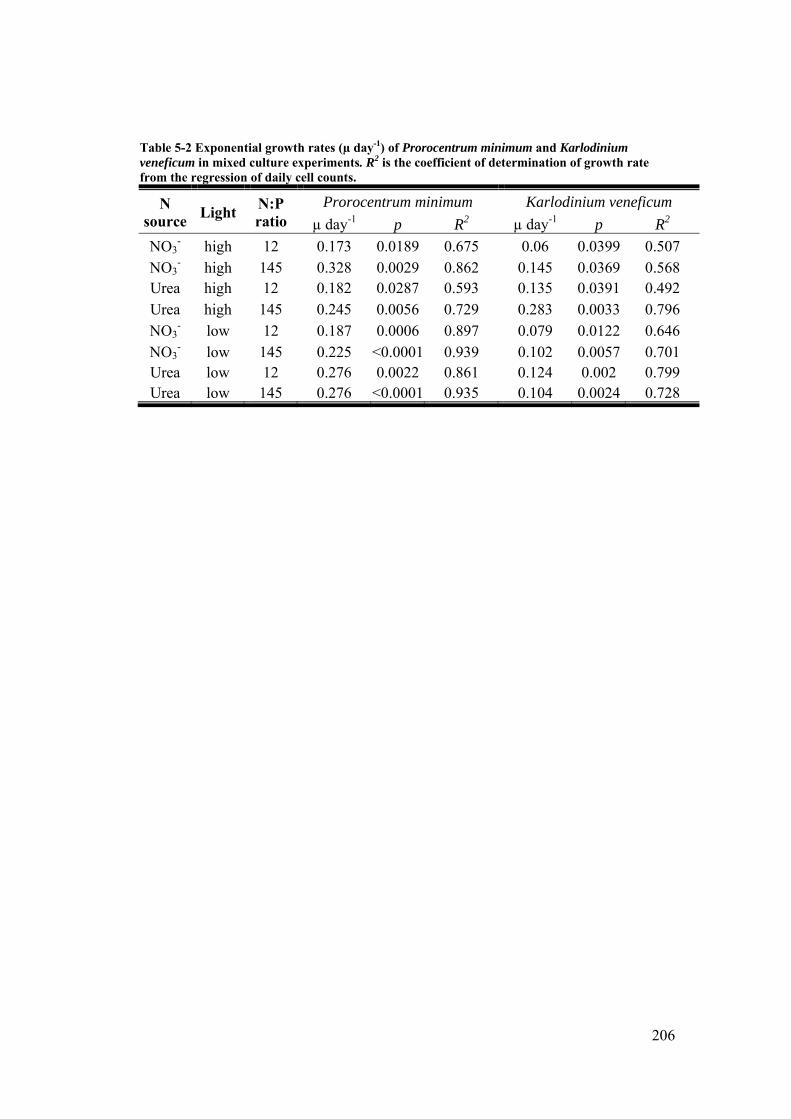
206
Table 5-2 Exponential growth rates (µ day-1) of Prorocentrum minimum and Karlodinium veneficum in mixed culture experiments. R2 is the coefficient of determination of growth rate from the regression of daily cell counts.
N source
Light N:P ratio
Prorocentrum minimum Karlodinium veneficum
µ day-1 p R2 µ day-1 p R2
NO3- high 12 0.173 0.0189 0.675 0.06 0.0399 0.507
NO3- high 145 0.328 0.0029 0.862 0.145 0.0369 0.568
Urea high 12 0.182 0.0287 0.593 0.135 0.0391 0.492 Urea high 145 0.245 0.0056 0.729 0.283 0.0033 0.796 NO3
- low 12 0.187 0.0006 0.897 0.079 0.0122 0.646 NO3
- low 145 0.225 <0.0001 0.939 0.102 0.0057 0.701 Urea low 12 0.276 0.0022 0.861 0.124 0.002 0.799 Urea low 145 0.276 <0.0001 0.935 0.104 0.0024 0.728

207
Table 5-3 Exponential growth rates (µ day-1) of Prorocentrum minimum and Karlodinium veneficum with Rhodomonas in mixed culture experiments. R2 is the coefficient of determination of growth rate from the regression of daily cell counts.
N source Light N:P ratio
Prorocentrum minimum Karlodinium veneficum
µ day-1 p R2 µ day-1 p R2
NO3- high 12 0.048 0.3521 0.204 0.086 0.0041 0.843
NO3- high 145 0.038 0.1054 0.434 0.09 0.1181 0.461
NO3- low 12 ~ 0 0.081 0.0712 0.532
NO3- low 145 ~ 0 ~0

208
Table 5-4 Monoculture exponential growth rates (µ day-1) of Prorocentrum donghaiense and Karlodinium brevis. R2 is the coefficient of determination of growth rate from the regression of daily cell counts.
N source
Light N:P ratio
Prorocentrum donghaiense Karlodinium brevis µ day-1 p R2 µ day-1 p R2
NO3- high 12 0.374 <0.0001 0.999 0.267 <0.0001 0.948
NO3- high 145 0.206 0.0002 0.911 0.219 <0.0001 0.942
Urea high 12 0.292 0.0001 0.939 0.278 <0.0001 0.971 Urea high 145 0.18 0.0016 0.913 0.278 <0.0001 0.989 NO3
- low 12 0.158 <0.0001 0.992 0.136 <0.0001 0.979 NO3
- low 145 0.216 <0.0001 0.988 0.124 <0.0001 0.971 Urea low 12 0.269 <0.0001 0.996 0.116 <0.0001 0.968 Urea low 145 0.282 <0.0001 0.986 0.078 <0.0001 0.943

209
Table 5-5 Exponential growth rates (µ day-1) of Prorocentrum donghaiense and Karlodinium brevis in mixed culture experiments. R2 is the coefficient of determination of growth rate from the regression of daily cell counts.
N source Light N:P ratio
Prorocentrum donghaiense Karlodinium brevis µ day-1 p R2 µ day-1 p R2
NO3- high 12 0.380 0.0004 0.871 0.173 <0.0001 0.974
NO3- high 145 0.301 0.002 0.79 0.249 <0.0001 0.987
Urea high 12 0.334 0.0014 0.818 0.235 <0.0001 0.97 Urea high 145 0.344 0.0069 0.709 0.224 <0.0001 0.987NO3
- low 12 0.127 0.0164 0.566 ~0 NO3
- low 145 0.153 0.0001 0.88 0.024 0.0131 0.552Urea low 12 0.116 <0.0001 0.92 ~0 Urea low 145 0.233 0.166 0.926 0.026 0.1391 0.266

210
Table 5-6. Exponential growth rates (µ day-1) of Prorocentrum donghaiense and Karlodinium brevis with Synechococcus in mixed culture experiments. R2 is the coefficient of determination of growth rate from the regression of daily cell counts.
N source Light N:P ratio
Prorocentrum donghaiense Karlodinium brevis µ day-1 p R2 µ day-1 p R2
NO3- high 12 0.385 <0.0001 0.951 0.172 0.0563 0.587
NO3- high 145 0.355 0.0061 0.866 0.16 0.0086 0.802
NO3- low 12 0.137 0.0003 0.894 0.019 0.2738 0.166
NO3- low 145 0.141 <0.0001 0.922 0.055 0.0011 0.762

211
Table 5-7 Summary of the growth rates of 4 dinoflagellates reported in laboratory experiments.

212
Day
0 2 4 6 8 10 12 14 16 18 20 22 24 26
fluor
esce
nce
unit
0
200
400
600
800
1000
1200
1400
1600LNP HLHNP HLLNP LLHNP LL
Day
0 2 4 6 8 10 12 14 16 18 20 22 24 26
fluor
esce
nce
unit
0
200
400
600
800
1000
1200
1400
1600LNP HLHNP HLLNP LLHNP LL
Day
0 2 4 6 8 10 12 14 16 18 20 22 24 26
fluor
esce
nce
unit
0
100
200
300
400
500LNP HLHNP HLLNP LLHNP LL
Day
0 2 4 6 8 10 12 14 16 18 20 22 24 26
fluor
esce
nce
unit
0
100
200
300
400
500LNP HLHNP HLLNP LLHNP LL
Figure 5-1 Time course of growth of Prorocentrum minimum (a) and Karlodinium veneficum (b) in monoculture with 2 nitrogen sources NO3
- (a, c) and urea (b, d) at high and low N:P ratios (HNP, LNP) and high and low light intensities (HL, LL). The error bar is the standard deviation of triplicate treatments.
a. P. minimum b. P. minimum
c. K. veneficum d. K. veneficum

213
a. NO3-
N:P 12 high light
Day
0 10 20 30 40
Cel
ls p
er m
l
0.0
5.0e+4
1.0e+5
1.5e+5
2.0e+5
2.5e+5K. veneficumP. minimum
b. NO3-
N:P 145 high light
Day
0 10 20 30 40
Cel
ls p
er m
l
0.0
5.0e+4
1.0e+5
1.5e+5
2.0e+5
2.5e+5
K. veneficumP. minimum
c. urea N:P 12 high light
Day
0 10 20 30 40
Cel
ls p
er m
l
0.0
5.0e+4
1.0e+5
1.5e+5
2.0e+5
2.5e+5K. veneficumP. minimum
d. urea N:P 145 high light
Day
0 10 20 30 40
Cel
ls p
er m
l
0.0
5.0e+4
1.0e+5
1.5e+5
2.0e+5
2.5e+5K. veneficumP. minimum

214
e. NO3-
N:P 12 low light
Day
0 10 20 30 40
Cel
ls p
er m
l
0.0
5.0e+4
1.0e+5
1.5e+5
2.0e+5
2.5e+5K. veneficumP. minimum
f. NO3-
N:P 145 low light
Day
0 10 20 30 40
Cel
ls p
er m
l
0.0
5.0e+4
1.0e+5
1.5e+5
2.0e+5
2.5e+5K. veneficumP. minimum
g. urea N:P 12 low light
Day
0 10 20 30 40
Cel
ls p
er m
l
0.0
5.0e+4
1.0e+5
1.5e+5
2.0e+5
2.5e+5K. veneficumP. minimum
h. urea N:P 145 low light
Day
0 10 20 30 40
Cel
ls p
er
ml
0.0
5.0e+4
1.0e+5
1.5e+5
2.0e+5
2.5e+5K. veneficumP. minimum
Figure 5-2 Time course of growth of Prorocentrum minimum and Karlodinium veneficum in mixed culture with 2 nitrogen sources at 2 N:P ratios and 2 light intensities. The error bar is the standard deviation of duplicate treatments.
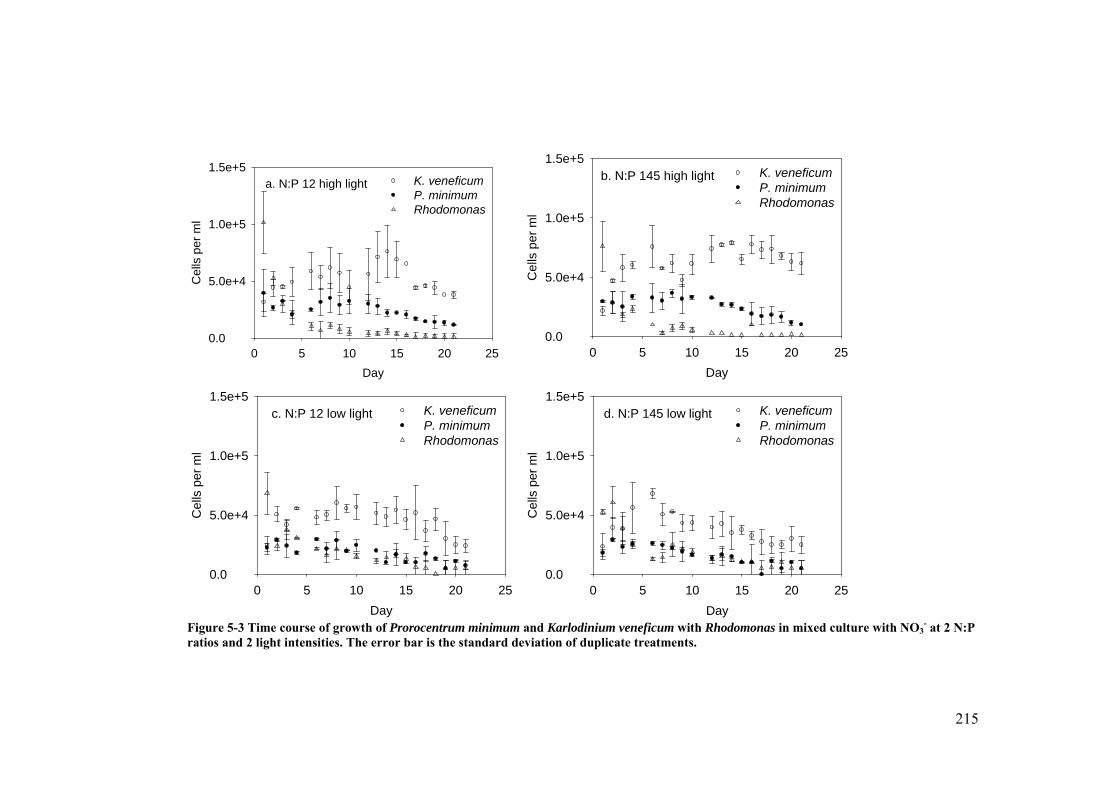
215
a. N:P 12 high light
Day
0 5 10 15 20 25
Cel
ls p
er m
l
0.0
5.0e+4
1.0e+5
1.5e+5K. veneficumP. minimum Rhodomonas
b. N:P 145 high light
Day
0 5 10 15 20 25
Cel
ls p
er m
l
0.0
5.0e+4
1.0e+5
1.5e+5K. veneficumP. minimum Rhodomonas
c. N:P 12 low light
Day
0 5 10 15 20 25
Cel
ls p
er m
l
0.0
5.0e+4
1.0e+5
1.5e+5K. veneficumP. minimum Rhodomonas
d. N:P 145 low light
Day
0 5 10 15 20 25
Cel
ls p
er m
l
0.0
5.0e+4
1.0e+5
1.5e+5K. veneficumP. minimum Rhodomonas
Figure 5-3 Time course of growth of Prorocentrum minimum and Karlodinium veneficum with Rhodomonas in mixed culture with NO3
- at 2 N:P ratios and 2 light intensities. The error bar is the standard deviation of duplicate treatments.

216
Day
0 2 4 6 8 10 12 14 16 18 20
fluor
esce
nce
unit
0
20
40
60
80
100LNP HLHNP HLLNP LLHNP LL
Day
0 2 4 6 8 10 12 14 16 18 20
fluo
resc
ence
un
it
0
20
40
60
80
100LNP HLHNP HLLNP LLHNP LL
Day
0 2 4 6 8 10 12 14 16 18 20
fluor
esce
nce
unit
0
10
20
30
40
50LNP HLHNP HLLNP LLHNP LL
Day
0 2 4 6 8 10 12 14 16 18 20
fluor
esce
nce
unit
0
10
20
30
40
50LNP HLHNP HLLNP LLHNP LL
Figure 5-4 Time course of growth of Prorocentrum donghaiense (a., b.) and Karenia brevis (c., d.) in monoculture with 2 nitrogen sources NO3
- (a., c.) and urea (b., d.) at high and low N:P ratios (HNP, LNP) and high and low light intensities (HL, LL). The error bar is the standard deviation of triplicate treatments.
a. b.
c. d.

217
a. NO3-
N:P 12 high light
Day
0 5 10 15 20 25
Cel
ls p
er m
l
0
2e+4
4e+4
6e+4
8e+4
1e+5K. brevisP. donghaiense
b. NO3-
N:P 145 high light
Day
0 5 10 15 20 25
Cel
ls p
er m
l
0
2e+4
4e+4
6e+4
8e+4
1e+5
K. brevisP. donghaiense
c. urea N:P 12 high light
Day
0 5 10 15 20 25
Cel
ls p
er m
l
0
2e+4
4e+4
6e+4
8e+4
1e+5K. brevisP. donghaiense
d. urea N:P 145 high light
Day
0 5 10 15 20 25
Cel
ls p
er m
l
0
2e+4
4e+4
6e+4
8e+4
1e+5K. brevisP. donghaiense
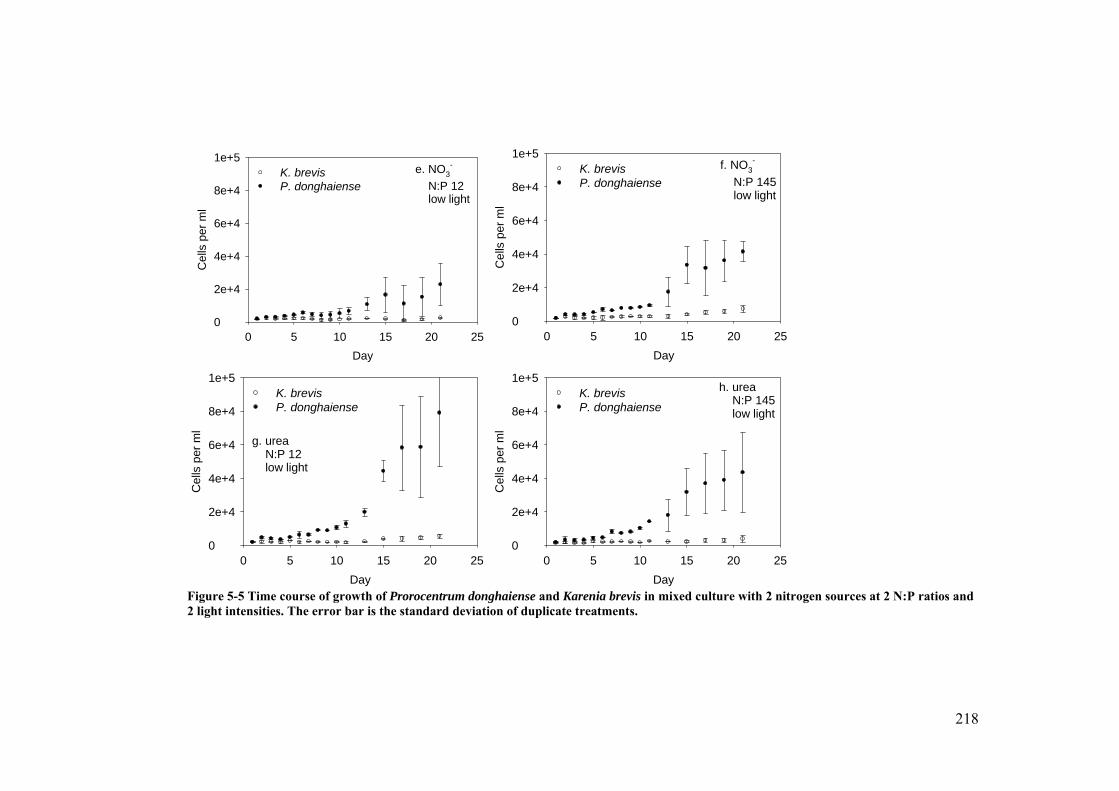
218
e. NO3-
N:P 12 low light
Day
0 5 10 15 20 25
Cel
ls p
er m
l
0
2e+4
4e+4
6e+4
8e+4
1e+5K. brevisP. donghaiense
f. NO3-
N:P 145 low light
Day
0 5 10 15 20 25
Cel
ls p
er m
l
0
2e+4
4e+4
6e+4
8e+4
1e+5K. brevisP. donghaiense
g. urea N:P 12 low light
Day
0 5 10 15 20 25
Cel
ls p
er m
l
0
2e+4
4e+4
6e+4
8e+4
1e+5K. brevisP. donghaiense
h. urea N:P 145 low light
Day
0 5 10 15 20 25
Cel
ls p
er m
l
0
2e+4
4e+4
6e+4
8e+4
1e+5K. brevisP. donghaiense
Figure 5-5 Time course of growth of Prorocentrum donghaiense and Karenia brevis in mixed culture with 2 nitrogen sources at 2 N:P ratios and 2 light intensities. The error bar is the standard deviation of duplicate treatments.
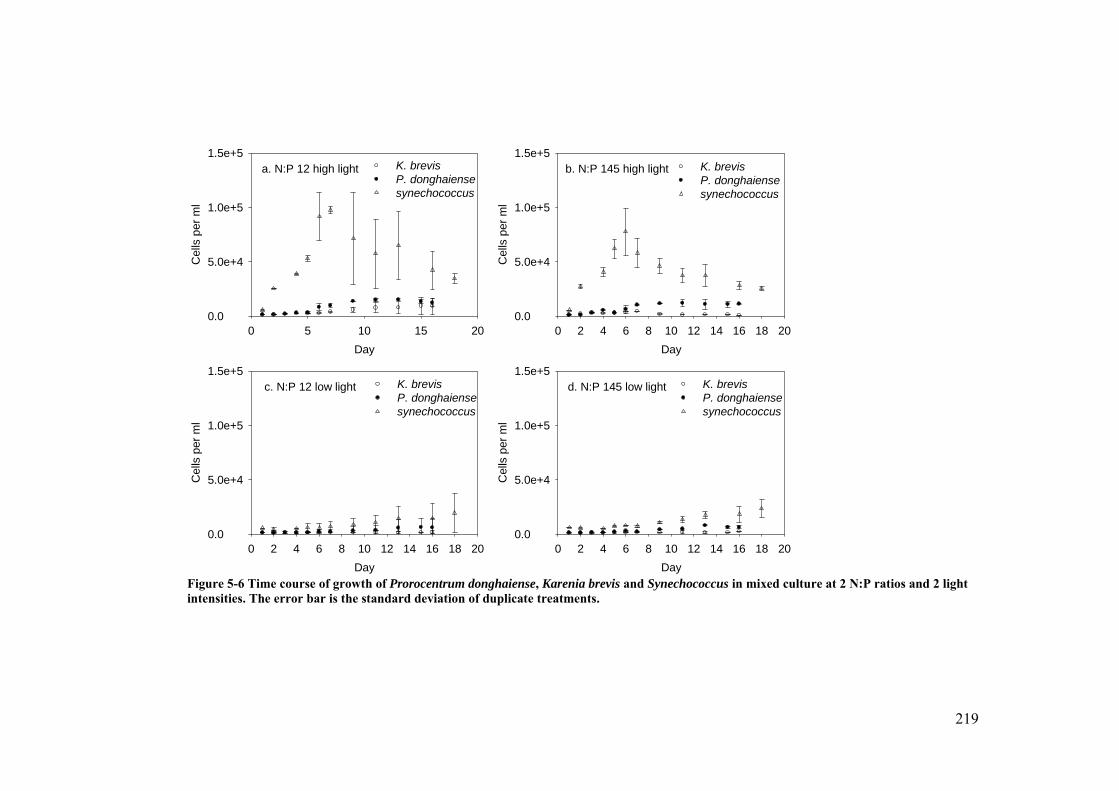
219
a. N:P 12 high light
Day
0 5 10 15 20
Cel
ls p
er m
l
0.0
5.0e+4
1.0e+5
1.5e+5K. brevisP. donghaiense synechococcus
b. N:P 145 high light
Day
0 2 4 6 8 10 12 14 16 18 20
Cel
ls p
er m
l
0.0
5.0e+4
1.0e+5
1.5e+5K. brevisP. donghaiense synechococcus
c. N:P 12 low light
Day
0 2 4 6 8 10 12 14 16 18 20
Cel
ls p
er m
l
0.0
5.0e+4
1.0e+5
1.5e+5K. brevisP. donghaiense synechococcus
d. N:P 145 low light
Day
0 2 4 6 8 10 12 14 16 18 20
Cel
ls p
er m
l
0.0
5.0e+4
1.0e+5
1.5e+5K. brevisP. donghaiense synechococcus
Figure 5-6 Time course of growth of Prorocentrum donghaiense, Karenia brevis and Synechococcus in mixed culture at 2 N:P ratios and 2 light intensities. The error bar is the standard deviation of duplicate treatments.

220
a. Hight Light Low N:P Ratio
Gro
wth
Rat
e pe
r D
ay
0.0
0.1
0.2
0.3
0.4
0.5
0.6IIIIII
PM PD
b.Hight Light High N:P Ratio
Gro
wth
Rat
e pe
r D
ay
0.0
0.1
0.2
0.3
0.4
0.5
0.6IIIIII
PM PD
c. Hight Light Low N:P Ratio
Gro
wth
Rate
per
Day
0.0
0.1
0.2
0.3
0.4
0.5
0.6IIIIII
PM PD
n.a. n.a.
d. Hight Light High N:P Ratio
Gro
wth
Rat
e pe
r D
ay
0.0
0.1
0.2
0.3
0.4
0.5
0.6IIIIII
PM PD
n.a. n.a.
e. Low Light Low N:P Ratio
Gro
wth
Rat
e pe
r D
ay
0.0
0.1
0.2
0.3
0.4
0.5
0.6IIIIII
PM PD
f. Low Light High N:P Ratio
Gro
wth
Rat
e pe
r D
ay
0.0
0.1
0.2
0.3
0.4
0.5
0.6IIIIII
PM PD
g. Low Light Low N:P Ratio
Gro
wth
Rat
e pe
r D
ay
0.0
0.1
0.2
0.3
0.4
0.5
0.6IIIIII
PM PD
n.a. n.a.
h. Low Light High N:P Ratio
Gro
wth
Rat
e pe
r D
ay
0.0
0.1
0.2
0.3
0.4
0.5
0.6IIIIII
PM PD
n.a. n.a.
NO3-
NO3-
Urea
Urea

221
i. Hight Light Low N:P Ratio
Gro
wth
Rat
e pe
r D
ay
0.0
0.1
0.2
0.3
0.4
0.5
0.6IIIIII
KV KB
j. Hight Light High N:P Ratio
Gro
wth
Rat
e pe
r D
ay
0.0
0.1
0.2
0.3
0.4
0.5
0.6IIIIII
KV KB
k. Hight Light Low N:P Ratio
Gro
wth
Rat
e pe
r D
ay
0.0
0.1
0.2
0.3
0.4
0.5
0.6IIIIII
KV KB
n.a. n.a.
l. Hight Light High N:P Ratio
Gro
wth
Rat
e pe
r D
ay
0.0
0.1
0.2
0.3
0.4
0.5
0.6IIIIII
KV KB
n.a. n.a.
m. Low Light Low N:P Ratio
Gro
wth
Rat
e pe
r D
ay
0.0
0.1
0.2
0.3
0.4
0.5
0.6IIIIII
KV KB
n. Low Light High N:P Ratio
Gro
wth
Ra
te p
er D
ay
0.0
0.1
0.2
0.3
0.4
0.5
0.6IIIIII
KV KB
o. Low Light Low N:P Ratio
Gro
wth
Rat
e pe
r D
ay
0.0
0.1
0.2
0.3
0.4
0.5
0.6IIIIII
KV KB
n.a. n.a.
p. Low Light High N:P Ratio
Gro
wth
Rat
e pe
r D
ay
0.0
0.1
0.2
0.3
0.4
0.5
0.6IIIIII
KV KB
n.a. n.a.
Figure 5-7 The exponential grow rates of 4 harmful dinoflagellates Prorocentrum minimum (PM), P. donghaiense (PD), Karlodinium veneficum (KV) and Karenia brevis (KB) in 3 sets of culture setting with treatments of high light (a, b, c, d, i, j, k, l) and low light (e, f, g, h, m, n, o, p); low N:P ratio (a, c, e, j, i, k, m, o) and high N:P ratio (b, d, f, h, j, l, n, p). Culture setting I: Monoculture; II: mixed culture of P. minimum and K. veneficum; mixing culture of P. donghaiense and K. brevis; III: mixed culture of Rhodomonas, P. minimum and K. veneficum; mixed culture of Synechococcus, P. donghaiense and K. brevis
NO3-
NO3-
Urea
Urea

222
Chapter 6: Research Conclusions
Dinoflagellate Blooms and the Matrix of Nutrients and Light
Smayda (Smayda and Reynolds 2001, Smayda 2002) has suggested that the
increase in dinoflagellate blooms can be categorized as responses to a changing
environment (e.g. eutrophication). Each dinoflagellate requires a common set of
ecological characteristics (niche) that support it to develop blooms (Smayda 1990,
Smayda 1997, 2002). Smayda (2002) refined this environmental adaptation of
dinoflagellates by classifying them into different functional groups in a matrix, based
on ecophysiological preferences organized by a near-shore / off-shore gradient in
decreasing nutrients, reduced mixing, and increasing light. In this matrix, estuarine
species are defined as the dinoflagellates which are better adapted to low-light high-
nutrient waters, but oceanic species are better adapted to high-light low-nutrient
waters.
Estuarine dinoflagellate Prorocentrum minimum and P. donghaiense have
been reported to coexist with Karenia brevis and K. mikimotoi in the southwest
Florida shelf and the East China Sea respectively (Heil et al. 2007, Li et al. 2009).
Each pair of algae developed blooms in either spatial or temporal succession in these
coastal waters, and a remarkable similarity was found between the dominant species
and their ambient N:P ratios (Li et al. 2009). This dissertation study was conducted to
answer the research question whether this relationship between the ambient N:P ratio
and the dominance species can be expanded to other regions, where estuarine species

223
P. minimum and Karlodinium veneficum develop blooms, and to address the
physiological basis for such a relationship. The research conducted for this
dissertation set out to study the growth and physiological mechanisms of nitrogen
acquisition with respect to nutrient and light, which are two factors used to
characterize the niches of dinoflagellates by Smayda’s matrix.
The following hypotheses were tested:
1) In Chesapeake Bay, P. minimum develops blooms in relative high DIN:DIP
ratio water; while K. veneficum blooms near or lower than the Redfield ratio.
2) These species will grow faster in the N:P ratio in which they develop blooms,
even when these nutrients are not at limiting levels.
3) Prorocentrum spp. preferentially take up more DIN in high DIN:DIP ratio
water, while Karlodinium can better use other source of N in the low DIN
water (e.g. DON, particulate N).
4) Low-light-adapted nitrogen acquisition by Prorocentrum spp. serves as an
adaptive advantage to grow in low light waters.
From this dissertation study, the following results were found, corresponding
to the hypotheses:
In the Chesapeake Bay, the estuarine species P. minimum developed blooms
in high DIN, high N:P ratio, turbid water; while K. veneficum bloomed after DIN was
depleted (Chapter 2) and ambient N:P ratio was near the Redfield ratio. These trends
are consistent with East China Sea and west Florida shelf for similar species (Chapter

224
2). K. veneficum needs additional N sources to bloom, which may be the relatively
high concentrations of DON in the water column.
However, in culture, the estuarine species P. minimum and P. donghaiense did
not reach the highest maximum growth rates in N-rich high N:P ratio water, instead,
they reached the highest maximum growth rates at more N:P balanced ratio (near the
Redfield ratio) in turbidistat (Chapter 3). When ambient N:P ratio varied, but
nutrients were sufficient, there was also no significant variation (p > 0.05) of the
growth rates for both P. minimum and K. veneficum in batch culture (Chapter 5).
Instead, P. minimum grew faster on NO3-, a DIN source, while, K. veneficum grew
faster on urea, a DON source.
Light is another important factor in the Smayda’s matrix. All four tested
species showed light limitation in the low light treatments in batch culture (Chapter 5)
and turbidistat (Chapter 4). However, light affected the growth rate differently: low-
light adapted estuarine species Prorocentrum spp. reached about 60% of their high-
light growth rate; while, oceanic species K. brevis only reached about 30% of its
high-light growth rate. Similar results were recorded in both batch culture and
turbidistat.
The diel growth of P. minimum and P. donghaiense is strictly light regulated.
Positive growth was only recorded during the light phase by the turbidistat (Chapter
4). The highest growth rates were recorded at the beginning of the light phase, and the
growth rates decreased during the light phase. This diel cycle of growth rate can be
interpreted by Droop’s model as the light-dark regulation of the N acquisition by
Prorocentrum species. The growth rate appears to be more driven by the variation of
225
cell quota, than by ambient nutrient concentrations. Prorocentrum spp. continuously
take up nitrogen at night to supplement the cell quota, when the growth stopped. The
cells have the maximum cell N quota and reach highest growth rate at the beginning
of light phase (Chapter 3). In contrast, oceanic species K. brevis and K. mikimotoi
take up N in the light phase only, even when nutrient is saturated (Paasche et al. 1984,
Sinclair et al. 2009). Therefore, the physiological mechanisms of nitrogen acquisition
are regulated by light differentially between these two types of algae. In turbid
estuarine water, Prorocentrum spp. can take up N at high rates and may be better
competitors than Karenia and Karlodinium spp., which have a greater light
requirement for dissolved N uptake.
When two types of algae were grown in mixed culture, the estuarine species
Prorocentrum spp. overgrew the opponents in most of the treatments (Chapter 5).
However, Karlodinium veneficum overgrew P. minimum with the presence of
Rhodomonas, a potential nutrient source. The growth of both K. brevis and P.
donghaiense were reduced with the presence of Synechococcus. Other mechanisms
(e.g. allelopathy), in addition to nutrient competition, should be considered and may
also play a role in determining the dominant species. Therefore, in the mixed culture,
growth rates do not need to be at the physiological maximum for the given set of
conditions for species to become dominant. There might be other competition
mechanisms (e.g. allelopathy), other than nutrient competition, to determine the
dominant species.
In summary, there are high DIN (mostly NO3-) sources accumulated in the
upper Chesapeake Bay and its tributaries during the winter and spring (Chapter 2).

226
When the water temperature increased over 10-15 °C, estuarine species P. minimum
can take the advantage of high DIN uptake rate in turbid water, and overgrow other
dinoflagellates or diatoms (Fig. 6-1). However, DIN is depleted in the summer, but
there are still relatively high organic forms of nutrients available in the water column.
Karlodinium veneficum may be mixotrophic and feed on the organic sources, or
directly feed on other micro-algae in the water column to develop blooms.
In eutrophic coastal systems (e.g. Chesapeake Bay), there are high residual
nutrient sources or/and nutrient inputs. The exponential growth phase of batch culture
and continuous culture are used to simulate the growth of dinoflagellates in such
environment. From this study, the availability of different nutrient sources (not
limited to inorganic nutrients), but not the ratio of those nutrients, are critical for the
nutrient acquisition and bloom development. P-limitation may not develop in high
N:P ratio eutrophic water, due to the development of light-limitation (Flynn 2010b).
Light, instead of ambient N:P ratio, significantly affected the growth of all species in
this study. In Chesapeake Bay, the eutrophic areas are very turbid, and the two types
of bloom-forming dinoflagellates have different nutrient acquisition strategies:
Prorocentrum minimum keeps taking N in the dark, while K. veneficum can be
mixotrophic and may directly use organic sources. Availability of nutrient sources
and light are two key environmental factors necessary to understand the bloom
mechanisms in eutrophic waters.
The Application of Droop Model
Nutrient limitation of phytoplankton grow can either be described by the
Monod model (Monod 1950) or by the Droop model (Droop 1968, 1973). Although

227
the Monod model originated as a description of steady-state bacterial growth, it has
been used as the default description of nutrient acquisition in dynamic systems in
many ecosystem models (Flynn 2010a). It is widely used, because it is the simplest
mathematical description of nutrient limited growth, and only considers external
nutrients. The Redfield ratio (Redfield 1958), originated as an empirical observation,
has been used as a key index to identify the limited nutrient in the application of
Monod model, in which the model simulation will follow the fate of the limiting
nutrient and the consumption of other nutrients follow in proportion of the Redfield
ratio (Flynn 2010a). However, the ambient N:P ratio is the sum of both abiotic and
biotic processes. Not only nutrient consumption, but also nutrient availability affects
the ratios. For example, in Chesapeake Bay (Chapter 2), when the water column is
dominated by the abiotic processes (i.e., terrestrial input) in the winter, the ambient
N:P ratio converge to the ratios of input nutrients, which is much higher than the
Redfield ratio. However, when the water column is dominated by the biotic processes
(i.e., algal blooms), the ambient N:P ratio converge to Redfield ratio, the
stoichiometric ratio of phytoplankton cells.
In this dissertation study, the effects of ambient N:P ratio on the growth and N
acquisition Prorocentrum species were studied. The N uptake rates of Prorocentrum
spp. were more balanced with the growth rates at N:P ratios near Redfield ratio.
However, when nutrients were sufficient, there was no significant variation of the
growth rates at different N:P ratios. There was no direct evidence that growth was
regulated by the ambient N:P ratio, instead, the growth is regulated by the nutrient
acquisition ability of the cells.
228
When studying N acquisition, both the N uptake and assimilation process can
be measured and linked to the growth rates by the Droop cell quota model (Droop
1968, 1973). An intracellular nutrient pool (cell quota) is regulated by nutrient taken
into the cell and assimilated to support the growth. The growth rate is regulated by the
size of cell quota, instead of the external nutrient pool (Droop 1968, 1973). The quota
concept is considered more realistic than the Monod model, because growth can now
continue at the expense of previously accumulated nutrient (Flynn 2008). It is easier
to configure a relationship between growth rate and the internal nutrient concentration
(quota) than between growth and the external nutrient concentration (Monod)
(Goldman 1977, Flynn 2010a). Thus, growth rate is solely a function of the quota
equation with no reference to external nutrient concentrations in the application of
Droop model. In this dissertation study, the physiological mechanisms of cell quota
regulated by nutrient uptake are supported by the turbidistat study, and can be
described using individual cell quota based model. Prorocentrum spp. can take up N
at night, and supplement the cell quota, which is consistent with the observation of
maximum growth rate of Prorocentrum spp. at the beginning of the light phase in a
diel cycle. Therefore, the Droop model may better describe the physiological
activities and growth of phytoplankton cells, and can be further applied to ecosystem
modeling work. The Monod model can not biologically capture this fundamental
dynamic. The growth and physiology of phytoplankton should be directly linked to
the cell quota, which is regulated by their ability to acquire nutrients (Flynn 2010b),
instead of the ambient nutrient concentrations or ratios.

229
The Improvement of Droop Model
The cell quota model initially described in term of cell (e.g. N per cell), but
cell size varies not only with cell cycle, but also with various environmental and
physiological factors, including nutrient stress (Lehman 1976, Gotham and Frisch
1981). Therefore, the changes of cell quota may not directly respond to the nutrient
content on a cell, but due to the change of cell size. To overcome these issues, the
quota relationship has been strongly suggested to be normalized to biomass and
described in terms of carbon (Flynn 2008). However, in this dissertation study, both
the uptake and assimilation rates were measured as specific rates (h-1). The cell N
quota can be described as a dynamic system of N acquisition and consumption, and
the growth rate can be mathematically described as variation rate of cell quota.
Compared to the Monod model, the application of Droop model needs more
parameters. In the future research, experiments should be designed to get complete
data sets for the Droop model. For example, in a growth experiment, not only the
nutrients and cell number variation during the growth phase should be measured, the
variation of particulate C, N, and P in the culture also should be measured, if possible.
Also, when using C or N isotope tracer techniques to study the C-fixation or N-
uptake, the variation of C and N in the cell should be linked with the growth rate
during the incubation. The Droop model will be not only more appropriate to be
applied to simulate the phytoplankton growth and nutrient dynamics in steady state
culture, but also may be applied in ecosystem modeling.

230
References
Droop MR (1968) Vitamin B12 and marine ecology 4. kinetics of uptake growth and inhibition in Monochrysis lutheri. Journal of the Marine Biological Association of the United Kingdom 48:689-733
Droop MR (1973) Some thoughts on nutrient limitation in algae. Journal of Phycology 9:264-272
Flynn KJ (2008) Use, abuse, misconceptions and insights from quota models - The Droop cell quota model 40 years on. Oceanography and Marine Biology: An Annual Review, Vol 46 46:1-23
Flynn KJ (2010a) Ecological modelling in a sea of variable stoichiometry: Dysfunctionality and the legacy of Redfield and Monod. Progress in Oceanography 84:52-65
Flynn KJ (2010b) Do external resource ratios matter? - Implications for modelling eutrophication events and controlling harmful algal blooms. Journal of Marine Systems 83; 170-180
Goldman JC (1977) Steady-state growth of phytoplankton in continuous culture - comparison of internal and external nutrient equations. Journal of Phycology 13:251-258
Gotham IJ, Frisch HL (1981) A simple-model for cell-volume and developmental compartments in nutrient limited cyclostat cultures of algae. Journal of Theoretical Biology 92:435-467
Heil CA, Revilla M, Glibert PM, Murasko S (2007) Nutrient quality drives differential phytoplankton community composition on the southwest Florida shelf. Limnology and Oceanography 52:1067-1078
Lehman JT (1976) Photosynthetic capacity and luxury uptake of carbon during phosphate limitation in Pediastrum duplex (Chlorophyceae). Journal of Phycology 12:190-193

231
Li J, Glibert PM, Zhou M, Lu S, Lu D (2009) Relationships between nitrogen and phosphorus forms and ratios and the development of dinoflagellate blooms in the East China Sea. Marine Ecology Progress Series 383:11-26
Monod J (1950) La technique de culture continue theorie et applications. Annales De L Institut Pasteur 79:390-410
Paasche E, Bryceson I, Tangen K (1984) Interspecific variation in dark nitrogen uptake by dinoflagellates. Journal of Phycology 20:394-401
Redfield, A.C., The biological control of chemical factors in the environment, American Scientist, 1958
Sinclair G, Kamykowski D, Glibert PM (2009) Growth, uptake, and assimilation of ammonium, nitrate, and urea, by three strains of Karenia brevis grown under low light. Harmful Algae 8:770-780
Smayda T (1990) Novel and nuisance phytoplankton blooms in the sea: Evidence for a global epidemic. In: Granéli E, Sundstrom B, Edler L, Anderson DM (eds) Toxic Marine Phytoplankton. Elsevier, New York
Smayda TJ (1997) Harmful algal blooms: Their ecophysiology and general relevance to phytoplankton blooms in the sea. Limnology and Oceanography 42:1137-1153
Smayda TJ (2002) Adaptive ecology, growth strategies and the global bloom expansion of dinoflagellates. Journal of Oceanography 58:281-294
Smayda TJ, Reynolds CS (2001) Community assembly in marine phytoplankton: application of recent models to harmful dinoflagellate blooms. Journal of Plankton Research 23:447-461

232
Figure
Figure 6-1 The conceptual model of the bloom development in the Chesapeake Bay: Prorocentrum minimum developed blooms on DIN in the spring; Karlodinium veneficum developed blooms on DON or directly feeding on other microalgae as food sources.
233
Complete References
Aalderink RH, Jovin R (1997) Estimation of the photosynthesis/irradiance (P/I) curve parameters from light and dark bottle experiments. Journal of Plankton Research 19:1713-1742
Adolf J, Bachvaroff T, Place AR (2007) Cryptophytes drive blooms of mixotrophic harmful algae: A testable hypothesis based on Karlodinium veneficum in Chesapeake Bay. Journal of Phycology 43:31-31
Adolf JE, Bachvaroff T, Place AR (2008) Can cryptophyte abundance trigger toxic Karlodinium veneficum blooms in eutrophic estuaries? Harmful Algae 8:119-128
Adolf JE, Bachvaroff TR, Krupatkina DN, Nonogaki H, Brown PJP, Lewitus AJ, Harvey HR, Place AR (2006a) Species specificity and potential roles of Karlodinium micrum toxin. African Journal of Marine Science 28:415-419
Adolf JE, Stoecker DK, Harding LW (2003) Autotrophic growth and photoacclimation in Karlodinium micrum (Dinophyceae) and Storeatula major (Cryptophyceae). Journal of Phycology 39:1101-1108
Adolf JE, Stoecker DK, Harding LW (2006b) The balance of autotrophy and heterotrophy during mixotrophic growth of Karlodinium micrum (Dinophyceae). Journal of Plankton Research 28:737-751
Adolf JE, Yeager CL, Miller WD, Mallonee ME, Harding LW (2006c) Environmental forcing of phytoplankton floral composition, biomass, and primary productivity in Chesapeake Bay, USA. Estuarine Coastal and Shelf Science 67:108-122
Andersen JH, Schluter L, Ærtebjerg G (2006) Coastal eutrophication: recent developments in definitions and implications for monitoring strategies. Journal of Plankton Research 28:621-628
Anderson DM (1997) Turning back the harmful red tide - Commentary. Nature 388:513-514
234
Anderson DM, Burkholder JM, Cochlan WP, Glibert PM, Gobler CJ, Heil CA, Kudela RM, Parsons ML, Rensel JEJ, Townsend DW, Trainer VL, Vargo GA (2008) Harmful algal blooms and eutrophication: Examining linkages from selected coastal regions of the United States. Harmful Algae 8:39-53
Anderson DM, Glibert PM, Burkholder JM (2002) Harmful algal blooms and eutrophication: Nutrient sources, composition, and consequences. Estuaries 25:704-726
Anderson SM, Roels OA (1981) Effects of light-intensity on nitrate and nitrite uptake and excretion by Chaetoceros curvisetus. Marine Biology 62:257-261
Baly E (1935) The kinetics of photosynthesis. Proceedings of the Royal Society B 117:218-239
Behrenfeld MJ, Prasil O, Babin M, Bruyant F (2004) In search of a physiological basis for covariations in light-limited and light-saturated photosynthesis. Journal of Phycology 40:4-25
Bennett WN, Boraas ME (1989) Comparison of population-dynamics between slow-growing and fast-growing strains of the rotifer Brachionus calyciflorus pallas in continuous Culture. Oecologia 81:494-500
Berthouex PM, Pallesen L, Booman K, Sedlack R (1983) A preliminary assessment of Michigan's phosphorus detergent ban. Journal Water Pollution Control Federation 55:323-325
Boynton WR, Garber JH, Summers R, Kemp WM (1995) Inputs, transformations, and transport of nitrogen and phosphorus in Chesapeake Bay and selected tributaries. Estuaries 18:285-314
Boynton WR, Kemp WM (1985) Nutrient regeneration and oxygen-consumption by sediments along an estuarine salinity gradient. Marine Ecology-Progress Series 23:45-55
Bricker, S.B., C.G. Clement, D.E. Pirhalla, S.P. Orlando, and D.R.G. Farrow. 1999. National Estuarine Eutrophication Assessment: Effects of Nutrient Enrichment in the Nation's Estuaries. Silver Spring, MD: National Oceanic and Atmospheric Administration (NOAA), National Ocean Service. 71

235
Bronk DA, Sanderson MP, Mulholland MR (2004) Organic and inorganic nitrogen uptake kinetics in field populations dominated by Karenia brevis. In: Steidinger KA, Landsberg JH, Tomas CR, Vargo GA (eds) Harmful Algae 2002, Florida Fish and Wildlife Conservation Commission, Florida Institute of Oceanography and Intergovernmental Oceanographic Commission of UNESCO, St. Petersberg, Florida, USA, p 80-82
Bulgakov NG, Levich AP (1999) The nitrogen : phosphorus ratio as a factor regulating phytoplankton community structure. Archiv Fur Hydrobiologie 146:3-22
Burkholder JM, Glasgow HB (1997) Pfiesteria piscicida and other Pfiesteria-like dinoflagellates: Behavior, impacts, and environmental controls. Limnology and Oceanography 42:1052-1075
Burkholder JM, Glibert PM, Skelton HM (2008) Mixotrophy, a major mode of nutrition for harmful algal species in eutrophic waters. Harmful Algae 8:77-93
Burns CL, Pennock JR, Lores EM, R.M. G (2000) The effect of nitrogen source on the growth and toxicity of three potentially harmful dinoflagellates. Journal of Phycology 36
Burns JA, Zehr JP, Capone DG (2002) Nitrogen-fixing phylotypes of Chesapeake Bay and Neuse River estuary sediments. Microbial Ecology 44:336-343
Caron DA, Sanders RW, Lim EL, Marrase C, Amaral LA, Whitney S, Aoki RB, Porter KG (1993) Light dependent phagotrophy in the fresh water mixotrophic chrysophyte Dinobryon cylindricum. Microbial Ecology 25:93-111
Carter V, Rybicki NB, Landwehr JM, Turtora M (1994) Role of weather and water quality in population dynamics of submersed macrophytes in the tidal Potomac River. Estuaries 17:417-426
Chai C, Yu ZM, Song XX, Cao XH (2006) The status and characteristics of eutrophication in the Yangtze River (Changjiang) estuary and the adjacent East China Sea, China. Hydrobiologia 563:313-328
Chisholm SW, Nobbs PA, Stross RG (1975) Simulation of algal growth and competition in a phosphate-limited cyclostat. Abstracts of Papers of the American Chemical Society:42-42

236
Cloern JE (2001) Our evolving conceptual model of the coastal eutrophication problem. Marine Ecology-Progress Series 210:223-253
Cloern JE, Jassby AD (2010) Patterns and scales of phytoplankton variability in estuarine-voastal ecosystems. Estuaries and Coasts 33:230-241
Cochlan WP, Harrison PJ, Denman KL (1991) Diel periodicity of nitrogen uptake by marine-phytoplankton in nitrate-rich environments. Limnology and Oceanography 36:1689-1700
Conway HL (1977) Interactions of inorganic nitrogen in uptake and assimilation by marine phytoplankton. Marine Biology 39:221-232
Cornwell JC, Conley DJ, Owens M, Stevenson JC (1996) A sediment chronology of the eutrophication of Chesapeake Bay. Estuaries 19:488-499
Cullen J, Zhu M, Davis R, Pierson D (1985) Vertical migration, carbohydrate synthesis, and nocturnal nitrate uptake during growth of Heterocapsa niei in a laboratory water column. In: Anderson D, White A, Baden D (eds) Toxic dinoflagellates. Elsevier, Amsterdam, p 189-194
Deeds J (2009) The evolving story of Gymnodinium galatheanum = Karlodinium micrum = Karlodinium veneficum. A ten year perspective. Journal of Phycology 45:1-2
Deeds JR, Reimschuessel R, Place AR (2006) Histopathological effects in fish exposed to the toxins from Karlodinium micrum. Journal of Aquatic Animal Health 18:136-148
Deeds JR, Terlizzi DE, Adolf JE, Stoecker DK, Place AR (2002) Toxic activity from cultures of Karlodinium micrum (=Gyrodinium galatheanum) (Dinophyceae) – a dinoflagellate associated with fish mortalities in an estuarine aquaculture facility. Harmful Algae 1:169-189
Degens ET, Mopper K (1976) Factors controlling distribution and early diagenesis of organic marine sediments. In: Riley JP, Chester R (eds) Chemical oceanography, Vol 6. Academic London, New York, San Francisco, p 60-114
237
Doemel WN, Brooks AE (1975) Detergent phosphorus and algal growth. Water Research 9:713-719
Doering PH, Oviatt CA, Nowicki BL, Klos EG, Reed LW (1995) Phosphorus and nitrogen limitation of primary production in a simulated estuarine gradient. Marine Ecology-Progress Series 124:271-287
Droop MR (1968) Vitamin B12 and marine ecology 4. kinetics of uptake growth and inhibition in Monochrysis lutheri. Journal of the Marine Biological Association of the United Kingdom 48:689-733
Droop MR (1973) Some thoughts on nutrient limitation in algae. Journal of Phycology 9:264-272
Duan SW, Liang T, Zhang S, Wang LJ, Zhang XM, Chen XB (2008) Seasonal changes in nitrogen and phosphorus transport in the lower Changjiang River before the construction of the Three Gorges Dam. Estuarine Coastal and Shelf Science 79:239-250
Dyhrman, S., 2005. Ectoenzymes in Prorocentrum minimum: alkaline phosphatase and leucine aminopeptidase. Harmful Algae 4, 619–627
Eppley RW, Holm-Hansen O, Strickland JD (1968) Some observations on vertical migration of dinoflagellates. Journal of Phycology 4:333-340
Eppley RW, Renger EH (1974) Nitrogen assimilation of an oceanic diatom in nitrogen-limited continuous culture. Journal of Phycology 10:15-23
Eppley RW, Rogers JN, McCarthy JJ, Sournia A (1971) Light/dark periodicity in nitrogen assimilation of marine phytoplankters Skeletonema costatum and Coccolithus huxleyi in N-limited chemostat culture. Journal of Phycology 7:150-154
Falkowski PG, Dubinsky Z, Wyman K (1985) Growth-irradiance relationships in phytoplankton. Limnology and Oceanography 30:311-321
Fan C, Glibert PM, Alexander J, Lomas MW (2003a) Characterization of urease activity in three marine phytoplankton species, Aureococcus anophagefferens,

238
Prorocentrum minimum, and Thalassiosira weissflogii. Marine Biology 142:949-958
Fan CL, Glibert PM (2005) Effects of light on nitrogen and carbon uptake during a Prorocentrum minimum bloom. Harmful Algae 4:629-641
Fan CL, Glibert PM, Burkholder JM (2003b) Characterization of the affinity for nitrogen, uptake kinetics, and environmental relationships for Prorocentrum minimum in natural blooms and laboratory cultures. Harmful Algae 2:283-299
Fenaux R, Malara G, Claustre H (1985) A turbidostat driven and controlled by microcomputer. Aquaculture 48:91-95
Fisher T, Boicourt W, Boynton W, Capone D, Chao SY, Conley D, Cornwell J, Costanza R, Delia C, Glibert P, Kemp M, Malone T, Peele E, Sanford L, Ulanowicz R (1990) Responses of Chesapeake Bay to nutrient Inputs - recycling, production, and export. Abstracts of Papers of the American Chemical Society 199:35-Geoc
Fisher TR, Gustafson AB, Sellner K, Lacouture R, Haas LW, Wetzel RL, Magnien R, Everitt D, Michaels B, Karrh R (1999) Spatial and temporal variation of resource limitation in Chesapeake Bay. Marine Biology 133:763-778
Fisher TR, Hagy JD, Boynton WR, Williams MR (2006) Cultural eutrophication in the Choptank and Patuxent estuaries of Chesapeake Bay. Limnology and Oceanography 51:435-447
Fisher TR, Peele ER, Ammerman JW, Harding LW (1992) Nutrient limitation of phytoplankton in Chesapeake Bay. Marine Ecology-Progress Series 82:51-63
Flynn KJ (2002) How critical is the critical N : P ratio? Journal of Phycology 38:961-970
Flynn KJ (2008) Use, abuse, misconceptions and insights from quota models - The Droop cell quota model 40 years on. Oceanography and Marine Biology: An Annual Review, Vol 46 46:1-23

239
Flynn KJ (2010a) Ecological modelling in a sea of variable stoichiometry: Dysfunctionality and the legacy of Redfield and Monod. Progress in Oceanography 84:52-65
Flynn KJ (2010b) Do external resource ratios matter? - Implications for modelling eutrophication events and controlling harmful algal blooms. Journal of Marine Systems 83; 170-180
Frisch HL, Gotham IJ (1977) Periodic algal cyclostat populations. Journal of Theoretical Biology 66:665-678
Gallegos CL, Bergstrom PW (2005) Effects of a Prorocentrum minimum bloom on light availability for and potential impacts on submersed aquatic vegetation in upper Chesapeake Bay. Harmful Algae 4:553-574
Glibert PM, Anderson DM, Gentien P, Granéli E, Sellner KG (2005a) The global, complex phenomena of harmful algal blooms. Oceanography 18 (2):136-147
Glibert PM, Burkholder JM (2006) The complex relationships between increasing fertilization of the earth, coastal eutrophication and proliferation of harmful algal blooms. In: Granéli E, Turner J (eds) Ecology of Harmful Algae. Springer, p 341-354
Glibert PM, Burkholder JM, Graneli E, Anderson DM (2008a) Advances and insights in the complex relationships between eutrophication and HABs: Preface to the special issue. Harmful Algae 8:1-2
Glibert PM, Burkholder JM, Kana TM, Alexander J, Skelton H, Shilling C (2009) Grazing by Karenia brevis on Synechococcus enhances its growth rate and may help to sustain blooms. Aquatic Microbial Ecology 55:17-30
Glibert PM, Capone DG (1993) Mineralization and assimilation in aquatic, sediment, and wetland systems. In: Knowles R, Blackburn TH (eds) Nitrogen isotope techniques, Vol 243-272. Academic Press
Glibert PM, Conley DJ, Fisher TR, Harding LW, Malone TC (1995) Dynamics of the 1990 winter spring bloom in Chesapeake Bay. Marine Ecology-Progress Series 122:27-43
240
Glibert PM, Garside C, Fuhrman JA, Roman MR (1991) Time-dependent coupling of inorganic and organic nitrogen uptake and regeneration in the plume of the Chesapeake Bay Estuary and its regulation by large heterotrophs. Limnology and Oceanography 36:895-909
Glibert PM, Harrison J, Heil C, Seitzinger S (2006) Escalating worldwide use of urea - a global change contributing to coastal eutrophication. Biogeochemistry 77:441-463
Glibert PM, Heil CA, Hollander D, Revilla M, Hoare A, Alexander J, Murasko S (2004) Evidence for dissolved organic nitrogen and phosphorus uptake during a cyanobacterial bloom in Florida Bay. Marine Ecology-Progress Series 280:73-83
Glibert PM, Magnien R, Lomas MW, Alexander J, Fan CL, Haramoto E, Trice M, Kana TM (2001) Harmful algal blooms in the Chesapeake and Coastal Bays of Maryland, USA: Comparison of 1997, 1998, and 1999 events. Estuaries 24:875-883
Glibert PM, Magnien RE (2004) Harmful algal blooms in the Chesapeake Bay, USA: Common species, relationships to nutrient loading, management approaches, successes, and challenges. In: Hall S, Anderson D, Kleindinst J, Zhu M, Zou Y (eds) Harmful Algae Management and Mitigation. Asia-Pacific Economic Cooperation, Singapore
Glibert PM, Mayorga E, Seitzinger S (2008b) Prorocentrum minimum tracks anthropogenic nitrogen and phosphorus inputs on a global basis: Application of spatially explicit nutrient export models. Harmful Algae 8:33-38
Glibert PM, McCarthy JJ (1984) Uptake and assimilation of ammonium and nitrate by phytoplankton - Indexes of nutritional status for natural assemblages. Journal of Plankton Research 6:677-697
Glibert PM, Terlizzi DE (1999) Cooccurrence of elevated urea levels and dinoflagellate blooms in temperate estuarine aquaculture ponds. Applied and Environmental Microbiology 65:5594-5596
Glibert PM, Trice TM, Michael B, Lane L (2005b) Urea in the tributaries of the Chesapeake and Coastal Bays of Maryland. Water Air and Soil Pollution 160:229-243

241
Goldman JC (1977) Steady-state growth of phytoplankton in continuous culture - comparison of internal and external nutrient equations. Journal of Phycology 13:251-258
Goldman JC, Glibert PM (1982) Comparative rapid ammonium uptake by 4 species of marine-phytoplankton. Limnology and Oceanography 27:814-827
Goldman JC, Mccarthy JJ, Peavey DG (1979) Growth-rate influence on the chemical composition of phytoplankton in oceanic waters. Nature 279:210-215
Goolsby DA, Battaglin WA (2000) Nitrogen in the Mississippi basin-estimating sources and predicting flux to the Gulf of Mexico. USGS Fact Sheet 135-00
Goshorn D, Deeds J, Tango P, Poukish C, Place AR, McGinty M, Butler W, Luckett C, Magnien R (2004) Occurrence of Karlodinium micrum and its association with fish kills in Maryland estuaries. In: Steidinger KA, Landsberg JA, Tomas CR, Vargo GA (eds) Proceedings of Harmful Algae 2002. IOC-UNESCO, St. Petersberg, p 361–363
Gotham IJ, Frisch HL (1981) A simple-model for cell-volume and developmental compartments in nutrient limited cyclostat cultures of algae. Journal of Theoretical Biology 92:435-467
Gotham IJ, Rhee GY (1981) Comparative kinetic-studies of phosphate-limited growth and phosphate-uptake in phytoplankton in continuous culture. Journal of Phycology 17:257-265
Gotham IJ, Rhee GY (1982) Effects of nitrate and phosphate limitation on cyclostat growth of 2 fresh-water diatoms. Journal of General Microbiology 128:199-205
Granéli E, Carlsson P, Legrand C (1999) The role of C, N and P in dissolved and particulate organic matter as a nutrient source for phytoplankton growth, including toxic species. Aquatic Ecology 33:17-27
Grzebyk D, Berland B (1996) Influences of temperature, salinity and irradiance on growth of Prorocentrum minimum (Dinophyceae) from the Mediterranean Sea. Journal of Plankton Research 18:1837-1849
242
Guillard RR, Ryther JH (1962) Studies of marine planktonic diatoms 1. Cyclotella nana Hustedt, and Detonula confervacea (Cleve) Gran. Canadian Journal of Microbiology 8:229
Hagy JD, Boynton WR, Keefe CW, Wood KV (2004) Hypoxia in Chesapeake Bay, 1950-2001: Long-term change in relation to nutrient loading and river flow. Estuaries 27:634-658
Hallegraeff GM (1993) A review of harmful algal blooms and their apparent global increase. Phycologia 32:79-99
Haraguchi K, Yamamoto T, Chiba S, Shimizu Y, Nagao M (2010) Effects of phytoplankton vertical migration on the formation of oxygen depleted water in a shallow coastal sea. Estuarine Coastal and Shelf Science 86:441-449
Harding LW, Coats DW (1988) Photosynthetic physiology of Prorocentrum mariae-lebouriae (Dinophyceae) during Its subpycnocline transport in Chesapeake Bay. Journal of Phycology 24:77-89
Harding LW, Mallonee ME, Perry ES (2002) Toward a predictive understanding of primary productivity in a temperate, partially stratified estuary. Estuarine Coastal and Shelf Science 55:437-463
Harding LW, Meeson BW, Tyler MA (1983) Photoadaptation and diel periodicity of photosynthesis in the dinoflagellate Prorocentrum mariae-lebouriae. Marine Ecology-Progress Series 13:73-85
Harding LW, Perry ES (1997) Long-term increase of phytoplankton biomass in Chesapeake Bay, 1950-1994. Marine Ecology-Progress Series 157:39-52
Hartig JH, Horvath FJ (1982) A preliminary assessment of Michigan's phosphorus detergent ban. Journal Water Pollution Control Federation 54:193-197
Healey FP (1977) Ammonium and urea uptake by some freshwater algae. Canadian Journal of Botany-Revue Canadienne De Botanique 55:61-69
Heaney S, Eppley R (1981) Light, temperature and nitrogen as interacting factors affecting diel vertical migrations of dinoflagellates in culture. Journal of Plankton Research 3:331-344
243
Hecky RE, Campbell P, Hendzel LL (1993) The stoichiometry of carbon, nitrogen, and phosphorus in particulate matter of lakes and oceans. Limnology and Oceanography 38:709-724
Hecky RE, Kilham P (1988) Nutrient limitation of phytoplankton in fresh-water and marine environments - a review of recent evidence on the effects of enrichment. Limnology and Oceanography 33:796-822
Heil CA, Glibert PM, Al-Sarawl MA, Faraj M, Behbehani M, Husain M (2001) First record of a fish-killing Gymnodinium sp bloom in Kuwait Bay, Arabian Sea: chronology and potential causes. Marine Ecology-Progress Series 214:15-23
Heil CA, Glibert PM, Fan CL (2005) Prorocentrum minimum (Pavillard) Schiller - a review of a harmful algal bloom species of growing worldwide importance. Harmful Algae 4:449-470
Heil CA, Revilla M, Glibert PM, Murasko S (2007) Nutrient quality drives differential phytoplankton community composition on the southwest Florida shelf. Limnology and Oceanography 52:1067-1078
Heisler J, Glibert PM, Burkholder JM, Anderson DM, Cochlan W, Dennison WC, Dortch Q, Gobler CJ, Heil CA, Humphries E, Lewitus A, Magnien R, Marshall HG, Sellner K, Stockwell DA, Stoecker DK, Suddleson M (2008) Eutrophication and harmful algal blooms: A scientific consensus. Harmful Algae 8:3-13
Hill SH, Abbott MR, Denman KL (1985) A computer-controlled turbidostat for the culture of planktonic algae. Canadian Journal of Fisheries and Aquatic Sciences 42:744-753
Hirsbrunner M (1981) A chemostat-apparatus for continuous culture of agae. Schweizerische Zeitschrift Fur Hydrologie-Swiss Journal of Hydrology 43:370-376
Hodgkiss IJ, Ho KC (1997) Are changes in N:P ratios in coastal waters the key to increased red tide blooms? Hydrobiologia 352:141-147
Hoffman FA, Bishop JW (1994) Impacts of a phosphate detergent ban on concentrations of phosphorus in the James River, Virginia. Water Research 28:1239-1240

244
Holmes RW, Williams PM, Eppley RW (1967) Red water in La Jolla Bay 1964-1966. Limnology and Oceanography 12:503-512
Howard MDA, Cochlan WP, Ladizinsky N, Kudela RM (2007) Nitrogenous preference of toxigenic Pseudo-nitzschia australis (Bacillariophyceae) from field and laboratory experiments. Harmful Algae 6:206-217
Howarth RW (2008) Coastal nitrogen pollution: A review of sources and trends globally and regionally. Harmful Algae 8:14-20
Howarth RW, Boyer EW, Pabich WJ, Galloway JN (2002) Nitrogen use in the United States from 1961–2000 and potential future trends. AMBIO 32:88-96
Jaworski NA, Howarth RW, Hetling LI (1997) Atmospheric deposition of nitrogen oxides onto the landscape contributes to coastal eutrophication in the northeast United States. Environmental Science & Technology 31:1995-2004
Jeong H, Yoo Y, Kim J, Seong K, Kang N, Kim T (2010) Growth, feeding, and ecological roles of the mixotrophic and heterotrophic dinoflagellates in marine planktonic food webs. Ocean Science Journal 45:65-91
Jeong HJ, Du Yoo Y, Park JY, Song JY, Kim ST, Lee SH, Kim KY, Yih WH (2005a) Feeding by phototrophic red-tide dinoflagellates: five species newly revealed and six species previously known to be mixotrophic. Aquatic Microbial Ecology 40:133-150
Jeong HJ, Park JY, Nho JH, Park MO, Ha JH, Seong KA, Jeng C, Seong CN, Lee KY, Yih WH (2005b) Feeding by red-tide dinoflagellates on the cyanobacterium Synechococcus. Aquatic Microbial Ecology 41:131-143
Jeong HJ, Song JY, Lee CH, Kim ST (2004) Feeding by larvae of the mussel Mytilus galloprovincialis on red-tide dinoflagellates. Journal of Shellfish Research 23:185-195
Jones HLJ, Durjun P, Leadbeater BSC, Green JC (1995) The relationship between photoacclimation and phagotrophy with Respect to Chlorophyll a, carbon and nitrogen content, and cell size of Chrysochromulina brevifilum (Prymnesiophyceae). Phycologia 34:128-134
245
Jordan TE, Cornwell JC, Boynton WR, Anderson JT (2008) Changes in phosphorus biogeochemistry along an estuarine salinity gradient: The iron conveyer belt. Limnology and Oceanography 53:172-184
Jordan TE, Correll DL, Miklas J, Weller DE (1991) Nutrients and chlorophyll at the interface of a watershed and an estuary. Limnology and Oceanography 36:251-267
Justic D, Rabalais NN, Turner RE (1995) Stoichiometric nutrient balance and origin of coastal eutrophication. Marine Pollution Bulletin 30:41-46
Kalyuzhin VA (1998) The growth of a turbidostat yeast culture in the presence of high concentrations of various compounds in a steady-state regime and under osmotic shock. Microbiology 67:499-503
Kanda J, Ziemann DA, Conquest LD, Bienfang PK (1989) Light-dependency of nitrate uptake by phytoplankton over the spring bloom in Auke Bay, Alaska. Marine Biology 103:563-569
Kemp WM, Boynton WR, Adolf JE, Boesch DF, Boicourt WC, Brush G, Cornwell JC, Fisher TR, Glibert PM, Hagy JD, Harding LW, Houde ED, Kimmel DG, Miller WD, Newell RIE, Roman MR, Smith EM, Stevenson JC (2005) Eutrophication of Chesapeake Bay: historical trends and ecological interactions. Marine Ecology-Progress Series 303:1-29
Koerselman W, Meuleman AFM (1996) The vegetation N:P ratio: A new tool to detect the nature of nutrient limitation. Journal of Applied Ecology 33:1441-1450
Kudela RM, Cochlan WP, Dugdale RC (1997) Carbon and nitrogen uptake response to light by phytoplankton during an upwelling event. Journal of Plankton Research 19:609-630
Lagus A, Suomela J, Weithoff G, Heikkila K, Helminen H, Sipura J (2004) Species-specific differences in phytoplankton responses to N and P enrichments and the N:P ratio in the Archipelago Sea, northern Baltic Sea. Journal of Plankton Research 26:779-798

246
Lane L, Rhoades S, Thomas C, Van Heukelem L (2000) Analytical services laboratory standard operating procedures, University of Maryland Center for Environmental Science, Cambridge, Maryland.
Lee GF, Joneslee A (1995) Impacts of a phosphate detergent ban on concentrations of phosphorus in the James River, Virginia - comment. Water Research 29:1425-1426
Lee YS, Seiki T, Mukai T, Takimoto K, Okada M (1996) Limiting nutrients of phytoplankton community in Hiroshima Bay, Japan. Water Research 30:1490-1494
Lehman JT (1976) Photosynthetic capacity and luxury uptake of carbon during phosphate limitation in Pediastrum duplex (Chlorophyceae). Journal of Phycology 12:190-193
Leighfield TA, Van Dolah FM (2001) Cell cycle regulation in a dinoflagellate Amphidinium operculatum: identification of the diel entraining cue and a possible role for cyclic AMP. Journal of Experimental Marine Biology and Ecology 262:177-197
Li AS, Stoecker DK, Adolf JE (1999) Feeding, pigmentation, photosynthesis and growth of the mixotrophic dinoflagellate Gyrodinium galatheanum. Aquatic Microbial Ecology 19:163-176
Li AS, Stoecker DK, Coats DW (2000) Spatial and temporal aspects of Gyrodinium galatheanum in Chesapeake Bay: distribution and mixotrophy. Journal of Plankton Research 22:2105-2124
Li AS, Stoecker DK, Coats DW, Adam EJ (1996) Ingestion of fluorescently labeled and phycoerythrin-containing prey by mixotrophic dinoflagellates. Aquatic Microbial Ecology 10:139-147
Li J, Glibert PM, Alexander JA (in press) Effects of ambient N:P ratio on the growth and nitrogen uptake of harmful dinoflagellate Prorocentrum minimum and Prorocentrum donghaiense in turbidistat. Chinese Journal of Oceanology and Limnology

247
Li J, Glibert PM, Zhou MJ (2010) Temporal and spatial variability in nitrogen uptake kinetics during harmful dinoflagellate blooms in the East China Sea. Harmful Algae 9:531-539
Li J, Glibert PM, Zhou MJ, Lu SH, Lu DD (2009) Relationships between nitrogen and phosphorus forms and ratios and the development of dinoflagellate blooms in the East China Sea. Marine Ecology-Progress Series 383:11-26
Lie HJ, Cho CH, Lee JH, Lee S (2003) Structure and eastward extension of the Changjiang River plume in the East China Sea. Journal of Geophysical Research-Oceans 108:-
Lindroth P, Mopper K (1979) High-performance liquid-chromatographic determination of subpicomole amounts of amino-acids by precolumn fluorescence derivatization with ortho-phthaldialdehyde. Analytical Chemistry 51:1667-1674
Litke DW (1999) Review of phosphorus control measures in the United States and their effects on water quality, U.S. Geological Survey
Lomas MW, Glibert PM (1999a) Interactions between NH4+ and NO3
- uptake and assimilation: comparison of diatoms and dinoflagellates at several growth temperatures. Marine Biology 133:541-551
Lomas MW, Glibert PM (1999b) Temperature regulation of nitrate uptake: A novel hypothesis about nitrate uptake and reduction in cool-water diatoms. Limnology and Oceanography 44:556-572
Lomas MW, Glibert PM (2000) Comparisons of nitrate uptake, storage, and reduction in marine diatoms and flagellates. Journal of Phycology 36:903-913
Lomas MW, Glibert PM, Berg GM, Burford M (1996) Characterization of nitrogen uptake by natural populations of Aureococcus anophagefferens (Chrysophyceae) as a function of incubation duration, substrate concentration, light, and temperature. Journal of Phycology 32:907-916
Lu DD, Goebel J (2001) Five red tide species in genus Prorocentrum including the description of Prorocentrum donghaiense Lu Sp. Nov. from the East China Sea. Chinese Journal of Oceanology and Limnology 4:337-344
248
Maki AW, Porcella DB, Wendt RH (1984) The impact of detergent phosphorus bans on receiving water-quality. Water Research 18:893-903
Malone TC, Conley DJ, Fisher TR, Glibert PM, Harding LW, Sellner KG (1996) Scales of nutrient-limited phytoplankton productivity in Chesapeake Bay. Estuaries 19:371-385
Malone TC, Crocker LH, Pike SE, Wendler BW (1988) Influences of River Flow on the Dynamics of Phytoplankton Production in a Partially Stratified Estuary. Marine Ecology-Progress Series 48:235-249
Malone TC, Garside C, Haines KC, Roels OA (1975) Nitrate Uptake and Growth of Chaetoceros Sp in Large Outdoor Continuous Cultures. Limnology and Oceanography 20:9-19
Marshall HG, Burchardt L, Lacouture R (2005) A review of phytoplankton composition within Chesapeake Bay and its tidal estuaries. Journal of Plankton Research 27:1083-1102
Marshall HG, Egerton T, Stem T, Hicks J, Kokocinski M (2004) Extended bloom concentration of the toxic dinoflagellate Dinophysis acuminata in Virginia estuaries during late winter and early spring, 2002 In: Steidinger KA, Landsberg JA, Tomas CR, Vargo GA (eds) Proceedings of Harmful Algae 2002. IOC-UNESCO, St. Petersberg, p 364–366
Marshall HG, Lacouture RV, Buchanan C, Johnson JM (2006) Phytoplankton assemblages associated with water quality and salinity regions in Chesapeake Bay, USA. Estuarine Coastal and Shelf Science 69:10-18
McDuff RE, Chisholm SW (1982) The calculation of in situ growth-rates of phytoplankton populations from fractions of cells undergoing mitosis - a clarification. Limnology and Oceanography 27:783-788
Megard RO, Berman T, Curtis PJ, Vaughan PW (1985) Dependence of phytoplankton assimilation quotients on light and nitrogen-source - implications for oceanic primary productivity. Journal of Plankton Research 7:691-702
Moisander PH, Morrison AE, Ward BB, Jenkins BD, Zehr JP (2007) Spatial-temporal variability in diazotroph assemblages in Chesapeake Bay using an oligonucleotide nifH microarray. Environmental Microbiology 9:1823-1835

249
Moncheva S, Gotsis-Skretas O, Pagou K, Krastev A (2001) Phytoplankton blooms in Black Sea and Mediterranean coastal ecosystems subjected to anthropogenic eutrophication: Similarities and differences. Estuarine Coastal and Shelf Science 53:281-295
Monod J (1950) La technique de culture continue theorie et applications. Annales De L Institut Pasteur 79:390-410
Mulholland MR, Bernhardt PW, Heil CA, Bronk DA, O'Neil JM (2006) Nitrogen fixation and release of fixed nitrogen by Trichodesmium spp. in the Gulf of Mexico. Limnology and Oceanography 51:1762-1776
Mulholland MR, Ohki K, Capone DG (1999) Nitrogen utilization and metabolism relative to patterns of N2 fixation in cultures of Trichodesmium NIBB1067. Journal of Phycology 35:977-988
NRC (2000) Clean coastal waters: Understanding and reducing the effects of nutrient pollution. National Academies Press.
Nygaard K, Tobiesen A (1993) Bacterivory in algae - a survival strategy during nutrient limitation. Limnology and Oceanography 38:273-279
Olson RJ, Chisholm SW (1986) Effects of light and nitrogen limitation on the cell cycle of the dinoflagellate Amphidinium carteri. Journal of Plankton Research 8:785-793
Olsson P, Granéli E (1991) Observations on diurnal vertical migration and phased cell-division for 3 coexisting marine dinoflagellates. Journal of Plankton Research 13:1313-1324
Paasche E, Bryceson I, Tangen K (1984) Interspecific variation in dark nitrogen uptake by dinoflagellates. Journal of Phycology 20:394-401
Paerl HW (1997) Coastal eutrophication and harmful algal blooms: Importance of atmospheric deposition and groundwater as ''new'' nitrogen and other nutrient sources. Limnology and Oceanography 42:1154-1165
Paerl HW, Valdes LM, Joyner AR, Piehler MF (2004) Solving problems resulting from solutions: Evolution of a dual nutrient management strategy for the

250
eutrophying Neuse river estuary, North Carolina. Environmental Science & Technology 38:3068-3073
Pan Y, Cembella AD (1998) Flow cytometric determination of cell cycles and growth rates in Prorocentrum spp. In: Reguera B, Blanco J, Fernandez ML, Wyatt T (eds) Harmful Algae, Xunta de Galicia and Intergovernmental Oceanic Commission of UNESCO, p 173-176
Phillips DJH, Tanabe S (1989) Aquatic pollution in the Far-East. Marine Pollution Bulletin 20:297-303
Pinckney JL, Paerl HW, Tester P, Richardson TL (2001) The role of nutrient loading and eutrophication in estuarine ecology. Environmental Health Perspectives 109:699-706
Ptacnik R, Andersen T, Tamminen T (2010) Performance of the Redfield Ratio and a family of nutrient limitation indicators as thresholds for phytoplankton N vs. P limitation. Ecosystems 13:1201-1214
Radach G, Berg J, Hagmeier E (1990) Long-term changes of the annual cycles of meteorological, hydrographic, nutrient and phytoplankton time-series at Helgoland and at Lv Elbe 1 in the German Bight. Continental Shelf Research 10:305-328
Redfield A.C. On the proportions of organic derivations in sea water and their relation to the composition of plankton. In James Johnstone Memorial Volume. (ed. R.J. Daniel). University Press of Liverpool, pp. 177-192, 1934
Redfield, A.C. The biological control of chemical factors in the environment, American Scientist, 1958
Revilla M, Alexander J, Glibert PM (2005) Urea analysis in coastal waters: comparison of enzymatic and direct methods. Limnology and Oceanography-Methods 3:290-299
Rhee G-Y (1978) The continuous culture in phytoplankton ecology. In: Droop MR, Jannasch HW (eds) Advances in Aquatic Microbiology

251
Rhee GY (1973) Continuous culture study of phosphate uptake, growth-rate and polyphosphate in Scenedesmus sp. Journal of Phycology 9:495-506
Rhee GY, Gotham IJ (1981) The effect of environmental-factors on phytoplankton growth - light and the interactions of light with nitrate limitation. Limnology and Oceanography 26:649-659
Riegman R (1995) Nutrient-related selection mechanisms in marine phytoplankton communities and the impact of eutrophication on the planktonic food web. Water Science and Technology 32:63-75
Rines JEB, McFarland MN, Donaghay PL, Sullivan JM (2010) Thin layers and species-specific characterization of the phytoplankton community in Monterey Bay, California, USA. Continental Shelf Research 30:66-80
Rudek J, Paerl HW, Mallin MA, Bates PW (1991) Seasonal and hydrological control of phytoplankton nutrient limitation in the lower Neuse River Estuary, North Carolina. Marine Ecology-Progress Series 75:133-142
Salerno M, Stoecker DK (2009) Ectocellular glucosidase and peptidase activity of the mixotrophic dinoflagellate Prorocentrum minimum (Dinophyceae). Journal of Phycology 45:34-45
Sanders RW, Porter KG, Caron DA (1990) Relationship between phototrophy and phagotrophy in the mixotrophic chrysophyte Poterioochromonas malhamensis. Microbial Ecology 19:97-109
Sciandra A (1991) Coupling and uncoupling between nitrate uptake and growth rate in Prorocentrum minimum (Dinophyceae) under different frequencies of pulsed nitrate supply. Marine Ecology-Progress Series 72:261-269
Seitzinger SP, Kroeze C, Bouwman AF, Caraco N, Dentener F, Styles RV (2002) Global patterns of dissolved inorganic and particulate nitrogen inputs to coastal systems: Recent conditions and future projections. Estuaries 25:640-655
Sellner KG (1997) Physiology, ecology, and toxic properties of marine cyanobacteria blooms. Limnology and Oceanography 42:1089-1104

252
Sharfstein B, Roels OA, Harris V, Lee V (1977) Effect of detergent legislation on phosphorus in effluent and receiving waters. Journal Water Pollution Control Federation 49:2017-2021
Shen ZL, Liu Q, Zhang SM, Miao H, Zhang P (2003) A nitrogen budget of the Changjiang River catchment. Ambio 32:65-69
Shimizu Y, Watanabe N, Wrensford G (1995) Biosynthesis of brevetoxins and heterotrophic metabolism in Gymnodinium breve. In: Watanabe N, Wrensford G, Lassus P, Arzul G, Erard-Le Denn E, Gentien P, Marcaillou C (eds) Harmful Marine Algal Blooms. Lavoisier Publishing Inc., New York, p 351-357
Sinclair G, Kamykowski D, Glibert PM (2009) Growth, uptake, and assimilation of ammonium, nitrate, and urea, by three strains of Karenia brevis grown under low light. Harmful Algae 8:770-780
Skipnes O, Eide I, Jensen A (1980) Cage culture turbidostat - a device for rapid-determination of algal growth-rate. Applied and Environmental Microbiology 40:318-325
Smayda T (1990a) Novel and nuisance phytoplankton blooms in the sea: Evidence for a global epidemic. In: Granéli E, Sundstrom B, Edler L, Anderson DM (eds) Toxic Marine Phytoplankton. Elsevier, New York
Smayda TJ (1990b) Novel and nuisance phytoplankton blooms in the Sea: Evidence for a global epidemic. In: Toxic Marine Phytoplankton, 4th International Conference. Elsevier, Amsterdam, p 29-40
Smayda TJ (1996) Dinoflagellate bloom cycles: what is the role of cellular growth rate and bacteria? In: Yasumoto T, Oshima Y, Fukuyo Y (eds) Harmful and Toxic Algal Blooms. Intergovernmental Oceanographic Commission of UNESCO
Smayda TJ (1997) Harmful algal blooms: Their ecophysiology and general relevance to phytoplankton blooms in the sea. Limnology and Oceanography 42:1137-1153
Smayda TJ (2002) Adaptive ecology, growth strategies and the global bloom expansion of dinoflagellates. Journal of Oceanography 58:281-294

253
Smayda TJ, Reynolds CS (2001) Community assembly in marine phytoplankton: application of recent models to harmful dinoflagellate blooms. Journal of Plankton Research 23:447-461
Smith VH (2003) Eutrophication of freshwater and coastal marine ecosystems - A global problem. Environmental Science and Pollution Research 10:126-139
Smith VH (2006) Responses of estuarine and coastal marine phytoplankton to nitrogen and phosphorus enrichment. Limnology and Oceanography 51:377-384
Smith VH, Joye SB, Howarth RW (2006) Eutrophication of freshwater and marine ecosystems. Limnology and Oceanography 51:351-355
Smith VH, Tilman GD, Nekola JC (1999) Eutrophication: impacts of excess nutrient inputs on freshwater, marine, and terrestrial ecosystems. Environmental Pollution 100:179-196
Solomon CM, Glibert PM (2008) Urease activity in five phytoplankton species. Aquatic Microbial Ecology 52:149-157
Stelzer RS, Lamberti GA (2001) Effects of N : P ratio and total nutrient concentration on stream periphyton community structure, biomass, and elemental composition. Limnology and Oceanography 46:356-367
Stoecker DK (1998) Conceptual models of mixotrophy in planktonic protists and some ecological and evolutionary implications. European Journal of Protistology 34:281-290
Stoecker DK (1999) Mixotrophy among dinoflagellates. Journal of Eukaryotic Microbiology 46:397-401
Stoecker DK, Gustafson DE (2003) Cell-surface proteolytic activity of photosynthetic dinoflagellates. Aquatic Microbial Ecology 30:175-183
Stoecker DK, Li AS, Coats DW, Gustafson DE, Nannen MK (1997) Mixotrophy in the dinoflagellate Prorocentrum minimum. Marine Ecology-Progress Series 152:1-12

254
Stoecker DK, Tillmann U, Granéli E (2006) Phagotrophy in harmful algae. In: Granéli E, Turner JT (eds) Ecology of Harmful Algae. Springer-Verlag, Berlin, p 177-187
Suttle CA, Harrison PJ (1988) Ammonium and phosphate-uptake rates, N-P supply ratios, and evidence for N-limitation and P-limitation in some oligotrophic lakes. Limnology and Oceanography 33:186-202
Taft JL, Taylor WR (1976) Phosphorus distribution in the Chesapeake Bay Chesapeake Science 17:67-73
Tango P, Butler W, Lacouture R, Goshorn D, Magnien R, Michael B, Hall H, Browhawn K, Wittman R, Betty W (2004) An unprecedented bloom of Dinophysis acuminata in Chesapeake Bay. In: Steidinger KA, Landsberg JA, Tomas CR, Vargo GA (eds) Proceedings of the Xth International Conference on Harmful Algae, St. Petersburg, Florida, p 358–363
Tango PJ, Butler W (2008) Cyanotoxins in tidal waters of Chesapeake Bay. Northeastern Naturalist 15:403-416
Tango PJ, Magnien R, Butler W, Luckett C, Luckenbach M, Lacouture R, Poukish C (2005) Impacts and potential effects due to Prorocentrum minimum blooms in Chesapeake Bay. Harmful Algae 4:525-531
Tett P, Heaney SI, Droop MR (1985) The Redfield ratio and phytoplankton growth-rate. Journal of the Marine Biological Association of the United Kingdom 65:487-504
Tyler MA, Seliger HH (1978) Annual subsurface transport of a red tide dinoflagellate to its bloom area - water circulation patterns and organism distributions in Chesapeake Bay. Limnology and Oceanography 23:227-246
USDA (2008) Fertilizer consumption and use. United States Department of Agriculture. http://www.ers.usda.gov/Data/FertilizerUse/
Van Dolah FM, Leighfield TA (1999) Diel phasing of the cell-cycle in the Florida red tide dinoflagellate, Gymnodinium breve. Journal of Phycology 35:1404-1411

255
Van Dolah FM, Leighfield TA, Sandel HD, Hsu CK (1995) Cell division in the dinoflagellate Gambierdiscus toxicus is phased to the diurnal cycle and accompanied by activation of the cell cycle regulatory protein, Cdc2 kinase. Journal of Phycology 31:395-400
Vargo GA (2009) A brief summary of the physiology and ecology of Karenia brevis Davis (G. Hansen and Moestrup comb. nov.) red tides on the West Florida Shelf and of hypotheses posed for their initiation, growth, maintenance, and termination. Harmful Algae 8:573-584
Vargo GA, Heila CA, Fanning KA, Dixon LK, Neely MB, Lester K, Ault D, Murasko S, Havens J, Walsh J, Bell S (2008) Nutrient availability in support of Karenia brevis blooms on the central West Florida Shelf: What keeps Karenia blooming? Continental Shelf Research 28:73-98
Vrede T, Ballantyne A, Mille-Lindblom C, Algesten G, Gudasz C, Lindahl S, Brunberg AK (2009) Effects of N:P loading ratios on phytoplankton community composition, primary production and N fixation in a eutrophic lake. Freshwater Biology 54:331-344
Wang JH, Wu JY (2009) Occurrence and potential risks of harmful algal blooms in the East China Sea. Science of the Total Environment 407:4012-4021
Wang Y, Tang XX (2008) Interactions between Prorocentrum donghaiense Lu and Scrippsiella trochoidea (Stein) Loeblich III under laboratory culture. Harmful Algae 7:65-75
Watson TG (1972) Present status and future prospects of turbidostat. Journal of Applied Chemistry and Biotechnology 22:229
Wheeler PA, Kirchman DL, Landry MR, Kokkinakis SA (1989) Diel periodicity in ammonium uptake and regeneration in the oceanic subarctic Pacific - implications for interactions in microbial food webs. Limnology and Oceanography 34:1025-1033
Wheeler PA, Olson RJ, Chisholm SW (1983) Effects of photocycles and periodic ammonium supply on 3 marine-phytoplankton species .2. ammonium uptake and assimilation. Journal of Phycology 19:528-533

256
Wiegner TN, Seitzinger SP, Glibert PM, Bronk DA (2006) Bioavailability of dissolved organic nitrogen and carbon from nine rivers in the eastern United States. Aquatic Microbial Ecology 43:277-287
Xu N, Duan SS, Li AF, Zhang CW, Cai ZP, Hu ZX (2010) Effects of temperature, salinity and irradiance on the growth of the harmful dinoflagellate Prorocentrum donghaiense Lu. Harmful Algae 9:13-17
Yan WJ, Zhang S (2003) The composition and bioavailability of phosphorus transport through the Changjiang (Yangtze) River during the 1998 flood. Biogeochemistry 65:179-194
Yoshida T, Rao BSM, Ohasa S, Taguchi H (1979) Dynamic analysis of a mixed culture in chemostat. Journal of Fermentation Technology 57:546-553
Zhang H, Litaker W, Vandersea MW, Tester P, Lin SJ (2008) Geographic distribution of Karlodinium veneficum in the US east coast as detected by ITS-ferredoxin real-time PCR assay. Journal of Plankton Research 30:905-922
Zhang J, Liu SM, Ren JL, Wu Y, Zhang GL (2007) Nutrient gradients from the eutrophic Changjiang (Yangtze River) Estuary to the oligotrophic Kuroshio waters and re-evaluation of budgets for the East China Sea Shelf. Progress in Oceanography 74:449-478
Zhou M, Yan T, Zou J (2003) Preliminary analysis of the characteristics of red tide areas in Changjiang River estuary and its adjacent sea. Chinese Journal of Applied Ecology 14:1031-1038
Zhou W, Yin K, Zhu D (2006) Phytoplankton biomass and high frequency of Prorocentrum donghaiense harmful algal bloom in Zhoushan sea area in spring. Chinese Journal of Applied Ecology (In Chinese) 17:887-893