abstract document: the effects of ultraviolet radiation on the
TRANSCRIPT

ABSTRACT
Title of Document: THE EFFECTS OF ULTRAVIOLET
RADIATION ON THE GROWTH,
REPRODUCTION AND SURVIVAL OF THE
LOBATE CTENOPHORE MNEMIOPSIS
LEIDYI IN CHESAPEAKE BAY
Kristen Alyssa Rathjen, Master of Science, 2010
Directed By: Dr. Denise Breitburg
Smithsonian Environmental Research Center
Professor Michael Roman
Marine, Estuarine and Environmental Sciences
Solar ultraviolet radiation (UVR) is an environmental stressor that can have a
variety of negative effects on aquatic organisms. The ctenophore Mnemiopsis leidyi
is a highly transparent organism that has not been shown to actively avoid UVR or
possess photoprotective compounds and may therefore be vulnerable to deleterious
effects of UVR. Results of this study indicate that summertime UVR exposure
equivalent to average UVR conditions within the top 0.5 m of the water column of the
Rhode River, Maryland, USA, can cause mortality and reduced size of M. leidyi.
Exposures tested did not, however, affect egg production. Experiments indicated a
sharp threshold for the tolerance of M. leidyi to biologically effective UVR exposure.
Mnemiopsis leidyi is an important component in many ecosystems; thus, changes in
its abundance have the potential to significantly affect coastal and estuarine food
webs and oyster, fish and sea nettle populations in systems like Chesapeake Bay.

THE EFFECTS OF ULTRAVIOLET RADIATION ON THE GROWTH,
REPRODUCTION AND SURVIVAL OF THE LOBATE CTENOPHORE
MNEMIOPSIS LEIDYI
By
Kristen Alyssa Rathjen
Thesis submitted to the Faculty of the Graduate School of the
University of Maryland, College Park, in partial fulfillment
of the requirements for the degree of
Master of Science
2010
Advisory Committee:
Dr. Denise Breitburg, Co-Advisor
Professor Michael Roman, Co-Advisor
Dr. Patrick Neale
Professor Christopher Rowe

ii
Dedication
To my husband, Bill, without whose never-ending patience and support, this goal
would never have been achieved.

iii
Acknowledgements
First and foremost, I would like to thank my advisor Dr. Denise Breitburg for
her guidance, insight and for always having her door open to me over the last several
years. I owe a debt of gratitude to Pat Neale for his endless patience in answering my
many questions, and also his logistical and analytical support. I would also like to
thank my co-advisor, Mike Roman and also Chris Rowe for serving on my committee
and for providing their support and advice.
I wish to thank Rebecca Burrell for imparting her knowledge of all things
gelatinous on me; for traipsing to sites with me with tons of luggage; for her sincere
willingness to assist wherever needed; and for her friendship throughout this
experience. I also want to thank the Smithsonian Environmental Research Center’s
Marine Ecology Lab and Photobiology Lab for their friendship, assistance and
support over the last three years. I would also like to thank Courtney Richmond for
diversions into the philosophical complexities of science and her continued
willingness to comment on various drafts and revisions. I also want to thank Darryl
Hondorp for allowing me to distract him with statistical dilemmas. And finally I am
grateful to Debbie Morrin-Nordlund for always having the answers to the sea of
administrative uncertainties.
This research was funded in part by Maryland Sea Grant, and the Smithsonian
Marine Science Network; funds to present my work at the Coastal and Estuarine
Research Federation conference came from the Jacob K Goldhaber travel award and
the Atlantic Estuarine Research Society.

iv
Table of Contents
Dedication………………………..………………………………………………..…..ii
Acknowledgements……………...…………………………………………………...iii
Table of Contents…………………...………………………………………………...iv
List of Tables………………………………………………………………………......v
List of Figures………………………….…………………………………………..….vi
Introduction…....……………………...…………………………………………….....1
Materials and Methods……………………………………………………………….10
Preliminary, Growth, Reproduction and Survival Experiments.….....10
General Experimental Methodology…………………………….10
Preliminary………………………………………………………13
Growth…………………………………………………………...14
Reproduction……………………………………………….……15
Survival…………………………………………………...……..17
Statistical Analysis………………………………………………18
Spectral Response Experiments…...………...…………………….…19
Experimental Set-up…………………………………………..…19
Biological Weighting Function……………………………….....21
Results……………………………………………………………………………..…24
Preliminary, Growth, Reproduction and Survival Experiments.….....24
Preliminary……………………………………………………...24
Growth…………………………………………………………..25
Reproduction……………………………………………….……27
Survival…………………………………………………...……..30
Spectral Response Experiments…...…...…………………………….31
Discussion and Conclusions……………….…...…………….………………...……33
Bibliography...………………………………………………...……………………...65

v
List of Tables
Table 1. Summary of experiments conducted in 2008 and 2009 with associated types
and treatments………………………………………………………………………..42
Table 2. Mean size and daily UVR exposure ( SE) with corresponding results for
the duration of the experiments on the cumulative survival of juvenile (< 3 cm) and
adult (> 3 cm) M. leidyi in UVR treatments (n/a= not applicable).………...………..43
Table 3. Mean daily solar UVR exposure ( SE) for growth and reproduction
experiments (n/a= not applicable).……………………………………...……………44
Table 4. Mean (± 1 SE), minimum and maximum recorded temperature
measurements for all solar experiments……………………………………………...45
Table 5. Statistical results from preliminary feeding experiments. Final models were
run as ANCOVA using Type III SS. Non-significant results in parenthesis were
excluded from the final model………………………………………………………..46
Table 6. Statistical results for initial size (weight and length) comparisons of M.
leidyi by treatment for individual growth experiment. Models were analyzed as
ANOVA’s using Type III SS………………………………………………………....47
Table 7. Statistical results for growth experiments examining effects of UVR on
growth (weight and length) of M. leidyi. Final weight model for Experiments 1 and
final weight and length models for Experiment 2 were analyzed as ANOVA’s using
Type III SS. Final length model for Experiment 1 and final weight and length models
for Experiment 3 were analyzed as ANCOVA’s using Type III SS. Results in
parenthesis were excluded from the final model……………………………………..48
Table 8. Reproduction experiments. Statistical results for the effect of UVR on rank-
transformed egg production and size (weight and length) of M. leidyi. Models of egg
production were analyzed in Solar 1, Solar 2 and Lamp 1 using ANOVA with Type
III SS; the final model in Lamp 2 was analyzed using ANCOVA with Type III SS.
Ctenophore size was analyzed as ANOVA using Type III SS in Solar 1 and Lamp 1
while the final model in Solar 2 and Lamp 2 were analyzed as ANCOVA using Type
III SS…………………………………………………………………………………49

vi
List of Figures
Figure 1. Experimental design for all outdoor growth, reproduction and survival
experiments under ambient solar set-up. Closed-system with water re-circulated
through a chiller to maintain temperatures within experimental chambers………….51
Figure 2. Experimental design for the solar photoinhibitron experiments used to
determine the biological weighting function. Closed-system with water re-circulated
through a chiller to maintain temperatures within experimental chambers………….52
Figure 3. The threshold response curve relating cumulative percent survival in
photoinhibitron, growth, reproduction and survival experiments to two-day
cumulative biologically effective exposure (H*) using the Daphnia pulicaria
biological weighting function………………………………………………………..53
Figure 4. Preliminary growth experiment; mean final weight (g) comparisons of
juvenile M. leidyi in +UVR (grey line) and -UVR (black line) treatments. Thin solid
line represents estimate of initial weight. The R2 values represent the linear fit for
+UVR and –UVR treatments with P-values of 0.1980 and 0.0035 respectively……54
Figure 5. Preliminary reproduction experiment; comparison of mean eggs produced
g-1
of ctenophore wet weight (top) and mean total eggs produced ind-1
(bottom) in
+UVR (grey line) and -UVR (black line) treatments. Thin solid line represents
estimate of initial egg production. The R2 values represent the linear fit for +UVR
and –UVR treatments with P-values of 0.0899 and 0.1652 for mean eggs g-1
and
0.0590 and 0.2608 for mean total eggs respectively…………………………………55
Figure 6. Mean final weight (black bars) and length (open bars) comparisons of small
M. leidyi in growth experiments. Letters represent results of a posteriori Fisher’s
LSD test on all pairwise comparisons. Different letters represent significant
differences between treatments P < 0.05. No pairwise comparisons were performed
on the weights in Experiment 3 due to a significant interaction between initial weight
and UVR treatment…………………………………………………………………..56
Figure 7. Mean number of eggs produced g-1
ctenophore wet weight (black, left) and
mean total number of eggs produced ind-1
(grey, right) in reproduction experiments
under solar and lamp-produced UVR………………………………………………..57
Figure 8. Mean final weight (black bars) and length (open bars) of M. leidyi in
reproduction experiments…………………………………………………………….58
Figure 9. Two day survival curve in response to average daily UV-B exposure for
UVR exposure treatments for all growth, reproduction and survival experiments.
Black circles represent experiments with juvenile ctenophores (< 3 cm), white circles
represent experiments with adult ctenophores (> 3 cm)……………………………..59

vii
Figure 10. Two day survival curve in response to the two day highest hour of UV
irradiance for UVR exposure treatments for all growth, reproduction and survival
experiments. Black circles represent experiments with juvenile ctenophores (< 3 cm),
white circles represent experiments with adult ctenophores (> 3 cm)……………….60
Figure 11. The biological weighting functions for Mnemiopsis leidyi and Daphnia
pulicaria (Williamson et al. 2001) with 95 % confidence intervals…………………61
Figure 12. The mean weighted cumulative irradiance exposure for individual
wavelengths from the solar photoinhibitron experiments……………………………62
Figure 13. The threshold response curve relating cumulative experimental mortality
in photoinhibitron, growth, reproduction and survival experiments to two-day
cumulative biologically effective exposure (H*)…………………………………….63
Figure 14. Solar and lamp UV energy comparison. Dashed line represents output
from the UV lamps; solid line represents solar energy from a typical clear summer
day (Data from July 28, 2009)……………………………………………………….64

1
Introduction
Solar ultraviolet radiation (UVR) is an important and dynamic feature in
aquatic ecosystems. Incident UVR is affected by factors such as sea surface state,
solar zenith angle, altitude, cloud cover and stratospheric ozone concentration.
Attenuation of UVR within the water column of aquatic ecosystems is mainly
influenced by absorption and scattering, which depend on the optical properties of the
water. Attenuation of UVR in marine ecosystems varies with trophic state (Tedetti
and Sempéré 2006); in oligotrophic open oceanic waters, UVR penetration is high,
while in eutrophic coastal ecosystems UVR is rapidly attenuated, mainly due to
absorption by the chromophoric component of dissolved organic matter (CDOM).
Consequently, seasonal fluctuations in CDOM and particulates alter the amount and
depth of UVR penetration in coastal ecosystems.
Solar UVR is an environmental stressor that can affect individual organisms
and community structure in aquatic ecosystems. The mechanisms of UVR stress vary
among species and life stages (Vincent and Neale 2000). Exposure to UVR can have
a variety of direct effects on aquatic organisms including DNA damage, slowed
growth, and changes in reproduction and development, as well as indirect effects such
as disruption of primary production and food web dynamics (Mostajir et al. 1999,
Zagarese and Williamson 2001, Palen et al. 2005, Häder et al. 2007). Blaustein et al.
(1994) suggested that ultraviolet radiation can be a contributing factor in geographic
distribution and population declines for amphibian species that are sensitive to UVR,

2
although it has been shown that many sensitive species alter their breeding behavior
to reduce embryonic UVR exposure (Palen et al. 2005). For zooplankton, UVR has
been shown to induce vertical migration, damage DNA, reduce fecundity and
increase mortality (Karanas et al. 1981, Grad et al. 2001, Williamson et al. 2001,
Leech et al. 2005, Häder et al. 2007).
Ultraviolet radiation is classified into three components based on
wavelengths; UV-A (320-400 nm), UV-B (280-320 nm), and UV-C (< 280 nm). The
energy per photon of UVR increases with decreasing wavelength; highly energetic
shorter wavelengths are more damaging than longer wavelengths. For this reason it is
often suggested that UV-B is more biologically damaging to organisms than UV-A.
Each component of UVR has characteristic effects. The effects of UV-A can
be both detrimental and beneficial. UV-A is capable of indirectly damaging DNA,
inhibiting growth and survival of zooplankton (Williamson et al. 1994) and fish
(Williamson et al. 1997) and reducing primary production, but is also necessary for
initiating photorepair mechanisms and for vision in some organisms. In Daphnia
pulicaria, for example, UV-A was found to be a key factor in initiating
photoenzymatic repair systems at low irradiance levels but at higher irradiance levels
UV-A was suggested to have a net negative effect (Williamson et al. 2001). UV-B
exposure is detrimental to all organisms because strong absorption of the high-energy,
shorter UV-B wavelengths by DNA and RNA can damage and structurally change
these molecules, cause toxic photoproducts and disrupt many cellular processes
(Vincent and Neale 2000, Buma et al. 2003). Methods to investigate the response of
organisms to specific wavelengths have demonstrated that biological damage

3
increases with decreasing wavelength in the UVR spectrum (Williamson et al. 2001).
These reasons again lead to suggestions that UV-B is more biologically damaging to
organisms than UV-A. Presently, there is no risk of damage from UV-C as no
wavelengths shorter than 290 nm reach the surface of the Earth due to absorption by
atmospheric gases, mainly ozone, in the stratosphere.
Negative effects of UVR can be manifested in many ways. On an individual
level, growth and reproduction can be negatively affected by UVR due to both direct
damage and an allocation of energy to repair UVR damage to DNA and tissues
(Speakman 1997, Fischer et. al. 2006). Elevated investment in repair and resulting
lower investment in growth and reproduction may decrease individual fitness of
organisms exposed to high levels of UVR, which could in turn decrease population
size. Subtle genetic changes due to UVR may accumulate through several
generations damaging biological functioning and potential fitness of later generations
(Vincent and Neale 2000).
Tolerances and responses of organisms to UVR vary depending on intensity,
duration and spectral composition of the exposure, the efficiency of protection and
repair strategies, and interactions with other variables (Vincent and Neale 2000).
Detrimental effects from UVR occur once the amount of absorbed UVR either no
longer provides a benefit or if repair mechanisms are unable to keep pace with the
damage; at this threshold, effects of UVR rapidly increase, often from negligible to
severe. The threshold for irradiance tolerance of an organism may be an effect of
wavelength, cumulative dose or the dose-rate of exposure (Whitehead et al. 2000).

4
It is impossible for many organisms to avoid all UVR exposure. As a result,
many organisms have evolved combinations of chemical, physical and behavioral
defense mechanisms to minimize UVR-induced damage. Many organisms utilize
compounds that are photoprotective [e.g., mycosporine-like amino acids (MAAs),
fluorescent pigments and melanin] or compounds that are either produced by the
organism or acquired through diet that can neutralize toxic photoproducts (e.g.
antioxidants and carotenoids). Some organisms simply move (e.g., vertical
migration) to minimize exposure to UVR, while other organisms have highly efficient
photoenzymatic repair systems. Many organisms incapable of producing UVR-
protective compounds may acquire them from their diet or through symbiotic
relationships. For example, the symbiotic dinoflagellate Symbiodinium
microadriaticum synthesizes and transfers MAAs to the tissues of its host, the upside-
down jellyfish Cassiopeia xamachana, which in part relies on MAAs for
photoprotection (Banaszak and Trench 1995).
In order to determine the effect of UVR in the natural environment, UVR
exposure treatments should be structured to include the full spectrum of solar
irradiance (a polychromatic approach; Caldwell et al. 1986, Cullen and Neale 1997).
This allows repair responses to counteract any UVR damage as would occur in
nature. One basic polychromatic approach is to use presence-absence experiments
with treatments that fully allow or prevent organism exposure to full spectrum UVR.
In these types of experiments, a screening agent (e.g., a UVR opaque acrylic sheet) is
used in ‘absence’ treatments to prevent UVR exposure and results are compared to a
‘presence’ treatment using a UVR transparent screen. Results from this type of

5
presence-absence experiment indicate whether a UVR effect is present at exposures
tested, but provide no direct information on organisms’ sensitivity to specific
wavelengths.
Many biological responses are dependent on spectral composition and
interactions among multiple wavelengths. In order to quantitatively relate
experimental responses to UVR exposure (or wavelength) it is therefore necessary to
apply spectral weighting functions (Cullen and Neale 1997), which describe the
relationship between wavelength and the effectiveness of UVR at producing a
response (Neale 2000). Biological weighting functions (BWFs) are sets of
wavelength-specific weighting coefficients established to represent simultaneous
wavelength-dependent effects when using broadband polychromatic approaches
(Neale 2000). Using a BWF, biologically effective exposure (measure of UVR dose)
can be determined for any type of light source. Net biologically effective exposure is
obtained by summing the product of the weighting coefficient, irradiance and
bandwidth at each wavelength over the spectrum. The biologically effective exposure
can be used to compare responses from exposures with inherently different spectral
properties and to determine the effects of varying spectral compositions (e.g., changes
in ozone concentration, water depth or clarity, etc.) on organism response.
Understanding wavelength-specific responses is necessary to predict consequences of
increased UVR exposure and to relate responses among studies with differing spectral
irradiance. In aquatic ecosystems, many such studies have focused on primary
production.

6
There have also been several studies on the wavelength dependent effects of
UVR on DNA damage and mortality in aquatic animals. These studies examined
various transparent life stages of organisms including sea urchin embryos, cod eggs,
water fleas and copepods (Kouwenberg et al. 1999, Tartarotti et al. 2000, Williamson
et al. 2001, Lesser et al. 2006). One important group of transparent organisms for
which the effect of spectral variation on UVR effects has not been studied is
gelatinous zooplankton including ctenophores.
The lobate ctenophore Mnemiopsis leidyi is a highly transparent organism
(Johnsen and Widder 2001) found in high UVR tropical waters as well as lower UVR
coastal waters. They are found throughout the water column but the amount of time
an individual animal spends near the surface versus lower in the water column is
unknown. There are inconsistent results from several studies on whether M. leidyi
exhibits a predictable pattern of directed vertical migration in response to select
environmental factors (reviewed in Purcell et al. 2001). Only a few members of the
phylum Ctenophora have been tested for presence of UVR-absorbing compounds, but
none have yielded positive results (Karentz 1991, Banaszak 2003). UVR-
transmission scans of individual ctenophores from the Chesapeake Bay show no signs
of any photoprotective compound (pers. obs.). There is no information on presence
or efficiency of the photorepair system of M. leidyi. A potential deficiency in UVR-
protective mechanisms could render M. leidyi susceptible to deleterious effects from
UVR. There is currently no information on the ability of M. leidyi to detect, respond
to and repair damage from UVR.

7
Mnemiopsis leidyi is native to estuaries and coasts along the eastern regions of
North and South America. They can tolerate a wide range of salinity and dissolved
oxygen concentrations but are generally intolerant to temperatures in excess of 30 oC
(Breitburg et al. 2003, Purcell et al. 2001). Peak M. leidyi abundance varies
regionally, with temperature, food availability and predators being the most important
factors in determining their abundance (Kremer 1994, Purcell and Cowan Jr. 1995).
In Chesapeake Bay, M. leidyi reaches peak abundances from June through September
when UV irradiance is at its annual peak. In more southern latitudes such as
Biscayne Bay, Florida, M. leidyi abundance peak during fall to winter when UVR is
nearing its annual low (Kremer 1994). The ability of M. leidyi to inhabit a range of
environmental conditions combined with its high reproductive output potential and
rapid growth rates has allowed for its rapid and successful invasion of the Black Sea
in the early 1980s, and its continual spread to other nearby bodies of water including
the Caspian Sea, Sea of Azov, North Sea, and Baltic Sea (Ivanov et al. 2000,
Boersma et al. 2007).
Mnemiopsis leidyi can rapidly increase in size and abundance under favorable
conditions. Individual growth and reproductive rates are related to ctenophore size
and prey availability. Under favorable conditions, small individuals can double their
biomass daily (Reeve et al. 1989). Mnemiopsis leidyi is a simultaneous
hermaphrodite that reaches reproductive maturity around 3 cm in length (Kremer
1976). Mature individuals can release 10,000+ eggs into the water column each night
(Kremer 1976). There is a positive relationship between fecundity and ctenophore
size for M. leidyi (Kremer 1976).
8
Mnemiopsis leidyi is an important component in the Chesapeake Bay and
other coastal and estuarine food webs. They are voracious predators that feed heavily
upon zooplankton and ichthyoplankton, including fish and oyster larvae (Nelson
1925, Purcell et. al. 1991, Cowan and Houde 1993). Mnemiopsis leidyi has few
predators within Chesapeake Bay although the scyphomedusae Chrysaora
quinquecirrha (the sea nettle) is a dominant predator that can control M. leidyi
abundances in parts of the mainstem Chesapeake Bay and its tributaries. Because of
its importance in estuarine food webs, changes in the abundance of M. leidyi have the
potential to significantly affect mesozooplankton, oyster, fish and sea nettle
populations.
The goal of this study was to examine the effects of current near-surface UVR
on growth, reproduction and survival of the ctenophore M. leidyi in the Rhode and
Patuxent Rivers, subestuaries of Chesapeake Bay. Growth experiments were
conducted to test the hypothesis that growth (weight and length) of M. leidyi is
reduced by exposure to UVR similar to that experienced in near-surface waters of the
Rhode River during summer. A negative effect of UVR on growth could potentially
prevent smaller M. leidyi exposed to high UV irradiance from achieving the minimum
reproductive size and could reduce total lifetime egg production for individuals that
do reproduce. Reproduction experiments were conducted to test the hypotheses that
exposure of M. leidyi to UVR similar to that experienced in near surface waters of the
Rhode River during summer would result in either a decrease in the number of eggs
produced, or possibly, a stress response expressed as an increased number of eggs
produced whereby the animal facing imminent death releases maximum gametes.

9
Reproductive M. leidyi might also experience a decrease in size thus reducing either
total egg production (as egg production is positively correlated with ctenophore size)
or the number of eggs produced per unit M. leidyi biomass. Finally, I examined the
effects of UVR exposure on the survival of M. leidyi and estimated the spectral
dependence of the survival response by comparing the survival of ctenophores under
different UVR spectral treatments.

10
Materials and Methods
Preliminary, growth, reproduction and survival experiments
General Experimental Methodology
In order to test the effects of UVR exposure on the growth, reproduction and
survival of Mnemiopsis leidyi, I conducted three sets of experiments during the
summers of 2008 and 2009 as well as a preliminary experiment during 2008 used to
determine an appropriate prey density and feeding regime (Table 1). The
methodology for each of the experiments was similar; specifics for each experiment
type (preliminary, growth, reproduction, survival) follow the general protocol
description below. Ctenophores were collected from mesohaline areas of two
Chesapeake Bay subestuaries, the Patuxent River (Solomons Island, Maryland) and
the Rhode River (Edgewater, Maryland) using a 0.5 cm mesh dip net. Salinity during
collections ranged from 7.7 – 12.5.
For all experiments, M. leidyi were weighed (to the nearest 0.1 g) and
measured (to the nearest 0.1 cm) after four days of UVR exposure. The biometric
conversion of M. leidyi wet weight to dry weight for salinities of 6 –12 is calculated
using the following equation (Nemazie et al. 1993; see Purcell et al. 2001 for
additional salinity regimes):
Percent carbon and nitrogen content are calculated as 5.1 % and 1.3 % of the dry
weight respectively for salinities of 6 – 12 (Nemazie et al. 1993).

11
For experiments, M. leidyi were placed in ten shallow 11 L chambers (43 cm x
28 cm x 12 cm deep) containing 0.5 μm filtered Rhode River water. Chambers were
placed either outdoors under ambient solar UVR or in the laboratory under UVR
lamps that simulated the spectral composition of noon solar UVR on a summer day.
Experimental chambers were fitted with either an Acrylite OP-3 UV resistant (-UVR)
or OP-4 UVR transparent (+UVR) acrylic sheet lid. Airlines were placed at the
surface of each chamber to gently move water and Artemia sp. prey throughout the
chamber without damaging M. leidyi.
In outdoor experiments (referred to as ‘solar’ experiments), experimental
chambers were placed in a shallow, temperature-controlled (18.0 – 31.5 oC) water
bath for a maximum of 4 d (Fig. 1). The chiller was unable to maintain a constant
temperature during hot sunny days therefore ice was added throughout the day to
attempt to maintain temperatures within a range of 5 – 7 oC. Alternatively on cold
nights the chiller had difficulty heating the water efficiently to maintain temperatures
within a narrow range. Experiments conducted in 2008 had only two treatment levels
(-UVR and +UVR). Due to mortality of all animals in +UVR treatments in several
late June and early July growth and reproduction experiments in 2009, however, an
additional treatment (S+UVR) was added that consisted of a shade cloth placed over a
UVR transparent lid, blocking approximately 54% of UVR. The remainder of
ambient solar UVR experiments conducted in 2009 therefore included three
treatments (-UVR, +UVR, S+UVR) with four control (-UVR) replicates and three
replicates each of +UVR and S+UVR treatments.

12
In indoor laboratory experiments (referred to as ‘lamp’ experiments), UVR
was produced by a bank of Q-Panel UVA-340 lamps. Lamp heights were adjusted to
modify the intensity of UVR (i.e. dose rate) so that approximately 12-13 h of UVR
exposure day-1
generated daily cumulative exposures similar to experiments
conducted under ambient solar UVR during late August thru early September 2008
and 2009. The lamp set-up was only used for two reproduction experiments.
Experiment duration was 4 d.
Broadband measurements of solar and lamp irradiance for all experiments
were made using polysulfone film dosimeters (Dunne 1996). One dosimeter was
placed at the bottom center of each of three experimental chambers (one of each
treatment) outside of the water bath (temperature does not affect the response of the
film to UVR). The film responds to biologically damaging UV-B but does not
provide a means to evaluate exposure to the longer, less biologically damaging,
UV-A wavelengths. Therefore, while UV-A was not blocked from +UVR treatments
and only partially blocked in S+UVR treatments, it was not directly measured.
An initial calibration of the absorbance of dosimeters in air and water was
done in comparison to spectral radiometer measurements. Replicate dosimeters
placed in black, water filled basins were exposed to solar irradiance for each of five
equally progressively longer time increments during a single day. A SERC SR18
spectral UV-B radiometer was located next to the basins to record cumulative spectral
irradiance. The optical absorbance at 330 nm of each dosimeter was measured using
a Cary 4 dual-beam spectrophotometer subtracting background optical density
measured at 400 nm. The average corrected absorbance for replicate calibration

13
dosimeters was plotted against the corresponding incident cumulative UV-B exposure
for each time interval. A saturating exponential curve for the relationship between
absorbance and integrated UV-B measured by the SR18 was fitted in Sigma Plot
(Jandel Scientific Software) by applying the three parameter exponential rise to a
maximum equation: . The fitted equation was then
rearranged to obtain estimated UV-B exposure from measurements of the absorbance
of the dosimeters deployed in experimental treatments. The absorbance
measurements were used to calculate UV-B exposures in kJ m-2
using the following
equation:
where Abs equals the absorbance of the dosimeter measured by the
spectrophotometer, m1=0.1267, m2=0.65801 and m3=0.056915. The dosimeters were
placed at the bottom of the chambers and therefore represent the minimum potential
exposure experienced by ctenophores moving throughout the chambers.
Preliminary Feeding Experiments
A preliminary solar UVR growth experiment was conducted in 2008 using a
range of Artemia sp. densities fed to small (0.7 – 2.2 cm) M. leidyi to determine a
suitable prey density and feeding regime for later growth experiments. Five prey
densities of Artemia sp. (10, 40, 120, 200 and 300 Artemia sp. L-1
) were chosen with
one replicate of each in both –UVR and +UVR treatments. Initial weight (to the
nearest 0.1 g) and length (to the nearest 0.1 cm) were estimated from 12 randomly
selected, similar-sized ctenophores from the same field collection. Each shallow
chamber contained six randomly selected M. leidyi 0.9 – 1.9 cm in length.

14
Ctenophores in each chamber were fed the full ration of prey in the morning. Prey
densities were monitored and adjusted twice during the day to maintain the
designated prey density. After four days of exposure ctenophores were removed from
treatments, weighed and measured.
A similar preliminary experiment was conducted in 2008 with large (6.0 - 9.5
cm) M. leidyi to determine a suitable feeding regime to test the effect of UVR on M.
leidyi egg production. For this experiment, five Artemia sp. densities (150, 250, 325,
400, 550 Artemia sp. L-1
) were chosen, with one replicate of each in both –UVR and
+UVR treatments. Estimates of initial weights and lengths of individuals were
obtained as in the preliminary growth experiment. Additionally, initial egg
production was estimated from ten similar sized ctenophores from the same field
collection on the evening of collection. Each shallow chamber contained four
randomly selected M. leidyi 6.6 – 9.5 cm in length. Prey were added to chambers as
described above. After four days of solar UVR exposure, M. leidyi egg production
was estimated by placing individual ctenophores in pitcher sieves fitted with 53 μm
mesh bottoms and counting the number of eggs released overnight (modified from
Grove and Breitburg 2005). The following morning, ctenophores were removed
weighed and measured. Pitchers were individually sieved in order to collect, stain
and preserve eggs in a 10% acid Lugol’s solution.
Growth Experiments
Three solar growth experiments were conducted in 2009 to test the effects of
UVR on growth of small (1.1 – 3.3 cm) M. leidyi. Each chamber contained three to
four randomly selected M. leidyi. The feeding regime for growth experiments was

15
based on results from the preliminary growth experiment (see above and results).
Ctenophores in all UVR treatment chambers (-UVR, +UVR, S+UVR) were fed 300
Artemia sp. L-1
each morning and a single afternoon addition of 100 – 150 Artemia
sp. L-1
.
Weight (to the nearest 0.1 g) and length (to the nearest 0.1 cm) of
experimental M. leidyi were measured at the start of each experiment. After four days
of UVR exposure (or prior to the fourth day if visual inspection indicated that
mortality could be imminent), surviving M. leidyi were removed from chambers, and
were weighed and measured again (no measurements were obtain from dead
ctenophores). It was impossible to track growth of individuals, therefore statistical
comparisons used chambers means. All three experiments were conducted similarly
with the exception that Experiment 1 was terminated after three days of UVR
exposure due to a high mortality rate in the +UVR treatments and seemingly
imminent mortality in the S+UVR treatments. The three experiments were analyzed
separately because the intensity of daily and cumulative UVR varied among
experiments.
Reproduction Experiments
Two reproduction experiments using solar UVR and two reproduction
experiments using UV lamps were conducted in 2008 and 2009 to examine the effects
of UVR on M. leidyi egg production, measured as both the number of eggs released
g-1
of ctenophore wet weight and total number of eggs released ind-1
. Reproduction
experiment methods were similar to those for growth experiments except that
chambers contained two to four similar-sized ctenophores 4.6 -10.0 cm in length.

16
Results of the preliminary feeding study indicated that a feeding density of 450
Artemia sp. L-1
would be sufficient to observe a UVR effect on large M. leidyi, if one
occurred (see results). In most reproduction experiments, M. leidyi in each chamber
were, therefore, fed approximately 450 Artemia sp. L-1
in the morning with an
additional 200 Artemia sp. L-1
in the afternoon. An exception to the feeding regime
was the second lamp reproduction experiment (Lamp 2) that examined the interaction
between UVR exposure and starvation; for this experiment fed M. leidyi received
food as described above while starved ctenophores received no food.
For the one solar and two lamp reproduction experiments conducted in 2008,
estimates of initial weights (to the nearest 0.1 g) and lengths (to the nearest 0.1 cm)
were based on measurements of a subsample of either 10 or 22 (depending on field
availability) randomly selected similar-sized ctenophores from the same field
collection. For the 2009 solar reproduction experiment (Solar 2), initial weights and
lengths of experimental ctenophores were measured as described in growth
experiments. A baseline estimate of egg production reflecting field conditions was
obtained by conducting egg production assays on similarly-sized ctenophores from
the same field collection at the start of each reproduction experiment.
Egg production by individual M. leidyi was estimated by placing individual
ctenophores in submersed 2 L pitcher sieves fitted with 53 μm mesh bottoms on the
evening of the fourth day of UVR exposure at ~17:00, and counting the eggs released
overnight. Pitchers were gently lifted from the water at ~08:00 and eggs were gently
washed from the sieve bottoms and preserved in 10% acid Lugol’s solution.
Individual M. leidyi were weighed and measured at the end of the assay. All eggs

17
were counted in samples with approx. ≤ 1,000 eggs; larger samples that appeared to
have > 1,000 eggs were subsampled using a Stempel pipette.
Survival Experiments
I conducted four survival experiments specifically to test effects of ambient
solar UVR on ctenophore survival and also consider data here from two experiments
that had extensive mortality in the + UVR treatments, Growth 1 (referred to as
Juvenile 2 in survival experiments) and Reproduction Solar 2 (referred to as Adult 4
in survival experiments). The first survival experiment in 2008 (Juvenile 1 in Table
2) tested juvenile ctenophores at a range of prey densities of Artemia sp. (10, 40, 120,
200 and 300 Artemia sp. L-1
); all other survival experiments used the feeding regime
that was selected for the respective ctenophore sizes as described above in growth and
reproduction experiments. The experimental design was the same as in solar growth
and reproduction experiments. Chambers contained 2 - 6 ctenophores depending on
the size and field availability of M. leidyi. Experiments lasted for four days unless
extensive mortality occurred in UVR exposure treatments prior to the fourth day, in
which case the experiment was terminated early. Substantial mortality often occurred
after two full days of UVR exposure; all survivorship data were therefore compared
using survival to the morning of the third day. Ctenophores were declared dead when
either a tissue outline of a carcass remained on the bottom of the chamber or the
ctenophore was reduced to an amorphous chunk less than 1/3 of its original size, did
not have the characteristic lobate ctenophore shape, had no gut cavity integrated
within the remaining tissue, and had little to no movement of the ctenes. The percent

18
survival for the full duration of each experiment was recorded for all chambers within
each UVR treatment (Table 2).
To further investigate the effect of UVR on mortality in M. leidyi I compiled
survivorship data from all solar experiments (including growth, reproduction and
survival) to determine the tolerance of M. leidyi to specific features of UVR (e.g.
cumulative dose, dose-rate). Because some experiments were terminated before the
fourth day, all survivorship data was compared using the two-day percent survival of
juvenile and adult ctenophores to mean daily UV-B exposure as described above.
The relationship between the two-day percent survival and mean daily UV-B
exposure was plotted and fit with a three parameter sigmoidal curve using Sigma Plot
(Jandel Scientific Software).
Statistical Analysis
The effect of UVR treatments on the growth, reproduction (eggs produced g-1
of ctenophore wet weight and total number of eggs produced ind-1
) and survival of M.
leidyi were each evaluated separately with either analysis of variance (ANOVA) or
analysis of covariance (ANCOVA). All data were analyzed with SAS 9.1 (SAS
Institute 2002) using Proc Mixed. Data were tested for normality and homogeneity of
variances prior to analysis. In 2009 growth and reproduction experiments when
initial sizes were available for experimental ctenophores, effects of UVR on weight
and length were analyzed using ANCOVA with initial weights or lengths as
covariates, otherwise ANOVAs were used to compare treatment mean sizes. Non-
significant interactions were removed from the models. In all experiments, t-tests
were conducted on the initial ctenophore sizes to verify that there were no significant

19
differences in starting sizes among UVR treatments. For reproduction experiments,
treatment means for eggs released g-1
wet weight and total numbers of eggs released
ind-1
were rank-transformed due to unequal variances among treatments, and
analyzed using an ANOVA. One exception was the second lamp experiment where
food availability was used as a categorical main effect in the ANOVA. Mean values
for growth and reproduction experiments were compared a posteriori using Fisher’s
LSD test (P < 0.05). The two-day cumulative percent survival of juvenile and adult
ctenophores was compared to mean daily UV-B exposure using ANOVA.
Spectral Response Experiments
Experimental Set-up
In order to test the effects of UVR spectral variation on the survival response
of Mnemiopsis leidyi, I conducted four experiments in August of 2009 using an
outdoor solar photoinhibitron. The photoinhibitron consisted of eight replicate
chambers for each of four UVR treatments. Wavelength exposure was manipulated
by using Schott longpass cut-off filters with 50% transmission cut-offs at 295, 305,
320 and 370 nm. Post-experimental scans of the filters revealed that the transmission
of the 295 was identical to the 305 filters and thus served as additional replicates of
the 305 treatment.
Mnemiopsis leidyi were collected using a 0.5 cm mesh dip net from the
Patuxent River (Solomons Island, Maryland). Initial weights and lengths of
ctenophores were obtained prior to being randomly assigned to treatments. Two M.
leidyi were placed into each of eight chambers of the solar photoinhibitron. The first

20
experiment used small (1.2 – 2.4 cm) M. leidyi. In this experiment, M. leidyi were
individually placed into Teflon bottles within the chambers to prevent ctenophores
from flowing among and out of the chambers. Subsequent experiments were run with
large (5.5 – 11.2 cm) M. leidyi placed directly into chambers. Water from the Rhode
River (Edgewater, Maryland) was filtered to 0.5 μm and re-circulated through a
chiller system to maintain water temperature within 21.7- 27.2 oC (in one experiment
the temperature briefly reached a maximum 33.1 oC because of restricted water flow
and was immediately corrected; Fig. 3). The water inflow rate was adjusted to allow
minimal water movement (yet still circulate chilled water) to avoid compressing M.
leidyi against the opposing wall. Equal prey densities among the chambers could not
be guaranteed given the flow-through design of the experimental chambers therefore
no food was used during the experiments. Experiments were run for a maximum of
four days or until substantial mortality occurred. If M. leidyi survived through day
four, they were removed from chambers, weighed and measured.
As in the growth, reproduction and survival experiments, polysulfone
dosimeters were used to obtain an estimate of broadband UVR exposure within the
chambers. Dosimeters could not be placed into the chambers when ctenophores were
present because of the potential for shading by the ctenophores. Therefore dosimeters
were placed at the bottom of each well for a full day of exposure before ctenophores
were added.
To estimate the proportion of incident UVR reaching the bottom of the
chambers, the dosimeter exposures for the full spectrum treatments were compared to
the incident UV-B exposure measured from the SR18 radiometer located at the

21
Smithsonian Environmental Research Center, Edgewater, Maryland (also used to
calibrate the dosimeters). The proportion of UVR between the measured exposure
from the chamber dosimeter and incident radiation was applied to the overall
spectrum of UVR exposure (290-400 nm) as determined by a combination of SR18
spectral measurements and radiative transfer modeling performed by the Smithsonian
Environmental Research Center’s Photobiology and Solar Radiation Lab (Edgewater,
Maryland, details in Neale et al. 2005). Spectral transmission scans of the Schott
longpass filters and Teflon bottles were also applied to the cumulative experimental
exposure for each treatment to estimate the spectral UVR exposure (290-400 nm, 1
nm resolution) within treatment chambers.
Biological Weighting Function
In order to develop a spectrally resolved model of UVR dependent mortality
in M. leidyi, I developed an exposure response curve and a BWF. Data from the
growth, reproduction and survival experiments indicated a threshold exposure for
mortality (see results), which suggested an exposure response curve with a threshold
(e.g. logit function). A trial model was considered which used the BWF for Daphnia
pulicaria (Williamson et al. 2001). This BWF resulted in inadequate estimations of
the predicted versus observed mortality of M. leidyi, partly due to the response in the
intermediate cutoff (320 nm) treatments (Fig. 3). These results indicated that a M.
leidyi-specific BWF was required; however, it was not possible to fit both the
exposure response function and BWF using the limited number of treatments in the
photoinhibitron experiments. I therefore modified the methodology presented in

22
Williamson et al. (2001) to incorporate a logit exposure response curve to calculate
weighting coefficients.
The initial objective was to estimate the weighting coefficient for each
individual wavelength ( in (kJ-1
m-2
)-1
) using Equation 1. In this model, m1 is
equal to the natural logarithm of the weight at 300 nm and m2 equals the slope of the
BWF. The proportionality constant, C, included in this model was set equal to 1. I
used the parameters from Williamson et al. (2001) for D. pulicaria as my initial
parameters but subsequently adjusted them based on my model’s convergence
parameters.
(1)
The best fit to the observed responses was determined using a second equation
for the biologically effective exposure (H*) which integrates the product of exposure
and weighting coefficients over the wavelengths of interest, where H(λ) is the
cumulative irradiance exposure at each wavelength. I chose the 290 - 400 nm range
to examine the damaging effects specific to UV-A and UV-B.
(2)
Once H* was determined, I used a logit function (Eq. 3) to predict mortality in
response to the biologically effective exposure where d1 is a measure of the variability
in individual sensitivity of the population.

23
(3)
The fit of this equation to the data was iteratively improved by adjusting the
parameters in Equations 1 and 3 using Marquadt nonlinear least-squares iterations
implemented in SAS. In order to fit the full model, the fit included both the
photoinhibitron data (to constrain the BWF, Eq. 1) and the solar growth, reproduction
and survival experiments (to constrain exposure response, Eq. 3). Standard errors of
estimated parameters were obtained from asymptotic variances and covariances.
Individual confidence intervals for εH(λ) were derived by propagation of errors
essentially as described in Williamson et al. (2001).

24
Results
Preliminary, growth, reproduction and survival experiments
Preliminary Feeding Experiments:
In the 2008 preliminary solar UVR growth experiment to determine a suitable
feeding density for a UVR effect on Mnemiopsis leidyi growth, the average initial size
of ctenophores was 0.34 ± 0.05 g and 1.10 ± 0.07 cm (n=12). The average daily UVR
exposure in the +UVR treatment was 29.4 ± 2.8 kJ m-2
UV-B day-1
(Table 3). There
was a wide temperature range during the experiment (Table 4) however only three
ctenophores died, each from a different a chamber and treatment.
Final weight and length of ctenophores were significantly affected by both
prey density and UVR treatment (Table 5, Fig. 4). The final size difference between -
UVR and +UVR treatments tended to increase with increasing prey density.
Subsequent growth experiments were run with prey densities of 300 Artemia sp. L-1
to maximize the potential for detecting a significant effect of UVR treatment on the
growth of small ctenophores.
In the 2008 solar reproduction experiment using variable prey densities the
average initial size of ctenophores were 29.23 ± 2.72 g and 7.8 ± 0.35 cm (n=10).
Final weight and length of ctenophores were significantly affected by UVR treatment
but not prey density (Table 5). Ctenophores in +UVR treatments lost weight and
shrank in length while in –UVR treatments ctenophores increased in size. The
average daily UVR exposure in the +UVR treatment was 23.2 ± 2.8 kJ m-2
UV-B

25
day-1
(Table 3). There was a wide temperature range for the experiment (Table 4)
however only one ctenophore died.
There was no significant effect of UVR on rank-transformed eggs released g-1
ctenophore wet wt. However, there was a significant effect of prey density (Table 5).
There were significant effects of both prey density and UVR treatment on the rank-
transformed total number of eggs produced ind-1
by M. leidyi (Table 5, Fig. 5). The
results of egg production in –UVR chambers using prey densities of 325 and 550
Artemia sp. L-1
most closely resembled initial field conditions. Subsequent
experiments were therefore run with the average of these prey densities - 450 Artemia
sp. L-1
.
Growth Experiments:
Mnemiopsis leidyi lost weight and shrank in length in all treatments in all
three growth experiments, probably because the initial size of ctenophores in these
experiments was larger than those in the preliminary growth experiment, and thus the
feeding regime chosen may not have been adequate to support positive growth. The
initial size of ctenophores averaged 1.8 ± 0.1 g and 2.3 ± 0.8 cm (n=40) in
Experiment 1, 2.1 ± 0.2 g and 2.4 ± 0.1 cm (n=30) in Experiment 2 and 1.6 ± 0.2 g
and 2.3 ± 0.1 cm (n=30) in Experiment 3. Mean initial sizes (weights and lengths)
did not differ significantly among treatments for individual experiments (Table 6).
Based on initial measurements, ctenophores in the –UVR treatments lost an average
of 24.9 ± 5.6 % of their weight and 16.5 ± 4.5 % of their length (n=40), ctenophores
in the +UVR treatments on average lost 43.4 ± 1.2 % of their weight and 27.5 ± 2.5 %

26
of their length (n=30) and ctenophores in the S+UVR treatments lost 49.2 ± 10.7 % of
their weight and 29.8 ± 5.0 % of their length (n=30).
Substantial mortality occurred in UVR exposure treatments in Experiment 1.
After three days of UVR exposure, all +UVR ctenophores had died, and S+UVR
ctenophores showed signs of impending death. Mnemiopsis leidyi comb rows became
opaque and lobes appeared shredded in all S+UVR chambers but ctenophores
appeared normal (transparent with unshredded lobes) in all –UVR chambers. The
experiment was therefore terminated one day early at the end of Day 3. There were
no indications of impeding mortality in either Experiment 2 or 3; therefore both
experiments ran for the full four days.
The average daily UVR exposure was significantly different among
experiments (ANOVA df=2,19, F=12.71, P=0.0003); UVR exposures were highest in
Experiment 1 and lowest in Experiment 3 (Table 3). The S+UVR treatment in
Experiment 1 had a similar average daily UVR exposure to the +UVR treatment in
Experiment 2 and the S+UVR treatment in Experiment 2 had a similar average daily
UVR exposure to the +UVR treatment in Experiment 3 (Table 3). Dosimeters
confirmed zero UVR exposure in all –UVR treatments. Mean temperatures for the
three growth experiments varied by 0.3 oC (Table 4).
Initial sizes of ctenophores were used as covariates in full statistical models
and were retained in final models where the effect of initial size on final size was
significant or there was a significant initial size * UVR treatment interaction
(P<0.05). Initial ctenophore weight had a significant effect on the final weight of
ctenophores in Experiment 3 but not in Experiments 1 or 2. Initial length of

27
ctenophores had a significant effect on the final length in Experiments 1 and 3 but not
in Experiment 2 (Table 7). The interaction between initial length and UVR treatment
was significant in Experiment 3 (Table 7).
There were significant UVR effects on both ctenophore weight and length in
Experiments 1 and 2 and on ctenophore length in Experiment 3; M. leidyi in the –
UVR treatment generally lost less weight and shrank less in length than ctenophores
exposed to UVR (Table 7; Fig. 6). A posteriori Fisher’s LSD tests of all pairwise
comparisons for each experiment indicated that there were significant differences in
final weights and lengths of ctenophores in +UVR treatments and –UVR treatments
but no differences in the final weights or lengths of ctenophores in +UVR treatments
and S+UVR treatments (Fig. 6).
Reproduction Experiments:
Mortality rates were high in solar +UVR treatments in reproduction
experiments. In Solar 1, all four Mnemiopsis leidyi from a single +UVR chamber
died most likely due to a sharp drop in salinity overnight as a result of heavy rains.
The chamber lid was skewed and allowed fresh water into the chamber; the salinity in
that particular chamber was 7.0 while the other chambers were 10.7 – 12.1. Three
ctenophores from a separate +UVR chamber in the same experiment also died the day
after mortality occurred in the chamber with the salinity drop but the cause is
uncertain; the single surviving ctenophore from that chamber was excluded from
statistics. In Solar 2, there was 100 % mortality in +UVR treatments and also
mortality of a total of five ctenophores, each from different chambers, in the S+UVR
treatments. No mortality occurred in –UVR chambers in either Solar 1 or Solar 2.
28
There was no mortality in either lamp experiment. The mean temperature for both
solar experiments was similar (Table 4).
Ultraviolet radiation did not affect rank-transformed egg production by
surviving M. leidyi (Table 8; Fig. 7) as measured by either number of eggs produced
g-1
ctenophore wet weight or number of eggs produced ind-1
in the solar and lamp
UVR reproduction experiments. Visual inspection of data suggested a tendency for
ctenophores in +UVR treatments to produce more eggs g-1
, but P > 0.10 for all
comparisons of rank-transformed data (Fig. 7). There was also no discernable pattern
in the number of eggs produced ind-1
(Fig. 7). There was no significant interaction
between food availability and UVR treatment in the second lamp reproduction
experiment (Lamp 2) that included both starved and fed M. leidyi (Table 8; Fig. 7).
Initial reproduction assays were variable; ctenophores produced an average of
8.6 ± 3.5 eggs g-1
and 167.7 ± 75.7 total eggs ind-1
in Solar 1 (n=10), 35.4 ± 10.2 eggs
g-1
and 1467.7 ± 452.7 total eggs ind-1
in Lamp 1 (n=8) and 46.8 ± 7.6 eggs g-1
and
991.6 ± 159.4 total eggs ind-1
in Lamp 2 (n=22). Too few ctenophores were collected
for Solar 2 to conduct an initial reproduction assay. After four days in experimental
chambers, surviving ctenophores in both treatments in Solar 1 produced more total
eggs g-1
and egg ind-1
than in initial reproduction assays. Both treatments in Lamp 1
produced fewer total eggs g-1
and eggs ind-1
and fed treatments in Lamp 2 produced
slightly greater eggs g-1
and total eggs ind-1
while starved ctenophores produced less
total eggs g-1
and eggs ind-1
than ctenophores from the respective initial reproduction
assays.

29
Similar to the growth experiments, all M. leidyi lost weight and shrank in
length during the reproduction experiments with a consistently greater loss in
ctenophore size in +UVR treatments than in -UVR treatments (Table 8). Based on
initial measurements, ctenophores in the –UVR treatments lost an average of 4.6 ±
10.1 % of their weight and 4.5 ± 6.7 % of their length (n=80), ctenophores in the
+UVR treatments on average lost 22.4 ± 11.5 % of their weight and 17.2 ± 5.3 % of
their length (n=49) and ctenophores in the S+UVR treatments lost 62.0 ± 0.0 % of
their weight and 37.3 ± 0.0 % of their length (n=12). In all experiments except Lamp
1 there was a significant negative effect of UVR on ctenophore length (Table 8; Fig.
8). There was a significant negative UVR effect on weight of M. leidyi in Solar 2 and
Lamp 2 and a trend of a negative effect in Solar 1, but no UVR effect on ctenophore
weight in Lamp 1 (Table 8; Fig. 8). There was also a significant negative effect of
initial weight on the final weight of ctenophores in Solar 2; chambers with larger
mean initial weights lost more weight than those with smaller initial weights.
There was no significant difference among the solar and lamp reproduction
experiments in the average daily UVR exposure in the surviving UVR exposure
treatments (ANOVA df=2,9, F=1.74, P=0.2303; Table 3). The average daily UVR
doses for Solar Reproduction 1 and 2 were higher than the average daily UVR doses
for all surviving UVR exposure treatments in growth experiments. The UVR dose in
the S+UVR treatment for Solar Reproduction Experiment 2 was similar in magnitude
to both lamp reproduction experiments, the +UVR treatment in Growth 2 and to the
S+UVR treatment in Growth Experiment 1 (Table 3). Dosimeters confirmed zero
UVR exposure in –UVR treatments.

30
Survival Experiments:
Exposure to near-surface solar irradiance with mean daily UVR exposures
> 31.0 kJ m-2
UV-B day-1
resulted in high percentages of mortality of M. leidyi (Table
2). The six solar survival experiments resulted in a combined mean of 99.0 ± 1.0 %
(n=102) survival in –UVR treatments, 8.8 ± 5.6 % (n=94) survival of ctenophores in
+UVR treatments, and 83.4 ± 8.4 % (n=24) survival in the S+UVR treatments. The
mean daily UVR exposures for the +UVR treatments of the survival experiments was
31.7 – 41.1 kJ m-2
UV-B day-1
(Table 2), and all survival experiments had a higher
mean daily UVR exposure than all of the surviving treatments in growth and
reproduction experiments. Dosimeters confirmed zero UVR exposure in –UVR
treatments. T-tests for each experiment confirmed no significant difference
(P > 0.05) in the size of ctenophores among UVR treatments.
During the summer of 2008 and 2009, two full days of near-surface UVR
exposure resulted in a significant decrease (ANOVA df=2,13, F=5.33, P=0.0204) in
survival for all experiments (growth, reproduction and survival). Across all solar
experiments, survival averaged 99.1 ± 0.6 % (n=196) in –UVR treatments (excluding
the mortality attributed to a sharp drop in salinity in a single chamber, see
Reproduction experiments), 49.5 ± 14.5 % (n=162) in +UVR treatments, and 91.7 ±
5.9 % (n=42) survival in S+UVR treatments on the morning of Day 3. A comparison
of the two-day percent survival of all UVR exposure treatments (+UVR and S+UVR)
of juvenile and adult ctenophores from all experiments (including preliminary,
growth, reproduction and survival) to mean daily UVR exposure indicated a survival
threshold response, with a sharp decline in survival at approximately 31.5 kJ m-2

31
UV-B day-1
and no difference in the response of juvenile and adult life stages (Fig. 9).
The response curve yielding the highest R2 was fit using a three parameter sigmoidal
function (P < 0.0001). A similar comparison of the four-day percent survival and
mean daily UVR exposure (for treatments not terminated in < four days with
surviving ctenophores) indicated the threshold to be approximately 33.2 kJ m-2
UV-B
day-1
. An additional comparison was made using the two-day percent survival and
the two-day highest hour of UVR irradiance. The response curve was best fit using a
four parameter sigmoidal function (P < 0.0001) resulting in a threshold around 12.7
kJ m-2
UV-B hour-1
(Fig. 10).
Spectral Response Experiments
The combined results from the solar photoinhibitron experiments suggest that
spectral variation of UVR has a significant effect (ANOVA, df=2,11, F=16.98,
P=0.0004) on the percent survival of Mnemiopsis leidyi. The percent survival
progressively decreased as shorter wavelength irradiance was included; the 370
treatment had 100.0 ± 6.2 % (n=16) survival, followed by the 320 treatment with 50.0
± 14.4 % (n=16) survival and the 295/305 treatment with 12.5 ± 8.5 % (n=24)
survival.
The mortality and cumulative irradiance data from the solar photoinhibitron,
growth, reproduction and survival experiments were used to fit the BWF parameters
resulting in values of -3.0415 ± 0.1861 for m1 (the natural log of the weight at 300
nm), 0.1142 ± 0.0081 for m2 (the spectral slope of the BWF) and 15.95 ± 7.87 for d1
(the measure of variability of individual sensitivity). The BWF model for M. leidyi
was fit with an R2 value 0.74, P<0.0001 (Fig. 11). Applying the BWF obtained to

32
spectral exposure produces a spectrum of biologically effective exposure per
wavelength (H*(λ)), from this it was possible to determine the range of most
damaging wavelengths to M. leidyi. The range corresponds to the region where the
H*(λ) was greater than 50% of the effective exposure peak response, in this case 307-
330 nm (Fig. 12). In comparing the BWF for M. leidyi to that published in
Williamson et al. (2001) for Daphnia pulicaria, my model revealed that the response
for M. leidyi is essentially the same as for D. pulicaria for much of the UVR spectrum
(Fig. 11).
The overall fit of the BWF model for M. leidyi is shown by comparing
predictions to observed mortality in the photoinhibitron, growth, reproduction (solar
and lamp) and survival experiments (Fig. 13). The relationship between two-day H*
and cumulative experimental mortality suggests that the logistical response model is
an acceptable predictor (R2=0.73, P<0.0001) of the effects of UVR on mortality. The
model is defined so that the threshold (50% mortality) of biologically effective
exposure that M. leidyi can tolerate in a two-day period is at H*= 1.0 (Fig. 13).

33
Discussions and Conclusions
Results under ambient solar UVR conditions indicate that summertime solar
UVR exposure equivalent to average conditions within the top 0.5 m of the water
column of the Rhode River has both lethal and sub-lethal deleterious effects on
Mnemiopsis leidyi individuals. Exposure to Rhode River near-surface summertime
solar UVR significantly decreased size and increased mortality of ctenophores, but
did not significantly affect egg production.
Except in preliminary experiments, experimental chambers designed to permit
UVR exposure did not result in ctenophore growth, even in –UVR control treatments,
but the loss in ctenophore weight and length was consistently greater in solar UVR
exposure treatments than in controls for both growth and reproduction experiments.
Because M. leidyi individuals I tested shrank in body size during all solar
experiments, my results may reflect the impacts of the combined stresses of UVR
exposure and an insufficient feeding regime. However, preliminary experiments in
which growth did occur yielded a similar pattern.
Mnemiopsis leidyi also did not achieve positive growth in indoor laboratory
experiments. Although ctenophore gut cavities contained food throughout the day,
growth was negative in all growth and reproduction experiments. This negative
growth in growth experiments may have been due to an inadequate feeding regime as
the size of the ctenophores used in the preliminary growth experiment to determine an
appropriate feeding regime for subsequent experiments were much smaller than those
used in later experiments. There was also negative growth in the reproduction

34
experiments but positive grown seen in ctenophores in the –UVR treatment in the
preliminary experiment; the size of ctenophores used in the preliminary reproduction
experiment was similar to the later reproduction experiments but ctenophores were
fed only twice day-1
and the second feeding was not adjusted for prey depletion. The
shallow (12 cm) dimensions of the chambers used to control UVR exposure may also
have impeded growth. Even with airlines at the surface, chambers did not provide
natural water circulation and may have inhibited the ability of M. leidyi to capture
sufficient prey.
There was a negative effect of UVR exposure on ctenophore size in only one
of the two reproduction experiments using lamp-produced UVR (Lamp 2). This
effect of lamp-produced UVR on size occurred under similar cumulative UVR
exposures to solar UVR exposures that also negatively affected ctenophore size. The
spectral composition of the UVA-340 lamps closely mimics summer noontime solar
radiation, so I do not believe that spectral qualities of the lamps were responsible for
differences in experiments using ambient solar and lamp produced UVR. Instead an
important difference may be that the UVR dose rate output of the lamps is constant
during exposure, whereas the spectral composition and intensity of solar UVR varies
throughout the day and the dose rate is not constant (Fig. 14). There was no UVR
effect on ctenophore size in Lamp Experiment 1 which had a higher average daily
exposure to UVR than Solar Growth Experiment 2 where a UVR effect on size was
observed in both +UVR and S+UVR treatments. These results may indicate that M.
leidyi is less sensitive to the cumulative daily UVR dose and more susceptible to

35
exposure to specific wavelengths, the dose-rate of exposure, the peak intensity of
daily UVR, or a combination of these factors.
I found no significant effect of UVR on egg production either as eggs g-1
of
ctenophore wet weight or total eggs produced ind-1
. It would be reasonable to expect
that an organism that is sensitive to UVR, has both ovaries and testes near the surface
of a transparent body, and gametes that are released into the environment may
experience direct damage to gonads or alter its reproductive effort during stressful
periods of high UVR. Mnemiopsis leidyi has a high and rapid capacity to repair
physical damage (Coonfield 1936). In addition, reproduction occurs overnight and
eggs hatch before the daily peak in UVR. One possible explanation for this strategy is
that it ensures that organs exposed to UVR have time to be repaired before releasing
gametes and that the gametes themselves are protected from UVR exposure. Another
alternative may be that UVR exposure necessary to reduce egg production may be
nearly equivalent to lethal exposures.
Because the energy required for egg production in M. leidyi is very low
(Reeve et al., 1989), natural selection may not favor shifting energy allocation away
from reproduction in response to damage from UVR or similar stressors. If
investment in reproduction is small compared to the energy required for tissue repair,
individuals may not gain a lifetime fitness advantage from altering reproductive
output in favor of somatic repair, assuming minimal or no damage to the functionality
of the reproductive organs has occurred. Furthermore, if damage sustained to
reproductive organs can be rapidly repaired before reproduction occurs, there may be
no benefit to reducing reproductive output even in the presence of damage to gonads.

36
Organism response and tolerance to UVR varies among species and life
stages, and can be dependent on spectral composition (Vincent and Neale 2000).
Data from the growth, reproduction and survival experiments suggest that the
tolerance threshold of M. leidyi does not differ with post-larval ctenophore size. The
results from applying the BWF to the photoinhibitron, growth, reproduction and
survival experiment data to calculate net biologically effective exposure suggested
that M. leidyi is tolerant of a biologically effective exposure of about 1.0 within a two
day period but does not indicate whether the threshold is due to the cumulative
biologically effective exposure of 1.0 over a two day period or whether the threshold
is due to a single high day of biologically effective exposure. From these results it is
uncertain whether reciprocity holds (i.e. the response to a dose of UVR being
independent of the dose rate). Reciprocity in M. leidyi needs to be further examined
before these results can be applied to other scenarios. Regardless of whether the
BWF is determined to be applicable to other conditions (i.e., if reciprocity holds), its
implications on sensitivity may still provide insights and explanations into some of
the behavioral ecology and trade-offs of M. leidyi in response to UVR.
An organisms’ position in the water column is key in determining the amount
of UVR exposure and subsequent damage. An organism that spends much of its time
at the water’s surface during periods of high UVR is more likely to suffer harmful
consequences than an identical organism that spends its time at depth. The outdoor
growth, reproduction and survival experiments and the solar photoinhibitron
experiments were performed under natural solar irradiance and their subsequent
exposures are representative of average summertime UVR conditions within the top

37
0.5 m of the Rhode River. Mnemiopsis leidyi is found throughout the water column
and not strictly limited to surface waters, therefore the exposures experienced in these
experiments are not representative of typical exposures for ctenophores that move
throughout the water column.
Organisms generally move throughout the water column for reasons such as
pursuing prey, following the thermocline, halocline or pycnocline, or in response to
UVR. Mnemiopsis leidyi is typically described as being found throughout the water
column and have not been shown to exhibit a predictable pattern of diel migration.
However, fine-scale diel variations in vertical distributions relative to UVR
penetration have not been examined. Costello and Mianzan (2003) observed distinct
aggregations of M. leidyi both in surface and near bottom waters off the coast of
Argentina. They were unable to attribute the aggregations to a specific environmental
variable. Mnemiopsis leidyi tend to avoid rough surface waters created by high
winds. It is unknown, however, whether they will also avoid surface waters during
periods of high UVR. If M. leidyi does have the ability to detect and respond to UVR
then it seems reasonable they would seek refuge at depths during periods of intense
UVR.
Some organisms also move vertically during the daytime to avoid visual
predation. In Chesapeake Bay, the main predators of M. leidyi are the sea nettle
Chrysaora quinquecirrha and the ctenophore Beroe beroe. Neither C. quinquecirrha
nor B. beroe are visual predators and therefore whether M. leidyi is UVR-transparent
as a method of camouflage is likely irrelevant in reducing its predation by these
predators. This suggests that the risk of visual predation would not be a reason to

38
favor absence of photoprotective compounds as a UVR-defense strategy.
Photoprotective compounds are also costly to produce and may not offer enough
protection against the most biologically damaging wavelengths specific to M. leidyi.
For example, the majority of known mycosporine-like amino acids absorb maximally
in the 320-360 nm range, which covers a only a portion of the wavelength range (307
- 330 nm) that appears to be the most harmful to M. leidyi.
Mnemiopsis leidyi is a voracious predator that does not appear to greatly
discriminate in prey selection (Purcell et al. 2001). Mnemiopsis leidyi are not visual
predators and forage with their oral cavity open and lobes extended to capture prey.
Transparency to UVR as well as transparency in general may allow M. leidyi to avoid
detection from potential prey when feeding. Several species of zooplankton have
been shown to have UVR photoreceptors and thus may depend on UVR for vision
(Leech and Johnsen 2003). If M. leidyi were to employ photoprotective compounds
blocking UVR they would be visible to prey species with UV-vision and thus
potentially reduce capture and feeding rates.
An organisms’ sensitivity to UVR may affect its seasonality in regions with
high incident UVR and penetration. In Chesapeake Bay which is at 38 oN latitude
and has turbid water and, in recent decades in Narragansett Bay farther to the north,
M. leidyi reaches peak abundances from June through September when UV irradiance
is at its annual peak (Kremer 1994, Sullivan et al. 2001). In some more southern
latitudes such as southern Florida (25 oN), however, M. leidyi peaks in eutrophic and
clear, subtropical waters during fall to spring when UVR is well below its annual
peak (Kremer 1994, Breitburg et al. unpublished data). It is possible that latitudinal

39
variation in incident UVR contributes to latitudinal variation in peak M. leidyi
abundance. Mnemiopsis leidyi in Chesapeake Bay may be able to withstand the peak
surface UVR (which this study suggests can be lethal) solely by seeking depth refuge.
This is possible in highly eutrophic waters where high abundances of dissolved
organic matter and particulates block UVR penetration from sub-surface waters,
while ctenophores in clear shallow (< 5 m) waters may have no refuge and therefore
peak during low UVR periods. Breitburg et al. (unpublished data) found that M.
leidyi densities in the St. Lucie River (Fort Pierce, Florida) tended to be higher during
peak UV periods from May- June than in the adjacent, clearer Indian River Lagoon.
An alternative explanation for the ability of M. leidyi to inhabit and thrive in high-
UVR clear tropical waters may be that the photoprotective strategies or photorepair
systems of populations of M. leidyi differ latitudinally and ctenophores from high-
UVR oligotrophic and tropical waters may utilize superior photoprotective
mechanisms, have a more efficient repair system, or may have higher tolerance to
UVR. The damage caused by UVR is not dependent on temperature. However, the
rate of photorepair and other repair mechanisms increases with increasing
temperatures (Williamson et al. 2002, Häder et al. 2007). These may be key points
that should be further examined to better understand the continued existence of the
UVR-sensitive M. leidyi in clear tropical waters where incident UVR and UVR
penetration are high.
In aquatic ecosystems, incident UV-B will increase due to ozone depletion but
more importantly, efforts to improve water quality in eutrophic coastal regions by
reducing runoff and nutrient loading will likely lead to reduced CDOM and increased

40
amounts and penetration of UV-B into the water column (Molot et al. 2004). If a
reduction in particulates and CDOM were to occur, M. leidyi could be at increased
risk for UVR damage at deeper depths, and in some cases where the water is very
shallow, M. leidyi may not find a depth refuge from UVR exposure. However, M.
leidyi has been observed in early June, near the annual peak in irradiance in shallow
(> 3 m) clear tropical waters off Carrie Bow Cay, Belize where there is no refuge
from UVR (pers. obs.).
UVR exposure could also affect natural populations by delaying or preventing
affected individuals from reaching the minimum size for reproduction. Reduced
growth rates leading to overall smaller sizes of individuals therefore have the
potential to decrease the lifetime fitness of individual ctenophores as well as
population growth rates. Although I did not detect a reduction in egg production in
my experiments, longer duration exposures might result in sufficiently reduced sizes
of reproductive individuals to generate an effect in the number of eggs produced ind-1
because egg production is positively correlated with ctenophore size. Consequences
of increased UVR penetration could therefore include reduced population sizes of M.
leidyi and resulting changes to coastal and estuarine food webs including increases in
zooplankton and ichthyoplankton populations and decreases in sea nettle and Beroe
populations in Chesapeake Bay.
There is much still unknown about the behavior and physiology of M. leidyi,
especially in response to UVR. The results from these experiments indicate that at
current conditions in the Rhode River, M. leidyi is at risk for damage from UVR
exposure within the top 0.5 m of the water column. The solar photoinhibitron

41
experiments and the determination of the BWF and biologically effective exposure
suggest that M. leidyi are most sensitive (i.e. have the lowest tolerance) to the high-
energy, shorter UV-B wavelengths. One of the caveats of the experiments is that
these mortality results would be anticipated if M. leidyi were confined to the upper
0.5 m of the water column or should conditions within the Rhode River change
allowing increased UVR exposures similar to these experimental exposures at greater
depths. However, these results cannot yet be applied to other situations until the
concept of reciprocity in M. leidyi is more closely examined. This information may
still provide additional insight into understanding the behavior of M. leidyi. In
addition to examining reciprocity, another interesting course of study would be to
investigate the behavioral responses of M. leidyi to UVR and examine differences in
physiological and behavioral responses in populations that differ latitudinally and
from waters with different eutrophic states.

42
Table 1. Summary of experiments conducted in 2008 and 2009 with associated types
and treatments.
Number of
Experiments
Experiment Type
Treatments 2008 2009 Notes
Preliminary +UVR, -UVR 2 0 Variable prey densities (one growth, one reproduction).
Growth +UVR, -UVR, S+UVR 0 3 Mortality of all +UVR in first
experiment.
Reproduction +UVR, -UVR 3 0 One solar and two lamp
experiments.
Reproduction +UVR, -UVR, S+UVR 0 1 Solar.
Survival +UVR, -UVR, S+UVR 0 6
Four solar survival experiments. Data also from
one growth and one reproduction experiment.

43
Table 2. Mean size and daily UVR exposure ( SE) with corresponding results for
the duration of the experiments on the cumulative survival of juvenile (< 3 cm) and
adult (> 3 cm) M. leidyi in UVR treatments (n/a= not applicable).
Mean Daily UVR (kJ m-2 UV-B day-1)
% Survival
Experiment Size (cm) +UVR S+UVR
+UVR S+UVR -UVR
Juvenile 1 1.4 ± 0.1 32.0 ± 3.2 n/a 26.7 n/a 100.0
Juvenile 2 2.3 ± 0.1 41.1 ± 2.6 21.7 ± 4.5 0.0 91.7 93.8
Adult 1 5.8 ± 0.2 35.0 ± 7.2 n/a 26.0 n/a 100.0
Adult 2 6.1 ± 0.2 35.3 ± 3.3 n/a 0.0 n/a 100.0
Adult 3 7.6 ± 0.1 40.0 ± 6.3 n/a 0.0 n/a 100.0
Adult 4 5.8 ± 0.1 31.7 ± 7.4 20.3 ± 2.6 0.0 75.0 100.0

44
Table 3. Mean daily solar UVR exposure ( SE) for growth and reproduction
experiments (n/a= not applicable).
Mean Daily UVR
(kJ m-2 UV-B day-1)
Experiment +UVR S+UVR
Preliminary Feeding (Growth) 29.4 ± 2.8 n/a
Preliminary Feeding (Repro) 23.2 ± 2.8 n/a Growth 1 41.1 ± 2.6 21.7 ± 0.8
Growth 2 23.1 ± 1.5 13.8 ± 0.9
Growth 3 14.0 ± 3.0 9.0 ± 1.9
Reproduction Solar 1 26.2 ± 3.0 n/a
Reproduction Solar 2 35.0 ± 5.4 20.3 ± 2.6
Reproduction Lamp 1 19.8 ± 2.3 n/a
Reproduction Lamp 2 21.3 ± 2.3 n/a

45
Table 4. Mean (± 1 SE), minimum and maximum recorded temperature
measurements for all solar experiments.
Temperature (oC)
Experiment Mean Minimum Maximum
Preliminary Growth 24.6 ± 0.2 19.7 31.5
Preliminary Reproduction 23.2 ± 0.3 19.5 29.0
Growth 1 23.6 ± 0.1 21.2 27.8
Growth 2 23.7 ± 0.1 18.0 26.8
Growth 3 23.4 ± 0.1 21.3 27.1
Solar Reproduction 1 23.9 ± 0.3 19.4 27.4
Solar Reproduction 2 25.2 ± 0.1 24.1 27.4

46
Table 5. Statistical results from preliminary feeding experiments. Final models were
run as ANCOVA using Type III SS. Non-significant results in parenthesis were
excluded from the final model.
Measure df F P
Growth Experiment
Weight UVR treatment 1,7 7.51 0.0289
Prey Density 1,7 17.27 0.0043 (UV treatment x Prey Density 1,6 4.66 0.0742)
Length UVR treatment 1,7 6.17 0.0419
Prey Density 1,7 20.86 0.0026 (UV treatment x Prey Density 1,6 1.30 0.2970)
Reproduction Experiment Egg Production (eggs g-1) rank-transformed UVR treatment 1,7 2.63 0.1490
Prey Density 1,7 8.29 0.0237 (UV treatment x Prey Density 1,6 0.10 0.7639)
Egg Production (total eggs) rank-transformed UVR treatment 1,7 9.64 0.0172
Prey Density 1,7 10.89 0.0131 (UV treatment x Prey Density 1,6 0.22 0.6551)
Weight UVR treatment 1,7 19.82 0.0030
Prey Density 1,7 0.13 0.7309 (UV treatment x Prey Density 1,6 0.40 0.5518)
Length UVR treatment 1,7 26.92 0.0013
Prey Density 1,7 0.37 0.5646 (UV treatment x Prey Density 1,6 0.19 0.6785)
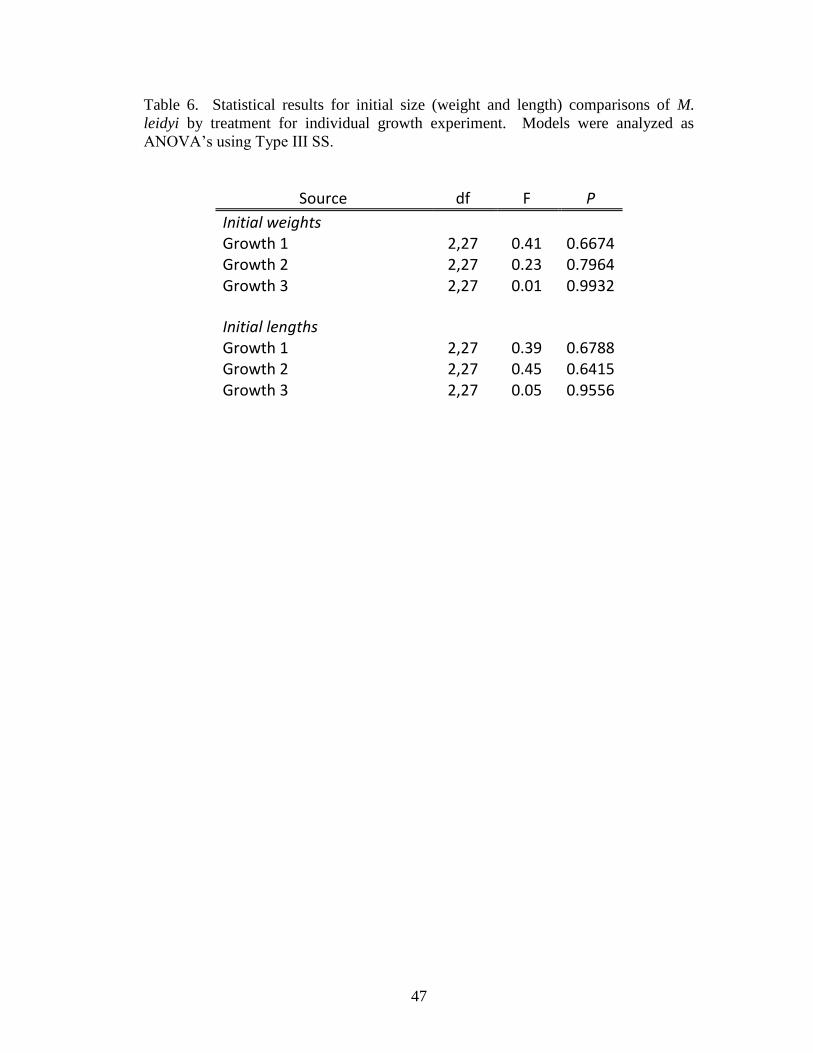
47
Table 6. Statistical results for initial size (weight and length) comparisons of M.
leidyi by treatment for individual growth experiment. Models were analyzed as
ANOVA’s using Type III SS.
Source df F P
Initial weights Growth 1 2,27 0.41 0.6674
Growth 2 2,27 0.23 0.7964 Growth 3 2,27 0.01 0.9932
Initial lengths Growth 1 2,27 0.39 0.6788
Growth 2 2,27 0.45 0.6415 Growth 3 2,27 0.05 0.9556

48
Table 7. Statistical results for growth experiments examining effects of UVR on
growth (weight and length) of M. leidyi. Final weight model for Experiments 1 and
final weight and length models for Experiment 2 were analyzed as ANOVA’s using
Type III SS. Final length model for Experiment 1 and final weight and length models
for Experiment 3 were analyzed as ANCOVA’s using Type III SS. Results in
parenthesis were excluded from the final model.
Source df F P
Growth 1 Weight UVR treatment 1,5 21.18 0.0058
(Initial Weight 1,4 0.06 0.8192) (Initial weight x UVR treatment 1,3 0.80 0.4364)
Length UVR treatment 1,3 52.81 0.0054
Initial length 1,3 21.10 0.0194 (Initial length x UVR treatment 1,2 0.00 0.9711)
Growth 2 Weight UVR treatment 2,7 5.80 0.0327
(Initial weight 1,6 0.47 0.5202) (Initial weight x UVR treatment 2,4 1.05 0.4307)
Length UVR treatment 2,7 6.94 0.0218
(Initial length 1,6 0.15 0.7116) (Initial length x UVR treatment 2,4 0.02 0.9823)
Growth 3 Weight UVR treatment 2,4 4.22 0.1033
Initial weight 1,4 49.01 0.0022 Initial weight x UVR treatment 2,4 8.59 0.0357 Length UVR treatment 2,6 7.93 0.0207 Initial length 1,6 6.55 0.0430 (Initial length x UVR treatment 2,4 0.65 0.5709)

49
Table 8. Reproduction experiments. Statistical results for the effect of UVR on rank-
transformed egg production and size (weight and length) of M. leidyi. Models of egg
production were analyzed in Solar 1, Solar 2 and Lamp 1 using ANOVA with Type
III SS; the final model in Lamp 2 was analyzed using ANCOVA with Type III SS.
Ctenophore size was analyzed as ANOVA using Type III SS in Solar 1 and Lamp 1
while the final model in Solar 2 and Lamp 2 were analyzed as ANCOVA using Type
III SS.
Source df F P
Reproduction Solar 1 Eggs g-1 rank-transformed 1,6 1.11 0.3336
Total eggs rank-transformed 1,6 0.52 0.4991 Weight 1,6 5.38 0.0595 Length 1,6 13.42 0.0105
Reproduction Solar 2 Eggs Eggs g-1 rank-transformed 1,5 0.11 0.7575
Total eggs rank-transformed 1,5 0.02 0.8940
Weight UV treatment (on final weight) 1,4 145.89 0.0003
Initial weight 1,4 79.97 0.0009 (Initial weight x UV treatment 1,3 0.70 0.4651)
Length UV treatment (on final length) 1,4 10.14 0.0334
Initial length 1,4 2.31 0.2032 (Initial length x UV treatment 1,3 0.16 0.7121)
Reproduction Lamp 1 Eggs g-1 rank-transformed 1,8 0.87 0.3780
Total eggs rank-transformed 1,4 2.07 0.2233 Weight 1,8 0.26 0.6238 Length 1,4 0.84 0.4102
Reproduction Lamp 2 Eggs g-1 rank-transformed UVR treatment 1,9 0.92 0.3632
Food availability 1,9 14.68 0.0040 (Food availability x UVR treatment 1,8 0.49 0.5053)

50
Total eggs rank-transformed
UVR treatment 1,9 0.84 0.3823 Food availability 1,9 30.38 0.0004 (Food availability x UVR treatment 1,8 0.35 0.5716)
Weight UVR treatment 1,9 5.42 0.0449
Food availability 1,9 1.94 0.1970 (UVR treatment x food availability 1,8 0.66 0.4391)
Length UVR treatment 1,9 18.09 0.0021
Food availability 1,9 4.22 0.0701 (UVR treatment x food availability 1,8 0.73 0.4174)

51
Figure 1. Experimental design for all outdoor growth, reproduction and survival
experiments under ambient solar set-up. Closed-system with water re-circulated
through a chiller to maintain temperatures within experimental chambers.

52
Figure 2. Experimental design for the solar photoinhibitron experiments used to
determine the biological weighting function. Closed-system with water re-circulated
through a chiller to maintain temperatures within experimental chambers.

53
Two-day cumulative H* using Daphnia BWF function
0.0 0.5 1.0 1.5
Cum
ulat
ive
perc
ent
surv
ival
0
20
40
60
80
100
120
Figure 3. The threshold response curve relating cumulative percent survival in
photoinhibitron, growth, reproduction and survival experiments to two-day
cumulative biologically effective exposure (H*) using the Daphnia pulicaria
biological weighting function.
R2=0.67

54
Figure 4. Preliminary growth experiment; mean final wet weight (g) comparisons of
juvenile M. leidyi in +UVR (grey line) and -UVR (black line) treatments. Thin solid
line represents estimate of initial weight. The R2 values represent the linear fit for
+UVR and –UVR treatments with P-values of 0.1980 and 0.0035 respectively.
1g M. leidyi WW = 0.0081 g DW, 0.0004 g C, 0.0001 g N (Nemazie et al. 1993).
R² = 0.96
R² = 0.48
0
0.2
0.4
0.6
0.8
1
1.2
0 100 200 300 400
Cte
no
ph
ore
wet
we
igh
t (g
) (m
ean
±1
SE)
Prey density (ind L-1)
-UVR
+UVR

55
Figure 5. Preliminary reproduction experiment; comparison of mean eggs produced
g-1
of ctenophore wet weight (top) and mean total eggs produced ind-1
(bottom) in
+UVR (grey line) and -UVR (black line) treatments. Thin solid line represents
estimate of initial egg production. The R2 values represent the linear fit for +UVR
and –UVR treatments with P-values of 0.0899 and 0.1652 for mean eggs g-1
and
0.0590 and 0.2608 for mean total eggs respectively.
R² = 0.67
R² = 0.53
0
10
20
30
40
50
60
70
80
100 200 300 400 500 600
Eggs
g-1
(me
an ±
1 S
E)
Prey density (ind L-1)
-UVR
+UVR
R² = 0.75
R² = 0.39
0
500
1000
1500
2000
2500
100 200 300 400 500 600
Eggs
ind
-1(m
ean
±1
SE)
Prey density (ind L-1)
-UVR
+UVR

56
Figure 6. Mean final wet weight (black bars) and length (open bars) comparisons of
small M. leidyi in growth experiments. Letters represent results of a posteriori
Fisher’s LSD test on all pairwise comparisons. Different letters represent significant
differences between treatments P < 0.05. No pairwise comparisons were performed
on the weights in Experiment 3 due to a significant interaction between initial weight
and UVR treatment.
00.5
11.5
22.5
+UVR S+UVR -UVR +UVR S+UVR -UVR
Fin
al s
ize
(g o
r cm
; m
ean
±1
SE)
Treatment
Experiment 1
A
ABB
10
0 %
Mo
rtal
ity
10
0 %
Mo
rtal
ity
00.5
11.5
22.5
+UVR S+UVR -UVR +UVR S+UVR -UVR
Fin
al s
ize
(g o
r cm
; m
ean
±1
SE)
Treatment
Experiment 2
A
A
A
B AB
00.5
11.5
22.5
+UVR S+UVR -UVR +UVR S+UVR -UVR
Fin
al s
ize
(g o
r cm
; m
ean
±1
SE)
Treatment
Experiment 3
AA, B
B

57
Figure 7. Mean number of eggs produced g-1
ctenophore wet weight (black, left) and
mean total number of eggs produced ind-1
(grey, right) in reproduction experiments
under solar and lamp-produced UVR.
0
20
40
60
80
-UVR +UVR
Eggs
g-1
(mea
n ±
1SE
)
Treatment
Solar 1
0
500
1000
1500
2000
-UVR +UVR
Eggs
ind
-1
(mea
n ±
1 S
E)
Treatment
Solar 1
0
20
40
60
80
- UVR S+ UVR +UVR
Eggs
g-1
(mea
n ±
1 S
E)
Treatment
Solar 2
10
0 %
Mo
rtal
ity
0
500
1000
1500
2000
- UVR S+ UVR +UVREg
gs in
d-1
(mea
n ±
1 S
E)Treatment
Solar 2
10
0 %
Mo
rtal
ity
0
20
40
60
80
-UVR +UVR
Eggs
g-1
(mea
n ±
1 S
E)
Treatment
Lamp 1
0
500
1000
1500
2000
-UVR +UVR
Eggs
ind
-1
(mea
n ±
1 S
E)
Treatment
Lamp 1
0
20
40
60
80
-UVR Fed
+UVR Fed
- UVR Starved
+UVR Starved
Eggs
g-1
(mea
n ±
1 S
E)
Treatment
Lamp 2
0
500
1000
1500
2000
-UVR Fed
+UVR Fed
-UVR Starved
+UVR Starved
Eggs
ind
-1
(mea
n ±
1 S
E)
Treatment
Lamp 2

58
Figure 8. Mean final wet weight (black bars) and length (open bars) of M. leidyi in
reproduction experiments.
0
10
20
30
-UVR +UVR -UVR +UVRFin
al s
ize
(g o
r cm
; m
ean
±1
SE)
Treatment
Solar 1
0
10
20
30
-UVR S+UVR -UVR S+UVRFin
al s
ize
(g o
r cm
; m
ean
±1
SE)
Treatment
Solar 2
0
10
20
30
-UVR +UVR -UVR +UVRFin
al s
ize
(g o
r cm
; m
ean
±1
SE)
Treatment
Lamp 1
0
10
20
30
-UVR Fed
+UVR Fed
-UVR Starved
+UVR Starved
-UVR Fed
+UVR Fed
-UVR Starved
+UVR Starved
Fin
al s
ize
(g
or
cm;
me
an ±
1SE
)
Treatment
Lamp 2
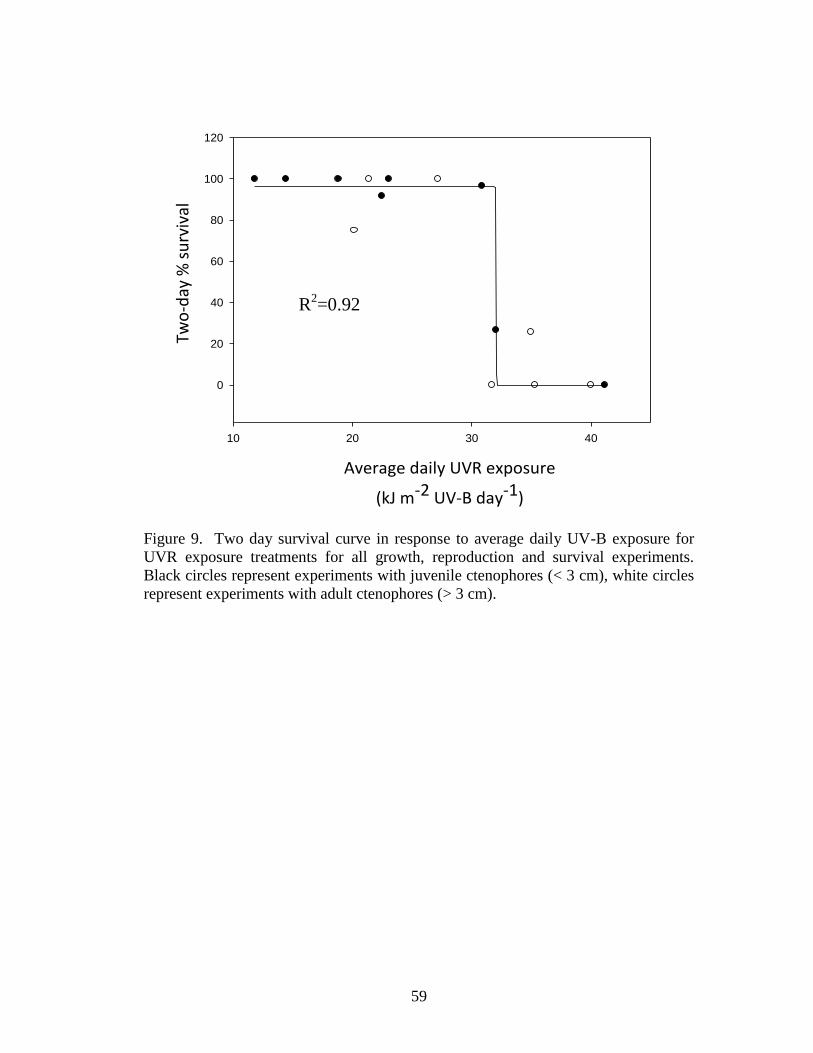
59
10 20 30 40
0
20
40
60
80
100
120
Two
-day
% s
urv
ival
Average daily UVR exposure
(kJ m-2 UV-B day-1)
Figure 9. Two day survival curve in response to average daily UV-B exposure for
UVR exposure treatments for all growth, reproduction and survival experiments.
Black circles represent experiments with juvenile ctenophores (< 3 cm), white circles
represent experiments with adult ctenophores (> 3 cm).
R2=0.92

60
Highest hour (kJ m-2 UV-B hour-1)
4 6 8 10 12 14 16
Two
-day
per
cen
t su
rviv
al
0
20
40
60
80
100
120
Figure 10. Two day survival curve in response to the two day highest hour of UV
irradiance for UVR exposure treatments for all growth, reproduction and survival
experiments. Black circles represent experiments with juvenile ctenophores (< 3 cm),
white circles represent experiments with adult ctenophores (> 3 cm).
R2=0.93

61
Figure 11. The biological weighting functions for Mnemiopsis leidyi and Daphnia
pulicaria (Williamson et al. 2001) with 95 % confidence intervals.
1E-05
0.0001
0.001
0.01
0.1
1
290 310 330 350 370 390
ε H(λ
) (*
kJ m
-2]-1
)
Wavelength (nm)
Mnemiopsis BWF
Mnemiopsis Lower CI
Mnemiopsis Upper CI
Daphnia BWF
Daphnia Lower CI
Daphnia Upper CI

62
Figure 12. The mean weighted cumulative irradiance exposure for individual
wavelengths from the solar photoinhibitron experiments.
0
0.005
0.01
0.015
0.02
0.025
0.03
0.035
0.04
0.045
290 310 330 350 370 390
H(λ
) n
m-1
Wavelength (nm)

63
Two-day H*
0.0 0.2 0.4 0.6 0.8 1.0 1.2 1.4 1.6
Cu
mu
lati
ve p
erce
nt
mo
rtal
ity
0
20
40
60
80
100
120
Figure 13. The threshold response curve relating cumulative experimental mortality
in photoinhibitron, growth, reproduction and survival experiments to two-day
cumulative biologically effective exposure (H*).
R2=0.73

64
Figure 14. Solar and lamp UV energy comparison. Dashed line represents output
from the UV lamps; solid line represents solar energy from a typical clear summer
day (Data from July 28, 2009).
0
0.1
0.2
0.3
0.4
0.5
0.6
0.7
0.8
3 6 8 10 13 15 18 20
UV
en
ergy
(W
m2)
Time of day (h)

65
Bibliography
Banaszak, A.T. 2003. Photoprotective physiological and biochemical responses of
aquatic organisms. In: Helbling, E.W., and Zagarese, H. (eds.) UV effects in
aquatic organisms and ecosystems, The Royal Society of Chemistry,
Cambridge, pp 329–356.
Banaszak, A.T., and Trench, R.K. 1995. Effects of ultraviolet (UV) radiation on
marine microalgal-invertebrate symbioses. II. The synthesis of mycosporine-
like amino acids in response to exposure to UV in Anthopleura elegantissima
and Cassiopeia xamachana. J Exp Mar Biol Ecol, 194:233-250.
Blaustein, A.R., Hoffman, P.D., Hokit, D.G., Kiesecker, J.M., Walls, S.C. and Hays,
J.B. 1994. UV repair and resistance to solar UV-B in amphibian eggs: A
link to population declines? Proc. Natl. Acad. Sci. U. S. A., 91: 1791-1795.
Boersma, M., Malzahn, A.M., Greve, W. and Javidpour, J. 2007. The first
occurrence of the ctenophore Mnemiopsis leidyi in the North Sea. Helgol Mar
Res, 61: 153-155.
Breitburg, D.L., Adamack, A., Rose, K.A., Kolesar, S.E., Decker, M.B., Purcell, J.E.,
Keister, J.E. and Cowan, J.H. Jr. 2003. The pattern and influence of low
dissolved oxygen in the Patuxent River, a seasonally hypoxic estuary.
Estuaries, 26: 280-297.
Buma, A.G.J., Boelen, P. and Jeffery, W.H. 2003. UVR-induced DNA damage in
aquatic organisms. In: Helbling, E.W., and Zagarese, H. (eds.) UV effects in
aquatic organisms and ecosystems, The Royal Society of Chemistry,
Cambridge, pp 291–327.
Caldwell, M.M., Camp, L.B., Warner, C.W. and Flint, S.D. 1986. Action spectra
and their key role in assessing biological consequences of solar UV-B
radiation change. In: Worrest, R.C., Caldwell, M.M. (eds.) Stratospheric
Ozone Reduction, Solar Ultraviolet Radiation and Plant Life, Springer, New
York, pp 87-111.
Coonfield, B.R. 1936. Regeneration in Mnemiopsis leidyi, Agassiz. Biol Bull
(Woods Hole), 71 (3): 421-428.
Costello, J.H. and Mianzan, H.H. 2003. Sampling field distributions of Mnemiopsis
leidyi (Ctenophora, Lobata): planktonic or benthic methods? J Plankton Res,
25:455-459.
Cowan Jr., J.H. and Houde, E.D. 1993. Relative predation potentials of
scyphomedusae, ctenophores and planktivorous fish on ichthyoplankton in
Chesapeake Bay. Mar Ecol Prog Ser, 95: 55-65.
Cullen, J.J. and Neale, P.J. 1997. Biological weighting functions for describing the
effects of ultraviolet radiation on aquatic systems. In: Häder, D.-P. (Ed.) The
effects of ozone depletion on aquatic ecosystems. R.G. Landes Company, 97-
118.
Dunne, R.P. 1999. Polysulphone film as an underwater dosimeter for solar
ultraviolet-B radiation in tropical latitudes. Mar Ecol Prog Ser, 189: 53-63.

66
Fischer, J.M., Fields, P.A., Pryzbylkowski, P.G., Nicolai, J.L. and Neale, P.J. 2006.
Sublethal exposure to UV radiation affects respiration rates of the freshwater
cladoceran Daphnia Catawba. Photochemistry and Photobiology, 82: 547-
550.
Grad, G., Williamson, C.E. and Karapelou, D.M. 2001. Zooplankton survival and
reproduction responses to damaging ultraviolet radiation: A test of reciprocity
and photoenzymatic repair. Limnol Oceanogr, 46: 584-591.
Grove, M. and Breitburg, D.L. 2005. Growth and reproduction of gelatinous
zooplankton exposed to low dissolved oxygen. Mar Ecol Prog Ser, 301: 185-
198.
Häder, D.-P., Kumar, H.D., Smith, R.C. and Worrest, R.C. 2007. Effects of solar
UV radiation on aquatic ecosystems and interactions with climate change.
Photochemical and Photobiological Sciences, 6: 267-285.
Ivanov, V.P, Kamakin, A.M., Ushivtzev, V.B., Shiganova, T., Zhukova, O., Aladin,
N., Wilson, S.I., Harbison, G.R. and Dumont, H.J. 2000. Invasion of the
Caspian Sea by the comb jellyfish Mnemiopsis leidyi (Ctenophora).
Biological Invasions, 2: 255-258.
Johnsen, S. and Widder, E.A. 2001. Ultraviolet absorption in transparent
zooplankton and its implications for depth distribution and visual predation.
Mar Biol, 138: 717-730.
Karanas, J.J., Worrest, R.C. and Van Dyke, H. 1981. Impact of UV-B radiation on
the fecundity of the copepod Acartia clausii. Mar Biol, 65: 125-133.
Karentz, D., McEuen, F.S., Land, M.C. and Dunlap, W.C. 1991. Survey of
mycosporine-like amino acid compounds in Antarctic marine organisms:
potential protection from ultraviolet exposure. Mar Biol, 108: 157-166.
Kouwenberg, J.H.M., Browman, H.I., Cullen, J.J., Davis, R.F., St-Pierre, J.-F. and
Runge, J.A. 1999. Biological weighting of ultraviolet (280-400 nm) induced
mortality in marine zooplankton and fish. I. Atlantic cod (Gadus morhua)
eggs. Mar Biol, 134: 269-284.
Kremer, P. 1976. Population dynamics and ecological energetic of a pulsed
zooplankton predator, the ctenophore Mnemiopsis leidyi. In: Wiley, M.L.
(ed.) Estuarine Processes, Academic Press, New York, 1:197-215.
Kremer, P. 1994. Patterns of abundance for Mnemiopsis in U.S. coastal waters: a
comparative overview. ICES J Mar Sci, 51:347-354.
Leech, D.M. and Johnsen, S. 2003. Behavioral responses – UVR avoidance and
vision. In: Helbling, E.W and Zagarese, H. (eds.) UV Effects in Aquatic
Organisms and Ecosystems, The Royal Society of Chemistry, Cambridge,
455-481.
Leech, D.M., Williamson, C.E., Moeller, R.E. and Hargreaves, B.R. 2005. Effects of
ultraviolet radiation on the seasonal vertical distribution of zooplankton: a
database analysis. Arch Hydrobiol, 162: 445-464.
Lesser, M.P., Barry, T.M., Lamare, M.D. and Barker, M.F. 2006. Biological
weighting functions for DNA damage in sea urchin embryos exposed to
ultraviolet radiation. J Exp Mar Biol Ecol, 328: 10-21.

67
Molot, L.A., Keller, W., Leavitt, P.R., Robarts, R.D., Waiser, M.J., Arts, M.T., Clair,
T.A., Pienitz, R., Yan, N.D., McNicol, D.K., Prairie, Y.T., Dillon, P.J.,
Macrae, M., Bello, R., Nordin, R.N., Curtis, P.J., Smol, J.P. and Douglas,
M.S.V. 2004. Risk analysis of dissolved organic matter-mediated ultraviolet
B exposure in Canadian inland waters. Can J Fish Aquat Sci, 61: 2511-2521.
Mostajir, B., Demers, S., de Mora, S., Belzile, C., Chanut, J., Gosselin, M., Roy, S.,
Zulema Villegas, P., Fauchot, J. and Bouchard, J. 1999. Experimental test of
the effect of ultraviolet-B radiation in a planktonic community. Limnol
Oceanogr, 44(3): 586-596.
Neale, P.J. 2000. Spectral weighting functions for quantifying the effects of UV
radiation in marine ecosystems. In: de Mora, S. J., Demers, S. & Vernet, M.
(eds.) The effects of UV radiation in the marine environment, Cambridge
Univ. Press, Cambridge, 72-100.
Neale, P., Goodrich, R. and Brinley, W. 2005. The Smithsonian-NIST-USDA-FPL
Network for Monitoring Solar Ultraviolet Irradiance: Comparison of
Radiometer Measurements and Radiative Transfer Model Calculations. In:
Martin, J. W., Ryntz, R. A. & Dickie, R. A. (eds.) Service Life Prediction:
Challenging the Status Quo. Federation of Societies for Coatings Technology,
Blue Bell, PA, pp. 159-70.
Nelson, T.C. 1925. On the occurrence and food habits of ctenophores in New Jersey
inland coastal waters. Biol Bull (Woods Hole), 48:92-111.
Nemazie, D.A., Purcell, J.E. and Gilbert, P.M. 1993. Ammonium excretion by
gelatinous zooplankton and their contributions to the ammonium requirements
of microzooplankton in Chesapeake Bay. Mar Biol, 116: 451-458.
Palen, W. J., Williamson, C. E., Clauser, A. A. and Schindler, D. E. 2005. Impact of
UV-B exposure on amphibian embryos: linking species physiology and
oviposition behavior. Proc R Soc Lond B, 272: 1227-1234.
Purcell, J.E. and Cowan Jr., J.H. 1995. Predation by the scyphomedusan Chrysaora
quinquecirrha on Mnemiopsis leidyi ctenophores. Mar Ecol Prog Ser, 129:
63-70.
Purcell, J.E., Cresswell, F.P., Cargo, D.G. and Kennedy, V.S. 1991. Differential
ingestion and digestion by the scyphozoan Chrysaora quinquecirrha and the
ctenophore Mnemiopsis leidyi. Biol Bull (Woods Hole), 180: 103-111.
Purcell, J.E., Shiganova, T.A., Decker, M.B. and Houde, E.D. 2001. The ctenophore
Mnemiopsis leidyi in native and exotic habitats: U.S. estuaries versus the
Black Sea basin. Hydrobiologia (Dev Hydrobiol 155), 451: 145-176.
Reeve, M.R., Syms, M.A. and Kremer, P. 1989. Growth dynamics of a ctenophore
(Mnemiopsis) in relation to variable food supply. I. Carbon biomass, feeding,
egg production, growth and assimilation efficiency. J Plankton Res, 11: 535-
552.
Speakman, J. 1997. Factors influence the daily energy expenditure of small
mammals. Proceedings of the Nutrition Society, 56: 1119-1136.
Sullivan, B.K. Van Keuren, D. and Clancy, M. 2001. Timing and size of blooms of
the ctenophore Mnemiopsis leidyi in relation to temperature in Narragansett
Bay, RI. Hydrobiologia (Dev Hydrobiol 155), 451: 113-120.

68
Tartarotti, B., Cravero, W. and Zagarese, H.E. 2000. Biological weighting function
for the mortality of Boeckella gracilipes (Copepods, Crustacea) derived from
experiments with natural solar radiation. Photochemistry and Photobiology,
72: 314-319.
Tedetti, M. and Sempéré, R. 2006. Penetration of Ultraviolet Radiation in the
Marine Environment. A Review. Photochemistry and Photobiology, 82: 389-
397.
Vincent, W. F. and Neale, P. J. 2000. Mechanisms of UV damage in aquatic
organisms. In: de Mora, S. J., Demers, S. & Vernet, M. (eds.) The effects of
UV radiation on marine ecosystems, Cambridge Univ. Press, Cambridge, 149-
176.
Whitehead, R.F., de Mora, S.J. and Demers, S. 2000. Enhanced UV radiation – a
new problem for the marine environment. In: de Mora, S. J., Demers, S. &
Vernet, M. (eds.) The effects of UV radiation on marine
ecosystems, Cambridge Univ. Press, Cambridge, 1-34.
Williamson, C.E., Metgar, S.L., Lovera, P.A. and Moeller, R.E. 1997. Solar
ultraviolet radiation and the spawning habitat of yellow perch, Perca
flavescens. Ecological Applications, 7: 1017-1023.
Williamson, C. E., Neale, P. J., Grad, G., De Lange, H. J. and Hargreaves, B. R.
2001. Beneficial and detrimental effects of UV on aquatic organisms:
Implications of spectral variation. Ecological Applications, 11: 1843-1857.
Williamson, C.E., Zagarese, H.E., Schulze, P.C., Hargreaves, B.R. and Seva, J. 1994.
The impact of short-term exposure to UV-B radiation on zooplankton
communities in north temperate lakes. J Plankton Res, 16: 205-218.
Zagarese, H. E. and Williamson, C.E. 2001. The implications of solar ultraviolet
radiation exposure for fish and fisheries. Fish and Fisheries, 2: 250-260.