abstract title: evaluating the impact of a wetland plant
TRANSCRIPT

ABSTRACT
Title: EVALUATING THE IMPACT OF A
WETLAND PLANT AND RHIZOSPHERE
MICROORGANISMS ON THE FATE OF A
MODEL CHLORINATED SOLVENT IN A
WETLAND PLANT BIOREACTOR
Ilisa Tawney, Master of Science, 2005
Directed By: Assistant Professor Jennifer G. Becker
Department of Biological Resources Engineering
The ability of wetland plants to impact the removal of cis-1,2-dichloroethene (DCE),
an intermediate formed during reductive dehalogenation of tetrachloroethene (PCE)
and trichloroethene (TCE), either via phytoremediation or rhizosphere oxidation,
which enhances aerobic microbial activity, was investigated. To accomplish this
goal, a bench-scale bioreactor system was designed to model wetland conditions and
evaluate DCE biodegradation. The bioreactor was operated as a continuous-flow,
completely-mixed biofilm reactor containing a single Phragmites australis individual
and root associated microorganisms. Significant removal of DCE in the bioreactor
was observed. To elucidate the removal mechanisms, the fate of 14[C]-DCE was
determined. The predominant removal mechanism was microbially-mediated
oxidation, presumably facilitated by plant-supplied oxygen and growth substrates,
followed by phytovolatilization, and incorporation into, and/or sorption to, plant and
microbial biomass. Based on these results, wetland plants and their associated
microorganisms are expected to contribute to DCE removal in the rhizosphere.

EVALUATING THE IMPACT OF A WETLAND PLANT AND RHIZOSPHERE
MICROORGANISMS ON THE FATE OF A MODEL CHLORINATED SOLVENT
IN A WETLAND PLANT BIOREACTOR.
By
Ilisa Tawney
Thesis submitted to the Faculty of the Graduate School of the
University of Maryland, College Park, in partial fulfillment
of the requirements for the degree of
Master of Science
2005
Advisory Committee:
Assistant Professor Dr. Jennifer G. Becker, Chair
Associate Professor Dr. Andrew Baldwin
Associate Professor Dr. Eric Seagren

© Copyright by
Ilisa Tawney
2005

ii
Acknowledgements
Foremost I must acknowledge the efforts of my advisor Dr. Jennifer Becker. She
provided continued support, encouragement, and guidance throughout the project.
Extended thanks go to my committee members. Dr. Andrew Baldwin provided
expertise in the plant field and greatly assisted in the ultimate plant selection for this
research. Dr. Eric Seagren proved to be a valuable resource for all things related to
reactor design and operation.
Others in the department were invaluable in this research, particularly those in the
Project Development Center, especially Gary Seibel. Gary contributed significantly
to the final bioreactor design and was able to execute my vague descriptions of my
needs into a perfect product. The graduate students of this department made being
here enjoyable, particularly my lab mates Emily Devillier, Deyang Huang and from
afar Preston Postl.
I am grateful to the Maryland Agricultural Experiment Station at the University of
Maryland for providing the initial funding for this project and to the American Water
Works Association for a Larson Aquatic Research Scholarship (LARS). I also extend
my gratitude to the Biological Resources Engineering Department for assistance and
financial support during my graduate research.
Finally I must give my deepest appreciation to my husband, Tim, who provided
support and encouragement and kept me going.

iii
Table of Contents
Acknowledgements .......................................................................................................ii
List of Tables................................................................................................................. v
List of Figures ..............................................................................................................vi
Chapter 1: Introduction ................................................................................................. 1
Chapter 2: Literature Review ........................................................................................ 4
Plant Response to Wetland Conditions ..................................................................... 4
Phytoremediation of Chlorinated Compounds.......................................................... 7
Microbial Biodegradation of Chlorinated Solvents .................................................. 9
Anaerobic Reductive Dehalogenation................................................................. 10
Aerobic Cometabolism........................................................................................ 11
Aerobic Metabolism............................................................................................ 15
Coupling Anaerobic and Aerobic Metabolism.................................................... 17
Bioremediation in Wetland Environments.............................................................. 19
Chapter 3: Hypothesis ................................................................................................. 23
Chapter 4: Goals and Objectives................................................................................. 24
Chapter 5: Experimental Approach............................................................................. 25
Conceptual Model of PCE Degradation in Wetland Soil and Plant Rhizosphere... 25
Development of Prototype Bioreactor and Characterization of [14C] DCE fate ..... 26
Chapter 6: Material and Methods................................................................................ 28
Bacterial Culture Maintenance................................................................................ 28
Evaluation of Biofilm Formation ............................................................................ 30
Bacterial Protein Analysis....................................................................................... 30
Bacterial Plate Counts ............................................................................................. 31
Plant Growth ........................................................................................................... 31
Design and Construction of Prototype Bioreactor .................................................. 33
Bioreactor Experimental Procedure ........................................................................ 41
Preparation of 14[C]-DCE solution.......................................................................... 44
Analytical Methods ................................................................................................. 45
Analysis of Volatile Organics ............................................................................. 45
Tracer Study Analysis ......................................................................................... 46
Quantification of Plant Exudates......................................................................... 46
Dissolved Oxygen Measurement ........................................................................ 47
Analysis of 14C-labeled fractions ........................................................................ 47
Biofilm Characterization ......................................................................................... 53
Chapter 7: Results and Discussion .............................................................................. 55
Bacterial Selection................................................................................................... 55
Plant Selection......................................................................................................... 58
Plant Treatment ....................................................................................................... 60
Bioreactor Operation ............................................................................................... 61
Tracer Study ............................................................................................................ 61
Root and JS666 Experiment.................................................................................... 63
Abiotic Control Experiment .................................................................................... 68

iv
JS666 Only Experiment .......................................................................................... 70
Plant and Associated Microorganisms Experiment (Trial 1) .................................. 75
Plant and Associated Microorganisms Experiment (Trial 2) .................................. 96
Chapter 8: Conclusion............................................................................................... 110

v
List of Tables
Table 7-1: Phases of operation incorporated with the root-JS666 experiment
Table 7-2: Operating parameters of the continuous-flow, completely-mixed
bioreactor.
Table 7-3: Phases of operation incorporated in the abiotic control experiment.
Table 7-4: Phases of operation incorporated into the JS666-only experiment.
Table 7-5: Phases of operation incorporated into the plant experiment (Trial 1).
Table 7-6: Steady-state distribution of 14C activity within each fraction analyzed in a
continuous-flow, completely-mixed bioreactor containing a P. australis individual
and associated microorganisms supplied with14[C]-DCE-amended anoxic media
(Trial 1).
Table 7-7: Activity of 14C associated with the attached biomass and biofilm thickness
and density as a function of depth in the rhizosphere chamber in a continuous-flow,
completely-mixed bioreactor containing a P. australis individual and associated
microorganisms supplied with14[C]-DCE-amended anoxic media (Trial 1).
Table 7-8: Activity of 14C associated with the P. australis and associated root
microorganisms as a function of section in a bioreactor containing a P. australis
individual and associated microorganisms supplied with14[C]-DCE-amended anoxic
media (Trial 1).
Table 7-9: Phases of operation incorporated into the plant experiment (Trial 2).
Table 7-10: Distribution of 14C activity within each fraction analyzed in a
continuous-flow, completely-mixed bioreactor containing a P. australis individual
and associated microorganisms supplied with14[C]-DCE-amended anoxic media
(Trial 2).
Table 7-11: Activity of 14C associated with the attached biomass and biofilm
thickness and density as a function of depth in the rhizosphere chamber in a
continuous-flow, completely-mixed bioreactor containing a P. australis individual
and associated microorganisms supplied with14[C]-DCE-amended anoxic media
(Trial 2).
Table 7-12: Activity of 14C associated with the P. australis and associated root
microorganisms as a function of section in a bioreactor containing a P. australis
individual and associated microorganisms supplied with14[C]-DCE-amended anoxic
media (Trial 2).

vi
List of Figures
Figure 1-1: Reductive dehalogenation pathway of PCE to ethene (adapted from
Freedman and Gossett, 1989).
Figure 1-2: MMO metabolism of methane including regeneration of reducing
equivalents and production of carbon dioxide.
Figure 1-3: Cometabolic transformation of DCE with methane as the primary growth
substrate.
Figure 1-4: Aerobic metabolism of DCE to form biomass and CO2.
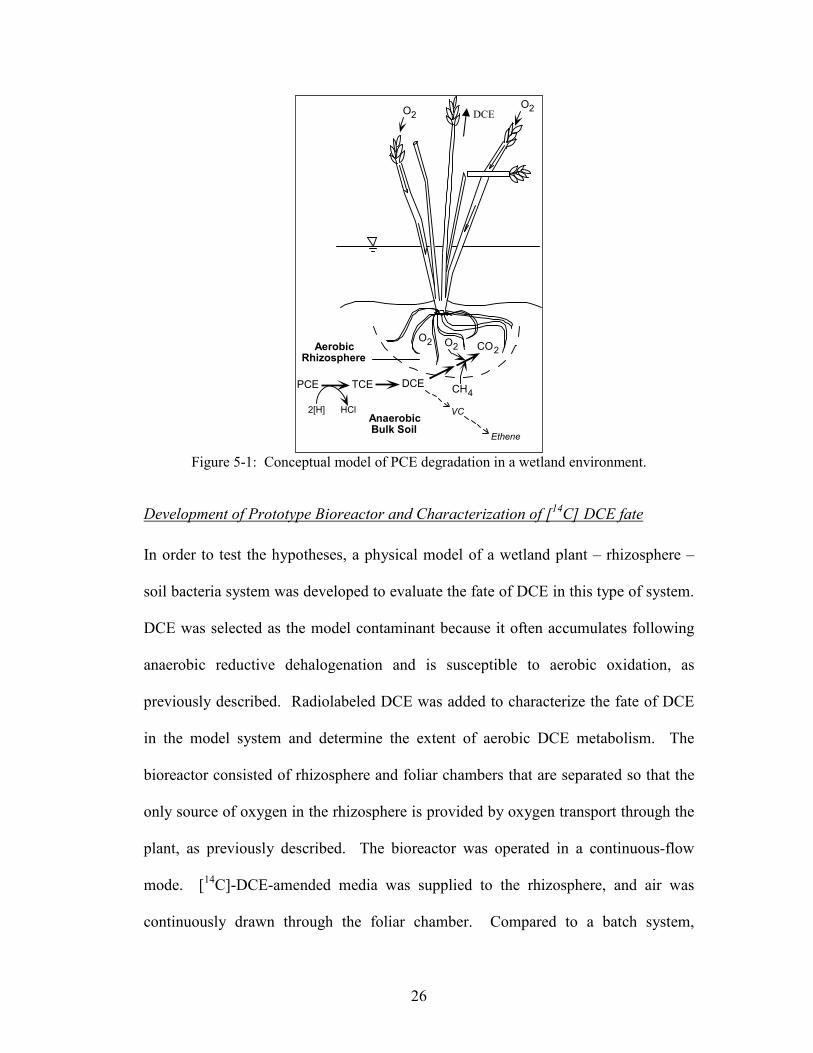
Figure 5-1: Conceptual model of PCE degradation in a wetland environment.
Figure 6-1: Overall design of the continuous-flow, completely-mixed bioreactor.
Figure 6-2: Schematic of rhizosphere chamber detailing parameters used in the
completely-mixed biofilm reactor mass balance equation (parameters defined in text).
Figure 6-3: Sample fractions to be analyzed for [14C].
Figure 7-1: Biofilm testing results for Bottles 1 and 3. Concentrations of DCE added
on days 15, 29, 49, 70, 78, 84, 91, 98, and 105 were estimated. All other
concentrations were measured.
Figure 7-2: Biofilm testing results for Bottle 2. Concentrations of DCE added on
days 21, 28, 35, 56, and 91 were estimated. All other concentrations were measured.
Figure 7-3: Experimental results of the tracer study conducted on the rhizosphere
chamber compared to the predicted model for a completely-mixed bioreactor.
Figure 7-4: Influent and effluent DCE concentrations and DCE removal in a
bioreactor without any biological components supplied with DCE-amended aerated
media.
Figure 7-5: Influent and effluent DCE concentrations and DCE removal in a
continuous-flow, completely-mixed biofilm reactor containing JS666 only.
Figure 7-6: Influent and effluent oxygen concentrations and net change in oxygen in
a continuous-flow, completely-mixed bioreactor containing a P. australis individual
and associated native microorganisms and fed DCE-free anoxic media (Trial 1).

vii
Figure 7-7: Influent and effluent COD concentrations in a continuous-flow,
completely-mixed bioreactor containing P. australis plant and native microorganisms
in a bioreactor supplied with both DCE-free aerated and anoxic media (Trial 1).
Figure 7-8: Influent and effluent DCE concentrations and DCE removal in a
continuous-flow, completely-mixed bioreactor containing a P. australis individual
and associated microorganisms supplied with DCE (unlabeled)-amended anoxic
media (Trial 1).
Figure 7-9: Influent 14[C]-DCE and
14C activity associated with volatile, CO2,
biomass, and non-volatile residue fractions in the effluent and 14C-DCE removal, in a
continuous-flow, completely-mixed bioreactor containing a P. australis individual
and associated microorganisms supplied with14[C]-DCE-amended anoxic media
(Trial 1).
Figure 7-10: 14C activity associated with the two CO2 traps used to collect
14CO2
from the gas phase of a continuous-flow, completely-mixed bioreactor containing a P.
australis individual and associated microorganisms supplied with14[C]-DCE-amended
anoxic media (Trial 1).
Figure 7-11: Influent and effluent oxygen concentrations and net change in oxygen in
a continuous-flow, completely-mixed bioreactor containing a P. australis individual
and associated native microorganisms and fed DCE-amended anoxic media (Trial 2).
Figure 7-12: Influent and effluent DCE concentrations and DCE removal in a
continuous-flow, completely-mixed bioreactor containing a P. australis individual
and associated microorganisms supplied with DCE (unlabeled)-amended anoxic
media (Trial 2).
Figure 7-13: Influent 14[C]-DCE and
14C activity associated with volatile, CO2,
biomass, and non-volatile residue fractions in the effluent and 14C-DCE removal, in a
continuous-flow, completely-mixed bioreactor containing a P. australis individual
and associated microorganisms supplied with14[C]-DCE-amended anoxic media
(Trial 2).
Figure 8-1: Potential uptake and transformation pathways of DCE in a plant-
rhizosphere microorganism bioremediation system. The size of the outflow arrows
reflects the likely relative extent of DCE transformation among the possible removal
processes.

1
Chapter 1: Introduction
The chlorinated solvents tetrachloroethene (PCE) and trichloroethene (TCE) are
commonly found groundwater contaminants. Past studies have provided evidence
that the sequential dechlorination of PCE and TCE by anaerobic bacteria to ethene, a
non-toxic product, is possible (Freedman and Gossett, 1989). However, with each
successive dehalogenation, the compounds become less susceptible to reductive
dehalogenation due, in part, to kinetic and thermodynamic limitations (Lee et al.,
1998). Thus, in practice, intermediates in the anaerobic pathway such as cis-1,2-
dichloroethene (DCE) and vinyl chloride (VC) often accumulate at sites that are
remediating PCE and/or TCE contamination through anaerobic natural attenuation or
engineered bioremediation approaches. The accumulation of these intermediates is
undesirable because DCE and VC are also considered environmental toxins. Under
aerobic conditions, an alternative route for complete detoxification of PCE and TCE
is possible. Specifically, the chlorinated ethenes with three or fewer chlorine atoms
can be mineralized to CO2 through cometabolic or, in the case of DCE and VC,
metabolic reactions (Coleman et al., 2002). Thus, if both anaerobic reductive
dehalogenation and aerobic oxidation could be coupled, it should be possible to
completely biodegrade PCE to CO2.
One environment in which anaerobic and aerobic conditions exist in close proximity
is in the wetland rhizosphere, the soil that immediately surrounds the plants’ roots and
interacts with the plant. Specifically, wetland plants have developed adaptations in
response to the anaerobic flooded soils in which they grow. These adaptations

2
include a porous internal structure that acts as a highly efficient diffusion path to
transport oxygen from the atmosphere to the root zone. In the process of oxygen
being transported through the roots, some oxygen can diffuse into the rhizosphere.
Groundwater that discharges to wetland systems is frequently contaminated with
chlorinated solvents because hazardous waste sites are often in close proximity to
surface waters (Lorah and Olsen, 1999). In these situations, the groundwater passes
sequentially through anaerobic and aerobic zones in the bulk wetland and rhizosphere
soils, respectively. Under these conditions, the potential for complete mineralization
of the chlorinated solvents via coupled anaerobic and aerobic biological processes
exists.
In addition to microbially-mediated removal of chlorinated compounds in wetlands,
phytoremediation of these compounds can occur via several mechanisms including
phytovolatilization, transformation and/or incorporation into biomass. However,
there are few studies examining phytoremediation with wetland plants, particularly
herbaceous species. Thus, the potential impact of wetland plants on the fate of
chlorinated compounds is unknown.
The goal of this study was to evaluate the impacts of wetland plants on the fate of
chlorinated solvents in contaminated groundwater. Specifically, the ability of plants
to affect contaminant levels directly through phytoremediation and indirectly through
rhizosphere oxidation, which could enhance microbial biodegradation of

3
contaminants, were considered. To accomplish this goal, a bench-scale bioreactor
system was designed to model wetland conditions and evaluate the biodegradation of
a model contaminant, DCE. This information is needed to improve our ability to
predict the behavior of these compounds in wetland sites undergoing natural
attenuation and to design more effective constructed wetlands for use with flows
containing chlorinated solvents.

4
Chapter 2: Literature Review
Wetlands and constructed wetlands have not been studied at length for their ability to
degrade anthropogenic compounds. However, constructed wetlands have been used
extensively in the past to treat nutrient and particulate waste streams, such as sanitary
waste, agricultural run off, and flows containing heavy metals, including acid mine
drainage (Kadlec and Knight, 1996). It is believed that the same processes used to
treat these waste streams may have application to the removal of anthropogenic
compounds from waste streams. However, a better understanding of microbial
degradation processes in wetlands and the influence of plants on these processes is
needed before the full treatment potential of wetlands can be realized. In this
literature review, a description of known plant and microbially-mediated processes
for removal of a model compound, DCE, is provided along with key plant
characteristics that could affect these processes.
Plant Response to Wetland Conditions
Wetland environments are ecotones between upland and aquatic systems. Wetlands
characteristically contain saturated soils that are rich in organic matter. Metabolism
of the organic matter by soil bacteria quickly depletes oxygen in the pore-water
(Mitsch and Gosselink, 2000). Oxygen diffusion in water is 10,000 times slower than
in air (Drew, 1997); therefore, when the demand for oxygen exceeds the supply,
dissolved oxygen is depleted (Mitsch and Gosselink, 2000), giving rise to hypoxic or
anoxic conditions in saturated wetland soils.
5
Anaerobic conditions are undesirable for plants for two reasons, as described by
Armstrong (1979): (1) oxygen is required for cell maintenance and growth, especially
at the root tip; and (2) soil phytotoxins have a greater accessibility to the plant in
anaerobic conditions. As previously mentioned, introduction of oxygen to the
rhizosphere via diffusion through flooded soil pores is limited; therefore, plants have
developed adaptations that allow them to survive in anaerobic soil. The basis of most
of these adaptations is the internal diffusion of oxygen within plants to provide cells
with the required amounts of oxygen. Wetland plants have a variety of mechanisms
to increase the efficiency of internal oxygen diffusion in response to oxygen
deficiencies associated with flooding. Among others, these mechanisms include
development of intracellular gas-filled spaces or aerenchyma; development of a
barrier to radial oxygen loss (ROL); and changes in root physiology, including root
thickness, length of roots and arrangement of roots. The first two adaptations are
relevant to this research and are discussed further below.
It is generally accepted that aerenchyma act as a preferential diffusion path for
oxygen from shoot to root because they increase porosity and decrease tortuosity
within the root. As summarized by Armstrong (1979), previous studies have
demonstrated the continuity of the gas space between the shoot and root, and the
dependence of the root on the oxygen transfer from the shoot. Aerenchyma formation
in certain species may explain why those species fare well in wet soil (Kawase and
Whitmoyer 1980). A study by Justin and Armstrong (1987) provided evidence that
wetland plants are more prone to having porous structures and the ability to aerate

6
their roots with atmospheric oxygen. Depending on the species, aerenchyma are
either inducible by flooding, as in maize, or formed constitutively without external
stimuli, as in rice. However, even in the latter, the overall porosity can be increased
above constitutive levels by external stimuli, e.g., flooding (Drew, 1997).
Oxygen transported through aerenchyma can ultimately diffuse radially through, and
out of, the root into the rhizosphere, thereby aerating this zone. This phenomenon is
known as ROL. Evidence of ROL includes the presence of a thick layer of hydrated
ferric oxide, formed by the reaction of reduced iron with oxygen, around the roots of
plants growing in reduced soils (Armstrong and Boatman, 1967). ROL can provide
several benefits to the plant including protection against phytotoxins that are present
in anaerobic soils. Released oxygen oxygenates the rhizosphere and, in turn,
phytotoxins, thereby reducing their toxicity while still allowing for uptake of water
and nutrients (Armstrong, 1979).
In some cases, a barrier to ROL can prevent oxygen loss; however, not all plants
develop an ROL barrier. As summarized by Colmer (2003) it has been suggested that
whether or not a plant develops an ROL barrier depends on the effectiveness of
longitudinal diffusion and soil redox potential. As the volume of aerenchyma and/or
root diameters become larger, there is less need to prevent ROL. Therefore, a plant
may develop aerenchyma in response to flooding, but not an ROL barrier, if the
aerenchyma provide enough oxygen to the tip even with ROL.

7
Anatomical and morphological changes, such as the formation of aerenchyma and
ROL, are important adaptive mechanisms that plants have developed to overcome
oxygen deficiency in the soil. However, the extent to which aerenchyma, ROL, and
other physiological changes develop varies with plant species. Therefore, the amount
of rhizosphere aeration that occurs as a result of these adaptations is species-specific.
Ultimately, these adaptations to flooded soils allow wetland plants, in particular, to
provide oxygen to their roots and subsequently release oxygen to the rhizosphere to
create an aerobic zone within the bulk anaerobic wetland soil.
Phytoremediation of Chlorinated Compounds
The role of non-wetland plant species, predominately hybrid poplars, in the removal
of chlorinated compounds, particularly TCE, has been investigated in past studies.
Evidence exists for various fates of TCE within plants, including phytovolatilization,
transformation, and incorporation into biomass. Phytovolatilization occurs when the
contaminant is taken up by the root system, diffuses upward through the plant and is
released through the aerial portions of the plants (leaves and stem). Several lab-based
studies have demonstrated that TCE can be released into the atmosphere via
phytovolatilization. Although there has been some variability in the extent of
phytovolatilization observed in different studies, phytovolatilization appears to be the
major removal mechanism in many studies (Burken and Schnoor, 1998; Schnabel et
al., 1997). A study by Ma and Burken (2003) used a laboratory reactor system
designed specifically to test for phytovolatilization and demonstrated that TCE was
taken up by poplars and volatilized to the atmosphere. Most studies have been
conducted on hybrid poplars (e.g. Burken and Schnoor, 1998), but there have also

8
been studies demonstrating TCE phytovolatilization using other types of plants,
including edible garden plants (Schnabel et al., 1997) and grasses (Anderson and
Walton, 1995).
Phytovolatilization does not transform the contaminant to a non-toxic product;
however, there is evidence that some plants can metabolize TCE to compounds that
are either released or incorporated into plant biomass. For example, Gordon et al.
(1998) detected the TCE oxidative metabolites trichloroethanol (TCOH),
trichloroacetic acid (TCAA), and dichloroacetic acid, and the mineralization product
CO2 in tests with poplar cuttings that were supplied with TCE. Testing conducted by
Shang et al. (2001) on the fate of TCOH in tobacco plants, revealed a reduction of
TCOH in the plant tissue of plants suspended in liquid media containing TCE,
indicating further metabolism of TCOH. The authors proposed a pathway in which
TCOH would be further metabolized to become incorporated into plant biomass.
This pathway included TCOH glycosylation to trichloroethanol glucoside.
Trichloroethanol glucoside was detected during the study, but did not persist in the
plant tissue once TCE exposure was discontinued, indicating that this compound was
metabolized further. The oxidative enzyme cytochrome P450 has been detected in
some plants species, but was not detectable in hybrid poplars, although there was
transformation of TCE to TCAA indicating that oxidation was occurring (Dietz,
2000). The presence of cytochrome P450 is of significance because it is the primary
enzyme involved in TCE oxidative metabolism in mammals, which results in the
products described above (e.g. TCOH and TCAA).

9
The studies discussed above all focused on TCE removal. However, in wetland
systems it is expected that TCE will be transformed via microbially-mediated
anaerobic reductive dehalogenation in the bulk soil to less chlorinated products, e.g.
DCE. Therefore, understanding the fate of these less-chlorinated products is also of
great interest. Vroblesky et al. (1999) observed uptake of DCE by several floodplain
and wetland tree species in the field, but apparently no studies have been conducted
with DCE and herbaceous wetland species. Burken (1996) proposed a relationship
between contaminant log Kow values and the percent of contaminant volatilized
following uptake by hybrid poplars, based on studies conducted with several volatile
compounds including BTEX and TCE:
57.1)(354.0% +−= owLogKdVolatilize (1)
Kow is the octanol-water partitioning coefficient, which is the ratio of the equilibrium
concentrations of a compound between octanol and water and indicates the potential
for portioning into soil organic matter. DCE has a log Kow value of 1.86 (EPA,
2005). According to Eq. (1), phytovolatilization of 91% of DCE by hybrid poplars
would be expected under the test conditions used by Burken. These results indicate
that uptake of DCE by hybrid poplars is likely to occur, but tests have not specifically
examined the effects of herbaceous wetland plants on the fate of DCE.
Microbial Biodegradation of Chlorinated Solvents
Under both anaerobic and aerobic conditions, microbially-mediated processes can act
to transform anthropogenic compounds in the environment. Some of the most
important reactions involved in the biotransformation of chlorinated solvents, and
their relevance to this research, are reviewed below.

10
Anaerobic Reductive Dehalogenation
Reductive dehalogenation involves the addition of two electrons to a molecule and
the simultaneous removal of the halogen. When compounds like PCE and TCE
undergo reductive dehalogenation, the halogen is replaced with a hydrogen atom in a
reaction known as hydrogenolysis. Because it requires an input of reducing
equivalents, reductive dehalogenation predominately occurs under anaerobic
conditions and requires a suitable electron donor, such as H2. Sequential reductive
dehalogenations of PCE can theoretically result in complete dehalogenation (and
detoxification) of the parent compound. Specifically, in the case of PCE, the
sequential removal of chlorine atoms can result in the production of TCE, DCE
(predominantly the cis-1,2 DCE isomer), VC, and, ultimately, ethene (Freedman and
Gossett, 1989) (Figure 1-1).
The complete dechlorination of PCE to ethene is desirable because ethene is non-
toxic; however, conversion of PCE to ethene is often not achieved in the field (Yang
and McCarty, 1998; Lee et al., 1998). As chlorine atoms are removed, the compound
becomes less susceptible to reductive dehalogenation due, in part, to kinetic and
thermodynamic limitations. Thus, under anaerobic conditions, PCE is often rapidly
Figure 1-1: Reductive dehalogenation pathway of PCE to ethene (adapted from
Freedman and Gossett, 1989)
VC PCE 1,2-
DCEs
TCE
2[H] HCl 2[H] HCl 2[H] HCl 2[H] HCl
Ethene

11
degraded, whereas less chlorinated species (e.g. DCE) are longer-lived (Lee et al.,
1998) indicating that the subsequent reduction of the lightly chlorinated compounds is
slower than the reduction of the highly chlorinated compounds. Thermodynamic
limitations relate to the redox potentials of the reductive dechlorination reactions. For
example, the potentials of the redox couples PCE/TCE, TCE/DCE, DCE/VC, and
VC/ethene are 0.58, 0.54, 0.36, and 0.49 V, respectively (Vogel et al., 1987).
Because of their higher redox potentials, PCE and TCE are somewhat more
susceptible to reduction than DCE and VC, which contributes to the frequent
accumulation of DCE and VC under anaerobic conditions (Wiedemeier et al., 1999).
The accumulation of DCE and VC is undesirable because, similar to the parent
compounds, they are considered environmental toxins. In particular, VC is a known
carcinogen. One approach to overcoming incomplete reductive dehalogenation is to
provide excess electron donor. However, this incurs additional expense, and
competition for electron donors between dehalogenating and other organisms and
other factors may limit the success of this approach (Yang and McCarty, 1998).
Therefore, although the complete detoxification of PCE under anaerobic conditions
has been observed, the accumulation of less chlorinated ethenes in practice limits the
usefulness of reductive dehalogenation as a stand-alone biodegradation process.
Aerobic Cometabolism
As summarized by Rittmann and McCarty (2001), aerobic oxidation of PCE, which is
completely oxidized, is not known to occur and is thermodynamically unfavorable,
whereas aerobic oxidation of the less chlorinated ethenes, TCE, DCE, and VC, is
known to occur. Oxidation of chlorinated ethenes such as DCE and VC by molecular

12
oxygen can result in their mineralization to CO2. Aerobic oxidation of at least some
of the chlorinated ethenes can occur via either cometabolic or metabolic processes
(Lee et al., 1998). Metabolic reactions lead to energy conservation and/or cell
growth, whereas there is no benefit in terms of energy generation or cell synthesis to
cells that mediate cometabolism. Cometabolic reactions involving chlorinated
ethenes are typically mediated by an oxygenase enzyme system (Arp et al., 2001).
A number of different oxygenase systems can act on chlorinated ethenes, in addition
to metabolizing the primary (physiological) growth substrate. These systems include
methane monooxygenase (MMO) of methanotrophs, which are found in wetland
environments (Lorah et al., 1997). Methanotrophs utilize methane as their primary
growth substrate under aerobic conditions. In wetland systems, the methane is
produced by methanogens in the bulk anaerobic wetland soil, and from there, it can
migrate to the aerobic rhizosphere. Methane is metabolized by MMO to methanol in
the presence of oxygen, and subsequent reduction and oxidation reactions regenerate
reducing equivalents (NADH) and CO2 (Figure 1-2).
Figure 1-2: MMO metabolism of methane including regeneration of reducing
equivalents and production of carbon dioxide
Formate
HCOOH
Methane
CH4
Formaldehyde
HCHO
Methanol
CH3OH
O2 NAD+
NADH NAD+ NADH
CO2
NAD+ NADH

13
Chlorinated ethenes can also be cometabolized by MMO to their respective epoxides,
short-lived unstable compounds that undergo abiotic transformations to various
products including aldehydes and acids (Vogel et al., 1987). These products formed
from the epoxide are not funneled into core metabolic pathways of methanotrophs
resulting in a net loss of energy during cometabolism of chlorinated ethenes (van
Hylckama Vlieg et al., 1996). Instead, the products can be metabolized by
heterotrophic bacteria to water and CO2 (Figure 1-3) (Little et al., 1988).
Consequently, methanotrophs deplete their reducing equivalent supplies without
deriving any benefit from the oxidation reaction.
Figure 1-3: Cometabolic transformation of DCE with methane as the primary growth
substrate.
Utilizing methanotrophic bacteria to exploit an MMO system for the transformation
of chlorinated ethenes may be feasible in contaminated environments that contain
methane and oxygen, but there are several aspects of this approach that may limit its
application. Potential drawbacks to cometabolic oxidation of chlorinated ethenes
include:
• Competition of substrates for enzymes – Competition of substrates for
enzymes occurs between the primary growth substrate (e.g., methane in the
case of methanotrophs) and the chlorinated ethenes, resulting in reduced rates
of degradation. For example, the maximum rate of TCE oxidation for most
HCOOH CH4
+
DCE
HCHO
O2 NAD+
NADH NAD+ NADH
CO2
NAD+ NADH
Oxygenase
Enzyme
Abiotic and Heterotrophic Transformation
CH3OH
+
DCE
epoxide

14
organisms is 10 to 100 times less than the oxidation rate of the primary growth
substrate (Arp et al., 2001).
• Toxicity – Based on several studies, as summarized by Arp et al. (2001), toxic
effects on bacteria cometabolizing chlorinated ethenes have been observed.
Observed toxic effects include damage to the oxygenase enzyme system,
resulting in enzyme inactivation, as well as to the whole cell. It is thought that
the oxidation products of chlorinated ethene metabolism, rather than the
parent compound themselves, are primarily responsible for the toxic effects,
but this has not been proven.
• Depletion of reducing equivalents – Metabolism of the primary growth
substrate regenerates NADH for the bacteria, whereas metabolizing the
chlorinated ethenes does not regenerate the reducing equivalents used to
transform the chlorinated ethene to an epoxide (Figure 1-3). As a result, the
rate and extent of cometabolic transformations may decrease as NADH
supplies are depleted (Alvarez-Cohen and Speitel, 2001). The depletion of
reducing equivalents can potentially be overcome by adding an intermediate
that is converted to NADH in a physiological pathway, e.g., formate (Figure
1-3). For example, in a study by Dolan and McCarty (1995), a methanotroph
had a higher capacity for chlorinated ethene degradation in the presence of
formate. However, in practice, continuously resupplying a source of reducing
equivalents may not be practical.

15
Aerobic Metabolism
In some cases, aerobic bacteria are able to utilize chlorinated ethenes as a growth
substrate (carbon source and electron donor) (Lee et al., 1998). Because the
chlorinated solvent is the growth substrate, many of the disadvantages associated with
cometabolism are eliminated with metabolic transformations. However, the
enzymatic machinery involved in the metabolic transformations is probably similar to
that involved in cometabolism. Specifically, an oxygenase enzyme is thought to be
involved in the first transformation of a chlorinated ethene to an epoxide, and the
chlorinated ethenes are ultimately mineralized to CO2, as in cometabolic
transformation (Figure 1-4) (Coleman et al., 2002; Verce et al., 2002). To date, the
substrate range of organisms that are able to grow by aerobic oxidations appears to be
limited to chlorinated ethenes that have one or two chlorine atoms. Several species
have been shown to grow on VC, e.g., Pseudomonas aeruginosa MF1 and
Mycobacterium aurum L1 (Verce et al., 2002). Recently, strain JS666, a member of
the Comamonadaceae family that grows on DCE, was isolated (Coleman et al.,
2002). Five other strains that belong to the Bacillus, Pseudomonas, and
Acinetobacter genera were also identified as being able to grow on DCE (Olaniran et
al., 2004). In most cases, the bacteria are able to cometabolize other chlorinated
solvents, such as TCE, trans-1,2 DCE, VC and/or cis- 1,2 DCE, in the presence of
their chlorinated growth substrate.

16
Figure 1-4: Aerobic metabolism of DCE to form biomass and CO2
It should be noted that little is known about the abundance and significance of aerobic
chlorinated ethene degraders in contaminated environments. Coleman et al. (2002)
speculated that bacteria able to grow on DCE are rare and may only exist in highly
selective environments, because they were only able to isolate two DCE-degraders
out of 18 aerobic enrichments despite extended incubations times and the use of
inocula from chloroethene-contaminated sites. However, there is growing evidence
that aerobic metabolizers are present in various environments. For example, as
mentioned above, Olaniran et al., (2004) isolated five strains capable of utilizing DCE
isomers as growth substrates from sites contaminated with chlorinated ethenes in
Africa. Additionally, other studies have found mixed cultures capable of utilizing
DCE without the presence of another growth substrate (Bradley and Chapelle, 2000;
Davis et al., 2002). In fact, in a study by Klier et al. (1999), removal of all DCE
isomers was observed in mixed cultures from soil that had no previous exposure
history to chlorinated compounds without supplementation of exogenous organic
nutrients. It is not known how many studies have been devoted to trying to isolate
and identify bacteria that can utilize DCE or VC as a growth substrate, but these
recent studies indicate that metabolism by pure or mixed cultures does occur in
various environments. Thus, the small number of aerobic chlorinated ethene isolates
DCE DCE
epoxide
O2 NAD+
NADH
CO2
+
Biomass
NAD+ NADH
Oxygenase
Enzyme

17
may mean that not enough effort has been devoted to looking for these organisms
(using appropriate culturing techniques), or it could be reflective of their
environmental significance. If the latter is true, it could complicate efforts to exploit
these organisms for in-situ bioremediation.
Coupling Anaerobic and Aerobic Metabolism
Coupling anaerobic and aerobic metabolism offers the potential to enhance the
biodegradation rate of organic contaminants with multiple chloro, nitro, or azo groups
(Field et al., 1995). In addition to PCE and TCE, examples of environmental
contaminants that appear to be well-suited to transformation via sequential anaerobic
and aerobic processes include 2,4,6-tricholorophenol, polychlorinated biphenyls, and
nitrobenzene (Field et al., 1995). In the case of chlorinated ethenes, reductive
dehalogenation is necessary and effective for the removal of the more oxidized highly
chlorinated ethenes, while aerobic oxidation can be utilized to effectively metabolize
the less chlorinated ethenes that accumulate from reductive dehalogenation. In fact
the removal of the lightly chlorinated ethenes, DCE and VC, via aerobic oxidation
may sometimes occur at a faster rate compared with biodegradation by anaerobic
reductive dehalogenation. A review by Suarez and Rifai (1999) summarized a
number of studies examining the degradation of chlorinated solvents under both
aerobic and anaerobic conditions. For DCE, the mean first-order removal rates for
studies conducted under both field and laboratory conditions were 0.476 and 0.004
day-1 for aerobic cometabolism and anaerobic reductive dehalogenation, respectively.
The mean first order removal rates for VC were 1.023 and 0.153 day-1 for aerobic
cometabolism and anaerobic reductive dehalogenation, respectively. Therefore,

18
exploiting anaerobic reductive dehalogenation and aerobic cometabolism or
metabolism in sequence, is expected to result in the complete removal of PCE that
occurs more rapidly compared to transformation under entirely anaerobic conditions.
Various studies have been conducted to examine the effectiveness of using sequential
anaerobic and aerobic zones for the biological removal of chlorinated ethenes. A
study by Devlin et al. (2004) investigated the removal of a mixture of chlorinated
compounds, including PCE, from groundwater in an isolated surface section of an
aquifer, consisting of an anaerobic zone followed by an aerobic zone. Two sections
were hydraulically separated from the bulk of the aquifer. In one section, sequential
anaerobic and aerobic conditions were artificially established with reducing agents
and biosparging, respectfully. The second section was not modified in any way so
that removal via natural attenuation could be monitored. The authors concluded that
removal of PCE was significantly better in the sequential treatment section compared
to the natural attenuation section. Very little PCE removal was observed within the
339 day test period under natural attenuation conditions, whereas PCE had a half-life
of 60 days in the sequential treatment system. In the sequential treatment system,
DCE was formed in the anaerobic zone and underwent significant degradation in the
aerobic zone (10-15 day half-life). Kao et al. (2003) observed similar results in a
flow-through system consisting of several columns in series for treatment of PCE in a
90-day study. TCE, DCE and VC accumulated in the anaerobic zone, but their
concentrations were reduced in the aerobic zone. Aerobic degradation was assumed
based on the molar PCE recovery, which decreased in each column and by an overall

19
total of 14%. The results indicated that the initial PCE concentration was not entirely
accounted for in the form of TCE, DCE, VC and/or ethene, and, therefore, some
oxidation must have occurred. These studies demonstrate the potential benefits of
utilizing sequential anaerobic and aerobic zones to increase the extent of chlorinated
ethene transformation compared to completely anaerobic conditions.
Bioremediation in Wetland Environments
The studies described above are examples of systems in which sequential or adjacent
anaerobic and aerobic zones were mechanically or chemically established.
Conversely, in wetland systems, these conditions are naturally established via
biogeochemical activity. Interestingly, wetlands are susceptible to contamination
with chlorinated solvents, because many hazardous waste sites at military
installations and at industrial facilities are located near surface-water bodies where
wetlands are a dominant part of the landscape (Lorah and Olsen, 1999).
The concept of using wetland environments for removal of chlorinated ethenes has
been examined in field- and bench-scale studies. Work by Lorah and Olsen (1999)
examined the natural attenuation of TCE and 1,1,2,2-tetrachloroethane (PCA) in a
contaminant plume discharging from an aerobic aquifer through wetland sediments.
Results from their study provided evidence that both TCE and PCA were completely
mineralized through pathways that included formation of DCE and VC, as a result of
reductive dehalogenation of the parent compounds. In addition to transformation of
DCE and VC via reductive dehalogenation, aerobic biodegradation of these
intermediates at the root interface also appeared to be possible, based on results from

20
a previous study by Lorah et al. (1997). The earlier study demonstrated the removal
of DCE and VC under aerobic conditions using wetland soil in batch microcosms.
The authors observed that the rate constants for methanotroph aerobic biodegradation
of cis-DCE, trans-DCE, and VC (0.05 – 0.09, 0.09 – 0.13, and 0.19 – 0.21 day-1,
respectively) were as high as TCE and PCA degradation under anaerobic conditions
(0.045 – 0.131, and 0.25 day-1, respectively), leading the authors to conclude that the
production of DCE and VC by the anaerobic biodegradation of TCE and PCA could
be balanced by their aerobic biodegradation in locations where oxygen is available,
e.g., at the sediment-water interface and near plant roots. Further, the contribution of
aerobic biodegradation to the overall removal may have been significant, based on
observations of extensive root systems in the field and evidence of methanotrophic
activity.
A bench-scale study was also conducted to examine the fate of TCE under wetland
conditions (Bankston et al., 2002). The batch experimental system included wetland
soil with indigenous bacteria and the wetland plant, broad-leaf cattail (Typha
latifolia). Following the addition of radiolabeled TCE, a mass balance on 14C
demonstrated the production of 14CO2 from [
14C]-TCE and the uptake of radiolabeled
carbon into biomass after 20 days. This study provides more definitive evidence for
detoxification of chlorinated ethenes in wetland systems via oxidation.
A preliminary constructed wetland design approach has been developed specifically
for the removal of chlorinated solvents, as summarized by Kassenga et al. (2003).

21
The approach was designed to have the following treatment stages: (1) after water is
pumped into a wetland bed in an upflow mode, chlorinated solvents undergo
incomplete reductive dehalogenation in the anaerobic zone at the base of the wetland;
(2) as water moves upward, chlorinated ethenes are sorbed onto the organic soil,
which results in longer contaminant detention times; and (3) within the plant root
zones, the less chlorinated ethenes pass through an aerobic area populated with
methanotrophic bacteria. A bench-scale study utilizing a column reactor containing
soil and wetland plants was developed to investigate the feasibility of using this type
of design (Kassenga et al. 2003). DCE and VC were supplied to the bottom of the
column, and the concentration of DCE and VC at various depths was monitored.
Results showed that as the distance above the core bottom increased, first DCE levels
decreased, then VC was subsequently produced, and finally VC levels decreased.
Although there were some operational problems, including breakthrough, the authors
concluded that treatment wetlands may be a technically and economically viable
option for treatment of groundwater contaminated with chlorinated solvents.
In the two bioreactor studies discussed above the removal of the chlorinated
compounds was attributed to microbial activity; however, no tests were conducted
with plants only to quantify the effects of the plants on the contaminant removal. For
example, the reactor system used by Kassenga et al. (2003) was not a fully closed
system and, thus, was not designed to ascertain the plant contribution to DCE
removal. In studies that utilized a closed two-phase experimental system, often the
aqueous and/or gas phase was maintained in batch mode. Another shortcoming of

22
many of these studies was the inclusion of a headspace in the aqueous root chamber,
thereby allowing considerable abiotic volatilization of the chlorinated compound to
occur (e.g. Bankston et al., 2002). Based on the results from these reactor designs, it
is difficult to make predictions about the partitioning and transformation of
chlorinated ethenes in a real wetland rhizosphere, in which the aqueous-phase
contaminants would be introduced more or less continuously and air flows freely past
the leaves and stem.
Overall, the studies discussed above suggest that wetland environments provide
suitable conditions for the complete microbially-mediated biodegradation of
chlorinated solvents via coupled anaerobic and aerobic conditions and also offer the
opportunity for removal of these contaminants through phytoremediation. However,
the processes controlling complete mineralization and/or transformation of these
compounds are not understood, which limits our ability to predict and enhance these
processes. The purpose of this research is to extend our understanding of these
processes.
23
Chapter 3: Hypothesis
This research project was designed to evaluate whether wetland ecosystems could
provide ideal conditions for the biological removal of chlorinated ethene
intermediates formed during the reductive dehalogenation of PCE and TCE, as
groundwater or waste streams impacted by these contaminants move through the
rhizosphere. Specifically, it was hypothesized that the plants may affect contaminant
levels indirectly by generating an aerobic rhizosphere habitat that promotes the
activity of aerobic bacteria capable of degrading the intermediates or directly, by
facilitating removal via phytovolatilization, transformation to CO2 or other
metabolites, or incorporation into plant biomass. DCE was selected as a model
compound for use in this study because DCE often accumulates during
biodegradation of PCE and TCE in anaerobic systems, and microbial biodegradation
of DCE under aerobic conditions has been observed (Coleman et al., 2002).

24
Chapter 4: Goals and Objectives
The goals of this research were to obtain information that can be used to design more
efficient and cost-effective in-situ wetland treatment methods, as compared to
existing engineered systems (Lorah and Olsen, 1999), and improve our ability to
predict the fate of chlorinated ethenes in engineered and natural attenuation systems.
In order to test the research hypotheses and achieve the research goals, the
experimental approach was designed to achieve the following specific objectives:
1. Design an experimental bioreactor system that can be used to evaluate the
ability of wetland plants to support the transformations of chlorinated ethenes.
2. Construct and characterize a prototype of the bioreactor.
3. Use the bioreactor to characterize the fate of a model contaminant, [14C] DCE,
fed to the root zone of the bioreactor.

25
Chapter 5: Experimental Approach
Conceptual Model of PCE Degradation in Wetland Soil and Plant Rhizosphere
A conceptual model of how PCE biodegradation in anaerobic and aerobic soil regions
occurs, as groundwater or waste streams impacted by these contaminants moves
through wetland soils, is depicted in Figure 5-1. As previously described, aerobic
oxidation of PCE is not possible. Therefore, PCE degradation must be initiated in the
anaerobic zones and involves reductive dehalogenation to TCE and DCE. Thereafter,
various potential fates are possible for DCE in the conceptual model. Microbial
biodegradation via reductive dehalogenation to VC and finally ethene under
anaerobic conditions is possible, although degradation to CO2 via aerobic microbial
oxidation in the plant rhizosphere is expected to occur to a greater extent. Oxidation
of the DCE formed may be the result of either cometabolic or metabolic processes. It
should be noted that aerobic oxidation of TCE and VC are also feasible
biodegradation processes. Aerobic oxidation reactions in the rhizosphere are possible
due to efficient internal oxygen diffusion through plants from the shoots to the roots,
and subsequent loss through the roots into the rhizosphere. Additionally, plants can
act upon DCE via phytovolatilization, transformation to CO2 or other metabolites, or
incorporation into biomass.
26
Figure 5-1: Conceptual model of PCE degradation in a wetland environment.
Development of Prototype Bioreactor and Characterization of [14C] DCE fate
In order to test the hypotheses, a physical model of a wetland plant – rhizosphere –
soil bacteria system was developed to evaluate the fate of DCE in this type of system.
DCE was selected as the model contaminant because it often accumulates following
anaerobic reductive dehalogenation and is susceptible to aerobic oxidation, as
previously described. Radiolabeled DCE was added to characterize the fate of DCE
in the model system and determine the extent of aerobic DCE metabolism. The
bioreactor consisted of rhizosphere and foliar chambers that are separated so that the
only source of oxygen in the rhizosphere is provided by oxygen transport through the
plant, as previously described. The bioreactor was operated in a continuous-flow
mode. [14C]-DCE-amended media was supplied to the rhizosphere, and air was
continuously drawn through the foliar chamber. Compared to a batch system,
Anaerobic Bulk Soil
PCE TCE DCE
2[H] HCl
O 2 CO 2
CH 4
O 2
O 2 O 2
Aerobic Rhizosphere
VC
Ethene
DCE

27
operating the reactor in a continuous-flow mode made the mass balance calculations
for evaluating the substrate rate more straight-forward. Further, the flow-through
reactor is more representative of wetland conditions in which water is continuously
moving and providing a steady supply of contaminants.
28
Chapter 6: Material and Methods
Bacterial Culture Maintenance
Strain JS666 was obtained from the laboratory of Dr. Jim Spain (Air Force Research
Laboratory, Tyndall AFB). The initial culture was grown up on ¼-strength Tryptic
soy agar (TSA) plates. Media and solid materials were sterilized by autoclaving at
120oC for 15-20 minutes, unless otherwise noted. Individual colonies were then
inoculated into 50 mL of autoclaved minimal salts medium (MSM), which consists of
in (g/L) K2HPO4 (2.27), KH2PO4 (0.95), (NH4)2SO4 (0.67), and 0.1 mL of a trace
metals solution containing (g/L): Na2ETA·2H2O (6.37), ZnSO4·7H2O (1.0),
CaCl2·2H2O (0.5), FeSO4·7H2O (2.5), NaMoO4·2H2O (0.1), CuSO4·5H2O (0.1),
CoCl2·6H2O (0.2), MnSO4·H2O (0.52), MgSO4·7H2O (60.0), adjusted to pH 7.2 with
10 M NaOH, and 3 µL 97% DCE (Fisher) to yield a nominal concentration of 70
mg/L (Coleman et al., 2002). Liquid cultures were established in 160-ml serum
bottles that were sealed with sterile Teflon-faced butyl septa and aluminum crimp
caps and are referred to here as first-generation cultures. All cultures were wrapped
in foil and maintained at room temperature (20-25oC) on a platform shaker (90
oscillations per minute, Eberbach). The cultures were re-supplied DCE whenever it
was depleted. 0.5-mL headspace samples were obtained from the serum bottles for
measurement of DCE concentrations using gas chromatography (described below).
After three to five additions of DCE, degradation of DCE slowed or stopped (N.
Coleman, 2004 and this study). Therefore, after degradation of several DCE
additions, air was added to each culture by first removing the septum and then

29
flushing the headspace with filter-sterilized (0.2 µm, Air Vent, Pall) lab air with a
sterile cannula for five minutes. Typically this was sufficient to restart DCE
degradation. However, it was also observed that after several additions of DCE had
been degraded, the pH decreased to 6.5, presumably due to the accumulation of HCl
produced by the dechlorination reactions. Therefore, when the addition of air alone
was not sufficient to restart DCE degradation, the pH was adjusted to 7.2 by adding
3.25 mL of 0.1 M NaOH. These two actions were able to restart DCE degradation
over several months.
Several quality control measures were undertaken to help maintain the purity and
genetic characteristics of the stock cultures sent by Dr. Spain. First, in order to
confirm that JS666 was the dominant organism in solid and liquid cultures, samples
of these cultures were examined under a phase contrast microscope and compared to
a physical description of the bacteria and a TEM image of JS666 provided by N.
Coleman. Second, samples of both the solid and liquid cultures were used to prepare
long-term, frozen glycerol stocks of JS666. JS666 was harvested from liquid cultures
by collecting 2 mL of the suspended culture and centrifuging it (4000 rpm) for 20
minutes to obtain a pellet. Solid culture samples were obtained by scraping cells
from one TSA plate. The collected cells were suspended in 0.4 mL of 20% glycerol
stock solution prepared using JS666 MSM for the liquid cultures and ¼-strength
Tryptic soy broth (TSB) for the solid cultures. 0.2 mL aliquots of the glycerol stock
were transferred to cryogenic tubes and stored in a -80oC freezer. The viability of
JS666 in the glycerol stocks was tested by plating with 0.1 mL of glycerol stock on

30
spread plates one week after storage. In all cases, JS666 colonies formed on the
plates.
Evaluation of Biofilm Formation
Second generation liquid cultures (50 mL MSM) were prepared in triplicate to
evaluate the ability of JS666 to form a biofilm. Each second generation culture
contained enough 2-mm soda lime glass beads to cover the bottom of the serum bottle
(approximately 7 g), along with an inoculum of 0.5 mL of first generation culture.
After three additions of DCE were degraded, the liquid MSM was aseptically
removed, and the beads were gently rinsed with 15 mL of sterile MSM twice to
remove any of the original MSM and, more importantly, any suspended biomass.
Fresh sterile MSM was then added, and the bottles were resealed and respiked with
DCE.
Bacterial Protein Analysis
Protein concentrations of the JS666 batch cultures were determined using a modified
Bradford colorimetric method (Bradford, 1976). Culture fluid (500 µL) was mixed
with 50 µL of 4.4 N NaOH and heated for 30 minutes at 80oC to affect cell lysis.
Following cooling to room temperature, the solution was neutralized with 50 µL of
4.4 N HCl. Each sample was centrifuged (14,000 x g, 10 min) to remove cells. 450
µL of the supernatant was mixed with 450 µL DI water and 900 µL of the Bradford
Reagent (Sigma Chemical Co.). The absorbance was measured at 595 nm with a
spectrophotometer (HACH, DR/4000, Loveland, CO, USA) and compared to a
31
calibration curve prepared using bovine serum albumin standards that were treated
identically.
Bacterial Plate Counts
Prior to the addition of a batch of JS666 liquid culture to the reactor, a plate count
was conducted to determine its bacterial density, as follows. First, 0.1 mL of culture
was mixed with 9.9 mL of dilution water (1.25 mL phosphate buffer solution (pH 7.2)
diluted to 1 L in DI water). Six serial dilutions were then prepared from this initial
dilution, and 0.1 mL of each dilution was plated on a ¼-TSA plate. The plates were
incubated at 19oC for three days. The number of colony forming units (CFU) on each
plate that contained between 30 and 300 colonies was counted.
Plant Growth
Individuals of common reed (Phragmites australis (Cav.) Trin. ex Steud.) that
conformed to the bioreactor were grown from samples collected from the
environment. The following procedure was developed for collecting and preparing
plant material for the reactor. Samples were dug from a wetland site located adjacent
to a stormwater retention pond on the University of Maryland campus. These
samples were separated from the overall rhizome structure, so that each individual
retained a 10 to 15 cm section of the rhizome, from which an extensive root structure
extended. The shoots were cut just above the roots and potted in sterile vermiculite
(autoclaved 120oC, 60 min). The plants were grown in a walk-in climate controlled
environmental chamber (Environmental Control Chambers, Chagrin Falls, Ohio) as
follows: The pots were placed in plastic containers, which were filled with several

32
inches of DI water to maintain saturated conditions. In addition, the humidity level
was maintained at 80% to minimize water loss. The environmental chamber was
programmed to simulate natural spring to early summer growing conditions in the
Mid-Atlantic region for the wetland plants. The chamber was set to provide a
photoperiod of twelve hours (average light reading 380 µmol/s m2 µA) and ten hours
of darkness with an hour of gradual light variation between each period. In addition
to providing an ideal photoperiod, the chamber temperatures, 30oC during the day and
20oC during the night, presumably resulted in maximum growth. Sterile growth
solution, MSM, was added to the pots twice a week. The plants were maintained on
MSM, rather than the more typically-used Hoaglands media (Hoagland and Arnon,
1938), because MSM was provided to JS666 and plants maintained in the flow-
through reactor (described below). The health and growth of the plants provided with
MSM or Hoaglands media was compared to confirm that MSM did not negatively
impact the plants before using it to maintain the plants (data not shown).
Prior to use in the bioreactor, the roots of appropriately sized plants were typically
treated to reduce levels of indigenous bacteria. The following root sanitization
method did not negatively impact plant health and involved five root treatments: (1)
shaking for 30 minutes in 0.05 M (pH 7.2) phosphate buffer solution to prevent
hypochlorite uptake in the next step (Okon et al., 1977); (2) exposure to a 10% bleach
(~5% hypochlorite) solution for 3 minutes; (3) a sterile DI water rinse; (4) shaking for
10 minutes in sterile 0.05 M phosphate buffer solution (pH 5.0) to remove residual
bleach; and (5) shaking for 30 minutes in 0.1 M (pH 7.2) phosphate buffer solution to

33
neutralize pH. All solutions were sterilized by autoclaving. Shaking was conducted
with a rotary platform shaker (120 RPM, Baxter S/P® Rotator V). The last four steps
were provided by A. Grybauskas (personal communication, 2004).
Design and Construction of Prototype Bioreactor
In this research project, an experimental bioreactor system was designed to
characterize the effects of a wetland plant on microbial biodegradation of DCE in a
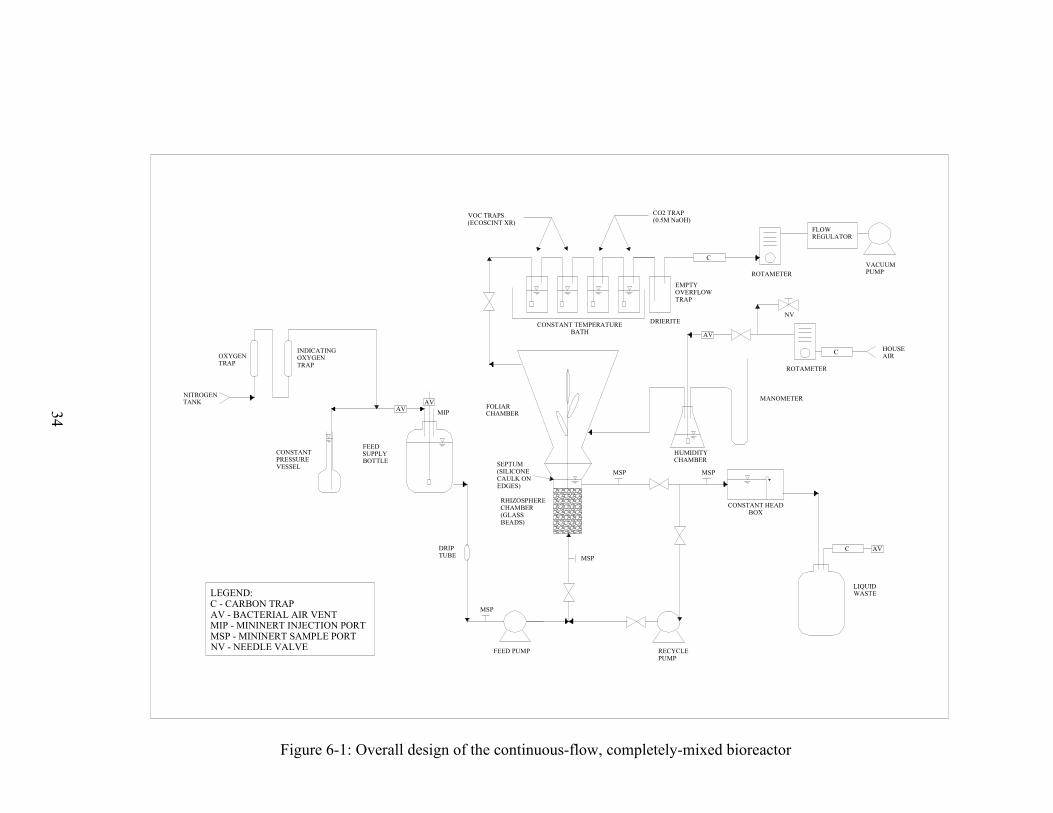
model wetland rhizosphere. A schematic of the final design is shown in Figure 6-1.
All components were constructed out of materials that are chemically compatible
with DCE including glass, brass fittings (Swagelok), and Teflon tubing covered with
Viton tubing to minimize abiotic loss of DCE and oxygen diffusion, respectively.
The bioreactor consisted of two glass chambers that housed a single plant. The roots
were in the lower (rhizosphere) chamber, while the leaves and stem were in the upper
(foliar) chamber. The two chambers were fitted together as follows: A glass blower
fused a glass O-ring to each chamber. The glass O-rings were sealed together with a
Viton O-ring, which fit into a channel on each glass O-ring, and held together with a
clamp. A tight seal between the two chambers prevented exchange of materials
between the two chambers, except via the plant. In particular, it was important that
oxygen transfer between the two chambers be limited to that supplied by the plant via
internal oxygen diffusion and subsequent ROL. This was accomplished by using a
Teflon-lined septum with an opening to accommodate the plant stem and non-toxic
silicone caulk to separate, and create a gas-tight seal between, the lower and upper
chamber. Oxygen was supplied to the plant via the gas system (described below).
34
MSP
DRIERITE
FLOW REGULATOR
VACUUM PUMP
Figure 6: Overall bioreactor design
LEGEND:C - CARBON TRAPAV - BACTERIAL AIR VENTMIP - MININERT INJECTION PORTMSP - MININERT SAMPLE PORTNV - NEEDLE VALVE
AV
AVAV
AV
C
C
C
MSP
MSP MSP
MIP
NITROGEN TANK
OXYGEN TRAP
INDICATINGOXYGEN TRAP
CONSTANT PRESSURE VESSEL
FEED SUPPLY BOTTLE
DRIP TUBE
FEED PUMP RECYCLE PUMP
RHIZOSPHERE CHAMBER(GLASS BEADS)
SEPTUM (SILICONE CAULK ON EDGES)
VOC TRAPS(ECOSCINT XR)
CO2 TRAP(0.5M NaOH)
CONSTANT TEMPERATURE BATH
FOLIAR CHAMBER
MANOMETER
HOUSE AIR
LIQUID WASTE
ROTAMETER
ROTAMETER
HUMIDITY CHAMBER
CONSTANT HEAD BOX
EMPTY OVERFLOW TRAP
NV
Figure 6-1: Overall design of the continuous-flow, completely-mixed bioreactor

35
A continuous supply of sterile, deoxygenated MSM amended with DCE (97% purity,
Fisher) was pumped in an upflow mode through the rhizosphere chamber to meet the
nutritional needs of both the bacteria and plant. A plant growth light (compact
fluorescent 125 W, 6400 K wide spectrum, Hydrofarm, Petaluma, CA) was utilized to
provide sufficient light (12 hr photoperiod) to the plant while in the bioreactor
(average light reading 220 µmol/s m2 µA). An LCD temperature strip attached to the
foliar chamber was used to monitor the temperature inside the chamber. The
temperature typically ranged from 20oC (typical nighttime temperature) and 28
oC
(typical daytime temperature).
The rhizosphere chamber was designed to support an aerobic DCE-degrading biofilm
growing on 2-mm acid-washed glass beads and contain the plant roots. The
rhizosphere chamber was 5 cm in diameter and had a total height of 140 mm. Glass
wool was placed in the bottom 33 mm of the chamber to support the glass beads,
which filled the remainder of the chamber (as described below). It should be noted
that there was a space between the top of the beads, which fell just below the effluent
line, and the septum used to separate the two chambers. This area was not part of the
140 mm reactor zone, but was filled with liquid during the experiments. The total
volume of the glass bead zone was 210 mL, with a pore-volume of 88.2 mL. The
rhizosphere chamber was completely saturated with media and covered with foil
during experiments. The level in the chamber was maintained with a polycarbonate
head box located on the waste line (Figure 6-1). During start-up, the height of the
weir in the head box was adjusted until the liquid level in the chamber was just below

36
the septum. Sampling ports (Mininert termination valves) were provided on the
rhizosphere chamber feed, influent, effluent, and wasting lines. Both the feed and
recycle pumps consisted of a Masterflex (Cole-Parmer) pump drive and Masterflex
Teflon tubing pump head (Cole-Parmer).
The rhizosphere chamber was sized on the basis of the physical characteristics of the
plant roots and bacterial growth and substrate-utilization kinetics using a completely-
mixed biofilm model (Rittmann and McCarty, 2001). In theory, maintaining a
hydraulically completely-mixed condition, should have ensured that DCE and oxygen
were uniformly distributed throughout the rhizosphere chamber and helped to prevent
the formation of DCE hotspots and excessive biomass where substrate concentrations
were high. A completely-mixed hydraulic condition was achieved by incorporating a
high rate of recycle flow relative to the influent flow (Rittmann, 1982). Rittmann
(1982) found that a minimum recycle-to-influent ratio of 10 was sufficient to
approximate completely-mixed conditions in a biofilm reactor. The sizing
calculations were based on steady-state mass balance equation for a completely-
mixed biofilm reactor according to:
aVJSSQdt
dshV ssinT −−== )(0 (2)
where QT is the total volumetric flow rate (L3T
-1) and is equal to QR (L
3T
-1), the
recycle flow rate, plus Q (L3T
-1), the influent flow rate; a is the specific biofilm
surface area (L-1); Sin is the influent substrate concentration (MsL
-3); S is the effluent
substrate concentration (MsL-3); Jss is the substrate flux into the biofilm (MsL
-2T
-1); V
is the reactor volume (L3); and h is the pore volume (L
3). Figure 6-2 provides a
37
simplified schematic of the rhizosphere chamber including some of the above
parameters. Eq. (2) was solved for a QT that yielded a V, and thus a length, that was
suitable for the P. australis plant roots when the chamber diameter was fixed at 5 cm
to accommodate the plant roots. Specifically, the values for QR and Q were adjusted
in a trial-and-error process until the length was suitable to contain the plant roots.
The design values for S and Sin were 1.5 mg/L and 50 mg/L, respectively. The value
of S was selected to be approximately four times greater than Smin (0.38 mg/L), which
is the minimum substrate concentration required to retain biomass at a steady-state
concentration. The value for Sin was selected based on concentrations found in the
environment at contaminated sites. Wrenn (2003) stated that the concentration of
chlorinated compounds in contaminated groundwater typically ranges between 10 and
100 mg/L. For example, DCE concentrations of approximately 51.4 mg/L were
observed at Plattsburgh Air Force Base (New York) (Wiedemeier et al., 1999).
Therefore, an intermediate value of 50 mg/L was selected. This Sin was achieved by
using a DCE concentration of ~1500 mg/L in the feed (So), which is below the
solubility limit of 1888 mg/L determined in this study. Jss and a were solved for using
the approach described by Rittmann and McCarty (2001) and references cited therein,
an assumed porosity of 0.4, and the kinetic constants of the bacterium selected
(JS666) for use in the bioreactor (described below). With these constraints, a recycle
flow rate of 30 times the feed pump rate (Q = 15 mL/hr and QR = 450 ml/hr), yielded
a total chamber volume of 210 mL and a length of 107 mm.

38
QT, Sin
Rhizosphere
Chamber
QT, S Q, S
QR, S
Q, S0
Figure 6-2: Schematic of rhizosphere chamber detailing parameters used in the completely-
mixed biofilm reactor mass balance equation (parameters defined in text).
A tracer study was conducted to verify that the rhizosphere chamber behaved as a
completely-mixed reactor. Following the method described by Seagren et al. (1999),
fluorescein dye was utilized as a non-reactive tracer to monitor breakthrough without
microorganisms or a plant in the reactor. Fluorescein dye was provided as a step
input to the reactor. Samples were collected continuously by connecting a sample
pump to the sampling point on the wasting line. The flow rate of the sample pump
was set to 75% of the feed pump flow rate, and the collected fluid was discharged
into a fraction collector. The fraction collector was set so that each tube collected 2
mL, which required approximately 10 minutes per tube. Every third sample was
analyzed as described below.
The gas system of the bioreactor was designed to continuously supply fresh, sterile
(0.2 µm, Air Vent, Pall) moist air to the foliar chamber, which was constructed using

39
a modified 2-L Erlenmeyer flask. This air provided the only source of oxygen for
diffusion to the root chamber in most experiments. Positive pressure alone was
initially used to supply humid air to the foliar flask. However, the amount of pressure
needed to pump air through the chamber using this approach resulted in air being
forced through the plant into the lower chamber, which in turn caused the water level
in this chamber to drop. Therefore, a vacuum pump (Schwarzer Precision, SP 700
EC) and a vacuum flow regulator (Cole-Parmer, 32505 Series Flow Controller) were
used to draw air from the rhizosphere chamber and through the downstream gas
effluent traps. The negative and positive pressures were carefully balanced using a
needle valve on the gas influent (Figure 6-1). The needle valve was adjusted so that
the reading on the manometer, which measured pressure in the foliar chamber, was
just above atmospheric pressure. This provided an influent flow rate that was slightly
greater than the vacuum flow rate and did not force air into the lower chamber. The
flow rate was maintained at 0.8 to 1.0 LPM (Burken and Schnoor, 1998), as measured
by a rotameter on the vacuum line. This flowrate prevented heat and moisture
accumulation in the chamber. The effluent traps consisted of 4 oz. glass bottles with
Teflon coated caps, through which holes were drilled to accommodate tubing and
glass dispersion tubes. These traps were in place in the gas system at all times during
the experiments. Before radiolabeled DCE was added, the traps were filled with DI
water. After [14C]-DCE was added, volatile organic compounds (VOCs) and CO2 in
the gas effluent were collected by four traps in series (described below). A drop flask
containing Drierite desiccant was placed after the VOC and CO2 traps to remove
moisture from the gas flow. Finally, a granular activated carbon (GAC) trap (ORBO

40
32, Supelco) was placed downstream of the other traps at all times to trap any residual
VOCs.
The media supply system was designed so that either anoxic or fully-aerated media
could be supplied to the rhizosphere. When anoxic media was required, it was
deoxygenated by autoclaving it at 120oC for 30 minutes, which also sterilized the
media, and sparging the hot media under filter-sterilized (0.2 µm, Air Vent, Pall)
oxygen-free nitrogen (Ultrapure carrier grade, Air Gas) until the media cooled to
room temperature. The oxygen content of the cooled media was measured. If oxygen
could be detected in the media, it was stored in an anaerobic chamber (85% N2/ 10%
CO2/ 5% H2; Coy Laboratories) with a sterile cotton plug to allow any residual
oxygen to diffuse out. The media bottle was then connected to the bioreactor system
via a quick disconnect (Swagelok). A continuous supply of filter-sterilized (0.2 µm,
Air Vent, Pall) nitrogen (High purity grade, Air Gas) and a constant head vessel (1-L
volumetric flask) was used to maintain the media bottle under a slightly positive
pressure (12″ H2O or 0.03 atm above atmospheric pressure) and prevent oxygen from
entering, even as the liquid level decreased. Any residual oxygen in the nitrogen
supply was removed with an oxygen trap and an indicating oxygen trap (Trigon
Technologies) in series. When oxygenated media was required, it was prepared by
sparging the media with filter-sterilized (0.2 µm, Air Vent, Pall) lab air after being
autoclaved and cooled.

41
Bioreactor Experimental Procedure
A series of experiments were conducted using the bioreactor system. In each case,
the fate of DCE under steady-state conditions was evaluated. The experimental
system used in each experiment varied, as follows. In the first experiment, a root-
only with JS666 experiment was performed to evaluate the removal of DCE in the
presence of a plant root. In the second experiment, an abiotic control experiment was
performed with the rhizosphere chamber only and aerated media to determine if there
was any abiotic loss of unlabeled DCE in the system. In the third experiment, the
rhizosphere chamber was operated with JS666 only and aerated media to evaluate the
ability of JS666 to transform unlabeled DCE in a continuous-flow biofilm
environment without the potential for inhibition due to the presence of preferential
substrates or competition with, and/or grazing by, protozoa introduced along with the
plant. In the fourth experiment, the foliar and rhizosphere chamber were used with
the plant and associated microorganisms to characterize the roles that wetland plants
play in affecting the fate of DCE. Two ways in which plants can influence microbial
transformation of DCE in the rhizosphere are by releasing oxygen and/or exudates,
which can serve as growth substrates through their roots. Therefore, in the fourth
experiment, the plant was supplied with anoxic, DCE-free media and influent and
effluent DO levels were measured to estimate oxygen release and the influent and
effluent soluble chemical oxygen demand (COD) concentrations were measured
periodically to obtain an estimate of exudate production. The oxygen levels were
measured until they reached steady-state. After steady state oxygen release was
observed, unlabeled DCE was added to the media. DCE levels were monitored until

42
the bioreactor reached steady-state with respect to DCE removal. Then [14C]-DCE
was added to the feed along with unlabeled DCE to characterize the contributions of
P. australis and the root-associated microorganisms to the removal of DCE and the
removal mechanisms themselves.
For all experiments, the performance of the bioreactor in terms of unlabeled DCE
removal was monitored by measuring the concentration of unlabeled DCE in the
liquid effluent and feed daily with a gas chromatograph (GC). Steady-state removal
of DCE was evaluated by measuring either the concentration of unlabeled DCE or
14C-activity for radiolabeled DCE in both the influent and effluent. When at least five
sequential measurements typically made on a daily basis could be fitted with a line
that had a slope not significantly different than zero (using a t-test with a p > 0.05),
the reactor was said to be at steady-state.
For experiments utilizing JS666, bacteria were added to the bioreactor once the liquid
level was stable in the rhizosphere chamber. For these experiments, the system was
supplied with oxygenated media to promote the establishment of both the plant (if
present) and bacteria. The bacteria were added aseptically with a sample pump
through the sampling point on the rhizosphere chamber influent. The bacterial source
was a liquid culture of JS666 (described above) containing between 106 to 10
8
CFU/ml (method described previously). JS666 cultures used to inoculate the
rhizosphere chamber were actively degrading DCE and were harvested within one to
two days of degrading a DCE addition. JS666 liquid cultures were pumped (50

43
mL/hr) into the reactor over a one-hour period. After the culture was added to the
bioreactor, aqueous DCE was added to the bioreactor via the effluent line, resulting in
a DCE concentration of 10 mg/L within the bioreactor system. Then the culture was
recycled through the rhizosphere chamber for 12 hours using the recycle pump.
During this time, there was no flow into or out of the bioreactor system. Afterwards,
the recycle pump was also turned off and the system was allowed to sit quiescently
for 24 hours to allow JS666 to attach to the glass beads. After 24 hours, the reactor
was again operated in recycle mode, without any inputs or outputs. The flow rate of
the recycle pump was slowly ramped up to 450 mL/hr, in an effort to prevent shearing
of the biofilm. The reactor was then operated as designed, i.e., with influent, effluent
and recycle flows, and feed and effluent DCE levels were monitored.
[14C]-DCE was used in this study so that the fate of DCE in different phases
(aqueous, gas, plant, and microbial biomass) could be quantified and the overall
efficiency of the DCE removal could be measured. After [14C]-DCE was added,
samples of the liquid, gas, and solid phases were collected and treated in different
ways to evaluate the amounts and forms of 14C that they contained. Samples of the
liquid effluent were collected approximately every 24 hours to determine aqueous
[14C]-DCE levels. This sampling frequency was selected based on the results of the
tracer study (described below). 14C-labeled VOCs and
14CO2 in the gas system
effluent were collected by a series of traps. Traps were maintained in duplicate (in
series) and cooled in a 4oC in-line water bath to increase their trapping efficiency
(Gage et al., 1959). Each of the first two traps contained 100 mL of the scintillation

44
cocktail Ecoscint XR to trap both labeled and unlabeled VOCs. The selection of the
Ecoscint XR cocktail was based on information provided by the manufacturer
(National Diagnostics), which indicated that this scintillation cocktail can be used to
trap organic compounds. The traps were not replaced during the experiment, because
the amount of phytovolatilized VOCs was not expected to exceed the reported
trapping capacity of the cocktail. The remaining two traps contained a 100-mL
solution of 0.5 M NaOH, which captured both labeled and unlabeled CO2. The
contents of these traps were exchanged once a day, because they were expected to
reach their CO2 trapping capacity after approximately 24 hours. At the conclusion of
the experiment, the amount of 14C associated with the plant material and bacterial
biomass was determined as described below.
Preparation of 14[C]-DCE solution
The [14C]-DCE (1 mCi, purity ≥ 96%, specific activity 4 mCi/mmol) was obtained
from Moravek. The [14C]-DCE was dissolved in 160 mL of sterile DI water in a 160
mL serum bottle as follows: First the ampoule (washed with 70% ethanol) containing
the [14C]-DCE was inserted in the empty serum bottle (placed on ice) and held in
place at the bottom of the bottle. Next approximately 140 mL of sterile DI water was
added. Then the class ampoule was broken and immediately the bottle was filled to
the top with approximately 20-mL of DI water and capped with a Teflon-faced butyl
septa and aluminum crimp cap. A 0.1-mL sample was tested to check for [14C]-DCE
activity and a second 0.1-mL sample was collected for headspace GC analysis
(described below) to check for contamination. The 160-mL stock was divided into
seven, 20-mL aliquots in 22-mL sterile serum bottles, and two, 10-mL aliquots in 10-
45
mL sterile serum bottles and stored at 4oC. For each 2 L of MSM prepared, one 20-
mL aliquot of [14C]-DCE stock solution was added, in addition to unlabeled DCE
(97%, Fisher), for a specific activity [14C]-DCE of approximately 30 µCi/L.
Analytical Methods
Analysis of Volatile Organics
The concentration of DCE was measured using a GC (Hewlett Packard, Model 5890
Series II Plus) equipped with a flame-ionization detector (FID) and a 3.2 mm x 2.44-
meter stainless-steel GC column packed with 1% SP-1000 on 60/80 Carbopak-B
(Supelco, Inc). Helium (Ultra Pure Carrier Grade, Air Gas) was used as the carrier
gas at a flow rate of 40 ml/min, and the FID was fueled by hydrogen (Ultra Pure
Grade, Air Gas) and air (Ultra Pure Grade, Air Gas) provided at flow rates of 40
ml/min and 400 ml/min, respectively. The injector and detector temperatures were
set at 200oC and 250
oC, respectively. The oven temperature was maintained
according to the following operating sequence: (1) 60oC for two minutes, (2) 20
oC
/min ramp to 150oC, and (3) 10
oC C/min ramp to 200
oC (Gossett, 1985).
To determine DCE aqueous concentrations in the bioreactor system, 100-µL samples
were collected with a 250 µL gastight syringe (Hamilton), injected into a 10-ml
sample vial sealed with a Teflon-faced butyl stopper and aluminum crimp cap and
equilibrated at 30oC for a minimum of one hour using a Multi-Blok heater (Lab-Line
Instruments, Inc.). Headspace samples (0.5 mL) were taken from the sample vials
using a 1-ml gas-tight syringe equipped with an on-off push-button valve (Pressure-
Lok®, Series A-2) and manually injected into the GC. The concentrations of the

46
unknown samples were determined based on a calibration curve. The calibration
curve was prepared using headspace samples obtained from aqueous DCE standards
that were prepared gravimetrically using a stock solution of DCE in methanol
(Gossett, 1985) and then transferred to the headspace vials. The linear calibration
curve was fit to the data using a relative least-squares (RLS) technique, as described
by Saez and Rittmann (1992). This was necessary because the residuals generated
using an absolute least-squares (ALS) linear relationship was correlated to the
observations. Specifically, their value increased as the dependent variable
(concentration) increased. As a result, the higher concentrations had more influence
on the ALS parameter estimation compared with the lowest standard concentration.
This was not unexpected, because the concentration range of the standards varied
over more than one order of magnitude (Saez and Rittmann, 1992).
Tracer Study Analysis
A 1.5 mL aliquot of the samples collected in the tracer study was placed in a quartz
cuvette and analyzed in a spectrofluorometer (Shimadzu) at a λexcitation of 440-442 nm
and a λemission of 514-518 nm (Seagren et al., 1999) to determine their fluorescein
content. A calibration curve was prepared with aqueous standards containing known
concentrations of fluorescein.
Quantification of Plant Exudates
The overall plant exudate content of the bioreactor effluent was estimated in terms of
COD. COD was quantified in 2-mL samples of the reactor feed and effluent using
the Hach method (0 - 150 mg/L), which utilizes potassium dichromate oxidation and

47
reactor digestion based on the approach described by Jirka and Carter (1975). A
Hach DR/4000 photometer was used in the analysis.
Dissolved Oxygen Measurement
To measure the plant root oxygen release in the reactor, the oxygen content in the
reactor effluent and feed were monitored. A flow-through oxygen probe (Lazar,
Model DO-166) was utilized with a polypropylene membrane (2-mm, Fisher). The
probe was connected to a pH meter (Orion 940A) to obtain output readings (mV
units). The meter output reading was calibrated to read percent oxygen saturation.
The probe was calibrated to 21% saturation daily by injecting air through the unit
using a syringe. The probe was calibrated once to 0% DO by injecting deoxygenated
DI water. The percent saturation readings measured in aqueous samples were
converted to DO concentrations using the following equation:
2
232000
100
%
760
)760(
414.22)/(
Omol
Omgx
rx
Hgmm
Hgmmpx
acLmgDO
−= (3)
where ac is the absorption coefficient of gas at 20oC, p is the vapor pressure of water
at 20oC (mm Hg), and r% is the percent oxygen reading.
Analysis of 14C-labeled fractions
The steady-state distribution of 14C in the different gas, liquid, and solid phases was
determined using the approach outlined in Figure 6-3. The radioactivity of all
samples was measured using a liquid scintillation counter (Perkin Elmer Tri-Carb
Scintillation Counter) with a counting time of 15 minutes using Ecoscint XR
scintillation cocktail (National Diagnostics) in 7-mL glass scintillation vials. A
counting time of 15 minutes was selected because in a previous study by Seagren

48
(1994), this time was found to be sufficiently long to keep the uncertainty at the 2σ
level to <10% of the total count rate for most samples. An internal standard quench
curve was used. All samples containing NaOH were allowed to sit overnight in the
dark to reduce chemiluminescence before they were counted (Voroney et al., 1991).
This method to reduce chemiluminescence was verified by comparing the
disintegrations per minute (dpm) measured in two 5-mL samples consisting of NaOH
(2 mL, 0.1 M) and Ecoscint XR (3 mL), one of which had been incubated in the dark
overnight and one of which was analyzed within 30 minutes of being prepared. A
background sample was also prepared by adding 2-mL of DI water to 3-mL Ecoscint
XR. The measured activity for the sample that had not been incubated overnight was
32.06 dpm, whereas the sample that had incubated overnight was 30.50 dpm,
compared to the background sample with 30.54 dpm. Comparing the data showed
that the radioactivity decreased in the sample that incubated overnight to levels
similar to those in the background sample. In contrast, the dpm counted in the sample
that had not incubated overnight, were higher than the background sample.

49
Figure 6-3: Sample fractions to be analyzed for [
14C]
Liquid Fractions
Liquid effluent samples (4 mL) were manually collected with a 5-mL gas tight
syringe (Hamilton) by pulling a sample from the rhizosphere chamber effluent.
NaOH (0.1 mL, 2.25 M) was added to the sample to raise the pH above 10.5 and
drive all 14CO2 into the aqueous phase (Freedman and Gossett, 1989). Then, the
aqueous sample was split into eight sub-samples (0.5 mL each), which were treated in
duplicate as follows (following Seagren, 1994): (1) injected directly through a Teflon-
lined septum screw cap into a scintillation vial containing scintillation cocktail; (2)
injected into an empty scintillation vial and stripped by nitrogen sparging for 30
minutes to remove 14C-labeled volatile compounds; (3) injected into an empty
scintillation vial and acidified with two drops of concentrated HCl (pH ≈ 1) and
stripped to remove the trapped 14CO2 plus
14C-labeled volatile compounds; and (4)
filtered (0.2 µm Millex® –FG Millipore) with the filtrate treated in the same manner
Gas Effluent from
Foliar Chamber
Liquid Effluent from
Rhizosphere Chamber
14C-DCE Added to Rhizosphere Chamber Influent
Plant Bacterial
Biofilm
Volatile
Organic 14C
14CO2
14C-Leaf-Stem
Biomass
14C-Root
Biomass
14C-
Bacterial
Biomass
14C-Non-
Volatile
Residue
14C-Volatile
Compounds
14C-Suspended
Bacterial
Biomass
14CO2

50
as sub-sample (3). 5 mL of scintillation cocktail was added to each vial for
treatments (2) through (4). All vials were shaken by hand for 30 seconds.
Comparison of these four sub-samples yielded the total 14C in the liquid phase (1),
14C-labeled volatile compounds (1) – (2),
14CO2 (3) – (2),
14C-labeled biomass (3) –
(4), and 14C-labeled non-volatile residues (1) – (2) – (3).
The amount of time required to strip the samples was verified as follows. A solution
of unlabeled DCE was added to DI water (0.5 mL) for a final DCE concentration of
approximately 10 mg/L. Prior to stripping the DCE with nitrogen, a 0.5 mL
headspace sample was obtained from the vial and analyzed on the GC to verify the
presence of DCE. The sample was then sparged for 30 minutes with nitrogen (Ultra
Pure Carrier Grade, Air Gas) supplied through a distribution manifold. After 10 and
30 minutes a headspace sample was collected and analyzed on the GC. After 10
minutes DCE was still detectable. After 30 minutes, there was no detectable DCE.
The presence of DCE and CO2 in different liquid fractions were verified following
the methods described by Seagren (1994). First, the fraction of DCE in the volatile
14C was determined by collecting a 100 µL effluent sample and analyzing it on the
GC, as previously described, for the presence of other volatile compounds such as
VC. Second, the 14CO2 fraction was confirmed to be CO2 by barium carbonate
(BaCO3) precipitation. A 0.5 mL sample of the liquid effluent was collected and
acidified following the method described for subsample (3) above and then inserted
into a vial and capped with a septum and screw cap with a hole. The sample was

51
sparged with nitrogen for 30 minutes through a needle inserted through the septum to
the bottom of the vial. A 1/16” OD Teflon tube was inserted through the septum into
the headspace of the vial. The other end of this tube was inserted to near the bottom
of a test tube containing 4 mL of 0.5 M NaOH and 145.6 mg BaOH2. This test tube
also contained a small magnetic stir bar and was placed on a magnetic stirrer to keep
solids from settling to the bottom. After the sample was sparged, the BaCO3 was
allowed to settle, and a 0.5mL sample of the solution was collected. The sample was
filtered through a 0.2 µm Millex® –FG Millipore syringe filter and counted in 5-mL
of Ecoscint XR.
Any compounds originally trapped in the basified sample, which became strippable
from solution when the sample was acidified (e.g. CO2), should have been trapped in
the NaOH in the second vial. In additions, any of the stripped 14C from the first vial
that was CO2 should have been precipitated as BaCO3 in the second vial, and thus
settled or filtered out and not been counted in the solution. Therefore, the counts in
the NaOH solution should have been at background levels if the fraction determined
by the presumptive test to be CO2 was indeed all CO2. The background sample
consisted of autoclaved MSM subjected to the same treatment.
Gas Fractions
Gas traps for VOCs, presumptively [14C]-DCE, and
14CO2 discharged from the foliar
zone were incorporated into the design, as previously described. The trapping
medium for [14C]-DCE also served as the scintillation cocktail and was counted

52
directly by transferring 5 mL of trapping medium to a scintillation vial. For the CO2
traps, 1.5 mL of the trapping agent (0.5 M NaOH) was added to a scintillation vial
containing 5 mL of scintillation cocktail. Three separate samples from each trap were
collected for counting to produce an average radioactivity level for a given volume of
trapping solution.
Solid Fractions
The amount of 14C taken up or absorbed by the plant was determined at the
termination of the experiment. The plant roots were separated from the stem and
leaves, and then each portion was weighed. Sub-samples (1g) of the separated plant
material were combusted in a biological oxidizer (RJ Harvey, Model OX400) as
described by Nair et al. (1993). The 14CO2 produced following combustion was
trapped in 20 mL of 0.5 M NaOH. Triplicate 1.5 mL aliquots of each 20-ml volume
of trapping solution were each combined with 5 mL of scintillation cocktail, and the
results of the triplicate analysis were averaged.
The efficiency of 14CO2 recovery for the oxidizer was determined by combusting a
sample containing a known amount of activity. The chemical selected to determine
the recovery efficiency should be representative of the samples combusted; therefore,
glucose was selected because plant material is largely composed of glucose. The
uniformly 14C-labeled glucose (≥ 97% purity, specific activity 100 µCi/mL) was
obtained from Moravek. A 14C-labeled glucose solution with a known activity
between 10,000 and 20,000 counts per minute (CPM) was prepared by diluting the

53
stock 14C-labeled glucose in 5.6 mL of DI water, added to 50-mg mannitol, and
combusted. The activity of the recovered 14CO2 was determined using the method
described above. The recovery efficiency, referred to as the correction factor, was
calculated by dividing the known activity by recovered activity. A background
sample was prepared by combusting 50 mg of mannitol. The correction factor was
used to determine the total activity in the plant material based on the amount of 14CO2
recovered from combusting the plant material.
In addition, the 14C incorporated into bacterial biomass was determined by collecting
100 beads from each of the algal, top, middle, and bottom layers (described below) of
the packed bed of biofilm at the conclusion of an experiment. The beads were added
to 5-mL of Ecoscint XR in a scintillation vial, agitated for 18 hours, and counted
(Martin et al., 1996). A background sample was prepared with clean beads.
Biofilm Characterization
After completion of experiments conducted with added JS666 or bacteria associated
with the roots of an intact plant, the biofilm thickness (Lf) and density (Xf) were
measured following the method described by Raskin (1987). 100 beads from each of
the algal, top, middle, and bottom layers (described below) of the packed bed were
collected, weighed, dried at 103oC overnight, and reweighed. The difference in the
wet and dry masses (W; M) was used to calculated Lf using the following equation:
)99.0(nA
WL f
ρ= (4)

54
where ρ is density of water at 20oC (M/L
3) = 0.9982 g/cm
3, n is the number of glass
beads = 100, A is the surface area per glass bead (L2). The surface area of the 2 mm
glass beads was calculated based on the diameter to be 12.56 mm2.
To determine Xf, the dried beads were then ignited at 500oC overnight, cooled in a
desiccator, and weighed. The difference in the dried and ignited masses is the volatile
suspended solids (VSS) content of the biofilm and was used to calculate the biofilm
density as follows:
f
fnAL
VSSX = (5)

55
Chapter 7: Results and Discussion
Bacterial Selection
The original experimental approach for this research project was based on the idea
that plants used in the bioreactor would essentially be cleansed of native bacteria
associated with their roots so that a pure DCE-metabolizing bacterial culture could be
maintained in the rhizosphere chamber. The rationale underlying the selection of this
approach was as follows: (1) it would help ensure that microbial oxidation of DCE
would occur in the bioreactor, and (2) the kinetics of DCE oxidation and microbial
growth would be defined and therefore could be used to select the reactor size and
flow rate and interpret the substrate removal. Therefore, a significant amount of
effort was devoted to the selection of a bacterium that would be appropriate for use in
the bioreactor. Specifically, it had to be able to oxidize DCE and form a biofilm.
Initial literature searches focused on methanotrophs because, as previously discussed,
it is known that in a natural wetland system, methanotrophs are able to mineralize
PCE daughter products through cometabolism while using methane as a growth
substrate. Many studies examining degradation of PCE daughter products with
methanotrophic bacteria have focused on Methylosinus trichosporium OB3b, because
of its high rates of chlorinated ethene degradation (e.g., van Hylckama Vlieg et al.
(1996) and Fitch et al. (1996)). Strain OB3b was a potential candidate for use in this
project; however, it does not readily form a biofilm in pure culture. Efforts to
improve strain OB3b’s ability to form a biofilm, including polymer flocculation and
application of antibiotics to reduce the competition of contaminating strains with

56
antibiotic resistant OB3b strains have shown only marginal improvements in biofilm
formation (Fitch et al., 1996). In addition, there are general problems with using
cometabolic processes to biodegrade DCE. That is, they can be difficult to sustain,
and supplying adequate concentrations of methane, which is rather insoluble, in the
feed is technically challenging. Therefore, other types of bacteria were considered.
As previously described, a bacterium capable of growing on DCE, strain JS666, was
recently identified (Coleman et al., 2002). JS666 was isolated from granular
activated carbon used in a pump-and-treat operation that was processing groundwater
contaminated with PCE, TCE, and DCE. Therefore, it seemed likely that JS666
would form a biofilm. JS666 oxidizes DCE at a relatively high rate compared to the
kinetics of other DCE-degrading organism reported in literature. For example, JS666
has a maximum specific substrate utilization rate (k) of 12.6 nmol/min/mg-protein. In
comparison, Methylomicrobium album BG8, a bacterium that transforms DCE
cometabolically, has a k of 0.12 nmol/min/mg-protein (Han et al., 1999). On the
other hand, JS666 appears to have a lower affinity for DCE compared to some
methanotrophic DCE degraders. The half-saturation constants for DCE (Ks) of
strains JS666 and BG8 are 1.6 µM and 0.8 µM, respectively. Little is known about
the mechanism involved in the biodegradation of DCE by JS666. However, Coleman
et al. (2002) suggested that the formation of a DCE epoxide by a monooxygenase
enzyme system is the first step in DCE oxidation.

57
Although JS666 had previously been shown to degrade DCE, the first criterion for
use in this research, it was not known if it would form a biofilm on the glass beads
used in the bioreactor. Therefore, beads placed in triplicate JS666 cultures that were
actively degrading DCE were washed with MSM and resupplied with DCE, as
previously described, to evaluate JS666’s ability to attach to the glass beads. Within
three to five weeks of the washing step, which should have removed suspended JS666
cells, DCE was degraded in all three bottles (Figure 7-1 and 7-2). This provided
strong evidence that JS666 adhered to the glass beads and was able to degrade DCE
in the attached form. Based on the results of this test, strain JS666 was selected for
use in the bioreactor because it appeared to be able to both degrade DCE and form a
biofilm.
0
50
100
150
200
250
300
350
400
450
500
0 20 40 60 80 100 120
Time (days)
DCE Concentration (µM)
Bottle 1
Bottle 3
Figure 7-1: Biofilm testing results for Bottles 1 and 3. Concentrations of DCE added on days
15, 29, 49, 70, 78, 84, 91, 98, and 105 were estimated. All other concentrations were
measured. Each data point represents a single measurement.
Day 50-
Media (and suspended
cells) removed and
replaced with fresh
media

58
0
100
200
300
400
500
600
0 20 40 60 80 100 120
Time (days)
DCE Concentration (µM)
Bottle 2
Figure 7-2: Biofilm testing results for Bottle 2. Concentrations of DCE added on days 21,
28, 35, 56, and 91 were estimated. All other concentrations were measured. Each data point
represents a single measurement.
Plant Selection
Considerable effort was also devoted to identification of a plant species that
demonstrated two key characteristics: (1) an ability to supply sufficient oxygen to the
rhizosphere to support aerobic bacterial respiratory needs and DCE oxidation, and (2)
a morphology that conformed to the physical conditions of the bioreactor. In
particular, the ability to develop an extensive root structure was desirable to
maximize the surface area for oxygen release and biofilm growth. A short shoot was
also required to fit the plant stem and leaves inside the foliar chamber. It was also
thought that it would be desirable from an ecological perspective to choose a Mid-
Atlantic native, non-invasive wetland plant that traditionally is included in
Day 56 –
Media (and
suspended cells)
removed and
replaced with
fresh media

59
constructed wetlands. Therefore, the plants initially considered included softstem
bulrush (Schoenoplectus tabernaemontani K.C. Gmel. Palla), soft rush (Juncus
effusus L.), broad-leaf cattail (Typha latifolia L.), and Pennsylvania smartweed
(Polygonum pensylvanicum L.). These plants were also considered in part because
they were expected to supply different amounts of oxygen to the rhizosphere because
they varied in terms of their classification as obligate or facultative wetland species,
their ability to tolerate flooded conditions, morphologies and other factors. However,
none of these plants could be grown in a way that developed an extensive root
structure with a short shoot.
The evaluation of plant candidates next turned to other species and ultimately resulted
in the selection of common reed (Phragmites australis (Cav.) Trin. ex Steud.), an
obligate wetland species, for use in this project. Common reed was selected because
it is known to oxygenate the rhizosphere; in fact, the oxygen concentrations in the
proximity of the root can reportedly reach the same concentration as found in the
atmosphere (Massacci et al., 2001). As measured by Armstrong et al. (2000), the
oxygen release from a 160-mm-long P. australis root (approximately 1.3 mm radius)
was 60 ng/cm2 root surface/min at 7 mm from the root tip. In addition, P. australis
can morphologically conform to the physical requirements of the bioreactor
experiments. Plants with mature extensive roots can be pruned to stimulate growth of
new, and thus short, shoots from their roots. It is recognized that P. australis can
become an invasive species, resulting in P. australis monoculture wetlands, which is
ecologically undesirable. However, this plant can be beneficial because it has been

60
able to colonize contaminated areas whereas few other species can survive (Massacci
et al., 2001).
Plant Treatment
Prior to use in the bioreactor, the roots of appropriately sized P. australis plants were
treated to significantly reduce levels of indigenous bacteria unless otherwise noted
below. Various methods reported in literature were evaluated for use in the study
before the final approach (described below) was adopted. The goal of the treatments
was to remove as many of the bacteria as possible without causing irreversible
damage to the plant. The methods that were tested included various concentrations of
hypochlorite treatment, with and without rotary shaking or sonification; UV treatment
(two 10 minute exposures, which was based on the typical amount of time required to
sterilize inanimate objects); and antibiotic treatment with vancomycin (Mehta et al.,
1959). The amount of bacterial inactivation and plant health were evaluated for each
treatment. Bacterial inactivation was measured using plate counts of root pressings
on full-strength TSA plates made before and after a treatment (Dandurand and
Knudsen, 2002). Plant health was evaluated qualitatively. No treatment resulted in
complete bacterial inactivation, although a one or two log reduction in the colony
counts was observed for most treatments. However, in most cases, the plant yellowed
and died shortly after treatment. The only treatment that did not irreversibly impair
plant health involved treatment with hypochlorite (10%) and rotary platform shaking
(120 RPM, Baxter S/P® Rotator V), as described above. This method resulted in an
approximately ten-fold reduction in the number of colony forming units.

61
Bioreactor Operation
The bioreactor system described above was constructed and mechanically tested
without any biological components by eliminating leaks and maintaining a constant
water level in the rhizosphere chamber. Following the mechanical testing, a treated
P. australis individual was placed in the bioreactor to confirm that an individual plant
could survive in the reactor. Following insertion of the plant, the bioreactor was
operated continuously for over six weeks without major operational difficulties.
Oxygenated media was supplied for the first four weeks during which time the plant
grew. Four new leaves emerged after the plant was placed in the reactor, although the
original leaves turned partially yellow. After three and a half weeks of operation,
there was significant yellowing of the newly emerged leaves. However, the top most
leaves remained mostly green, and new leaves continued to emerge at the top of the
plant. A few days after the emergence of the second round of new leaves,
deoxygenated media was supplied to the reactor to determine if the plant could
survive on anoxic media. The reactor was operated with deoxygenated media for
over two weeks, and during this time the plant survived. Some new growth was
observed at the top of the plant. However, the partially yellow leaves became
completely yellow. These results showed that the bioreactor could function
hydraulically as designed, and that the selected plant could survive in the system.
Tracer Study
A non-reactive tracer study was performed on the rhizosphere chamber (as described
above). The experimentally measured effluent concentrations were compared to the

62
predicted results for a flow-through completely-mixed bioreactor, which were based
on a mass balance of the system, according to:
QSQSdt
dSV oT −= (6)
where VT is the total volume (L3). The influent concentration of fluorescein (So) was
2.3 mg/L. The total volume (VT) was 142 mL, which included the pore-volume (Vv =
88.2 mL), the volume above the beads (37 mL), and the volume of the recycle tubing
(21 mL for 122 cm of 0.47 cm I.D. tubing). The pore volume was determined using
the total volume within the bead zone (V = 210 mL as described above) and the
measured porosity (0.42 as determined using a displacement method). The flow rate
was 16 mL/hr, which yielded a hydraulic detention time of 8.9 hours. As shown in
Figure 7-3, the experimental results closely matched the predicted concentrations
calculated with Eq. (6). This good fit suggests that the rhizosphere chamber did
behave as a hydraulically completely-mixed reactor. Further, the results of the tracer
study indicate that steady state was reached in approximately three days when no
reactions were occurring.
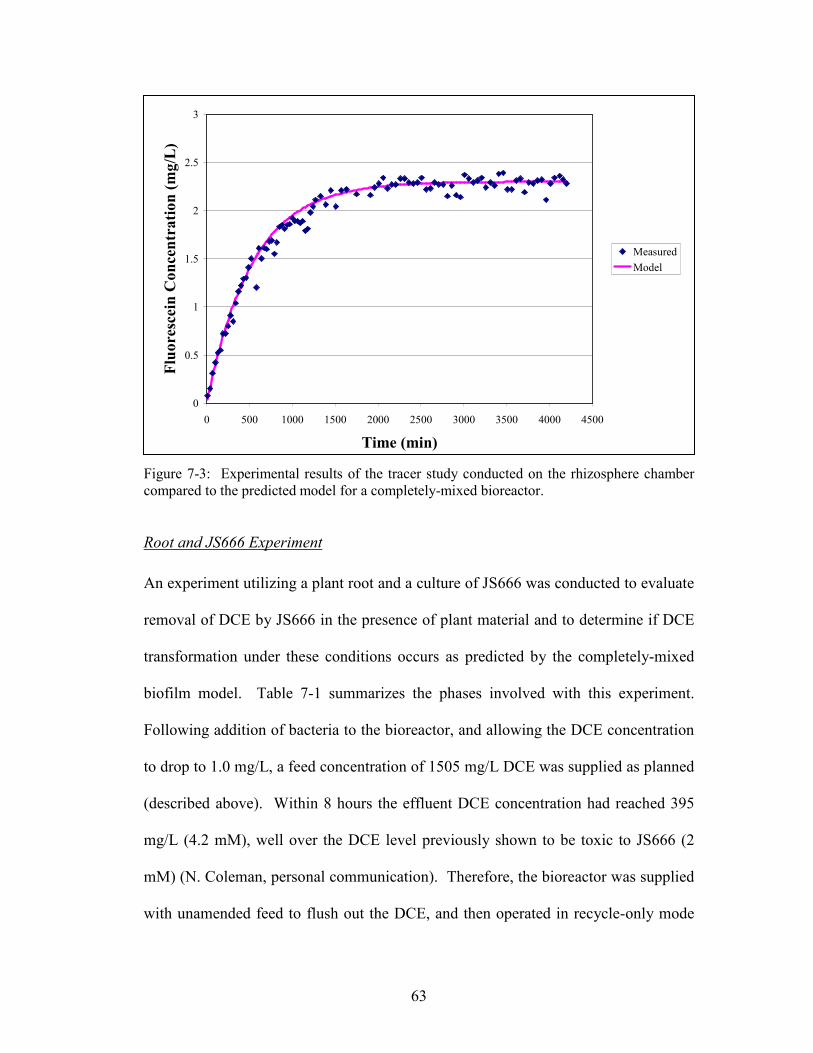
63
0
0.5
1
1.5
2
2.5
3
0 500 1000 1500 2000 2500 3000 3500 4000 4500
Time (min)
Fluorescein Concentration (mg/L)
Measured
Model
Figure 7-3: Experimental results of the tracer study conducted on the rhizosphere chamber
compared to the predicted model for a completely-mixed bioreactor.
Root and JS666 Experiment
An experiment utilizing a plant root and a culture of JS666 was conducted to evaluate
removal of DCE by JS666 in the presence of plant material and to determine if DCE
transformation under these conditions occurs as predicted by the completely-mixed
biofilm model. Table 7-1 summarizes the phases involved with this experiment.
Following addition of bacteria to the bioreactor, and allowing the DCE concentration
to drop to 1.0 mg/L, a feed concentration of 1505 mg/L DCE was supplied as planned
(described above). Within 8 hours the effluent DCE concentration had reached 395
mg/L (4.2 mM), well over the DCE level previously shown to be toxic to JS666 (2
mM) (N. Coleman, personal communication). Therefore, the bioreactor was supplied
with unamended feed to flush out the DCE, and then operated in recycle-only mode

64
for several days. Next a second batch of JS666 was added in the event that the toxic
levels of DCE had killed off the first batch of added JS666. The DCE concentration
in the feed was reduced to 75 mg/L (790 µM), which was below the toxic level;
however, there was still little removal of DCE observed. The feed was then further
reduced to 10 mg/L, a level that was still significantly greater than Smin. This feed
concentration is still of environmental relevance, because many sites are
contaminated with concentrations of DCE in this range (Wiedemeier, 1999). Other
laboratory studies of microbial DCE biodegradation also used concentrations in this
range (e.g. Kassenga et al., 2003; Suarez and Rifai, 1999). At this feed concentration,
approximately 1 mg/L removal of DCE was consistently observed over a time period
of five days. This removal was assumed to be attributed to JS666 alone.
Table 7-1: Phases of operation incorporated with the root & JS666 experiment
Operation
Phase
Days of
Operation
Feed Characteristics Purpose
1 0-4 Aerated, DCE free Establish system
2 4-11 No Feed Add JS666
3 12 Aerated, amended with
DCE (1500 mg/L)
Measure steady-state
removal of DCE
4 13-18 Aerated, DCE free Reduce DCE
concentration
5 19-20 No Feed Add JS666 (2nd batch)
6 21-28 Aerated, amended with
DCE (75 mg/L)
Measure steady-state
removal of DCE
7 28-49 Aerated, amended with
DCE (10 mg/L)
Measure steady-state
removal of DCE

65
Based on the results of this experiment, it was apparent that there was not sufficient
attached biomass to achieve the removal predicted by the biofilm model using JS666
substrate removal kinetics and assumed Xf values (described above) or that the ability
of JS666 to degrade DCE was inhibited in the bioreactor environment. In calculating
the predicted DCE removal, a typical biofilm density of 40 mg VSS/cm3 (Rittmann
and McCarty, 2001) was assumed. Based on 1 mg/L removal of DCE, Eq. (7) was
solved for Jss.
aV
SSQJ OTSS
)( −= (7)
Eq. (8) was solved for Xf, assuming Lf was equal to the thickness of one bacterium
(1µm).
'b
YJLX SS
ff = (8)
Where b’ is the overall specific loss rate for the biofilm (T-1) and Y is the JS666 true
yield coefficient (MxMs-1) (6.1 g protein/mol cDCE) (Coleman et al., 2002). Using
Eq. (7) and (8), and additional equations provided by Rittmann and McCarty (2001)
to solve for b’, the biofilm density was calculated as 1.39 mg VSS/cm3. This value is
below the normal range of 10 – 100 mg VSS/cm3, implying a non-continuous biofilm
(Rittmann, 1993). Based on these results, an analysis was conducted using Eq. (7)
and (8) to determine if lowering the feed flow rate would improve the removal with a
DCE feed concentration of 10 mg/L, while maintaining the other operating
parameters (e.g. recycle rate). This analysis showed that reducing the flow rate would
reduce the effluent concentration by providing additional time for JS666 to degrade
the DCE. Therefore, the feed rate was reduced to the lowest reasonable setting on the

66
feed pump (approximately 6 ml/hr). At this flow rate, a DCE effluent concentration
of 7.5 mg/L was predicted. Table 7-2 summarizes the operating parameters of the
bioreactor in subsequent experiments, and reflects these operational changes.
Table 7-2: Operating parameters of the continuous-flow, completely-mixed
bioreactor.
Characteristic Value
Active length of reactor 107 mm
Diameter of reactor 5 cm
Cross-sectional area of reactor, Acs 19.6 cm2
Volume of reactor, V 210 cm3
Diameter of glass beads, dp 2 mm
Surface area of a glass bead, A 12.56 mm2
Specific surface area, a 18 cm-1
Porosity, ε = Vv/V 0.42
Pore volume, Vv 88.2 cm3
Feed flow rate, Q 6 cm3/hr
Detention time, θ = Vv/Q 14.7 hr
Recycle ratio, QR/Q 75
Time of one pass through the column, Vv/ (Q + QR) 11.6 min
Superficial velocity of fluid, v = (Q + QR)/Acs 556 cm/d
To explain the low amount of DCE removal observed, the possibility that JS666 was
washing out and was not attaching to the beads to a significant extent was examined
by analyzing the effluent for the presence of JS666. First, 0.1-mL of effluent from
the wasting line was plated and showed few colonies of JS666 (< 10 CFU/ml).
Additionally, 1-mL samples from the effluent were inoculated in 50 mL MSM to test
for DCE removal. It took approximately six weeks for removal of the first spike of
67
DCE to occur, and little biomass was observed in the cultures. This time period was
significantly longer than the time required for removal of a similar concentration of
DCE in the batch cultures. This seemed to indicate that few cells of JS666 were
washing out and therefore, this did not explain the low DCE removal.
Another potential explanation for the low amount of DCE removal is that JS666
preferentially utilizes alternative substrates, i.e. plant exudates, in lieu of DCE. The
tendency of JS666 to use non-chlorinated organic substrates preferentially has
previously been observed (N. Coleman, personal communication) and was observed
in this study in batch cultures of JS666 supplied with 50 mM ethanol and 400 µM
DCE. In these cultures, removal of DCE was not observed although there was
significant biomass present. Therefore, the bioreactor effluent in the root and JS666
experiment was tested for possible alternative substrates by measuring its COD
content, which was 43 mg/L. The COD measurement suggests that the plant root was
releasing exudates that could possibly serve as alternative substrates for JS666.
Therefore, it is possible that the presence of the plant may have had a negative impact
on DCE removal by JS666.
Additionally, JS666 is highly subject to predation by other microorganisms (N.
Coleman, personal communication), which also could potentially have reduced the
density of JS666 in the reactor. Spread plates prepared using reactor effluent samples
revealed other colony morphologies, indicating that other microorganisms were
present in the reactor, in addition to JS666. This was not surprising because the

68
process used to remove native microorganisms from the plant surface was shown to
be less than 100% effective.
Abiotic Control Experiment
The bioreactor was next operated without any biological components (plants or
microorganisms) to quantify abiotic loss of DCE in the bioreactor system. The
phases of this experiment are outlined in Table 7-3. Because the feed DCE
concentration decreased over time as the level in the feed bottle decreased due to
volatilization of a decreasing total mass of DCE, feed and effluent samples were
compared to determine the removal of DCE in the bioreactor. Once the removal had
appeared to level-off, five influent and effluent samples were collected on four
consecutive days (3 to 6) to test whether steady state had been achieved (Figure 7-4).
Table 7-3: Phases of operation incorporated in the abiotic control experiment.
Operation
Phase
Days of
Operation
Feed Characteristics Purpose Figure
1 0 Aerated, DCE-Free Establish System NA
2 0-6- Aerated, amended
with DCE
Measure steady-
state removal of
DCE
7-4
Steady-state removal of DCE was confirmed through a statistical analysis. The
statistical analysis tested if the slope of a line drawn through the last five data points
of DCE removal was equal to zero. A slope of zero would indicate steady-state
removal of DCE. The statistical test produced a t-statistic of 0.34 with a
corresponding p-value of 0.38; therefore, the system was determined to be at steady

69
state (95% confidence interval). State-state DCE removal averaged 1.0 mg/L or
12.7% removal.
0
1
2
3
4
5
6
7
8
9
10
0 2 4 6
Day
DCE (m
g/L)
Effluent Concentration
Influent Concentration
Removal
Figure 7-4: Influent and effluent DCE concentrations and DCE removal in a bioreactor
without any biological components supplied with DCE-amended aerated media. Each data
point represents the concentration in a single influent or effluent sample obtained on the same
day (or the difference in these concentrations).
The abiotic removal observed was most likely due to interactions between DCE and
the reactor tubing and septum used to seal the top of the rhizosphere chamber. Loss
of chlorinated compounds in the presence of Teflon tubing has been observed for
TCE (Wrenn, 1992) and polychlorinated biphenyls (Cseh, et al., 1989). In the case of
TCE, Wrenn (1992) found that the Teflon tubing became saturated with the
chlorinated solvent relatively quickly, and TCE losses became relatively minor after a
short contact period. In a study conducted by Kovacs and Kampbell (1999), loss of
TCE and PCE was observed in vials containing Teflon coated septum. For a septum

70
having a surface area approximately equal to that used in this study, there was
approximately 12% and 34% loss of TCE and PCE, respectively, after an exposure
period of 14 days at 22oC. Based on these observations and others, the authors
concluded that larger, less water-soluble molecules were more highly sorbed by the
Teflon. Assuming this trend holds for DCE, which is smaller and more water-soluble
than TCE or PCE, then it would be expected that less than 12 to 34% DCE in the
reactor feed would be sorbed by the Teflon-coated septum used in this study. This is
consistent with a total observed loss of 12.7%, which presumably reflects sorption of
DCE to both the Teflon-coated septum and the Teflon tubing.
JS666 Only Experiment
After completion of the abiotic experiment, JS666 was added to the bioreactor to
specifically evaluate the role of JS666 in removing DCE in the rhizosphere. Table 7-
4 outlines the phases incorporated into the JS666-only experiment. 50 mL of a JS666
culture (106 CFU/ml) was added, as described above. It was soon observed that there
was little DCE removal above abiotic loss, although this can not be examined
statistically because steady-state DCE removal never occurred in the JS666 only
experiment. In fact, the removal of DCE slowly decreased in the days following the
start of the experiment, resulting in less than 10% removal (Figure 7-5). A second
50-mL batch of JS666 (105 CFU/ml) was added to the reactor on day nine, in an
attempt to increase the biomass concentration and stimulate DCE removal. The
process of adding bacteria was modified to allow a longer attachment period (40
hours) in this case, to promote biofilm formation. Further, to ascertain if the bacteria
were failing to attach and were instead washing out of the reactor, a 0.1 mL of sample

71
from the wasting line was collected and plated on ¼-TSA plates for several days after
the reactor operation was restored to a flow-through mode. The spread plate results
indicated that within a few hours after starting flow, little washout was occurring;
however, during the next three consecutive days, there was significant washout, as
indicated by a large number of colonies on the plates (> 300 CFU per plate).
Concurrent with the washout, little removal of DCE was observed. In fact, the DCE
removal was again less than that observed during the abiotic experiment, and it
ultimately fell to 0.37 mg/L or 5.1% DCE removed, compared to 1 mg/L or 12.7%
removal in the abiotic experiment (Figure 7-5). It is not clear why less DCE removal
was observed in the presence of JS666 than in the abiotic experiment. Possible
explanations include that the Teflon tubing and/or septum had become saturated with
DCE and there was no further abiotic removal of DCE and there may have been DCE
contained with the inoculum.
Table 7-4: Phases of operation incorporated into the JS666-only experiment
Operation
Phase
Days of
Operation
Feed Characteristics Purpose Figure
1 0 No Feed Add JS666 7-5
2 0-6 Aerated, amended
with DCE
Measure steady-state
removal of DCE
7-5
3 6-8 No Feed Add JS666 7-5
4 8-10 Aerated, amended
with DCE
Measure steady-state
removal of DCE
7-5
After flushing the reactor for three days, the bioreactor was disassembled to collect
samples of beads for measurement of the biofilm parameters, Lf and Xf. No visible
72
biofilm was observed on the beads. Three 100 bead samples were collected, from the
top, middle, and bottom sections of the bioreactor column. Lf values of 1.4 µm, 0.56
µm and 0.56 µm were measured in the top, middle, and bottom sections, respectively,
using Eq. (4). Xf values of 2.997 x 10⁷ mg/L, 0 mg/L, and 1.4 x 10
7 mg/L were
determined for the top, middle, and bottom sections, respectively using Eq. (5).
These results suggested that any attached JS666 biomass was present in a thin, but
dense biofilm. In general, thin biofilms tend to be dense, so in general the
combination of a small Lf and a large Xf was not surprising. However, the Xf values
are orders of magnitude larger than values reported in other studies. For example,
Rittmann et al. (1986) measured values of biofilm thickness and density in the range
of 18 to 440 µm and 13.1 to 58.0 mg/L, respectively, in an aerobic biofilm reactor
containing a mixed culture. Therefore, it seemed likely that the Xf values measured
in this study were not accurate. In fact, after reviewing the procedures that were used
to measure Xf, it was determined that some mistakes were probably made.
Specifically, the beads were not cooled in a desiccator after the first heating period,
which may have allowed any biomass and/or the beads to absorb atmospheric water,
impacting the weight and, thus, the calculated biofilm parameters. In addition, Xf is a
function of Lf (Eq. 5), and because Lf is so small, it is difficult to accurately measure
this value, and small changes in Lf can have a large impact on the magnitude of Xf.
Despite these problems, it is likely that there was very little biofilm formation on the
glass beads and that, at best, it was patchy throughout the bioreactor.

73
Based on the low DCE removal, the observed washout of bacteria in the JS666-only
experiment, and the biofilm measurements, it was concluded that JS666 was unable to
form a significant biofilm in the bioreactor. This was unexpected based on the results
of the batch studies in which JS666 appeared to attach to the glass beads and the root-
JS666 experiment in which little washout was observed. However, the conditions in
the batch experiments did not replicate the bioreactor conditions, particularly the
shear resulting from the continuous flow and high rate of recycle. This could explain
why the bacteria apparently were able to form a biofilm under quiescent batch
conditions, but not in the reactor. The fact that little washout was observed in the
root-JS666 experiment may suggest that the root provided a more favorable
attachment surface compared to the glass beads.
0
2
4
6
8
10
12
0 5 10
Day
DCE (m
g/L)
Effluent
Concentration
Influent
Concentration
Removal
Figure 7-5: Influent and effluent DCE concentrations and DCE removal in a continuous-
flow, completely-mixed biofilm reactor containing JS666 only. Each data point represents
the concentration in a single influent or effluent sample obtained on the same day (or
difference in concentrations of the two samples).
First JS666 addition Second JS666
addition

74
The role of surface roughness in determining whether or not bacteria will attach to a
given surface has frequently been reported in the literature. Increased surface
roughness probably often enhances biofilm development because microbial
attachment initiates in crevices, which are protected from fluid shear and more
prevalent in rough surfaces than in smooth surfaces (Annachhatre and Bhamidimarri,
1992). Thus, the glass beads may not have been rough enough to provide sufficient
protected crevices for biofilm initiation, although they are commonly used for this
purpose in laboratory bioreactor studies. Therefore, an attempt was made to identify
a material that would provide a better attachment surface for JS666 and could be
purchased in the form of 2-mm beads that could be incorporated into the rhizosphere
chamber with the glass beads. Stainless steel is commonly found to be contaminated
with bacteria in the food industry (Boulangé-Petermann, 1996) and stainless steel
(grade 304L) has a greater surface roughness than glass (Faille et al., 2002).
Therefore, it was decided that 2-mm (grade 316) stainless steel beads should be added
in future experiments conducted with JS666. The surface of the steel beads was
manually scratched with a file to increase surface roughness. 316 grade stainless steel
was selected because it is a softer material and was relatively easy to score.
Other factors could have contributed to the inability of JS666 to attach to the glass
beads in the absence of a plant root. For example, during the root-JS666 experiment,
the reactor operated in recycle-only mode (no feed) for approximately seven days
following the addition of the bacteria to allow the DCE levels to decrease. In
comparison, the reactor operated in recycle-only mode for approximately two hours

75
as the recycle rate was ramped up to full speed, following addition of the bacteria in
the JS666-only experiment. The extended period of time of operation in recycle-only
mode in the root/JS666 experiment may have provided additional opportunities for
the planktonic JS666 to attach to surfaces. Therefore, any future experiments
conducted with JS666 should incorporate a longer recycle-only period following
addition of the bacteria. It should be noted that relatively few effluent samples of the
root-JS666 experiment were obtained for analysis of CFU. Therefore, it is possible
that significant washout did occur in the root and JS666 experiment but was not
detected with the sampling frequency used.
Plant and Associated Microorganisms Experiment (Trial 1)
Given the apparent inability of JS666 to attach to the glass beads under flow-through
conditions, no further work with JS666 was conducted in this study. Therefore, an
experiment was next conducted with a whole P. australis individual in the bioreactor.
The surface of the plant root was treated as described above to reduce the size of the
native root microorganisms populations before it was inserted into the rhizosphere
chamber. In addition to glass beads, stainless steel beads (approximately 1000) were
added to the rhizosphere chamber. A series of tests were conducted with this plant to
evaluate the importance of different potential roles for wetland plants in removing
DCE and related compounds from the rhizosphere. Specifically, the evaluations were
designed to determine: (1) the amount of DO released by the plant, (2) the production
of plant exudates (measured as COD), (3) the effect of the plant on DCE levels, and
(4) the fate of the DCE using radiolabeled substrate. Table 7-5 outlines the phases
incorporated into this experiment to accomplish these evaluations.

76
After the plant was inserted into the rhizosphere chamber, the bioreactor flows, both
gas and liquid, were initiated in the start-up phase (Phase 1), which included leak
testing the seal between the rhizosphere and foliar chambers. During this time,
aerated DCE-free feed was supplied. Once the bioreactor operation was established,
an effluent sample was collected to determine plant exudate release under aerated
feed conditions (discussed below). Next, anoxic media was supplied to the bioreactor
so that DO and exudate production could be measured under environmentally-
relevant conditions (Phase 2). In order to best explain the data, the DO data from
phase 2 are discussed first, followed by the plant exudate data from phase 1 and 2.
Table 7-5: Phases of operation incorporated into the plant experiment (Trial 1)
Operation
Phase
Days of
Operation
Feed Characteristics Purpose Figure
1 0-15 Aerated, DCE-Free 1) Establish reactor,
including seal
2) Measure exudate
production
NA
7-7
2 16-22 Anoxic, DCE-Free 1) Measure steady-
state DO release
2) Measure exudate
production
7-6
7-7
3 23-32 Anoxic, amended
with unlabeled DCE
Measure steady-state
DCE removal
7-8
4 32-40 Anoxic, amended
with labeled DCE
Measure steady-state
[14C]-DCE removal
7-9
The percent DO of the bioreactor influent (measured following the break tube [Figure
6-1]) apparently never reached zero, in part because the media supply could not be
fully deoxygenated. Media supply DO levels ranged from 0.7 to 1.9% (0.3 to 0.82

77
mg/L) DO. Even more importantly, the bioreactor could not be assembled without
entrapping some air in the break tube in the feed line, which undoubtedly contributed
to the DO measured in the reactor influent. Over time the influent DO concentration
decreased from 3.8 to 2.8 mg/L, as shown in Figure 7-6, indicating that the air in the
break tube was slowly dissolving into the feed and being depleted. When the influent
DO level was 3.8 mg/L, it was considered sufficiently low enough to measure the
amount of DO released by the plant. Influent and effluent DO levels were measured
from day 16 through 22. On day 21 it appeared that steady-state with respect to
oxygen release had been reached, based on the statistical test conducted (p > 0.05).
The results are shown in Figure 7-6 and indicate that there was an average 2.48 mg/L
DO net increase in the rhizosphere during the steady-state period (days 18-22).
0
1
2
3
4
5
6
7
8
15 17 19 21 23
Day after initial start-up
Dissolved Oxygen (mg/L)
Influent Concentration
Effluent Concentration
Net Release
Figure 7-6: Influent and effluent oxygen concentrations and net change in oxygen in a
continuous-flow, completely-mixed bioreactor containing a P. australis individual and
associated native microorganisms and fed DCE-free anoxic media (Trial 1). Each data point
represents the concentration in a single influent or effluent sample obtained on the same day
(or the difference in the concentrations in these samples).

78
The net DO increase is the difference between the effluent and influent DO values
and takes into account processes occurring in the reactor that can both increase DO
(e.g., plant root aeration) and decrease DO (e.g., endogenous microbial respiration).
A previous study by Massacci et al. (2001) indicated that the oxygen concentrations
in the proximity of a P. australis root can reach the same concentration as found in
the atmosphere (20.9%). Based on this information, it was anticipated that the
effluent DO concentrations would reach levels close to atmospheric; however, the
effluent concentration averaged 14.0% (5.74 mg/L) during the DO testing period.
Possible explanations for a lower than anticipated DO content include lower than
normal aeration by the plant and plant root and respiration by microorganisms and/or
roots.
Significant numbers of microorganisms were introduced to the bioreactor with the
plant and subsequently disassociated from the plant. To evaluate the role of
microorganisms in decreasing the DO levels, spread plates were prepared with
effluent samples five days after the initial start-up. Microorganisms were present at
concentrations much greater than 300 CFU/ml and therefore were likely consuming a
significant amount of the oxygen released by the plant. Respiration by root matter
may also have decreased the net oxygen released.
In addition to microbial respiration leading to a lower than anticipated DO
concentration in the bioreactor, it is possible that the plant in the bioreactor may not
have been able to aerate the root zone to the same extent as a plant in natural

79
conditions. Several observations support this statement. First, the approximately one
foot tall shoot in the bioreactor was considerably shorter than that of a full-grown
plant (six to seven feet tall), which reduced the amount of surface area available for
intake of oxygen that could be transported to the root zone via passive diffusion.
Second, the old shoots, which were cut off before placing the plant in the bioreactor
and are capable of generating convective air flow through P. australis that contributes
to root aeration (Colmer, 2003) were below the septum in the rhizosphere chamber.
As a result, convective air flow presumably could not occur in the bioreactor plant,
reducing its overall aeration capacity. There was evidence that the cut shoots could
contribute to root aeration in the bioreactor because bubbles were released from the
cut shoots during the start-up period. However, bubbling was undesirable because it
had a negative impact on the hydraulic operation of the reactor; therefore, caulk was
applied to the cut shoots to stop the bubbling. This likely reduced or even eliminated
their ability to contribute to rhizosphere aeration. Finally, the health of the plant
declined after it was placed in the bioreactor, as revealed by the yellowing of the
leaves and stems; however, a new green shoot was emerging during this period of
testing. Presumably, a green and healthy plant transmits more oxygen to the roots
compared to a less healthy plant or a shoot which has not fully developed.
Abiotic factors may also have contributed to the net release of DO; however, this has
not yet been tested. Assuming that the DO release observed was due solely to plant
activity, the observed release of oxygen into the rhizosphere chamber has important
implications. Most importantly, it indicates that P. australis has the capability to

80
generate appropriate redox conditions for aerobic microorganisms. This suggests that
if the appropriate aerobic microorganisms are present, the potential exists for
oxidation of DCE. Depending on the biofilm density present in the reactor,
microbially-mediated oxidation of DCE was expected to represent a significant
percent of the 14[C]-DCE removal in phase 4 of the experiment.
Influent and effluent COD concentrations were measured periodically during the
period of DO release measurements, in addition to the COD measurement made prior
to the period of the DO test, as described above to test for plant exudates. As shown
in Figure 7-7, the effluent COD concentration was higher than the influent
concentration on two out of the three days when both measurements were made. One
pair of measurements was taken when the reactor was supplied with aerated feed (day
8), and the other pair was taken during a period of anoxic feed (day 22). The COD
measured in the feed on all sampling days was most likely the result of the oxygen
demand exerted by the various inorganic chemicals present in the media. The
effluent COD was approximately equal to the influent COD on day 17, which was
two days after anoxic feed was initiated (Figure 7-7). This was due to an increase in
the influent COD concentration between days 8 and 17, rather than a decrease in
effluent COD during this period. A likely explanation for the increase in the influent
COD concentration is the switch to anoxic media. To directly test this idea, a fresh
batch of deoxygenated media was prepared and analyzed for COD concentration and
then the media was aerated and reanalyzed for COD concentration. The
deoxygenated media was shown to have a higher COD content, by at least 6 mg/L,

81
compared to the aerated media. As can be seen in Figure 7-7, this is consistent with
the results of the next set of measurements made (day 22) after the switch to anoxic
feed. The effluent COD was again significantly higher than the influent COD
concentration, resulting in a net COD release of 19.5 mg/L. The overall net increase
of COD was presumably a result of plant exudates being released into the rhizosphere
chamber. At least some of the exudates could presumably serve as a carbon source
(growth substrate) for the native root microorganisms and, thus, cometabolism of
DCE by organisms growing on exudates could conceivably occur. However,
competition between DCE and the growth substrates (exudates) for the enzymes
involved in DCE cometabolism and other factors could decrease the extent of DCE
cometabolism actually observed.
0
10
20
30
40
50
0 10 20 30
Day after initial start-up
COD (mg/L)
Influent
Concentration
Effluent
Concentration
Figure 7-7: Influent and effluent COD concentrations in a continuous-flow, completely-
mixed bioreactor containing P. australis plant and native microorganisms in a bioreactor
supplied with both DCE-free aerated and anoxic media (Trial 1). Each data point represents
the concentration in a single influent and single effluent sample obtained on the same day.
Switch to
anoxic media
16

82
On the 23rd day after initial start-up, after the DO and COD measurements were
completed, unlabeled DCE was added to the reactor feed. As previously done, the
influent and effluent concentrations were monitored to determine the net DCE
removal. For the first few days, it was observed that the influent DCE concentration
decreased more rapidly than observed in the past. For example, between days 23 and
24, there was a decrease of 2 mg/L (Figure 7-8). In previous experiments, the
maximum daily decrease seen was 0.5 mg/L, which is nearly an order of magnitude
lower. This “normal” decrease in aqueous DCE concentration was thought to be due
to equilibrium of a decreasing total DCE mass in the feed bottle between the gas and
aqueous phases. On day 24, additional DCE was added to the feed bottle to
compensate for this loss, causing the influent DCE concentration to increase to 9
mg/L on day 25. However, by the following day, the influent DCE concentration had
decreased again to 7.6 mg/L. One potential explanation for the higher-than-normal
decrease in influent DCE concentrations might have been loss of DCE through the
nitrogen supply line that connected the feed supply bottle and the constant pressure
vessel (Figure 6-1) and was used to maintain a constant pressure in the feed supply
bottle. Up to this point, the constant pressure system had only been used during the
period of the DO experiment and not in any previous experiments. The rapid
decrease in the influent DCE concentration was undesirable because it complicated
measurement of DCE removal. Therefore, the constant pressure system was
disconnected on day 26 (Figure 7-8). The constant pressure system was disconnected
by using isolation valves so that oxygen could not be introduced to the feed supply
bottle. Steady-state removal of DCE began within one day after disconnecting the

83
constant pressure system, as determined by the statistical analysis (p > 0.05).
Removal of unlabeled DCE was monitored for six days and averaged 1.88 mg/L, or
30.5% removal, during this period. Based on the results of the abiotic control
experiment, removal of 12.7% of the influent DCE was presumably due to abiotic
losses. Therefore, removal of 17.8% of the influent DCE was probably attributable to
the presence of the plant and/or associated microorganisms.
0
1
2
3
4
5
6
7
8
9
10
22 24 26 28 30 32
Day after initial start-up
DCE (m
g/L)
EffluentConcentration
InfluentConcentration
Removal
Figure 7-8: Influent and effluent DCE concentrations and DCE removal in a continuous-
flow, completely-mixed bioreactor containing a P. australis individual and associated
microorganisms supplied with DCE (unlabeled)-amended anoxic media (Trial 1). Each data
point represents the concentration in a single influent or effluent sample obtained on the same
day (or the difference in the concentrations in these samples).
To improve our understanding of the mechanisms contributing to the observed
removal of DCE in the presence of P. australis and microorganisms introduced with
plant, 14[C]-DCE was added to the feed supply bottle on the 32
nd day after initial start-
Constant
Pressure
System
Disconnected
84
up of the bioreactor. The reactor was sampled as described above to capture the 14C
fractions produced in the liquid, gaseous, and solid phases. The 14C content in the
liquid fractions was measured daily, the gaseous CO2 traps were measured and
exchanged daily, and the remaining fractions, gaseous DCE and plant and biofilm
solid fractions, were measured at the conclusion of the experiment after steady-state
14[C]-DCE removal was reached. Figure 7-9 shows the daily
14C content in the liquid
effluent fractions including, volatile 14C (presumably
14[C]-DCE),
14CO2,
14C-
biomass, and 14C-labeled non-volatile residues;
14C influent activity (presumably
14[C]-DCE); and
14[C]-DCE removal over a eight day period. During this period,
steady-state with regard to 14[C]-DCE removal was reached, as determined by
statistical analysis (p > 0.05). The average 14[C]-DCE removal was 9.28 µCi/L or
31.4% during the steady-state period, consistent with the removal of unlabeled DCE.
The measurement of 14[C]-DCE and
14CO2 from the liquid fractions, was
presumptive; however, the presence of 14[C]-DCE and
14CO2 was confirmed in a
single sample through GC analysis and precipitation of 14CO2 using Ba(OH)2,
respectively. DCE was the only volatile compound detected in both the effluent and
influent using GC. The precipitation of 14CO2 as BaCO3 resulted in a
14C activity in
the NaOH trapping vial (described above) of 36.58 DPM, which was similar to the
activity in the blank that was treated in the same manner (27.68 DPM). In
comparison, the activity in the presumptive 14CO2 fraction collected on the same day
of this test was 1083 DPM. Thus 99% of the activity in this fraction could actually be
attributed to 14CO2.

85
0
5
10
15
20
25
30
35
32 33 34 35 36 37 38 39 40 41
Day after initial start-up
14C Content (µCi/L)
Influent 14C-
DCE
Volatile 14C-fraction (DCE)
in the effluent14CO2 in
effluent
14C-biomass in
effluent
14C-labeled non-
volatile residues
in effluent14C-DCE
Removal
Figure 7-9: Influent 14[C]-DCE and
14C activity associated with volatile, CO2, biomass, and
non-volatile residue fractions in the effluent and 14C-DCE removal, in a continuous-flow,
completely-mixed bioreactor containing a P. australis individual and associated
microorganisms supplied with14[C]-DCE-amended anoxic media (Trial 1). Each data point
represents the average of duplicate analyses.
After steady-state 14[C]-DCE removal had been reached and all fractions had been
analyzed for their 14C content, a mass balance on the
14C was conducted to determine
the percent 14C recovered in each fraction, the total recovery of the
14C supplied to the
reactor, and the percent removal of 14[C]-DCE. This analysis was conducted over the
steady-state period (days 34-40). Because those fractions that were collected at the
conclusion of the experiment (e.g. biomass) had to be characterized in terms of 14C
activity per experiment, the activity in the fractions collected on a daily basis (e.g.
liquid fractions) also had to be expressed in terms of 14C activity per experiment. For
the liquid fractions, this was done by multiplying the measured activity in a given

86
volume (µCi/L) by the flow rate (6 mL/hr) and the duration of the steady-state period.
Table 7-6 shows the total 14C recovery and the percent of
14C recovered in each
fraction analyzed during the experiment. It should be noted that it is not clear if the
plant biomass and 14CO2 (gas phase) were statistically significant fractions. With a
total 14C recovery of 87.7%, 12.3% of the influent activity was unaccounted for in the
bioreactor. During the abiotic control experiment, there was 12.7% removal of DCE,
presumably due to abiotic losses, as described above. Therefore, the 12.3% of the
influent 14C that was unaccounted for was presumably due to abiotic losses.
Table 7-6: Steady-state distribution of 14C activity within each fraction analyzed in a
continuous-flow, completely-mixed bioreactor containing a P. australis individual
and associated microorganisms supplied with14[C]-DCE-amended anoxic media
(Trial 1).
Fraction Recovered 14C Activity (µCi) % influent
14C
Recovered
Influent 29.8 --
Liquid Effluent1
14[C]-DCE 20.41 68.6
14CO2 1.77 5.9
14C- biomass 0.42 1.4
14C-Non-Volatile residues 0.91 3.1
Gas Effluent
14[C]-DCE 1.96 6.6
14CO2
0.08 0.25
Biomass
14C-Biofilm on beads 0.36 1.2
14C-Plant (and root
associated biofilm)
0.18 0.60
Total 26.09 87.7
1: Calculated as the sum of the daily measurement of 14C activity (µCi/L) x flowrate x 24 hr.

87
The overall removal of [14C]-DCE was 31.4%; however, the removal due to biotic
factors alone was approximately 19.1%. These values are in close agreement with the
measured removal of unlabeled DCE. The total average removal of unlabeled DCE
was 30.5%, with 17.8% removal likely due to biotic factors, because 12.7% of the
total was presumably due to abiotic losses (based on the results of the abiotic control
experiment).
The daily liquid fraction measurements, shown in Figure 7-9, show that activity in the
14CO2,
14C-biomass, and
14C-labeled non-volatile residues fractions was present
within one day after introducing 14[C]-DCE. The
14CO2 activity was typically the
highest of the three, followed by the activity of the 14C-labeled non-volatile residues.
Thus, the results of the analysis indicated that some DCE (~10%) was being
transformed by microorganisms into CO2 plus non-volatile residues. The non-volatile
residues are suspected to be intermediates in the complete oxidation of DCE. The
epoxide formed from DCE oxidation is a short-lived, unstable compound that
undergoes abiotic transformations to various products, including aldehydes and acids
(Vogel et al., 1987), which would be detected as non-volatile residue. Thus, complete
transformation to 14CO2 appears to have occurred to a greater extent than incomplete
transformation to 14C-labeled non-volatile compounds. The former is more desirable
because the non-volatile compounds that form in some instances possess toxic
properties. For example, one intermediate transiently formed during TCE oxidation,
chloral hydrate, is a controlled substance and mutagen (Newman and Wackett, 1991);
however, no attempt was made to identify the non-volatile compounds in this study,
88
so it is not known if they have any toxic properties. Activity in the effluent biomass
may have been due to microbial metabolism of 14[C]-DCE,
14C-labeled non-volatile
residues, or 14CO2. If the fractions potentially reflecting oxidative pathways, CO2
(gas and aqueous) and non-volatile residue, are combined, then the most predominant
removal mechanism operating in the bioreactor appears to be oxidation, accounting
for 9.3% removal of the 14[C]-DCE introduced in the feed. However, the amount of
14[C]-DCE oxidized may be higher because the microbial biomass (suspended and
attached) and plant presumably took up 14CO2 and/or
14C-labeled non-volatile
residues. If activity associated with the biomass is also attributed to oxidation, then
up to 12.5% of the 14[C]-DCE removal may be due to oxidation.
14[C]-DCE removal via oxidation was not unexpected because oxygen was present in
the system, as demonstrated above, and microorganisms were known to be present,
and presumably grew, in the system. However, until the 14C tracer was added, it was
not known whether the microorganisms were actually acting upon the DCE. Based
on previous studies it was suspected that microorganisms introduced with the plant
would be able to transform DCE. For example, Bankston et al. (2002) monitored
14[C]-TCE removal in a batch microcosm containing a T. latifolia individual and soil
with native microorganisms and recovered 5.3% of the 14C-activity as
14CO2. It
should be noted that in the study by Bankston et al. (2002), the plant and soil were
obtained from a site known to be contaminated with TCE. In contrast, in this study,
the P. australis plants were collected from a site with no known history of chlorinated
solvent contamination, which demonstrates that it is possible for transformation to
89
occur without previous exposure of plants and microorganisms to DCE. This
phenomenon was also observed in a study by Klier et al. (1999), in which removal of
all DCE isomers was observed in mixed cultures obtained from soil that had no
previous exposure history to chlorinated compounds. Overall, the results obtained in
this study demonstrate that the native microorganism populations associated with the
P. australis collected in this study have the ability to transform DCE using plant-
supplied oxygen. Thus, in a natural wetland containing P. australis, a significant
amount of oxidation of DCE is also expected to occur.
To determine the 14C-activity associated with the attached biomass along the
rhizosphere chamber, the rhizosphere chamber was vertically divided into four
sections. 100 glass beads were obtained from each section and analyzed for 14C-
activity and the total amount of biomass (measured as Lf and Xf as described in Eq.
(4) and (5)). It should be noted that the stainless steel beads were excluded from this
analysis. The first section consisted of the top 10% of the chamber, which contained
a green algal biofilm. The remaining beads were vertically divided (approximately
into thirds) to create the top, middle, and bottom sections. As shown in Table 7-7,
there was a thin dense biofilm throughout the reactor, similar to the biofilm
characteristics in the experiment containing JS666 only. The biofilm density in the
bottom layer was more than an order of magnitude higher than in the rest of the
reactor, although there was the least amount of 14C-activity recovered in this section.
The variability in biofilm density may be the result of measurement error, because the
difference in weight between the various treatments used to determine the solids

90
concentration (described above) was small (in the mg range). Uneven mixing of the
substrates (e.g., oxygen and/or 14[C]-DCE) on a micro-scale could also have
contributed to a heterogeneous biofilm formation. The 14C activity in the biofilm was
also not found to be uniformly distributed in the rhizosphere chamber. Instead, there
was a slight gradient in the activity of 14C-labeled biomass along the length of the
chamber. The most activity was recovered in the algal layer, which could be the
result of uptake of 14CO2 through photosynthesis. The amounts of activity measured
in the remaining sections were similar and may reflect metabolism of 14[C]-DCE
oxidation products and/or 14[C]-DCE. Sorption of
14[C]-DCE and/or its oxidation
products to biomass also could have contributed to the activity in each of these
sections.
Table 7-7: Activity of 14C associated with the attached biomass and biofilm thickness
and density as a function of depth in the rhizosphere chamber in a continuous-flow,
completely-mixed bioreactor containing a P. australis individual and associated
microorganisms supplied with14[C]-DCE-amended anoxic media (Trial 1).
Reactor Section Lf (µm) Xf (mg/mL) Total Activity (µCi)
Algal 0.21 2305.84 0.15
Top 0.07 3952.87 0.09
Middle 0.18 2371.72 0.07
Bottom 0.11 38,540.50 0.05
The microorganisms responsible for oxidation were present as a result of incomplete
root surface sterilization and became established in the bioreactor in the weeks
leading up to the addition of DCE to the reactor following initial start-up. In fact
during this period, algae growth was visually observed in the upper layers of the
beads and along the plant stem below the septum, which demonstrated the ability of

91
at least some of the native plant root microorganisms to survive in the reactor. The
algal source in the rhizosphere chamber was the plant because algae were seen on the
plant roots prior to insertion into the rhizosphere chamber (even after surface
treatment). Additionally algae were never visually observed in the feed supply bottle
or the feed tubing, only in the upper portion of the rhizosphere chamber, indicating
that algae were not growing in the feed supply bottle.
It seems likely that the microbial transformation of DCE in the bioreactor was the
result of cometabolic rather than metabolic activity, for several reasons: (1) the extent
of DCE oxidation and incorporation into microbial biomass was not extensive (Figure
7-9 and Table 7-6), as expected for cometabolic transformations (Alexander, 1981);
(2) there are more known aerobic chlorinated ethene cometabolizers compared with
characterized aerobic organisms that transform these compounds through metabolic
processes (Coleman et al., 2002); and (3) the plant exudates presumably were
available as growth substrates that could support cometabolic processes. However, it
should be noted that all of this is speculative and the exact nature of the DCE
oxidation mechanism is unknown.
Phytovolatilization of DCE was also an important process in the bioreactor as
revealed by the presence of activity in the 14[C]-VOC traps (presumably
14[C]-DCE).
Phytovolatilization accounted for 6.6% (Table 7-6) of the removal of the 14[C]-DCE
introduced in the feed. It should be noted that occasionally the pressure in the foliar
chamber fell below atmospheric, creating a slight vacuum (max 3” H2O or 0.0074

92
atm). It is possible that the vacuum may have enhanced phytovolatilization by
“pulling” 14[C]-DCE through the plant; however, because the vacuum pressure was
very small, it is expected that any enhancement was negligible. Phytovolatilization is
a less desirable removal mechanism compared to oxidation, because unlike oxidation,
phytovolatilization is a non-destructive removal mechanism. The ability of P.
australis to volatilize DCE was not unexpected because phytovolatilization of TCE
has been found to occur with hybrid poplars (e.g., Burken and Schnoor, 1998). In
addition, P. australis contains an internal diffusion pathway that, in addition to
increasing oxygen diffusion into the roots, should allow for diffusion of volatile
compounds up from the roots and into the shoots.
Interestingly, there was little evolution of gaseous 14CO2, as shown in Table 7-6. This
may be the result of little 14CO2 uptake by the plant roots and/or funneling of
14CO2
taken up by the roots into photosynthetic pathways in the shoots. The gaseous 14CO2
data collected on a daily basis are shown in Figure 7-10 and reveal that there were
fluctuations in the daily release of 14CO2, which may reflect changing rates of
photosynthesis in the plants and/or daily differences in trapping efficiencies as a
result of variability in the gas flow rate through the traps.

93
0
0.002
0.004
0.006
0.008
0.01
0.012
0.014
0.016
0.018
0.02
32 34 36 38 40
Day after initial start-up
14CO
2 (µCi/trap)
Trap #1
Trap #2
Total
Figure 7-10: 14C activity associated with two CO2 traps in series used to capture
14CO2 from
the gas phase of a continuous-flow, completely-mixed bioreactor containing a P. australis
individual and associated microorganisms supplied with14[C]-DCE-amended anoxic media
(Trial 1). Each data point represents the average of four analyses.
The smallest fraction of 14C recovered (excluding gaseous CO2) was in the plant
biomass, indicating that there was limited incorporation of DCE into the biomass and
limited plant metabolism of DCE. When the plant was oxidized to quantify its total
14C-activity, it was also separated into various sections to determine how the
14C-
activity was distributed throughout the plant. The following sections were oxidized
and analyzed for 14C-activity separately: (1) the new shoot that developed during the
course of the experiment; (2) the original shoot, which was further divided into two
categories (pieces that had yellowed during the experiment and pieces that had
remained green); and (3) the root, which was further divided into the rhizome and the
root hairs extending from the rhizome. The activity of each section was measured,

94
and the activity per mass of each section was calculated. The pieces were weighed
after the plant had air-dried overnight. As can be seen from Table 7-8, the highest
14C-activity was observed in the new shoot, followed by the
14C-activity in the root
hairs. If the 14C-activity in the new shoot was primarily the result photosynthetic
uptake of 14CO2, then it could explain why there was more
14C-activity in the new
shoot compared to the other sections. As previously mentioned, photosynthetic 14CO2
uptake could also explain why there was little evolution of 14CO2 by the plant. There
was less 14C-activity in the yellowed sections of the leaves compared to the new green
shoot, presumably because green shoots carry out more photosynthesis than yellow
shoots. However, the detection of some activity in the yellow shoots suggests that
these shoots may have also played a role in DCE removal. This is important because
it may mean that some removal of DCE due to plant effects could continue in the
field after the growing season into the fall and winter, although the amount of DCE
removal may decrease significantly when photosynthesis stops. 14C-activity per unit
biomass in the root hairs exceeded that in the rhizome by two orders of magnitude,
which may be the result of less surface area for DCE uptake in the rhizome compared
with the root hairs. Detention of 14C in the rhizome also might be shorter than in the
root hairs because the rhizome appears to have more internal porosity compared to
the root hairs, which could result in quick passage of 14C through the rhizome to the
shoot. The root hairs presumably grew during the course of the experiment, whereas
no growth of the rhizome was observed. Thus, the higher 14C content in the root hairs
could be the result of a higher rate of metabolism resulting in incorporation of 14C
into biomass in the root hairs compared with the rhizome. It is important to note that
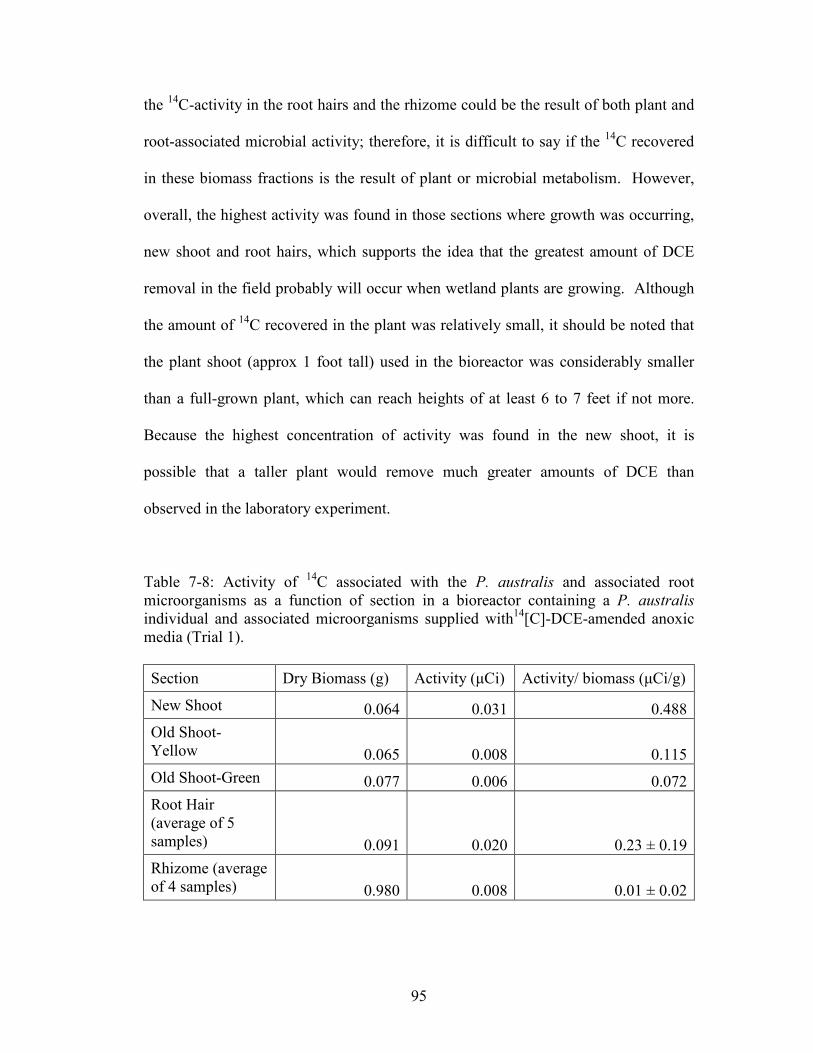
95
the 14C-activity in the root hairs and the rhizome could be the result of both plant and
root-associated microbial activity; therefore, it is difficult to say if the 14C recovered
in these biomass fractions is the result of plant or microbial metabolism. However,
overall, the highest activity was found in those sections where growth was occurring,
new shoot and root hairs, which supports the idea that the greatest amount of DCE
removal in the field probably will occur when wetland plants are growing. Although
the amount of 14C recovered in the plant was relatively small, it should be noted that
the plant shoot (approx 1 foot tall) used in the bioreactor was considerably smaller
than a full-grown plant, which can reach heights of at least 6 to 7 feet if not more.
Because the highest concentration of activity was found in the new shoot, it is
possible that a taller plant would remove much greater amounts of DCE than
observed in the laboratory experiment.
Table 7-8: Activity of 14C associated with the P. australis and associated root
microorganisms as a function of section in a bioreactor containing a P. australis
individual and associated microorganisms supplied with14[C]-DCE-amended anoxic
media (Trial 1).
Section Dry Biomass (g) Activity (µCi) Activity/ biomass (µCi/g)
New Shoot 0.064 0.031 0.488
Old Shoot-
Yellow 0.065 0.008 0.115
Old Shoot-Green 0.077 0.006 0.072
Root Hair
(average of 5
samples) 0.091 0.020 0.23 ± 0.19
Rhizome (average
of 4 samples) 0.980 0.008 0.01 ± 0.02
96
The growth of a new shoot during the experiment indicates that the concentrations of
DCE used during the experiment, 5 mg/L (0.05 mM) to 10 mg/L (0.1 mM), did not
completely inhibit plant growth and the plant was able to maintain normal functions
in the presence of DCE. These results are in good agreement with a previous study
by Dietz (2000) that examined the phytotoxic effects of various chlorinated
compounds, including DCE, on poplars. In that study, the author found that there was
zero growth above 6.0 mM DCE. Growth occurred at lower DCE concentrations,
although to a lesser extent than in the absence of DCE, and decreased linearly from 0
to 6.0 mM DCE.
Plant and Associated Microorganisms Experiment (Trial 2)
A second plant-only experiment was conducted to determine if the removal of DCE
by various processes in the presence of a P. australis individual with root-associated
microorganisms observed in Trial 1 was reproducible. There were some minor
differences in the experimental procedures used in the two experiments. Most
importantly, the root surface was not sanitized in Trial 2 because it was found in the
previous experiment that the native microorganisms contributed significantly to DCE
removal. Instead, a second P. australis individual was placed directly in a second
rhizosphere chamber. When the rhizosphere chamber used in Trial 1 was removed
from the bioreactor set-up for analysis of plant and attached microbial biomass, it was
replaced with the second rhizosphere chamber and plant without resterilizing the
various sections of tubing and other bioreactor components. Unlabeled DCE was
introduced the following day, once it was confirmed that the seal between the
rhizosphere and foliar chambers was sound. Table 7-9 outlines the phases
97
incorporated into the Trial 2 experiment with the plant and associated
microorganisms.
Table 7-9: Phases of operation incorporated into the plant experiment (Trial 2)
Operation
Phase
Days of
Operation
Feed Characteristics Purpose Figure
1 1 Anoxic, DCE-Free Establish reactor,
including seal
NA
2 1-10 Anoxic, amended
with unlabeled DCE
1) Monitor steady-
state DO release
2) Measure steady-
state DCE removal
7-11
7-12
3 10-14 Anoxic, amended
with labeled DCE
Measure steady-state
[14C]-DCE removal
7-13
DO measurements were made concurrently with DCE measurements. Steady-state
with respect to net DO change was established within the five-day period, as
determined through statistical analysis (p>0.05). A net loss of DO, averaging 0.18
mg/L, was observed over the five-day period when DO measurements were taken, as
shown in Figure 7-11. In contrast, a net increase in DO levels was observed in Trial 1
conducted with a plant and associated microorganisms. Two factors probably were
primarily responsible for the different DO results in the two experiments. First, DCE
was not included in the feed while changes in DO were monitored in Trial 1, as it was
in Trial 2. As discussed below, DCE removal did occur during phase 2 of Trial 2.
Presumably a significant amount of the DO removal was due to DCE oxidation, an
oxygen-demanding process that was not active during the period of DO
measurements (Phase 2) in Trial 1. Second, the net DO loss was presumably due in

98
part to a large microbial population associated with the root, because no attempt was
made to reduce the abundance of root microorganisms as in Trial 1. In fact, it was
noted that during phase 2 of Trial 2 the water above the beads in the rhizosphere
chamber was cloudy, but cleared a few days later, presumably due to washout of the
high concentration of suspended microorganisms from the rhizosphere chamber. No
cloudiness was ever observed in the reactor during Trial 1, in which a net increase in
DO was observed. In addition to oxidizing DCE, these root-associated
microorganisms in Trial 2 could have exerted a greater oxygen demand than the root
microorganisms in Trial 1 by oxidizing larger amounts of exudates and through
increased levels of endogenous respiration. Thus, overall, the DO results obtained in
Trial 2 support the idea that root-associated microorganisms are able to utilize oxygen
supplied by the plants for DCE oxidation and other processes.
It was expected that there would be increased DCE removal in Trial 2 compared with
the previous experiment because of the larger population of root-associated
microorganisms in Trial 2. This appeared to be the case initially. As shown in Figure
7-2 in the first three to four days, DCE removals of ~4 mg/L were observed (except
for on day 2 at which time the DCE effluent concentration should have still been
ramping up based on the tracer study). In comparison removals of ~2 mg/L were
observed in Trial 1 (Figure 7-8). However, the amount of DCE removal in Trial 2
decreased steadily until day eight. During this period, a significant amount of
suspended biomass was washed out of the rhizosphere chamber, as indicated by the
decrease in cloudiness and may explain why the DCE removal decreased. By day
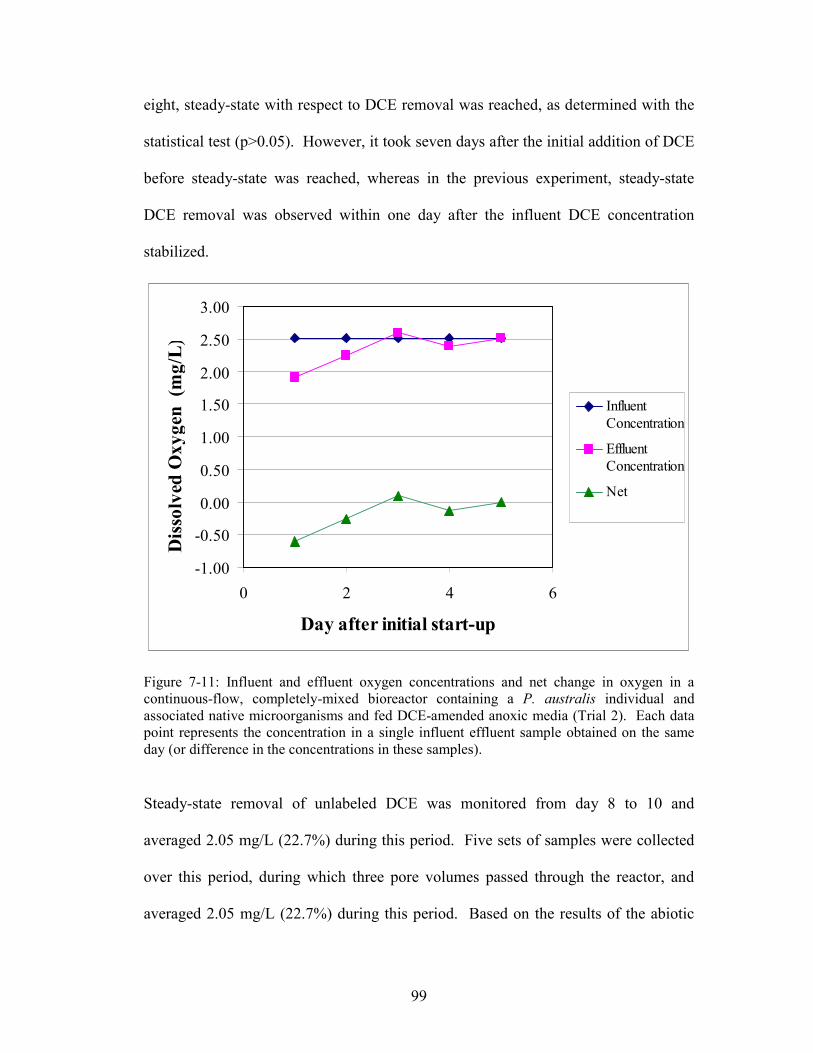
99
eight, steady-state with respect to DCE removal was reached, as determined with the
statistical test (p>0.05). However, it took seven days after the initial addition of DCE
before steady-state was reached, whereas in the previous experiment, steady-state
DCE removal was observed within one day after the influent DCE concentration
stabilized.
-1.00
-0.50
0.00
0.50
1.00
1.50
2.00
2.50
3.00
0 2 4 6
Day after initial start-up
Dissolved Oxygen (m
g/L)
Influent
Concentration
Effluent
Concentration
Net
Figure 7-11: Influent and effluent oxygen concentrations and net change in oxygen in a
continuous-flow, completely-mixed bioreactor containing a P. australis individual and
associated native microorganisms and fed DCE-amended anoxic media (Trial 2). Each data
point represents the concentration in a single influent effluent sample obtained on the same
day (or difference in the concentrations in these samples).
Steady-state removal of unlabeled DCE was monitored from day 8 to 10 and
averaged 2.05 mg/L (22.7%) during this period. Five sets of samples were collected
over this period, during which three pore volumes passed through the reactor, and
averaged 2.05 mg/L (22.7%) during this period. Based on the results of the abiotic

100
control experiment, removal of 12.7% of the influent DCE was presumably due to
abiotic losses. Therefore, removal of 10% of the influent DCE was probably
attributable to the presence of the plant and/or associated microorganisms.
0
2
4
6
8
10
12
1 3 5 7 9 11
Day after initial start-up
DCE (m
g/L)
Effluent
Concentration
Influent
Concentration
Removal
Figure 7-12: Influent and effluent DCE concentrations and DCE removal in a continuous-
flow, completely-mixed bioreactor containing a P. australis individual and associated
microorganisms supplied with DCE (unlabeled)-amended anoxic media (Trial 2). Each data
point represents the concentration in a single influent or effluent sample obtained on the same
day (or difference in the concentrations in these samples).
Initially, it was expected that DCE removal in Trial 2 would be greater than that
observed in the previous experiment (30.5%) because of a larger microbial population
size. Thus, the removal of unlabeled DCE in Trial 2 (22.7%), statistically lower
(p>0.05) than the 30.5% removal observed in Trial 1, was somewhat surprising.
However, there are several factors that may explain the lower than expected removal.
First, plant health declined over the course of the second experiment as indicated by

101
complete yellowing of all leaves. In comparison, in the previous experiment, only
partial yellowing of the original leaves occurred. The complete yellowing was likely
the result of stress associated with being placed in the rhizosphere chamber without
an initial aerated feed supply and not a phytotoxic response to DCE. Providing
aerated media may help get plants established in the bioreactor and this was done in
all previous experiments conducted with intact plants. In contrast, anoxic feed was
supplied throughout the Trial 2 experiment. Another difference between the
condition of the plants in the two experiments is that a new shoot developed in the
foliar chamber during the first experiment, but not in the second experiment. This is
significant because the highest amount of plant-associated 14C-activity in the first
experiment was found in the new shoot. In Trial 2 a new shoot did develop below the
septum in the rhizosphere chamber, but because it could not penetrate the septum and
continue growing into the foliar chamber, it most likely was unable to significantly
contribute to DCE removal because it could not function as an inlet for diffusion of
oxygen to the roots and as an outlet for diffusion of DCE from the roots. The
development of a new shoot indicates that growth was not inhibited by DCE and/or
the anoxic conditions.
Another potential reason for lower than expected DCE removal is related to the
microbial populations, which may have been decreasing through this test period as a
result of washout. The impact of suspended microorganisms prior to washout can be
seen in the first few days (3-6) in Figure 7-12, when the overall removal of DCE
exceeded 30.5%, ranging from 35 to 45% (3.5 to 4.6 mg/L). During this time a net
102
loss of DO was also measured (Figure 7-11), which was indicative of relatively high
biological activity and consistent with the relatively high DCE removal observed.
After washout of the suspended microorganisms occurred, there may not have been a
sufficient biofilm to maintain the relatively high DCE removal because there may
have been insufficient time, compared to Trial 1, to form a sizable biofilm before
DCE was supplied to the bioreactor. Compared with Trial 1 where DCE was added
to the feed on the 23rd day after the initial start-up, DCE was added to the feed on the
2nd day in Trial 2. Thus, where initial biomass levels may have been lower in the first
experiment, they could have formed a more stable biofilm that could achieve greater
substrate removal before DCE was added compared with the population present in
Trial 2.
On day 10, after the DO and unlabeled DCE measurements were completed, labeled
DCE was added to the reactor feed, as in the previous experiment. 14[C]-DCE was
supplied in the feed for a total of four days. The distribution of 14C was analyzed as
before by collecting daily samples of the liquid fractions and measuring the activity in
the biomass phases and the gas phase 14[C]-VOC traps at the conclusion of the
experiment. However, the gas phase CO2 traps used in Trial 1 were not incorporated
into this experiment, because gas phase 14CO2 represented only a small fraction of the
total 14C recovered in the previous experiment, and the daily exchange of these traps
caused major reactor operational problems.

103
The results of the daily analyses of the liquid fractions are shown in Figure 7-13.
During the first two days effluent 14[C]-DCE levels increased as the feed containing
unlabeled and labeled DCE gradually replaced the media containing only unlabeled
DCE in the bioreactor. Effluent 14[C]-DCE activity and
14[C]-DCE removal leveled
off on day 13, three days after adding the 14[C]-DCE feed (day 10), and presumably
the bioreactor was at steady-state with respect to 14[C]-DCE removal from this point
on. Over the two day period (day 13 and 14) when the 14[C]-DCE removal leveled
off, the percent 14[C]-DCE removal averaged 20%, which closely matches the percent
removal observed during the unlabeled DCE feed (22.7%). Further, in Trial 1, 14[C]-
DCE removal appeared to be at steady-state within two days of adding 14[C]-DCE
(Figure 7-9). It should be noted that between the two sampling events on days 13 and
14, more than three pore volumes passed through the reactor. Constant substrate
removal over three pore volumes is generally though to be a sufficient indicator of
stable reactor performance.
As in the previous experiment, 14C-activity was measured in all of the fractions, and a
mass balance analysis was conducted. In this case, the mass balance analysis was
conducted using only effluent 14C data collected over the two-day period during
which the reactor appeared to be at steady-state (i.e. days 13 and 14), and 14C
biomass. Table 7-10 shows the total recovery and the percent of 14C recovered in
each fraction analyzed during the experiment.
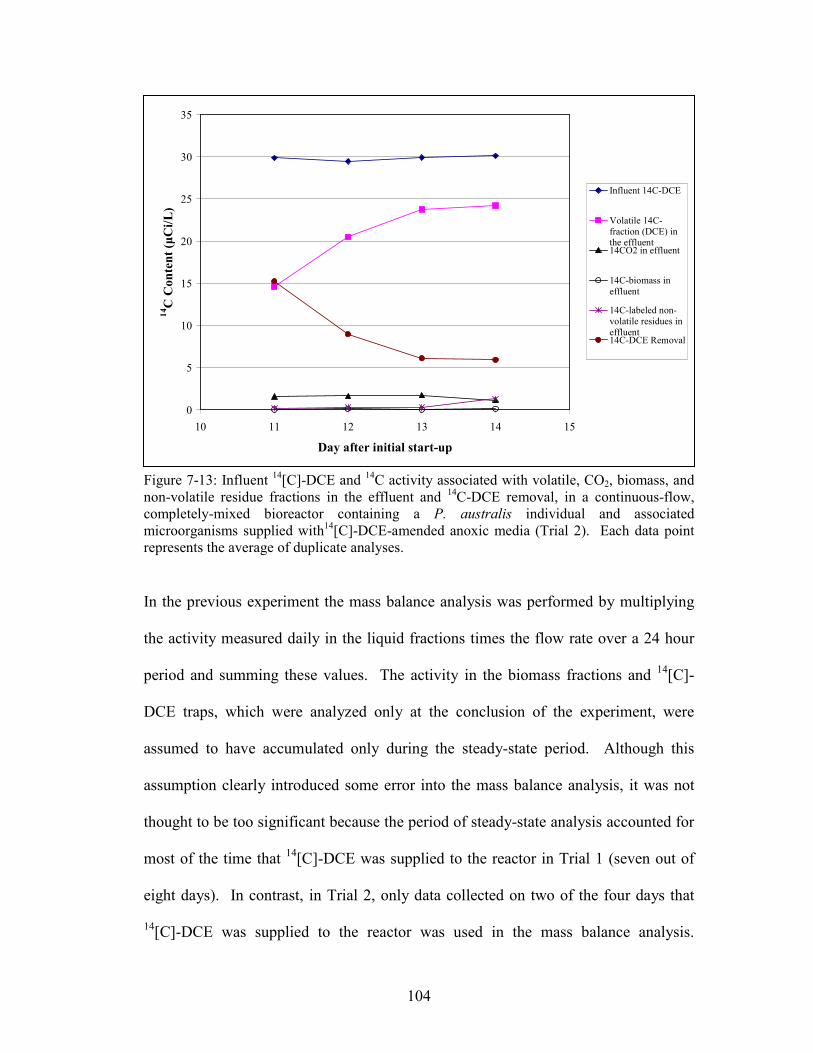
104
0
5
10
15
20
25
30
35
10 11 12 13 14 15
Day after initial start-up
14C Content (µCi/L)
Influent 14C-DCE
Volatile 14C-
fraction (DCE) inthe effluent14CO2 in effluent
14C-biomass in
effluent
14C-labeled non-
volatile residues in
effluent14C-DCE Removal
Figure 7-13: Influent
14[C]-DCE and
14C activity associated with volatile, CO2, biomass, and
non-volatile residue fractions in the effluent and 14C-DCE removal, in a continuous-flow,
completely-mixed bioreactor containing a P. australis individual and associated
microorganisms supplied with14[C]-DCE-amended anoxic media (Trial 2). Each data point
represents the average of duplicate analyses.
In the previous experiment the mass balance analysis was performed by multiplying
the activity measured daily in the liquid fractions times the flow rate over a 24 hour
period and summing these values. The activity in the biomass fractions and 14[C]-
DCE traps, which were analyzed only at the conclusion of the experiment, were
assumed to have accumulated only during the steady-state period. Although this
assumption clearly introduced some error into the mass balance analysis, it was not
thought to be too significant because the period of steady-state analysis accounted for
most of the time that 14[C]-DCE was supplied to the reactor in Trial 1 (seven out of
eight days). In contrast, in Trial 2, only data collected on two of the four days that
14[C]-DCE was supplied to the reactor was used in the mass balance analysis.

105
Therefore, 50% of the measured activity in the biomass and 14[C]-DCE trap fractions
was assumed to have accumulated during the steady-state period and used in the mass
balance analysis. Analysis of 14C distribution in the liquid effluent fractions was
handled the same way as in Trial 1. Based on these assumptions, a total 14[C]-DCE
removal of 20.1% was calculated, 12.6% of this removal was attributed to biotic
factors.
Table 7-10: Steady-state distribution of 14C activity within each fraction analyzed in
a continuous-flow, completely-mixed bioreactor containing a P. australis individual
and associated microorganisms supplied with14[C]-DCE-amended anoxic media
(Trial 2).
Fraction Recovered 14C Activity (µCi) % influent
14C
Recovered
Influent 8.6 --
Liquid Effluent1
14[C]-DCE 6.9 79.9
14CO2 0.42 4.8
14C- biomass 0.02 0.26
14C-Non-Volatile residues 0.23 2.6
Gas Effluent
14[C]-DCE
2 0.04 0.48
Biomass
14C-Biofilm on beads
2 0.33 3.9
14C-Plant (and root
associated biofilm)2
0.05 0.51
Total 7.99 92.5
1: Calculated as the sum of the daily measurement of 14C activity (µCi/L) x flowrate x 24 hr.
2: Accounts for only 50% of the total 14C-activity recovered

106
The total recovery of influent 14[C]-DCE was 92.5%. The balance of 7.5%
unaccounted for in the bioreactor and presumably reflects abiotic 14[C]-DCE loss. A
significantly greater fraction of the influent 14[C]-DCE (12.3%) was unaccounted for
in the first experiment. The difference in the calculated recoveries could reflect
sampling error that causes excessively high activity to be measured resulting in higher
total recovery. It is also possible that less than 50% of the activity in the biomass
fractions(s)/ 14
[C]-DCE trap were attributable to the steady-state period in Trial 2.
Finally, it is conceivable that the differences in the calculated recoveries are real and
there was less abiotic loss occurring during the second experiment.
The presence of 14C-activity in all of the fractions demonstrates that the DCE removal
mechanisms that occurred in Trial 1 in the presence of P. australis and associated
root microorganisms were reproducible. There are some similarities and
dissimilarities with respect to the percent 14C recovered in each fraction in the two
plant and associated root microorganism experiments. First, the percent aqueous
14CO2 recovered was similar (5.9% and 4.8% for the first and second experiment,
respectively). The percent 14C recovered as non-volatile residues was also fairly
constant for the two experiments. The distribution of 14C in microbial biomass was
different in the two experiments. Compared to the first experiment there was less 14C
recovered in liquid effluent biomass but greater 14C recovery in the biofilm. This
may be an indication that there might have been more opportunity for the DCE-
removing microorganisms from the established biofilm to washout in the first
experiment compared to the second experiment because the 14C analysis was

107
conducted over a longer time period in the first experiment. If the 14C-activity
associated with both the suspended and biofilm microorganisms are combined, 2.6%
and 4.1% for the first and second experiment, respectively, then there is a similar
recovery of the 14C-activity in all of the microorganism fractions.
Overall the fractions that might be attributable to bacterial oxidation (as discussed
above for Trial 1) account for 7.5 to 12.1% of the total recovery, compared to 9.3 to
12.5% in the previous experiment. Because these two ranges are similar, it appears
that oxidation occurred to a similar extent in the second experiment compared with
the first experiment. However, less phytovolatilization occurred in Trial 2 than in
Trial 1. 14[C]-DCE in the gas phase accounted for only 0.96% of the total
14C
recovered in Trial 2 (0.48% over the steady-state period), whereas it accounted for
6.7% of the 14C recovered in the previous experiment. Decreased phytovolatilization
likely explains the overall decrease in 14[C]-DCE removal observed in Trial 2
compared with the previous experiment. The reason for reduced phytovolatilization
may be related to plant health. As described above, the plant shoot became
completely yellow during the experiment, and there were no growing parts of the
plant in the foliar chamber. Another possible explanation for the reduced gas
phase14[C]-DCE recovered is related to the trapping efficiency of the
14[C]-DCE
traps. In Trial 2 there was a consistent high gas flow rate through the 14[C]-DCE
traps which may have reduced the contact time between the 14[C]-DCE and trapping
medium and thus the amount of 14[C]-DCE trapped. A high flow rate was only
occasionally observed in Trial 1.
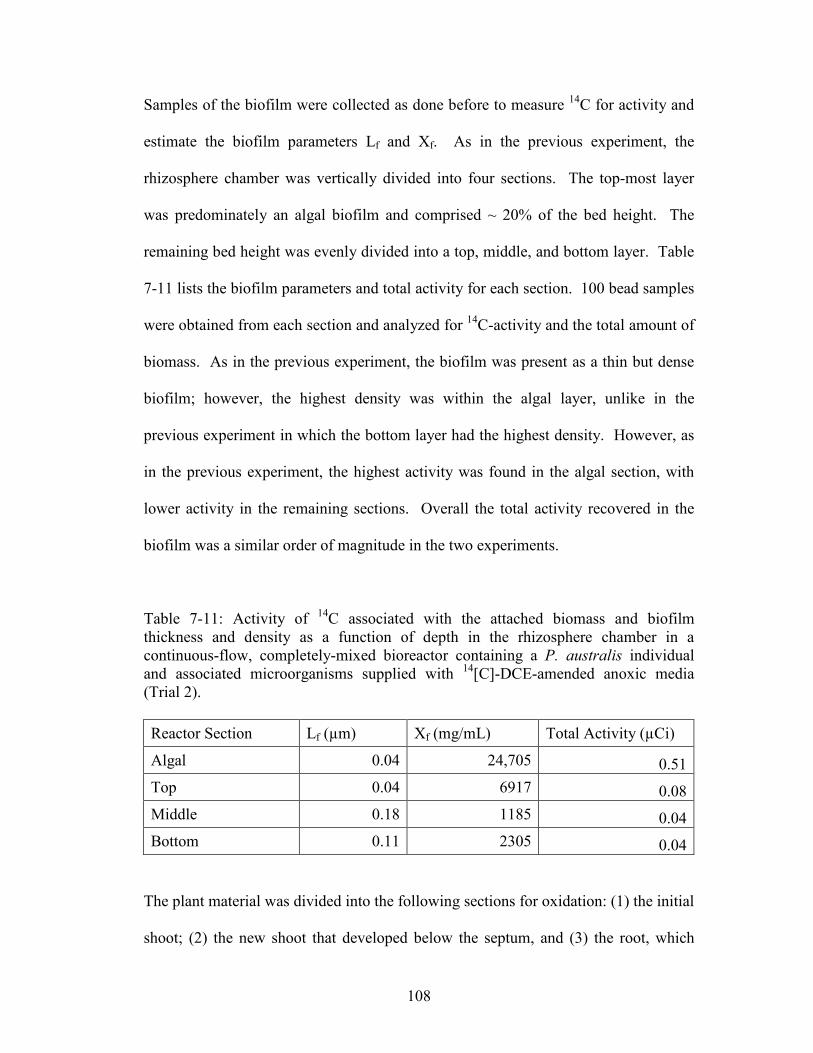
108
Samples of the biofilm were collected as done before to measure 14C for activity and
estimate the biofilm parameters Lf and Xf. As in the previous experiment, the
rhizosphere chamber was vertically divided into four sections. The top-most layer
was predominately an algal biofilm and comprised ~ 20% of the bed height. The
remaining bed height was evenly divided into a top, middle, and bottom layer. Table
7-11 lists the biofilm parameters and total activity for each section. 100 bead samples
were obtained from each section and analyzed for 14C-activity and the total amount of
biomass. As in the previous experiment, the biofilm was present as a thin but dense
biofilm; however, the highest density was within the algal layer, unlike in the
previous experiment in which the bottom layer had the highest density. However, as
in the previous experiment, the highest activity was found in the algal section, with
lower activity in the remaining sections. Overall the total activity recovered in the
biofilm was a similar order of magnitude in the two experiments.
Table 7-11: Activity of 14C associated with the attached biomass and biofilm
thickness and density as a function of depth in the rhizosphere chamber in a
continuous-flow, completely-mixed bioreactor containing a P. australis individual
and associated microorganisms supplied with 14[C]-DCE-amended anoxic media
(Trial 2).
Reactor Section Lf (µm) Xf (mg/mL) Total Activity (µCi)
Algal 0.04 24,705 0.51
Top 0.04 6917 0.08
Middle 0.18 1185 0.04
Bottom 0.11 2305 0.04
The plant material was divided into the following sections for oxidation: (1) the initial
shoot; (2) the new shoot that developed below the septum, and (3) the root, which

109
was further divided into rhizome and root hairs as before. The activity of each
section was measured, and the activity per mass of each section was calculated to
determine the greatest concentration of 14C (Table 7-12). As can be seen from these
results, the highest 14C-activity was observed in the root hairs, followed by the
14C-
activity levels in the new shoot. As before, there was more activity in the root hairs
than in the rhizome, and, overall the highest activity was found in those sections
where growth was occurring (i.e., the root hairs). Interestingly, a significant amount
of activity was found in the new shoot. This could be the result of absorption because
this shoot was submerged in the rhizosphere chamber and thus in direct contact with
the aqueous 14[C]-DCE. Alternatively, it is possible that the new shoot did in fact
contribute to a limited extent to 14[C]-DCE removal, perhaps as the result of either
14[C]-DCE or
14CO2 metabolism.
Table 7-12: Activity of 14C associated with the P. australis and associated root
microorganisms as a function of section in a bioreactor containing a P. australis
individual and associated microorganisms supplied with14[C]-DCE-amended anoxic
media (Trial 2).
Section Biomass (g) Activity (µCi) Activity/biomass (µCi/L)
Old Shoot 0.2726 0.001 0.004
New Shoot 0.6579 0.007 0.011
Root Hair (average
of 3 samples) 0.504
0.016
0.031 ± 0.005
Rhizome (average
of 5 samples) 1.388
0.008
0.005 ± 0.001

110
Chapter 8: Conclusion
This study was designed to test the hypothesis that wetland plants could impact the
fate of DCE in the rhizosphere via direct and/or indirect mechanisms. The results of
this study demonstrate that P. australis and root-associated microorganisms
significantly reduced DCE levels. The removal mechanisms included oxidation of
DCE by the microorganisms, which was likely possible because of plant-supplied
oxygen and exudates; DCE phytovolatilization; and, to a lesser extent, incorporation
of DCE or its metabolites into biomass. These results indicate that wetland plants
have both direct and indirect impacts on the fate of DCE in the rhizosphere.
All of the removal processes observed in this study, including oxidation and
phytovolatilization would be expected to occur in natural wetlands. The DCE
removal mechanisms observed in this study and their relative extent are shown
graphically in a revised conceptual model of biological processes that can affect the
fate of chlorinated solvents in the rhizosphere (Figure 8-1). Understanding the DCE
removal mechanisms should improve our ability to predict the fate of DCE
discharged to a wetland and perhaps provide a basis to enhance the removal of DCE
from wetlands. Based on this study, it would be expected that most DCE removal
would occur via microbially-mediated oxidation to CO2 and, to a lesser extent, non-
volatile compounds, as depicted in Figure 8-1. Phytovolatilization, to a lesser extent
than oxidation, would also be expected to contribute to removal of DCE from the
groundwater, but this is a less desirable removal mechanism because it does not result
in the destruction of DCE. However, it might be possible to increase the extent of
111
oxidation by using engineered approaches to increase microbial activity. For
example, if methanotrophs were found to be largely responsible for facilitating the
DCE oxidation, providing an optimal amount of methane, that could serve as their
growth substrate, could increase the cometabolic rate of DCE oxidation.
Conceivably, if microbial activity is optimized, DCE could be largely oxidized to
either CO2 or non-volatile compounds before it comes into contact with the plant
roots, resulting in reduced DCE phytovolatilization. Finally, as shown in Figure 8-1,
the model includes some plant and microbial DCE metabolism, resulting in
incorporation of DCE or its metabolites into biomass; however, this is expected to
occur to a lesser extent compared to the other removal mechanisms.
Interestingly, Kassenga et al. (2003) proposed a wetland design conceptual model
targeted at the removal of chlorinated ethenes. The removal process included
formation of less chlorinated ethenes (e.g. DCE and VC), through reductive
transformations of the more highly-chlorinated ethenes in the anaerobic zone, and
microbially-mediated aerobic oxidation of the DCE and VC within the rhizosphere.
The current study demonstrates that microbially-mediated aerobic oxidation of DCE
can occur in the rhizosphere, but in addition, other removal mechanisms, namely
phytovolatilization, should be included in the conceptual model as noted above.
These are important findings because the accumulation of incompletely
dehalogenated ethenes, especially DCE and VC, is a major problem in many TCE-
and PCE-contaminated groundwater aquifers. This study shows that if the
groundwater flow path includes passage through a wetland containing plants like P.
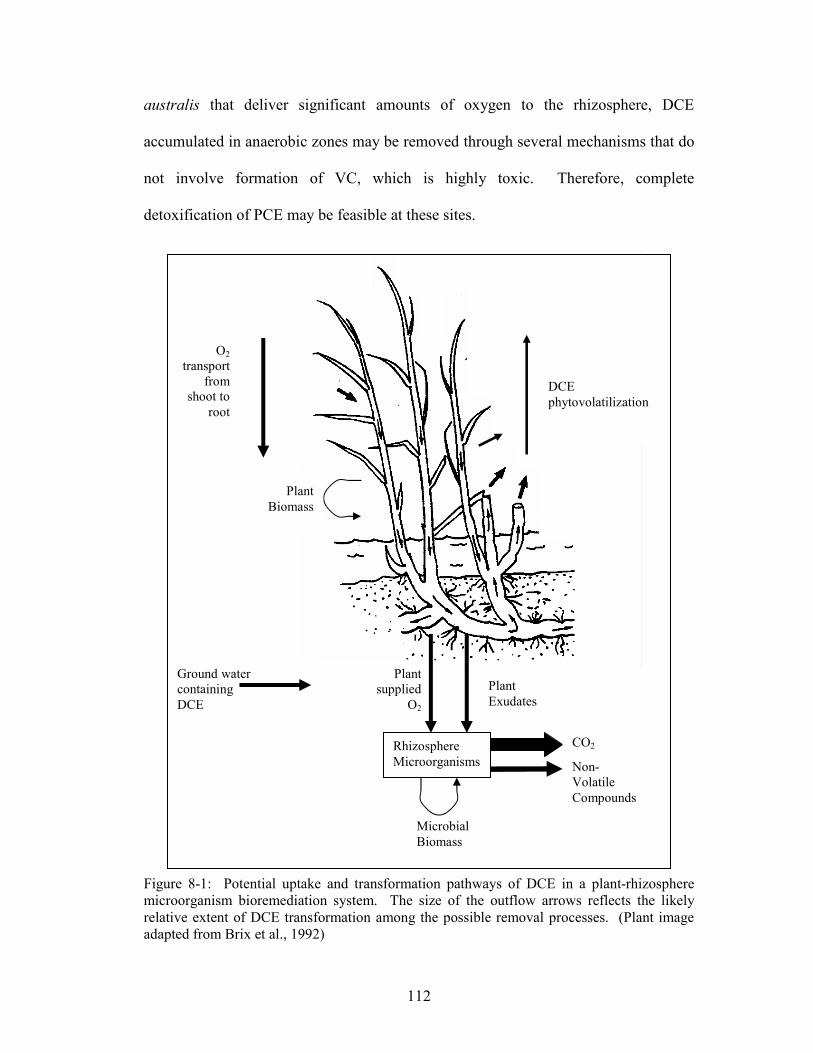
112
australis that deliver significant amounts of oxygen to the rhizosphere, DCE
accumulated in anaerobic zones may be removed through several mechanisms that do
not involve formation of VC, which is highly toxic. Therefore, complete
detoxification of PCE may be feasible at these sites.
Figure 8-1: Potential uptake and transformation pathways of DCE in a plant-rhizosphere
microorganism bioremediation system. The size of the outflow arrows reflects the likely
relative extent of DCE transformation among the possible removal processes. (Plant image
adapted from Brix et al., 1992)
Microbial
Biomass
Ground water
containing
DCE
Plant
supplied
O2
Rhizosphere
Microorganisms
Plant
Exudates
DCE
phytovolatilization
CO2
Non-
Volatile
Compounds
O2
transport
from
shoot to
root
Plant
Biomass

113
The results of this study provide valuable insight into potentially important removal
mechanisms that could influence the fate of chlorinated ethenes in the wetland
rhizosphere. However, because the conditions used in the lab are different from those
encountered throughout the year in wetland ecosystems, further research is required
before accurate predictions about the fate of chlorinated ethenes in ground water that
discharges into wetlands can be made. Field studies involving wetlands, in particular
those containing P. australis, could provide information on the extent of DCE
removal that could be expected throughout the year as conditions change in natural or
constructed wetlands. Even greater removal of DCE might occur in a real wetland, at
least during certain times of the year. For example, during the summer months P.
australis will grow considerably larger than the plant size used in this experiment,
which may result in a greater amount of DCE phytovolatilization and/or increased
oxidation of DCE by microorganisms thru increased delivery of oxygen to the
rhizosphere. Additionally, summer time temperatures will typically be higher than
that used in the lab (approximately 20oC), which would further increase microbial
activity including, presumably the extent of microbially-mediated oxidation of DCE.
Conversely, during the winter months, when there are no active growing shoots and
microbial activity is decreased, there may be less DCE removal than observed in this
study. The effects of these environmental changes would have to be factored into any
assumptions about chlorinated ethene removal in either natural or constructed
wetlands.
114
Overall, the research conducted provided information on the relationships between
wetland plants and rhizospheric microorganisms and their roles in achieving the
biodegradation of chlorinated ethenes. Specifically, this study demonstrated that the
wetland plant P. australis affected contaminant levels indirectly, by helping to
generate an aerobic rhizosphere habitat that promoted the activity of aerobic root-
associated microorganisms capable of degrading DCE, and directly, by facilitating
removal via phytovolatilization, and to a lesser extent incorporation into plant and
microbial biomass. This information should enhance our ability to predict and
improve the fate of groundwater contaminants that are discharged to natural wetlands.
In addition, it should improve our ability to apply constructed wetlands in the
treatment of waste streams containing chlorinated solvents and, potentially, other
anthropogenic compounds, in order to improve our water resources. Further work
would be required prior to application to large-scale industrial waste or contaminated
ground water sites, but this work provides a fundamental first step in understanding
the processes occurring in wetlands and their application to bioremediation.

115
Bibliography
Alexander M. (1981) Biodegradation of Chemicals of Environmental Concern.
Science 211: 132-138.
Anderson J., P. McCarty (1997) Transformation Yields of Chlorinated Ethenes by a
Methanotrophic Mixed Culture Expressing Particulate Methane Monooxygenase.
Applied and Environmental Microbiology. 63(2): 687-693.
Anderson T.D., B.T. Walton (1995) Comparative Fate of [14C]Trichloroethylene in
the Root Zone of Plants from a Former Solvent Disposal Site. Environmental
Toxicology and Chemistry 14(12): 2041-2047.
Annachhatre A.P., S.M.R. Bhamidimarri (1992) Microbial Attachment and Growth in
Fixed-Film Reactors: Process Startup Considerations. Biotechnology Advances
10:69-91.
Alvarez-Cohen L., G. Speitel Jr. (2001) Kinetics of Aerobic Cometabolism of
Chlorinated Solvents. Biodegradation 12: 105-126.
Armstrong W. (1979) Aeration in Higher Plants. Advances in Botanical Research 7:
225-332.
Armstrong W., D.J. Boatman (1967) Some Field Observations Relating the Growth
of Bog Plants to Conditions of Soil Aeration. Journal of Ecology 55: 101-110.
Armstrong W., D. Cousins, J. Armstrong, D.W. Turner, P.M. Beckett (2000) Oxygen
Distribution in Wetland Plant Roots and Permeability Barriers to Gas-exchange with
the Rhizosphere: a Microelectrode and Modeling Study with Phragmites australis.
Annals of Botany 86: 687-703.
Arp D., C. Yeager, M. Hyman (2001) Molecular and Cellular Fundamentals of
Aerobic Cometabolism of Trichloroethylene. Biodegradation 12(2): 81-103.
Bankston J.L., D.L. Sola, A.T. Komor, D.F. Dwyer (2002) Degradation of
Trichloroethylene in Wetland Microcosms Containing Broad-Leaved Cattail and
Eastern Cottonwood. Water Research 36:1539-1546.
Boulangé-Peterman L. (1996) Process of Bioadhesion on Stainless Steel Surfaces and
Cleanability: A Review with Special Reference to the Food Industry. Biofouling
10(4): 275-300.
Bradford, M (1976) A Rapid and Sensitive Method for the Quantification of
Microgram Quantities of Protein Utilizing the Principle of Protein-Dye Bind.
Analytical Biochemistry 72: 248-254.

116
Bradley P.M., F.H. Chapelle (2000) Aerobic Microbial Mineralization of
Dichloroethene as Sole Carbon Substrate. Environmental Science and Technology
34(1): 221-223.
Brix H., B.K. Sorrell, P.T. Orr (1992) Internal Pressurization and Convective Gas
Flow in Some Emergent Freshwater Macrophytes. Limnology and Oceanography
37(7): 1420-1433.
Burken J.G. (1996) Uptake and fate of Organic Contaminants by Hybrid Poplar
Trees. PhD Dissertation, University of Iowa.
Burken J.G., J.L Schnoor (1998) Predictive Relationships for Uptake of Organic
Contaminants by Hybrid Poplar Trees. Environmental Science and Technology
32(21):3379-3385.
Coleman N. (2004) University of Sydney, NSW, Australia. Personal
Communication.
Coleman N., T. Mattes, J. Gossett, J. Spain (2002) Biodegradation of cis-
Dichloroethene as the Sole Carbon Source by a β-Proteobacterium. Applied and
Environmental Microbiology. 68(6): 2726-2730.
Colmer T.D. (2003) Long-distance Transport of Gases in Plants: A Perspective on
Internal Aeration and Radial Oxygen Loss from Roots. Plant, Cell and Environment
26: 17-36.
Colmer T., M.R. Gibberd, A. Wiengwerra, T.K. Tinh (1998) The Barrier to Radial
Oxygen Loss from Roots of Rice is Induced by Growth in Stagnant Solution. Journal
of Experimental Botany 49: 1431-1436.
Cookson J.T. (1995) Bioremediation Engineering: Design and Approach. McGraw
Hill, New York.
Cseh, T., S. Sanschagrin, J. Hawari, R., Samson (1989) Adsorption-Desorption
Characteristics of Polychlorinated Biphenyls on Various Polymers Commonly Found
in Laboratories. Applied and Environmental Microbiology 55(12): 3150–3154.
Dandurand L-M. C., G.R. Knudsen (2002) Sampling Microbes from the Rhizosphere
and Phyllosphere. pg. 516-526. In Manual of Environmental Microbiology, C.J. Hurst
et al. (Eds.), ASM Press.
Davis J.W., J. M. Odom, K.A. DeWeerd, D.A. Stahl, S.S. Fishbain, R.J. West, G.M
Klecha, J.G. DeCarolis (2002) Natural Attenuation of Chlorinated Solvents at Area 6,
Dover Air Force Base: Characterization of Microbial Community Structure. Journal
of Contaminant Hydrology 57: 41-59.

117
Devlin J.F., D. Katic, J.F. Barker (2004) In Situ Sequenced Bioremediation of Mixed
Contaminants in Groundwater. Journal of Contaminant Hydrology 69: 233-261.
Dietz A.C. (2000) Phytotoxicity of Chlorinated Aliphatics to Hybrid Poplar Cuttings
and Axenic Tissue Cultures. PhD Dissertation. University of Iowa.
Drew M.C. (1997) Oxygen Deficiency and Root Metabolism: Injury and Acclimation
under Hypoxia and Anoxia. Annual Review of Plant Physiology and Plant Molecular
Biology 48: 223-250.
Dolan M., P. McCarty (1995) Methanotrophic Chloroethene Transformation
Capacities and 1,1-Dicholoroethene Transformation Product Toxicity.
Environmental Science and Technology 29: 2741-2747.
Environmental Protection Agency (EPA) (2005) Technical Factsheet on: 1,2-
dichloroethylene http://www.epa.gov/OGWDW/dwh/t-voc/12-dich2.html, March 11,
2005.
Faille, C., C. Jullien, F. Fontaine, M. Bellon-Fontaine, C. Slomianny, T. Benezech
(2002) Adhesion of Bacillus spores and Escherichia coli Cells to Inert Surfaces: Role
of Surface Hydrophobicity. Canadian Journal of Microbiology 48:728-738.
Field J.A., A.J.M. Stams, M. Kato, G. Schraa (1995) Enhanced Biodegradation of
Aromatic Pollutants in Cocultures of Anaerobic and Aerobic Bacterial Consortia.
Antonie van Leeuwenhoek 67: 47-77.
Fitch M. W., D. Weissman, P. Phelps, G. Georgiou, G.E. Speitel Jr. (1996)
Trichloroethylene Degradation by Methylosinus trichosporium OB3b Mutants in a
Sequencing Biofilm Reactor. Water Resources 30(11): 2655-2664.
Freedman D.L., J.M. Gossett (1989) Biological Reductive Dechlorination of
Tetrachloroethylene and Trichloroethylene to Ethylene under Methanogenic
Conditions. Applied and Environmental Microbiology 55(9): 2144-2151.
Gage J.C., N. Strafford, R. Truhaut (1959) International Union of Pure and Applied
Chemistry: Methods for Determination of Toxic Substances in air. Buterworths,
London, England.
Gordon M., N. Choe, J. Duffy, G. Ekuan, P. Hellman, I. Muiznieks, M. Ruszaj, B.B.
Shurtleff, S. Strand, J. Wilmoth, L.A. Newman (1998) Phytoremediation of
Trichloroethylene with Hybrid Poplars. Environmental Health Perspectives
Supplements 106(S4): 1001-1004.
Gossett J.M. (1985) Anaerobic Degradation of C1 and C2 Chlorinated Hydrocarbons.
Air Force Engineering and Services Center. ESL-TR-85-38.

118
Grybauskas, A. (2004) University of Maryland College Park, College Park, MD.
Personal Communication.
Han J-I., S. Lontoh, J.D. Semrau (1999) Degradation of Chlorinated and Brominated
Hydrocarbons by Methylomicrobium album BG8. Archives of Microbiology 172:
393-400.
Hoagland D.R., D.I. Arnon (1938) The Water-Culture Method for Growing Plants
Without Soil. University of California College of Agriculture, Agricultural
Experiment Station, Circular 347.
Justin, W. Armstrong (1987) The Anatomical Characteristics of Roots and Plant
Response to Soil Flooding. New Phytologist 106: 465-495.
Jirka, A.M., M.J. Carter (1975) Micro Semi-Automated Analysis of Surface and
Wastewaters for Chemical Oxygen Demand. Analytical Chemistry 47(8): 1397-1402.
Kadlec, R.H., R.L. Knight (1996) Treatment Wetlands. Lewis Publishers, Boca
Raton, Florida.
Kao C.M., S.C. Chen, J.Y. Wang, Y.L Chen, S.Z. Lee (2003) Remediation of PCE-
Contaminated Aquifer By an In-Situ Two-Layer Biobarrier: Laboratory Batch and
Column Studies. Water Research 37: 27-38.
Kassenga G.R., J.H. Pardue, S. Blair, T. Ferraro (2003) Treatment of Chlorinated
Volatile Organic Compounds in Upflow Wetland Mesocosms. Ecological
Engineering 19: 305-323.
Kawase M., R. Whitmoyer (1980) Aerenchyma Development in Waterlogged Plants.
American Journal of Botany 67: 18-22.
Klier N.J., R.J. West, P.A. Donberg (1999) Aerobic Biodegradation of
Dichloroethylenes in Surface and Subsurface Soils. Chemosphere 38(5): 1175-1188.
Kovacs D.A., D.H. Kampbell (1999) Improved Method for the Storage of
Groundwater Samples Containing Volatile Organic Analytes. Archives of
Environmental Contamination and Toxicology 36: 242-247.
Lee M., J. Odom, R. Buchanan (1998) New Perspectives on Microbial
Dehalogenation of Chlorinated Solvents: Insights from the Field. Annual Review of
Microbiology 52: 423-452.
Little, C.D. A.V. Palumbo, S.E. Herbes, M.E. Lidstrom, R.L. Tyndall, P.J. Gilmer
(1988) Trichloroethylene Biodegradation by a Methane-Oxidizing Bacterium.
Applied and Environmental Microbiology 54(4): 951-956.

119
Lorah M.M., L.D. Olsen (1999) Natural Attenuation of Chlorinated Volatile Organic
Compounds in a Freshwater Tidal Wetland: Field Evidence of Anaerobic
Biodegradation. Water Resources Research 35(12): 3811-3827.
Lorah, M.M., L.D. Olsen, B.L. Smith, M.A. Johnson, W.B. Fleck (1997) Natural
Attenuation of Chlorinated Volatile Organic Compounds in a Freshwater Tidal
Wetlands, Aberdeen Proving Ground, Maryland, U.S. Geological Survey Water
Resources Investigation Report, 97-4171.
Ma X., J.G. Burken (2003) TCE Diffusion to the Atmosphere in Phytoremediation
Applications. Environmental Science and Technology 37: 2534-2539.
Martin, M.J., B.E. Logan, W.P. Johnson, D.G. Jewett, R.G. Arnold (1996) Scaling
Bacterial Filtration Rates in Different Sized Porous Media. Journal of Environmental
Engineering 122(5): 407-415.
Massacci, A., F. Pietrini, M.A. Iannelli (2001) Remediation of Wetlands by
Phragmities australis. Minerva Biotechologica 13: 135-140.
Mehta, P.P., D. Gottlieb, D. Powell (1959) Vancomycin, A Potential Agent for Plant
Disease Prevention. Phytopathology 49: 177-184.
Mitsch, W.J., J.G. Gosselink (2000) Wetlands. 3rd ed. John Wiley and Sons, Inc.,
New York.
Newman L.M., L.P Wackett (1991) Fate of 2,2,2-Trichloracetaldehyde (Chloral
Hydrate) Produced During Trichloroethylene Oxidation by Methanotrophs. Applied
and Environmental Microbiology 57(8):2399-2402.
Olaniran A.O., D. Pillay, B. Pillay (2004) Aerobic Dechlorination of cis- and trans-
Dichloroethenes by Some Indigenous Bacteria Isolated from Contaminated Sites in
Africa. Journal of Environmental Sciences 16(6): 968-972.
Orchard B.J., W.J. Doucette, J.K. Chard, B. Bugbee (2000) A Novel Laboratory
System for Determining Fate of Volatile Organic Compounds in Planted Systems.
Environmental Toxicology and Chemistry 19(4): 888-894.
Raskin L. (1987) Structural and Functional Analysis of Anaerobic Biofilm
Communities: An Integrated Molecular and Modeling Approach. Ph.D. Dissertation,
University of Illinois at Urbana-Champaign, Urbana, IL.
Rittmann, B.E. (1982) Comparative Performance of Biofilm Reactor Types.
Biotechnology and Bioengineering 24: 1341-1370.
Rittmann B.E. P.L. McCarty (2001) Environmental Biotechnology: Principles and
Application. McGraw Hill, New York.

120
Saez P.B., B.E. Rittmann (1992) Model-Parameter Estimation using Least Squares.
Water Resources 26(6): 789-796.
Schnabel W.E., A.C. Dietz, J.G. Burken, J.L. Schnoor, P.J. Alvarez (1997) Uptake
and Transformation of Trichloroethylene by Edible Garden Plants. Water Resources
31(4) 816-824.
Seagren, E.A., (1994) Quantitative Evaluation of Flushing and Biodegradation for
Enhancing In Situ Dissolution of Nonaqueous-Phase Liquids. PhD Dissertation,
University of Illinois at Urbana-Champaign, Urbana, IL,.
Seagren E.A., B.E. Rittmann, A.J. Valocchi (1999) An Experimental Investigation of
NAPL Pool Dissolution Enhancement by Flushing. Journal of Contaminant
Hydrology 37:111-137.
Shang T.Q., S.L. Doty, A.M. Wilson, W.N. Howald, M.P. Gordon (2001)
Trichloroethylene Oxidative Metabolism in Plants: The Trichloroethanol Pathway.
Phytochemistry 58: 1055-1065.
Suarez M.P., H.S. Rifai (1999) Biodegradation Rates for Fuel Hydrocarbons and
Chlorinated Solvents in Groundwater. Bioremediation Journal 3 (4): 337-362.
van Hylckama Vlieg J.E.T., W. de Koning, D.B. Janssen (1996) Transformation
Kinetics of Chlorinated Ethenes by Methylosinus trichosporium OB3b and Detection
of Unstable Epoxides by On-line Gas Chromatography. Applied and Environmental
Microbiology 62(9): 3304-3312.
Verce M.F., C.K. Gunsch, A.S. Danko, D.L. Freedman (2002) Cometabolism of cis-
1,2-Dichloroethene by Aerobic Cultures grown on Vinyl Chloride as the Primary
Substrate. Environmental Science and Technology 36: 2171-2177.
Vogel T., G. Criddle, P. McCarty (1987) Transformations of Halogenated Aliphatic
Compounds. Environmental Science Technology 21: 722-736.
Voroney R.P., J.P. Winter, E.G. Gregorich (1991) Microbe/Plant/Soil Interactions.
pgs. 77-99. In Carbon Isotope Techniques, D.C. Coleman and B. Fry (Eds.).
Academic Press, New York.
Vroblesky D.A., C.T. Nietch, J.T. Morris (1999) Chlorinated Ethenes from
Groundwater in Tree Trunks. Environmental Science and Technology 33: 510-515.
Wiedemeier T.H., H.S. Rifai, C.J. Newell, J.J. Wilson (1999) Natural Attenuation of
Fuels and Chlorinated Solvents in the Subsurface. John Wiley & Sons, Inc. New
York.
Wrenn, B.(2003) Washington University, St. Louis, MO. Personal Communication.

121
Wrenn, B. (1992) Substrate Interactions During the Anaerobic Biodegradation of
1,1,1-Trichlorethane. Ph.D. Dissertation. University of Illinois at Urbana-
Champaign, Urbana, IL.
Yang Y., and P. L. McCarty (1998) Competition for Hydrogen within a Chlorinated
Solvent Dehalogenating Anaerobic Mixed Culture. Environmental Science
Technology. 32: 3591-3597.