abstract title of dissertation: allostery in groel: its role
TRANSCRIPT

ABSTRACT
Title of dissertation: ALLOSTERY IN GROEL: ITS ROLE IN THE REFOLDING
OF PROTEIN SUBSTRATES
John Peter Grason, Doctor of Philosophy, 2003
Dissertation directed by: Professor George H. Lorimer Department of Chemistry and Biochemistry
The Escherichia coli chaperonin GroEL assists in the re-folding of misfolded
substrate proteins (SPs). In response to the binding of ATP, GroEL undergoes large,
allosteric structural transitions, resulting in an expansion of its central cavity and a
capping of the cavity by the co-chaperonin GroES. Bound SP is released into the central
cavity following the structural transitions. The exact mechanism by which GroEL assists
in the re-folding of SPs is unknown, though there is evidence that GroEL has the ability
to forcefully unfold bound SPs, giving them another chance to fold to the native state.
The studies in this dissertation concentrate on relating the allosteric domain
movements of GroEL to the unfolding of SPs: 1) As a means of controlling the domain
movements, an intersubunit salt bridge was replaced with a pair of cysteine residues,
allowing for the controlled introduction of cross-links that could tether the GroEL rings
in their closed conformation. 2) The possible allosteric basis of SP’s ability to stimulate
the ATPase activity of GroEL was explored using standard kinetic assays. 3) The

kinetics of GroES release from the GroEL/GroES complex in response to ATP binding
were studied using stopped-flow fluorescence measurements, with an emphasis on
determining why SP binding accelerates the rate of release. From these studies, it was
concluded that the subunits within a GroEL ring move in a single concerted motion,
maximizing the potential unfolding force exerted by GroEL against bound SP. It was
also found that SP stimulates ATPase activity by binding to and holding a ring in the
more active, closed conformation. To do this, SP must exert a force on the ring, and in
order to undergo its structural changes, GroEL must in turn perform work on the SP.
GroES release is stimulated for a similar reason. Since unfolded SP increases the number
of reaction cycles and decreases the amount of time SP spends encapsulated in the central
cavity, it is proposed that a GroEL-assisted refolding mechanism that includes an active
unfolding event makes the most sense in physiological terms.
ALLOSTERY IN GROEL: ITS ROLE IN THE REFOLDING OF PROTEIN
SUBSTRATES
by
John Peter Grason
Dissertation submitted to the Faculty of the Graduate School of the University of Maryland, College Park in partial fulfillment
of the requirements for the degree of Doctor of Philosophy
2003
Advisory Committee: Professor George H. Lorimer, Chair Professor Dorothy Beckett Professor Victor Muñoz Professor Richard Stewart Professor Devarajan Thirumalai


ii
DEDICATION
This dissertation is dedicated to my wife, Jennifer,
for absolutely everything, and who deserves this degree far more than I ever will…
…To my grandfather, Martin Sheska…
…and to Cody.

iii
ACKNOWLEDGEMENTS
It is impossible to complete a project such as this without the help of many
people. All of the good things presented in this dissertation are due to them.
The mistakes are entirely my own.
Many thanks to…
…my advisor, Dr. George Lorimer, for constant guidance, for countless
stimulating discussions, for always being accessible, for providing me with a great
project, for convincing me (several times) to finish this degree, …and for never requiring
me to teach (and that last one’s a big one).
…Gilles Curien, for teaching me the skills and techniques used in all aspects of
this project. I was very fortunate to have Gilles as my first mentor when I arrived in the
lab. He’s an outstanding scientist, and a great friend as well.
…my colleague of the past two years, Jen Gresham. Thank you for all the
conversations, all the lunches, all the help, for convincing me (more than several times)
to finish this degree, for reading the first draft of this dissertation, for putting up with me,
and most importantly, for being a fantastic friend.
…all my lab mates over the years. Thanks to Edward Hammond, Mark Uebel,
Lusiana Widjaja, and Jen Grason for all their help and all the good times.
…my Lehigh colleagues. Thanks to Linda Lowe-Krentz, Al Gilotti, Marianne
Hamel, and Cheryl Isleib-Blaukovitch for providing me with a wonderful introduction to
working in a lab.
…the members of my dissertation committee, for giving up their time to carefully
read this document and help me fulfill this final requirement.

iv
…my family, for all their encouragement and support.
…Jen’s family, for always being there for me.
…and finally, my wife Jennifer, of course, for all her love and unwavering
support, and for being my most important motivation in finishing this degree.

v
TABLE OF CONTENTS
List of Figures viii List of Abbreviations xii Chapter 1: Introduction and Specific Aims 1 1.1 The Structure of GroEL 3 1.2 Why Does Nature Need GroEL? 5 1.3 The Workings of GroEL 6 1.4 The GroE Reaction Cycle 8 1.5 Active or Passive Refolding? 14 1.6 Allosteric Domain Movements Drive Unfolding 16 1.7 Specific Aims 19 Chapter 2: General Methods and Experimental Procedures 21 2.1 A Note on Protein Concentration 22 2.2 Site Directed Mutagenesis of GroEL and GroES 22 2.3 Polyacrylamide Gel Electrophoresis (PAGE) 23 2.4 Purification of GroEL 24 2.5 Purification of GroES 27 2.6 Purification of His-Tagged GroES 28 2.7 Preparing GroEL Cysteine Mutants for Cross-Linking or Labeling 29
2.8 GroEL Cross-linking 30 2.9 Coupled-enzyme ATPase Assay 31
2.10 Preparing Unfolded Protein Substrates 33 2.11 Computer Software 33 Chapter 3: Characterization of a GroEL Intersubunit Double Cysteine Mutant:
R197C / E386C 34 3.1 Introduction 35 3.2 Methods Specific to Chapter 3 38 3.2.1 Mutagenesis 38 3.2.2 Gradient Gels 38 3.2.3 Purification of Phosphate Binding Protein 39 3.2.4 Labeling of PBP 40 3.2.5 ATPase Assay Using PBP 41 3.2.6 Assaying GroES Release From the EL/ES Bullet Using
14C-ATP 42 3.2.7 Assaying GroES Release From the EL/ES Bullet Using
His-tagged GroES 42 3.3 Data Analysis 43 3.3.1 Gel Quantitation of the Reaction Coordinate 43 3.3.2 Developing Models that Predict GroELIRX’s Response to
Cross-Linking 49

vi
TABLE OF CONTENTS (CONT.) 3.4 Results 54 3.4.1 Cross-linking of GroELIRX 54 3.4.2 Native Cysteines are Non-reactive 56 3.4.3 Kinetics of Diamide Oxidation and DTT Reduction
Demonstrate that Oxidation is Stochastic 57 3.4.4 GroELIRX Has Reduced Overall Cooperativity Compared
to GroELWT 59 3.4.5 Locking GroELIRX Into the TT State Eliminates Cooperativity 63 3.4.6 Two Cross-links Are Needed in a GroELIRX Ring to Lock it in
the T State 63 3.4.7 One Cross-link Per GroELIRX Ring is Sufficient to Prevent
GroES Binding 67 3.4.8 GroELIRX’s Ability to Release GroES is Compromised 67 3.4.9 Unfolded SP Does Not Stimulate GroELIRX ATPase Activity 69 3.5 Discussion 71 Chapter 4: Allosteric Basis for the Actions of SP on GroEL ATPase Activity:
Evidence for Active Unfolding 76 4.1 Introduction 77 4.2 Methods Specific to Chapter 4 79 4.2.1 Assay for MDH Activity During Re-folding by GroEL 79 4.3 Results 79 4.3.1 Effect of SPs on GroEL ATPase Activity 79 4.3.2 Titration of Unfolded SP 81 4.3.3 Refolding of MDH by GroEL/GroES 81 4.3.4 X-linked GroELIAX is not Affected by SP 83 4.3.5 Adding Unfolded SP to GroELIAX Provides a Direct
Measurement of VmaxT 85 4.3.6 SP is not a Perfect Mimic of a Cross-link 87 4.3.7 Short Peptides and a Hydrophobic Amino Acid do not
Stimulate ATPase Activity 90 4.4 Discussion 91 Chapter 5: Examining the Allosteric Basis for the Release of GroES from the
GroEL/GroES Complex 97 5.1 Introduction 98 5.2 Methods Specific to Chapter 5 100 5.2.1 Mutagenesis and Purification 100 5.2.2 Labeling GroEL E315C and GroES 98C with Fluorescent
Probes 102 5.2.3 Stopped-Flow Fluorescence Measurements 103 5.2.4 Measuring the Kinetics of GroES Release Using GroESHis 107

vii
TABLE OF CONTENTS (CONT.)
5.3 Results 108 5.3.1 Confirming the Presence of FRET in the Experimental
System 110 5.3.2 Measuring GroES Release Using FRET 111
5.3.3 GroES Dissociation Results Differ from Those Previously Published 113 5.3.4 Effect of K+ Ion on GroES Release 116 5.3.5 Effect of ADP on GroES Release 117 5.3.6 Effect of Unfolded SP on GroES Release 120 5.3.7 Relating ATPase Activity to GroES Release 123 5.3.8 Effect of Unfolded SP on GroES Release When SP is
Added Under Non Steady-state Conditions 125 5.3.9 Effect of SP at Different ADP Concentrations 125 5.3.10 ADP and ATP Compete for the Binding Sites on the
Trans Ring 126 5.3.11 Effect of [ATP] on the Rate of GroES Release 128 5.4 Discussion 130 5.4.1 Explaining the Difference Between the Published and
Current Results 130 5.4.2 Interpreting the Release Kinetics 132 Chapter 6: Summary and Final Discussion 140 Appendix: Probability Equations for Quantitating GroELIRX Cross-Linking 148 References 150
viii
LIST OF FIGURES
1-1 The Structure of GroEL, GroES and the GroEL/GroES “Bullet” Complex 4
1-2 Movement of the SP Binding Sites in Response to ATP/GroES 7
1-3 The GroE Reaction Cycle 8
1-4 Allosteric Structural Transitions of GroEL 10
1-5 Certain Steps of the GroE Reaction Pathway are “Driven” Forward by GroES
12
1-6 ATPase Rate Dependence on [ATP] 17
2-1 Purification of GroEL 27
2-2 Purification of GroES 29
2-3 Coupled Enzyme ATPase Assay 32
2-4 Monitoring ATPase Rate in Real Time 32
3-1 Two T State Salt Bridges Were Replaced With Cys Pairs 36
3-2 Purification of PBP 40
3-3 Binomial Distributions Define Population of 14-mers Containing 0,1,2...etc. Tethers at Any Point on the Reaction Coordinate
45
3-4 Quantitation of GroELIAX Oxidation 45
3-5 Scheme for Modeling the Cross-linking of GroELIRX 47
3-6 Cross-linking Model of GroELIRX 47
3-7 Extent of Tethering is Quantitated Using Disappearance of Monomers 48
3-8 Modeling the Effect of Cross-links on GroEL’s Ability to Bind GroES 50

ix
3-9 Scheme for Developing Models Which Predict the Response of GroEL ATPase Activity to Cross-linking
52
3-10 Varying the Input Parameters Affects the Shape of the Theoretical ATPase Traces in Different Ways
53
3-11 Cross-linking of GroELIRX Can Be Visualized Using SDS-PAGE 55
3-12 Stoichiometric Cross-linking of GroELIRX Indicates No Reaction With Native Cysteines
57
3-13 Oxidation Kinetics of GroELIRX Using Diamide 59
3-14 Reduction Kinetics of Oxidized GroELIRX Using DTT 60
3-15 Dependence of GroEL ATPase Activity on [ATP] 61
3-16 Determination of GroELIRX’s ATPase Activity Using the PBP Assay 62
3-17 Response of GroELIRX ATPase Activity to Oxidation 65
3-18 Kinetics of GroES Release from GroELIRX in Response to ATP Binding to the Trans Ring
68
3-19 GroES Release from GroELIRX as Measured Using GroESHis 70
3-20 GroELIRX Binds Unfolded SP but its ATPase Activity is Not Enhanced by it
71
4-1 Stimulation of ATPase Activity by Unfolded SP 80
4-2 Titration of unfolded SP into GroEL ATPase Reactions 82
4-3 Addition of SP to GroEL/GroES ATPase Reaction 83
4-4 Monitoring the Re-folding of MDH by GroELWT/GroES 84
4-5 Effect of Unfolded SP on Cross-linked GroELIAX 86
4-6 Response of GroELIAX to Oxidation, ± Unfolded SP 87

x
4-7 Dependence of GroELIAX ATPase Activity on [ATP] ± SP, ± Cross-linking
89
4-8 Free Energy Cycles: Allosteric Transitions With Different Substrates 94
5-1 GroEL/GroES/ADP Complex with the FRET Residues Highlighted 101
5-2 Experimental Design for Measuring GroES Release 104
5-3 Diagramming the Events and Rates of the GroEL Reaction Cycle 109
5-4 Steady-state Fluorescence Measurements Demonstrating FRET 111
5-5 Decrease in Signal Requires Both Donor and Acceptor, Confirming FRET
112
5-6 Decrease in FRET Signal is Specific to ATP 113
5-7 Decrease in FRET Signal Requires Addition of Excess Unlabeled GroES with ATP
114
5-8 FRET Signal is Independent of the Extent of Labeling; Release Kinetics are Independently Confirmed
115
5-9 Effect of K+ Concentration on GroES Release 116
5-10 Effect of ADP on GroES Release 118
5-11 Effect of Unfolded SP on GroES Release 121
5-12 Relating the Rate of GroES Release to the ATPase Rate 124
5-13 Effect of Unfolded SP on the GroES Release Rate When SP is not Included in the Initial GroEL/GroES/ADP Equilibrium
126
5-14 ADP Inhibits Unfolded SP’s Ability to Stimulate GroES Release 127
5-15 Raising [ADP] and Lowering [ATP] Slows Release and Increases the Lag Phase
128
5-16 Effect of Varying the ATP Concentration Used to Initiate GroEL/GroES Dissociation
129

xi
5-17 A Proposed General Pathway for GroES Release 133
5-18 A Short Hypothetical Pathway Demonstrates the Potential Complexity of the System
139

xii
LIST OF ABBREVIATIONS
°C degrees Celsius
[X] concentration of X
Å Angstroms
ADP adenosine diphosphate
α-LA α-lactalbumin (bovine)
Amp ampicillin
AMP-PNP 5’-adenylylimidodiphosphate
ATP adenosine triphosphate
BME β-mercaptoethanol
cryo-EM cryo-electron microscopy
Cys cysteine
DEAE diethylaminoethyl (weak anionic exchanger)
DMF N,N-dimethylformamide
DMSO dimethylsulfoxide
DNA deoxyribonucleic acid
DTT dithiothreitol
E. coli Escherichia coli
EDTA ethylenediaminetetraacetic acid
F5M fluorescein-5-maleimide
FRET fluorescence resonance energy transfer
GroELD GroEL E315C labeled with IAEDANS
GroELIAX GroEL D83C/K327C (intrasubunit double cys pair)
GroELIRX GroEL R197C/E386C (intersubunit double cys pair)
xiii
GroELWT wild-type GroEL
GroESA GroES 98C labeled with F5M
GroESHis GroES with His6 tag
GroESWT wild-type GroES
His histidine
IAEDANS 5-((((2-iodoacetyl)amino)ethyl)amino) naphthalene-1-sulfonic acid
IPTG isopropyl-β-D-thiogalactopyranoside
K+ potassium ion
KAc potassium acetate
kDa kilodaltons
KNF Koshland-Nemethy-Filmer model of allostery
LB Luria-Bertani broth
LDH lactate dehydrogenase (bovine)
MDH malate dehydrogenase (pig heart mitochondrial)
Mg magnesium
MgAc magnesium Acetate
mPDM meta-phenylenedimaleimide
mS milliSiemens/centimeter
ms milliseconds
MW molecular weight
MWC Monod-Wyman-Changeux model of allostery
NaAc sodium acetate
NADH nicotinamide adenine dinucleotide
NaOH sodium hydroxide

xiv
NEM N-ethylmaleimide
Ni-NTA nickel-nitrilotriacetic acid
nm nanometers
NMR nuclear magnetic resonance
oPDM ortho-phenylenedimaleimide
PAGE polyacrylamide gel electrophoresis
PBP phosphate binding protein
PCR polymerase chain reaction
PEP phosphoenolpyruvate
PK pyruvate kinase (bovine)
pPDM para-phenylenedimaleimide
Q quaternary ammonium (strong anionic exchanger)
R Relaxed state in MWC terminology
Rubisco Ribulose bisphosphate carboxylase
SDS sodium dodecyl sulfate
SP substrate protein
SP sulfopropyl (strong cationic exchanger)
SR1 single-ring mutant of GroEL
T Tight state in MWC terminology
TEMED N,N,N’,N’-tetramethylethylenediamine
Tet tetracycline
Tris Tris (hydroxymethyl) aminomethane
Trp tryptophan
u units of enzyme activity

1
Chapter 1
Introduction and Specific Aims

2
Proteins are the essential molecular machines that sustain the chemical reactions
of life. The unique, three-dimensional structure of a protein determines its specificity and
its function, and the structure of a protein is determined entirely by its primary amino
acid sequence (1). A protein is synthesized as a linear strand of these amino acids by the
ribosome, and must then fold correctly into higher order structures. The folding of
proteins is a remarkable event in nature, requiring the proper rotation of molecular bonds,
the forming of salt bridges and hydrogen bonds, and the collapse of a core of
hydrophobic amino acids. A correctly folded protein is only marginally more stable than
many other possible structures. It is therefore not surprising that proteins occasionally do
not reach their correct, final structure; it is more surprising that most do. Incorrectly
folded proteins are not functional; most will form insoluble aggregates, eventually
subject to proteolysis. However, for some incorrectly folded proteins, all is not lost.
They still have a chance to fold to their correct structure thanks to a group of proteins
known as chaperonins, members of a broader group of proteins known as chaperones.
Molecular chaperones are proteins which affect the fold or conformation of other proteins
(2). An example is Hsp70, which unfolds proteins and assists in importing them into
mitochondria (3). Another is Hsp90, which assists in the folding of signal transduction
proteins (4). A third example, chaperonins, rescue misfolded proteins and allow them to
refold.
GroEL/Hsp60 is the best understood of all the chaperonins (for reviews see (2,
5)), and exemplifies a protein that operates as a molecular machine. Georgopoulos and
coworkers originally discovered it as a protein that was essential for the growth of
Escherichia coli (E. coli), along with its co-chaperonin GroES/Hsp10 (6). Since that

3
time, there have been hundreds of publications dealing with various aspects of GroEL:
its structure, its ATP-driven structural changes, its effect on substrate proteins (SPs), and
even its possible role in disease. However, the mechanism by which it accomplishes its
primary function, using ATP to rescue misfolded proteins, remains controversial. One
school of thought says that GroEL is a passive participant in protein refolding. It simply
binds misfolded proteins, sequesters them to prevent them from aggregating, and
provides them with an environment favorable to folding (7). Others believe that GroEL
plays a more active role in refolding, in that it binds misfolded substrates, forcibly
unfolds them, and gives them another chance to fold correctly (8). The answer remains
elusive, but the work presented in this dissertation provides support for the active
mechanism.
1.1 The Structure of GroEL
GroEL is a tetradecamer and a double toroid, arranged as two rings stacked back
to back. Each ring is composed of seven identical subunits, with a molecular weight of
approximately 57 kD per subunit (9). The crystal structure of the GroEL monomer (10)
shows the protein arranged into three distinct domains (Figure 1-1). The equatorial
domain is responsible for most of the inter-subunit contacts between monomers of the
same ring and all of the inter-ring contacts. This domain also contains the binding site
for ATP, one binding site per subunit, for a total of 14 ATP binding sites per GroEL
tetradecamer. The residues responsible for the binding and hydrolysis of ATP are the
most conserved residues among the GroEL homologues from several organisms (11).
The second large domain is the apical domain, which is known to contain the binding
sites for the substrate polypeptide as well as the co-chaperonin GroES (12). These two

4
C
A B
Figure 1-1: The Structure of GroEL, GroES and the GroEL/GroES “Bullet” Complex. A) The structure of a single GroEL subunit (from PDB file 1grl (10)). The apical domain is highlighted in orange, the equatorial domain in yellow, and the intermediate domain in purple. B) The structure of a single GroES subunit (from PDB file 1aon (14)). The mobile loop (the GroEL binding site) is highlighted in red. C) The GroEL/GroES bullet (from PDB file 1aon (14)). The trans ring is colored blue, the cis ring is colored green, and the GroES ring is colored red. A single subunit in each GroEL ring is highlighted using the same domain color scheme as in A to show the change in conformation a subunit undergoes in response to ATP and GroES. (See section 2.11).

5
domains are connected by a smaller domain known as the intermediate domain, with
hinge regions formed at the inter-domain connecting points. Arranged as a 14-mer, the
GroEL subunits form two large, non-connecting central cavities in which the SP binds
and is later sequestered (13). During the cycle of GroEL assisted protein folding, GroES
binds to one end of the GroEL double ring, forming a cap over one of the central cavities
(14). GroES is a ring comprised of seven identical 10 kD subunits (15), each containing
an unstructured mobile loop which can bind to the GroEL apical domain. It should be
noted that GroES7-GroEL14-GroES7 particles, or “footballs”, have been seen in cryo-
electron microscopy studies (16), though it is not at all clear whether these species are
obligate parts of the reaction cycle (17). Over the course of its reaction cycle, GroEL
undergoes several large structural changes, first visualized using cryo-EM (18), which are
described in detail below.
1.2 Why Does Nature Need GroEL?
Why is a chaperone such as GroEL necessary? The answer has to do with the
pathways by which proteins are believed to fold. The folding mechanism of most
proteins can be best described by an energy landscape, which is strewn with many local
energy minima, the most pronounced of which represents the native (properly folded)
state (19). It is certainly true that some proteins can achieve their native state with no
assistance, under normal cellular conditions. However, the other minima represent
intermediate folding conformations in which the protein may become trapped on its way
to achieving the native state. What happens to a protein once it enters one of these traps
depends on the protein. Some proteins are able to escape the traps through fluctuations in
thermal energy. However, other proteins cannot rescue themselves and under normal

6
conditions would remain misfolded and inactive, or would aggregate. GroEL is believed
to facilitate refolding by binding these trapped intermediates, possibly unfolding them,
and releasing them into a sequestered environment in which folding can begin anew.
Rescuing proteins from these energy wells necessarily requires energy input, and this
energy is supplied by the binding and hydrolysis of ATP. ATP not only provides the
energy for protein refolding, but also acts as the timer that controls the process (20). ATP
is the driving force for the important allosteric structural changes that are the critical
elements of the GroEL reaction cycle.
1.3 The Workings of GroEL
It was first realized in the late 1980’s that the GroE complex was important in
post-translational protein processing when it was shown that GroEL and GroES together
were required for the assembly of ribulose bisphosphate carboxylase (Rubisco)
oligomers. This was first demonstrated with native Rubisco particles within a
transformed E. coli cell (21) and later with unfolded Rubisco protomers and purified
GroEL/ES in vitro in an Mg-ATP dependent reaction (22). It was soon shown that not
only Rubisco but many different proteins were able to bind to GroEL in their unfolded,
but not native, states (23). More recent experiments using artificial peptides suggest that
GroEL does not prefer to recognize any particular secondary structure (24). This implies
that GroEL is not only promiscuous in its selection of SPs, but it is able to discriminate
between folded and unfolded proteins. GroEL’s ability to bind a large variety of proteins
explains the observation that the folding rate of proteins that fold spontaneously under
certain conditions is usually decreased in the presence of GroEL. This is due to GroEL
binding the folding intermediates of proteins that do not require it for folding, thus

7
slowing their progress to the native state. The crystal structure of GroEL (10), along with
mutagenesis studies that identified the substrate binding sites (12), shed light on GroEL’s
preference for unfolded substrates. The surfaces of the apical domains that face the
inside of the central cavity contain several highly conserved hydrophobic residues (11)
that correspond well to the identified SP binding site. These residues on each subunit
form a contiguous ring of hydrophobicity that lines the central cavity (Figure 1-2) (10).
Figure 1-2: Movement of the SP Binding Sites in Response to ATP/GroES. As GroEL undergoes its allosteric transitions upon binding ATP (the R state) and GroES (the R’ state), the hydrophobic SP binding sites which line the entrance to the inner cavity are dispersed from their T state positions. This is the motion that would provide the power stroke to active unfolding. (See section 2.11).
These binding sites are specific for non-native peptides (25, 26), because unfolded
proteins tend to contain exposed hydrophobic surfaces, surfaces that become buried upon
the peptide achieving the correct fold (27, 28). Upon the movement of the apical
domains following ATP binding, these hydrophobic residues become buried, releasing
the SP into the central cavity. Because the interaction between the SP and GroEL is
strong, it is possible that the SP might remain bound as the apical domains undergo their
large conformational change. In that case, the protein would stretch with them, and
actively unfold (29).

8
1.4 The GroE Reaction Cycle
The controlling force behind the GroE cycling mechanism is ATP. It was realized
early on that the actions of GroEL were ATP dependent and indeed Mg and ATP are
absolutely required for the reconstitution of active Rubisco in vitro (22). Later it was
determined that K+ was required for the binding of ATP and that the ATPase activity of
GroEL increased with increasing K+ concentrations (30, 31). Since then, a large number
of experiments have attempted to elucidate in great detail how ATP controls the GroE
cycle (Figure 1-3). In the absence of GroES, the cycle time of a single ring of GroEL
ADP
ADP
ADP
ADP
ATP
ATP ATP
+GroES, ATP
+GroES
+ATP +Misfolded
SP
ATP Hydrolysis
Release of
GroES and SP
Figure 1-3: The GroE Reaction Cycle. GroEL is shown in blue, GroES in orange, and SP in red. The events depicted are described in the text. The GroES/GroEL/GroES complex is shown in brackets due to the uncertainty that this football complex is actually a requisite part of the cycle.
9
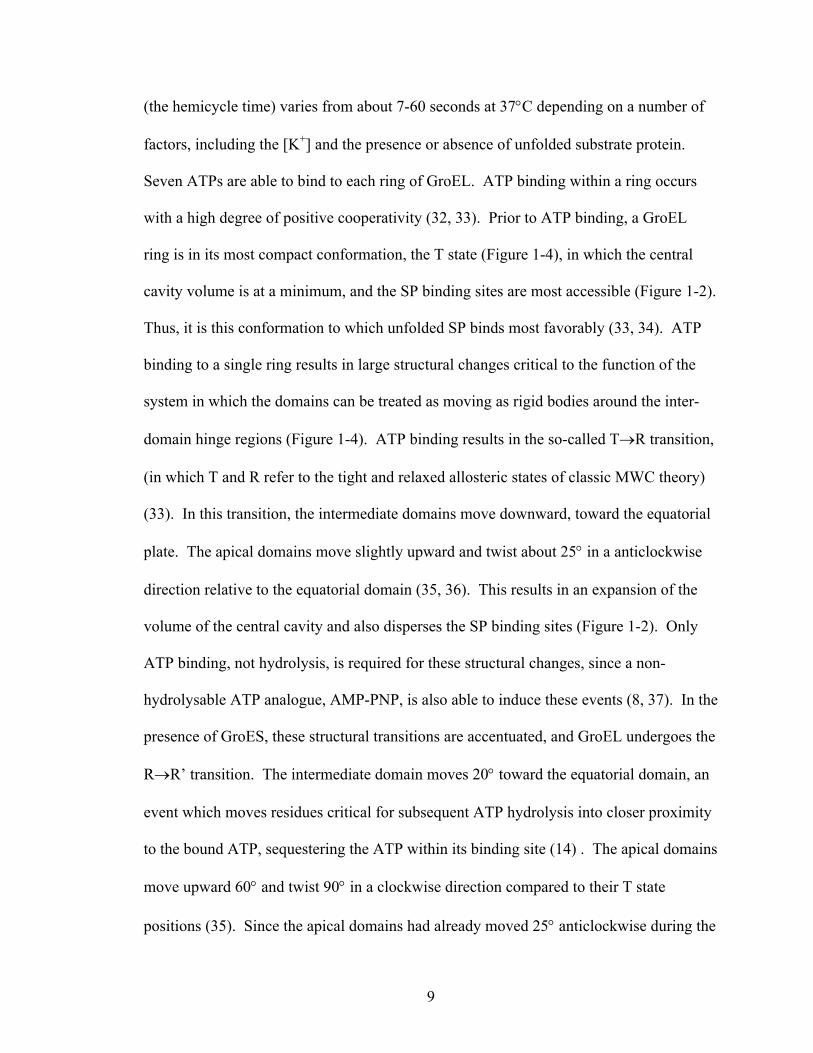
(the hemicycle time) varies from about 7-60 seconds at 37°C depending on a number of
factors, including the [K+] and the presence or absence of unfolded substrate protein.
Seven ATPs are able to bind to each ring of GroEL. ATP binding within a ring occurs
with a high degree of positive cooperativity (32, 33). Prior to ATP binding, a GroEL
ring is in its most compact conformation, the T state (Figure 1-4), in which the central
cavity volume is at a minimum, and the SP binding sites are most accessible (Figure 1-2).
Thus, it is this conformation to which unfolded SP binds most favorably (33, 34). ATP
binding to a single ring results in large structural changes critical to the function of the
system in which the domains can be treated as moving as rigid bodies around the inter-
domain hinge regions (Figure 1-4). ATP binding results in the so-called T→R transition,
(in which T and R refer to the tight and relaxed allosteric states of classic MWC theory)
(33). In this transition, the intermediate domains move downward, toward the equatorial
plate. The apical domains move slightly upward and twist about 25° in a anticlockwise
direction relative to the equatorial domain (35, 36). This results in an expansion of the
volume of the central cavity and also disperses the SP binding sites (Figure 1-2). Only
ATP binding, not hydrolysis, is required for these structural changes, since a non-
hydrolysable ATP analogue, AMP-PNP, is also able to induce these events (8, 37). In the
presence of GroES, these structural transitions are accentuated, and GroEL undergoes the
R→R’ transition. The intermediate domain moves 20° toward the equatorial domain, an
event which moves residues critical for subsequent ATP hydrolysis into closer proximity
to the bound ATP, sequestering the ATP within its binding site (14) . The apical domains
move upward 60° and twist 90° in a clockwise direction compared to their T state
positions (35). Since the apical domains had already moved 25° anticlockwise during the

10
T→R transition, they therefore must move 115° in a clockwise direction during the
R→R’ transition (36).1 This has a significant effect on the properties of the central cavity.
The cavity increases drastically in volume from 85,000 Å3 to 175,000 Å3 (14). The
hydrophobic SP binding sites become completely buried in the walls of the central cavity
(Figure 1-2), and the cavity now becomes hydrophilic in nature (14). SP that may have
been bound to the SP binding sites must be released into the expanded cavity, which is
now capped by GroES. Because of the cavity’s hydrophilicity, it now provides a
favorable folding environment for the released SP. The domain movements of both the
1 The allosteric pathway is typically represented in the literature as T→R→R’. However, this mechanism is based, at least in part, on the assumption that the T state cannot bind ATP, and that therefore GroES cannot bind to the T state. This assumption is now known to be incorrect (see Chapters 3 and 4), and therefore it is possible that the actual pathway is R→T→R’, or even some other variant.
T R’ R
SP
ATP GroES
ATP ATP ATP ATP
Figure 1-4: Allosteric Structural Transitions of GroEL. The domain movements within a single ring in response to ligands are drawn. The equatorial domains are shown in yellow, the intermediate domains in purple, the apical domains in orange, and GroES is shown in red. The binding of ATP favors transition to the R state, and, in the presence of GroES, the R’ state. SP prefers to bind to the T state, when the SP binding sites are most exposed.

11
T→R transition and R→R’ transition are concerted in nature; all seven subunits undergo
the motion at the same time, as evidenced by structural analyses (14) and molecular
dynamics simulations (38). Once in the R’ state, the so-called GroEL14-GroES7 “bullet”
structure, ATP hydrolysis occurs in a quantized manner, demonstrated by the release of 7
moles of inorganic phosphate per GroEL 14-mer in the presence of GroES (20). The
resulting ADP bullet (the cis-complex) is highly stable (20). SP that may be sequestered
beneath the GroES cap is unfolded, as has been shown using fluorescence anisotropy
measurements (39) and hydrogen/tritium exchange measurements (8), among other
methods. Thus, ATP binding serves as the driving force for releasing unfolded protein
into the central cavity. The coupling of ATP binding and hydrolysis to large, cooperative
structural changes is a general feature of molecular chaperones such as, for example,
Hsp90 (4).
The GroEL/GroES/ADP/±SP complex remains intact until ATP binds to the distal
ring (trans ring) (Figure 1-3) (20, 37). ATP binding causes the release of the ligands
from the cis ring, with GroES necessarily leaving first, followed by the SP and ADP.
The allosteric signal that trans-ATP binding initiates is currently unknown, although the
signal may be communicated through a subtle structural change that occurs at the inter-
ring interface (equatorial plate) upon the formation of the asymmetric complex. The
center of the plate moves away from the cis-cavity by a few degrees during complex
formation (Figure 1-4) (14, 29). Trans-ATP binding may somehow affect this “tilting” of
the equatorial domains and cause cis-GroES release. Once GroES is released from the
cis ring, the ring collapses back to a more compact state, although whether it is the T or R
state is unclear, and it probably depends on whether or not SP is present (see Chapter 5).

12
A new cis-complex can now be constructed on the trans ring once ATP is bound,
although the exact order of events is poorly defined. It is known that ATP hydrolysis
must occur in the cis-ring prior to SP and GroES binding to the trans ring (17), although
it is not known whether trans-GroES binding must occur in order for GroES to dissociate
from the cis ring. Thus, it is not known whether GroES/GroEL/GroES football
complexes are a requisite part of the reaction cycle (Figure 1-3). However, because one
folding chamber is falling apart as the other is forming, the GroE system is inherently
efficient. The clearing of ligands from one ring does not have to occur prior to the
addition of ligands to the other ring, thus allowing the two rings to operate in an
alternating fashion (17). GroEL operating in this manner has been called a “two-stroke
motor” (29).
It is worth noting at this point that the reaction pathway of GroEL is not an
entirely reversible process; that is, some elements of the pathway are “driven” in one
direction by the presence of GroES (Figure 1-5). In the absence of GroES, the binding of
SP to the T (or R) states is reversible, as is the T→R allosteric transition itself. ATP
binding is also reversible. However, once GroES becomes involved, the events are
forced to occur in a certain order. For example, the R’→T transition cannot occur within
a ring when GroES is bound. GroES is not released prior to ATP hydrolysis in the cis-
ring (17). SP cannot be released prior to GroES release. This is an important point,
because in the presence of GroES, the system cannot reach an equilibrium, making
Figure 1-5: Certain Steps of the GroE Reaction Pathway are “Driven” Forward by GroES. The reversible and irreversible steps of the reaction pathway for one GroEL ring are depicted. The GroEL ring is noted in the scheme as its allosteric state, T or R. No assumptions are made as to the relative rates or favorability of the events. This scheme simply depicts whether or not they can occur. Forbidden transitions are noted with an X. Species which cannot exist are noted in red.

13

14
steady-state kinetic measurements of the pathway only somewhat useful in defining the
rates of reaction.
1.5 Active or Passive Refolding?
The previous section defined the events that occur during the reaction cycle, and
they have been well characterized and well accepted, at least in a general sense.
However, what actually is happening to the SP between the time it binds to the closed T
ring and when it is ejected into the central cavity remains unclear. This is the major point
of contention: whether GroEL plays a passive or an active role in the (un)folding of the
SP (8).
The passive refolding hypothesis, also known as the Anfinsen’s cage model, (7,
40) states that the inner cavity of GroEL simply serves as a sequestered, hydrophilic
environment for the SP, allowing it to fold in isolation and avoid aggregation. For
example, rhodanese has been shown to fold to the native state while trapped inside the
central cavity, (39). In this experiment, a single-ringed mutant of GroEL (SR1) was used
in order to prevent ATP binding to the trans ring from releasing GroES, thus trapping
rhodanese in the central cavity for an extended period of time and preventing more than
one turnover from occurring. Rhodanese refolded with a half-time of 7 minutes. Re-
folding experiments using malate dehydrogenase (MDH) as a substrate protein were also
said to be consistent with this mechanism, since little unfolding (as measured by
deuterium exchange) was seen immediately following ATP/GroES addition to SR1/MDH
(41). Significant de-protection was seen only at later time points following a period of
isolation in the SR1 cavity. Such experiments, however, significantly perturb the GroEL
reaction cycle by artificially extending the time SP spends in the central cavity (5). As

15
will be shown in this dissertation, SP is given only, at most, 12 seconds to fold in the
central cavity before it is released. Therefore, substrates that refold in 7 minutes within
the GroEL/GroES complex are clearly not doing so under physiological conditions. In
other studies with rhodanese, in which GroES is allowed to release from GroEL on its
normal time scale, multiple rounds of SP binding and release are necessary in order for
rhodanese to reach the native state (42). Therefore, experiments which artificially extend
the lifetime of the GroEL/GroES complex are ignoring what is happening to the SP
during the multiple turnovers.
The active unfolding model views GroEL as a molecular machine, one that does
actual work on the SP. In this view, ATP binding and hydrolysis is coupled to the
forceful unfolding of the protein. This type of mechanism has been described by Todd et
al. (19) as an “iterative annealing mechanism” in that misfolded proteins can bind
repeatedly to GroEL, with each round of subsequent ATP binding and hydrolysis causing
unfolding of the misfolded substrate. Repeated binding and unfolding, or annealing,
cycles optimize the final yield of properly folded substrate (5, 19). When the apical
domains move upon ATP binding, the bound substrate is pulled apart and unfolded as the
substrate binding sites move and twist away from each other (8, 29). By doing so, the
protein now has another chance to fold to the native state. Once unfolded the protein is
given a chance to refold within the cavity, but is ejected from the cavity upon the release
of GroES whether it has folded correctly or not (20, 29). Since the cycle time of a GroEL
ring is about 7-13 seconds in the presence of SP at 37°C at 100 mM K+, the protein
would have to be unfolded within that time span. This was demonstrated using
hydrogen/tritium exchange experiments with labeled Rubisco (8). In fact, an unfolding

16
event occurred within five seconds, consistent with unfolding occurring during the
domain movements and before the protein is suspended in the central cavity.
Hydrogen/deuterium exchange experiments have also demonstrated the viability of
iterative annealing in GroEL, in that GroEL is able to repeatedly cause de-protection of
core amide protons during rounds of ATP binding and hydrolysis (43-45). Finally, a
theoretical study (46) has been done which has modeled SPs as beads on a string, folding
in a cubic box representing the central cavity. The interior environment of the box was
alternately switched between being hydrophobic and hydrophilic. The studies concluded
that the yield of native protein was maximized when the cavity environment changed
relatively rapidly, consistent with the iterative annealing mechanism (46). The passive
mechanism would prefer that the central cavity remain hydrophilic indefinitely.
Recent experiments have shown that GroEL is required for the refolding of
aconitase, a substrate that is too large to fit within the central cavity (47). Therefore, at
least in this case, encapsulation and the sequestration of the SP cannot lead to its
refolding. Since the GroEL is binding the aconitase, however, it is tempting to suggest
that its refolding is caused by active unfolding, where encapsulation is not necessarily
required. Examples such as these, along with the work presented in this thesis, show that
active unfolding of SP by GroEL is an attractive and plausible mechanism to explain the
actions of GroEL on at least some of its known substrates.
1.6 Allosteric Domain Movements Drive Unfolding
If active unfolding does take place, then it must be driven by the large, allosteric
domain movements that occur in response to ATP similar to what has been hypothesized
to occur in Hsp70 (3). Therefore, in order to definitively show that active unfolding

17
occurs, a detailed understanding of GroEL’s complex ATP binding properties must be
obtained. Horovitz and colleagues have developed a model of nested cooperativity to
explain why GroEL’s ATPase activity rises at increasing, relatively low ATP
concentrations but then decreases as [ATP] is increased even further (Figure 1-6) (33).
Figure 1-6: ATPase Rate Dependence on [ATP]. These data, taken from Yifrach and Horovitz (33), show the unusual [ATP] dependence of GroEL ATPase activity which prompted the formulation of the nested cooperativity model.
Ligand-free GroEL has both rings in their most compact form and with their hydrophobic
binding sites both facing the central cavity. This is known as the TT state. The T state
has a high affinity for substrate protein (due to the exposed binding sites) and low affinity
for ATP. Actually, as originally defined, it was assumed that the T state could not bind
or hydrolyze ATP, an exclusive binding assumption. Upon the binding of ATP, the T →
R transition occurs where the apical domains begin to move upward and the binding sites
move apart (Figures 1-2 and 1-4). The R state has a low affinity for substrate and a high
affinity for ATP. According to the model of nested cooperativity, ATP binds with
positive cooperativity within the same ring which undergoes the T → R transition in a
concerted all or none motion: an MWC allosteric transition (48). Between rings, ATP
binds with negative cooperativity and thus GroEL undergoes a stepwise TT → TR → RR

18
transition with increasing concentrations of ATP: a KNF transition (49). In this model,
the ATPase rate rises with increasing, relatively low ATP concentrations due to the
population of the TR state, in which the T ring is inactive and the R ring is highly active.
(The use of the word “highly” here is relative; GroEL actually has a very weak ATPase
rate, about 2-3 turnovers/minute under normal conditions). The ATPase rate decreases at
high [ATP] due to the shifting of the equilibrium to the RR state, in which the two R
rings combined have a lower activity than the R ring alone in the TR state. Two
allosteric constants can be defined for these transitions: L1=[TR]/[TT] and
L2=[RR]/[TR], with L2 << L1 due to the inter-ring negative cooperativity (33, 50).
Because protein unfolding is coupled to these structural transitions, these constants define
what is happening to a substrate when bound to GroEL. These constants, especially L1 in
the presence of GroES, dictate how long a substrate is exposed to a hydrophobic (T state)
versus hydrophilic (R state) environment and consequently how long a substrate remains
bound to GroEL versus how long it is encapsulated within the cavity. ATP binding
increases L1 since the R state has a higher affinity for ATP, and SP binding decreases L1
since the T state has a higher affinity for the substrate (33, 34). However, it is difficult to
relate these equilibrium constants to the actual GroEL mechanism, since, in the presence
of GroES, the system is never at equilibrium. Because GroES and ATP are always
present, GroEL is constantly in motion. A more useful quantitative description would
involve the rate constants of each transition. However, this is also difficult to accomplish
since it is hard to isolate one structural transition from another in real time.

19
1.7 Specific Aims
The goal of this work was to gain a better understanding of the allosteric transitions
which accompany the potential unfolding of substrates by GroEL, and the transitions
which accompany other steps in the GroEL reaction cycle. This topic was approached in
three general ways, which are described here briefly, and expounded on later in the
introductions to the individual dissertation chapters:
1) In order to better understand the T → R and subsequent R → R’ transitions,
which are the important events in SP unfolding, it was critical to be able to control
these transitions. Previous work in the lab made use of a GroEL mutant in which
an intrasubunit salt bridge, D83/K327, that is present in the T state but broken in
the R state, was replaced with cysteine residues (51). This allowed for the
controlled introduction of disulfide bonds or chemical cross-links that served to
lock rings into the T conformation. For this dissertation, a detailed study was
done on a mutant in which an intersubunit salt bridge was replaced with a double
cysteine pair. This salt bridge, R197/E386, was chosen because introduction of
disulfide bonds or chemical cross-links could potentially prevent the large,
twisting motion which the apical domains must undergo during the T → R and the
subsequent R → R’ transition and which would serve as a driving force in SP
unfolding. The effect of cross-linking this mutant on the various aspects of
GroEL behavior was examined using a wide variety of techniques.
2) The effect of substrate protein on GroEL’s ATPase activity and the T/R
equilibrium was examined. This work expanded on data obtained by Yifrach and
Horovitz (34) in which the addition of unfolded SP increased ATPase activity

20
approximately 4-fold. They attributed this increase in rate to a shift in the
equilibrium from the RR state to what they considered to be the more active TR
state. The studies presented here attempt to discover whether or not this is the
actual reason for substrate stimulation. They expand on this result by using a
wider range of SPs, and by looking at the effect of SP on ATPase activity in real
time. The double cysteine mutants were used in these experiments in order to
determine the effect of SP on GroEL that has been locked in the T state. The
ultimate goal of these studies was to design a general mechanism that could
explain the effects of SP, cross-linking, and the T → R transition on ATPase
activity.
3) The release of GroES from the GroES7-GroEL14 bullet complex in response to
ATP binding to the trans ring was examined in great detail. This event has been
implicated as being the rate-limiting step in the GroEL reaction cycle (17). This
work expands on a result obtained by Rye et al. (17) in which they found that SP
increases the rate of GroES release from the bullet complex. The work presented
here addresses the underlying reasons for this result, and specifically concentrates
on whether the allosteric state of the trans ring affects the rate of release. This
work makes use of GroEL and GroES mutants labeled with fluorescent probes
that can act as a fluorescence resonance energy transfer (FRET) pair (52).
Release kinetics were studied in a stopped-flow fluorescence instrument using
these labeled mutants under a wide range of conditions.
21
Chapter 2
General Methods and Experimental Procedures

22
This chapter details the experimental procedures and laboratory techniques used
in all studies presented in this dissertation. Techniques that are more specific to the
studies in an individual chapter are discussed in the methods section of that chapter.
2.1 A Note on Protein Concentration
All GroEL and GroES concentrations noted in this dissertation, unless otherwise
indicated, are the monomer concentrations. In situations where the oligomer
concentrations are informative, they will be distinguished by the presence of subscripts,
ie. GroEL14 and GroES7.
2.2 Site Directed Mutagenesis of GroEL and GroES
All GroEL and GroES mutants were prepared using plasmids pGEL1 and pGES1
respectively (a kind gift of Dr. Ed Eisenstein). These plasmids have the E. coli GroEL or
GroES gene cloned in a pkk233-2 expression vector (Amersham) (53), a vector that
confers ampicillin (Amp) resistance. Site-directed mutagenesis was accomplished using
either the U.S.E. Mutagenesis Kit (Amersham) or the Quick-Change kit (Stratagene),
using the protocols detailed in the kits. The mutagenic primers used for each mutant are
given in the individual chapters. The primers were designed in all cases possible to add
or delete a convenient restriction site in order to provide an easy way of detecting
potentially successful mutagenesis even before sequencing. In the cases where the
Stratagene kit was used for mutagenesis, ordering primers that were gel-purified was
found to be a critical factor in successful mutagenesis due to this kit’s reliance on PCR as
its method of introducing mutations. All restriction enzymes were purchased from
Roche. Small-scale plasmid preps of 3 ml of culture or less (minipreps) were done using
standard SDS/NaOH lysis and phenol/chloroform extraction protocols (54) or were done

23
using the Qiagen Qiaprep Spin Miniprep Kit. Plasmid extractions of 100 ml of culture
were done with the Qiagen Hi-Speed Plasmid Midi Kit. For all mutants, the final mutated
plasmid was transformed into E. coli strain JM105 (Amersham) by electroporation using
a BTX electroporator. Once transformed, glycerol stocks and purified plasmid were
prepared from the same single colony from an overnight plate. All plasmids were
sequenced at the University of Maryland DNA sequencing facility. For GroEL mutants,
three sequencing primers were required to obtain full coverage of the sequence with some
overlap. These primers were EL5’ (5’CATCCGGCTCGTATAATGTG3’), EL3’
(5’ATCAGACCGCTTCTGCG TTC3’), and EL570
(5’GAAGGTATGCAGTTCGAC3’). For GroES mutants, only EL5’ and EL3’ were
used, and these provided a full read from both the 5’ and 3’ directions. All mutants
discussed in this dissertation had confirmed correct sequences.
2.3 Polyacrylamide Gel Electrophoresis (PAGE)
Gel solutions were prepared according to standard recipes (54, 55) using a pre-
mixed 30% acrylamide/bis-acrylamide (29:1) solution from Bio-Rad. Unless otherwise
noted, gels were poured using 0.75 mm spacers 10 x 8 cm glass plates. The apparatus
used was the Hoefer SE250 Mini-Vertical unit. Gels were typically run at 15 mAmps per
gel, using Tris/glycine/SDS running buffer. Gels were visualized by staining with
PhastBlue (a Coomassie Blue variant by Amersham), and de-staining with 30%
methanol/10% acetic acid followed by 10% ethanol/10% acetic acid. Typically, gels
contained SDS and loading buffer contained DTT. Occasionally, native PAGE was
performed instead, and this was done by leaving the SDS out of the gel solutions, loading
buffer, and running buffer. More often, non-reducing SDS-PAGE was needed, and this

24
was done simply by leaving DTT out of the loading buffer. When quantitative results
were desired, special care was taken to ensure that all gel plates were clean and dust-free.
The first and last lanes were usually not used for quantitation due to band curvature. 40
pmols of protein was found to be an ideal amount of protein for quantitation, and GroEL
was usually quantitated on a 12% gel. Gels were quantitated by densitometry using the
PDSI hardware and ImageQuant software from Molecular Dynamics.
2.4 Purification of GroEL
The importance of using GroEL which was as pure as possible in these
experiments cannot be overstated. It is a point that is insufficiently appreciated in much
of the published work on GroEL. Contaminating protein can have significant effects on
measurements of ATPase rates, to name just one example. In a few cases, results here
differ with the published results of other groups. In most of these cases, these differences
can be attributed to the impurity of the GroEL used to obtain the published results.
GroEL was purified according to established protocols with several modifications.
4.5 to 6 liters of JM105 E. coli containing the pGEL1 plasmid, with or without mutations,
were grown at 37°C in LB media containing 100 ug/ml Amp to an optical density of
about 0.3 at 600 nm. Protein overexpression was initiated with the addition of IPTG to a
final concentration of 0.5 mM, at which point the temperature was decreased to 30°C.
Induction was allowed to proceed for 12-16 hours. Cells were harvested by
centrifugation and resuspended in lysis buffer containing 50 mM Tris pH 8, 1 mM
EDTA, 5 mM MgCl2, 1 mM DTT, 5 mM ε-amino-n-caproic acid, and 1 mM
benzamidine. The cells were lysed by sonication using a Branson sonicator at power
level 5 with a 50% duty cycle for 75 seconds for each 50 ml portion of cell suspension.

25
Following removal of cell debris by centrifugation at 32,500 x g, 4°C for 30 minutes,
nucleic acid was removed by precipitation with streptomycin sulfate at a final
concentration of 6 mg/ml. Precipitate was removed by centrifugation at 32,500 x g, 4°C
for 60 minutes, and the supernatant was collected as the crude lysate. The lysate,
typically 150 ml, was loaded onto a 500 ml DEAE Sepharose Fast Flow column
(Amersham) which had been equilibrated with 500 ml of 200 mM Tris pH 8 and 1800 ml
of Buffer A (50 mM Tris pH 8, 1 mM EDTA, 5 mM MgCl2, and 1 mm DTT). Following
elution of the flow-through, the remaining protein was eluted with a 2L gradient from 0
mM to 500 mM NaCl on a Pharmacia FPLC System. The fractions containing GroEL (as
determined by SDS-PAGE) typically eluted at a conductivity of about 28 mS, with a total
volume of 170 ml. To concentrate this large volume, saturated ammonium sulfate was
added to a final concentration of 65% and the solution was left stirring at 4°C overnight.
The following day, the precipitate was recovered by centrifugation at 10,000 x g, 4°C for
30 minutes, and resuspended in 15-20 ml of S300 buffer (50 mM Tris pH 7.5, 1 mM
EDTA, 10 mM MgCl2, and 1 mM DTT). The protein was then de-salted by loading it
onto a 300 ml S300 Sephacryl gel filtration column (Amersham) that had been
equilibrated with 300 ml of S300 buffer. The flow-through (about 60 ml) was collected
and concentrated to about 10 mg/ml using Centriplus concentrators (Millipore) with a
MW cutoff of 50,000 Da. This crude GroEL was then stored at -80°C until the
subsequent steps could be performed.
The final part of the purification involved an acetone precipitation modified from
Voziyan and Fisher (56), and was the critical step in obtaining high purity GroEL. The
idea behind this step is that due to GroEL’s ability to bind hydrophobic, unfolded
26
proteins, it would be stable in the presence of a hydrophobic solvent. Pure acetone was
added drop-wise to crude GroEL, which was being rapidly stirred, to a final
concentration of 45%, resulting in the precipitation of all proteins in the solution.
Following centrifugation at 32,500 x g, 25°C for 30 minutes, the pellet was resuspended
in 10 mM Tris pH 7.5, 10 mM MgAc, and 1 mM DTT. Only GroEL is able to resuspend
in the buffer, whereas the contaminating proteins remain precipitated. This precipitate
was removed by centrifugation at 32,500 x g, 25°C for 60 minutes and the supernatant,
containing pure GroEL, was collected. To remove any trace of acetone and to
concentrate the sample, saturated ammonium sulfate was added to a final concentration
of 65%, followed by centrifugation at 10,000 x g, 25°C for 30 minutes. GroEL was
resuspended in 10 mM Tris pH 7.5, 10 mM MgAc (and 1 mM DTT in the case of
mutants containing cys residues) and de-salted on a PD-10 column (Amersham). The
final product was concentrated in the Centriplus-50 concentrators, aliquotted, and frozen
at -80°C. The final concentration was checked by measuring absorbance at 280 nm,
using an extinction coefficient of 9600 M-1cm-1.
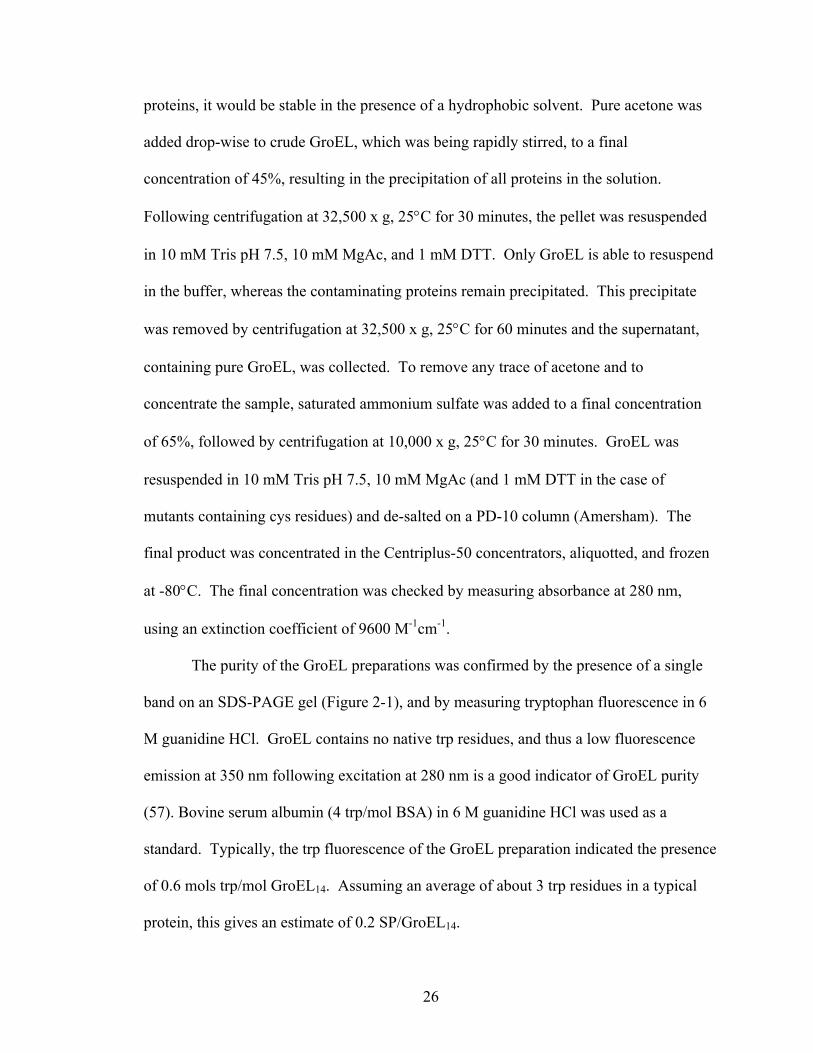
The purity of the GroEL preparations was confirmed by the presence of a single
band on an SDS-PAGE gel (Figure 2-1), and by measuring tryptophan fluorescence in 6
M guanidine HCl. GroEL contains no native trp residues, and thus a low fluorescence
emission at 350 nm following excitation at 280 nm is a good indicator of GroEL purity
(57). Bovine serum albumin (4 trp/mol BSA) in 6 M guanidine HCl was used as a
standard. Typically, the trp fluorescence of the GroEL preparation indicated the presence
of 0.6 mols trp/mol GroEL14. Assuming an average of about 3 trp residues in a typical
protein, this gives an estimate of 0.2 SP/GroEL14.

27
Figure 2-1: Purification of GroEL. Lane 1= MW standards. Lane 2= Crude lysate. Lanes 3-7= Fractions from DEAE column. Lane 8= Pool from S300 de-salting column. Fraction 9= Pure GroEL following acetone treatment.
Finally, it was confirmed that, under the conditions used in all experiments,
GroEL was indeed a 14-mer and was not separating into either monomers or single rings.
This was done for GroELWT, and for all GroEL mutants, using analytical gel filtration
chromatography.
2.5 Purification of GroES
GroES was purified using methods modified from published protocols (58).
Crude cell lysate from 4.5 L of JM105 containing plasmid pGES1 with or without
mutations was prepared using the procedure described above for GroEL. This lysate was
then placed in an 80°C water bath and constantly stirred until the lysate temperature was
70°C. This temperature was maintained for 10 minutes. Precipitated proteins were
removed by centrifugation at 32,500 x g, 25°C for 30 minutes. Saturated ammonium
sulfate was then added to the supernatant to a final concentration of 65%, and the
precipitation was allowed to stir overnight at 4°C. Following centrifugation at 10,000 x
1 2 3 4 5 6 7 8 9
28
g, 4°C, for 30 minutes, the pellet was resuspended in 15-20 ml of G25 buffer (10 mM
Tris pH 7.5, 0.1 mM EDTA, 0.1 mM DTT). This was de-salted on a 150 ml G25M
column (Amersham) which had been equilibrated with 300 ml G25 buffer. The 60 ml of
flow-through at pH 7.5 was then jumped to around pH 5.1 by the rapid addition of 80 ml
50 mM NaOAc pH 5. Three separate runs were done on a 75 ml SP Sepharose HP
column (Amerhsam) equilibrated with 400 ml 50 mM NaOAc, 0.1 mM EDTA, 0.1 mM
DTT. For each run, one portion of the protein solution (about 50 ml) was loaded onto the
column. Following elution of the flow-through, GroES was eluted with a 750 ml gradient
from 0 mM to 200 mM NaCl. Fractions containing GroES as determined by SDS-PAGE
were pooled and saturated ammonium sulfate was added to a final concentration of 65%.
The ammonium sulfate precipitations from all three runs were combined and allowed to
stir overnight. Following centrifugation at 10,000 x g, 4°C, for 30 minutes, the pellets
were resuspended in 5 ml 10 mM Tris pH 7.5 and the resulting solution was de-salted on
a series of PD-10 columns equilibrated in the same buffer. This de-salted solution was
concentrated on Centricon concentrators with an MW cut-off of 10,000 Da. The final
concentration was determined by measuring the absorbance at 280 nm using an extinction
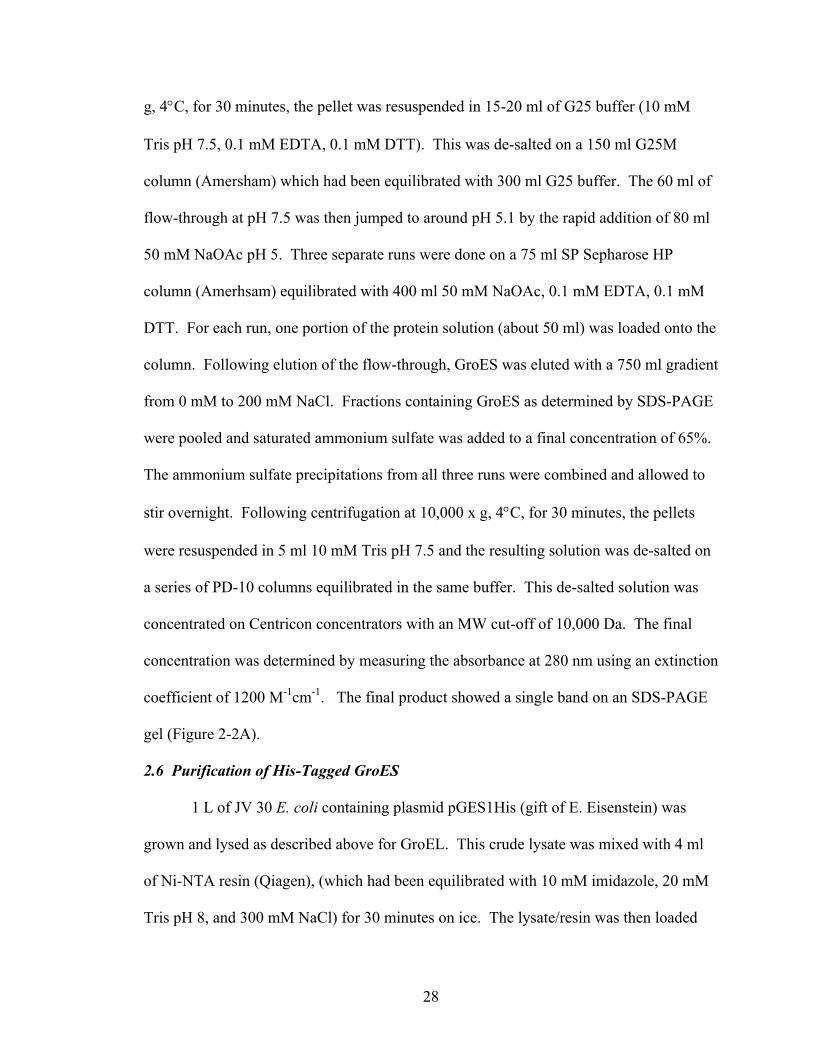
coefficient of 1200 M-1cm-1. The final product showed a single band on an SDS-PAGE
gel (Figure 2-2A).
2.6 Purification of His-Tagged GroES
1 L of JV 30 E. coli containing plasmid pGES1His (gift of E. Eisenstein) was
grown and lysed as described above for GroEL. This crude lysate was mixed with 4 ml
of Ni-NTA resin (Qiagen), (which had been equilibrated with 10 mM imidazole, 20 mM
Tris pH 8, and 300 mM NaCl) for 30 minutes on ice. The lysate/resin was then loaded

29
Figure 2-2: Purification of GroES. A) Purification of wild-type GroES (12% gel). Lane 1= MW standards. Lane 2= Crude lysate. Lane 3= Post-heat treatment. Lane 4= Pool from G25 de-salting column. Lane 5-7= Pools of the three SP column runs. Lane 8=Final product, pure GroES. B) Purification of his-tagged GroES (15% gel). Lane 1= Crude lysate. Lane 2-4= 60 mM imidazole washes. Lane 5= blank. Lane 6= 250 mM imidazole elution. Lane 7= blank. Lane 8 = Final product, pure his-tagged GroES. Note the faint, lower band of wild-type GroES which is the non-induced GroES produced normally by the cells.
into a syringe barrel and washed with 60 mM imidazole, 20 mM Tris pH 8. For the first
few washes, this buffer also contained 300 mM NaCl, which was left out of the last wash.
His-tagged GroES was eluted from the column with 250 mM imidazole, 20 mM Tris pH
8. The eluent was concentrated in a Centriplus-10 and then buffer exchanged on a PD-10
equilibrated in 10 mM Tris pH 7.5. The PD-10 eluent was then concentrated, aliquotted,
and stored at -80°C. The final concentration was determined as above for wild-type
GroES, and the final product was a single band on an SDS-PAGE gel (Figure 2-2B).
2.7 Preparing GroEL Cysteine Mutants for Cross-Linking or Labeling
In order to ensure that all thiols were fully available for cross-linking or labeling,
freshly reducing pure GroEL samples was essential. This was done by adding 10-20 mM
DTT to enough GroEL as was required for that day’s procedure and allowing it to react
30
for 30 minutes. The DTT was then removed by de-salting on a PD-10 column
equilibrated in 10 mM Bis-Tris pH 7.0, 10 mM MgAc, followed by concentration with a
Centricon-30 (Millipore) to a useful concentration. To eliminate oxidation by any
contaminating metal ions that might be present, all buffers were treated with Chelex resin
(Sigma) to remove these ions (prior to Mg2+ addition). Under these conditions, no
oxidation was detectable on a non-reducing SDS-PAGE gel.
2.8 GroEL Cross-linking
Two methods were used to induce disulfide bond formation in GroEL double
cysteine mutants. The first was to use catalytic amounts of copper (CuCl2), and the
second was to use stoichiometric amounts of diamide, a reagent capable of forming
disulfide bonds in a non-catalytic fashion (59). Unless otherwise noted, the GroEL
concentration during these reactions was 40 µM. To quench these reactions, free
cysteines were blocked with 40 mM N-ethylmaleimide (NEM, from Sigma) and 100 mM
Tris pH 6.8. To quantitate oxidation, samples were boiled for 1 minute to expose the
native, buried cys residues to NEM, and then diluted with SDS loading blue without
DTT. The samples were boiled for an additional two minutes, and then loaded on the gel.
Chemical cross-linking reagents were also used in some experiments to insert
irreversible cross-links of varying lengths between two cysteines (60, 61). These
reagents were phenylenedimaleimides in the ortho, meta, and para conformations
(oPDM, mPDM, and pPDM, respectively). mPDM was purchased from Sigma; oPDM
and pPDM were purchased from Research Organics. 50 mM stocks of these reagents
were made in DMSO and stored at -80°C. These reagents were added stoichiometrically
in a volume of DMSO which did not exceed 10% of the total reaction volume. Cross-

31
linking was found to be complete in less than 5 seconds at room temperature. Free
cysteines were blocked with NEM and cross-linking was quantitated by SDS-PAGE.
2.9 Coupled-enzyme ATPase Assay
The most commonly used method to measure ATPase activity in this dissertation
makes use of a coupled-enzyme system that ties the production of ADP by GroEL to the
oxidation of NADH by lactate dehydrogenase (LDH) according to the following scheme
(Figure 2-3). This system has the benefit of allowing the monitoring of ATPase activity
in real time, and has the added advantage of a built-in ATP regenerating system that
ensures a constant ATP concentration. The system is dependent on the coupling enzymes
and reagents (PK, LDH, NADH, and PEP) being in excess over GroEL to ensure an
entirely coupled response. The oxidation of NADH was monitored at 340 nm in a
Hewlett Packard 8453 UV/Vis spectrophotometer in kinetics mode. The system was
programmed to collect data points every second for user-specified amounts of time. The
cuvet holder was connected to a circulating water bath (VWR) to allow temperature
regulation. This instrument does not require the cuvet to be covered during data
collection, which allowed for the addition of reagents at any time during a measurement.
Thus, rate changes in response to added reagents could be monitored in real time (Figure
2-4). Changes in absorbance were measured over various time intervals within a given
trace. Non-linear or wavy traces were discarded. ATPase rates were calculated using the
change in absorbance over a given time interval, the extinction coefficient of NADH
(6.22 mM-1cm-1), and by accounting for the GroEL concentration. Unless otherwise
noted, the conditions used for all assays was 2 µM GroEL, 50 mM Tris pH 7.5, 100 mM

32
Figure 2-3: Coupled Enzyme ATPase Assay. Hydrolysis of ATP by GroEL is directly coupled to the oxidation of NADH by LDH through the intermediary enzyme, PK, which also serves to regenerate ATP. NADH oxidation is monitored at 340 nm since it absorbs at this wavelength and NAD+ does not.
0.4
0.5
0.6
0.7
0.8
0.9
1
1.1
1.2
1.3
1.4
0 50 100 150 200 250Time (sec.)
Abs
orba
nce
340
nm
Figure 2-4: Monitoring ATPase Rate in Real Time. An example of a kinetic trace showing the decrease in absorbance at 340 nm. The trace begins by measuring the ATPase activity of GroEL alone. At the arrow, GroES was added mid-run and the rate slows. The outlying points are mixing artifacts created by the mixer interrupting the light beam.

33
KAc, 10 mM MgAc, 0.2 mM PEP, 0.2 mM NADH, 4 units LDH, and 5 units PK at
37°C.
2.10 Preparing Unfolded Protein Substrates
The two SPs most commonly used in these experiments were α-lactalbumin (α-
LA, bovine) and malate dehydrogenase (MDH, mitochondrial, from pig heart). α-LA
was purchased from Sigma and MDH from Roche, and neither was further purified
before use. α-LA is known to remain unfolded in the presence of DTT and the absence
of Ca2+ (34, 62), and therefore it was denatured in a large batch and stored at -80°C. Due
to its ability to refold spontaneously (63, 64), MDH was freshly denatured before each
experiment. To unfold both of these SPs, a concentrated aliquot of the protein was
diluted into 2 mM Tris pH 8, 10 mM DTT and allowed to react for 10 minutes. The SPs
were then diluted 5-fold into 0.01 N HCl and allowed to denature for 1 hour. MDH was
used as is; α-LA was buffer exchanged on a PD-10 into 10 mM Tris pH 7.5, 10 mM
MgAc and stored at -80°C until needed. Concentration was determined at 280 nm using
extinction coefficients of 28,400 M-1cm-1 form α-LA and 6880 M-1cm-1 for MDH.
2.11 Computer Software
All protein structures shown in this dissertation were made with the free Protein
Explorer software package at www.proteinexplorer.org (65). Unless otherwise noted, all
data plotting and fitting was done with KaleidaGraph Ver. 3.5 (Synergy Software).

34
Chapter 3
Characterization of a GroEL Intersubunit Double Cysteine Mutant:
R197C / E386C

35
3.1 Introduction
Like any machine, if GroEL is going to perform work, it must incorporate a
“power stroke” into its mechanism of action. GroEL’s power stroke is provided by the
rigid body motions of its subunits when it undergoes its allosteric transitions upon
binding ATP. A machine’s effectiveness increases when all of its parts move in concert.
Likewise, it is reasonable to assume that GroEL could exert a maximum unfolding force
by having all of its subunits move in a single, concerted motion. Concerted motion has
already been suggested by molecular dynamic simulations (38) and by the observation
that the movement of one subunit is sterically hindered by the adjacent subunit unless the
adjacent subunit is moving as well (14). Because concerted motion is a critical factor in
forced unfolding, a further demonstration of its existence was sought. To accomplish
this, a way of controlling the T→ R and R→ R’ structural transitions was needed.
Extensive work in this laboratory (G. Curien, unpublished) has made use of a
GroEL mutant, GroELIAX, in which a critical T state salt bridge, D83/K327, has been
replaced by a pair of cysteine residues (51). This salt bridge connects the equatorial and
apical domains within a single subunit in the T state (Figure 3-1, a and b). In the R and
R’ states, this salt bridge is broken. The introduction of a double cysteine pair allows for
the insertion of disulfide bonds or chemical cross-linkers with the intent of tethering a
subunit in the closed, T conformation. The hypothesis of this previous work was that a
single disulfide bond or cross-link within a ring would be sufficient to tether the entire
ring in the closed state, thus demonstrating concerted motion. This was indeed shown to
be the case, and along with this, several other properties of the T and R states were
discovered.

36
The essential conclusions drawn from the studies with GroELIAX are as follows
(G. Curien, unpublished results). By carefully setting the experimental conditions, ie.
eliminating contaminating metal ions, the introduction of either disulfide bonds or
chemical cross-links into the double cys pair can be done in a controlled manner.
GroELIAX can be oxidized to any point on the reaction coordinate between 0% and 100%
subunits oxidized. Previous studies with this mutant were limited to fully reduced or
fully oxidized protein (51). Only one disulfide bond or cross-link is necessary to tether
an entire ring in the T state and prevent GroES binding. In other words, the T→R’
C
B
D
A
Figure 3-1: Two T State Salt Bridges Were Replaced With Cys Pairs. A,B) The GroELIAX D83/K327 interdomain, intrasubunit salt bridge is present in the T state (A) but breaks in the R’ state (B). The Cα-Cα distance between these two residues is 9 Å in the T state and 37 Å in the R’ state. C,D) The GroELIRX interdomain, intersubunit salt bridge R197/E386 salt bridge is present in the T state (C) but breaks in the R’ state (D). The Cα-Cα distance between these two residues is 12 Å in the T state and 84 Å in the R’ state. These structures were made with PDB file 1aon (14).
37
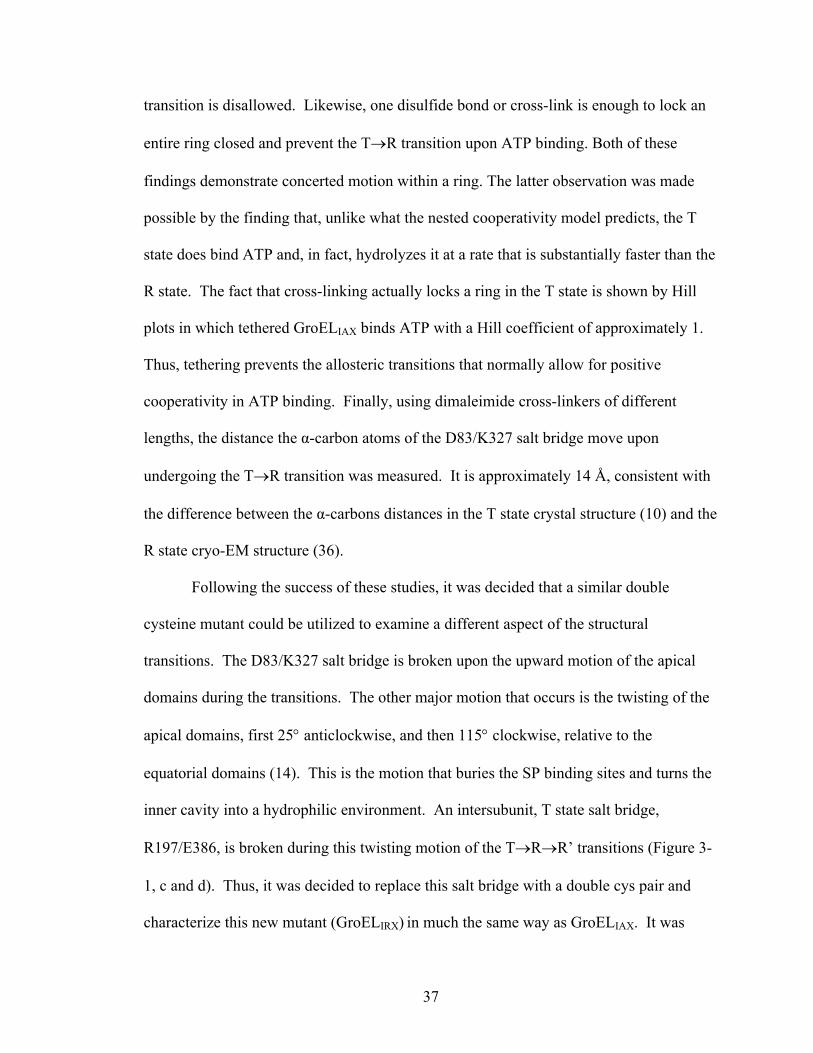
transition is disallowed. Likewise, one disulfide bond or cross-link is enough to lock an
entire ring closed and prevent the T→R transition upon ATP binding. Both of these
findings demonstrate concerted motion within a ring. The latter observation was made
possible by the finding that, unlike what the nested cooperativity model predicts, the T
state does bind ATP and, in fact, hydrolyzes it at a rate that is substantially faster than the
R state. The fact that cross-linking actually locks a ring in the T state is shown by Hill
plots in which tethered GroELIAX binds ATP with a Hill coefficient of approximately 1.
Thus, tethering prevents the allosteric transitions that normally allow for positive
cooperativity in ATP binding. Finally, using dimaleimide cross-linkers of different
lengths, the distance the α-carbon atoms of the D83/K327 salt bridge move upon
undergoing the T→R transition was measured. It is approximately 14 Å, consistent with
the difference between the α-carbons distances in the T state crystal structure (10) and the
R state cryo-EM structure (36).
Following the success of these studies, it was decided that a similar double
cysteine mutant could be utilized to examine a different aspect of the structural
transitions. The D83/K327 salt bridge is broken upon the upward motion of the apical
domains during the transitions. The other major motion that occurs is the twisting of the
apical domains, first 25° anticlockwise, and then 115° clockwise, relative to the
equatorial domains (14). This is the motion that buries the SP binding sites and turns the
inner cavity into a hydrophilic environment. An intersubunit, T state salt bridge,
R197/E386, is broken during this twisting motion of the T→R→R’ transitions (Figure 3-
1, c and d). Thus, it was decided to replace this salt bridge with a double cys pair and
characterize this new mutant (GroELIRX) in much the same way as GroELIAX. It was

38
expected that GroELIRX would provide many of the same results as its predecessor,
primarily a demonstration of concerted motion. This did not entirely turn out to be the
case.
3.2 Methods Specific to Chapter 3
3.2.1 Mutagenesis The R197C and E386C mutations were inserted into the
pGEL1 plasmid using the U.S.E mutagenesis kit. The mutagenic primers were as
follows: R197C: GGTATGCAGTTCGACTGCGGATATCTGTCTCCTTACTTCATC,
E386C: GTGGGTGCTGCTACATGTGTTGAAATGAAAGAG. R197C inserts a new
EcoRV site and E386C inserts a new BspLU11I site.
It was realized at some point during these studies that wild-type GroEL subunits
expressed from the native GroEL gene in the bacteria would limit the extent of cross-
linking. In an attempt to overcome this, the mutant plasmid was transformed into a cell
line, MGM100, in which the native GroEL gene is under the transcriptional control of a
pBAD promoter (66). This promoter is activated by growing the cells in minimal media
containing arabinose and suppressed by growing the cells in media containing glucose.
Thus, wild-type expression could supposedly be expressed by growing the cells in
glucose. This turned out to make little difference in the eventual cross-linking results, but
this is noted here since much of the protein used came from this strain.
3.2.2 Gradient Gels 3-9% gradient gels were poured using a small Hoeffer
gradient gel mixer with 9% resolving gel solution in the front chamber and 3% resolving
gel solution in the rear chamber. The mixer was held above a magnetic stir plate and a
stir bar was placed in the front chamber to ensure proper mixing. Both valves were
opened and the solution was poured through rubber tubing and a thin, glass pipet into a

39
gel cassette 10.5 cm tall with 1.5 mm spacers. Once polymerized, a 3% stacking gel was
poured on top.
3.2.3 Purification of Phosphate Binding Protein PBP A197C was purified
essentially according to the published procedures with a few modifications (67, 68). A
10 ml LB starter culture containing 12.5. mg/L tetracycline was inoculated with a single
colony of E. coli transfected with a plasmid containing the Phos gene. This gene
expresses the PBP protein when the cells are grown under low phosphate conditions. The
saturated starter culture was diluted into 100 ml LB/Tet and grown overnight. 40 ml of
this LB culture was added to each of 2 flasks containing 1 L of TG Plus minimal media
(67) with 640 µM phosphate. These large cultures were grown to an OD600 of 1.2. The
cells were pelleted by centrifugation, resuspended in TG Plus media containing 64 µM
phosphate, and incubated overnight at 37°C under these low phosphate conditions to
produce PBP. The following day, the cells were harvested by centrifugation and
resuspended in 10 mM Tris pH 7.6, 30 mM NaCl. The cells were pelleted again, washed
in fresh buffer, then pelleted once again. The cells were resuspended in 50 ml 33 mM
Tris pH 7.6. Then, 50 ml of 33 mM Tris pH 7.6, 0.1 mM EDTA, 40% sucrose was added
rapidly, and the cells were once again pelleted. To initiate the osmotic shock which lysed
the periplasm of the cells, the cells were rapidly resuspended in 100 ml 0.5 mM MgCl2
and stirred. The lysed solution was then centrifuged, and the supernatant, containing
PBP, was brought to 10 mM Tris pH 7.6. This solution was split into two portions. Each
portion was loaded onto a 25 ml Q Sepharose HP column (Amersham) equilibrated with
10 mM Tris pH 7.6, 1 mM MgCl2. A 250 ml gradient from 0 mM to 200 mM NaCl was
run following elution of the flow-through. Fractions containing PBP as judged by SDS-
40
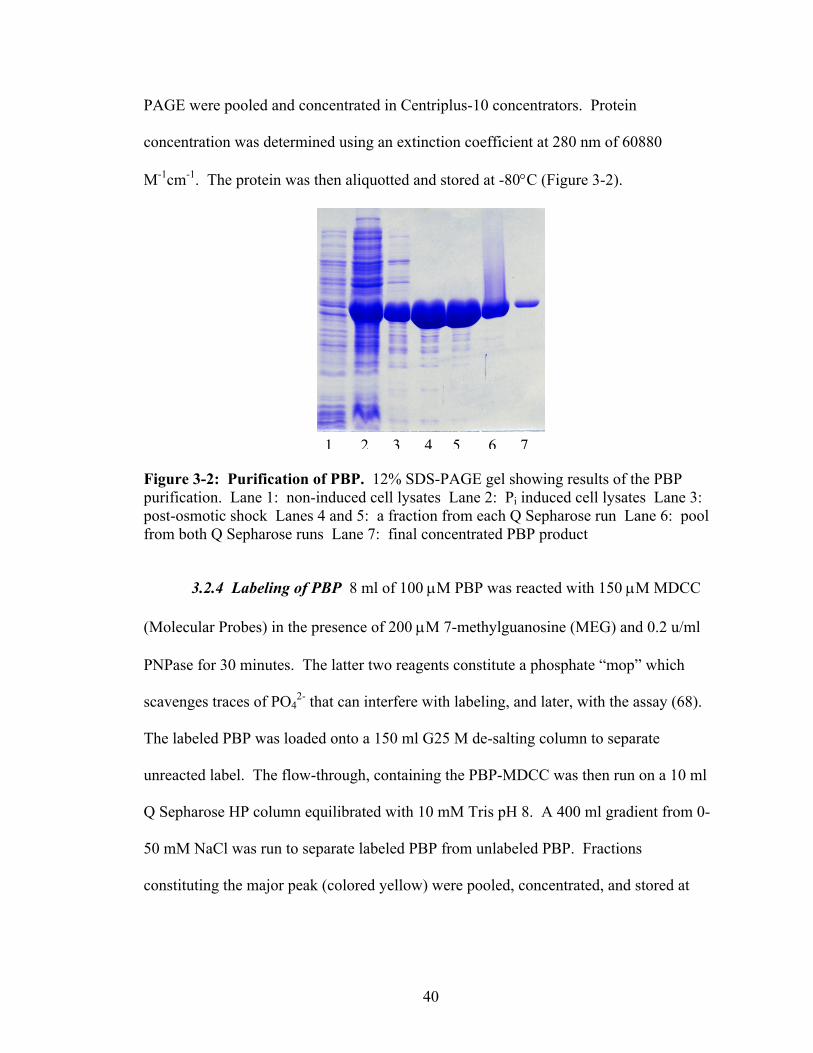
PAGE were pooled and concentrated in Centriplus-10 concentrators. Protein
concentration was determined using an extinction coefficient at 280 nm of 60880
M-1cm-1. The protein was then aliquotted and stored at -80°C (Figure 3-2).
Figure 3-2: Purification of PBP. 12% SDS-PAGE gel showing results of the PBP purification. Lane 1: non-induced cell lysates Lane 2: Pi induced cell lysates Lane 3: post-osmotic shock Lanes 4 and 5: a fraction from each Q Sepharose run Lane 6: pool from both Q Sepharose runs Lane 7: final concentrated PBP product
3.2.4 Labeling of PBP 8 ml of 100 µM PBP was reacted with 150 µM MDCC
(Molecular Probes) in the presence of 200 µM 7-methylguanosine (MEG) and 0.2 u/ml
PNPase for 30 minutes. The latter two reagents constitute a phosphate “mop” which
scavenges traces of PO42- that can interfere with labeling, and later, with the assay (68).
The labeled PBP was loaded onto a 150 ml G25 M de-salting column to separate
unreacted label. The flow-through, containing the PBP-MDCC was then run on a 10 ml
Q Sepharose HP column equilibrated with 10 mM Tris pH 8. A 400 ml gradient from 0-
50 mM NaCl was run to separate labeled PBP from unlabeled PBP. Fractions
constituting the major peak (colored yellow) were pooled, concentrated, and stored at
1 2 3 4 5 6 7

41
-80°C until used in the assay. Further purification on a MonoQ, as suggested in the
published protocol (68), was found not to be necessary.
3.2.5 ATPase Assay Using PBP Labeled PBP shows a relatively strong increase
in fluorescence emission upon binding phosphate. Because of the high sensitivity of
PBP-MDCC fluorescence to the presence of contaminating phosphate, all buffers and
ATP solutions were treated with the phosphate mop prior to use. Residual PNPase,
which interfered with the signal in the assay, was removed by filtering the mopped
buffers or ATP solutions on a Centricon-10. The standard conditions of this assay were
50 mM Tris pH 7.5, 100 mM KAc, 10 mM MgAc, 0.2 mM PEP, 5 units PK, 3 µM PBP,
varying [ATP], and 0.05 µM GroEL. Fluorescence measurements were done in a Perkin-
Elmer LS50B spectrofluorometer. The excitation wavelength was 425 nm, the emission
wavelength was 463 nm with the excitation and emission monochrometer slits set to 2.5
and 15 nm respectively. Instrument response time was set to 1. Prior to each assay, a
standard curve was made using known amounts of phosphate to calibrate the PBP
solution for that day. To measure ATPase rates, a small volume fluorescence cuvet
containing all components except GroEL was incubated in the cuvet holder for 5 minutes
at 37°C. Pre-warmed GroEL was then added to a final volume of 200 µl and data
collection was immediately initiated. Data points were collected every second for 200
seconds. The slope of the trace was calculated over two different intervals along the
trace, and the average slope was used to calculate the change in phosphate concentration
using the extinction coefficient obtained from the standard curve. From this, the ATPase
rate was calculated using the GroEL concentration and sample volume.

42
3.2.6 Assaying GroES Release From the EL/ES Bullet Using 14C-ATP This
assay is based on one previously developed in our lab (G. Curien, unpublished). A
GroEL/GroES bullet complex made with 14C-ATP was created by mixing GroEL,
GroES, and [8-14C-]ATP (Amersham) in buffer at final concentrations of 10 mM Tris pH
7.5, 5 mM KAc, 10 mM MgAc, 35 µM GroEL, 35 µM GroES, and 210 µM 14C-ATP at
3380 dpm/nmol ATP. Bullets were allowed to form for at least 10 minutes at which
point they were diluted 1:1 with 10 mM Tris pH 7.5, 5 mM KAc, 10 mM MgAc, with or
without 3 mM unlabeled ATP (final [ATP] = 1.5 mM). At various time points, the
release reaction was quenched and unbound ATP was separated by loading 200 µl of the
reaction on a PD-10 column equilibrated in 10 mM Tris pH 7.5, 5 mM KAc, 10 mM
MgAc, 3 mM ADP. The sample was immediately chased with 2.5 ml of this buffer to
bring the protein to the bottom of the column. The protein was then eluted with 1.1 ml of
buffer. 500 µl of the eluent was added to a scintillation vial along with 4 ml of
Scintiverse (Fisher), and counted on a Beckman scintillation counter. The number of
ATP molecules retained per GroEL 14-mer was calculated using this formula:
merGroELnmoldpmATPnmol
countedlelutedlCountedsDpmmerATP
1425.01*
33801*
5001100*)'(14/
µµ
=
3.2.7 Assaying GroES Release From the EL/ES Bullet Using His-tagged
GroES This procedure was one created by Mark Uebel in our lab for his M.S. thesis
(69). A 300 µl solution containing 10 mM Tris pH 7.5, 10 mM MgAc, 1 mM KAc, 70
µM ATP, 18 µM GroESHis, and 14 µM GroELWT or GroELIRX was incubated for 5
minutes at room temperature to allow bullet formation and ATP exhaustion. This
solution was then loaded onto a column containing 1 ml Ni-NTA resin (Qiagen)
43
equilibrated with 20 mM Tris pH 7.5, 10 mM MgAc. After the sample was loaded, the
column was washed three times with 0.8 ml 20 mM Tris pH 7.5, 10 mM MgAc to elute
any flow-through. All three eluents were collected. To elute the GroEL, bullet
dissociation was initiated by loading three separate 0.8 ml portions of a solution
containing 20 mM Tris pH 7.5, 10 mM MgAc, 5 mM KAc, 7 µM GroESWT, ± 50 µM
ATP onto the column and collecting each eluent. Following a single wash with 20 mM
Tris pH 7.5, 10 mM MgAc, the GroESHis along with any undissociated GroEL was eluted
with 3 separate washes with 250 mM imidazole. 60 µl of each of the 10 fractions was
added to 12 µl of 6X loading blue containing BME, boiled for 2 minutes, and 18 µl of
each sample was loaded on a 15% SDS-PAGE gel.
3.3 Data Analysis
It should be noted that much of the original work in developing these
mathematical techniques presented in this section was done by Gilles Curien. The basic
techniques for formulating the theoretical functional models (including formulating the
binomial distributions and using them to produce the models, predicting populations
using probabilities, and formulation of all ES binding models and the original ATPase
models) were developed by Dr. Curien. The details of these are provided here for the
convenience of the reader, and are cited appropriately. The development of the models
and techniques used to analyze GroELIRX by SDS-PAGE and the reworking and further
refinement of the ATPase models was work done by this author.
3.3.1 Gel Quantitation of the Reaction Coordinate In order to characterize
GroELIRX’s response to oxidation or cross-linking, a method is needed to quantitate the
amount of cys-cys tethering that has taken place in response to some reagent. The extent

44
of tethering will be quantitated by SDS-PAGE, and therefore a robust method is needed
to take the information from the gel and turn it into a measurement of the cross-linking
reaction coordinate. This can be done using fairly simple mathematics. At first glance,
adding some amount of cross-linker to a population of GroEL 14-mers seems to create a
mess: some 14-mers will contain 1 tether, some will contain 2, and some will even have
all 14 double cys sites tethered. It was realized during the earlier studies using GroELIAX
that the population of 14-mers at any point along the reaction coordinate can be described
by binomial distributions (G. Curien, unpublished). These follow the general formula:
)()1(**!)!*(
! xyx ppxxy
ytethersxcontainingsubnitsoffractionmole −−−
= , where y is
the number of subunits per oligomer (14 in the case of GroEL), x is the number of tethers
in an isolated oligomer, and p is the global fraction of cys-cys sites that are tethered. The
distributions are shown in Figure 3-3. This assumes that cross-linking is an entirely
stochastic process, meaning that the insertion of a tether in one ring does not favor or
disfavor the insertion of further tethers in the other subunits in that ring. It will be shown
later experimentally that this is indeed the case.
In order for this information to be of any use, the reaction coordinate must be
defined by direct measurement. A clearer way of referring to this coordinate is by calling
it the fraction of subunits tethered. In the case of GroELIAX, where the cys-cys pairs are
intrasubunit, a tether causes a GroEL subunit to run with reduced mobility on an SDS-
PAGE gel (Figure 3-4). The fraction tethered can be calculated simply by dividing the
intensity of the upper band by the combined intensities of the upper and lower bands.
Simplifying the situation even further is that the measurement in each lane of the gel is

45
Figure 3-3: Binomial Distributions Define Population of 14-mers Containing 0,1,2...etc Tethers at Any Point on the Reaction Coordinate. (G. Curien, unpublished) Formulated using the equation given in the text, these traces show the fraction of 14-mers containing 0, 1 or more tethers. The numbers of Reduced and Oxidized (or cross-linked) subunits are noted for some of the traces.
Extent of Oxidation
Reduced Subunits
Oxidized Subunits
Figure 3-4: Quantitation of GroELIAX Oxidation. (G. Curien, unpublished) Oxidation of GroELIAX, which contains intrasubunit cys-cys pairs. A intrasubunit disulfide bond causes a GroELIAX subunit to run with reduced mobility on a 12% SDS-PAGE gel. Fraction tethered is quantitated by dividing the intensity of the upperband by the total intensity of both bands in each lane.

46
independent of the other lanes; thus, sample load is not required to be the same in each
lane (G. Curien, unpublished).
Quantitating the fraction of subunits tethered when working with GroELIRX is
considerably more complicated. This is due to the cys-cys pairs being intersubunit rather
than intrasubunit. A single tether between two subunits results in the formation of a
dimer. Further addition of tethers results in the formation of more dimers and eventually
trimers, tetramers, pentamers, hexamers, and heptamers. A heavily tethered sample of
GroELIRX produces a ladder when run on a gel (see section 3.4.1). In order to quantitate
the fraction of subunits tethered, the appearance and disappearance of each of these
multi-subunit species must be defined as the reaction coordinate progresses. This was
done according to the scheme shown in (Figure 3-5). Beginning with a 14-mer
containing no tethers, the insertion of a single tether has a 1/1 probability of causing a
dimer to form. The insertion of a second tether has a 2/13 chance of producing a trimer,
and an 11/13 chance of producing a second dimer. Insertion of a third tether results in the
species and probabilities shown in the figure. This mathematical analysis was continued
for the fourth through fourteenth tether, and a series of probability equations was
constructed (see Appendix). These equations produce the mole fraction of a given
species (monomer, dimer, etc.) at any value along the reaction coordinate by multiplying
the fraction of 14-mers with a given number of tethers (the rxn coordinate) by the
probability that those 14-mers contain that particular species, by the number of that
species the 14-mer is predicted to contain. This results in the plot shown in Figure 3-6.
The key features of this plot to note are the decrease in the mole fraction of monomers,

47
Two Cross-Links
Three Cross-Links
One Cross-link
No Cross-Links
(14/14)
(7/13) (2/13) (2/13) (2/13)
Probability Factors
14 monomers
12 monomers, 1 dimer
(4/12)
(4/12)
(4/12)
(7/12)
(2/12)
(2/12)
(1/12)
(7/12)
(2/12)
(2/12)
(1/12)
(7/12)
(2/12)
(2/12)
(1/12)
Figure 3-5: Scheme for Modeling the Cross-linking of GroELIRX. The disappearance of monomers and appearance of dimers, trimers, etc. in response to inserted intersubunit tethers in the case of GroELIRX can be modeled using simple probabilities. GroEL is represented by 14 blocks with each row of blocks representing a ring. One inserted tether has a 14/14 chance of causing a dimer to form. The next inserted tether has a 2/13 chance of causing a trimer to form and an 11/13 chance of forming another dimer. This analysis can be continued for 3,4,…,14 tethers per 14-mer.
Figure 3-6: Cross-linking Model of GroELIRX. Beginning with 14 monomers at 0% cross-linked, and ending with 2 heptamers at 100% cross-linked, this plot shows the number of moles of each GroELIRX monomer or multimeric species that are present at all points on the reaction coordinate. These traces were formulated using the methods described in the text and depicted in Figure 3-5.

48
the relatively significant increase and then decrease in the dimers, and the eventual
takeover by the heptamers when everything is nearly fully tethered.
This information now allows for the quantitation of the fraction tethered using
SDS-PAGE. The easiest way to accomplish this is by concentrating on the disappearance
of the monomer (see section 3.4.1). Each point on the reaction coordinate shows a
unique amount of monomers (unlike the dimer which occurs in the same amount at two
points on the coordinate) and this amount decreases as the fraction tethered increases.
The monomer curve can be fit to a polynomial equation (Figure 3-7). This allows for the
conversion of the fraction of monomer remaining in a lane to the fraction tethered. The
gel is run with an untreated control sample that is assumed to have undergone no cross-
linking. The intensities of the monomer bands in the other lanes are then divided into the
intensity of the monomer band in the control lane to obtain the fractions of monomer
remaining. These are then converted to the fractions tethered using the polynomial
equation. Overall: MonomerFractionTetheredFraction −= 1 . One further note:
because the intensity of a band in one gel lane is being compared with the band intensity
in another lane, the loading needs to be normalized. This was done by including an
Figure 3-7: Extent of Tethering is Quantitated Using Disappearance of Monomers. The monomer trace from the GroELIRX cross-linking model is plotted as the fraction of monomers remaining and fit to a 2nd
degree polynomial equation. The trace fits perfectly to the equation: y= x2 - 2x + 1. This equation can be used to relate the fraction of monomer remaining (vs. the uncross-linked control) on an SDS-PAGE gel to the overall fraction tethered of the reaction.
49
internal protein standard, carbonic anhydrase, CbAn (Sigma), which is about 30 kDa. All
other lanes were normalized to the control lane using this equation:
XLaneIntensityCbAnLaneControlIntensityCbAnXLaneIntensityMonomerIntMonomerCorrected *=
3.3.2 Developing Models that Predict GroELIRX’s Response to Cross-Linking
The goal of several of these experiments was to determine the number of tethers per ring
necessary to prevent conformational changes. As stated above, this analysis was also
performed on GroELIAX prior to the studies with GroELIRX. As part of the previous
studies a method was developed to predict the response of GroELIAX to cross-linking (G.
Curien, unpublished). This method involves determining the number of tethers in each
ring using probabilities, and then predicting a property of that ring in response to the
number of tethers. The result is a theoretical plot that the real data should closely match
if the prediction is correct. For example, it was predicted that one tether per ring would
lock that ring in the T state and prevent GroES binding. To build the model, an analysis
was done to determine the probability that 14-mers at any point on the reaction
coordinate contained one ring that was not tethered. These 14-mers would still be able to
bind GroES. The analysis was as follows: insertion of the first tether has a 1/1
probability of tethering one ring. A second tether then has a 6/13 chance of tethering
another subunit in the same ring and a 7/13 chance of inserting into the other ring. Thus,
after only two inserted tethers, 7/13 of the GroEL 14-mers will not be able to bind
GroES. This analysis is continued for the tethers beyond 2 up to 14, although by the time
the eighth tether is inserted, all GroEL would be predicted to be unable to bind GroES. A
similar analysis can be done in which it is predicted that two tethers are required per ring
to prevent GroES binding. The probability of a 14-mer containing a given number of

50
tethers in each ring is multiplied by the fraction of the GroEL population containing the
total number of tethers in both rings (known from the binomial distributions), which is
then multiplied by a number representing the function of the tethered species. In this
case, a 14-mer that can bind GroES is assigned ‘1’ and a 14-mer that cannot is assigned
‘0’. The theoretical plot is shown in Figure 3-8 (Curien, unpublished).
A similar analysis was done to draw theoretical models that predict the response
of the ATPase activity of a given GroEL mutant to cross-linking. Again, the goal was to
demonstrate the number of cross-links necessary to lock a ring in the T state. These
models were formulated by predicting a Vmax for both the T and R states and using these
numbers in the same way that the functional number was used in the ES binding models.
One surprising result obtained with GroELIAX was that the ATPase activity increased at
Figure 3-8: Modeling the Effect of Cross-links on GroEL’s Ability to Bind GroES. (G. Curien, unpublished). Formulated using simple probabilities and the binomial distributions as described in the text, the theoretical models shown here predict the number of tethers necessary to prevent GroES from binding to GroEL (the number of tethers necessary to prevent the T→R’ transition). Data obtained with both GroELIAX (G. Curien, unpublished) and GroELIRX (Figure 3-16c) follow closely the trace in which 1 cross-link per ring eliminates GroES binding to that ring.

51
low levels of cross-linking but then decreased to zero at high levels (Curien,
unpublished). Thus, another feature was incorporated into the model that accounted for
this by hypothesizing that a tether inserted into a subunit destroyed the ATPase activity of
that subunit. However, subsequent work with a single-ringed version of GroEL done
well after the original GroELIAX studies showed that this model is probably not correct (J.
Gresham, unpublished). Collectively, a new model was formulated by the lab that
accounted for the decrease in activity by stating that a ring remains fully active until a
certain number of subunits in a ring are tethered. After that many tethers are inserted, the
ring becomes inactive; a so-called “X strikes and you’re out” model (J. Gresham,
unpublished). This new model satisfactorily fit the data for both GroELIAX and single-
ringed GroEL.
Further refinement of the ATPase model is necessary when considering
GroELIRX, due to the fact that the ATPase activity of GroELIRX decreases at high levels
of cross-linking, but does not disappear completely. A new model was developed to
account for this by including another Vmax in the analysis (Figure 3-9). This value is
assigned to a GroEL ring with X cross-links in it, and represents the residual activity that
the ring retains upon receiving X tethers. In the case of GroELIAX, this residual Vmax
would be 0. This number, along with VmaxT, VmaxR, and X (the number of “strikes”) can
be varied to obtain the best fit for the data (Figure 3-10). This more robust model is new
work presented in this dissertation.
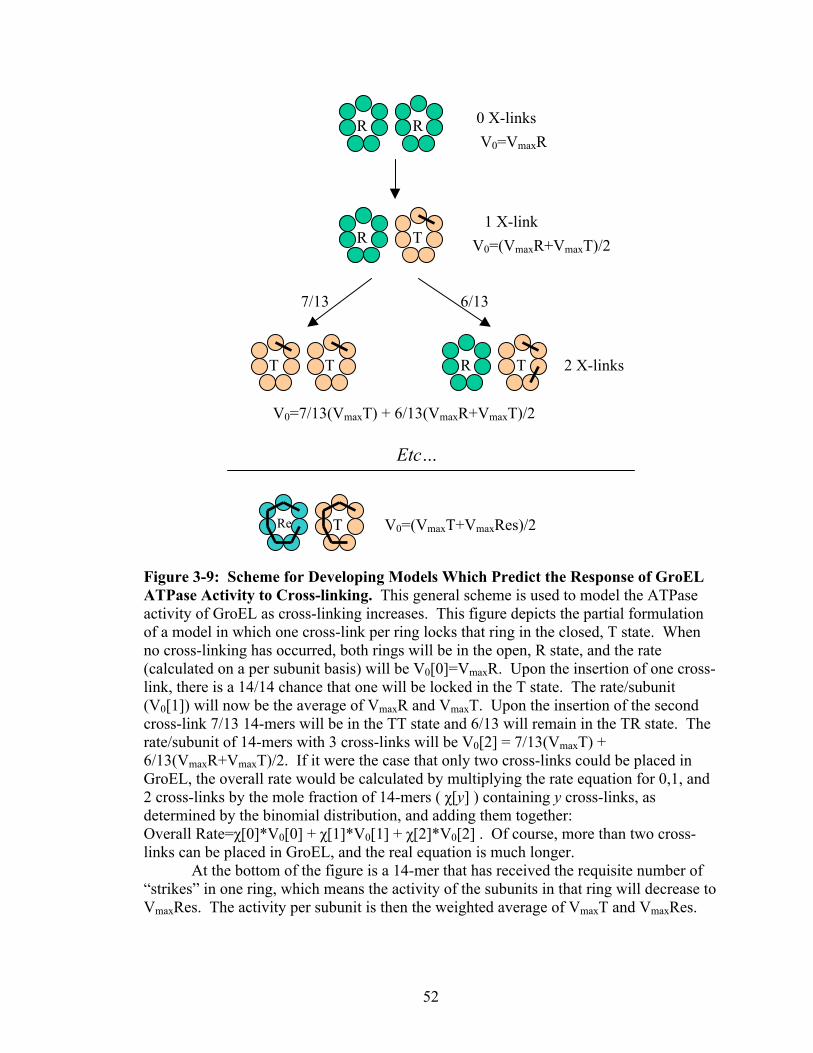
52
0 X-links
2 X-links
1 X-link
R
T T T
T
R
R
R
V0=VmaxR
V0=(VmaxR+VmaxT)/2
6/137/13
V0=7/13(VmaxT) + 6/13(VmaxR+VmaxT)/2
T Re
Etc…
V0=(VmaxT+VmaxRes)/2
Figure 3-9: Scheme for Developing Models Which Predict the Response of GroEL ATPase Activity to Cross-linking. This general scheme is used to model the ATPase activity of GroEL as cross-linking increases. This figure depicts the partial formulation of a model in which one cross-link per ring locks that ring in the closed, T state. When no cross-linking has occurred, both rings will be in the open, R state, and the rate (calculated on a per subunit basis) will be V0[0]=VmaxR. Upon the insertion of one cross-link, there is a 14/14 chance that one will be locked in the T state. The rate/subunit (V0[1]) will now be the average of VmaxR and VmaxT. Upon the insertion of the second cross-link 7/13 14-mers will be in the TT state and 6/13 will remain in the TR state. The rate/subunit of 14-mers with 3 cross-links will be V0[2] = 7/13(VmaxT) + 6/13(VmaxR+VmaxT)/2. If it were the case that only two cross-links could be placed in GroEL, the overall rate would be calculated by multiplying the rate equation for 0,1, and 2 cross-links by the mole fraction of 14-mers ( χ[y] ) containing y cross-links, as determined by the binomial distribution, and adding them together: Overall Rate=χ[0]*V0[0] + χ[1]*V0[1] + χ[2]*V0[2] . Of course, more than two cross-links can be placed in GroEL, and the real equation is much longer. At the bottom of the figure is a 14-mer that has received the requisite number of “strikes” in one ring, which means the activity of the subunits in that ring will decrease to VmaxRes. The activity per subunit is then the weighted average of VmaxT and VmaxRes.
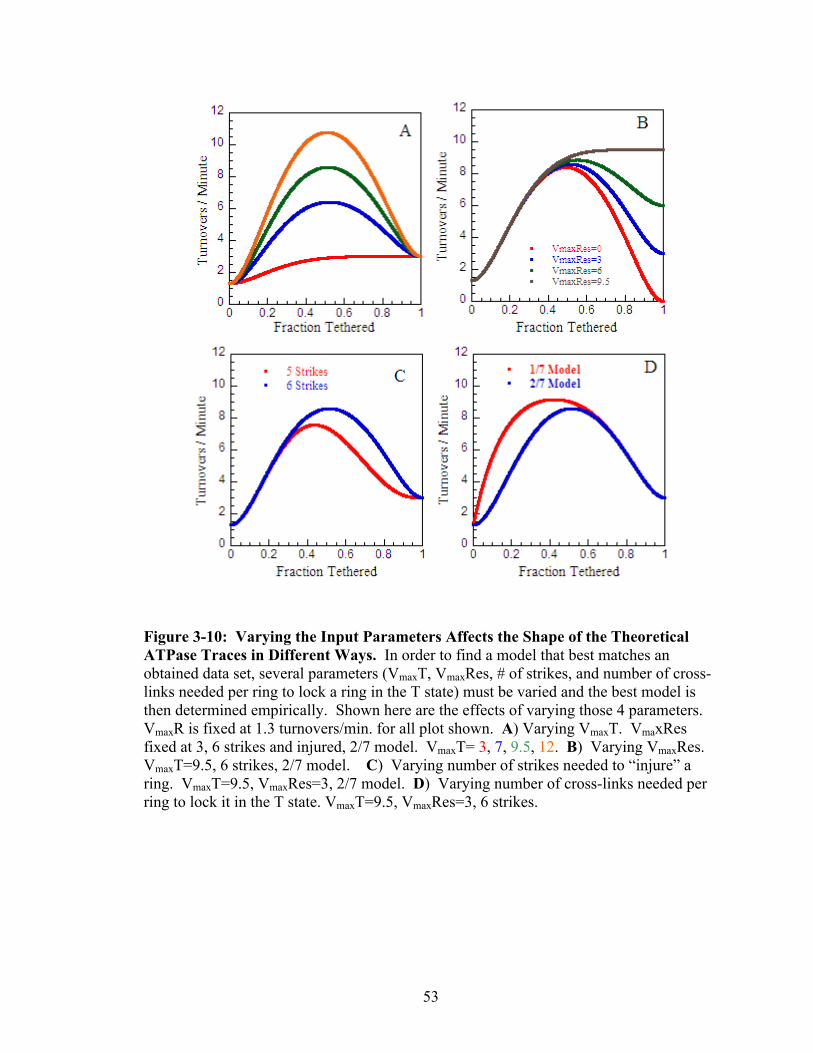
53
Figure 3-10: Varying the Input Parameters Affects the Shape of the Theoretical ATPase Traces in Different Ways. In order to find a model that best matches an obtained data set, several parameters (VmaxT, VmaxRes, # of strikes, and number of cross-links needed per ring to lock a ring in the T state) must be varied and the best model is then determined empirically. Shown here are the effects of varying those 4 parameters. VmaxR is fixed at 1.3 turnovers/min. for all plot shown. A) Varying VmaxT. VmaxRes fixed at 3, 6 strikes and injured, 2/7 model. VmaxT= 3, 7, 9.5, 12. B) Varying VmaxRes. VmaxT=9.5, 6 strikes, 2/7 model. C) Varying number of strikes needed to “injure” a ring. VmaxT=9.5, VmaxRes=3, 2/7 model. D) Varying number of cross-links needed per ring to lock it in the T state. VmaxT=9.5, VmaxRes=3, 6 strikes.

54
3.4 Results
3.4.1 Cross-linking of GroELIRX Since the R197C/E386C cysteine pair
replaces an intersubunit salt bridge, the introduction of a disulfide bond or cross-link
between these residues would produce a GroEL dimer. Further cross-linking would
produce higher-order multimers. Run on an SDS-PAGE gel, cross-linked GroELIRX
would be expected to produce a ladder in which everything from monomers to heptamers
should be visible. To confirm this, GroELIRX was oxidized to various extents using
stoichiometric amounts of diamide. Diamide has the chemical formula
(CH3)2NCON==NCON(CH3)2 and adds disulfide bonds to free thiol pairs using a two-
step reaction mechanism (59). Varying amounts of diamide were added to a 40 µM
dilution of GroELIRX in 10 mM Tris pH 8, 10 mM MgAc. The solution also contained 30
µM CbAn to use as the internal standard during quantitation. After 30 minutes at 37°C,
free thiols were blocked by the addition of NEM (see section 2.6) and denatured by the
addition of SDS loading blue without DTT. To best visualize the ladder, the oxidized
GroEL was loaded onto a 3%-9% gradient gel (section 3.2.2). This type of gel (Figure 3-
11a) clearly shows an increasing amount of higher-order multimers as the diamide
amount is increased. Eight distinct bands, representing monomers through the two forms
of heptamers (six or seven tethers leading to open or closed rings, respectively), can be
distinguished.
The decrease in the amount of monomers as oxidation increased was used to
determine the extent of oxidation (see section 3.3.1). Diamide-oxidized GroEL was run
on 12% SDS-PAGE gels on which the monomer band can be easily quantified (Figure 3-
11b). These gels also allowed for the quantitation of the carbonic anhydrase internal
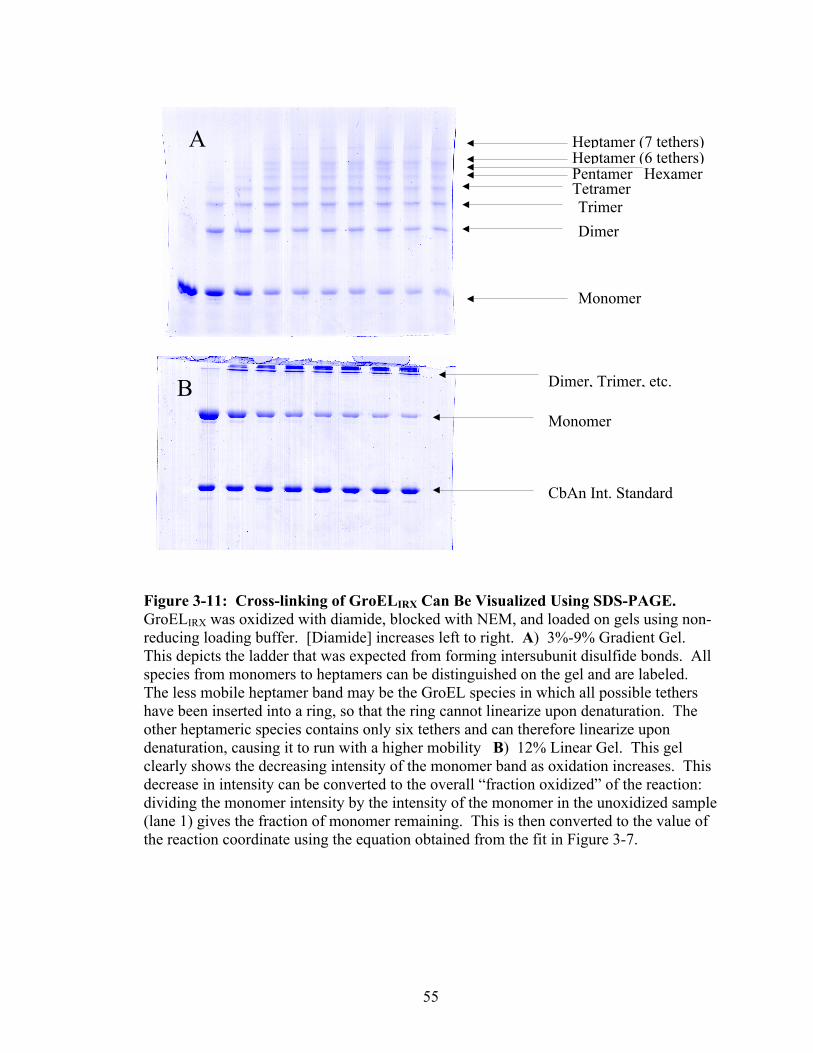
55
A
B Monomer
CbAn Int. Standard
Dimer, Trimer, etc.
Monomer
Dimer Trimer
Tetramer
Heptamer (6 tethers) Heptamer (7 tethers)
Pentamer Hexamer
Figure 3-11: Cross-linking of GroELIRX Can Be Visualized Using SDS-PAGE. GroELIRX was oxidized with diamide, blocked with NEM, and loaded on gels using non-reducing loading buffer. [Diamide] increases left to right. A) 3%-9% Gradient Gel. This depicts the ladder that was expected from forming intersubunit disulfide bonds. All species from monomers to heptamers can be distinguished on the gel and are labeled. The less mobile heptamer band may be the GroEL species in which all possible tethers have been inserted into a ring, so that the ring cannot linearize upon denaturation. The other heptameric species contains only six tethers and can therefore linearize upon denaturation, causing it to run with a higher mobility B) 12% Linear Gel. This gel clearly shows the decreasing intensity of the monomer band as oxidation increases. This decrease in intensity can be converted to the overall “fraction oxidized” of the reaction: dividing the monomer intensity by the intensity of the monomer in the unoxidized sample (lane 1) gives the fraction of monomer remaining. This is then converted to the value of the reaction coordinate using the equation obtained from the fit in Figure 3-7.
56
standard. Similar oxidation experiments were done with GroELWT. No oxidation was
detected (not shown).
3.4.2 Native Cysteines are Non-reactive GroEL contains three native cysteine
residues. These create a potential risk for side reactions when working with double-
cysteine mutants, although the crystal structure seems to indicate that the native cys
residues are buried. When others have used GroEL mutants with inserted cysteines, they
have first mutated the native cys residues to alanine (17, 51). It has also been reported
that the native cysteines are indeed reactive to sulfhydryl labels under certain conditions
(70). However, we and others have found that cysteine-less GroEL shows a marked
decrease in ATPase activity (G. Curien, unpublished, and (17)). In fact, GroELIRX
constructed in a cysteine-less background is extremely unstable and difficult to purify
(data not shown). Therefore, it was decided to construct the double cysteine mutants
used in this laboratory exclusively in wild-type backgrounds.
To determine the extent of any side reactions that may take place with the native
cysteines, a diamide and dimaleimide titration was performed with GroELIRX. Increasing
amounts of either diamide or oPDM were added to 40 µM GroELIRX at 10 mM Tris, 10
mM MgAc pH 8 and pH 7.5 respectively. The reaction was allowed to run for 30
minutes, and free thiols were then blocked with NEM. Extent of oxidation and cross-
linking were quantitated by SDS-PAGE. The results show that both diamide and oPDM
react in a directly proportional manner until the reagent concentration reaches
approximately the GroEL site concentration (40 µM), after which no further increase in
the reaction extent is seen (Figure 3-12a,b). Because the titration curve breaks almost
exactly at the site concentration, it is reasonable to conclude that the other cysteines are

57
non-reactive, at least to these reagents. GroELWT is unaffected by oxidation or cross-
linking (data not shown).
3.4.3 Kinetics of Diamide Oxidation and DTT Reduction Demonstrate that
Oxidation is Stochastic A critical assumption in being able to use the mathematics
discussed in section 3.3 is that the insertion of disulfide bonds or cross-links into a 14-
mer is stochastic. The insertion of a tether into one ring does not favor or disfavor the
insertion of a second tether into the same ring. To demonstrate that this is indeed the case
with GroELIRX, a detailed examination of its oxidation and reduction kinetics was
undertaken. If oxidation is indeed stochastic, then oxidation kinetics are expected to be
single exponential. Furthermore, the kinetics of reduction of fully oxidized GroELIRX by
DTT should also be single exponential with the rates having a linear dependence on DTT
concentration. A similar analysis to this was used in the earlier work with GroELIAX, but
Figure 3-12: Stoichiometric Cross-linking of GroELIRX Indicates No Reaction With Native Cysteines. 40 µM GroELIRX (along with 30 µM CbAn) was reacted with the indicated amounts of either diamide (A) or oPDM (B). Extent of cross-linking was measured by SDS-PAGE. The vertical black line in both plots indicates site concentration.

58
those studies relied on copper oxidation, which has a relatively complicated reaction
mechanism (G. Curien, unpublished). Diamide uses a much simpler two-step mechanism
to form disulfide bonds:
In the first step, diamide reacts with a free cysteine thiol. This step is expected to be
concentration dependent. In the second step, the attached diamide reacts with the other
free cysteine in the pair. The product of this second step is a disulfide bond and a
reduced diamide molecule (59).
To confirm the kinetics of this reaction, various amounts of diamide were added
to 40 µM GroELIRX at 37°C in 10 mM Tris pH 8, 10 mM MgAc. The rate of disulfide
formation was monitored by quenching the reaction at certain times with NEM. Extent
of oxidation was quantitated by SDS-PAGE. The kinetics of oxidation were found to be
single exponential with a rate constant that is independent of diamide concentration
(Figure 3-13 a,b). This implies that the rate-limiting step in the reaction is the second
step, the formation of the disulfide bond, which the reaction mechanism predicts is
concentration independent.
The reduction of fully oxidized GroELIRX by DTT was also monitored. A 40 µM
sample of diamide-oxidized GroELIRX was reacted with various concentrations of DTT in

59
10 mM Tris pH 8, 10 mM MgAc, and the kinetics of reduction were monitored at 37°C.
The reaction was quenched at various time points by NEM, and the extent of reduction
was quantitated by SDS-PAGE. Reduction kinetics were single exponential with a rate
constant that is [DTT] dependent (Figure 3-14a). A re-plot of these rate constants vs.
[DTT] shows a linear dependence with a slope that is the bi-molecular rate constant of
DTT reduction (Figure 3-14b). Taken together, these kinetics demonstrate that oxidation
is indeed stochastic. A similar analysis was not possible with dimaleimide cross-linkers
since the kinetics of cross-linking are too fast to measure, and the reaction is irreversible.
3.4.4 GroELIRX Has Reduced Overall Cooperativity Compared to GroELWT
GroELWT shows an unusual ATPase activity dependence on ATP concentration (Figure
1-4). This observation prompted the formulation of the nested cooperativity model (33).
Figure 3-13: Oxidation Kinetics of GroELIRX Using Diamide. 40 µM GroELIRX was oxidized with various amounts of diamide at 37°C in 10 mM Tris pH8, 10 mM MgAc. The reactions were quenched by blocking unreacted cysteines with NEM, and quantitated by SDS-PAGE. A) Data at all diamide concentrations fit to single exponentials. The open circle data was collected using a sub-stoichiometric amount of diamide (20 µM). All other data was collected with [diamide] ≥ 40 µM. B) Re-plot of the rates obtained from the single exponential fits of the data from A. The error bars represent the uncertainty of the fit.

60
This experiment was repeated using the coupled-enzyme assay under the conditions listed
in section 2.9 at 37°C with 2 µM GroELWT. The results (Figure 3-15a) are similar, but
not identical, to Yifrach and Horovitz’s (33), showing the two breakpoints at 5 µM and
30 µM ATP. The [ATP] dependence of GroELIRX’s activity was also measured using the
coupled-enzyme assay under the same conditions. The results in Figure 3-15b show that
the first transition is occurring at ATP concentrations below site concentration (2 µM),
where any rate measurement violates steady-state assumptions. In order to accurately
measure the [ATP] dependence of this mutant, another method was needed that could
measure ATPase activity at GroEL concentrations significantly lower than 2 µM (the
lower limit of the coupled-enzyme assay is about 1 µM).
Martin Webb and colleagues have developed a method of measuring inorganic
phosphate release that relies on a mutant of a periplasmic bacterial protein called
Figure 3-14: Reduction Kinetics of Oxidized GroELIRX Using DTT. Diamide-oxidized GroELIRX at 40 µM was reduced with various concentrations of DTT at 37°C in 10 mM Tris pH 8, 10 mM MgAc. A) The data were fit to single exponentials. B) Re-plot of the reduction rates obtained from the fits in A. These rates were fit to a linear equation, the slope of which is the second order rate constant of the reaction, 0.043 mM-1min-1.
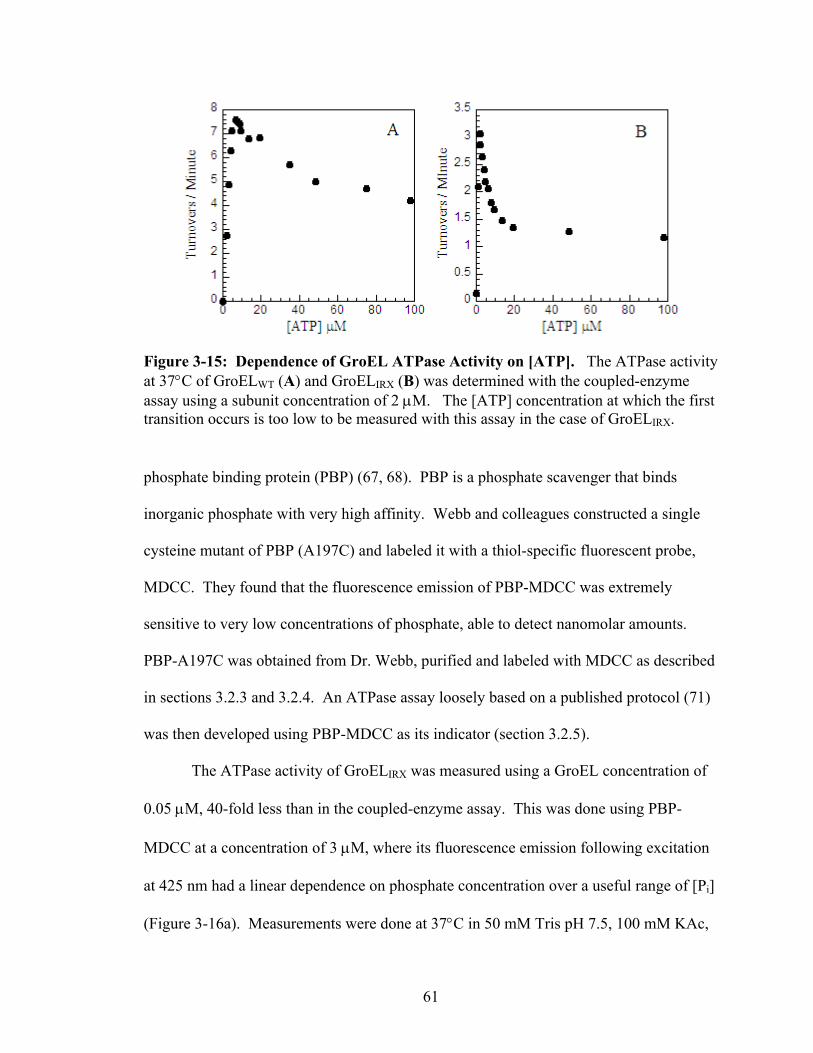
61
phosphate binding protein (PBP) (67, 68). PBP is a phosphate scavenger that binds
inorganic phosphate with very high affinity. Webb and colleagues constructed a single
cysteine mutant of PBP (A197C) and labeled it with a thiol-specific fluorescent probe,
MDCC. They found that the fluorescence emission of PBP-MDCC was extremely
sensitive to very low concentrations of phosphate, able to detect nanomolar amounts.
PBP-A197C was obtained from Dr. Webb, purified and labeled with MDCC as described
in sections 3.2.3 and 3.2.4. An ATPase assay loosely based on a published protocol (71)
was then developed using PBP-MDCC as its indicator (section 3.2.5).
The ATPase activity of GroELIRX was measured using a GroEL concentration of
0.05 µM, 40-fold less than in the coupled-enzyme assay. This was done using PBP-
MDCC at a concentration of 3 µM, where its fluorescence emission following excitation
at 425 nm had a linear dependence on phosphate concentration over a useful range of [Pi]
(Figure 3-16a). Measurements were done at 37°C in 50 mM Tris pH 7.5, 100 mM KAc,
Figure 3-15: Dependence of GroEL ATPase Activity on [ATP]. The ATPase activity at 37°C of GroELWT (A) and GroELIRX (B) was determined with the coupled-enzyme assay using a subunit concentration of 2 µM. The [ATP] concentration at which the first transition occurs is too low to be measured with this assay in the case of GroELIRX.

62
10 mM MgAc, 0.2 mM PEP, and 5 u PK. The latter two were included to ensure a
constant [ATP]. Great care was taken to eliminate contaminating phosphate from all
solutions by making use of a enzymatic phosphate “mop” developed by the Webb group
(see section 3.2.4) (68). The results in Figure 3-16b show that both breakpoints now
occur above site concentration, at about 1 µM and 10 µM. All transitions are shifted to
lower [ATP] compared to GroELWT, indicating a reduction in the overall cooperativity
with respect to ATP binding. The shifting of the transition to lower [ATP] is consistent
with the absence of a salt-bridge that stabilizes the T state, which R197/E386 does. The
rates overall are about half that of GroELWT. Rates obtained using PBP as an indicator are
very close to those obtained with the coupled-enzyme assay, demonstrating the
usefulness of the PBP assay.
Figure 3-16: Determination of GroELIRX’s ATPase Activity Using the PBP Assay. In order to use a lower [GroEL], the more sensitive fluorescent PBP assay was used to measure activity. A) The fluorescence response to increasing amounts of inorganic phosphate was standardized before every experiment using a phosphate standard curve, an example of which is shown here. B) ATPase activity of both reduced (closed circles) and 50% oxidized (open triangles) GroELIRX was determined with the PBP assay at 37°C using 0.05 µM GroEL. The oxidized GroEL data were fit to the Hill equation giving values: Vmax=5.2 turnovers/min., K=0.44 µM, nH=1.3.
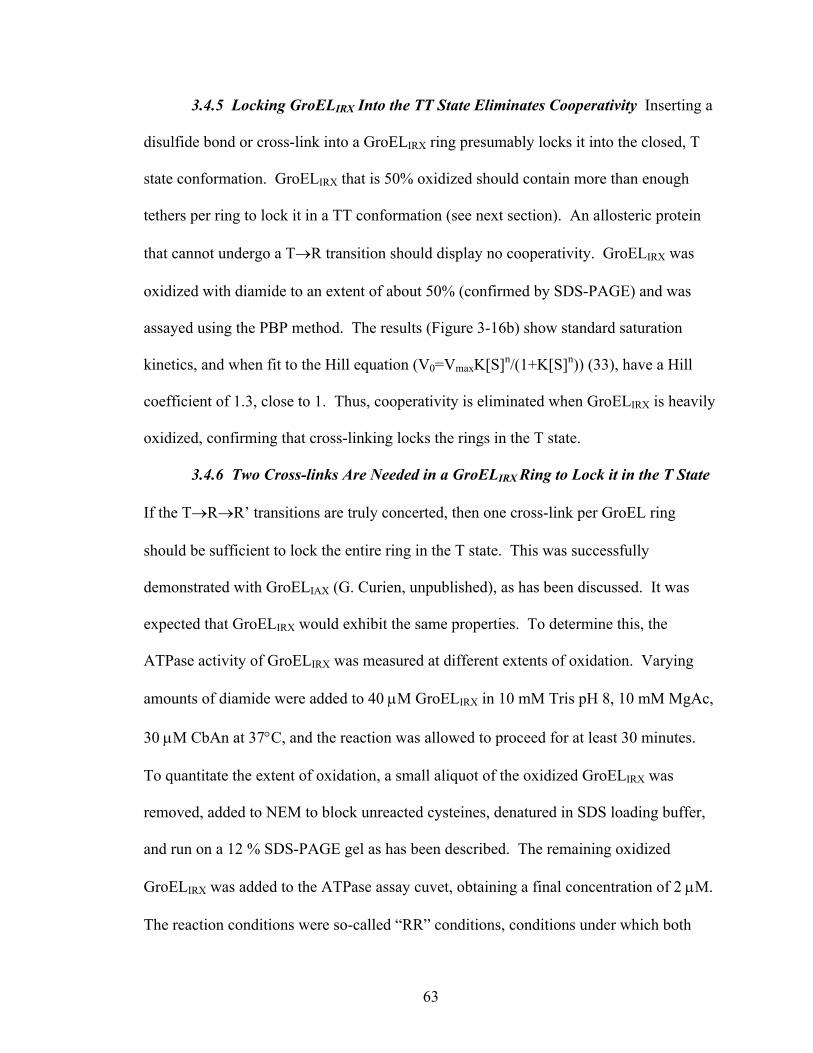
63
3.4.5 Locking GroELIRX Into the TT State Eliminates Cooperativity Inserting a
disulfide bond or cross-link into a GroELIRX ring presumably locks it into the closed, T
state conformation. GroELIRX that is 50% oxidized should contain more than enough
tethers per ring to lock it in a TT conformation (see next section). An allosteric protein
that cannot undergo a T→R transition should display no cooperativity. GroELIRX was
oxidized with diamide to an extent of about 50% (confirmed by SDS-PAGE) and was
assayed using the PBP method. The results (Figure 3-16b) show standard saturation
kinetics, and when fit to the Hill equation (V0=VmaxK[S]n/(1+K[S]n)) (33), have a Hill
coefficient of 1.3, close to 1. Thus, cooperativity is eliminated when GroELIRX is heavily
oxidized, confirming that cross-linking locks the rings in the T state.
3.4.6 Two Cross-links Are Needed in a GroELIRX Ring to Lock it in the T State
If the T→R→R’ transitions are truly concerted, then one cross-link per GroEL ring
should be sufficient to lock the entire ring in the T state. This was successfully
demonstrated with GroELIAX (G. Curien, unpublished), as has been discussed. It was
expected that GroELIRX would exhibit the same properties. To determine this, the
ATPase activity of GroELIRX was measured at different extents of oxidation. Varying
amounts of diamide were added to 40 µM GroELIRX in 10 mM Tris pH 8, 10 mM MgAc,
30 µM CbAn at 37°C, and the reaction was allowed to proceed for at least 30 minutes.
To quantitate the extent of oxidation, a small aliquot of the oxidized GroELIRX was
removed, added to NEM to block unreacted cysteines, denatured in SDS loading buffer,
and run on a 12 % SDS-PAGE gel as has been described. The remaining oxidized
GroELIRX was added to the ATPase assay cuvet, obtaining a final concentration of 2 µM.
The reaction conditions were so-called “RR” conditions, conditions under which both

64
rings are known to be in the R state. High ATP concentrations are known to create the
RR state (33), and a high potassium concentration is thought to do the same (72). Thus,
the conditions used in these assays are 50 mM Tris pH 7.5, 100 mM KAc, 10 mM MgAc,
1 mM ATP, 0.2 mM PEP, 0.2 mM NADH, along with LDH and PK. After collecting
data for 150 seconds, GroES was added to a final concentration of 2 µM, and data
collection was continued for another 150 seconds. Rates were calculated from the data
both before and after GroES addition, and plotted vs. the fraction oxidized obtained from
the gel quantitation (Figure 3-17a). As was the case with GroELIAX, activity rises as
oxidation increases, indicating that the T state has a higher activity than the R state. As
was also the case with GroELIAX, activity decreases at higher levels of oxidation,
although, unlike GroELIAX, the activity does not appear to extrapolate to zero at 100%
oxidation. As would be expected, at higher levels of oxidation, GroES has no effect on
the activity, since all rings are presumably locked in the T state at this point and cannot
bind GroES.
In order to determine the number of disulfide bonds required to lock a ring in the
T state and prevent the transition to the less active R state, theoretical models of the
ATPase activity response to oxidation were formulated using the methods that are
described in section 3.3.2. The data are then compared empirically to these models, and
conclusions are drawn depending on which model follows the data the closest. These
models require the input of several parameters: the Vmax of the R state, the Vmax of the T
state, the number of subunits in a ring that need to be oxidized in order for the ring’s
activity to decrease (the number of “strikes”), and the residual Vmax of a subunit in a ring
that has been hit with that many “strikes.” Finally, the number of cross-links per ring
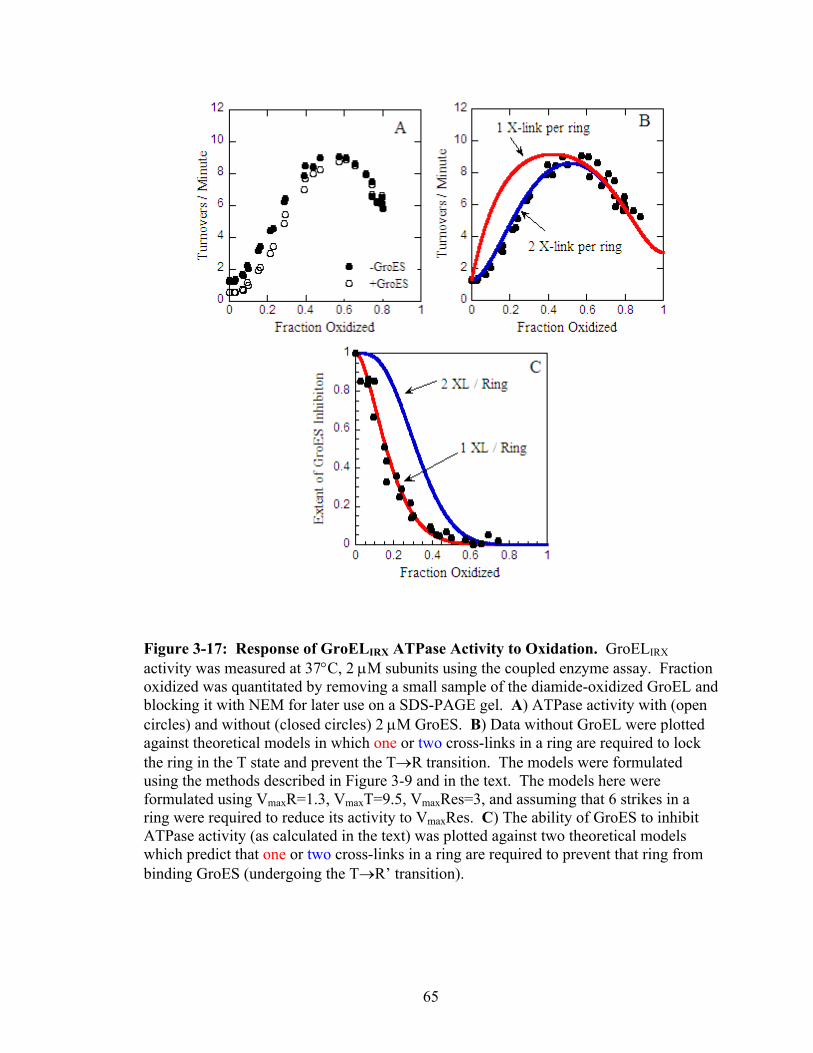
65
Figure 3-17: Response of GroELIRX ATPase Activity to Oxidation. GroELIRX activity was measured at 37°C, 2 µM subunits using the coupled enzyme assay. Fraction oxidized was quantitated by removing a small sample of the diamide-oxidized GroEL andblocking it with NEM for later use on a SDS-PAGE gel. A) ATPase activity with (open circles) and without (closed circles) 2 µM GroES. B) Data without GroEL were plotted against theoretical models in which one or two cross-links in a ring are required to lock the ring in the T state and prevent the T→R transition. The models were formulated using the methods described in Figure 3-9 and in the text. The models here were formulated using VmaxR=1.3, VmaxT=9.5, VmaxRes=3, and assuming that 6 strikes in a ring were required to reduce its activity to VmaxRes. C) The ability of GroES to inhibit ATPase activity (as calculated in the text) was plotted against two theoretical models which predict that one or two cross-links in a ring are required to prevent that ring from binding GroES (undergoing the T→R’ transition).

66
required to lock it in the T state must be included. Two of these parameters are known
from inspection of the data. VmaxR is the rate measured when the GroEL is fully reduced,
since the assay is done under RR conditions. VmaxRes is the rate that the data appear to
extrapolate to at a fraction oxidized of 1. The data show that these values are
approximately 1.3 and 3 turnovers per minute, respectively. The other parameters must
be determined empirically simply by comparing many different traces to the data. It
should be noted that VmaxT is not the activity at the peak of the data curve, since some
rings will already have begun to lose their activity at this point on the reaction coordinate.
For all experiments such as this, two models were simulated, one in which 1 cross-link
locked a ring into the T state (a 1/7 model), and one in which 2 cross-links were needed
(a 2/7 model). Equations used to produce these models assuming 6 strikes are given in
the Appendix. Data obtained with the single-ring version of GroEL suggest that the
number of strikes needed in a ring to reduce the activity was 6 (J. Gresham, unpublished).
Therefore, the only parameter left to be determined was VmaxT. Through trial and error,
it was determined that a model in which VmaxT was set to 9.5 fit the data the best (Figure
3-17b). This is about half of the empirically determined VmaxT for GroELIAX (see
Chapter 4). What was unexpected was that this model was a 2/7 model, one in which 2
cross-links were needed per ring in order to lock it in the T state, not 1 as would have
been expected if the subunits moved in a concerted fashion.
It should be noted that several other models were considered to explain the data.
A model in which 1 cross-link locked both rings in the T state (a 1/14 model), or one in
which one cross-link locked a ring in the T state, but destroyed the activity in the two
subunits that were cross-linked together were formulated and discarded. There are

67
several other examples that need not be noted here. The only model that satisfactorily
described the data was the 2/7 model, primarily due to the lag seen in the data at low
levels of oxidation.
3.4.7 One Cross-link Per GroELIRX Ring is Sufficient to Prevent GroES
Binding The same set of data can be used to examine the effect of oxidation on
GroELIRX’s ability to bind GroES by examining the effect of GroES addition on ATPase
activity. GroES inhibition of ATPase activity was quantitated by dividing the rate
measured without GroES by the rate measured with GroES to obtain the fraction of
activity inhibited by GroES. This number was normalized using the following equation:
)1()1( %0
ExtentXtoOxidizedGroEL
OxidizedAtGroELNormalized InhibitionES
InhibitionESFactorInhibition
−
−= . Presented in this way,
an inhibition factor of 1 means that GroES is having its maximal effect on GroEL
ATPase activity (usually reducing the activity to half of what it is without GroES), and an
inhibition factor of 0 means GroES has no effect on the activity. The normalized data are
plotted in Figure 3-17c. Theoretical models are also plotted which predict that either 1 or
2 cross-links per ring are necessary to prevent GroES binding (section 3.2.2). The data
points clearly follow the model in which 1 cross-link per ring prevents GroES binding, or
put another way, 1 cross-link per ring prevents the T→R’ transition. At least in the case
of this transition, conformational changes appear to be concerted.
3.4.8 GroELIRX’s Ability to Release GroES is Compromised Binding of ATP to
the trans ring of a GroEL/GroES bullet complex causes GroES and trapped ADP to be
released from the opposite cis ring. Studies with GroELWT and GroELIAX bullets indicate
that ADP is completely released within 1 minute of ATP addition (G. Curien,
unpublished). Studies with GroEL and GroES labeled with fluorescent probes that

68
constitute a FRET pair show that GroES release takes place anywhere from 40 seconds
down to <1 second depending on conditions (see Chapter 5). The release rate of GroES
from reduced GroELIRX was measured using the assay described in section 3.2.6 in which
the GroEL/GroES bullet is made using a small excess of 14C-labeled ATP, which is
allowed sufficient time to exhaust. Following the addition of a large excess of unlabeled
ATP to cause release, the remaining bound 14C is measured at several time points. The
results in Figure 3-18 show that release of 14C-ADP occurs with a half time of 8-10
minutes, much slower than in similar experiments with GroELWT or GroELIAX.
Figure 3-18: Kinetics of GroES Release from GroELIRX in Response to ATP Binding to the Trans Ring. The release of GroES from the GroELIRX/GroES/ADP bullet was quantitated by measuring the amount of trapped 14C-ADP left bound to GroEL underneath the GroES cap at various times following the addition of a large excess of cold ATP. The reaction was quenched by loading the solution on a PD-10 column and separating free ATP from the GroEL. 14C-ADP co-eluting with GroEL was measured by scintillation counting.
Since the assay using 14C-ATP actually measures the release of ADP from the
bullet complex and not GroES release, it was possible that GroES was being released but
not ADP. To confirm the results of the 14C-ATP assay, GroES release was measured by
another method (section 3.2.7) (69) in which the GroEL/GroES bullet is made using his-
tagged GroES (GroESHis). The complex is then loaded onto Ni-NTA resin. Following a

69
wash with buffer to elute unbound protein, ATP and excess wild-type GroES are added to
the resin to initiate bullet dissociation and cause GroES exchange. His-tagged GroES and
any remaining complexed GroEL are then eluted with an imidazole wash. All elutions
from the column are collected and run on an SDS-PAGE gel. As is seen in Figure 3-19, a
control experiment with GroELWT shows complete release of GroEL from GroESHis
within the time span of the experiment (about 5 minutes). However, the same experiment
with reduced GroELIRX shows that only about 50% of the GroESHis has been released
over the same time span. This confirms that GroELIRX is somehow deficient in its ability
to signal bullet dissociation following ATP binding to the trans ring.
Section 3.4.9 Unfolded SP Does Not Stimulate GroELIRX ATPase Activity The
ATPase activity of GroELWT is stimulated approximately 6-7-fold in the presence of
unfolded SP (34). The ATPase activity of GroELIRX was measured in the presence two
acid-denatured SPs, α-lactalbumin and malate dehydrogenase. In neither case was any
stimulation of activity seen (Figure 3-20a). GroELWT in the same experiment was
stimulated 6-7 fold by both SPs.
It is possible that GroELIRX does not show any rate enhancement in the presence
of SP because it cannot bind unfolded SPs. To make sure that GroELIRX is binding SP,
80 µM GroELIRX was reacted with 22 µM folded or unfolded MDH in 20 mM Tris pH
7.5, 100 mM KAc, 10 mM MgAc, 0.2 mM PEP, 100 µM ATP, 2 units PK. The
GroEL/MDH solution was loaded onto a S3000 analytical gel filtration column
(Phenomenex) equilibrated in 20 mM Tris pH 7.5, 10 mM MgAc, 100 µM ATP, 50 mM
NaCl, 0.05% NaN3. This column can separate GroEL/MDH complex from free MDH.
The GroEL and MDH peaks were collected, precipitated with trichloroacetic acid,
70
-ATP Challenge +ATP Challenge
GroELWT
GroELIRX
Flow-Through
GroESWT
250 mM Imidazole
Flow-Through
GroESWT
250 mM Imidazole
EL
ES
EL
ES
Flow-Through
ATP/ GroESWT
ATP/ GroESWT
Flow-Through
250 mM Imidazole
250 mM Imidazole
Figure 3-19: GroES Release from GroELIRX as Measured Using GroESHis. As described in section 3.2.7, the bullet complex was made with 14 µM GroEL (WT or IRX) and GroESHis, and loaded onto a Ni-NTA column. The column was washed 3 times with buffer, with the washes collected as the flow-through. Next, GroESWT/±ATP was applied to the column in 3 portions to initiate GroEL release from GroESHis in exchange for GroESWT. Following 1 wash with buffer to remove remaining GroESWT, GroESHis was released from the column with 3 washes of 250 mM imidazole. All 10 fractions were run on 15% SDS-PAGE gels, loaded in order of elution. On each gel, the first three lanes are the flow-through, showing GroEL which was not retained on the column, presumably because it never bound GroESHis. The next four lanes contain the GroEL (upper band) eluted by GroESWT ± ATP, along with the GroESWT (lower band). The last three lanes contain the GroEL which elutes with GroESHis, presumably because it did not release from GroESHis upon addition of ATP. GroESHis runs with a slightly reduced mobility compared to GroESWT.

71
dissolved in loading blue, and samples of each were loaded onto an SDS-PAGE gel
(Figure 3-20b). Folded MDH eluted entirely as free MDH, but unfolded MDH eluted
both as free MDH and also co-eluted with the GroEL, indicating that unfolded MDH
does indeed bind to GroELIRX. A control experiment with GroELWT showed the same
result with a comparable amount of MDH binding. These results seem to show that
GroELIRX can bind unfolded SP, but for some reason its ATPase activity is not enhanced
by it.
Section 3.5 Discussion
The earlier studies done with GroELIAX provided straightforward answers as to
the effect of adding cross-linkers to a GroEL ring. In the cases of both the T→R and
T→R’ transitions, one cross-link within a ring was sufficient to lock that ring in the T
Figure 3-20: GroELIRX Binds Unfolded SP but its ATPase Activity is Not Enhanced by it. A) The ATPase activity of GroELWT and reduced GroELIRX was measured in the presence of acid-denatured α-lactalbumin or malate dehydrogenase (50-fold excess and 4-fold excess over GroEL rings respectively). ATPase rates are plotted relative to the activity of GroEL without added SP. B) The binding of folded and unfolded MDH to GroELWT or reduced GroELIRX was examined. Native or acid-denatured MDH was mixed with GroEL in the presence of ATP and loaded on an S3000 analytical gel filtration column to separate unbound MDH from GroEL and any bound MDH. The GroEL and MDH peaks were collected and run on 12% SDS-PAGE gels.

72
state (G. Curien, unpublished). If one cross-link is enough to lock a ring in the T state,
then it can be inferred that all subunits are moving in a concerted fashion as a ring opens
and closes. This concerted motion would seem to be a favorable mechanism for
providing the maximum unfolding force if GroEL does actively unfold proteins. It was
expected that GroELIRX would closely mimic those results, but this did not prove to be
the case. The studies presented here with GroELIRX reveal some important limitations of
the sort of analysis used here, and they provide some evidence that the allosteric
mechanism is more complicated than was previously thought.
Before discussing allostery, there is one unusual, but consistent, result seen in all
cross-linking experiments done with GroELIRX. It may have been noticed that in all
cross-linking experiments, GroELIRX is never oxidized or cross-linked beyond about
80%. GroELIAX could be cross-linked to at least 95%. There are several reasons why
this may be so. The first is the presence of GroELWT subunits in all 14-mers. GroELWT
is produced from the native E. coli GroE operon in an unknown amount during bacterial
growth and during induction. The presence of even one GroELWT subunit in a mostly
GroELIRX 14-mer will reduce the number of possible tethers in that 14-mer from 14 to 12,
since the double cysteine pair in this mutant is intersubunit. This means that the reaction
coordinate can never exceed 85%. The presence of a second wild-type subunit would
reduce this number even further. Eliminating all GroELWT subunits requires advanced
molecular biology techniques, made more difficult by the fact that GroEL is absolutely
required for cell growth. This was not deemed to be necessary for these experiments, and
a maximum extent of cross-linking of 80% proved to be sufficient to obtain the necessary
results.

73
The most surprising result obtained with GroELIRX was that 2 cross-links per ring
are required to lock a ring in the T state and prevent the T→R transition. This result is
difficult to interpret in the face of all of the other results from these types of experiments,
which have suggested that all subunits move in a concerted motion. The T→R’ transition
in this mutant appears to be concerted, and both transitions are concerted in GroELIAX.
However, it does seem possible that one transition only requires one cross-link to prevent
it from occurring whereas the other requires two. The two transitions involve different
conformational changes. The T→R transition is only a partial opening of the ring,
involving the movement of the apical domains upwards and twisting anticlockwise 25° in
response to ATP binding in the absence of GroES. The T→R’ transition requires a more
dramatic upward motion of the apical domains, and a 90° clockwise twist (relative to the
T conformation). It is possible that the elimination of the R197/E386 salt bridge allows
enough flexibility in the motion of the ring to allow the T→R transition to occur more
freely, and additional tethers may be required to hold the ring in the T state.
Complicating the situation further is a recent cryo-EM structure of ATP-bound GroEL
produced by Helen Saibil and co-workers, which presumably mimics the R state (36). In
this structure, a salt bridge is postulated to exist between K80 and E386. Thus, the
E386C mutation in GroELIRX may not only remove a T state salt bridge, but an R state
one as well. Both the T and R states may be destabilized by this mutation. It is,
therefore, possible that the motion of a GroELWT ring is indeed concerted, and the
unusual result seen with this mutant is an artifact of the mutations. There has also been a
recent observation that the energy of the R197/E386 salt bridge is possibly coupled to the
energy of a salt bridge involving D155 (73). The weakening of one salt bridge leads to
74
the weakening of the other. A GroEL mutant, D155A, remarkably undergoes sequential
structural transitions rather than concerted ones, for an unknown reason (73). It is
possible that the structural transitions of GroELIRX are less concerted due to a weakening
of the D155/R395 salt bridge, leading to a partially sequential transition, and this may be
why two cross-links rather than one are required to prevent the T→R transition.
The observation that the structural transitions of GroELIRX occur at lower ATP
concentrations than observed with GroELWT is more readily explained. The removal of a
salt bridge that stabilizes the T state would be expected to allow an easier transition to the
R state (although this is complicated by the E386 mutation potentially removing both a T
and R state salt bridge). The shifting of the transitions to lower ATP concentrations also
raises the values of the allosteric constants L1 and L2. The Hill coefficient describing the
interaction between the two rings can be calculated using the following equation: nH = 2/
[1+(L1/L2)1/2] (33). The values of L1 and L2 were not explicitly determined in these
studies due to the necessity of eliminating the exclusive binding assumption (see sec. 1.6)
from the complex equation needed to fit these data. This is work ongoing in the lab (J.
Gresham, unpublished). However, published work with a similar mutant, R197A (33,
74), is entirely consistent with the results obtained here, in that the values of the allosteric
constants were higher than those for wild-type. In the case of the R197A mutant, the Hill
coefficient as calculated above was higher compared to wild-type (0.07 vs. 0.003
respectively) (33). Since these numbers are less than one and describe negative
cooperativity, an increase in nH compared to wild-type means that negative cooperativity
is reduced in the mutant. It may then be assumed that negative cooperativity in GroELIRX
is reduced as well, based on the similar results to R197A.
75
This reduction in negative cooperativity may provide an explanation for another
unusual result obtained with GroELIRX. As has been shown, the ability of GroELIRX to
release GroES upon binding ATP to the trans ring is somehow deficient compared to
GroELWT. This event requires communication of an unknown, probably subtle, structural
signal from the trans ring to the cis ring. A reduction in negative cooperativity implies
that the two rings are not communicating properly in GroELIRX, and thus the release
signal is possibly not being sent efficiently. The structural basis for the R197C/E386C
mutations affecting negative cooperativity, which is almost certainly controlled primarily
by interactions at the equatorial plate, remains unknown.
The observation that unfolded SP does not stimulate ATPase activity in GroELIRX
as it does in GroELWT is more difficult to explain, although the reason may also involve
the reduction in negative cooperativity. It has been observed that the single-ring variant
of GroEL, SR1, is also not stimulated by SP (J. Gresham, unpublished). In this mutant,
negative cooperativity clearly cannot exist. It is therefore possible that stimulation by SP
somehow depends on negative cooperativity, or more accurately, depends on efficient
inter-ring communication. Stimulation by SP will be covered in more detail in the next
chapter, and its possible dependence on inter-ring communication will be discussed in
Chapter 6. These studies with GroELIRX highlight the potential importance of inter-ring
communication in events in which this type of signaling has previously not been
implicated.

76
Chapter 4
Allosteric Basis for the Actions of SP on GroEL ATPase Activity:
Evidence for Active Unfolding

77
4.1 Introduction
It is difficult to demonstrate that GroEL exerts a mechanical force on bound SP.
Short of an atomic force microscopy experiment, the only ways currently available to
demonstrate the existence of active work on SPs are by indirect methods. The following
argument can be considered: if GroEL exerts force on an SP and pulls it apart, then the
SP must exert a reciprocal force on GroEL.
GroEL would exert its pulling force during the separation of its SP binding sites
while undergoing its allosteric transitions (Figure 1-2). Adjacent binding sites move
from being 23 Å apart in the T to state to 29 Å apart in the R state, to an even larger 36 Å
in the R’ state. The presence of SP would tend to counteract the displacement of the
binding sites. Since the SP binding sites are most exposed in the T state, SP
preferentially binds to the T state. SP bound to these sites will thus tend to hold a ring in
the T conformation, affecting the T→R equilibrium in favor of the T state (34).
But, does SP actually pull on the SP binding sites, holding a ring in the T state? A
clue is provided by the observation that unfolded substrate stimulates the ATPase activity
of GroELWT (34). At the time this was discovered, it was postulated that the stimulation
was the result of a shift in the overall equilibrium from the RR state to the TR state.
According to the original nested cooperativity model, the TR state is the most active
state, due to the highly active R ring (33). This model, however, contains the exclusive
binding assumption. From the results with GroELIAX, and the results presented in
Chapter 3 with GroELIRX, it is now known that the exclusive binding assumption is
invalid. The T state does bind ATP and hydrolyzes it at a faster rate than the R state.
The reasons behind ATPase stimulation by SP must therefore be revisited.

78
Since the presence of SP shifts the T→R equilibrium in favor of the T state, and
since we now know that the T state has a higher ATPase activity than the R state, it is
tempting to speculate that ATPase activity is stimulated because SP is holding one or
both rings in the T conformation. In effect, the SP is acting as a tether, similar to the
tethers provided by the disulfide bonds or chemical cross-links in the studies with
GroELIAX and GroELIRX. The latter two are covalent linkages; mechanical constraints
that lock a ring in the T state by counteracting the force of the structural transition. If SP
is mimicking a covalent tether, then it must also be counteracting the motion of the
subunits, and it must do this by exerting its own force on the subunits. This is what
would be predicted if active unfolding occurs in the GroE system. In order for GroEL to
encapsulate the SP, it must overcome the force of the SP and undergo the T→R→R’
transitions, binding GroES and burying the SP binding sites. If the binding of SP is tight,
then bound SP will be stretched as the subunits move, and will be actively unfolded.
Therefore, a demonstration that SP mimics the effect of a covalent tether will provide
further evidence that active unfolding by GroEL is a real process.
If SP is mimicking a covalent bond, then certain predictions can be made about
the effect of SP on the behavior of GroEL. If SP is locking, or holding, a ring in the T
state, then the measured ATPase activity in the presence of SP should be approximately
the Vmax of the T state. VmaxT cannot be measured directly, but can be estimated using
the ATPase models described in the previous chapter if the experiments are performed
with a double cysteine mutant, such as GroELIAX. Furthermore, SP should have no
additional effect on the ATPase activity of GroELIAX that has already been locked in the
T state. Finally, if SP is acting as a tether, then it must be acting as an intersubunit tether,

79
connecting two or more SP binding sites. These binding sites need not necessarily be on
adjacent subunits. This would depend on the conformation of the highly variable
unfolded substrate. But, the SP would necessarily have to be large enough to span at
least two adjacent subunits in order to act as a tether, a distance of approximately 23 Å.
A small substrate such as a short peptide should not be able to form a tether, and
therefore should not affect the ATPase activity. Here, these predictions are tested
experimentally using two different SPs and by making use of GroELIAX, the intrasubunit
double cysteine mutant.
4.2 Methods Specific to Chapter 4
4.2.1 Assay for MDH Activity During Re-folding by GroEL The recovery of
activity by MDH during re-folding by GroEL was monitored spectroscopically. Acid-
denatured MDH was added to a solution containing 50 mM Tris pH 7.5, 100 mM KAc,
10 mM MgAc, 0.2 mM PEP, 0.2 mM NADH, 1 mM DTT, 1 mM ATP, 5 units PK, 2 µM
GroELWT, and 2 µM GroES, with a final MDH concentration of 0.4 µM at 30°C. At
various times after MDH addition, 30 µl of this refolding reaction was removed and
added to a cuvet containing 900 µl 50 mM Tris pH 7.5, 100 mM KAc, 10 mM MgAc, 0.2
mM NADH, 1 mM DTT and 1 mM oxaloacetate. The final [MDH] was 14 nM. The
decrease in absorbance at 340 nm was monitored over 30 seconds, and the rate was
calculated using the ∆AU and the [MDH].
4.3 Results
4.3.1 Effect of SPs on GroEL ATPase Activity The ATPase activity of
GroELWT and GroELIAX was measured in the presence of acid-denatured α-lactalbumin
(α-LA) and malate dehydrogenase (MDH) using the coupled enzyme assay at 37°C. α-

80
LA is a convenient SP to use in these experiments, because it is stable at all temperatures
used and will not refold even in the presence of GroEL/GroES. MDH is less convenient,
because it is somewhat unstable at 37°C, tends to aggregate, and will refold in the
presence of both GroEL and GroES (but, not GroEL alone). Representative data are
shown in Figure 4-1. In all cases, the GroEL concentration was 2 µM. A 25-fold excess
Figure 4-1: Stimulation of ATPase Activity by Unfolded SP. A 25-fold excess of acid-denatured α-LA or a 2-3-fold excess of acid-denatured MDH (see section 2.10) was added to a GroEL ATPase reaction with 2 µM GroEL at 37°C. GroELWT consistently showed slightly slower rates than GroELIAX but was stimulated by SP to a greater extent. Controls using folded α-LA and MDH showed slight stimulations (about 1.5-fold), probably due to the presence of unfolded protein in these commercial preparations.
of α-LA or a 2-3 fold excess of MDH over GroEL rings was used to obtain the rates
shown. GroELWT was typically stimulated 5-7 fold by SP, and GroELIAX about 3-4 fold.
GroELIAX consistently shows a higher basal ATPase rate than GroELWT, which explains
why it did not undergo the same degree of stimulation. The absolute rates and the degree
of stimulation obtained with unfolded SPs tended to vary from experiment to experiment,
depending on the preparation of GroEL that was used. This most likely reflected the

81
small amount of contamination that remained even after the acetone precipitation was
used to purify the GroEL. Controls with folded SP typically showed about a 1.5-fold
stimulation of activity, presumably due to unfolded SP present in the solution (data not
shown).
4.3.2 Titration of Unfolded SP To determine the amount of SP required for
maximal stimulation of GroELWT and GroELIAX, increasing amounts of unfolded α-LA or
MDH were added to 2 µM GroEL (0.14 µM GroEL14) and activity was measured at
37°C. The results are presented in Figure 4-2. The SPs appear to bind less efficiently to
GroELIAX. This is probably due to the absence of the T state salt bridge causing a shift of
the T→R intra-ring equilibrium towards the R state, making the SP binding sites less
accessible. A 50-fold excess of the weak-binding α-LA over rings is needed to cause
maximum rate stimulation, but in the case of the tight-binding MDH, only a 3-fold excess
is required.
4.3.3 Refolding of MDH by GroEL/GroES The re-folding of MDH is
accelerated by the complete GroE system (GroEL, GroES, ATP) (64). It was noticed that
upon addition of MDH to an ATPase reaction containing both GroEL and GroES, that
there is an initial rate stimulation, followed by a slow decrease back to approximately the
rate measured without added MDH. No such observation is made with α-LA, which,
once added, continues to stimulate the rate to the same extent for the entire measurement
(Figure 4-3). Once decalcified, reduced, and denatured, α-LA cannot refold to the native
state (34) even in the presence of GroE, whereas MDH can. The burst of activity seen
with MDH followed by the relaxation to the initial rate must represent the refolding of
the SP, which no longer stimulates GroEL’s ATPase activity once refolded. The

82
amplitude of the burst is dependent upon the concentration of MDH added, and the rate
of refolding is approximately constant at all [MDH] (Figure 4-4a,b,c).
To confirm that MDH is refolded under the conditions of the ATPase assay,
unfolded MDH was added to a solution containing the complete GroE system in the same
buffer as was used in the coupled-enzyme assay (Figure 4-4d). At various times, MDH
activity was measured by removing an aliquot of this reaction and adding it to a cuvet
Figure 4-2: Titration of unfolded SP into GroEL ATPase Reactions. Increasing amounts of α-LA or MDH were added to GroEL ATPase reactions with 2 µM GroEL (0.29 µM GroEL rings) at 37°C. A) GroELWT with α-LA B) GroELWT with MDH C) GroELIAX with α-LA, D) GroELIAX with MDH.

83
containing oxaloacetate and NADH (section 4.2.1). This experiment was carried out at
30°C due to the instability of MDH at 37°C (63). The kinetics of the ATPase burst and
that of the MDH re-folding cannot be directly compared due to a dimerization step that
must take place in order for MDH to regain full activity (50).
4.3.4 X-linked GroELIAX is not Affected by SP The simplest explanation for
why SP stimulates activity is that SP is forcing the GroEL ring to maintain the more
active T conformation. If this is true, then SP should not affect the ATPase activity of a
ring that is already locked in the T state by a cross-link. To test this, GroELIAX was
cross-linked to an extent of about 25% and assayed with and without SP. An extent of
Figure 4-3: Addition of SP to GroEL/GroES ATPase Reaction. The change in rate upon addition of α-LA or MDH to an ATPase reaction was monitored in real-time using the coupled-enzyme assay. The absorbance readings at 340 nm are shown, with SP added at the arrow, and rate can be inferred by considering the slope of the trace. Addition of a 25-fold excess of α-LA over GroELWT rings in the presence of 2 µM GroES at 37°C causes constant stimulation over the course of the measurement. Addition of a 2-fold excess of MDH to GroELWT/GroES causes an initial rapid decrease in absorbance followed by a slow return to approximately the same slope as before the SP was added. The mixing points are masked for clarity.
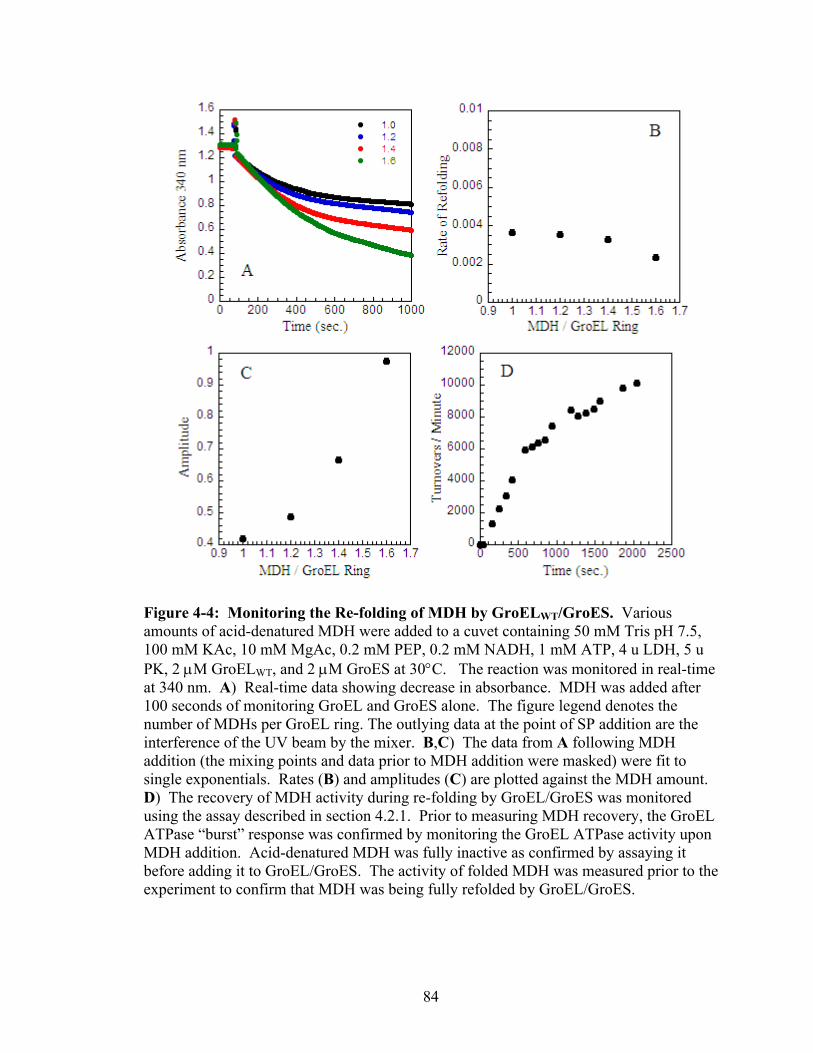
84
Figure 4-4: Monitoring the Re-folding of MDH by GroELWT/GroES. Various amounts of acid-denatured MDH were added to a cuvet containing 50 mM Tris pH 7.5, 100 mM KAc, 10 mM MgAc, 0.2 mM PEP, 0.2 mM NADH, 1 mM ATP, 4 u LDH, 5 u PK, 2 µM GroELWT, and 2 µM GroES at 30°C. The reaction was monitored in real-time at 340 nm. A) Real-time data showing decrease in absorbance. MDH was added after 100 seconds of monitoring GroEL and GroES alone. The figure legend denotes the number of MDHs per GroEL ring. The outlying data at the point of SP addition are the interference of the UV beam by the mixer. B,C) The data from A following MDH addition (the mixing points and data prior to MDH addition were masked) were fit to single exponentials. Rates (B) and amplitudes (C) are plotted against the MDH amount. D) The recovery of MDH activity during re-folding by GroEL/GroES was monitored using the assay described in section 4.2.1. Prior to measuring MDH recovery, the GroEL ATPase “burst” response was confirmed by monitoring the GroEL ATPase activity upon MDH addition. Acid-denatured MDH was fully inactive as confirmed by assaying it before adding it to GroEL/GroES. The activity of folded MDH was measured prior to theexperiment to confirm that MDH was being fully refolded by GroEL/GroES.

85
25% was chosen because this is approximately the point at which all rings contain at least
one cross-link, according to the binomial distributions and the rules of probability.
(GroELIRX was not used since it does not respond to SP.) A higher extent is undesirable
since rings would begin to lose activity once they contained too many tethers (see
Chapter 3). The effect of GroES was also tested. GroELIAX was cross-linked with
oPDM, which allowed the use of DTT in the subsequent assay in order to ensure that the
SPs were completely unfolded. The relative effects are shown in Figure 4-5. SP
stimulates the activity of reduced GroELIAX about 3-fold to between 16 and 19
turnovers/minute. SP has very little effect on cross-linked material, whose activity is
already approximately 18 turnovers/minute. GroES slows reduced GroELIAX’s ATPase
activity by about one half and has less of an effect on cross-linked GroELIAX, as would be
expected since most rings will not be able to bind GroES. The relative effect of SP on
GroEL is greater in the presence of GroES, for reasons that are not clear, but this was
consistently seen throughout these studies. It is possible that the trans ring of a bullet
has a higher affinity for SP than the rings do in GroEL alone.
4.3.5 Adding Unfolded SP to GroELIAX Provides a Direct Measurement of
VmaxT When formulating the theoretical models that predict the response of ATPase
activity to tethering, it is necessary to estimate several parameters, one of which is VmaxT
(see Chapter 3). An estimate of VmaxT is obtained empirically by determining the value
of VmaxT which produces a model that best fits the data. VmaxT cannot be measured
directly by locking rings in the T state with tethers, since this also causes a loss in
activity. However, if unfolded SP is mimicking a cross-link and holding a ring in the T
state, then the rate measured in the presence of SP should be approximately VmaxT,

86
Figure 4-5: Effect of Unfolded SP on Cross-linked GroELIAX. 2 µM GroELIAX that was 0% or 25% cross-linked was assayed at 37°C with or without 2 µM GroES, 7.4 µM α-LA (25-fold excess over rings), and 0.56 µM MDH (2-fold excess over rings). The rates, relative to the rate measured in the absence of GroES and SP, are shown. The reactions contained 1 mM DTT. Cross-linking was done with oPDM and was confirmed by SDS-PAGE quantitation.
assuming that SP does not cause a loss in activity. This seems a safe assumption, since
high concentrations of SP never cause a loss in activity (Figure 4-2). To test whether or
not SP provides a measurement for VmaxT, the response of GroELIAX’s ATPase activity to
oxidation was tested with and without added α-LA in an experiment similar to those
described in Chapter 3. The results are shown in Figure 4-6. In the absence of SP, the
data match a theoretical model in which 1 disulfide bond per ring is sufficient to lock the
ring in the T state, and 6 tethers per ring cause a loss of all activity (VmaxRes=0). VmaxR
was estimated to be the rate of fully reduced GroELIAX and VmaxT was estimated to be 18,
as this produced the model which best fit the data. In the presence of SP, the activity of
reduced GroELIAX was 16-17. SP has no effect on the ATPase activity when the

87
Figure 4-6: Response of GroELIAX to Oxidation, ± Unfolded SP. Various amounts of diamide were added to 40 µM GroELIAX, and the reaction was allowed to proceed for at least 30 minutes at 37°C at pH 8. After removing a small portion of the oxidized GroEL and adding it to NEM to block the free cysteines, the remainder was added to a reaction mixture containing 50 mM Tris pH 7.5, 100 mM KAc, 10 mM MgAc, 0.2 mM PEP, 0.2 mM NADH, 1 mM ATP, 4 u LDH, 5 u PK, with a final GroEL concentration of 2 µM. The change in absorbance at 340 nm was monitored at 37°C. Halfway through the measurement, acid-denatured α-LA was added to a final concentration of 15 µM, a 50-fold excess over rings. The fraction of subunits oxidized was quantitated using the NEM-blocked samples by SDS-PAGE. The theoretical model shown was plotted using these parameters: VmaxR=3.8, VmaxT=18, VmaxRes=0, and 6 strikes (see section 3.3.2). The thin, brown line represents the fraction of rings remaining in the R state.
population of rings in the R state reaches zero. Thus, the VmaxT measured in the presence
of SP and the VmaxT predicted by the model are almost identical. At higher levels of
oxidation, SP has a slight inhibitory effect on ATPase activity, for reasons not entirely
clear.
4.3.6 SP is not a Perfect Mimic of a Cross-link As a final demonstration that SP
mimics a cross-link by holding a ring in the T state, the ATPase activity of GroELIAX was
measured in the presence of SP as a function of ATP concentration. If SP is a perfect
mimic of a cross-link that locks a ring in the T state, the cooperativity of ATP binding

88
should be reduced and the Hill coefficient should approach 1. The ATPase activity of
both fully reduced GroELIAX and that which was 50% oxidized was measured as a
function of [ATP], with and without 15 µM α-LA (a 50-fold excess over rings). SP once
again stimulates the activity of GroELIAX, but only at high ATP concentrations, reaching
VmaxT at approximately 800 µM ATP (Figure 4-7a). With GroELIAX that is 50%
oxidized, SP inhibits activity at all [ATP] below 800 µM (Figure 4-7c). The Hill
coefficients obtained from the data in Figure 4-7c are 1.2 and 1.5, essentially identical,
with and without SP respectively. Rate inhibition was also seen with fully reduced
GroELIAX at very low [ATP] (Figure 4-7b), in which the data appear to be sigmoidal,
indicating an increase in the cooperativity of ATP binding.
The observation that SP stimulates reduced GroELIAX only at high [ATP] is
consistent with data from Yifrach and Horovitz, who found that at low [ATP], very high
amounts of α-LA (>100-fold excess) were needed to achieve rate stimulation (see (34)).
It is possible that the concentration of SP used here was too low to show stimulation at
low [ATP], although the absolute [ATP] where this phenomenon is observed in their
results and in the results shown here do not quite match. This could be due to differing
K+ concentrations, differing reaction temperatures, or the slightly different way in which
the SP was prepared. It is also possible that the difference is due to an unknown property
of the mutant.
The increase in cooperativity at low [ATP] is consistent with the idea that SP
holds a ring in the T state, but doesn’t lock it in the T state. This makes sense, because
the SP is not a covalent linkage. The T→R transition is still allowed, but is rendered
more difficult by SP. Thus, the transition would be expected to occur at higher [ATP],

89
Figure 4-7: Dependence of GroELIAX ATPase Activity on [ATP] ± SP, ± Cross-linking. The ATPase activity of fully reduced GroELIAX and that which is 50% oxidized by diamide was determined at various [ATP] with or without 15 µM unfolded α-LA (50-fold excess over rings). Measurements were taken at 37°C with a final GroEL concentration of 2 µM. A) Activity of fully reduced GroELIAX with and without SP. B) The data from (A) at low [ATP]. C) Activity of 50% oxidized GroELIAX with and without SP. The data were fit to the Hill equation (sec. 3.4.5) and gave the following values: -SP: Vmax=20 turnovers/minute, K=0.004 µM, nH=1.5; +SP: Vmax=21, K=0.004 µM, nH=1.2.

90
with increased cooperativity. In the case of a cross-link, the T→R transition is never
allowed; therefore, no cooperativity is observed.
However, the observation that SP inhibits activity under some conditions is more
difficult to explain. In the case of the fully reduced GroELIAX at very low [ATP], the
reason is almost certainly a decreased affinity for ATP in the SP-bound rings, which is
due to the increased cooperativity in ATP binding within a ring. The reason for SP
inhibition of rate in the case of oxidized GroELIAX is more elusive. It is possible that the
effect of having both cross-links and SP bound to the same ring is to create an artificial T
conformation which has an even more reduced affinity for ATP, but this is only a guess.
In conclusion, despite some irregularities in the details, SP in a broad sense seems to
closely mimic a cross-link in that it binds to and holds a ring in the T conformation,
shifting the T→R equilibrium in favor of the T state.
4.3.7 Short Peptides and a Hydrophobic Amino Acid do not Stimulate ATPase
Activity If SP is acting as a tether, holding, but not locking, a ring in the T conformation,
then it must be an intersubunit tether that spans two or more SP binding sites. If this is
true, then a substrate which can bind to the SP binding sites but which is too short to span
two or more sites, should not cause a rate enhancement. To test this prediction, short,
synthetic peptides were obtained from Dr. Lila Gierasch. These peptides, which were
designed to mimic unfolded SPs with various secondary structural elements, are known
through NMR studies to bind to the SP binding sites (75), and are too short to span two
adjacent binding sites. Three peptides, DRho2, LDRho2, and Ac-Rho2, were dissolved
in 10 mM Tris pH 8. Each peptide contained a single tryptophan, which allowed
concentration determination at 280 nm with an extinction coefficient of 5559 M-1. The
91
peptides were added to an ATPase reaction containing 2 µM GroELWT at 30°C. At
peptide concentrations ranging from 8 µM up to 75 µM, no stimulation of ATPase
activity was seen, either in the absence or presence of 2 µM GroES (data not shown). At
the end of each measurement, unfolded MDH was added to the reaction to ensure that
rate stimulation was possible, and in all cases a 6-7 fold stimulation was seen. It should
be noted that the binding of the peptides to GroELWT was not confirmed, and the binding
constants of the peptides were not published, but it is certain that they are able to bind to
GroEL (75).
In addition to the short peptides, a hydrophobic amino acid, leucine, was also
tested in an ATPase reaction. It has been reported that hydrophobic amino acids such as
leucine and isoleucine cause a rate enhancement (76), a result that would invalidate the
current hypothesis that an SP must span multiple SP binding sites in order to cause rate
stimulation. The effect of added leucine on the ATPase activity of GroELWT was tested
with 2 µM GroEL at 37°C. Leucine concentrations up to 5 mM were tried, and no effect
was ever seen on the ATPase activity, either with or without 2 µM GroES (data not
shown). It is unknown why rate stimulation was seen in the published report (76).
Although the observations with short peptides and with leucine are both admittedly
negative results, they do lend further support to the idea that an SP must be able to
connect two or more SP binding sites in order to cause rate stimulation.
4.4 Discussion
The stimulation of ATPase activity by unfolded SP has previously been tied to
GroEL’s allosteric transitions. SP was thought to shift the overall equilibrium from the
RR state to the more active TR state (34). The results presented here, in combination
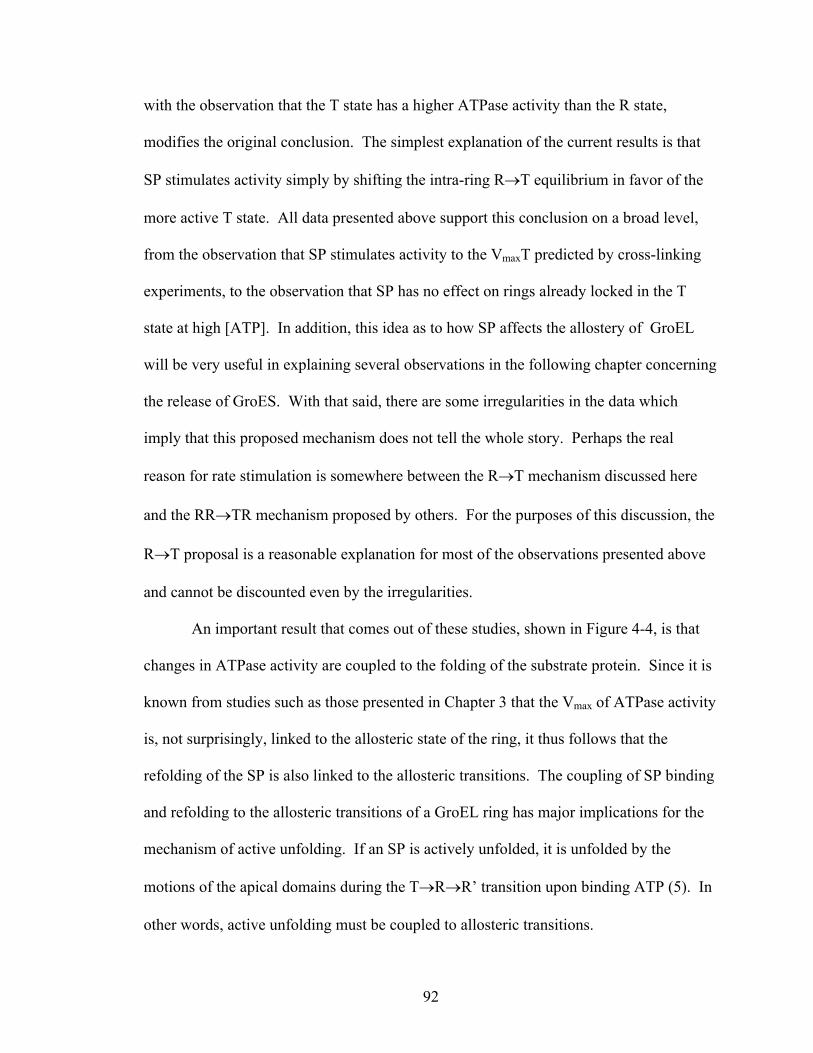
92
with the observation that the T state has a higher ATPase activity than the R state,
modifies the original conclusion. The simplest explanation of the current results is that
SP stimulates activity simply by shifting the intra-ring R→T equilibrium in favor of the
more active T state. All data presented above support this conclusion on a broad level,
from the observation that SP stimulates activity to the VmaxT predicted by cross-linking
experiments, to the observation that SP has no effect on rings already locked in the T
state at high [ATP]. In addition, this idea as to how SP affects the allostery of GroEL
will be very useful in explaining several observations in the following chapter concerning
the release of GroES. With that said, there are some irregularities in the data which
imply that this proposed mechanism does not tell the whole story. Perhaps the real
reason for rate stimulation is somewhere between the R→T mechanism discussed here
and the RR→TR mechanism proposed by others. For the purposes of this discussion, the
R→T proposal is a reasonable explanation for most of the observations presented above
and cannot be discounted even by the irregularities.
An important result that comes out of these studies, shown in Figure 4-4, is that
changes in ATPase activity are coupled to the folding of the substrate protein. Since it is
known from studies such as those presented in Chapter 3 that the Vmax of ATPase activity
is, not surprisingly, linked to the allosteric state of the ring, it thus follows that the
refolding of the SP is also linked to the allosteric transitions. The coupling of SP binding
and refolding to the allosteric transitions of a GroEL ring has major implications for the
mechanism of active unfolding. If an SP is actively unfolded, it is unfolded by the
motions of the apical domains during the T→R→R’ transition upon binding ATP (5). In
other words, active unfolding must be coupled to allosteric transitions.
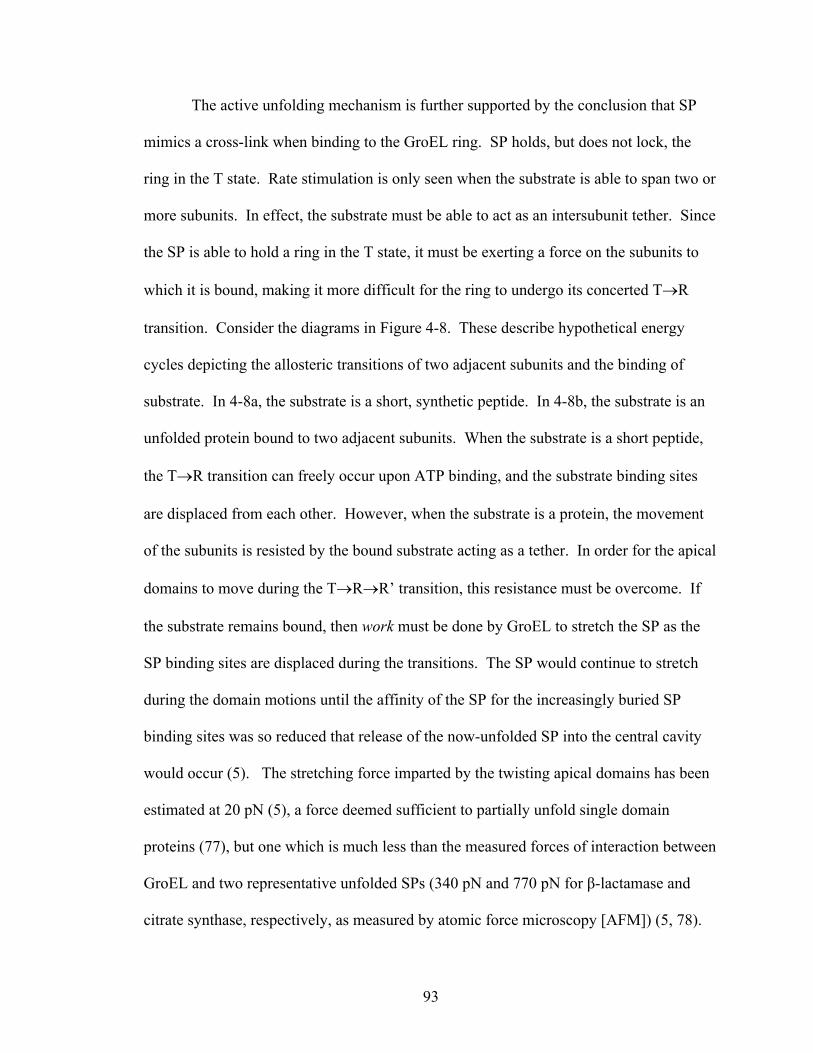
93
The active unfolding mechanism is further supported by the conclusion that SP
mimics a cross-link when binding to the GroEL ring. SP holds, but does not lock, the
ring in the T state. Rate stimulation is only seen when the substrate is able to span two or
more subunits. In effect, the substrate must be able to act as an intersubunit tether. Since
the SP is able to hold a ring in the T state, it must be exerting a force on the subunits to
which it is bound, making it more difficult for the ring to undergo its concerted T→R
transition. Consider the diagrams in Figure 4-8. These describe hypothetical energy
cycles depicting the allosteric transitions of two adjacent subunits and the binding of
substrate. In 4-8a, the substrate is a short, synthetic peptide. In 4-8b, the substrate is an
unfolded protein bound to two adjacent subunits. When the substrate is a short peptide,
the T→R transition can freely occur upon ATP binding, and the substrate binding sites
are displaced from each other. However, when the substrate is a protein, the movement
of the subunits is resisted by the bound substrate acting as a tether. In order for the apical
domains to move during the T→R→R’ transition, this resistance must be overcome. If
the substrate remains bound, then work must be done by GroEL to stretch the SP as the
SP binding sites are displaced during the transitions. The SP would continue to stretch
during the domain motions until the affinity of the SP for the increasingly buried SP
binding sites was so reduced that release of the now-unfolded SP into the central cavity
would occur (5). The stretching force imparted by the twisting apical domains has been
estimated at 20 pN (5), a force deemed sufficient to partially unfold single domain
proteins (77), but one which is much less than the measured forces of interaction between
GroEL and two representative unfolded SPs (340 pN and 770 pN for β-lactamase and
citrate synthase, respectively, as measured by atomic force microscopy [AFM]) (5, 78).
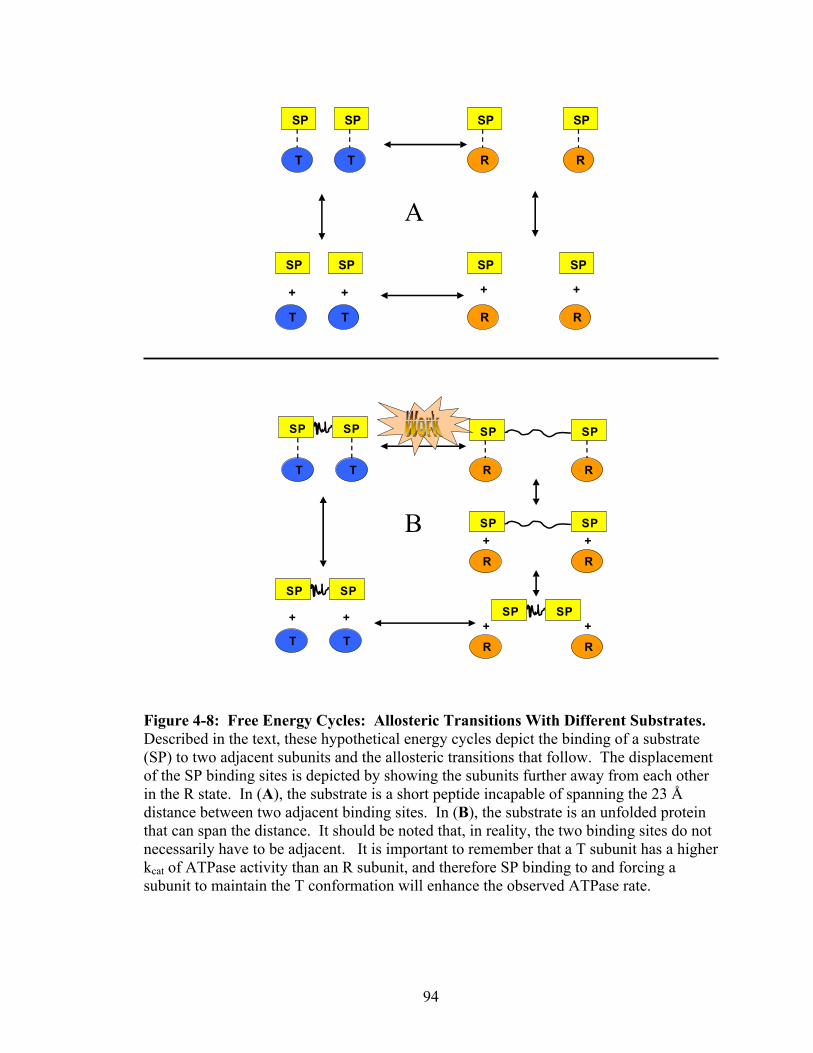
94
+ +
SP SP
T T
SP SP
T T
SP
R
SP
R
SP SP
R R
++
SP SP
T T
SP
R
SP
R
SP
R
SP
R
+ +
R R
+ +SP SP+ +
SP SP
T T
Figure 4-8: Free Energy Cycles: Allosteric Transitions With Different Substrates. Described in the text, these hypothetical energy cycles depict the binding of a substrate (SP) to two adjacent subunits and the allosteric transitions that follow. The displacement of the SP binding sites is depicted by showing the subunits further away from each other in the R state. In (A), the substrate is a short peptide incapable of spanning the 23 Å distance between two adjacent binding sites. In (B), the substrate is an unfolded protein that can span the distance. It should be noted that, in reality, the two binding sites do not necessarily have to be adjacent. It is important to remember that a T subunit has a higher kcat of ATPase activity than an R subunit, and therefore SP binding to and forcing a subunit to maintain the T conformation will enhance the observed ATPase rate.
B
A

95
One could argue that, even if GroEL does exert force on the SP, unfolding does
not occur. Rather, GroEL simply exerts force on the SP until the SP releases from its
binding sites. This would require the intermolecular interactions within the misfolded SP
to resist the 20 pN stretching force, and would require the stretching force to overcome
the force of GroEL/SP interaction. This may be the case for some SPs. Indeed, the
ability of GroEL to actively unfold SPs is, to a large extent, dependent on the SP.
However, as has been previously implied (5), at least for the two SPs mentioned above,
the 20 pN stretching force exerted by the twisting apical domains would not be sufficient
to overcome the interaction forces and pull the SP binding sites away from the SP.
Therefore, it is more likely that these SPs would remain bound to the apical domains
during the T→R→R’ twisting motions, allowing the SPs to be stretched until the SP
binding sites become at least partially buried. At this point, the GroEL/SP interaction
forces would likely be reduced to the point where they can no longer overcome the
stretching force, and the SP would be released into the central cavity. Many additional
AFM experiments, measuring the interaction of a wide range of SPs with GroEL, will be
necessary to gain some understanding of the number of SPs capable of binding tightly
enough to GroEL to allow them to be forcefully unfolded (5).
In summary, while the experiments presented in this chapter do not address the
magnitude of the forces involved in SP unfolding, they do strongly suggest that active
unfolding does indeed occur. As stated in the introduction to this chapter, if an SP
restrains the movement of the subunits during the allosteric transitions, then in
overcoming that restraint the subunits must exert an opposite force on the SP. These
experiments demonstrate that SPs exert a force on GroEL, in that they restrain the T→R

96
transition by mimicking a covalent tether. This strongly suggests, therefore, that the
reciprocal is also true: GroEL exerts a force on SPs. Thus, in discovering the likely
cause of ATPase rate stimulation by unfolded SPs, these experiments have indirectly
demonstrated a critical requirement of the iterative annealing mechanism (5), that GroEL
performs work on SPs.

97
Chapter 5
Examining the Allosteric Basis for the Release of GroES from the
GroEL/GroES Complex
98
5.1 Introduction
The discharge of GroES from the cis ring of a GroEL14/GroES7 complex is
initiated by the binding of ATP to the opposite trans ring, following the hydrolysis of
ATP in the cis ring (37). This allows any substrate protein encapsulated beneath GroES
to be released into the surrounding environment, whether the SP is properly folded or not
(20, 79). This is a critical step in the GroE reaction cycle. It allows for the coordinated
breakdown of a folding chamber on one ring of GroEL and the formation of a new one on
the other ring. Since one chamber is falling apart as the other is forming, the efficiency
of the GroEL machine is optimized (17, 29). The amount of time that GroES spends
bound to GroEL is also important, for this is the time period in which an SP can refold in
the protective isolation of the cis chamber. In the passive unfolding mechanism, in which
it is proposed that GroEL promotes protein refolding simply by isolating misfolded SPs
in a favorable folding environment (7), the amount of time an SP is allowed to fold in the
central cavity is a critical factor. Any reduction in the amount of time the SP spends
encapsulated in the central cavity would reduce the chances of its being properly folded
when it is released. In contrast, encapsulation time is not the important parameter in the
active unfolding, or iterative annealing, mechanism. Under this mechanism, the number
of times in which the SP can be forcefully unfolded and given another chance to fold,
either inside or outside the cavity, is most important. In this mechanism, the number of
times the system turns over is the critical factor, the more the better (19, 46).
GroES release has been implicated as the rate-limiting step in the GroE reaction
cycle, occurring at a rate of 0.04 sec-1 in the absence of SP (17, 80). However, Rye et al.
have found that, in the presence of SP, the rate of release is accelerated to 1-2 sec-1 (17).

99
The reason given for the acceleration in these studies was that SP somehow increased the
rate of an additional structural transition that occurred in the cis ring following cis-ATP
hydrolysis but prior to ATP binding to the trans ring (17). The nature of this structural
transition remains unclear, and indeed, the structural basis for any of the events that
accompany GroES release are unknown. The structural signal that is communicated
between the rings following trans-ATP binding is not understood.
The goal of the studies in this chapter was to take a closer look at the events that
accompany GroES release. Specifically, an allosteric basis for these events was sought.
It was realized that the same mechanism by which SP accelerates the hydrolysis of ATP,
ie. the shifting of the T→R equilibrium towards the T state (see Chapter 4), might be
responsible for the acceleration of GroES release seen in the previous study. Thus, it was
asked whether or not the allosteric state of the trans ring (T or R) had any effect on the
rate of GroES release. As has been discussed, there are several allosteric effectors of the
T→R structural transition, such as SP, nucleotide, and K+ ions. The effect of these
various components on GroES release was therefore tested in an attempt to elucidate the
effect of allostery on the release mechanism.
In order to study GroES release, the experimental system devised by Rye et al.
was used in which single cysteine GroEL and GroES mutants were labeled with
fluorescent probes (17, 52). These two probes constitute a fluorescence resonance energy
transfer (FRET) pair, in which, upon excitation of the donor probe, energy from the
excited state of the donor probe is transferred to the acceptor probe, causing an increase
in the emission from the acceptor and a decrease in the emission from the donor. The
efficiency of this energy transfer is related to the distance between the two probes (81).
100
When GroEL is bound to GroES, energy transfer can occur and there is strong emission
from the acceptor probe; whereas when GroES is released from GroEL, the distance
between them is essentially infinite, no transfer can occur, and emission from the
acceptor probe is significantly decreased. GroES release can therefore be measured in a
stopped-flow device in which the emission from the acceptor probe is monitored upon
excitation of the donor probe as GroES release is initiated.
The results presented in this chapter provide new insights into the events that
accompany GroES release. The data obtained here by systematically varying the
conditions of the experiments in much greater detail than in the previous studies by Rye
et al. (17, 37), have allowed for the formulation of a detailed reaction mechanism, which
will be described in the subsequent sections. This refined mechanism specifically
implicates one event, the release of ADP from the trans ring, as being the rate-limiting
step in GroES release. The basis for SP stimulation of the rate of GroES release is also
discussed. The implications of these findings on the active unfolding vs. passive
unfolding debate are discussed in Chapter 6. Some of the data presented in this chapter
differ significantly from the data published previously by Rye et al. (17), and the possible
reasons for this are discussed below, along with the limitations of these studies in
determining all of the steps in this unexpectedly complex reaction.
5.2 Methods Specific to Chapter 5
5.2.1 Mutagenesis and Purification The two mutants used for the FRET studies
in these experiments were GroEL E315C and GroES 98C (Figure 5-1). GroEL E315C
was constructed in pGEL1 using the Stratagene Quick-Change kit using the protocol in
the kit documentation. The mutagenic primers were E315C-S:

101
GCTGGAAAAAGCAACCCT GTGCGACCTAGGTCAGGCTAAACG and E315C-NS:
CGTTTAGCCTGACCTAGG TCGCACAGGGTTGCTTTTTCCAGC. A new Bln I
restriction site was also introduced by these primers for purposes of detection. GroEL
E315C was purified as described in section 2.4. GroES 98C was created by inserting a
cysteine residue at the C terminus of GroES. The mutant was constructed in pGES1 with
the Quick-Change kit using primers ES98C-S:
GGCAATTGTTGAAGCGTBCTAACCTTGGCTGTTTTGG and ES98C-NS:
CCAAAACAGCCAAGGTTAGCACGCTTCAACAATTGCC. These plasmids also
eliminated a unique Hind III site from the plasmid sequence. GroES 98C was purified
Trans Ring
GroES
Cis Ring
GroEL
Figure 5-1: GroEL/GroES/ADP Complex with the FRET Residues Highlighted. GroEL E315 was mutated to cysteine and a cysteine was added to the C-terminus of GroES (residue 97 is highlighted). These were labeled with the probes IAEDANS and F5M respectively. These residues are approximately 36 Å apart (Cα→Cα). The cis ring ADP is constrained in the nucleotide binding sites, whereas trans ring ADP can freely diffuse. This structure was made using PDB file 1aon (14).

102
essentially according to the protocol in section 2.7 but required a slight modification to
the SP Sepharose column conditions. The column was run at pH 4.8, and GroES 98C
was eluted with a 150 ml gradient from 0 to 300 mM NaCl.
5.2.2 Labeling GroEL E315C and GroES 98C with Fluorescent Probes The
donor chromophore, IAEDANS and the acceptor chromophore, fluorescein-5-maleimide
(F5M), were purchased from Molecular Probes. For purposes of FRET, the R0 value for
this pair of probes is about 40 Å (82). The distance between the α-carbons of GroEL
E315C and GroES 98C is 36Å, close to the R0 value. Solutions of these probes were
made in anhydrous DMF at a final concentration of 20 mM. Prior to labeling, both
mutants were freshly reduced with 5 mM DTT. DTT was removed by running the
protein on a PD-10 column equilibrated with 10 mM Tris pH 7.5, 10 mM MgAc that had
been treated with Chelex resin. GroEL E315C was labeled at several different
concentrations with varying amounts of IAEDANS. In one case, 320 µM GroEL was
labeled with a 25-fold excess of IAEDANS over GroEL14, 575 µM. The estimated extent
of labeling with these conditions was 90%. In another, 200 µM GroEL was labeled with
200 µM IAEDANS in phosphate buffer at pH 7.5, leading to a labeling extent of 40%.
The experimental results were not dependent on the extent of labeling, as will be
discussed in the next section. The labeling reaction was carried out at 25°C for 1 hour in
the dark. Unreacted cysteines were blocked with a molar equivalent of NEM, followed
by a quench with 10 mM DTT. GroES 98C was also labeled under various conditions.
In one case, 470 µM GroES was labeled with a 3-fold excess of F5M over GroES7, 200
µM F5M for 1 hour. Labeling was estimated at 90% under these conditions, but some
aggregation was seen. Labeling was also done with 115 µM GroES and 48 µM F5M for

103
10 minutes. Under these conditions, no aggregation was seen. The experimental results
were also not dependent on the extent of GroES labeling. The labeling reaction was
quenched with 10 mM DTT. For both proteins, excess label was removed by running the
protein on a PD-10 column equilibrated with 10 mM Tris pH 7.5, 10 mM MgAc. The
labeled protein was then concentrated and stored at -80°C. The concentration of labeled
GroEL (GroELD) was checked both by checking its absorbance at 280 nm, and by
comparing it to GroEL of a known concentration on an SDS-PAGE gel. The
concentration of the labeled GroES (GroESA) was measured using a Bradford assay and
also quantitative SDS-PAGE since F5M interferes strongly with the absorbance signal at
280 nm. The IAEDANS concentration was measured at 336 nm using an extinction
coefficient of 5400 M-1 (17). The concentration of F5M was measured at 491 nm using
an extinction coefficient of 74500 M-1 (17).
5.2.3 Stopped-Flow Fluorescence Measurements Figure 5-2 shows the
experimental design schematically. All fluorescence measurements were carried out on
an Applied Photophysics SX18MV-R stopped-flow apparatus. The instrument was
configured with a 20 µl flow cell with a pathlength of 2 mm and a 530 nm emission cut-
off filter. The monochrometer slits were set to position 2, corresponding to a slit width of
approximately 9 mm. The syringes and flow cell were thermostatted at 30°C with a
circulating water bath (VWR). The total volume of solution pushed into the flow cell per
shot was approximately 170 µl, or 85 µl from each syringe. The dead time of the
instrument averages about 1 ms according to the instrument documentation and was not
explicitly determined during these studies. As per Rye et al. (17), the excitation
wavelength used for all measurements was 336 nm. The instrument is capable of an
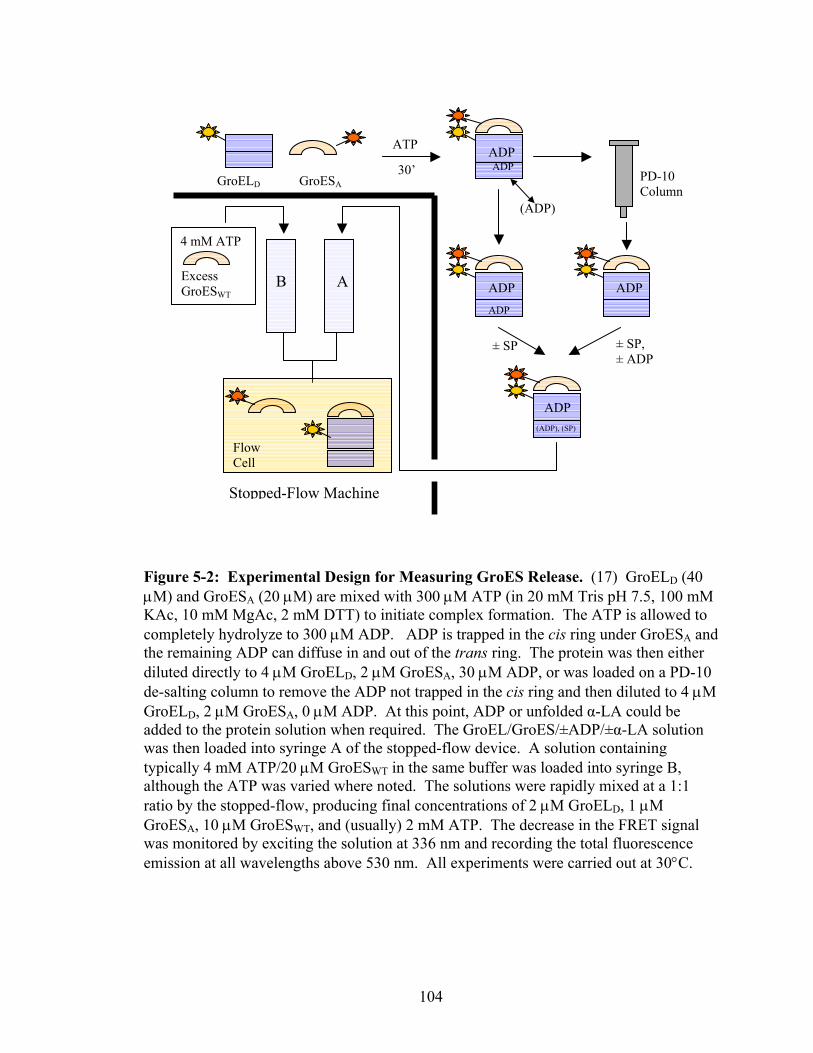
104
GroELD GroESA
ATP
30’ADP ADP
(ADP)
ADP ADP ADP
± SP ± SP, ± ADP
ADP (ADP), (SP)
AB Excess GroESWT
PD-10 Column
4 mM ATP
Stopped-Flow Machine
Flow Cell
Figure 5-2: Experimental Design for Measuring GroES Release. (17) GroELD (40 µM) and GroESA (20 µM) are mixed with 300 µM ATP (in 20 mM Tris pH 7.5, 100 mM KAc, 10 mM MgAc, 2 mM DTT) to initiate complex formation. The ATP is allowed to completely hydrolyze to 300 µM ADP. ADP is trapped in the cis ring under GroESA andthe remaining ADP can diffuse in and out of the trans ring. The protein was then either diluted directly to 4 µM GroELD, 2 µM GroESA, 30 µM ADP, or was loaded on a PD-10 de-salting column to remove the ADP not trapped in the cis ring and then diluted to 4 µM GroELD, 2 µM GroESA, 0 µM ADP. At this point, ADP or unfolded α-LA could be added to the protein solution when required. The GroEL/GroES/±ADP/±α-LA solution was then loaded into syringe A of the stopped-flow device. A solution containing typically 4 mM ATP/20 µM GroESWT in the same buffer was loaded into syringe B, although the ATP was varied where noted. The solutions were rapidly mixed at a 1:1 ratio by the stopped-flow, producing final concentrations of 2 µM GroELD, 1 µM GroESA, 10 µM GroESWT, and (usually) 2 mM ATP. The decrease in the FRET signal was monitored by exciting the solution at 336 nm and recording the total fluorescence emission at all wavelengths above 530 nm. All experiments were carried out at 30°C.

105
oversampling function in which it collects data points approximately every 40 µs,
averages several consecutive data points together, and records the average. This has the
effect of removing much of the noise from the final trace, and this function was used for
all measurements. The machine had two basic limitations in these studies. Because it is
not capable of measuring fluorescence emission at specific wavelengths, but only at all
wavelengths above the wavelength of the cut-off filter, it was not capable of monitoring
the change in the fluorescence emission of the donor. A second problem occurs because
the drive piston that pushes the syringes is pneumatically driven. The pressure on the
syringes is released about 30 ms following the shot. This causes some interference in the
trace around this time. This can be avoided by forcing the instrument to hold pressure on
the syringes until the conclusion on the measurement, but this can only be done on
measurements of 5 seconds or less. As will be seen, many of the measurements
presented in this chapter show two events, one prior to 200 ms, and one lasting as long as
200 seconds. This required many of the measurements to be performed twice. In one
measurement, the events prior to 200 ms were monitored with the pressure held, and in
the second measurement events out to 200 sec. were measured with the pressure not held.
Unless otherwise noted, the experimental conditions used for the experiments are
as follows. The GroELD, GroESA complex was formed at 20 mM Tris pH 7.5, 100 mM
KAc, 10 mM MgAc, and 2 mM DTT. The GroELD concentration was 40 µM, and the
total GroES concentration was 20 µM. The amount of GroESA used was adjusted
depending on the extent of F5M labeling so that the concentration of F5M was always 5
µM. GroESWT was used to bring the total GroES concentration up to 20 µM, and
hereafter all GroES in this solution will be called GroESA, since GroES subunits from

106
different GroES rings will mix rapidly (personal observation). Complex formation was
initiated by adding ATP to a final concentration of 300 µM and allowing the reaction to
proceed for at least 30 minutes to ensure that all ATP was converted to ADP. At this
point the solution was either diluted directly to 4 µM GroEL with 20 mM Tris pH 7.5,
100 mM KAc, 10 mM MgAc, and 2 mM DTT, or was loaded onto a PD-10 column
equilibrated in the same buffer to remove the ADP not trapped in the cis ring. Buffer was
then added to the column to bring the total volume loaded up to 2.5 ml, and the protein
was eluted with 2.5 ml of buffer. The eluent was then diluted to 4 µM GroEL with
buffer. In either case, the solution was then filtered on a 0.2 µm filter to degas it, and was
then loaded into syringe A of the stopped-flow machine. Syringe B, unless otherwise
noted, contained 20 mM Tris pH 7.5, 100 mM KAc, 10 MgAc, 2 mM DTT, 20 µM
GroESWT (a 10-fold excess over GroESA), and 4 mM ATP. The solutions were mixed
1:1 by the machine, to obtain final concentrations of 2 µM GroELD, 1 µM GroESA, 10
µM GroESWT, and 2 mM ATP (in addition to 15 µM ADP leftover from the formation of
the complex if de-salting was not performed) (Figure 5-2). All measurements were done
at 30°C. This amount of protein provided an adequate signal, with an acceptable amount
of noise.
In each experiment, several traces were averaged together to obtain the final trace
shown in the plots. For traces out to 200 seconds, as little as three traces averaged out to
a final trace that was practically noise free. For traces done over short time periods, 8-10
traces were averaged to obtain the final trace. Where appropriate, in order to make traces
easier to compare, the raw data were adjusted (by addition or subtraction) so that all
traces ended at an intensity of zero. In some cases, it was necessary to combine data

107
obtained at <200 ms with data obtained up to 200 sec. This was done by first adjusting
the 200 sec trace so that it ends at zero, and then adjusting the intensity of the short trace
so that it matches the point at 200 ms of the long trace. This allowed for a qualitative
comparison of one trace to another.
5.2.4 Measuring the Kinetics of GroES Release Using GroESHis The kinetics of
GroES release were independently confirmed by measuring the exchange of GroESHis for
GroESWT following ATP addition, using a protocol similar to the one discussed in section
3.2.7. This experiment was designed to mimic the conditions of the stopped-flow
experiments as closely as possible. The bullet complex was formed with 40 µM
GroELWT, 20 µM GroESHis, and 300 µM ATP in 20 mM Tris pH 7.5, 100 mM KAc, 10
mM MgAc. This was allowed to react for at least 30 minutes. This was then diluted 10-
fold to 4 µM in the same buffer. This solution was then diluted 1:1 with 2 mM ATP and
20 µM GroESWT to initiate GroESHis release. In a separate reaction, no ATP was added
as a control. As in the stopped-flow experiments, the final concentrations during the
release are 2 µM GroEL, 1 µM GroESHis, and 10 µM GroESWT. All solutions were
incubated at 30°C. The release reaction was quenched at various time points by adding
glucose to a final concentration of 5 mM and 7.5 units of hexokinase. The quenched
reactions (120 µl) was then added to 20 µl of Ni-NTA resin on a small spin column (Bio-
Rad) which had been equilibrated with 20 mM Tris pH 7.5, 100 mM KAc, 10 mM
MgAc. Following sample addition, the column was spun at 2000x g to elute the flow
through (the GroEL which has released GroESHis). 40 µl of buffer was then added to the
column, the column was spun at 2000 x g, and the eluent was collected and included in
the flow-through. The column was then washed with 120 µl and then 40 µl of 250 mM
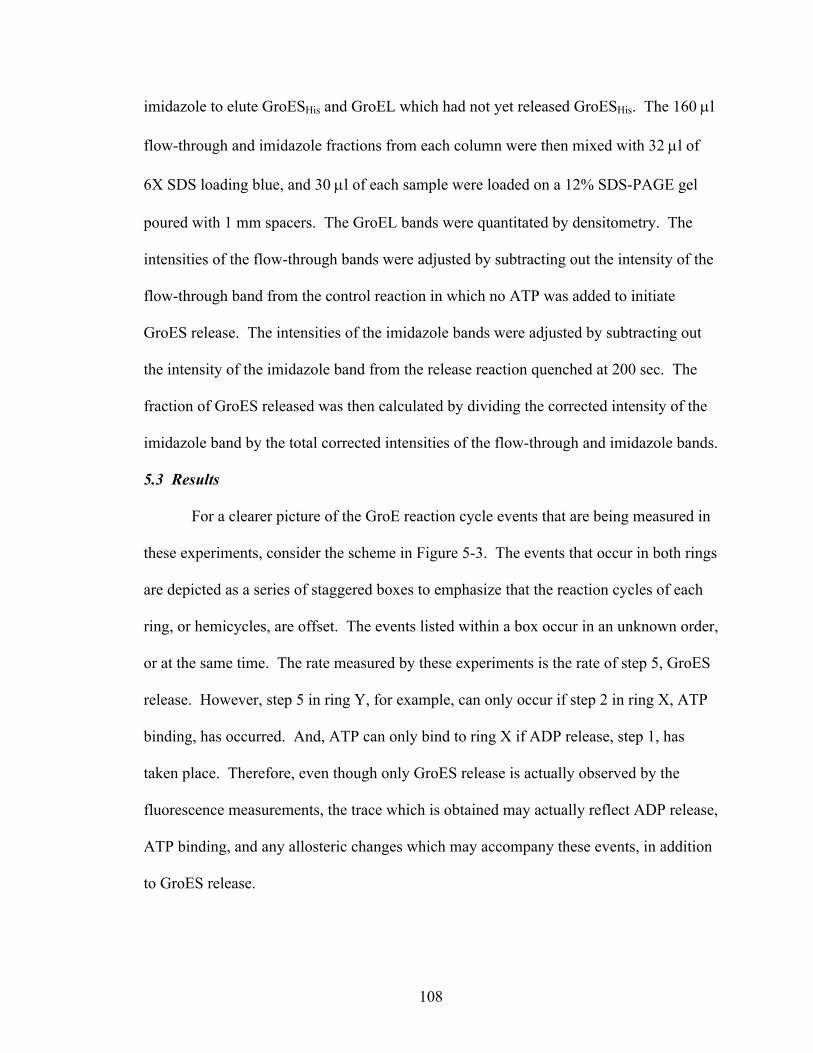
108
imidazole to elute GroESHis and GroEL which had not yet released GroESHis. The 160 µl
flow-through and imidazole fractions from each column were then mixed with 32 µl of
6X SDS loading blue, and 30 µl of each sample were loaded on a 12% SDS-PAGE gel
poured with 1 mm spacers. The GroEL bands were quantitated by densitometry. The
intensities of the flow-through bands were adjusted by subtracting out the intensity of the
flow-through band from the control reaction in which no ATP was added to initiate
GroES release. The intensities of the imidazole bands were adjusted by subtracting out
the intensity of the imidazole band from the release reaction quenched at 200 sec. The
fraction of GroES released was then calculated by dividing the corrected intensity of the
imidazole band by the total corrected intensities of the flow-through and imidazole bands.
5.3 Results
For a clearer picture of the GroE reaction cycle events that are being measured in
these experiments, consider the scheme in Figure 5-3. The events that occur in both rings
are depicted as a series of staggered boxes to emphasize that the reaction cycles of each
ring, or hemicycles, are offset. The events listed within a box occur in an unknown order,
or at the same time. The rate measured by these experiments is the rate of step 5, GroES
release. However, step 5 in ring Y, for example, can only occur if step 2 in ring X, ATP
binding, has occurred. And, ATP can only bind to ring X if ADP release, step 1, has
taken place. Therefore, even though only GroES release is actually observed by the
fluorescence measurements, the trace which is obtained may actually reflect ADP release,
ATP binding, and any allosteric changes which may accompany these events, in addition
to GroES release.
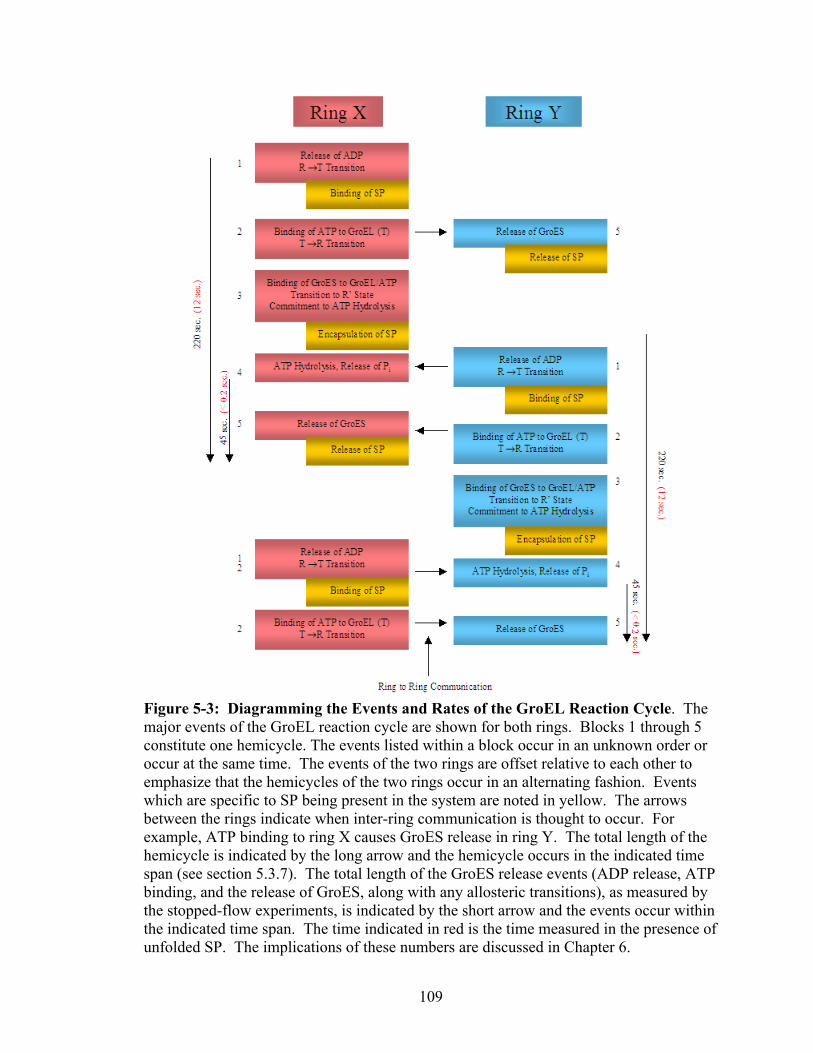
109
Figure 5-3: Diagramming the Events and Rates of the GroEL Reaction Cycle. The major events of the GroEL reaction cycle are shown for both rings. Blocks 1 through 5 constitute one hemicycle. The events listed within a block occur in an unknown order or occur at the same time. The events of the two rings are offset relative to each other to emphasize that the hemicycles of the two rings occur in an alternating fashion. Events which are specific to SP being present in the system are noted in yellow. The arrows between the rings indicate when inter-ring communication is thought to occur. For example, ATP binding to ring X causes GroES release in ring Y. The total length of the hemicycle is indicated by the long arrow and the hemicycle occurs in the indicated time span (see section 5.3.7). The total length of the GroES release events (ADP release, ATP binding, and the release of GroES, along with any allosteric transitions), as measured by the stopped-flow experiments, is indicated by the short arrow and the events occur within the indicated time span. The time indicated in red is the time measured in the presence of unfolded SP. The implications of these numbers are discussed in Chapter 6.

110
5.3.1 Confirming the Presence of FRET in the Experimental System As stated
above, GroES release was measured by labeling single cysteine mutants of GroEL and
GroES with fluorescent probes that constitute a FRET pair (52). The residues that were
mutated to cys residues, GroEL E315C and GroES 98C, are shown in Figure 5-1. These
residues are approximately 36 Å apart when GroES is bound to GroEL. The R0 value
(the distance at which the energy transfer efficiency is 50%) of the
IAEDANS/fluorescein-5-maleimide pair is approximately 40 Å, making this set of
probes ideal for monitoring GroEL/GroES dissociation. The release of GroES should
result in a decrease in the fluorescence emission of the acceptor probe, F5M, which has
an emission maximum at 519 nm. To confirm the presence of FRET in this system,
GroELD and GroESA were examined by steady state fluorescence (Figure 5-4). Adding
ATP to a solution of GroELD and GroESA causes a noticeable change in the relative peak
heights of the donor and acceptor emission. A decrease in the emission of the donor at
473 nm is apparent along with a smaller increase in the acceptor emission at 519 nm.
This is what would be expected if ATP were initiating complex formation between
GroEL and GroES.
All FRET measurements of GroES release were done using a stopped-flow
fluorometer. To confirm that the signal obtained using the stopped-flow device was
actually a FRET signal, a series of control experiments were performed. In these
experiments, complexes of GroEL and GroES were made in which one or both probes
were eliminated from the system. To initiate dissociation, these complexes were rapidly
mixed with a large excess of ATP and excess unlabeled GroES or GroEL where
appropriate. This experiment is able to test whether or not any spectral changes that occur

111
Figure 5-4: Steady-state Fluorescence Measurements Demonstrating FRET. A 4 µM GroELD, 2 µM GroESA solution with and without 30 µM ATP was measured in a steady-state fluorescence spectrophotometer. The solution was excited at 336 nm and the emission was scanned from 400 to 600 nm. Donor emission occurs at 473 nm and the acceptor emits at 519 nm.
which are not due to FRET, such as changes in the quantum yields of the donor or
acceptor, affect the signal that is obtained (52). The excitation wavelength used in all
experiments was 336 nm, which is approximately the absorbtion maximum of
IAEDANS. Emission was monitored at all wavelengths above the 530 nm cut-off filter.
This filter was used to ensure that the measured signal was not being affected by the
donor emission. As shown in Figure 5-5, only in the experiment in which both labeled
GroEL and labeled GroES were used was any significant signal change obtained,
confirming that the signal change obtained is due to FRET. Because the signal changes
obtained in the controls using either of the fluorescent probes by themselves were so
small, it was decided that a correction of the FRET signal using these control traces, as
was done by Rye et al. (17), was unnecessary.
5.3.2 Measuring GroES Release Using FRET The basic experimental design
was as follows, and is based on Rye et al (17). GroELD, GroESA, and a 7-fold excess of

112
Figure 5-5: Decrease in Signal Requires Both Donor and Acceptor, Confirming FRET. The GroEL/GroES complex was formed using GroEL E315C and GroES 98C with and without their respective labels (Donor, Acceptor) according to the experimental protocol, using 10 mM instead of 100 mM KAc. In the (-D,-A), (-D,+A), and the (+D,+A) experiments, 4 mM ATP and 10 µM GroESWT were loaded in syringe B. In the (+D,-A) experiment, 4 mM ATP and 10 µM GroELWT was loaded in syringe B.
ATP were mixed a relatively concentrated protein concentrations (40 µM GroEL, 20 µM
GroES, 300 µM ATP) since complex formation is more efficient at higher protein
concentrations. This was allowed to incubate for at least 30 minutes at room temperature
to allow the ATP to fully exhaust. The complex was then diluted to 4 µM and loaded
into syringe A of the stopped-flow device. GroESWT at 20 µM and a high concentration
of ATP (4 mM) were loaded into syringe B. Upon the solutions being rapidly mixed 1:1,
ATP (now at 2 mM) binds to the trans ring and dissociates GroESA from the cis ring, and
the large excess of GroESWT (10-fold excess) prevents GroESA from rebinding and
reestablishing the FRET signal.
To confirm that only ATP, and not ADP, causes GroES release, each nucleotide
was separately used to trigger complex dissociation. As shown in Figure 5-6, only ATP
causes a significant change in the FRET signal. The signal decreases with a half time of

113
Figure 5-6: Decrease in FRET Signal is Specific to ATP. GroESA dissociation was initiated using 4 mM ATP or 4 mM ADP in syringe B along with 10 µM GroESWT. The rest of the experiment was done according to the standard protocol, using 10 mM instead of 100 mM KAc. The slow decrease seen in the ADP trace, and at the end of most traces shown in this chapter, is probably due to the bleaching of the fluorophores.
about 20 seconds and only does so when ATP is used, beginning with a small lag phase.
Only a slight, constant, relatively linear decrease in signal is seen with ADP. This
decrease has been attributed to a bleaching of the fluorophores and was seen in all traces,
under all conditions, in these stopped-flow studies.
To confirm the necessity of including excess GroESWT in the dissociation
experiment, the procedure was attempted without it. As shown in Figure 5-7, when
GroESWT is eliminated from syringe B, no change in signal is seen, besides the bleach.
Apparently, GroESA rebinds to GroELD almost immediately, allowing for no decrease in
signal. Thus, a large excess of GroESWT was included in all subsequent experiments.
5.3.3 GroES Dissociation Results Differ from Those Previously Published The
results of the GroES dissociation experiments in Figures 5-5 and 5-6 show traces which
have multiple phases. There is a clear lag phase early in the trace, followed by a slow,

114
Figure 5-7: Decrease in FRET Signal Requires Addition of Excess Unlabeled GroES with ATP. The experiment was carried out according to the standard protocol with and without 20 µM GroESWT in syringe B.
exponential decay with a half time of 20 seconds. This differs significantly from the
traces obtained by Rye et al., who saw a faster decrease at a lower temperature (25°C),
with no sign of a lag phase (17). This was a cause for concern. There are a few
differences between the published protocol and that which is used here. One difference
was the extent of labeling of the GroEL and GroES. In the published paper, both proteins
were only labeled to an extent of about 30%. In the original preparation of labeled
protein used in the present experiments, a labeling extent of 90% was obtained. It was
possible that the high extent of labeling with bulky, hydrophobic fluorophores was
causing distorted release kinetics. To check this, the proteins were re-labeled with a
smaller amount of both probes, and the experiment was repeated. As seen in Figure 5-8,
both the heavily labeled and relatively lightly labeled preparations of protein showed
identical release kinetics. (The preparations that were lightly labeled showed a smaller
overall amplitude change, as would be expected). This eliminated the labeling extent as a
possible source of the differences.

115
Figure 5-8: FRET Signal is Independent of the Extent of Labeling; Release Kinetics are Independently Confirmed. GroESA release was measured using different preparations of GroELD, one of which was 40% labeled with IAEDANS and the other 95% labeled. The amplitudes of the traces were normalized for easier comparison. Also, the kinetics of GroESHis release from GroELWT were measured using the protocol in section 5.2.4. The fraction of GroESHis retained following ATP addition was normalized as described in the text.
It remained a small possibility that the FRET signal witnessed in the current
experiments was not actually monitoring GroES release, but some other slower event. To
check this, a control experiment was performed to monitor GroES release kinetics using a
completely independent protocol, described in section 2.2.4. Briefly, the release of
GroESHis from GroELWT, as triggered by the addition of ATP and GroESWT under the
same experimental conditions used in the stopped-flow experiments, was monitored by
stopping the release reaction at certain time points using a glucose/hexokinase quench.
GroEL that was still bound to GroESHis was separated from released GroEL (now bound
to GroESWT) using a small Ni-NTA column, and the column eluents were quantitated by
SDS-PAGE. As shown in Figure 5-8, the GroES release kinetics monitored using this
protocol are nearly identical to those obtained using the stopped-flow protocol. Thus, the
FRET signal in the stopped-flow experiments is almost certainly measuring GroES

116
dissociation. It was thus felt that the traces seen using the current protocol were valid,
and that some other factor was causing the difference in the traces. Possible reasons will
be discussed in section 5.4.
5.3.4 Effect of K+ Ion on GroES Release The ATPase activity of GroEL is
dependent on the concentration of K+ ion (31). It has been proposed that K+ affects
activity by influencing the T→R equilibrium in favor of the R state (72). This was
proposed because at low K+ concentrations, ATPase activity tends to be higher than at
high [K+]. It was inferred that K+ was favoring the transition to the less-active R state.
Thus, K+ was used in the GroES release experiments to find out whether or not the
allosteric state of the trans ring affected the rate of release. At low K+, the trans ring
should be in the T state, and at high [K+], the R state. The results in Figure 5-9, with 3
Figure 5-9: Effect of K+ Concentration on GroES Release. GroESA release was measured at three different K+ concentrations. In these experiments, the GroELD/GroESA complex formation step and the release measurement were both done at the stated [K+]. ADP was not removed prior to measuring the release.
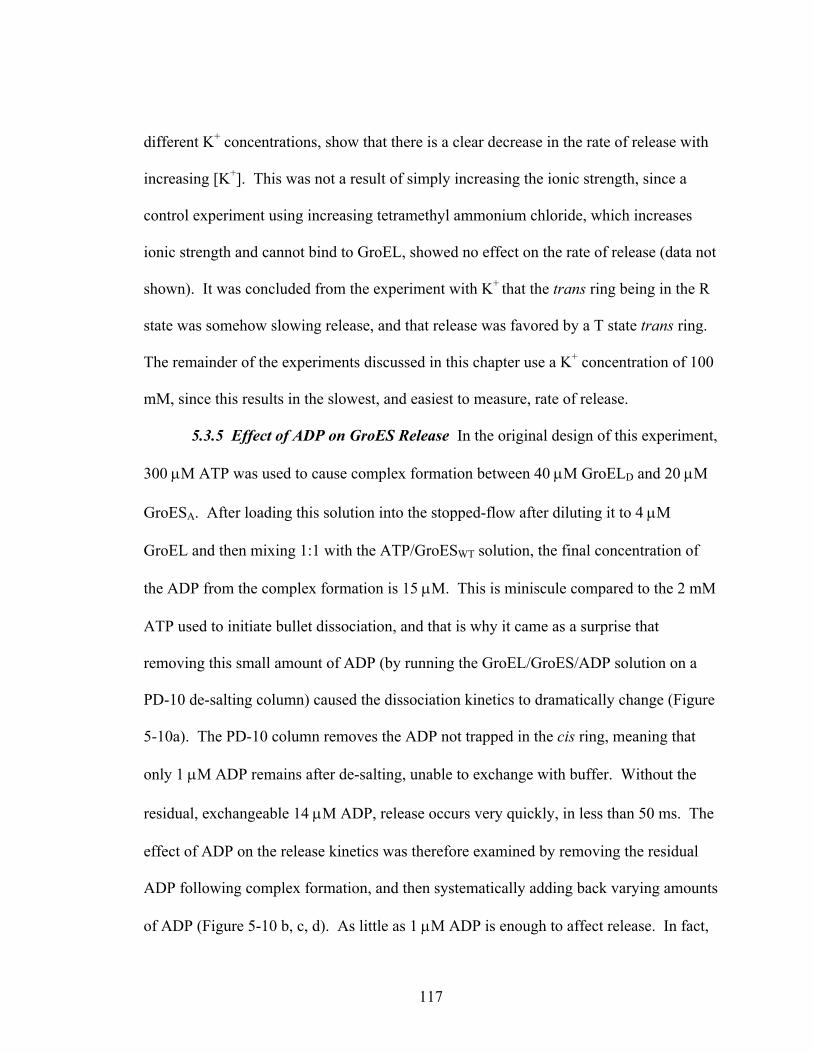
117
different K+ concentrations, show that there is a clear decrease in the rate of release with
increasing [K+]. This was not a result of simply increasing the ionic strength, since a
control experiment using increasing tetramethyl ammonium chloride, which increases
ionic strength and cannot bind to GroEL, showed no effect on the rate of release (data not
shown). It was concluded from the experiment with K+ that the trans ring being in the R
state was somehow slowing release, and that release was favored by a T state trans ring.
The remainder of the experiments discussed in this chapter use a K+ concentration of 100
mM, since this results in the slowest, and easiest to measure, rate of release.
5.3.5 Effect of ADP on GroES Release In the original design of this experiment,
300 µM ATP was used to cause complex formation between 40 µM GroELD and 20 µM
GroESA. After loading this solution into the stopped-flow after diluting it to 4 µM
GroEL and then mixing 1:1 with the ATP/GroESWT solution, the final concentration of
the ADP from the complex formation is 15 µM. This is miniscule compared to the 2 mM
ATP used to initiate bullet dissociation, and that is why it came as a surprise that
removing this small amount of ADP (by running the GroEL/GroES/ADP solution on a
PD-10 de-salting column) caused the dissociation kinetics to dramatically change (Figure
5-10a). The PD-10 column removes the ADP not trapped in the cis ring, meaning that
only 1 µM ADP remains after de-salting, unable to exchange with buffer. Without the
residual, exchangeable 14 µM ADP, release occurs very quickly, in less than 50 ms. The
effect of ADP on the release kinetics was therefore examined by removing the residual
ADP following complex formation, and then systematically adding back varying amounts
of ADP (Figure 5-10 b, c, d). As little as 1 µM ADP is enough to affect release. In fact,
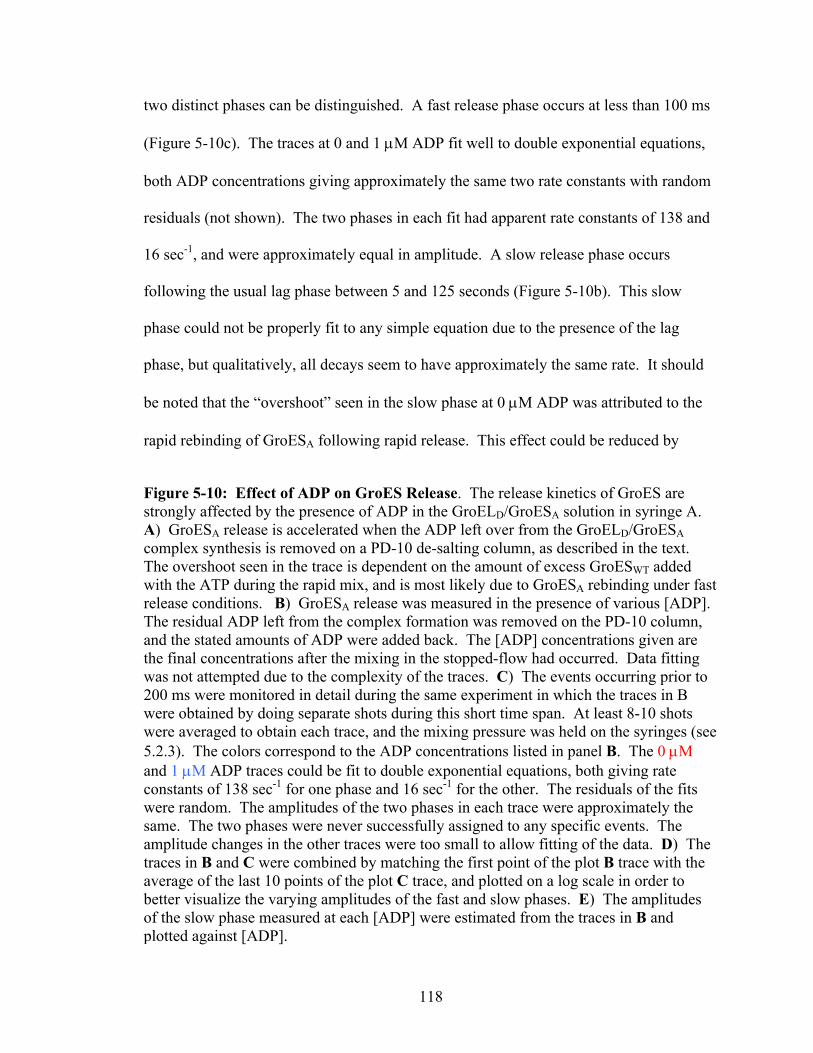
118
two distinct phases can be distinguished. A fast release phase occurs at less than 100 ms
(Figure 5-10c). The traces at 0 and 1 µM ADP fit well to double exponential equations,
both ADP concentrations giving approximately the same two rate constants with random
residuals (not shown). The two phases in each fit had apparent rate constants of 138 and
16 sec-1, and were approximately equal in amplitude. A slow release phase occurs
following the usual lag phase between 5 and 125 seconds (Figure 5-10b). This slow
phase could not be properly fit to any simple equation due to the presence of the lag
phase, but qualitatively, all decays seem to have approximately the same rate. It should
be noted that the “overshoot” seen in the slow phase at 0 µM ADP was attributed to the
rapid rebinding of GroESA following rapid release. This effect could be reduced by
Figure 5-10: Effect of ADP on GroES Release. The release kinetics of GroES are strongly affected by the presence of ADP in the GroELD/GroESA solution in syringe A. A) GroESA release is accelerated when the ADP left over from the GroELD/GroESA complex synthesis is removed on a PD-10 de-salting column, as described in the text. The overshoot seen in the trace is dependent on the amount of excess GroESWT added with the ATP during the rapid mix, and is most likely due to GroESA rebinding under fast release conditions. B) GroESA release was measured in the presence of various [ADP]. The residual ADP left from the complex formation was removed on the PD-10 column, and the stated amounts of ADP were added back. The [ADP] concentrations given are the final concentrations after the mixing in the stopped-flow had occurred. Data fitting was not attempted due to the complexity of the traces. C) The events occurring prior to 200 ms were monitored in detail during the same experiment in which the traces in B were obtained by doing separate shots during this short time span. At least 8-10 shots were averaged to obtain each trace, and the mixing pressure was held on the syringes (see 5.2.3). The colors correspond to the ADP concentrations listed in panel B. The 0 µM and 1 µM ADP traces could be fit to double exponential equations, both giving rate constants of 138 sec-1 for one phase and 16 sec-1 for the other. The residuals of the fits were random. The amplitudes of the two phases in each trace were approximately the same. The two phases were never successfully assigned to any specific events. The amplitude changes in the other traces were too small to allow fitting of the data. D) The traces in B and C were combined by matching the first point of the plot B trace with the average of the last 10 points of the plot C trace, and plotted on a log scale in order to better visualize the varying amplitudes of the fast and slow phases. E) The amplitudes of the slow phase measured at each [ADP] were estimated from the traces in B and plotted against [ADP].

119
Figure 5-10: Effect of ADP on GroES Release.

120
increasing the amount of excess GroESWT added with the ATP (not shown). These
results indicate that the ADP concentration only affects the relative amplitudes, and not
the rates, of the fast and the slow phases, as is seen most clearly when plotting the data on
a log scale (Figure 5-10d). The amplitude of the slow phase was estimated and plotted
against [ADP] in Figure 5-10e. An [ADP] of 5 µM is nearly enough to eliminate the fast
phase entirely.
5.3.6 Effect of Unfolded SP on GroES Release Unfolded substrate protein
increases the ATPase activity of GroEL. It has also been found that unfolded MDH
increases the rate of GroES release (17). The increase in ATPase activity was attributed
in Chapter 4 to SP binding to and holding a GroEL ring in the more active T state. It is
therefore tempting to conclude that SP enhances the rate of GroES release by binding to
and holding the trans ring in the T state, which somehow favors GroES release. The
effect of unfolded SP was examined in detail by adding various amounts of the weak-
binding, unfolded α–lactalbumin to the GroELD/GroESA complex, both in the presence
and in the absence of 15 µM ADP, loading this solution in syringe A, and measuring the
rate of GroESA release. The effect of a wide range of α-LA concentrations in the
presence of ADP is shown in Figure 5-11,a and b. α-LA affects both the rate and the
amplitude of the release. High amounts of α-LA substantially increase the rate of GroES
release. In fact, only a 0.5 molar equivalent of α-LA to 14-mer is enough to speed the
release, albeit slightly. Once again, these traces could not be fit to a simple equation due
to the lag phase and also to the appearance of a fast phase at higher concentrations of α-
LA. However, the half-times of these traces could be estimated, and were plotted against
the SP concentration (Figure 5-11c). This is useful because the half-time of the trace can

121
be thought of as the average amount of time that an intact folding chamber exists on
GroEL. It is the mean “residence” time, the average amount of time that an SP can spend
folding in the protective environment of the hydrophilic, cis ring central cavity. Only 10
α-LA per 14-mer are enough to reduce the residence time to practically zero.
At relatively high amounts of α-LA, a single exponential-like fast phase becomes
apparent (Figure 5-11d). This fast phase increases in amplitude and rate with increasing
α-LA, to a maximum of about 25 sec-1 with a 50-fold excess of α-LA over 14-mer. When
the traces are plotted on a log scale (Figure 5-11e), it can be seen that α-LA affects the
relative amplitudes of the fast and slow phases. At high [α-LA], all GroES release occurs
Figure 5-11: Effect of Unfolded SP on GroES Release. Freshly reduced unfolded α-LA was added to the GroELD/GroESA/±ADP solution prior to loading it in syringe A. The α-LA amount given in each plot is the excess of α-LA over GroEL 14-mers. Since only the trans ring is available to bind SP when GroES is bound to the cis ring, this number also represents the excess of α-LA over binding sites. α-LA does not refold under the conditions used in these experiments. A and B) The effect on GroESA release of several different amounts of α-LA is shown. ADP was not removed prior to the experiment; thus, the final [ADP] after mixing was 15 µM. The data is split amongst two plots for clarity. Again, data fitting was not done due to the complexity of the traces. C) The half-time of the traces in A and B was estimated and plotted against the amount of α-LA used in the experiment. The half-time represents the average amount of time that an SP spends encapsulated in the central cavity under GroES and can be called a “mean residence time.” D) The fast phase was examined in detail with different amounts of α-LA. 8-10 shots were averaged to obtain each trace, and the mixing pressure was held on the syringes. The 25x and 50x traces were fit to single exponential equations giving an average rate constant of about 25 sec-1. E) In the same experiments used to obtain the traces in D, the slow phases out to 200 seconds were also measured. The fast and slow traces were combined as in Figure 5-10d, and plotted on a log scale to better illustrate the changing amplitudes of the fast and slow phases. The trace colors correspond to the α-LA amounts in D. F) The effect of unfolded α-LA on the release of GroESA in the absence of ADP in the syringe A solution was also measured. All release occurred in the fast phase (<200 ms). 8-10 shots were averaged to obtain these traces, and the mixing pressure was held. The traces fit reasonably well to double exponentials. The two phases had rate constants which increased slightly with increasing α-LA. The rate constant of the faster phase ranged from 135-175 sec-1 and the slower phase rate constant ranged from 5-28 sec-1. The amplitudes of the two phases did not change much with increasing α-LA, and both phases had approximately equal amplitudes at all [α-LA]. Again, these two phases could not be assigned to any specific events.

122
Figure 5-11: Effect of Unfolded SP on GroES Release

123
within 2 seconds. At mid-range [SP], for example 10x α-LA (Figure 5-11e, green),
release seems to be partitioned between the two release phases. This is similar to the
effect seen with varying ADP concentrations, although in the case of α-LA the rates, as
well as the amplitudes, of the two phases seem to vary with [α-LA], whereas only the
amplitudes varied with [ADP].
Finally, the effect of unfolded α-LA on the rate of GroES release in the absence of
ADP was examined. ADP was once again removed on a PD-10 column following
complex formation. As is shown in Figure 5-11f, all GroES release in the absence of
ADP occurs prior to 100 ms. As was the case with the traces in Figure 5-10c, these data
fit best to a double exponential model. SP has a small effect on the rates obtained from
this analysis. The faster phase rate constant increases from 135 sec-1 in the absence of SP
to 175 sec-1 in the presence of 50x SP, a 30% change. The slower phase increases from 5
to 28 sec-1. This latter phase may correspond to the fast release event seen in the
presence of ADP, which had a similar rate (Figure 5-11d).
5.3.7 Relating ATPase Activity to GroES Release As mentioned above, the half-
time of GroES release represents the average residence time of an SP in the central
cavity. However, the amount of time a ring spends with SP captured in the central cavity
below the GroES cap is only part of the reaction cycle of a single GroEL ring. This cycle
must also include ATP binding, allosteric transitions, and GroES binding. It would be
useful to relate the total reaction cycle time of one ring, or hemicycle time, to the mean
residence time. The hemicycle time can be calculated from the ATPase rate. The
ATPase rate of GroEL E315C at 30°C in the presence of GroES and increasing amounts
of unfolded α-LA was measured (Figure 5-12a), and is very similar to that obtained with

124
GroELWT and GroES (not shown). The hemicycle time can then be calculated using the
following logic. For example, if the ATPase rate is 1 turnover/subunit/min., then each
ring must turnover 0.5 times per minute. The total cycle time of the ring is the inverse of
0.5 min.-1, multiplied by 60 to put the final value in seconds. Thus, a ring with a turnover
rate of 0.5 min.-1 has a hemicycle time of 120 seconds. The hemicycle time was
calculated for the rates measured in Figure 5-12a, and plotted against the mean residence
times measured in the stopped-flow experiments when the data was obtained with the
same concentration of α-LA (Figure 5-12b). It is important to note that the relationship is
not linear. The hemicycle time is always longer than the mean residence time (it has to
be), but when the hemicycle time is relatively low (< 15 sec.), the residence time
Figure 5-12: Relating the Rate of GroES Release to the ATPase Rate. A) The ATPase activity of unlabeled GroEL E315C in response to added α-LA was measured using the coupled enzyme assay at 30°C, 100 mM K+ with 2 µM GroEL(E315C), and 2 µM GroESWT. B) The ATPase rate was converted into the hemicycle time, or the total amount of time it takes one ring to proceed through an entire reaction cycle, as described in the text. The hemicycle time was then plotted against the mean residence time recorded with the same amount of added α-LA, both axes on log scales. This allows one to relate the amount of time a GroEL spends releasing GroES to the total time of the reaction.

125
becomes very short (about 10 msec.). This indicates that in the presence of a high
concentration of SP, a ring spends very little of its total cycle time releasing GroES.
5.3.8 Effect of Unfolded SP on GroES Release When SP is Added Under Non
Steady-state Conditions In all stopped-flow experiments with SP discussed thus far, the
SP was added to pre-formed GroELD/GroESA complex, and the system was allowed to
come to equilibrium before release was initiated. The experiment was also done in which
the SP was added to the complex/15 µM ADP at the same time as the ATP/GroESWT (the
α-LA was added to the syringe B solution). The effect of α-LA on GroES release under
these non steady-state conditions is significantly different than the effect seen in Figure
5-11 under steady-state conditions. Increasing [α-LA] only affects the rate of the slow
release phase, and not the amplitude (Figure 5-13a). A fast phase prior to 200 ms is not
seen (Figure 5-13b, and compare with Figure 5-11d). Thus, the appearance of the fast
phase is entirely dependent on the establishment of a pre-equilibrium of the GroEL trans
ring, ADP, and SP.
5.3.9 Effect of SP at Different ADP Concentrations The effect of SP on GroES
release shown in Figure 5-11,a-e was measured in the presence of 15 µM ADP. There is
already a strong indication that SP and ADP are affecting GroES release in similar, but
opposite ways. High [ADP] slows release; it increases the amplitude of the slow phase.
High [SP] speeds release; it increases the amplitude of the fast phase, and it increases the
rates of both the slow and the fast phase. The relationship between these two allosteric
effectors was explored further by measuring the effect of unfolded α-LA on GroES
release at several ADP concentrations (Figure 5-14 a,b). The amplitudes of the slow
phases were estimated from the traces and plotted against the [α-LA] (Figure 5-14c). The
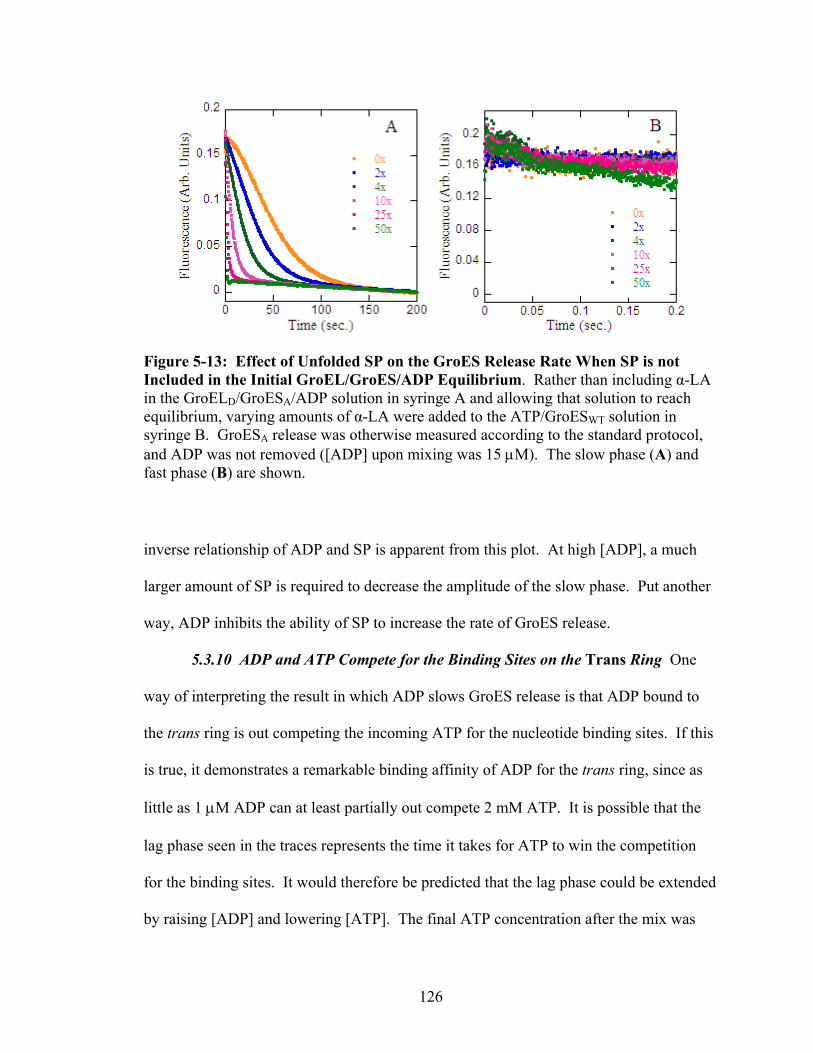
126
inverse relationship of ADP and SP is apparent from this plot. At high [ADP], a much
larger amount of SP is required to decrease the amplitude of the slow phase. Put another
way, ADP inhibits the ability of SP to increase the rate of GroES release.
5.3.10 ADP and ATP Compete for the Binding Sites on the Trans Ring One
way of interpreting the result in which ADP slows GroES release is that ADP bound to
the trans ring is out competing the incoming ATP for the nucleotide binding sites. If this
is true, it demonstrates a remarkable binding affinity of ADP for the trans ring, since as
little as 1 µM ADP can at least partially out compete 2 mM ATP. It is possible that the
lag phase seen in the traces represents the time it takes for ATP to win the competition
for the binding sites. It would therefore be predicted that the lag phase could be extended
by raising [ADP] and lowering [ATP]. The final ATP concentration after the mix was
Figure 5-13: Effect of Unfolded SP on the GroES Release Rate When SP is not Included in the Initial GroEL/GroES/ADP Equilibrium. Rather than including α-LA in the GroELD/GroESA/ADP solution in syringe A and allowing that solution to reach equilibrium, varying amounts of α-LA were added to the ATP/GroESWT solution in syringe B. GroESA release was otherwise measured according to the standard protocol, and ADP was not removed ([ADP] upon mixing was 15 µM). The slow phase (A) and fast phase (B) are shown.
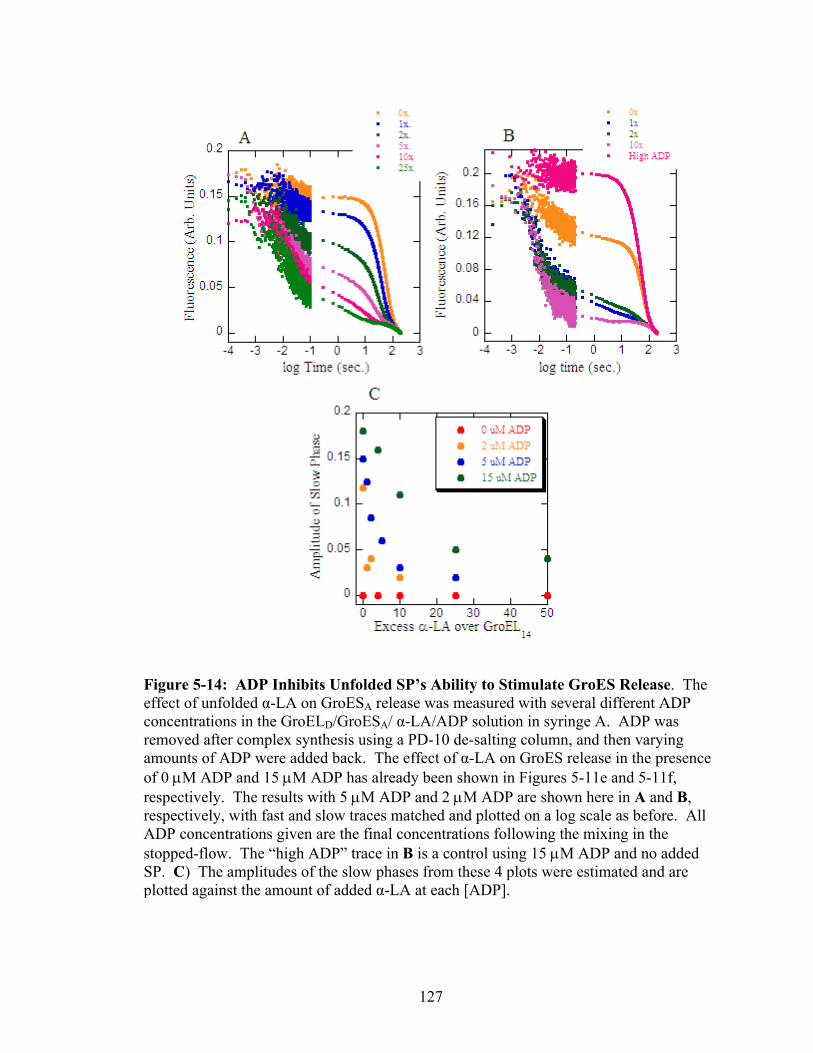
127
Figure 5-14: ADP Inhibits Unfolded SP’s Ability to Stimulate GroES Release. The effect of unfolded α-LA on GroESA release was measured with several different ADP concentrations in the GroELD/GroESA/ α-LA/ADP solution in syringe A. ADP was removed after complex synthesis using a PD-10 de-salting column, and then varying amounts of ADP were added back. The effect of α-LA on GroES release in the presence of 0 µM ADP and 15 µM ADP has already been shown in Figures 5-11e and 5-11f, respectively. The results with 5 µM ADP and 2 µM ADP are shown here in A and B, respectively, with fast and slow traces matched and plotted on a log scale as before. All ADP concentrations given are the final concentrations following the mixing in the stopped-flow. The “high ADP” trace in B is a control using 15 µM ADP and no added SP. C) The amplitudes of the slow phases from these 4 plots were estimated and are plotted against the amount of added α-LA at each [ADP].

128
lowered to 250 µM, and the amount of ADP added back following de-salting on the PD-
10 column was varied (Figure 5-15). The rate of release is indeed slowed significantly
when a high concentration of ADP is added back, and the lag phase does increase in
magnitude. This supports the notion that the lag phase, at least in part, represents the
time it takes for ATP to replace ADP on the trans ring.
Figure 5-15: Raising [ADP] and Lowering [ATP] Slows Release and Increases the Lag Phase. GroESA release was measured with varying amounts of ADP in the syringe A solution and only 500 µM ATP in syringe B (250 µM ATP after stopped-flow mixing). The ADP leftover from the GroELD/GroESA complex synthesis was removed by de-salting, and varying amounts of ADP were then added back. The ADP concentrations given are the final concentrations after the mixing in the stopped-flow.
5.3.11 Effect of [ATP] on the Rate of GroES Release The dependence of the
GroES release rate on the concentration of ATP used to initiate complex dissociation was
tested, both with and without unfolded α-LA, in the absence of competing ADP. The
traces, both without and with unfolded α-LA (Figure 5-16 a and b, respectively), fit
reasonably well to single exponentials. The fitting was complicated by the appearance of
a lag phase a lower [ATP]. In fitting these traces, the lag phase was ignored in an effort
to get a general idea of the rate constants. The rates obtained are plotted in Figure 5-16c.

129
Figure 5-16: Effect of Varying the ATP Concentration Used to Initiate GroEL/GroES Dissociation. The concentration of ATP in the syringe B solution used to initiate GroESA release was varied, and the effect of this on the release kinetics was measured in the absence of ADP. ADP was removed following complex synthesis by de-salting on a PD-10 column. The ATP concentrations shown in the legends are the final concentrations (in µM) after the stopped-flow mix. This experiment was done both in the absence (A) and presence (B) of a 50-fold excess (over 14-mers) of α-LA in the GroELD/GroESA solution. 8-10 shots, during which the mixing pressure was held, were averaged to obtain the final traces, and these were fit to single exponential equations. At low [ATP], data was collected for a longer time period to enable data fitting. Also at low [ATP], data fitting was made more complicated by the appearance of a lag phase early in the trace. The data points encompassing the lag phase were ignored during the fitting, and rate constants obtained from these fits are therefore very approximate. C) The rate constants obtained from the single exponential fits are plotted against the [ATP]. The dependence of the rate constants on [ATP] is not linear.

130
Surprisingly, SP appears to inhibit the release rate at lower [ATP], reminiscent of the
finding that SP inhibits ATPase activity at low [ATP] (see Chapter 4). It is also apparent
that kobs is not linearly related to [ATP], indicating that ATP binding to the trans ring is
not a simple bimolecular reaction.
5.4 Discussion
5.4.1 Explaining the Difference Between the Published and Current Results
Although the results in this chapter agree with the published results of Rye et al. (17) in a
general sense (ie. SP causes a stimulation of the GroES release rate), the traces
themselves are very different. The published traces were all said to have fit to single or
double exponentials, and they contained no lag phase. Also, all of the published rates
were faster than those obtained here, even though they were measured at a lower
temperature. The published traces were obtained at 10 mM K+, so they would be
expected to show somewhat faster rates than the traces here, which were mostly obtained
at 100 mM K+. However, the published traces still give rates that are significantly faster
than the limited number of traces obtained at 10 mM K+ in the studies for this
dissertation. Therefore, the difference in K+ concentration is not nearly the whole story.
One subtle difference between the two experimental protocols is that Rye et al.
inserted the E315C mutation into GroEL in which all of the native cysteines had been
removed. They did this to prevent any unwanted labeling of the native cys residues,
assuming that these were reactive (52). As was discussed in Chapter 3, the native cys
residues, in our hands at least, do not appear to be accessible to reaction, and thus the
native cys residues were not removed when making the E315C mutant. This choice was
made for other reasons as well. GroEL that is cys-free has a significantly lower ATPase
131
activity (G. Curien, unpublished, and (17)). Also, cys-free GroEL appears to much less
stable than GroELWT, and other mutants made in the cys-free background did not survive
the acetone treatment (G. Curien and J. Grason, unpublished). Thus, it was felt that the
drawbacks of using the cys-free GroEL in these studies far outweighed the benefits of
avoiding what would probably have been a miniscule amount of unwanted labeling of the
native cys residues. This reasoning seems justified now knowing that the extent of
labeling had no effect whatsoever on the GroES release kinetics, and also knowing that
labeled GroEL had an ATPase activity identical to GroELWT (not shown). The fact that
Rye et al. did choose to use the cys-free background is certainly a difference between the
protocols, and is one possible cause of the differing traces.
The most likely cause of the altered traces, however, is the presence of
contaminated protein in their GroEL preparations. It is very clear from the data presented
above that even a slight amount of unfolded SP has an effect on the rate of release. It is
shown in Figure 5-11 that only a 4-fold excess of the weak-binding α-LA increases the
rate of GroES release and eliminates the lag phase. Therefore, it does not take much
contaminating protein in a GroEL preparation to have a substantial effect on the GroES
release kinetics. It is strongly believed that the acetone precipitation used to purify the
GroEL used in these studies (see Chapter 2) produces GroEL preparations of the highest
purity currently obtainable. The purification protocol used by Rye et al. is not made
entirely clear, but it certainly did not involve the acetone precipitation. Therefore, it
seems highly probable that the faster release kinetics presented in the published paper
were due to contaminating protein present in the GroEL preparation. It is thus believed
that the data obtained in the current studies is superior in quality to the published data.
132
5.4.2 Interpreting the Release Kinetics The results presented in this chapter are
a first attempt at determining the kinetics of the signaling pathway for GroES release.
Several important conclusions can be drawn from the data about the roles of the various
allosteric effectors that were used in these experiments. However, this signaling pathway
has the potential to be extremely complex, and a robust determination of all the rate
constants that might be involved in the pathway cannot be accomplished with the present
data. With that said, the results presented here provide us with far more information
about this pathway than was known before.
The effect of ADP on the release kinetics seems clear. At low concentrations of
ADP, the trace splits into two distinct phases: a fast phase complete within 100 ms, and a
slow phase with a half-time of 40-50 seconds (Figure 5-10). When the ADP
concentration is zero, only the fast phase is seen, and when the ADP concentration is
above 10 µM, only the slow phase is seen. Between 0 and 10 µM, the ADP affects the
relative amplitudes of the two phases, but does not seem to affect the rates. One possible
interpretation of this data is that in the equilibrium that exists in the GroEL/GroES/ADP
solution prior to the ATP addition, there are two populations of GroEL/GroES
complexes. The two populations are noted schematically in Figure 5-17, rows A and B.
One population has ADP bound to the trans ring, and the other does not. Upon ATP
addition, the population with free trans rings (A) binds ATP immediately, the release
signal is sent, and GroES dissociates rapidly, within 100 ms. Referring to Figure 5-3,
only step 2 in ring X and step 5 in ring Y are measured. In the other population (B), the
incoming ATP is forced to compete with the trans-bound ADP. Only after ADP is
finally released and ATP is bound can the release signal be sent and GroES dissociate.
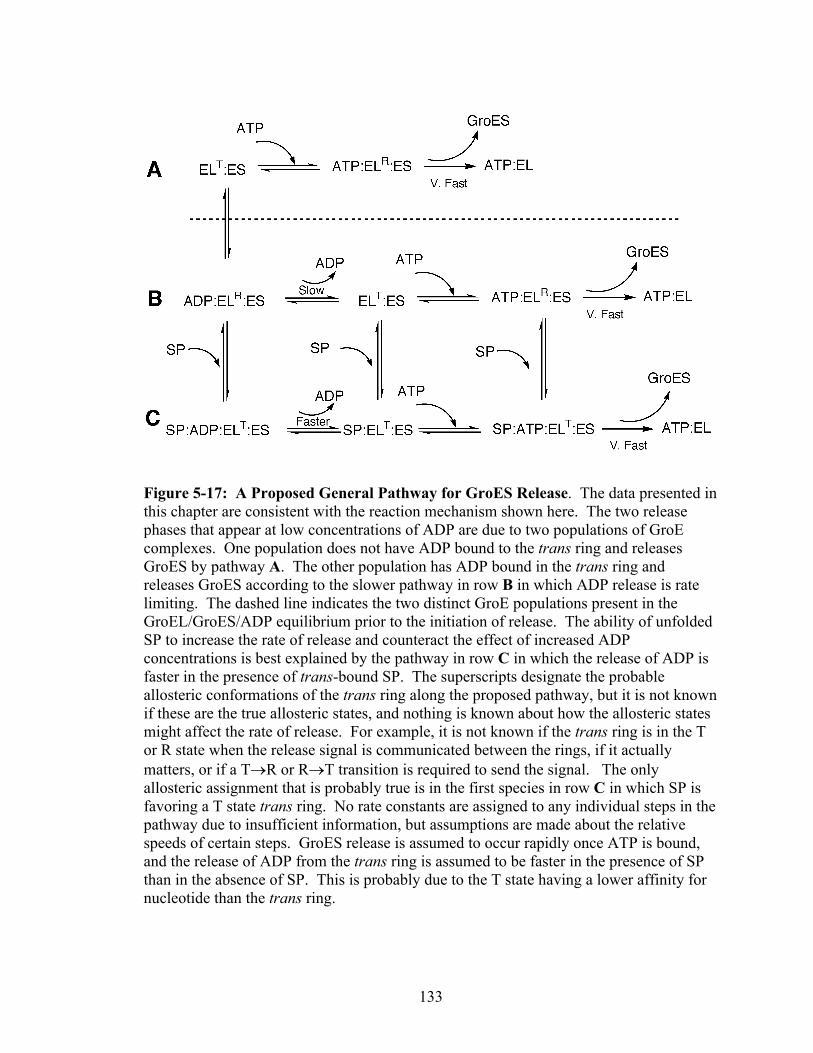
133
Figure 5-17: A Proposed General Pathway for GroES Release. The data presented in this chapter are consistent with the reaction mechanism shown here. The two release phases that appear at low concentrations of ADP are due to two populations of GroE complexes. One population does not have ADP bound to the trans ring and releases GroES by pathway A. The other population has ADP bound in the trans ring and releases GroES according to the slower pathway in row B in which ADP release is rate limiting. The dashed line indicates the two distinct GroE populations present in the GroEL/GroES/ADP equilibrium prior to the initiation of release. The ability of unfolded SP to increase the rate of release and counteract the effect of increased ADP concentrations is best explained by the pathway in row C in which the release of ADP is faster in the presence of trans-bound SP. The superscripts designate the probable allosteric conformations of the trans ring along the proposed pathway, but it is not known if these are the true allosteric states, and nothing is known about how the allosteric states might affect the rate of release. For example, it is not known if the trans ring is in the T or R state when the release signal is communicated between the rings, if it actually matters, or if a T→R or R→T transition is required to send the signal. The only allosteric assignment that is probably true is in the first species in row C in which SP is favoring a T state trans ring. No rate constants are assigned to any individual steps in the pathway due to insufficient information, but assumptions are made about the relative speeds of certain steps. GroES release is assumed to occur rapidly once ATP is bound, and the release of ADP from the trans ring is assumed to be faster in the presence of SP than in the absence of SP. This is probably due to the T state having a lower affinity for nucleotide than the trans ring.

134
Again referring to Figure 5-3, steps 1 and 2 in ring X and step 5 in ring Y are measured
from this population. The presence of the lag phase in the slow phase of the traces
indicates a slow, upstream process (or processes, see step 1 in Figure 5-3) that occur(s)
prior to the event that is observed in the experiment. ADP release is most likely this slow
event, however, the occurrence of other processes, such as allosteric transitions, cannot
be excluded. It is safe to assume that in the presence of bound ADP, the trans ring
spends most of its time in the R state. Perhaps an R→T transition must occur that is
coupled to ADP release, since nucleotide is thought to bind less tightly to the T state. Or,
the transition may occur once ADP has left, prior to ATP binding. The R→T transition
prior to ADP release might also be the slow event, with ADP dissociation occurring
relatively fast. There is no way of distinguishing these possibilities from the current data.
It should be noted that under physiological conditions, the trans ring will always contain
bound ADP, and therefore GroES will always be released with the slow kinetics
demonstrated here (if no SP is bound). The release of GroES has previously been
implicated as the slow step in the GroE reaction cycle (17), and it is demonstrated here
that the rate determining step in that process is the release of ADP from the trans ring,
and possibly the allosteric transitions which accompany that release.
The effect of K+ on the release kinetics is relatively simple to analyze. Increasing
amounts of K+ slow the release of GroES (Figure 5-9). K+ is thought to shift the T→R
equilibrium towards the R state. Therefore, GroES release is slower when the trans ring
is in the R state. There could be several reasons for this. The release of ADP from the
trans ring should be slower when the trans ring is in the R state, since R rings have a
higher affinity for nucleotide. Thus, the incoming ATP would have a harder time

135
competing off the ADP from the binding sites. It is also possible that an allosteric
transition to the T state needs to occur at some point in the pathway in order for GroES to
eventually be released, and this transition would be disfavored by high [K+]. It will
require more experiments under several different conditions to fully determine the effect
of K+ on the release pathway, but it seems reasonable to conclude from the studies with
K+ that, not surprisingly, the allosteric state of the trans ring has a large effect on GroES
release.
The effect of unfolded SP on GroES release kinetics is more complex. Not only
does the addition of SP to the GroEL/GroES solution prior to ATP addition affect the
relative amplitudes of the fast and slow phases, but it also appears to affect the rates of
the two phases (Figure 5-11e). It has the inverse effect on release to that of ADP. High
[SP] speeds release, whereas high [ADP] slows release. In addition, the concentration of
ADP affects the magnitude of the release stimulation by SP. At high ADP concentration,
higher concentrations of SP are required to stimulate the release rate. However, when
ADP is removed from the system and release occurs entirely prior to 100 ms, SP has little
additional effect besides a slight possible rate enhancement. The simplest way to explain
SP’s ability to stimulate GroES release is to consider the conclusions from Chapter 4. It
was proposed that SP is able to enhance ATPase activity by forcibly holding a GroEL
ring in the T state. When SP binds to the trans ring of the GroEL/GroES complex, it
should have the same effect. A trans ring in the T state will have less of an affinity for
bound ADP, thereby favoring its release and the binding of the large excess of ATP once
it is added. SP is therefore altering the equilibrium between GroEL/GroES and ADP,
creating two populations of GroEL/GroES complexes (Figure 5-17, rows B and C),

136
similar to the effect of low [ADP]. This explains the appearance of the two phases upon
addition of SP to the GroEL/GroES complex, and it explains why SP has little additional
effect when ADP is removed.
This does not explain, however, the observation that SP also increases the rates of
the fast and slow phases when ADP is present. SP’s rate enhancing ability is
demonstrated most effectively when it is not included in the initial equilibrium prior to
ATP addition but instead is added with the ATP (Figure 5-13). In this case, no fast phase
appears, which means that only one GroEL/GroES population exists, one in which all
complexes have ADP bound to the trans ring. When SP is added in such a way, it still
exerts a significant stimulatory effect on the release rate. The exact reason for this is
unclear, although it almost certainly has something to do with SP binding to the trans
ring and holding it in the T state. It may again be an issue of speeding the release of
ADP. But, this does not explain why SP stimulates the rate of the fast phase (Figure 5-
11d). The fast phase should not be affected by ADP release, since the GroEL/GroES
complexes that dissociate during the fast phase do not contain trans-ADP. Therefore, the
trans ring being in the T state must affect some other step in the reaction pathway,
possibly one or two of the allosteric transitions depicted in boxes 1 and 2 of Figure 5-3.
This step (or steps) is difficult to pinpoint with the data presented here, because the
allostery of the pathway is so poorly understood, and the experimental protocol used
cannot provide a direct measure of the allosteric transitions. If the pathway contains a
slow R→T transition, then SP should speed release. Or, if sending the release signal
from the trans ring to the cis ring requires the trans ring to be in the T state, then added
SP would again be expected to increase the release rate. There is no way of knowing if
137
either of those guesses are true without more experimental data, preferably data obtained
with another observable.
All experiments discussed thus far used a saturating amount of ATP to dissociate
the GroEL/GroES complex. When ADP is removed, and the [ATP] is varied, a non-
linear dependence on [ATP] is obtained (Figure 5-16c). This implies that the [ATP]-
dependent event that is being monitored in the experiment, probably ATP binding, is at
least a two-step process. Obtaining rate constants from this data is not possible, since this
typically involves extrapolating the points at low [ATP] to zero. The traces at low [ATP]
contain unexplained lag phases and are difficult to fit to single exponential equations. It
is therefore not possible to use these data to measure binding affinity or the rate of ATP
binding. What is interesting is the result that at low [ATP], SP inhibits the rate of GroES
release. Since inhibition by SP is only seen at lower [ATP], the rate inhibition is
probably a result of decreased ATP affinity for the T state trans ring with bound SP. In
other words, ATP binding may become rate limiting at lower [ATP]. It is also possible
that SP is slowing a downstream T→R transition that is required for GroES release.
Again, more study is needed to further elucidate the pathway.
The kinetic data obtained in these experiments allow several important
conclusions to be made. First and foremost, ADP release clearly seems to be the rate-
limiting step in the GroES release signaling pathway. Second, SP stimulates the rate of
GroES release by enhancing the population of trans rings in the T state, which not only
increases the rate of ADP release, but also might favor an allosteric R→T transition that
occurs somewhere in the pathway. However, the limitations of these experiments are
also very apparent. The determination of rate constants for all steps in the release
138
pathway is impossible, since the exact allosteric transitions that must take place along the
way are unknown. The reaction cycle in Figure 5-3 notes possible allosteric transitions at
several points. If multiple allosteric transitions must occur, the kinetic mechanism will
become exceedingly complex (Figure 5-18). Even a partial determination of some of the
rate constants involved is difficult because the traces are so complex and difficult to fit.
Some rate constants were obtained from double exponential fits of the fast phase (as in
Figure 5-10c), but assigning the two rates to individual events is not yet possible. The
only conclusion that can be made is that the upper limit on the rate of release is
approximately 140-170 sec-1, and the lower limit is around 0.2 sec-1. The fact that the
GroES release rate can vary by three orders of magnitude depending on conditions is
interesting in itself. This has important biological implications, which will be discussed
in the next chapter. A full determination of the kinetic pathway will eventually be
possible, but another observable will be needed, preferably one that can monitor the
allosteric transitions. The specific allosteric signal sent from the trans ring to the cis ring
that causes GroES release remains a mystery.

139
Figure 5-18: A Short Hypothetical Pathway Demonstrates the Potential Complexity of the System. Rate constants were not assigned to any of the steps in the pathway shown in Figure 5-17, and the allosteric states of the trans ring at each point were only guessed at. This is because very little is known about the allostery of this pathway, and when one begins to consider the various allosteric states that might be involved in the pathway, things rapidly get complicated. Consider the partial pathway shown above. This is a partial kinetic pathway in the context of these experiments because it does not involve SP. Unlike Figure 5-17, this pathway includes the T→R and R→T transitions that may occur at several points. Nothing is known about the rates of these conversions, and there is currently no good way to measure them. It is not known whether any of the conversions are required for release to occur. Most importantly, the allosteric transitions that might be involved in the final release signal after ATP is bound have not been defined. This example pathway presents a scenario in which release only occurs from an ATP bound-T state trans ring. ATP binding may create an “activated” T state (designated by an *) that must then undergo a T→R transition before release can occur, but this is only one of many scenarios. In fact, there is some evidence from experiments with GroELIAX that the T→R transition is not required for GroES release (G. Curien, unpublished), but there was no kinetic element to these experiments that would provide a hint as to whether release is favored from either a T or R state trans ring. Suffice to say, the determination of a complete kinetic mechanism for the potentially complicated GroES release pathway will require many additional experiments.
140
Chapter 6
Summary and Final Discussion

141
The issue of whether or not GroEL is able to forcefully unfold SPs remains a
controversial issue in the literature, despite 15 years of study by a large number of
researchers. If active unfolding does takes place, it does so as a result of the allosteric
structural transitions that a GroEL ring undergoes in response to ATP and GroES
binding, during which GroEL may perform work on any bound SP. These studies have
taken a close look at the concertedness of the transitions, the properties of the T and R
states, how the transitions are affected by SP, and how allostery might play a role in one
step of the GroEL reaction cycle, the release of GroES in response to ATP binding. In
looking at these various aspects of GroEL, compelling evidence has been uncovered
which suggests that GroEL does actively unfold substrates, and that GroEL operates most
efficiently as an unfoldase, rather than as a passive isolation chamber.
The major conclusions from this dissertation can be summarized as follows.
Studies with GroELIRX (Chapter 3), a mutant into which intersubunit tethers can be
introduced in order to lock the rings in the T state, reveal that the T→R→R’ transition
within a ring is concerted, albeit with the discussed caveats. These studies, in
combination with previous studies with another double cysteine mutant, GroELIAX,
suggest that all 7 subunits in a ring are forced to undergo domain movements in one
concerted motion. This is important, because the upward, twisting motion of the apical
domains which occurs during the T→R→R’ transition would provide the “power stroke”
to any SP unfolding event. Concerted motion within a ring would maximize the potential
unfolding force during the power stroke. Additionally, this mutant was revealed to be
defective in its inter-ring communication. This was shown by its reduced ability to

142
release GroES, its reduced negative cooperativity, and this may have something to with
the inability of SP to stimulate its ATPase activity.
The stimulation of GroEL’s ATPase activity by unfolded SP was examined in
Chapter 4. It was suggested that SP is able to enhance ATPase activity because it binds
to and enhances the population of GroEL rings in the T state, which has a higher Vmax of
ATPase activity than the R state. SP behaves similarly to a covalent tether in this respect.
SP is able to bind to two or more SP binding sites and prevent the T→R transition, acting
like an intersubunit tether exerting a mechanical force on GroEL. Therefore, in order for
GroEL to undergo its structural transitions, it must be able to exert a countering force on
the substrate. Thus, rate stimulation by SP is at least an indirect demonstration that
GroEL must perform work on its substrates.
Finally, the release of GroES from GroEL upon the binding of ATP to GroEL’s
trans ring, and the ability of unfolded SP to enhance the rate of this process, was
examined in Chapter 5. It was discovered that the rate limiting step in the GroES release
pathway was the release of ADP from the trans ring prior to ATP binding. It was
suggested that one reason SP is able to stimulate GroES release is that it binds to the
trans ring and shifts the ring’s T→R equilibrium towards the T state. The T state has a
lower affinity for ADP, and therefore the release of ADP is accelerated. Additionally, it
was implied that a T state trans ring also enhances the rate of GroES release by another
mechanism that remains unknown due to a poor understanding of the allostery and
signaling events of the pathway.
The finding that unfolded SP not only has the ability to stimulate ATPase activity,
but also to stimulate the rate of GroES release has important implications in a biological

143
sense. SP can stimulate ATPase activity by as much as 10-fold in the presence of GroES,
and it can stimulate GroES release by a remarkable 4 orders of magnitude. In Chapter 5,
the relationship between the amount of time an SP can remain encapsulated in the central
cavity (mean residence time) and the total cycle time of a single ring (hemicycle time)
was explored. The offset hemicycles of the two rings were shown schematically in
Figure 5-3. In the absence of SP, the hemicycle time is about 220 seconds, 40-50 of
which are spent releasing GroES. With SP, the hemicycle time is reduced to about 12
seconds. Of those 12 seconds, less than 0.1 second is spent releasing GroES. Thus,
when unfolded SP is present, not only is the total cycle time reduced, meaning the system
cycles more often, but the amount of time the folding chamber remains intact is
significantly reduced. Without knowing the rate of GroES association, it cannot be
known exactly for how long during the 12 seconds GroES is bound to GroEL, but the
important point is that it is far less than it is in the absence of SP. Since the lifetime of
the folding chamber is reduced, the amount of time an unfolded SP has to refold in
isolation is also reduced in the presence of SP. According to the passive mechanism of
GroEL-assisted protein folding, the important function that GroEL serves is to isolate
misfolded proteins in a favorable folding environment and protect them from aggregation
while they refold (7). But, why would a system, whose key function is to provide a
folding chamber, significantly reduce the lifetime of that folding chamber in the presence
of the very substrate it is charged with protecting? In other words, the system does not
seem to be well designed for the purpose of protecting substrates. Instead, it seems better
designed to bind and release substrates as quickly as possible, and the more SP there is,
the faster GroEL turns it over. The system appears well designed for the active unfolding
144
mechanism, in which turnovers are the key (5, 46). Each hemicycle will result in one
forced unfolding event, followed by a short refolding period in the central cavity, and
then the SP will be released, folded or not. The active unfolding mechanism is most
efficient when the system is turning over rapidly; conversely, passive unfolding is least
efficient when the system is turning over rapidly. Therefore, without even discussing the
mechanism by which SP stimulates activity or GroES release, the simple fact that it does
suggests that GroE has evolved to unfold proteins, rather than to act as a passive folding
chamber.
The fact that ATPase activity and the rate of GroES release are affected by
unfolded SP highlights the importance of using GroEL of the highest purity when making
quantitative measurements. Purifying GroEL is not a trivial task; after all, its function is
to bind a large variety of other proteins. Even a weak binding SP such as α-LA is able to
affect the GroES release rate in only 2-fold excess. However, the problems associated
with impure GroEL were made abundantly clear in Chapter 5, where studies with highly
pure GroEL provided data that were dramatically different from published data obtained
with what was presumably contaminated GroEL. The acetone precipitation procedure
(56) used to purify the GroEL for these studies should become the standard protocol in
any laboratory seeking to make the kinds of quantitative measurements that were
presented in this dissertation. There are too many examples in the literature of GroEL
ATPase measurements that give rates which we only observe after the deliberate addition
of unfolded SP, and which vary dramatically from one laboratory to another. Many of
these reports make no specific mention of any procedure that had been used to remove
such contaminating SP. There is very little point in attempting the kinds of sophisticated

145
quantitative analyses being presented in the current GroEL literature if the GroEL
preparations used for the analyses are full of contaminating proteins.
This dissertation presents an explanation as to why unfolded SP stimulates
ATPase activity and the release of GroES: SP binds to and stabilizes the T conformation
of a GroEL ring. This explanation is a reasonable one, because GroEL rings locked in
the T state by covalent tethers have a significantly higher ATPase activity than rings in
the R state (see results in Chapter 3 with GroELIRX and GroELIAX), and there are other
data in Chapter 4 which also support this explanation. With that said, the real
explanation for rate stimulation by SP is almost certainly more complicated. The current
explanation does not explain why SP does not stimulate activity in either GroELIRX or
SR1. There is no satisfactory explanation as to why, at relatively low [ATP], SP inhibits
the activity of GroEL that is locked in the T state. It is very possible that reducing rate
stimulation by SP to a simple effect on the T→R equilibrium is an oversimplification,
albeit one which explains most of the data. It is more likely that the allostery of GroEL is
more complicated than has been implied by some of the assumptions and conclusions of
this dissertation, and that, in fact, there may be additional allosteric states that play a role
in the GroEL reaction cycle.
The idea that additional allosteric states exist besides T, R, and R’ is not a new
one. Their existence was acknowledged during the original synthesis of the nested
cooperativity model (33), and it has been shown in cryo-EM studies that the T-state trans
ring of GroEL/GroES complex is structurally different from a T-state ring of GroEL in
the TT state (83). This suggests that the allosteric state of one ring is dependent of the
allosteric state of the other ring. This also raises the possibility that there may be

146
additional allosteric T or R states that exist in the presence of SP, with their own ATP
binding affinity and Vmax. These possibilities significantly complicate any discussion of
GroEL’s allostery. However, it also provides a potential explanation for why SP does not
stimulate the ATPase activity of GroEL mutants in which inter-ring communication is
deficient. Consider the following: the binding of SP to a ring may very well hold that
ring in the T state, but it may also affect the Vmax and binding affinity of the other ring. It
may be that the unbound ring transits to another allosteric state upon SP binding to the
other ring, and that this transition is absolutely required for the SP-bound ring to transit to
a more active T state. In fact, this highlights one dangerous assumption present in
formulating the theoretical models discussed in Chapter 3, and that is the assumption that
the allosteric state of one ring is completely independent of the state of the other.
Including an inter-ring dependence and additional allosteric states in the theoretical
models would be extremely difficult, and any data fit to these more complicated models
would probably not be good enough to be able to distinguish between the various models
anyway. This is not to say that the conclusions reached with the current theoretical
models are incorrect, however, the fact that the models are almost certainly
oversimplifications should be kept in mind. For now, T, R, and R’ provide a useful
description of allostery as we currently understand it and will suffice until a more robust
model of allostery can be developed.
This dissertation has presented a study of GroEL’s allosteric properties and how
they are related to its role in rescuing misfolded protein substrates. The debate over
passive vs. active unfolding will certainly not end here, and it may be difficult to ever
fully resolve the question. However, the data documented in these pages make a case

147
that active unfolding does occur, and that the allosteric structural transitions and catalytic
functions that GroEL undergoes are designed to allow it to occur efficiently. Concerted
domain movements maximize the unfolding force. Unfolded substrate proteins exert a
mechanical force on their binding sites, which obliges GroEL to exert force on the SPs in
return. When unfolded SP is present, the GroE system hydrolyzes ATP, releases GroES,
and cycles more rapidly, allowing it to perform more unfolding events in a shorter
amount of time. In the absence of SP, the system turns over slowly, conserving cellular
resources. GroEL does work on its substrates with an efficient power stroke and does so
most efficiently when the workload is heaviest. It is the very definition of a machine, and
its continued study should provide countless insights into the way Nature has designed
other cellular machines. Several of the experiments presented here may be useful in the
study of other ringed structures, such the Clp proteases (84), or the PA63 heptamer of
anthrax toxin (85) . The studies undertaken for this dissertation may provide valuable
tools to use in the ongoing study of Nature’s skill as an engineer.

148
APPENDIX
A.1 Equations Used to Find the Number of Moles of Monomers, Dimers, etc. per
Moles of 14-mer in a Cross-Linked Sample of GroELIRX.
These equations produce the number of moles of a given species (monomer,
dimer, etc.) per moles of 14-mer at any value along the reaction coordinate by
multiplying the fraction of 14-mers with a given number of tethers (from the binomial
distribution equations) by the probability that those 14-mers contain that particular
species, by the number of that species the 14-mer is predicted to contain. For example,
using non-real numbers to illustrate, at some point on the reaction coordinate 15% of the
14-mers contain 3 tethers. In these 14-mers, there is a 1/4 probability that two dimers are
present. The mole fraction of dimers is then 0.15*(1/4)*2. The probability numbers
were calculated using the scheme in Figure 3-5.
In the following equations, yx is the fraction of 14-mers containing x tethers. The
probability factor has already been multiplied by the number of species contained in the
14-mer for simplicity.
Moles of Monomer = y0*14 + y1*12 + y2*(132/13) + y3*(1320/156) +
y4*(11880/1716) + y5*(95040/17160) + y6*(665280/154440) + y7*(3991680/1235520)
+ y8*(19958400/8648640) + y9*(79833600/51891840) + y10*(239500800/259459200)
+ y11*(479001600/1037836800) + y12*(479001600/3113510400) + y13*0 + y14*0
Moles of Dimer = y0*0 + y1*1 + y2*(22/13) + y3*(330/156) + y4*(3960/1716) +
y5*(39600/17160) + y6*(332640/154440) + y7*(2328480/1235520) +
y8*(13305600/8648640) + y9*(59875200/51891840) + y10*(199584000/259459200) +
y11*(439084800/1037836800) + y12*(479001600/3113510400) + y13*0 + y14*0

149
Moles of Trimer = y0*0 + y1*0 + y2*(2/13) + y3*(60/156) + y4*(1080/1716) +
y5*(1440/17160) + y6*(151200/154440) + y7*(1270080/1235520) +
y8*(8467200/8648640) + y9*(43545600/51891840) + y10*(163296000/259459200) +
y11*(399168000/1037836800) + y12*(479001600/3113510400) + y13*0 + y14*0
Moles of Tetramer = y0*0 + y1*0 + y2*0 + y3*(6/156) + y4*(216/1716) +
y5*(4320/17160) + y6*(60480/154440) + y7*(635040/1235520) +
y8*(5080320/8648640) + y9*(30481920/51891840) + y10*(130636800/259459200) +
y11*(359251200/1037836800) + y12*(479001600/3113510400) + y13*0 + y14*0
Moles of Pentamer = y0*0 + y1*0 + y2*0 + y3*0 + y4*(24/1716) + y5*(960/17160) +
y6*(20160/154440) + y7*(282240/1235520) + y8*(2822400/8648640) +
y9*(20321280/51891840) + y10*(101606400/259459200) +
y11*(319334400/1037836800) + y12*(479001600/3113510400) + y13*0 + y14*0
Moles of Hexamer = y0*0 + y1*0 + y2*0 + y3*0 + y4*0 + y5*(120/17160) +
y6*(5040/154440) + y7*(105840/1235520) + y8*(1411200/8648640) +
y9*(12700800/51891840) + y10*(76204800/259459200) +
y11*(279417600/1037836800) + y12*(479001600/3113510400) + y13*0 + y14*0
Moles of Heptamer = y0*0 + y1*0 + y2*0 + y3*0 + y4*0 + y5*0 + y6*(720/154440) +
y7*(36000/1235520) + y8*(887040/8648640) + y9*(13789440/51891840) +
y10*(145152000/259459200) + y11*(1037836800/1037836800) +
y12*(4790016000/3113510400) + y13*(12454041600/6227020800) +
y14*(12454041600/6227020800)

150
REFERENCES
1. Anfinsen, C. B. (1973) Principles that govern the folding of protein chains.
Science 181, 223-230
2. Sigler, P. B., Xu, Z., Rye, H. S., Burston, S. G., Fenton, W. A., and Horwich, A.
L. (1998) Structure and function in GroEL-mediated protein folding. Annu Rev
Biochem 67, 581-608
3. Matouschek, A., Pfanner, N., and Voos, W. (2000) Protein unfolding by
mitochondria. The Hsp70 import motor. EMBO Reports 1, 404-410
4. Richter, K., Muschler, P., Hainzl, O., and Buchner, J. (2002) Coordinated ATP
hydrolysis by the Hsp90 dimer. J Biol Chem 318, 611-620
5. Thirumalai, D., and Lorimer, G. H. (2001) Chaperonin-mediated protein folding.
Annu Rev Biophys Biomol Struct 30, 245-269
6. Georgopoulos, C. P., and Hohn, B. (1978) Identification of a host protein
necessary for bacteriophage morphogenesis (the groE gene product). Proc Natl
Acad Sci USA 75, 131-135
7. Ellis, R. J., and Hartl, F. U. (1996) Protein folding in the cell: competing models
of chaperonin function. FASEB J 10, 20-26
8. Shtilerman, M., Lorimer, G. H., and Englander, S. W. (1999) Chaperonin
function: folding by forced unfolding. Science 284, 822-825
9. Hemmingsen, S. M., Woolford, C., van der Vies, S. M., Tilly, K., Dennis, D. T.,
Georgopoulos, C. P., Hendrix, R. W., and Ellis, R. J. (1988) Homologous plant
and bacterial proteins chaperone oligomeric protein assembly. Nature 333, 330-
334

151
10. Braig, K., Otwinowski, Z., Hegde, R., Boisvert, D. C., Joachimiak, A., Horwich,
A. L., and Sigler, P. B. (1994) The crystal structure of the bacterial chaperonin
GroEL at 2.8 A. Nature 371, 578-586
11. Brocchieri, L., and Karlin, S. (2000) Conservation among HSP60 sequences in
relation to structure, function, and evolution. Protein Sci 9, 476-486
12. Fenton, W. A., Kashi, Y., Furtak, K., and Horwich, A. L. (1994) Residues in
chaperonin GroEL required for polypeptide binding and release. Nature 371, 614-
619
13. Weissman, J. S., Hohl, C. M., Kovalenko, O., Kashi, Y., Chen, S., Braig, K.,
Saibil, H. R., Fenton, W. A., and Horwich, A. L. (1995) Mechanism of GroEL
action: productive release of polypeptide from a sequestered position under
GroES. Cell 83, 577-587
14. Xu, Z., Horwich, A. L., and Sigler, P. B. (1997) The crystal structure of the
asymmetric GroEL-GroES-(ADP)7 chaperonin complex. Nature 388, 741-750
15. Hunt, J. F., Weaver, A. J., Landry, S. J., Gierasch, L., and Deisenhofer, J. (1996)
The crystal structure of the GroES co-chaperonin at 2.8 A resolution. Nature 379,
37-45
16. Azem, A., Kessel, M., and Goloubinoff, P. (1994) Characterization of a functional
GroEL14(GroES7)2 chaperonin hetero- oligomer. Science 265, 653-656
17. Rye, H. S., Roseman, A. M., Chen, S., Furtak, K., Fenton, W. A., Saibil, H. R.,
and Horwich, A. L. (1999) GroEL-GroES cycling: ATP and nonnative
polypeptide direct alternation of folding-active rings. Cell 97, 325-338
152
18. Chen, S., Roseman, A. M., Hunter, A. S., Wood, S. P., Burston, S. G., Ranson, N.
A., Clarke, A. R., and Saibil, H. R. (1994) Location of a folding protein and shape
changes in GroEL-GroES complexes imaged by cryo-electron microscopy.
Nature 371, 261-264
19. Todd, M. J., Lorimer, G. H., and Thirumalai, D. (1996) Chaperonin-facilitated
protein folding: optimization of rate and yield by an iterative annealing
mechanism. Proc Natl Acad Sci U S A 93, 4030-4035
20. Todd, M. J., Viitanen, P. V., and Lorimer, G. H. (1994) Dynamics of the
chaperonin ATPase cycle: implications for facilitated protein folding. Science
265, 659-666
21. Goloubinoff, P., Gatenby, A. A., and Lorimer, G. H. (1989) GroE heat-shock
proteins promote assembly of foreign prokaryotic ribulose bisphosphate
carboxylase oligomers in Escherichia coli. Nature 337, 44-47
22. Goloubinoff, P., Christeller, J. T., Gatenby, A. A., and Lorimer, G. H. (1989)
Reconstitution of active dimeric ribulose bisphosphate carboxylase from an
unfoleded state depends on two chaperonin proteins and Mg-ATP. Nature 342,
884-889
23. Viitanen, P. V., Gatenby, A. A., and Lorimer, G. H. (1992) Purified chaperonin
60 (groEL) interacts with the nonnative states of a multitude of Escherichia coli
proteins. Protein Sci 1, 363-369
24. Aoki, K., Motojima, F., Taguchi, H., Yomo, T., and Yoshida, M. (2000) GroEL
binds artificial proteins with random sequences. J Biol Chem 275, 13755-13758
153
25. Lin, Z., Schwartz, F. P., and Eisenstein, E. (1995) The hydrophobic nature of
GroEL-substrate binding. J Biol Chem 270, 1011-1014
26. Buckle, A. M., Zahn, R., and Fersht, A. R. (1997) A structural model for GroEL-
polypeptide recognition. Proc Natl Acad Sci U S A 94, 3571-3575
27. Privalov, P. L., Tiktopulo, E. I., Venyaminov, S., Griko, Y., Makhatadze, G. I.,
and Khechinashvili, N. N. (1989) Heat capacity and conformation of proteins in
the denatured state. J Mol Biol 205, 737-750
28. Murphy, K. P., Privalov, P. L., and Gill, S. J. (1990) Common features of protein
unfolding and dissolution of hydrophobic compounds. Science 247, 559-561
29. Lorimer, G. (1997) Protein folding. Folding with a two-stroke motor. Nature 388,
720-721, 723
30. Viitanen, P. V., Lubben, T. H., Reed, J., Goloubinoff, P., O'Keefe, D. P., and
Lorimer, G. H. (1990) Chaperonin-facilitated refolding of ribulosebisphosphate
carboxylase and ATP hydrolysis by chaperonin 60 (groEL) are K+ dependent.
Biochemistry 29, 5665-5671
31. Todd, M. J., Viitanen, P. V., and Lorimer, G. H. (1993) Hydrolysis of adenosine
5'-triphosphate by Escherichia coli GroEL: effects of GroES and potassium ion.
Biochemistry 32, 8560-8567
32. Gray, T. E., and Fersht, A. R. (1991) Cooperativity in ATP hydrolysis by GroEL
is increased by GroES. FEBS Lett 292, 254-258
33. Yifrach, O., and Horovitz, A. (1995) Nested cooperativity in the ATPase activity
of the oligomeric chaperonin GroEL. Biochemistry 34, 5303-5308

154
34. Yifrach, O., and Horovitz, A. (1996) Allosteric control by ATP of non-folded
protein binding to GroEL. J Mol Biol 255, 356-361
35. Roseman, A. M., Chen, S., White, H., Braig, K., and Saibil, H. R. (1996) The
chaperonin ATPase cycle: mechanism of allosteric switching and movements of
substrate-binding domains in GroEL. Cell 87, 241-251
36. Ranson, N. A., Farr, G. W., Roseman, A. M., Gowen, B., Fenton, W. A.,
Horwich, A. L., and Saibil, H. R. (2001) ATP-bound states of GroEL captured by
cryo-electron microscopy. Cell 107, 869-879
37. Rye, H. S., Burston, S. G., Fenton, W. A., Beechem, J. M., Xu, Z., Sigler, P. B.,
and Horwich, A. L. (1997) Distinct actions of cis and trans ATP within the double
ring of the chaperonin GroEL. Nature 388, 792-798
38. Ma, J., Sigler, P. B., Xu, Z., and Karplus, M. (2000) A dynamic model for the
allosteric mechanism of GroEL. J Mol Biol 302, 303-313
39. Weissman, J. S., Rye, H. S., Fenton, W. A., Beechem, J. M., and Horwich, A. L.
(1996) Characterization of the active intermediate of a GroEL-GroES-mediated
protein folding reaction. Cell 84, 481-490
40. Hartl, F. U., and Hayer-Hartl, M. (2002) Molecular chaperones in the cytosol:
from nascent chain to folded protein. Science 295, 1852-1858
41. Chen, J., Walter, S., Horwich, A. L., and Smith, D. L. (2001) Folding of malate
dehydrogenase inside the GroEL-GroES cavity. Nat Struct Biol 8, 721-728
42. Weissman, J. S., Kashi, Y., Fenton, W. A., and Horwich, A. L. (1994) GroEL-
mediated protein folding proceeds by multiple rounds of binding and release of
nonnative forms. Cell 78, 693-702

155
43. Zahn, R., Perrett, S., and Fersht, A. R. (1996) Conformational states bound by the
molecular chaperones GroEL and secB: a hidden unfolding (annealing) activity.
J Mol Biol 261, 43-61
44. Zahn, R., Perrett, S., Stenberg, G., and Fersht, A. R. (1996) Catalysis of amide
proton exchange by the molecular chaperones GroEL and SecB. Science 271,
642-645
45. Nieba-Axmann, S. E., Ottiger, M., Wuthrich, K., and Pluckthun, A. (1997)
Multiple cycles of global unfolding of GroEL-bound cyclophilin A evidenced by
NMR. J Mol Biol 271, 803-818
46. Betancourt, M. R., and Thirumalai, D. (1999) Exploring the kinetic requirements
for enhancement of protein folding rates in the GroEL cavity. J Mol Biol 287,
627-644
47. Farr, G. W., Fenton, W. A., Chaudhuri, T. K., Clare, D. K., Saibil, H. R., and
Horwich, A. L. (2003) Folding with and without encapsulation by cis- and trans-
only GroEL-GroES complexes.
48. Monod, J., Wyman, J., and Changeux, J.-P. (1965) On the nature of allosteric
interactions: a plausible model. J Mol Biol 12, 88-118
49. Koshland, D. E., Jr., Nemethy, G., and Filmer, D. (1966) Comparison of
experimental binding data and theoretical models in proteins containing subunits.
Biochemistry 5, 365-385
50. Yifrach, O., and Horovitz, A. (2000) Coupling between protein folding and
allostery in the GroE chaperonin system. Proc Natl Acad Sci U S A 97, 1521-1524
156
51. Murai, N., Makino, Y., and Yoshida, M. (1996) GroEL locked in a closed
conformation by an interdomain cross-link can bind ATP and polypeptide but
cannot process further reaction steps. J Biol Chem 271, 28229-28234
52. Rye, H. S. (2001) Application of fluorescence resonance energy transfer to the
GroEL-GroES chaperonin reaction. Methods 24, 278-288
53. White, Z. W., Fisher, K. E., and Eisenstein, E. (1995) A monomeric variant of
GroEL binds nucleotides but is inactive as a molecular chaperone. J Biol Chem
270, 20404-9
54. Sambrook, J., Fritsch, E. F., and Maniatis, T. (1989) Molecular Cloning, A
Laboratory Manual, Second Ed., Cold Spring Harbor Laboratory Press
55. Laemmli, U. K. (1970) Cleavage of proteins during the assembly of the head of
bacteriophage T4. Nature 227, 680-685
56. Voziyan, P. A., and Fisher, M. T. (2000) Chaperonin-assisted folding of
glutamine synthetase under nonpermissive conditions: off-pathway aggregation
propensity does not determine the co-chaperonin requirement. Protein Sci 9,
2405-2412
57. Todd, M. J., and Lorimer, G. H. (1998) Criteria for assessing the purity and
quality of GroEL. Methods in Enzymology 290, 135-141
58. Eisenstein, E., Reddy, P., and Fisher, M. T. (1998) Overexpression, purification,
and properties of GroES from Escherichia coli. Methods in Enzymology 290, 119-
135
59. Kosower, N. S., and Kosower, E. M. (1995) Diamide: An oxidant probe for
thiols. Methods in Enzymology 251, 123-133

157
60. Nitao, L. K., and Reisler, E. (1998) Probing the conformational states of the SH1-
SH2 helix in myosin: A cross-linking approach. Biochemistry 37, 16704-16710
61. Hashimoto, M., Majima, E., Goto, S., Shinohara, Y., and Terada, H. (1999)
Fluctuation of the first loop facing the matrix of the mitochondrial ADP/ATP
carrier deduced from inermolecular cross-linking of cys56 residues by
bifunctional dimaleimides. Biochemistry 38, 1050-1056
62. Okazaki, A., Ikura, T., Nikaido, K., and Kuwajima, K. (1994) The chaperonin
GroEL does not recognize apo-alpha-lactalbumin in the molten globule state. Nat
Struct Biol 1, 439-446
63. Peralta, D., Hartman, D. J., Hoogenraad, N. J., and Hoj, P. B. (1994) Generation
of a stable folding intermediate which can be rescued by the chaperonins GroEL
and GroES. FEBS Letters 339, 45-49
64. Ranson, N. A., Dunster, N. J., Burston, S. G., and Clarke, A. R. (1995)
Chaperonins can catalyse the reversal of early aggregation steps when a protein
misfolds. J Mol Biol 250, 581-586
65. Martz, E. (2002) Protein Explorer: Easy yet powerful Macromolecular
Visualization. Trends in Biochemical Sciences 27, 107-109
66. Nielsen, K. L., McLennan, N., Masters, M., and Cowan, N. J. (1999) A single-
ring mitochondrial chaperonin (Hsp60-Hsp10) can substitute for GroEL-GroES in
vivo. Journal of Bacteriology 181, 5871-5875
67. Brune, M., Hunter, J. L., Corrie, J. E., and Webb, M. R. (1994) Direct, real-time
measurement of rapid inorganic phosphate release using a novel fluorescent probe
158
and its application to actomyosin subfragment 1 ATPase. Biochemistry 33, 8262-
8271.
68. Brune, M., Hunter, J. L., Howell, S. A., Martin, S. R., Hazlett, T. L., Corrie, J. E.,
and Webb, M. R. (1998) Mechanism of inorganic phosphate interaction with
phosphate binding protein from Escherichia coli. Biochemistry 37, 10370-10380.
69. Uebel, M. H. (2001) Recovering intact GroEL complexes formed in vivo. In
Department of Chemistry and Biochemistry, University of Maryland College
Park, College Park, MD
70. Jai, E. A., and Horowitz, P. M. (1999) Nucleotide and Mg2+ induced
conformational changes in GroEL can be detected by sulfhydryl labeling. J
Protein Chem 18, 387-396
71. McLaughlin, S. H., Smith, H. W., and Jackson, S. E. (2002) Stimulation of the
weak ATPase activity of human hsp90 by a client protein. J Mol Biol 315, 787-
798
72. Widjaja, L. (2002) Allosteric control of GroEL by ATP: Effects of monovalent
and divalent cations. In Department of Chemistry and Biochemistry, University of
Maryland, College Park, College Park, MD
73. Danziger, O., Rivenzon-Segal, D., Wolf, S. G., and Horovitz, A. (2003)
Conversion of the allosteric transition of GroEL from concerted to sequential by
the single mutation Asp-155 -> Ala. Proc Natl Acad Sci U S A 100, 13797-13802
74. Yifrach, O., and Horovitz, A. (1994) Two lines of allosteric communication in the
oligomeric chaperonin GroEL are revealed by the single mutation Arg196-->Ala.
J Mol Biol 243, 397-401

159
75. Wang, Z., Feng, H., Landry, S. J., Maxwell, J., and Gierasch, L. M. (1999) Basis
of substrate binding by the chaperonin GroEL. Biochemistry 38, 12537-12546
76. Richarme, G., and Kohiyama, M. (1994) Amino acid specificity of the
Escherichia coli chaperone GroEL (heat shock protein 60). J Biol Chem 269,
7095-7098
77. Fisher, T. E., Marszalek, P. E., and Fernandez, J. M. (2000) Stretching single
molecules into novel conformations using the atomic force microscope. Nat Struct
Biol 7, 719-724
78. Vinckier, A., Gervasoni, P., Zaugg, F., Ziegler, U., Lindner, P., Groscurth, P.,
Pluckthun, A., and Semenza, G. (1998) Atominc force microscopy detects
changes in the interaction forces between GroEL and substrate proteins. Biophys.
J. 74, 3256-3263
79. Burston, S. G., Weissman, J. S., Farr, G. W., Fenton, W. A., and Horwich, A. L.
(1996) Release of both native and non-native proteins from a cis-only GroEL
ternary complex. Nature 383, 96-99
80. Burston, S. G., Ranson, N. A., and Clarke, A. R. (1995) The origins and
consequences of asymmetry in the chaperonin reaction cycle. J Mol Biol 249,
138-152
81. Lakowicz, J. R. (1999) Principles of Fluorescence Spectroscopy
82. Molecular Probes (2003) Handbook of Molecular Probes and Research Products.
83. White, H. E., Chen, S., Roseman, A. M., Yifrach, O., Horovitz, A., and Saibil, H.
R. (1997) Structural basis of allosteric changes in the GroEL mutant Arg197--
>Ala. Nat Struct Biol 4, 690-694

160
84. Hoskins, J. R., Sharma, S., Sathyanarayana, B. K., and Wickner, S. (2001) Clp
ATPases and their role in protein unfolding and degradation. Advances in protein
chemistry 59, 413-429
85. Mourez, M., Lacy, D. B., Cunningham, K., Legmann, R., Sellman, B. R.,
Mogridge, J., and Collier, R. J. (2002) 2001: a year of major advances in anthrax
toxin research. Trends in Microbiology 10, 287-293