abstract title of document: rnai and morpholino as tools to
TRANSCRIPT
ABSTRACT
Title of Document: RNAI AND MORPHOLINO AS TOOLS TO
STUDY SIGNALING IN LIMULUS VENTRAL PHOTORECEPTORS.
Monika M Deshpande, Doctor of Philosophy,
2006 Directed By: Dr. Richard Payne, Neuroscience and Cognitive
Science program
Limulus ventral photoreceptors have been studied using electrophysiological,
immunocytochemical, and biochemical techniques. However, genetic manipulation
has eluded Limulus research because the animal takes about 10 years to mature. As an
alternative, we decided to explore the possibility of using RNA interference (RNAi),
and morpholino to reduce the levels of a target protein. The purpose of this study was
to test whether use of these techniques would result in any physiological changes in
the ventral photoreceptors.
As a target we chose arrestin, a protein that binds to and quenches
metarhodopsin, the activated form of rhodopsin. Injecting arrestin RNAi, or arrestin
morpholino into the cells had a profound effect. The rate of spontaneous quantal
events („bumps‟) in the injected cells had a 5-fold increase as compared to bump rates
of control cells at 24 hrs after injection. Because high levels of metarhodopsin are
thought to be present in ventral photoreceptors even in darkness, this result is
consistent with an increase in the amount of unquenched metarhodopsin in the cells.
To show that the increase in spontaneous dark bumps was a result of unquenched
metarhodospin, we treated RNAi -injected cells with hydroxylamine, a bleaching
agent that destroys metarhodopsin. The bump rate after this treatment was down to
pre-injection levels confirming our hypothesis that the excess bumps were generated
by unquenched metarhodopsin.
Another target protein selected was opsin. Opsin bound to the chromophore
forms rhodopsin, and rhodopsin photoconverts to metarhodopsin. Therefore, opsin
reduction was expected to lead to a reduction in sensitivity to light. sensitivity to light
decreased by about 30 fold at 96 hrs after opsin morpholino injections.
In another set of experiments, we fixed the injected cells with the
arrestin/opsin antibodies. We measured the fluorescence from thee secondary
antibodies targeted against the arrestin/opsin primary antibodies to get an insight into
the protein levels. We observed a 2.5 fold decrease in fluorescent counts in arrestin
morpholino injected cells and a 17 fold decrease in opsin injected cells.
RNAI AND MORPHOLINO AS TOOLS TO STUDY SIGNALING IN LIMULUS VENTRAL PHOTORECEPTORS.
By
Monika M Deshpande
Dissertation submitted to the Faculty of the Graduate School of the University of Maryland, College Park, in partial fulfillment
of the requirements for the degree of Doctor of Philosophy
2006
Advisory Committee: Professor Richard Payne, Chair Professor Pamela A. Abshire Professor Robert J. Dooling Professor Arthur N. Popper Professor Stephen M. Wolniak

© Copyright by
Monika M Deshpande
2006

ii
Dedication
To Mom and Dad for always believing in me even at times when I did not believe in
myself. Thank you.

iii
ACKNOWLEDGMENTS First and foremost I must thank Richard for being my mentor and for being so patient with me. I still remember the day that I began this wonderful, though at times frustrating journey. I was filled with anxiety having come to a new country, leaving behind everything that was familiar to me. As soon as I first met him I felt at ease; I knew I had come to the right place. At times I would get carried away in my excitement or sometimes be so frustrated that I thought of quitting, but Richard was always there for me. He taught me that even the lowly graduate students are to be respected. He taught me the value of persistence. And above all he instilled in me the love for what I do. Richard also guided me with meeting my committee members. They have been such an inspiration for me and guided me in every step of the way. Dr. Popper was an invaluable help while I was writing my thesis. He came up with valuable suggestions which greatly enhanced the quality of my research. Dr. Wolniak was very helpful in designing the experiments. Dr. Abshire helped me immensely in the actual data analysis. He was largely responsible for dispelling the fear of math that many years of high school education had created in me. And last but certainly not the least, I must thank Dr. Dooling for all the help that he provided in ensuring that proper procedures were followed and that all the criterions were being met. I would also take this opportunity to thank my fellow lab-mate Youjun. Over the years he has become a close friend of mine. He has been a great support for me, and a great listener. I will greatly miss him. I would also like to thank Murat for especially helping with me my Matlab difficulties, Dr. Lee for our various discussions on experiments. Sandy has been an absolutely wonderful friend and ensured that also the NACS regulations were being met. I would need to write an entire thesis just thanking her! I would also like to thank Amar and Narendra for being such good friends and being there for me through it all. When I first joined the department, I was filled with excitement about science. But I often wondered whether I would lose this thirst for knowledge as I embarked on this road towards a Ph.D. Instead as I graduate from the University of Maryland, I am filled with even more passion and respect for science than I ever felt. I honestly believe I cannot pay a greater tribute to all the wonderful people in the NACS department who have fostered such a productive and a fun environment.
iv
TABLE OF CONTENTS Introduction ......................................................................................................................... 1
1.1 Phototransduction ............................................................................................... 1 1.1.1 Phototransduction in Limulus ...................................................................... 2
1.2 Post-transcriptional gene silencing techniques ................................................... 5 1.2.1 The RNAi technique .................................................................................... 5 1.2.2 Use of Morpholino ....................................................................................... 7
1.3 Selection of appropriate proteins to test the success of these techniques ........... 7 1.4 Opsin ................................................................................................................... 9
1.4.1 Vertebrate opsins ....................................................................................... 10 1.4.2 Invertebrate opsins ..................................................................................... 11
1.5 Arrestin ............................................................................................................. 12 1.5.1 The role of arrestin in vertebrate phototransduction .................................. 12 1.5.2 Mutations in vertebrate arrestin ................................................................. 13 1.5.3 Arrestin function in invertebrates .............................................................. 14 1.5.4 Mutations in invertebrate arrestin .............................................................. 15
1.6 Complementary oligonucleotide techniques are especially useful for molecules with high turnover since they target mRNA. .......................................................... 16 1.6.1 Opsin turnover ............................................................................................... 16
1.6.2 Arrestin turnover ........................................................................................ 17 1.7 Electrophysiology ............................................................................................. 17 1.8 Target proteins and predictions ......................................................................... 19
RNAi as a tool to downregulate arrestin levels in Limulus ventral photoreceptors.......... 21 2.1 Introduction ....................................................................................................... 21 2.2 Materials and methods ...................................................................................... 25
2.2.1 Preparation of the nerve ............................................................................. 25 2.2.2 Preparation of siRNA ................................................................................. 25 2.2.3 siRNA treatment ........................................................................................ 26 2.2.4 Hydroxylamine treatment .......................................................................... 26 2.2.5 Electrophysiology ...................................................................................... 27 2.2.6 Estimation of photon counts corresponding to the different log10 light intensities. ........................................................................................................... 28 2.2.7 Calculating volume of injections ............................................................... 29 2.2.8 Data analysis .............................................................................................. 30
2.3 RESULTS ......................................................................................................... 31 2.3.1 siRNA is membrane permeable in Limulus ventral photoreceptors: ......... 31 2.3.2 Arrestin siRNA injections lead to an increase in the dark bump rate and are most effective at 24 hrs after treatment ............................................................... 33 2.3.3 The bumps generated by siRNA injections have properties similar to those generated in the presence of log10 -8.5 light. ...................................................... 37 2.3.4 Bleach with hydroxylamine reduces dark noise ........................................ 39 2.3.5 The effects of hydroxylamine are consistent with an attack on metarhodopsin but not rhodopsin........................................................................ 41
v
2.3.6 siRNA injected cells bleached with hydroxylamine show a marked decrease in dark bumps. ...................................................................................... 45
2.4 Discussion ......................................................................................................... 47 2.4.1 Injecting siRNA is the optimum delivery method. .................................... 48 2.4.2 Increased bump rate after siRNA injections gives an estimate of arrestin turnover rate. ....................................................................................................... 48 2.4.3 Excess bumps are probably caused by unquenched metarhodopsin. ......... 50 2.4.4 Equal rhodopsin and metarhodopsin ratio in Limulus results in a decrease in spontaneous dark bumps after bleach with hydroxylamine. ........................... 50 2.4.5 siRNA injections do not abolish bump rates completely. .......................... 51 2.4.6 siRNA technique can be a very powerful tool to study Limulus phototransduction. ............................................................................................... 52
Inhibiting Limulus arrestin and opsin gene expression using Morpholino Antisense Oligonucleotide ................................................................................................................. 53
3.1 Introduction ....................................................................................................... 53 3.2 MATERIALS and METHODS......................................................................... 56
3.2.1 Preparation of the nerve ............................................................................. 56 3.2.2 Morpholino injections ................................................................................ 56 3.2.3 Electrophysiology ...................................................................................... 57 3.2.4 Immunocytochemistry ............................................................................... 58 3.2.5 Confocal microscopy ................................................................................. 59
3.3 RESULTS ......................................................................................................... 60 3.3.1 Arrestin morpholino leads to a 5-fold increase in bump rate 24 hrs after injection............................................................................................................... 60 3.3.2 Dose-dependence in arrestin morpholino injected cells ............................ 63
3.4 Opsin morpholino Injections............................................................................. 65 3.4.1 Opsin morpholino injections reduce dark noise ......................................... 65 3.4.2 Opsin morpholino injections lead to a 1.5 log10 reduction in sensitivity at 96 hrs after injection. .......................................................................................... 67 3.4.3 Bump rates in response to opsin morpholino injections show a dose-dependent effect .................................................................................................. 69 3.4.4 Light sensitivity decreases in opsin morpholino injected cells. ................. 70 3.4.5 Bump amplitude is not reduced in injected cells ....................................... 73 3.4.6 Peak amplitude is reduced in response to a saturating flash of light ......... 74 3.4.7 Response kinetics affected in the presence of a non-saturating flash of light............................................................................................................................. 76
3.5 Reduction in protein levels after morpholino injections ................................... 77 3.5.1 Dextran injections do not damage the cell ................................................. 77 3.5.2 Arrestin morpholino injections lead to a 2.5 fold reduction in fluorescent counts .................................................................................................................. 79 3.5.3 Opsin morpholino injections lead to a 17 fold reduction in fluorescent counts .................................................................................................................. 82
3.6 DISCUSSION ................................................................................................... 85 3.6.1 Consequence of Rhodopsin and metarhodopsin with similar spectral properties............................................................................................................. 88
Discussion ......................................................................................................................... 90
vi
4.1 Controls used in the experiments. ..................................................................... 90 4.2 RNAi vs. Morpholino ...................................................................................... 91 4.3 Arrestin reduces dark noise. .............................................................................. 92 4.4 Opsin confirmed as the photopigment in Limulus. ........................................... 94 4.5 Consequence of opsins with similar spectral properties not resolved. ............. 95 4.6 Regulation of metarhodopsin deactivation is extremely critical in Limulus..... 97 4.7 Membrane channels involved in phototransduction. ........................................ 98 4.8 Future directions. ............................................................................................ 100
References ....................................................................................................................... 102

vii
LIST OF FIGURES
Figure 1.1: Mechanism of RNAi ………………………………………………. 4 Figure 1.2 Schematic depicting the photoisomerization events of rhodopsin in invertebrates. ………………………………………………………………….. 9 Figure 2.1: Graph of PMT Counts ……………………………………………. 29 Figure 2.2 Graph of Dark bump rate …………………………………….......... 32 Figure 2.3 Dark Bumps in RNAi injected cells ……………………………….. 34 Figure 2.4 Bump rate after SiRNA injections at 24 hrs ……………………….. 35 Figure 2.5: Spontaneous dark bump rate ……………………………………….. 36 Figure 2.6: The response kinetics of cells ……………………………………… 37 Figure 2.7: Power spectrum of traces with bumps ……………………………… 39 Figure 2.8: Effect of hydroxylamine treatment on control cells. ……………….. 41 Figure 2.9: Hydroxylamine treatment in the dark ………………………………. 43 Figure 2.10: Dark bump rate after hydroxylamine treatment in the dark ……….. 44 Figure 2.11: Reduction in bump rate after bleach with hydroxylamine ………… 46 Figure 2.12: The dark bumps are compared for a cell before injection …………. 47 Figure 3.1: Bumps after 1µM arrestin morpholino injections ………………….. 61 Figure 3.2: Dark bumps in cells injected with arrestin morpholino. ……………. 62 Figure 3.3: Dose dependence in arrestin morpholino injections ………………... 64 Figure 3.4: Dark bump rate in cells injected with 1 uM opsin morpholino …….. 66 Figure 3.5: 1 mM Opsin morpholino injections at various hrs ………………….. 68 Figure 3.6: Dose dependence at 96 hrs after opsin morpholino injections ……… 70 Figure 3.7: Sensitivity to light decreases with time …………………………….. 72 Figure 3.8: Response to a 200ms saturating flash (log100) ……………………... 75 Figure 3.9: Response to a 200ms non-saturating flash (log10-4) ……………….. 76 Figure 3.10: Immunofluorescece micrograph of dextran staining……………… 78 Figure 3.11: Fluorescent counts in cells injected with arrestin morpholino……. 80 Figure 3.12: Fluorescent counts from z-section images of cells. ………………. 81 Figure 3.13: Confocal fluorescent images of ventral photoreceptors …………... 84 Figure 3.14: Fluorescent counts from z-section images of cells ………………... 85
1
Chapter 1
Introduction
1.1 Phototransduction
Vertebrates and invertebrates share some crucial steps in phototransduction
while differing in others. The primary event in both vertebrates and invertebrates is
absorption of a photon of light by the photopigment rhodopsin. This event activates a
heterotrimeric G-protein and ultimately generates an electrical signal. However, the
intermediate steps are different in the two classes of animals. In vertebrate
phototransduction, the G-protein is transducin. Transducin- GTP activates the effector
enzyme, cyclic GMP (cGMP) phosphodiesterase (PDE). A transient decrease in
cGMP levels leads to the activation of cyclic nucleotide gated (CNG) channels
(1Fesenko et al., 1985; 2Kaupp et al., 1989). This cascade results in channel closure
and causes the membrane to hyperpolarize (3Yarfitz & Hurley, 1994).
In contrast to vertebrates, in the microvillar photoreceptors of Drosophila,
absorption of a photon leads to the opening of two cationic channels, TRP and TRPL,
and an inward current resulting in membrane depolarization (4Niemeyer et al., 1996).
The phototransduction is mediated by a G-protein activated phospholipase C (PLC)
(5Bloomquist et al., 1988; 6Ranganathan et al., 1995). Activation of PLC catalyzes the
breakdown of phosphatidylinositol-4, 5-bisphosphate (PIP2) leading to the production
of inositol 1, 4, 5 trisphosphate (InsP3) and diacylglycerol (DAG) (7Berridge, 1993).
2
Exactly how these products lead to the opening of the TRP & TRPL channels is not
known.
1.1.1 Phototransduction in Limulus Limulus ventral photoreceptors make an excellent model system for the study
of invertebrate visual transduction for several reasons. Firstly, they are very large in
size (~ 200 x 80 µm). This allows for multiple electrode impalement and pressure
injection of substances in single cell recordings. Secondly, once dissected, the cells
show robust responses for up to 75 days and therefore can be used to study long-term
effects of manipulations (8Bayer et al., 1978). One optic nerve contains about 25- 35
photoreceptor cells. All the above mentioned properties have enabled several
researchers to use the Limulus ventral photoreceptors to get an insight into the
invertebrate phototransduction process using electrophysiology, biochemistry, and
immunocytochemistry (9Drolochter & Stieve, 1997).
The Limulus ventral photoreceptors are divided into a rhadbomeral (R) lobe
and an arhabdomeral (A) lobe (10Stern et al., 1982; 11Calman & Chamberlain, 1982).
The R lobe has microvilli and is light sensitive whereas the A lobe is light insensitive.
The axon arises from the A-lobe. The photocurrent is localized to the R-lobe (12Payne
& Fein 1986). The phototransduction involves InsP3 as a second messenger. InsP3
both excites and adapts the photoreceptors via a rise in intracellular calcium (13Brown
et al., 1984; 14Fein et al., 1984; 15Payne et al., 1986). Although over the years,
3
substantial progress has been made in understanding the phototransduction in Limulus
ventral photoreceptors, some questions still remain unanswered.
One of the crucial steps that are not known is the identity of the membrane
channel responsible for membrane depolarization in response to light. Two likely
candidates for the channel are CNG, as in vertebrates, or TRP, as in Drosophila.
Injection of InsP3 into the photoreceptors activates the light-dependent conductance
(16Fein et al., 1984; 17Payne et al., 1986). Intracellular injection of Ca2+ elicits a
response that mimics a light-induced response, whereas buffering Ca2+ inhibits this
response (18Shin et al., 1993; 19Payne et al., 1986; 20Frank & Fein, 1991). Collectively
these results show that InsP3 –induced release of stored Ca2+ might be the message
responsible for activating the channels. Further, these results suggest that TRP
channels might be involved in this process. However, other studies show that cGMP
injections also depolarize ventral photoreceptors and in turn suggest the possible
involvement of this second messenger in phototransduction (21Johnson et al., 1986).
Further evidence in support of the cGMP pathway comes from the work that showed
that the light-dependent channels were opened by cGMP and not by Ca2+, and that
inhibitors of guanylate cyclase reduced light-induced response (22Bacigalupo et al.,
1991; 23Garger et al., 2001). These observations favor CNG channels in mediating
photocurrent in Limulus. In our laboratory, putative cGMP and TRP channels have
been cloned and sequenced from the Limulus eye cDNA (24Chen at al., 1999;
25Bandyopadhyay and Payne, 2004).
4
The next step is to perform functional studies on these channels. Traditionally,
the role of specific genes is determined by selecting or creating a mutation in the gene
of interest followed by detailed analysis of the phenotype. Mutation and knockout
experiments have led to a wealth of information on phototransduction in mice and in
Drosophila. It is believed that until the effects of a gene knockout or null mutation are
studied, a categorical statement can not be made about the function of the gene. This
is because the knockout background may reveal multiple forms of proteins, redundant
pathways, or reveal a gene as a pseudogene. Therefore, knockouts have become the
“gold standard” for identifying protein function. However, despite a wealth of
physiological data in Limulus phototransduction, mutation experiments are not
performed because the animal requires about 10 years to mature. One way to
overcome this problem is to use functional silencing of genes. This may bring the
understanding of the physiology in Limulus to an approximate alignment with the
molecular mechanisms found in studying Drosophila.
We decided to use RNA interference (RNAi) and morpholinos as tools to
achieve functional silencing. Our aim was to investigate if this technique would work
in Limulus ventral photoreceptors. We chose arrestin and opsin proteins as our targets
since these two proteins are better characterized, and their role in Limulus
phototransduction is better understood than either of the putative membrane channels.
5
1.2 Post-transcriptional gene silencing techniques
RNAi and morpholino are emerging as most effective tools in bringing about
functional silencing of genes. Both of these molecules are complementary
oligonucleotides that interfere with mRNA translation. This reduces protein levels
and functionally silences the gene.
1.2.1 The RNAi technique
RNA interference (RNAi), also named RNA silencing or post transcriptional
gene silencing (PTGS), is a powerful technique that allows tissue-specific
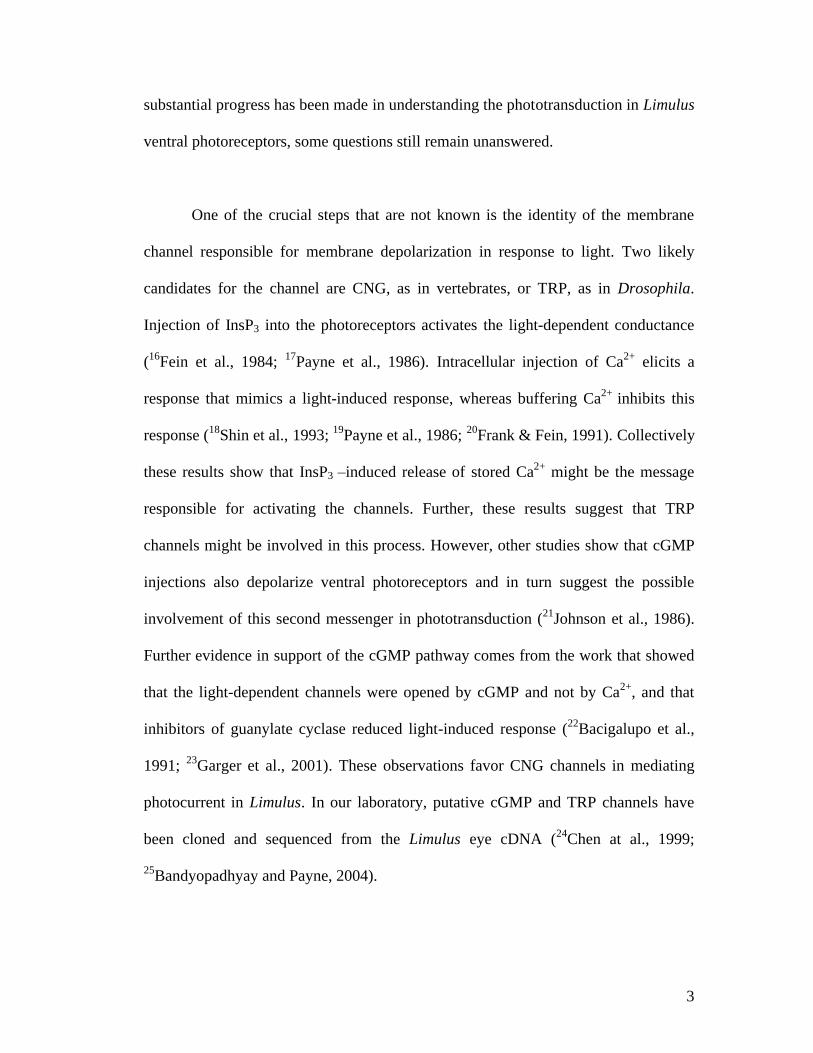
suppression of gene expression. As depicted in Fig.1.1, a small double-stranded RNA
(dsRNA) introduced in the cell gets cut into small 21-25 nucleotide (nt) interfering
RNAs (siRNAs) that induce sequence-specific degradation of homologous single-
stranded mRNA (26Fire et al., 1998). It is hypothesized that dsRNA resembles a viral
or transposon infection and the cell has developed a defense mechanism to destroy it.
The cell produces (or activates) RNA endonucleases that cleave the target RNA into
small pieces (27Hammond et al., 2000).
Double stranded RNA-mediated RNA interference is an effective method to
down- regulate the levels of proteins in cells. It has become a dominant reverse
genetics method that allows one to move from gene sequence to function. This
technique has been shown to work in vertebrates and invertebrates, and has been
extensively used in C. elegans, plants, D. melanogaster, mouse, and several cell lines

6
(Fire et al., 1998; 28Chuang et al, 2000; 29Misquitta et al., 1999; 30Caplen et al.,
2001;31Tuschl et al., 1999). RNAi is especially useful in organisms that were not
amenable to genetic analysis. If this technique works in Limulus, it would be ideal for
manipulation of RNA levels.
Figure 1.1: Mechanism of RNAi results in post-transcriptional knockdown of a gene product. dsRNA is introduced into the cell by soaking, injecting, or transfecting. The dsRNA strands are cut by Dicer (a member of the RNase III family of dsRNA-specific ribonucleases) into siRNAs. The siRNAs get attached to a nuclease, the RNA-induced silencing complex (Risc). The complex binds to the target mRNA that has a perfect complementary sequence. The targeted mRNA gets degraded by Risc activity.
Figure modified from the webpage of Wolfgang Nellen Department of Genetics
at Kassel University, Germany.
http://www.uni-kassel.de/fb19/genetics/projects/prj_as.html
7
1.2.2 Use of Morpholino
Phosphorodiamidate morpholino oligomers (PMOs) are single, 25nt strands of
a DNA-like molecule (32Summerton & Weller, 1997). They are different from DNA
in two aspects. The phosphodiester linkage in DNA is replaced by a
phosphorodiamidate linkage in morpholino. Secondly, the five membered
deoxyribose ring in DNA is replaced by a six membered morpholine ring. These
modifications make them highly resistant to degradation by enzymes while at the
same time, they do not affect binding by Watson-Crick pairing (33Hudziak et al.,
1996). They are antisense molecules that prevent ribosome binding, or interfere with
pre-mRNA spicing, and subsequently block gene expression.
Morpholinos are typically designed against the first 25 bases 3‟ to the AUG
translational start site. They presumably act by preventing ribosomal binding to the
mRNA. In the absence of ribosomal binding, translation is blocked and the target
gene can be silenced (Review 34Summerton, 1999; 35Ekker & Larson, 2001).
Morpholinos show a high affinity, low toxicity and very few non-specific side effects
(Summerton, 1999; Summerton & Weller 1997).
1.3 Selection of appropriate proteins to test the success of these techniques
We used several criteria to select proteins for testing these techniques in
Limulus ventral photoreceptors. Firstly the proteins should to be a part of the visual
transduction cascade. Secondly, they should have been sequenced (to allow designing
of complementary probes). Thirdly, their turnover should be high since the above
8
techniques target freshly synthesized proteins and have no effect on the proteins
already present in the system. The two proteins that seemed to fit these criteria were
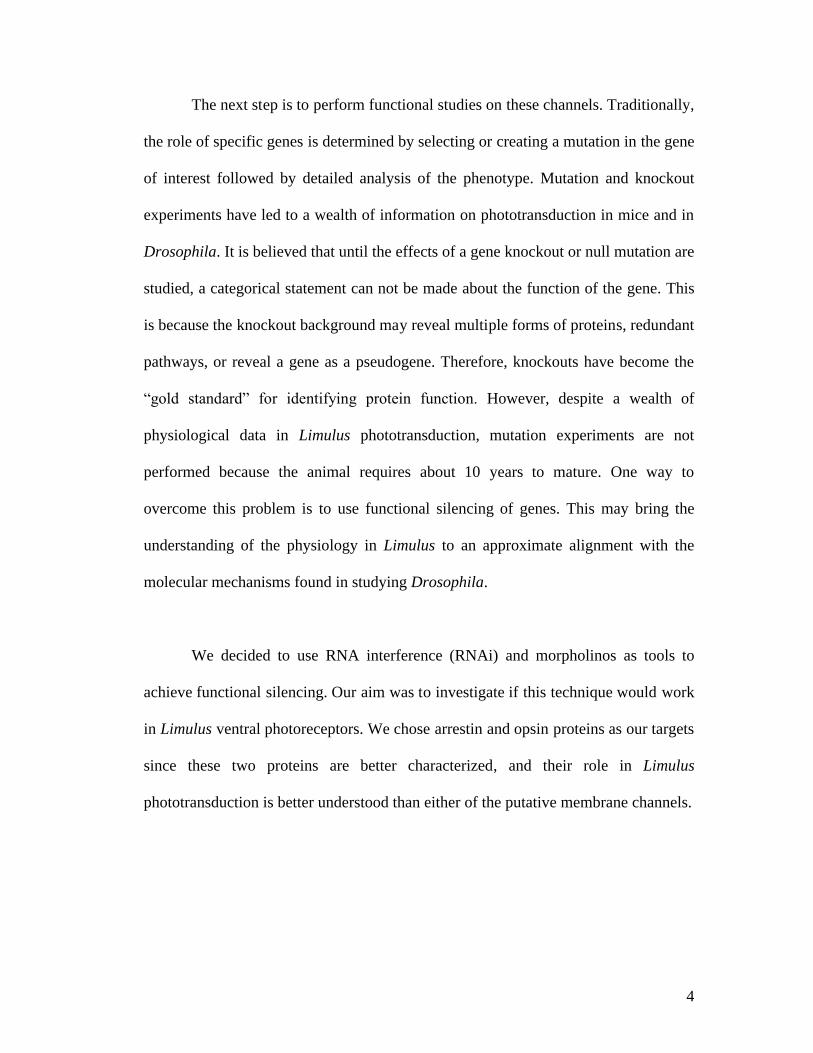
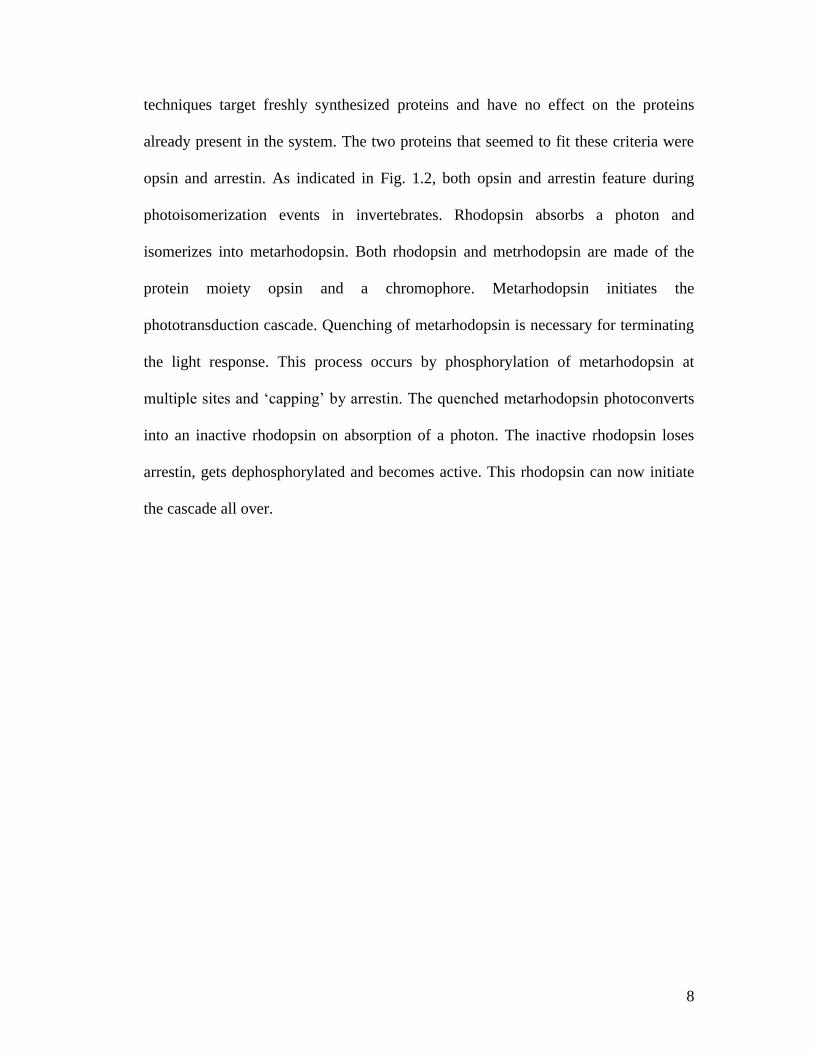
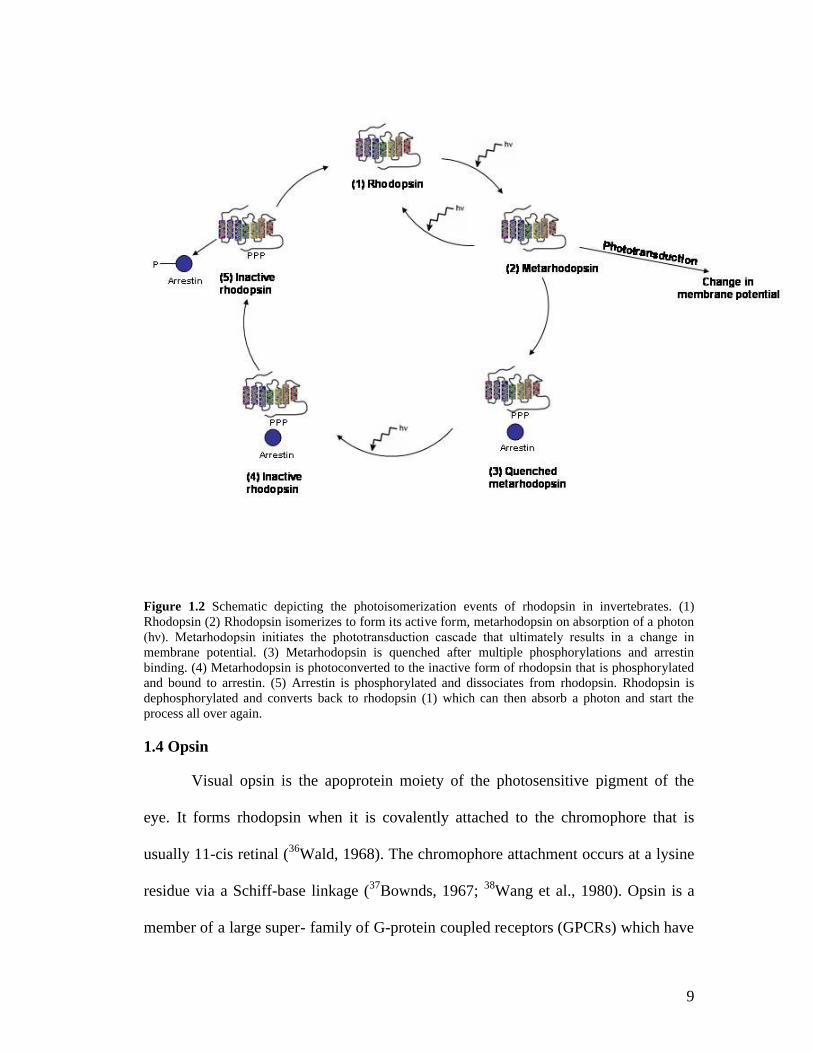
opsin and arrestin. As indicated in Fig. 1.2, both opsin and arrestin feature during
photoisomerization events in invertebrates. Rhodopsin absorbs a photon and
isomerizes into metarhodopsin. Both rhodopsin and metrhodopsin are made of the
protein moiety opsin and a chromophore. Metarhodopsin initiates the
phototransduction cascade. Quenching of metarhodopsin is necessary for terminating
the light response. This process occurs by phosphorylation of metarhodopsin at
multiple sites and „capping‟ by arrestin. The quenched metarhodopsin photoconverts
into an inactive rhodopsin on absorption of a photon. The inactive rhodopsin loses
arrestin, gets dephosphorylated and becomes active. This rhodopsin can now initiate
the cascade all over.
9
Figure 1.2 Schematic depicting the photoisomerization events of rhodopsin in invertebrates. (1) Rhodopsin (2) Rhodopsin isomerizes to form its active form, metarhodopsin on absorption of a photon (hν). Metarhodopsin initiates the phototransduction cascade that ultimately results in a change in membrane potential. (3) Metarhodopsin is quenched after multiple phosphorylations and arrestin binding. (4) Metarhodopsin is photoconverted to the inactive form of rhodopsin that is phosphorylated and bound to arrestin. (5) Arrestin is phosphorylated and dissociates from rhodopsin. Rhodopsin is dephosphorylated and converts back to rhodopsin (1) which can then absorb a photon and start the process all over again.
1.4 Opsin
Visual opsin is the apoprotein moiety of the photosensitive pigment of the
eye. It forms rhodopsin when it is covalently attached to the chromophore that is
usually 11-cis retinal (36Wald, 1968). The chromophore attachment occurs at a lysine
residue via a Schiff-base linkage (37Bownds, 1967; 38Wang et al., 1980). Opsin is a
member of a large super- family of G-protein coupled receptors (GPCRs) which have
10
a seven-transmembrane -helical domain (39Baldwin et al., 1997). Opsin is different
from the other GPCRs in that it has a lysine residue that binds retinal in the seventh
helix. Many studies of vertebrate photoreceptors have increased our understanding of
the role of opsins in phototransduction. Since vertebrates and invertebrates share
many features of phototransduction, especially the few initial steps, these studies also
give us an indication of the role of opsins in invertebrates as well.
1.4.1 Vertebrate opsins
Upon absorption of a photon in the photoreceptors of vertebrates, the 11-cis
retinal bound to rhodopsin isomerizes to form all-trans retinal on a femtosecond time
scale (40Wang et al., 1994). This causes conformational changes in the opsin and
leads to the conversion of rhodopsin to metarhodopsin. This conversion occurs
through various intermediates such as photorhodopsin, bathorhodopsin,
lumirhodopsin, metarhodopsin I, metarhodopsin II, and metarhodopsin III (41Okada et
al., 2001). These intermediates can be distinguished based on their specific absorption
maxima (42Shichida & Imai, 1998). Metarhodopsin II initiates the phototransduction
cascade by activating the heterotrimeric G-protein transducin (43Stryer, 1986;
44Nathans, 1992). In a process termed bleaching, metarhodopsin eventually gets
destroyed when the chromophore dissociates from it. Renewal of rhodopsin involves
the binding of fresh retinal to opsin.
Point mutations in opsins lead to retinitis pigmentosa, an autosomal –
dominant disease that causes blindness (45Dryja et al., 1990). In mice, rhodopsin
mutants cause retinitis pigmentosa, retinal degeneration, and failure to develop rod
outer segments (46Olsson et al., 1992; 47Toda et al., 1999; 48Humphries et al., 1997).
11
1.4.2 Invertebrate opsins
Invertebrate rhodopsin gets pohotoisomerized in the presence of blue light,
and activates the Gq subunit of the heterotrimeric G-protein, dgq (49Lee et al., 1990;
50Scott et al., 1995). Upon activation, rhodopsin forms intermediates similar to those
in vertebrates (51Yoshizawa & Wald, 1964). However, unlike in vertebrate
photoreceptors, metarhodopsin from invertebrates is thermally stable and does not
bleach (52Kropf et al., 1959). Upon absorption of orange light it photoconverts back to
rhodopsin.
The downstream steps of this cascade differ in vertebrates in invertebrates. In
vertebrates, cGMP channels close and the photoreceptors hyperpolarize (53Fesenko et
al., 1985). Although in invertebrates the identity of membrane channel is not fully
understood, the photoreceptor membrane depolarizes as a result of phototransduction
(54Hagins et al., 1962; 55Bortoff, 1964). Quenching of metarhodopsin is essential for
ending phototransduction.
The Drosophila ninaE (neither inactivation nor afterpotential E) gene was
isolated and identified as encoding the opsin that is expressed in R1-R6 cells of
Drosophila photoreceptors (56O‟Tousa et al., 1985; 57Zuker et al., 1985). Mutations in
this gene cause ultrastructural defects as well as loss of photoreceptor sensitivity
(58O‟Tousa et al., 1989). Recessive ninaE mutants exhibit a defective light response
and photoreceptor cell death (59Leonard et al., 1992). Dominant ninaE mutants are
defective in rhodopsin maturation, trafficking of rhodopsin in the endoplasmic
reticulum, or cause retinal degeneration and constitutive strong desensitization in
12
photoreceptor cells (60Colley et al., 1995; 61Kurada et al., 1998; 62Iakhine et al.,
2004).
Limulus has multiple opsin genes two of which (opsin1 & opsin2) are cloned
and better understood than the other genes (63Dalal et al., 2003; 64Smith et al., 1993).
1.5 Arrestin
Arrestins are a class of soluble proteins that in conjunction with receptor kinases
quench the G-protein coupled receptor function (65Hargrave & McDowell, 1992).
There are two types of visual arrestins, rod –specific (called s-antigen) and cone-
specific (called x- arrestin) (66Review Krupnick & Benovic, 1998; 67Sakuma et al.,
1996). Several different types of visual arrestins also occur in the invertebrates.
Drosphila has two (68LeVine et al., 1990; 69Yamada et al., 1990).
1.5.1 The role of arrestin in vertebrate phototransduction
Arrestin was initially characterized as a protein that translocated to the rod
outer segment (ROS) after rhodopsin activation (Kuhn et al., 1984). During
quenching of the light response, metarhodopsin is deactivated by a two-step process.
Initially, rhodopsin kinase phosphorylates metarhodopsin at multiple serine and
threonine residues on its COOH-terminal (70Wilden et al., 1982). This quenches the
metarhodopsin partially. Phosphorylation alone decreases metarhodopsin activity by
about 50% (Xu et al, 1997). Arrestin binding occurs only after metarhodopsin is
phosphorylated at least at three sites (71Schleicher et al., 1989; 72Mendez et al., 2000).
Arrestin does not bind to rhodopsin, has low affinity for unphosphorylated
metarhodopsin and phosphorylated rhodopsin, and a high affinity for phosphorylated
13
metarhodopsin (73Vsevolod et al., 2004). Only after arrestin binding does the
metarhodopsin get completely quenched (74Kuhn et al., 1984; 75Wilden et al., 1986;
Xu et al., 1997). Quenched metarhodopsin cannot bind to transducin and thus is
inactive. Later, in the presence of retinal dehydrogenase, the all-trans-retinal gets
reduced to all- trans-retinol (76Palczewski et al., 1994). The retinol dissociates from
opsin, leaving arrestin bound to phosphorylated opsin. Arrestin is then released, and
phosphatase 2A dephosphorylates the opsin (77Palczewski et al., 1989). The
rhodopsin is regenerated when opsin binds to a freshly synthesized 11-cis retinal.
1.5.2 Mutations in vertebrate arrestin
In humans, a homozygous deletion of nucleotide 1147 (1147delA) in codon
309 of the arrestin gene leads to the formation of a “functional null allele” because
although the gene product is formed, it is not functional (78Fuchs et al., 1995). This
mutation results in a type of autosomal recessive congenital stationary night blindness
(CSNB) called Oguchi disease (79Oguchi 1907). The symptoms of this disease
include abnormally slow dark adaptation and diffuse yellow or gray coloration of the
fundus (80Maw et al., 1995). This results in inability to see in darkness. After 2 or 3
hours in total darkness, the normal color of the fundus and the ability to see returns.
This is called the 'Mizuo phenomenon' (81Mizuo 1913). All other visual functions,
including visual acuity, visual field, and color vision are usually normal (82Carr and
Ripps 1991).
The dark adaptation in Oguchi disease patients is slow because even under
very dim light, the phototransduction cascade takes a long time to terminate. This
may reduce the ability of the photoreceptors to detect low levels of light and thus

14
reduces night vision. The visual defects of Oguchi disease appear to require severe
reduction in arrestin levels. Patients with heterozygous mutations in the arrestin gene
do not show any defects in dark adaptation.
Correspondingly in mice (83Xu et al., 1997), heterozygous arrestin mutants
which have 33% functional arrestin still have normal responses in light. Homozygous
null mutants, however, have a normal rising phase but prolonged falling phase in
response to light. A defect in the falling phase is expected since in the absence of
arrestin, there would be more unquenched metarhodopsin in the photoreceptors. An
increase in the unquenched metarhodopsin would affect termination of the
phototransduction cascade.
1.5.3 Arrestin function in invertebrates
In invertebrates there is one crucial difference in the fate of metarhodopsin
from that of vertebrates. In vertebrates, the metarhodopsin dissociates into
chromophore and opsin and rhodopsin is resynthesized in a multi-step process.
However, in invertebrates, the metarhodopsin is thermostable, does not bleach, and
does not regenerate spontaneously to rhodopsin. It stays as metarhodopsin until it
absorbs a photon and isomerizes back to rhodopsin. In the absence of light, the only
way to deactivate the metarhodopsin is phosphorylation and arrestin binding. Because
a few unquenched metarhodopsin molecules might generate continuous bumps in the
dark, a failure to quench metarhodopsin will lead to an increase in dark noise. Even a
relatively small number of unquenched metarhodopsin molecules might therefore
substantially increase background noise and decrease the sensitivity to light. So
15
deactivation of metarhodopsin in invertebrates is a crucial step and needs to be
strictly regulated.
The mechanism of arrestin function in invertebrates is understood mainly
from work in Drosophila. In the presence of arrestin, metarhodopsin gets
phosphorylated at multiple sites and gets quenched (84Bentrop et al., 1993). As in
vertebrates, arrestin further quenches the metarhodopsin activity and protects it from
dephosphorylation by phosphatases (85Byk et al., 1993). Upon absorption of another
photon, the arrestin-bound phosphorylated metarhodopsin is converted into arrestin-
bound phosphorylated rhodopsin. Phosphorylated rhodopsin releases arrestin and gets
dephosphorylated by RDGC, a rhodopsin phosphatase (86Vinos et al., 1997). This
dephosphorylated rhodopsin is ready to absorb another photon.
1.5.4 Mutations in invertebrate arrestin
Drosophila has two arrestin genes. Mutation in the dominant arrestin gene
leads to a photoresponse that has a prolonged deactivating afterpotential (PDA) that
takes ten times longer to terminate the light response (87Dolph et al., 1993). This
observation indicates that arrestin is necessary for termination of phototransduction in
vivo.
There is evidence for only one arrestin gene in Limulus photoreceptors
(88Smith et al., 1995). Limulus arrestin appears to be concentrated at the
photosensitive rhabdomeral membrane, which is consistent with its participation in
phototransduction. Arrestin also occurs in extra-rhabdomeral vesicles that contain
internalized rhabdomeral membrane and might therefore also play a role in rhodopsin
16
endocytosis. In response to a bright flash of light, CaCAM PKII phosphorylates
arrestin in both ventral and lateral photoreceptors (89Battelle et al., 2001; 90Smith et
al., 1995; 91Calman et al., 1996).
1.6 Complementary oligonucleotide techniques are especially useful for molecules with high turnover since they target mRNA.
1.6.1 Opsin turnover
Vertebrate opsin levels are under the control of light and circadian rhythm. In
mice, opsin mRNA and protein levels peak just before daylight and are lowest in the
middle of the next dark cycle at night (92Bowes et al., 1988; 93McGinnis et al., 1990).
In toad and fish retinas, the opsin mRNA level rises just before light onset, remains
high while lights are on, and decreases four to tenfold in the dark (94Korenbrot et al.,
1989). In Drosophila, rhodopsin is highly stable and undergoes low levels of turnover
(95Schwemer, 1984).
In Limulus, opsin mRNA levels increase during mid to late afternoon and
decrease during the night. The levels are light driven and are not affected by circadian
input. The opsin 1 mRNA levels were twice the opsin 2 levels. However, there was
no significant change in the relative levels throughout the 24 hr cycle (96Dalal et al.,
2003). Although there is no direct evidence of changes in the protein levels, since
vertebrate opsin levels mimic opsin mRNA pattern, probably Limulus opsin does so
as well.
17
1.6.2 Arrestin turnover
The turnover rate of arrestin varies from one organism to another. Over a 24
hr day and night cycle, arrestin mRNA levels vary in mice, rats, fish, and toads
(97Bowes et al., 1988; 98Craft et al., 1990; 99McGinnis et al., 1990). In mice, the
arrestin mRNA levels are lowest just before onset of the light and peak just before
darkness. Arrestin mRNA levels in mammals follow rates of transcription, the rate of
synthesis, and the level of arrestin protein (100McGinnis et al., 1994; 101Agarwal et al.,
1994; 102Organisciak et al., 1991).
On the other hand, arrestin mRNA levels in Drosophila, and Xenopus remain
constant over a 24 hr period (103Hartman et al., 2001; 104Green and Besharse, 1996).
In Drosophila (Hartman et al., 2001), arrestin protein levels are also stable over a 24
hr period and thus reflect the mRNA pattern. In Limulus, arrestin mRNA levels are
low in the night and high in daytime (105Battelle et al., 2000). These changes in
arrestin mRNA levels may reflect changes in the protein levels.
1.7 Electrophysiology can be used to assess the success of the complementary
oligonucleotide techniques.
To investigate whether the RNAi and morpholino based techniques were
successful, electrophysiological response of the Limulus photoreceptor cells to light
can be studied. These cells show small depolarizations in membrane potential (1-
10mV) even in complete darkness in the form of dark noise called “bumps”. Bumps
also occur in several other vertebrate and invertebrate photoreceptors such as locust,
18
spider, Hermissenda, and toad (106Scholes, 1965; 107DeVoe, 1972; 108Takeda, 1982;
109Baylor et al., 1979).
The occurrence of spontaneous dark bumps is attributed to two mechanisms.
One is the thermal isomerization of rhodopsin (110Barlow et al., 1993) and the second
results from the back reactions from quenched metarhodopsin. Temperature and pH
contribute to the first mechanism. These bumps are heavily dependent upon
surrounding temperatures since temperature strongly influences rhodopsin thermal
isomerization. Toad photoreceptors show reduced dark bumps at low temperatures
(111Aho et al., 1988). A rhodopsin unprotonated at the Schiff base is more likely to
isomerize than a protonated one (112Birge and Barlow 1995). Therefore lowering of
pH results in a reduction of dark bumps. Unquenched metarhodopsin contributes to
the second mechanism. Metarhodopsin is kept quenched by the action of
phosphorylation and arrestin binding.
In the dim light, the absorption of a single photon causes a similar
depolarizing event called quantum bump (113Yeandle & Spiegler, 1973). The light
induced quantum bump is generated by metarhodopsin.
The amplitude and temporal profiles of the dark and light activated bumps are
identical, because thermally isomerized rhodopsin is indistinguishable from
photoisomerized rhodopsin (114Baylor et al., 1980). The inability to distinguish
between dark and light-induced bumps becomes a key limiting factor in dim light. In
dim light, the dark bumps generate false signals which can not be distinguished from
those generated by single photon absorption. It is therefore important for an animal to
19
keep the noise level as low as possible. In Limulus the problem of lowering thermal
isomerization of rhodopsin is handled internally by lowering the photoreceptor pH via
an unknown mechanism. This protonates the Schiff base of a small population of
unprotonated rhodopsins and reduces noise. The problem of spontaneous activation of
metarhodopsin resulting in dark bumps is reduced by keeping a tight control of
quenching by phosphorylation and arrestin binding (115Lisman 1985). On exposure to
bright light, the cells depolarize to about 60mV. A summation of bumps leads to these
larger light-induced changes in membrane potential as demonstrated using a model
called the “adapting bump model” (116Dodge et al., 1968). The spontaneous dark
bumps, light-induced bumps, and depolarization in response to bright light are three
parameters that can be investigated in cells treated with the complementary
oligonucleotides.
1.8 Target proteins and predictions
Opsin and arrestin were selected as target proteins to test the feasibility of
using RNAi and morpholino in Limulus ventral photoreceptors. The two proteins
have well defined functions, which helps us to predict what to expect in the event of
reduction in their levels. A reduction in opsin concentration would lead to a
subsequent reduction in rhodopsin and metarhodopsin concentration. This would
affect both the dark and light-induced bumps. A reduction in arrestin is expected to
increase unquenched metarhodopsin which would increase the bump rate. They form
a nice pair since they have opposing effects. Neither protein was expected to affect
the resting membrane potential, or the bump attributes other than bump rate (such as

20
peak, duration, etc.). They were also not expected to affect the peak response in the
presence of bright light.
21
Chapter 2
RNAi as a tool to downregulate arrestin levels in Limulus ventral photoreceptors
2.1 Introduction
RNA interference (RNAi), also named RNA silencing or post transcriptional
gene silencing (PTGS), is a powerful technique that allows tissue-specific
suppression of gene expression. A small double-stranded RNA (dsRNA) introduced
in the cell gets cut into small 21-25nt interfering RNAs (siRNAs) that induce
sequence-specific degradation of homologous single-stranded mRNA (117Fire et al.,
1998). dsRNA seemingly resembles a viral or transposon infection and the cell has
developed a defense mechanism to destroy it. The cell produces (or activates) RNA
endonucleases that cleave the target RNA into small pieces (118Hammond et al.,
2000).
Double stranded RNA-mediated RNA interference is an effective method to
downregulate the levels of proteins in cells. It has become a dominant reverse
genetics method which allows one to move from gene sequence to function. This
technique has been shown to work in vertebrates and invertebrates, and has been
extensively used in C. elegans, plants, D. melanogaster, mouse, and several cell lines
(Fire et al., 1998; 119Chuang et al, 2000; 120Misquitta et al., 1999; 121Caplen et al.,
22
2001, and 122Tuschl et al., 1999). RNAi is especially useful in organisms that are not
amenable to genetic analysis. One such organism is Limulus polyphemus, the
horseshoe crab.
In our laboratory, we have used Limulus ventral photoreceptors to investigate
the phototransduction cascade. These ventral photoreceptors are very large (~ 200 x
80 µm) and can be maintained in culture for several days. These properties make
them highly suitable for electrophysiology, immunocytochemistry, and microscopy.
If RNAi worked in this system, it would be a powerful tool to explore additional
aspects of the phototransduction mechanism.
We selected arrestin as a target protein to test whether the RNAi technique
works in the Limulus ventral photoreceptors. Arrestin binds to phosphorylated
metarhodopsin and quenches it so that the physiological activity of metarhodopsin in
phototransduction is completely abolished. Metarhodopsin is the photoactivated form
of rhodopsin that initiates the phototransduction cascade. Quenching of
metarhodopsin involves phosphorylation at multiple sites and subsequent arrestin
binding. In the absence of arrestin, phosphorylated metarhodopsin is likely to be
dephosphorylated spontaneously. The dephosphorylated metarhodopsin is active and
may initiate the phototransduction cascade in the dark. Thus, arrestin binding is an
essential part of the phototransduction cascade and a reduction in the abundance of
arrestin protein should lead to a gain-of-function response.
23
siRNA delivery methods vary depending on the organism under investigation.
The double stranded RNA can be fed to C.elegans, injected in Xenopus oocytes, or
delivered through special delivery methods such as scrape-loading (123Timmons &
Fire; 1998; 124Nakano et al., 2000). We decided to add arrestin siRNA into the culture
medium. Although we observed some effects with this delivery method, to increase
accuracy, we decided to inject the siRNA into the cells. Consistent with our
predictions about the effects of arrestin silencing, we observed a 5-fold increase in
bump rate at 24 hrs after injection.
Since arrestin siRNA might increase unquenched metarhodopsin
concentration, we looked at tools to decrease active metarhodopsin concentration.
Metarhodopsin can be bleached by hydroxylamine, a very strong reducing agent. In
vertebrates, hydroxylamine competes with the opsin and attacks the chromophore at
the Schiff base linkage (125Crescitelli 1958). After binding to the chromophore, it
forms retinal oxime (C=NOH) and opsin. Hydroxylamine is more likely to attack the
Schiff base bond after photoisomerization of rhodopsin because the linkage in opsin
is shielded either by the phospholipid layer of the outer membrane or by being buried
within the hydrophobic portion of the opsin (126Abrahamson 1974). In rod
photoreceptors, hydroxylamine treatment destroys metarhodopsin and reduces the
light-induced bumps (127Leibrock & Lamb, 1997). The rate of breakdown of
metarhodopsin in the presence of hydroxylamine shows a half-time between 12 min
to 35 hr depending on the species and type of pigment being studied.

24
It is reasonable to suspect that, as in the case of vertebrates, hydroxylamine
acts in Limulus by competing with opsin for the Schiff base. Another hypothesis is
that probably an unstable intermediate photopigment (between rhodopsin and
metarhodopsin) is formed on photon absorption. In this intermediate, the bond
between the opsin and chromophore is momentarily broken and hydroxylamine
attaches to the chromophore at this instant. The result of either of these processes
would be breakdown of metarhodopsin in the presence of hydroxylamine.
Hydroxylamine affects two indicators of reduced metarhodopsin content. One is the
quantum efficiency to flashes of light. The second is the early receptor potential
(ERP). ERP occurs in the presence of intense bright light, has virtually no latency,
and is hypothesized to be generated directly by charge displacements that resulted
from the isomerization of rhodopsin (128Cone & Pak, 1971). Therefore, ERP is a
direct measure of the amount of rhodopsin and its intermediates present in the
photoreceptor. Hydroxylamine treatment in the ventral eye has been shown to
decrease the quantum efficiency, and abolish the ERP in response to flashes of light
(129Faddis and Brown 1992). This treatment was very effective in light but not in the
dark, further supporting the hypothesis that hydroxylamine destroys metarhodopsin.
Our aim was to use hydroxylamine to counteract any effects of unquenched
metarhodopsin in the presence of arrestin siRNA.
25
2.2 Materials and methods
2.2.1 Preparation of the nerve
The ventral nerve of adult male horseshoe crabs, Limulus polyphemus, was dissected
as described by Clark et al. The nerves were placed in artificial sea water (ASW) that
contained (in mM): 435 NaCl, 10 KCl, 20 MgCl2, 25 MgSO4, 10 CaCl2, and 10
HEPES. The nerves were desheathed, and treated with 1% pronase (Calbiochem, San
Diego, CA) for 1 min.
2.2.2 Preparation of siRNA
siRNA was produced in the laboratory of Dr. Barbara Battelle (The Whitney
Laboratory & The Department of Neuroscience, Univ. of Florida) using Ambion‟s
siRNA cocktail kit. A 314nt long piece of cDNA which is the 3‟ end of Limulus
arrestin gene from nt 926-1239 was used. dsRNA was produced by transcribing in the
same reaction mix two plasmids containing the target sequence: one plasmid had the
T7 promoter at the 5' end of the sequence; the other had the promoter at the 3' end.
After the transcription reaction, the products were annealed, treated with RNAse and
DNAse, and the double stranded product was purified. The product migrated as a
single band that was slightly larger than the 300 bp marker. 50ml of this purified
product contained about 1 mg/ml of RNA. About 15 mg of RNA was then cut with
RNAse III, and the cut pieces were purified. The yield was about 50 ml of 470 mg/ml
RNA or 52 mM siRNA.
26
The control siRNA was ordered from Ambion. The control siRNA was diluted
the same way as the arrestin siRNA and injected into cells.
2.2.3 siRNA treatment
In bath:
A Limulus ventral nerve was placed in a 200 µl well. The well was filled with
10 µl siRNA and 190 µl culture medium. A control preparation contained a nerve in a
dish with 200 µl culture medium and no siRNA. The nerves were kept in a cold room
(100 C) for four days covered in aluminum foil so that they were not exposed to light.
Injections:
siRNA was diluted to 1/1000 in a carrier solution (100mM potassium
aspartate, 10mM Hepes, pH 7.0). This siRNA was pulse-pressure injected into the
ventral photoreceptors with a glass electrode of 20MΩ resistance. All nerves were
kept in a culture medium in a cold room under 12 hrs light / 12 hrs dark conditions.
Control nerves with cells injected with the carrier solution alone were also treated
similarly.
2.2.4 Hydroxylamine treatment
Cells were chemically bleached with hydroxylamine to reduce their
metarhodopsin content (Faddis & Brown 1992). The protocol used is described in
27
Payne & Demas (2000). Briefly, a bleaching solution was prepared containing (mM)
200 hydroxylamine chloride (Sigma-Aldrich), 235 NaCl, 10 KCl, 20 MgCl2, 25
MgSO4, 10 CaCl2, 10 HEPES, adjusted to pH 6.5 with 10 N NaOH and cooled to 4°C.
Cells were bathed in this solution for 10 min under intense white light at 4°C (for
bleaching experiments) and in the dark at 4°C (for dark experiments). Nerves were
then washed four times at 10-min intervals with 50 ml ASW at 4°C.
2.2.5 Electrophysiology
The arrangement of light source and neutral density (ND) filters was similar
to that described in 130Wang et al., (2002). The unattenuated intensity of light was 80
mW/cm2. Other intensities are log10 units of attenuation of this intensity. Attenuation
by -10 log10 units typically elicited about one single photon event per second. Axon
laboratory‟s Axoscope 9 was used for data acquisition. A Digidata 1200 (Axon
instruments) analog-to-digital board installed in a personal computer was used, with
temporal filtering set to 300 Hz and digital sampling at 1 kHz.
The response of cells in the dark and to various intensities of light was
recorded with glass micropipettes containing carrier solution (resistance ~ 20MΩ).
The same micropipette was used to inject siRNA into the cells. The siRNA injected
cells were tested at 18, 20, 23, 24, and 48 hrs after injection. The cells were dark
adapted for about 30 min and their response in the dark was recorded. The dark
response was represented as the number of bumps/s. The cells were then exposed to
28
200ms flashes of light of varying intensities (log10 -6, -5, -4, -3, -2, -1 and 0). At these
intensities, we do not observe bumps but a single depolarization with amplitudes in
the range of -20 to -60mV. Every flash was followed by a period of complete
darkness until the cells recovered the dark-adapted state.
For experiments involving hydroxylamine treatment, in addition to the dark
and bright light responses as described above, bump rate in response to continuous
dim light for two min was also recorded. The dim light is represented as log10 -10
through -7.5 in increments of 0.5. Exposure to this intensity of light increases the
bump rate with increasing intensity. Every dim light exposure was followed by a
period of complete darkness till the cells recovered their dark-adapted state.
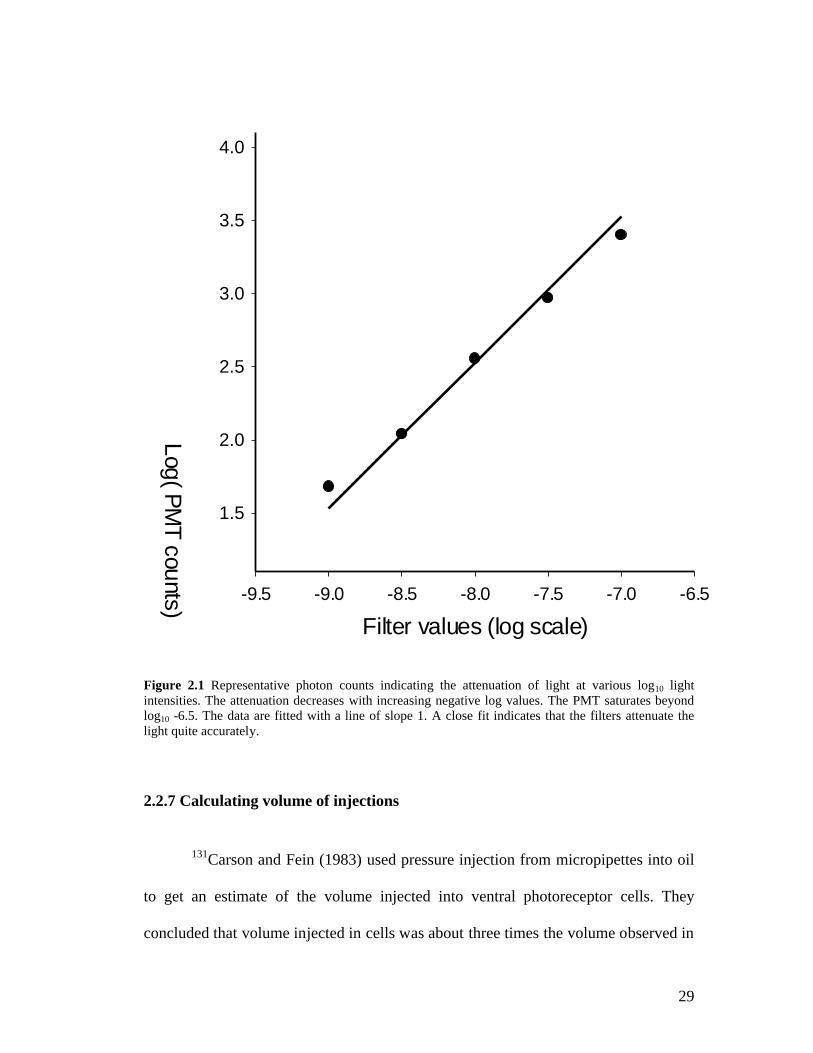
2.2.6 Estimation of photon counts corresponding to the different log10 light intensities.
In order to verify the accuracy of the ND filters, a photon multiplier tube (PMT) was
used to count the number of photons emitted when particular ND filters were used to
attenuate the light to specific log10 intensities. The results are fitted with a line of
slope one and shown in fig.2.1. This indicates a linear relationship between the
incident light and the number of photons counted by the PMT. This also indicates that
the filters attenuate the light quite accurately.
29
Filter values (log scale)-9.5 -9.0 -8.5 -8.0 -7.5 -7.0 -6.5
Log( PMT counts)
1.5
2.0
2.5
3.0
3.5
4.0
Figure 2.1 Representative photon counts indicating the attenuation of light at various log10 light intensities. The attenuation decreases with increasing negative log values. The PMT saturates beyond log10 -6.5. The data are fitted with a line of slope 1. A close fit indicates that the filters attenuate the light quite accurately.
2.2.7 Calculating volume of injections
131Carson and Fein (1983) used pressure injection from micropipettes into oil
to get an estimate of the volume injected into ventral photoreceptor cells. They
concluded that volume injected in cells was about three times the volume observed in
30
oil. In our experiments, we injected about 4 pl solution in oil/injection. This would
mean that at we injected about 12 pl solution in the cell/ injection. Since we injected
each cell 10 times, the total volume was about 120pl. This was about 1/5th the volume
of the cells. Since we injected about 55 M siRNA in a cell with an average volume of
550pl, concentration of siRNA in the cell was about 11 M.
2.2.8 Data analysis The traces were analyzed for the bump number and bump amplitude using an
in-house Matlab program developed by Mr. Murat Ayetikin. The program was
designed to calculate threshold by two methods. The first was a manual method
wherein the user manually clicked a point and all points above it were considered for
bump estimation. The second method was called the “boxing” method. In this
approach the user drew a box around the part of the trace where no bumps occurred.
The program then calculated the mean and standard deviation (SD) of that section. A
threshold for a bump was assigned as four SD above this mean. We initially used both
these methods to obtain threshold for about 10 traces. Once I verified that the
thresholds obtained via both the methods were similar, I used only the boxing method
for subsequent analysis.
Once the threshold was selected, the program detected peaks above this level
and determined their amplitude. A peak was determined as a highest value that had at
least 25 consecutive points in both directions with lower values. To avoid counting
multiple bumps, we also had a provision to discard a peak if it appeared within 80ms
of another peak on either side (since average bump duration was about 40ms).
31
Amplitude was the height of the peak from the threshold value. The bumps identified
in this manner were then assigned to various bins of 0.5mV amplitude. Individual
differences between the bump rates were measured using a t-test. Probability (p)
value of less than 0.05 was considered significant. To verify whether the bumps
obtained in different categories had similar properties, we calculated the power
spectra obtained from a fast Fourier transform (FFT) of the traces.
2.3 RESULTS
2.3.1 siRNA is membrane permeable in Limulus ventral photoreceptors:
dsRNA can be delivered to C. elegans by soaking the animals in a medium
containing dsRNA (132Tabara et al., 1998). If the siRNA can be delivered to ventral
photoreceptors just by adding it to the medium, it would keep the cells healthy and
undamaged. We tried to deliver siRNA by adding the siRNA to the culture medium
and testing the response of the cells through electrophysiological methods. Nerves
kept for 96 hrs in a culture medium without siRNA added to it were used as a control.
When the rate of dark bumps was compared between the two types of cells as in Fig.
2.2, those with siRNA in the medium had a rate of 3.4 + 0.8/s as compared to a dark
bump rate of 1.1 + 0.2/s in cells that were not exposed to siRNA. The peak response
of the siRNA treated cells was similar to control cells under bright light (log -3
through log 0 in increments of 1).
This led us to conclude that siRNA is membrane permeable. However, there
were two problems associated with this method. Firstly, there was a lot of variability
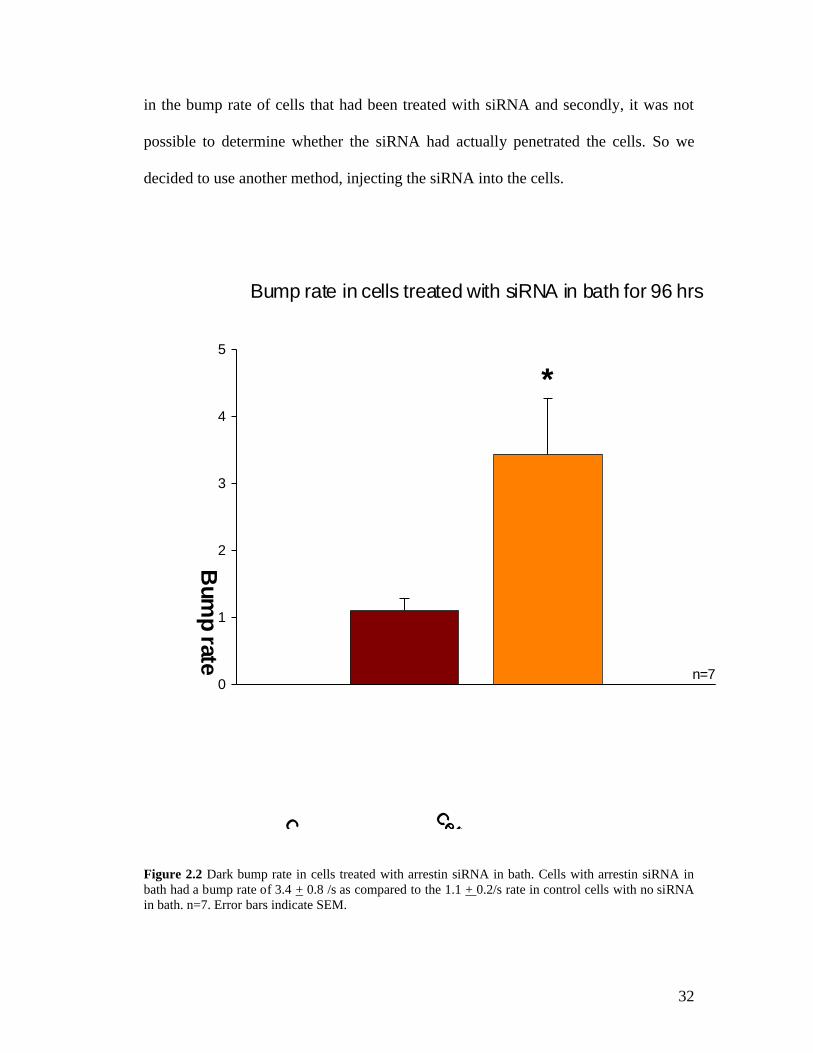
32
in the bump rate of cells that had been treated with siRNA and secondly, it was not
possible to determine whether the siRNA had actually penetrated the cells. So we
decided to use another method, injecting the siRNA into the cells.
Bump rate in cells treated with siRNA in bath for 96 hrs
Bum
p rate
0
1
2
3
4
5
Cells in culture medium
Cells in arrestin siRNA
*
n=7
Figure 2.2 Dark bump rate in cells treated with arrestin siRNA in bath. Cells with arrestin siRNA in bath had a bump rate of 3.4 + 0.8 /s as compared to the 1.1 + 0.2/s rate in control cells with no siRNA in bath. n=7. Error bars indicate SEM.
33
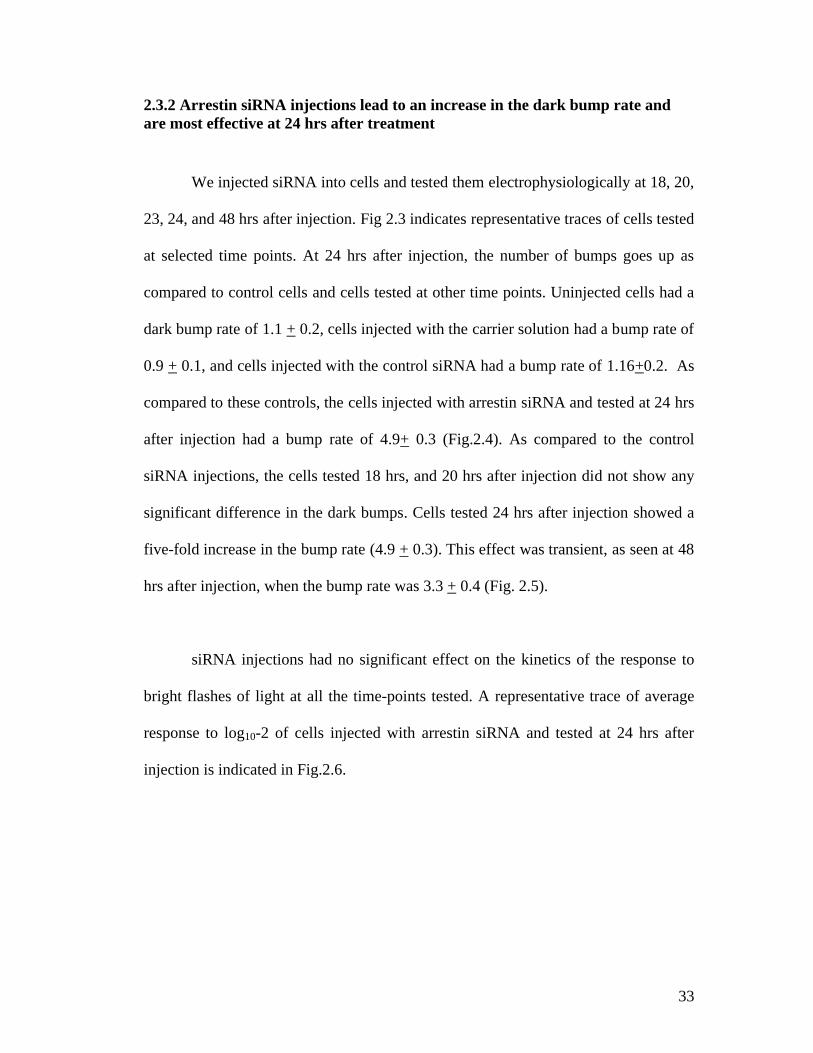
2.3.2 Arrestin siRNA injections lead to an increase in the dark bump rate and are most effective at 24 hrs after treatment
We injected siRNA into cells and tested them electrophysiologically at 18, 20,
23, 24, and 48 hrs after injection. Fig 2.3 indicates representative traces of cells tested
at selected time points. At 24 hrs after injection, the number of bumps goes up as
compared to control cells and cells tested at other time points. Uninjected cells had a
dark bump rate of 1.1 + 0.2, cells injected with the carrier solution had a bump rate of
0.9 + 0.1, and cells injected with the control siRNA had a bump rate of 1.16+0.2. As
compared to these controls, the cells injected with arrestin siRNA and tested at 24 hrs
after injection had a bump rate of 4.9+ 0.3 (Fig.2.4). As compared to the control
siRNA injections, the cells tested 18 hrs, and 20 hrs after injection did not show any
significant difference in the dark bumps. Cells tested 24 hrs after injection showed a
five-fold increase in the bump rate (4.9 + 0.3). This effect was transient, as seen at 48
hrs after injection, when the bump rate was 3.3 + 0.4 (Fig. 2.5).
siRNA injections had no significant effect on the kinetics of the response to
bright flashes of light at all the time-points tested. A representative trace of average
response to log10-2 of cells injected with arrestin siRNA and tested at 24 hrs after
injection is indicated in Fig.2.6.
34
Dark Bumps in RNAi injected cells
10mV 1s
Control
18 hrs after injection
24 hrs after injection
48 hrs after injection
Figure 2.3: Representative traces of bumps observed in different categories. Cells
were injected with siRNA and were tested at 18, 24, and 48 hours after injection. At
24 hrs after injection, the bump rate is almost 5 times higher than that in the control.
35
Bump rate after SiRNA injections at 24 hrs
Bum
p rate
0
1
2
3
4
5
6
Uninjected cellsInjected with carrier solution
Injected with coontrol SiRNA
Injected with arrestin RNA
*
n=7
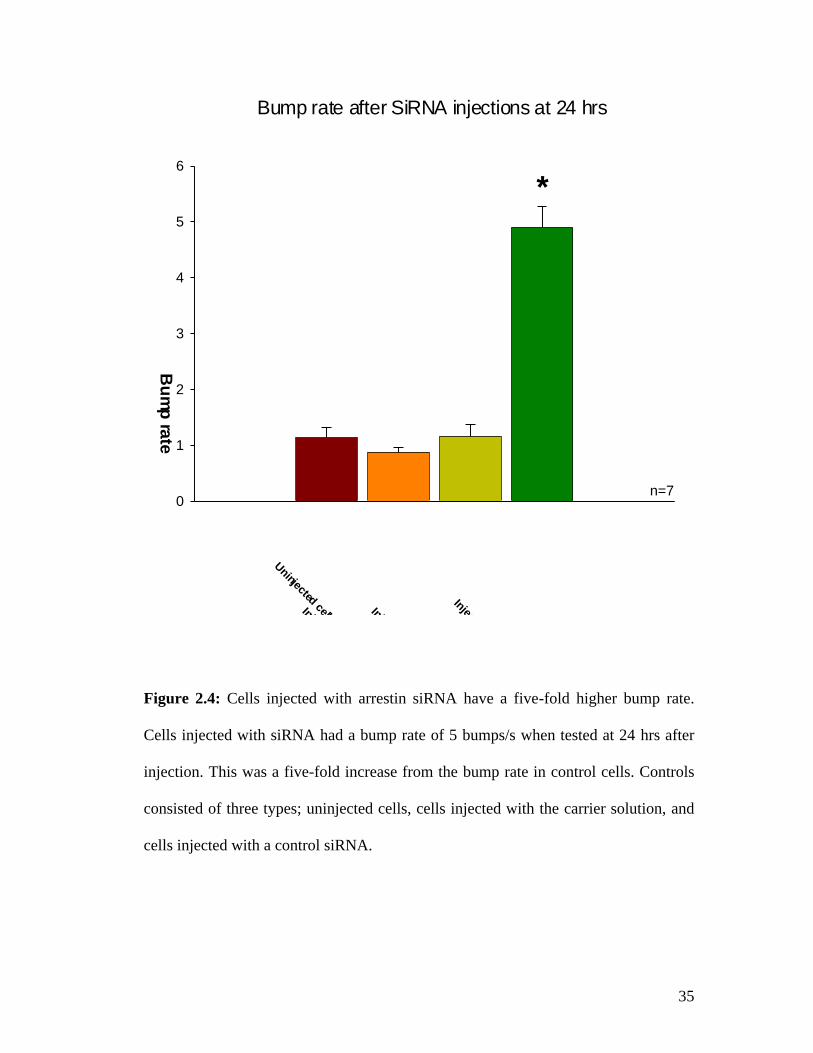
Figure 2.4: Cells injected with arrestin siRNA have a five-fold higher bump rate.
Cells injected with siRNA had a bump rate of 5 bumps/s when tested at 24 hrs after
injection. This was a five-fold increase from the bump rate in control cells. Controls
consisted of three types; uninjected cells, cells injected with the carrier solution, and
cells injected with a control siRNA.
36
RNAi treatment is most effective at 24 hrs after injection
Bum
ps/s
0
1
2
3
4
5
6
Control siRNA at 24 hrs
Arrestin siRNA at 18 hrs
Arrestin siRNA at 20 hrs
Arrestin siRNA at 23 hrs
Arrestin siRNA at 24 hrs
Arrestin siRNA at 48 hrs
**
*
n=9
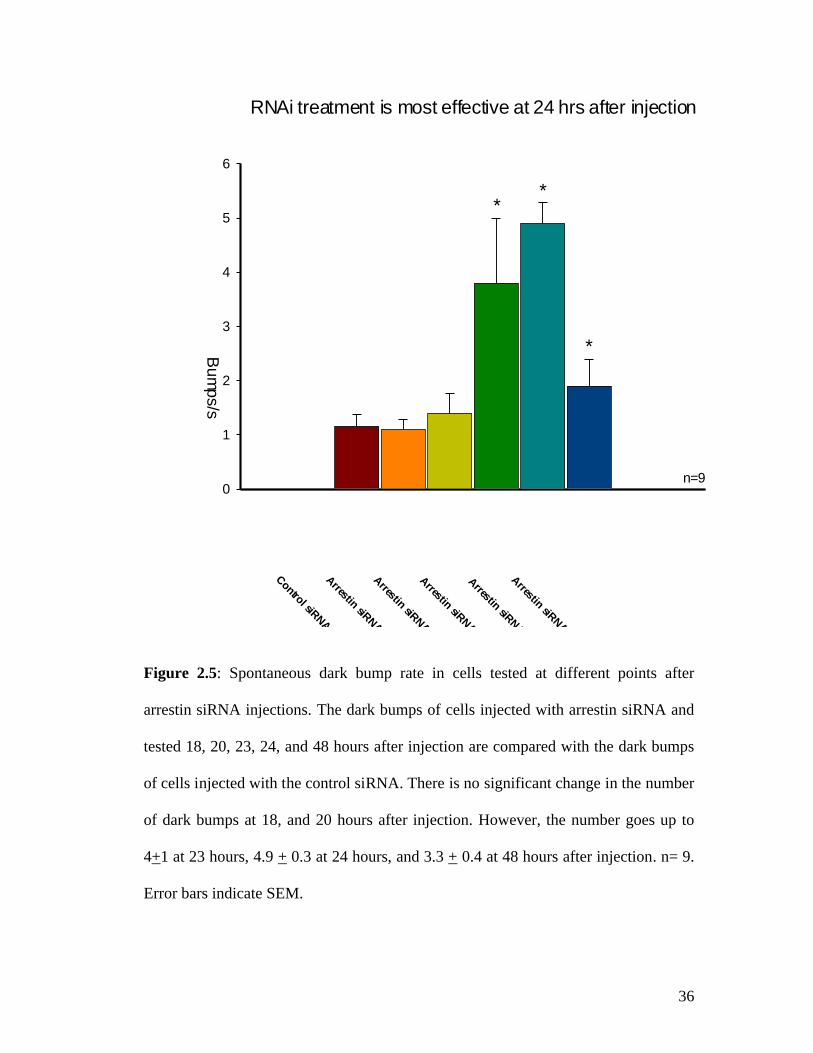
Figure 2.5: Spontaneous dark bump rate in cells tested at different points after
arrestin siRNA injections. The dark bumps of cells injected with arrestin siRNA and
tested 18, 20, 23, 24, and 48 hours after injection are compared with the dark bumps
of cells injected with the control siRNA. There is no significant change in the number
of dark bumps at 18, and 20 hours after injection. However, the number goes up to
4+1 at 23 hours, 4.9 + 0.3 at 24 hours, and 3.3 + 0.4 at 48 hours after injection. n= 9.
Error bars indicate SEM.
37
Mean response to 200 ms flashes of log10 -2 light
Control
RNAi injected
1s
10mV
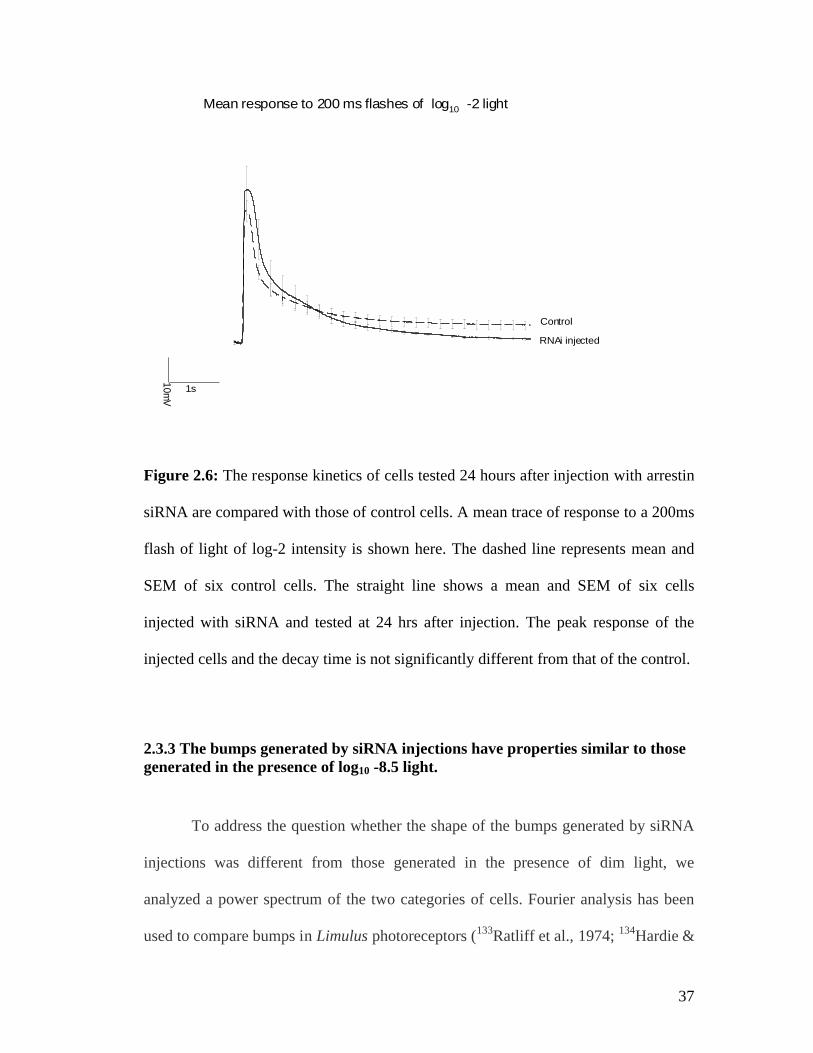
Figure 2.6: The response kinetics of cells tested 24 hours after injection with arrestin
siRNA are compared with those of control cells. A mean trace of response to a 200ms
flash of light of log-2 intensity is shown here. The dashed line represents mean and
SEM of six control cells. The straight line shows a mean and SEM of six cells
injected with siRNA and tested at 24 hrs after injection. The peak response of the
injected cells and the decay time is not significantly different from that of the control.
2.3.3 The bumps generated by siRNA injections have properties similar to those generated in the presence of log10 -8.5 light.
To address the question whether the shape of the bumps generated by siRNA
injections was different from those generated in the presence of dim light, we
analyzed a power spectrum of the two categories of cells. Fourier analysis has been
used to compare bumps in Limulus photoreceptors (133Ratliff et al., 1974; 134Hardie &
38
Minke, 1994). Fig. 2.7 is a power spectrum plot of mean traces from two categories
of cells. One set of traces is from the cells injected with siRNA and their response
recorded in the dark. The second set of traces is from control cells exposed to dim
light (log -8.5). This light intensity was selected because it resulted in a bump rate of
about 5/s in control cells which is similar to the spontaneous dark bump rate in cells
injected with siRNA. Traces from bumps generated by siRNA injections have a
power spectrum similar to that of traces from bumps generated in dim light. This
indicates that siRNA induced bumps and light-induced bumps may have similar
properties.
39
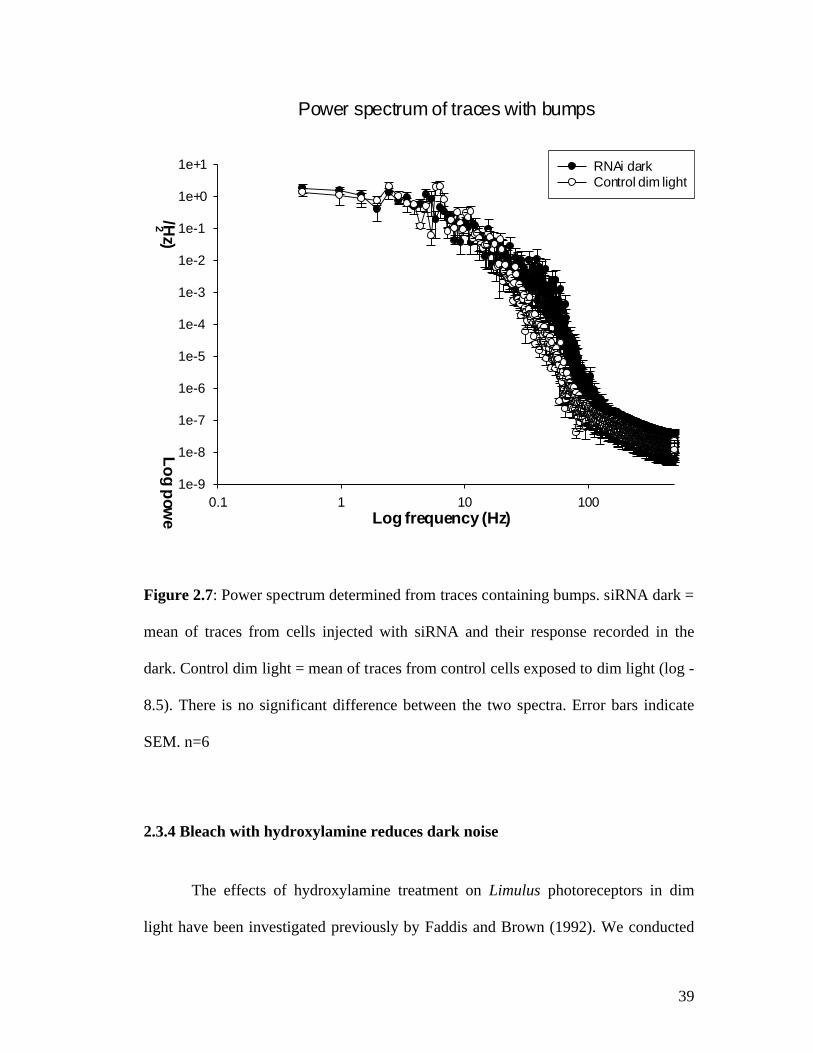
Power spectrum of traces with bumps
Log frequency (Hz)0.1 1 10 100
Log power spectral density (m
V2 /H
z)
1e-9
1e-8
1e-7
1e-6
1e-5
1e-4
1e-3
1e-2
1e-1
1e+0
1e+1 RNAi darkControl dim light
Figure 2.7: Power spectrum determined from traces containing bumps. siRNA dark =
mean of traces from cells injected with siRNA and their response recorded in the
dark. Control dim light = mean of traces from control cells exposed to dim light (log -
8.5). There is no significant difference between the two spectra. Error bars indicate
SEM. n=6
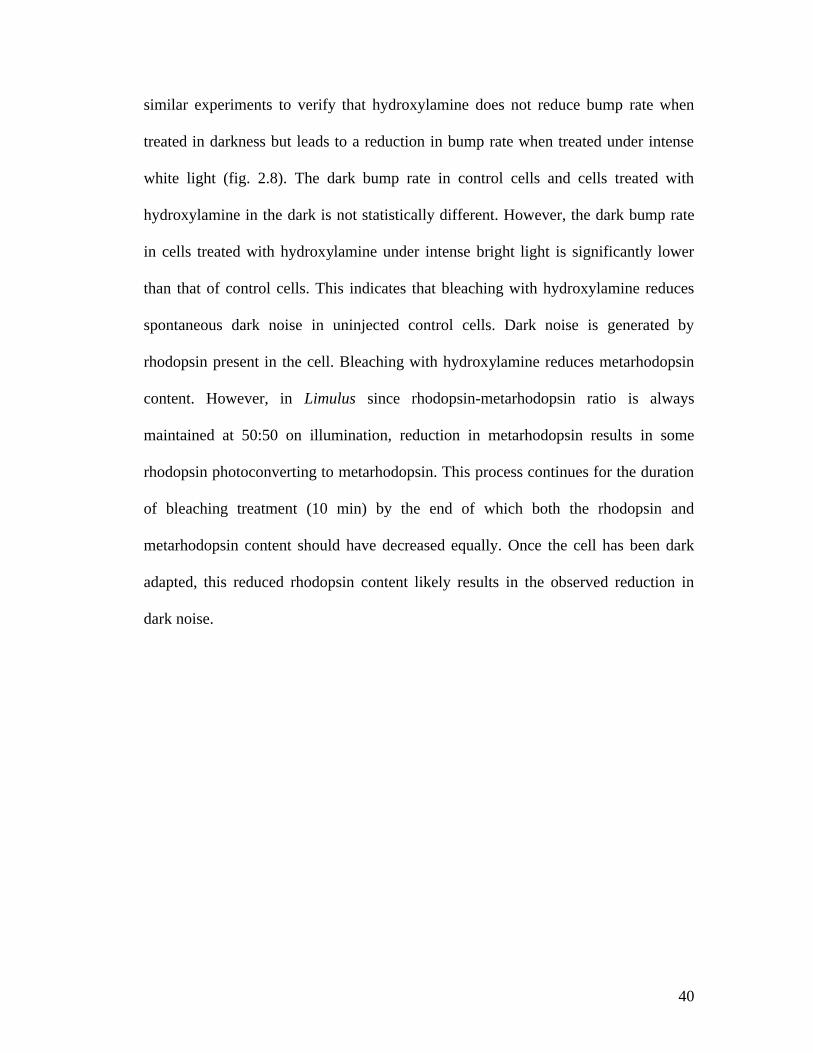
2.3.4 Bleach with hydroxylamine reduces dark noise
The effects of hydroxylamine treatment on Limulus photoreceptors in dim
light have been investigated previously by Faddis and Brown (1992). We conducted
40
similar experiments to verify that hydroxylamine does not reduce bump rate when
treated in darkness but leads to a reduction in bump rate when treated under intense
white light (fig. 2.8). The dark bump rate in control cells and cells treated with
hydroxylamine in the dark is not statistically different. However, the dark bump rate
in cells treated with hydroxylamine under intense bright light is significantly lower
than that of control cells. This indicates that bleaching with hydroxylamine reduces
spontaneous dark noise in uninjected control cells. Dark noise is generated by
rhodopsin present in the cell. Bleaching with hydroxylamine reduces metarhodopsin
content. However, in Limulus since rhodopsin-metarhodopsin ratio is always
maintained at 50:50 on illumination, reduction in metarhodopsin results in some
rhodopsin photoconverting to metarhodopsin. This process continues for the duration
of bleaching treatment (10 min) by the end of which both the rhodopsin and
metarhodopsin content should have decreased equally. Once the cell has been dark
adapted, this reduced rhodopsin content likely results in the observed reduction in
dark noise.
41
Log light intensitydark -10 -9 -8 -7 -6
Bum
ps/s
0
1
2
3
4
Hydroxylamine dark
Control
Hydroxylamine bleach
Hydroxylamine can be used to reduce metarhodopsin content
Figure 2.8: Effect of hydroxylamine treatment on control cells. Uninjected control
cells were treated with hydroxylamine in the dark and in the light. The bump rate was
tested at dim light intensities. Hydroxylamine treatment in the dark had no significant
effect on the bump rate of cells. However, bleach with hydroxylamine in intense
bright light led to a reduction in sensitivity to light.
2.3.5 The effects of hydroxylamine are consistent with an attack on metarhodopsin but not rhodopsin.
Hydroxylamine treatment in the dark has been shown to have no effect on the
light-induced bump rate of control cells (Faddis and Brown, 1992). We observed that
42
after treatment with hydroxylamine in the dark, there is no reduction in the dark
bumps generated by the uninjected control cells. Since hydroxylamine attacks
metarhodopsin and does not affect rhodopsin, this result confirms that dark bumps in
control cells do not originate from metarhodopsin. We also tested the effect of
treating cells with hydroxylamine in the dark on the bump rate in cells injected with
the arrestin siRNA. Representative traces from control cells, cells injected wit arrestin
siRNA, and injected cells treated with hydroxylamine are shown in Fig. 2.9. We
measured the dark bump rate in control cells before and after hydroxylamine
treatment, and in injected cells before and after hydroxylamine treatment. The bump
rate in injected cells treated with hydroxylamine (1.1 + 0.2) was educed significantly
from that at 24hr after injection (5 + 0.4). The bump rate of control cells before and
after treatment was 1.4 + 0.1 and 1.2 + 0.1 respectively (Fig. 2.10).
Since hydroxylamine reduces the concentration of metarhodopsin, the
corresponding reduction in bump rate in hydroxylamine – treated cells is indicative of
metarhodopsin being the source of these bumps. The bump rate after treatment is
almost indistinguishable from that of pre-treatment in uninjected control cells. This
indicates that the hydroxylamine treatment probably led to the dissociation of the
excess metarhodopsin that was generated as a result of the RNAi treatment.
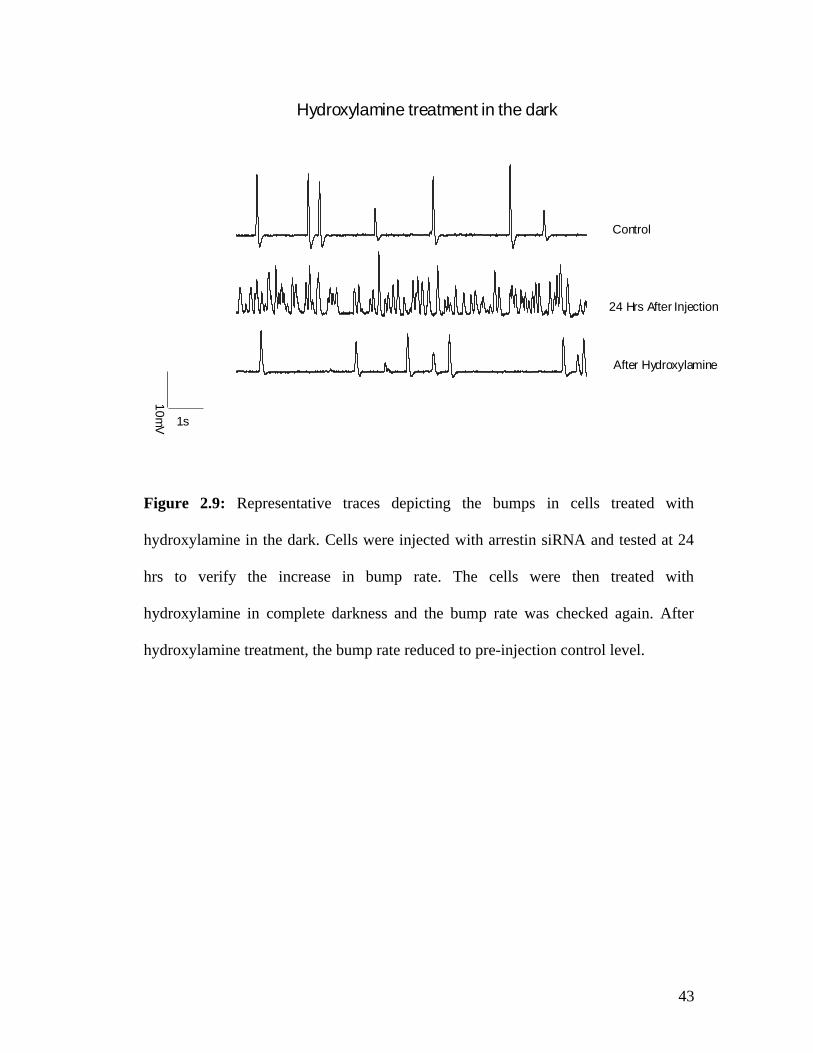
43
Hydroxylamine treatment in the dark
Control
24 Hrs After Injection
After Hydroxylamine
10mV 1s
Figure 2.9: Representative traces depicting the bumps in cells treated with
hydroxylamine in the dark. Cells were injected with arrestin siRNA and tested at 24
hrs to verify the increase in bump rate. The cells were then treated with
hydroxylamine in complete darkness and the bump rate was checked again. After
hydroxylamine treatment, the bump rate reduced to pre-injection control level.
44
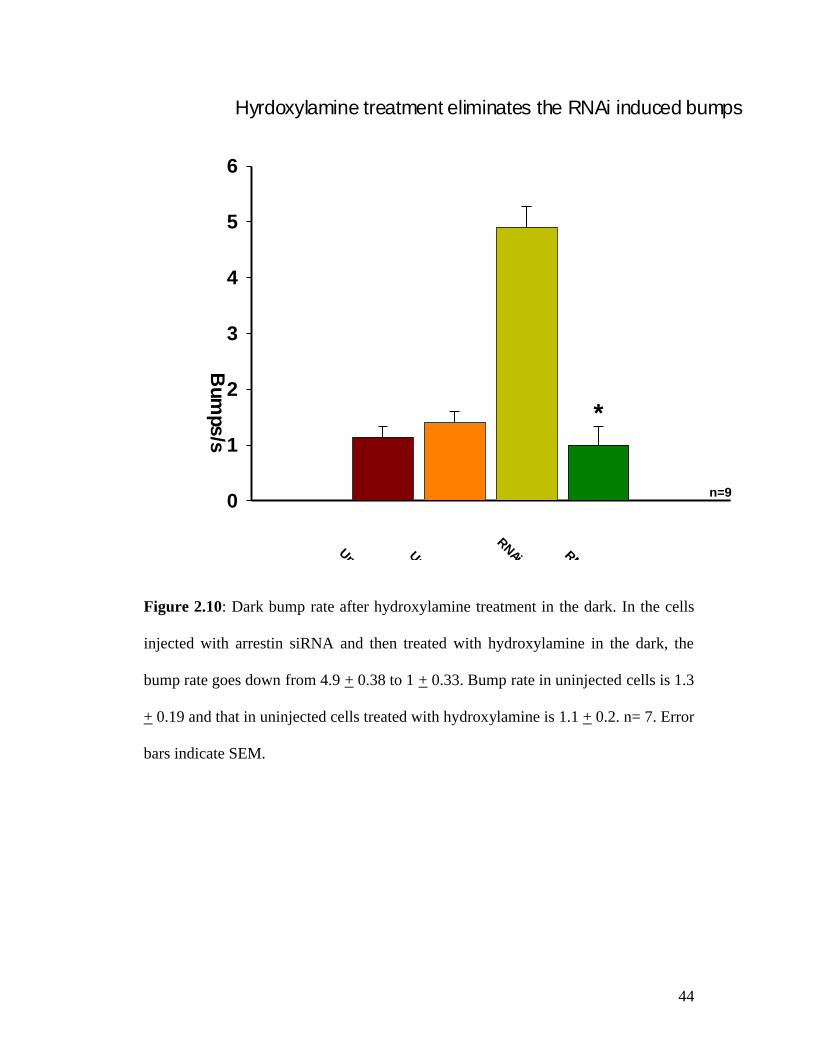
Hyrdoxylamine treatment eliminates the RNAi induced bumps
Bum
ps/s
0
1
2
3
4
5
6
Uninjected
Uninj + Hyd
RNAi injRNAi + Hyd
n=9
*
Figure 2.10: Dark bump rate after hydroxylamine treatment in the dark. In the cells
injected with arrestin siRNA and then treated with hydroxylamine in the dark, the
bump rate goes down from 4.9 + 0.38 to 1 + 0.33. Bump rate in uninjected cells is 1.3
+ 0.19 and that in uninjected cells treated with hydroxylamine is 1.1 + 0.2. n= 7. Error
bars indicate SEM.
45
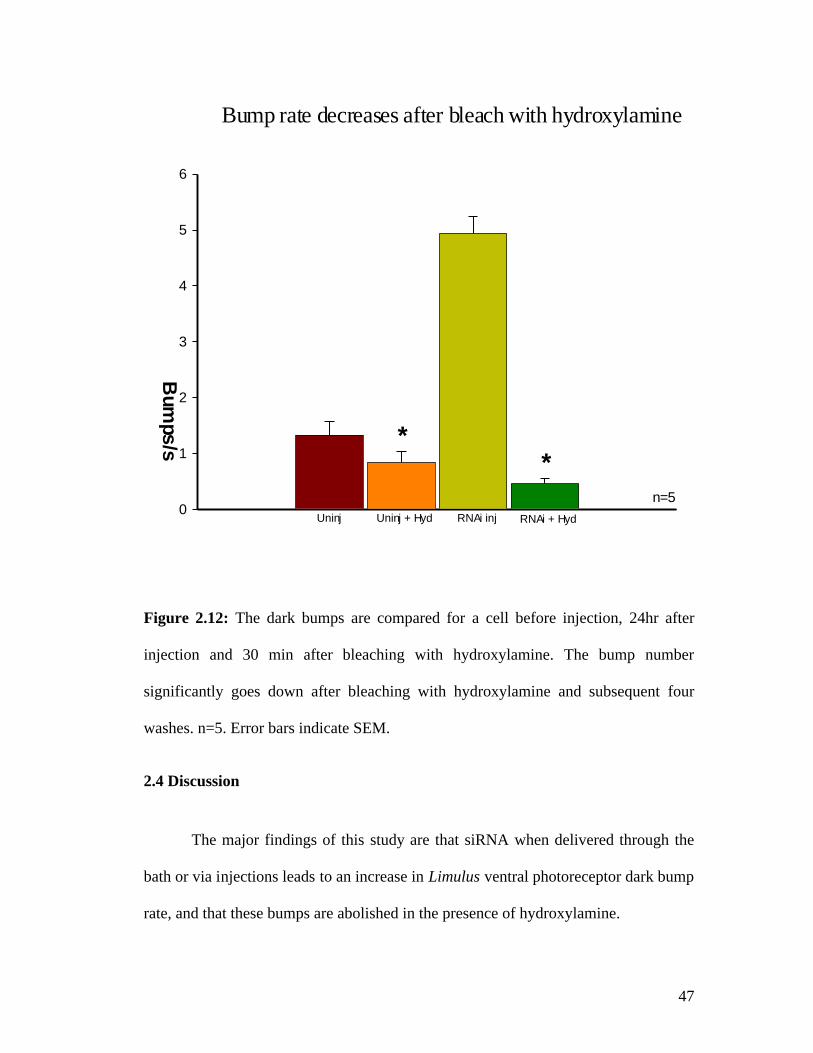
2.3.6 siRNA injected cells bleached with hydroxylamine show a marked decrease in dark bumps.
We studied the effect of bleach with hydroxylamine on the cells injected with
arrestin siRNA. The dark noise in uninjected cells was recorded. These cells were
then injected with siRNA, and after 24hrs, the dark noise was recorded again to verify
the increase in bumps. Then these cells were bleached with hydroxylamine in the
presence of intense bright light for 10 min. After several washes, the dark noise of the
cells was recorded again. Representative traces are depicted in Fig. 2.11. As indicated
in Fig. 2.12, the bump rate in bleached cells (0.4 + 0.1) was reduced significantly
from that at 24hr after injection (4.8 + 0.3). In uninjected control cells, the bump rate
after bleach (0.8 + 0.2) was also lower than that of pre-bleach (1.3 + 0.2).
During 10 min of bleaching, the hydroxylamine is expected to inactivate
metarhodopsin by binding to all-trans retinal. This will reduce the metarhodopsin
concentration in the cell. In bright light, some rhodopsin is expected to convert to
metarhodopsin. This metarhodopsin is again attacked by the hydroxylamine. Since
rhodopsin-metarhodopsin is at equal ratio in vivo, we may see a decrease in
rhodopsin content as well. As this process continues, the content of both rhodopsin
and metarhodopsin is decreased. The reduction in bump rate occurs due to
elimination of bumps generated by unquenched metarhodopsin, and the bumps
generated by some rhodopsin.
46
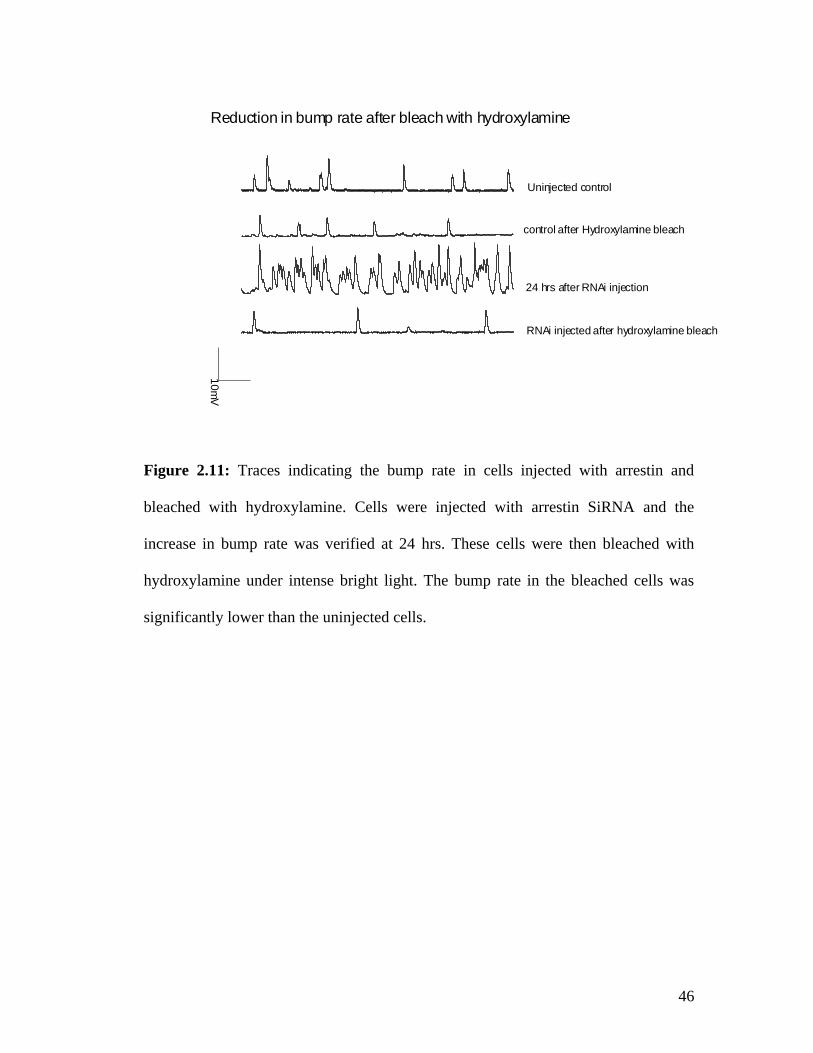
Reduction in bump rate after bleach with hydroxylamine
Uninjected control
control after Hydroxylamine bleach
24 hrs after RNAi injection
RNAi injected after hydroxylamine bleach
10mV
Figure 2.11: Traces indicating the bump rate in cells injected with arrestin and
bleached with hydroxylamine. Cells were injected with arrestin SiRNA and the
increase in bump rate was verified at 24 hrs. These cells were then bleached with
hydroxylamine under intense bright light. The bump rate in the bleached cells was
significantly lower than the uninjected cells.
47
Uninj Uninj + Hyd RNAi inj RNAi + Hyd
Bum
ps/s
0
1
2
3
4
5
6
Bump rate decreases after bleach with hydroxylamine
**
n=5
Figure 2.12: The dark bumps are compared for a cell before injection, 24hr after
injection and 30 min after bleaching with hydroxylamine. The bump number
significantly goes down after bleaching with hydroxylamine and subsequent four
washes. n=5. Error bars indicate SEM.
2.4 Discussion
The major findings of this study are that siRNA when delivered through the
bath or via injections leads to an increase in Limulus ventral photoreceptor dark bump
rate, and that these bumps are abolished in the presence of hydroxylamine.
48
2.4.1 Injecting siRNA is the optimum delivery method.
Delivery methods vary widely. siRNA can be fed, injected, or scrape loaded
into cells. Although in Limulus ventral photoreceptors arrestin siRNA in bath seems
to have the expected effect on the dark noise, we observed considerable levels of
variability in the response. This could result probably because of the variation in
positioning of cells on the nerve. Some cells are more accessible than others. The
nerve is treated with pronase before the treatment. The pronase cleaves the peptide
bonds in the glia that surround the photoreceptor cells on the optic nerve. However,
this action of pronase might not be uniform and could affect accessibility to the
photoreceptor cells. These factors might lead to varying amounts of siRNA entering
into the cells and might account for the observed variability of response. Also, the
only verification of the success of the technique was the electrophysiological data.
There was no independent confirmation of the success of the RNAi technique since
we could not mark the cells that had taken up the siRNA. We therefore decided to
inject cells with the arrestin siRNA. This allowed us to estimate the amount of siRNA
injected into the cells (~11nM) and later also allowed us to mark the cells that had
been injected. With injections, we also had an internal control of uninjected cells
from the same nerve.
2.4.2 Increased bump rate after siRNA injections gives an estimate of arrestin turnover rate.
We expected the arrestin RNAi injections to be effective if the turnover rate of
arrestin was high since the RNAi affects the levels of freshly made protein and has no
49
effect on the pre-existing protein in the system. The turnover rate of arrestin protein
varies from one organism to another. Over a 24 hr (12h D/12h N) cycle, diurnal
rhythms of arrestin mRNAs have been observed in mice, rats, fish, and toads
(135Bowes et al., 1988; 136Craft et al., 1990; 137McGinnis et al., 1990; 138Korenbrot et
al., 1989). On the other hand, there is no change in arrestin mRNA levels over a 24hr
period in Drosophila, and Xenopus (139Hartman et al., 2001; 140Green and Besharse,
1996). In Limulus, arrestin protein turnover has not been determined. Light causes a
reversible movement of the arrestin protein to the photosensitive membrane. Light-
driven shedding of the rhabdomeral membrane probably involves arrestin (141Sacunas
et al., 2002). Arrestin mRNA levels are regulated mostly by clock input. Levels of
arrestin mRNA are higher during the day in the light than during the night in the dark
(142Battelle et al., 2000). In mice, levels of arrestin biosynthesis mimic the mRNA
levels (143Agarwal et al., 1994). In Limulus too, changes in arrestin mRNA levels may
reflect changes in the protein levels. In the present study, we observed a maximum
effect of arrestin siRNA injections at 24 hrs.
At 48 hrs after injections, we observed a decline in the bump rate from that at
24 hrs after injections. siRNA gets amplified once it is inside cells. The decrease in
bump rate could be indicative of deleterious effects of high siRNA concentration. It
could also be due to the degradation of siRNA inside the cells. There is no direct
evidence to indicate either of the two possibilities.
50
2.4.3 Excess bumps are probably caused by unquenched metarhodopsin.
The source of these bumps was of interest to us. The increase in bump rate was
probably caused due to the presence of unquenched metarhodopsin in the
photoreceptors. Hydroxylamine is often used to reduce metarhodopsin concentration
pharmacologically since it competes for the chromophore, retinal. We treated siRNA-
injected cells with hydroxylamine and observed that the bump rate went down to
about 1/s which is similar to control levels. In the presence of siRNA, there was a
high concentration of unquenched metarhodopsin present in the cell and this
presumably led to an increase in bump rate. After hydroxylamine treatment, the
metarhodopsin concentration was decreased and the bump rate also was reduced.
Since the RNAi-induced bumps in toads are generated by metarhodopsin, a decrease
in the bump rate in the ventral photoreceptors could be indicative of a decrease in
metarhodopsin concentration (144Leibrock and Lamb, 1997).
2.4.4 Equal rhodopsin and metarhodopsin ratio in Limulus results in a decrease in spontaneous dark bumps after bleach with hydroxylamine.
When hydroxylamine was administered in the presence of intense bright light,
there was a decrease in the spontaneous dark bump rate in cells injected with arrestin
siRNA. This decrease was significantly lower than the spontaneous bump rate in the
control cells. This can be explained if we consider that in Limulus photoreceptors the
ratio of rhodopsin and metarhodopsin is always maintained at 50:50 in the light. In
51
this set of experiments, we expect arrestin levels to go down due to siRNA injections.
Pharmacologically the injections cause an increase in unquenched metarhodopsin.
The unquenched metarhodopsin could be destroyed by hydroxylamine treatment. This
could skew the ratio towards rhodopsin. The intense bright light could aid in
converting large amounts of rhodopsin into metarhodopsin and the ratio could be
maintained. In this process, however, the total amount of both rhodopsin and
metarhodopsin would be reduced than in the dark state. Since the dark bumps are
generated in part by rhodopsin in toads, the spontaneous dark bumps after bleach with
hydroxylamine in Limulus will probably be lower than those in the dark-adapted state
(145Baylor et al., 1980).
2.4.5 siRNA injections do not abolish bump rates completely.
In the above experiments, I did not observe a difference in the peak amplitude or
the kinetics of falling phase in response to flashes of bright light. This could be due to
two reasons. Firstly, metarhodopsin may be partially deactivated when it is
phosphorylated. So even in the absence of arrestin, the phosphorylated metarhodopsin
is quenched to a large extent and the falling phase of the light is not significantly
affected. Secondly, the reduction in arrestin content might not be sufficient to leave a
large number of metarhodopsin molecules unquenched. A similar phenomenon has
been observed in arrestin mutant mice (146Xu et al., 1997). The heterozygous mutants
with 33% arrestin protein showed no change in response to light. On the other hand,
the null homozygous mutants showed an abnormal falling phase in response to light
while the rising phase of light response was unaffected. In Drosophila arrestin
mutants, there was no change in response to bright light when the arrestin1 expression
52
was reduced to 10% and 80% respectively (147Dolph et al., 1993). However, when the
expression of the dominant arrestin, arrestin2 was reduced to 10%, a prolonged
depolarized afterpotential (PDA) was observed. This confirms the idea that only a
drastic change in arrestin concentration will sufficiently change the concentration of
unquenched metarhodopsin that would affect the falling phase of the response.
2.4.6 siRNA technique can be a very powerful tool to study Limulus phototransduction.
Our experiments indicate that using siRNA might be a feasible option for
manipulating the concentration of the proteins involved in Limulus phototransduction.
This method can be used to explore the function of trp and cGMP genes that have
been sequenced in our lab. siRNA has opened the doors for exploration of a large
number of processes in vertebrates and invertebrates alike. The feasibility of siRNA
as a potential therapeutic drug is being explored. RNAi in Limulus has the potential to
be a very powerful tool that can be used to understand the transduction mechanisms
better.
53
Chapter 3
Inhibiting Limulus arrestin and opsin gene expression using Morpholino Antisense Oligonucleotide
3.1 Introduction
The ventral photoreceptor cells of the horseshoe crab Limulus polyphemus are
highly suitable for studying phototransduction. Their large size renders them ideal for
single-unit recordings. They are also amenable to other techniques such as
immunocytochemistry and microscopy. However, genetic studies have not been
possible so far because the animal takes about 10 years to mature.
We decided to use morpholino oligonucleotides to silence target genes
functionally to overcome the problem of genetic manipulation. Phosphorodiamidate
morpholino oligomers (PMOs) are potent antisense molecules used to inhibit gene
expression by preventing translation or by inhibiting pre-mRNA splicing
(148Summerton & Weller, 1997;149 Summerton, 1999). PMOs differ from DNA in that
they have a nonionic phosphorodiamidate intersubunit linkage instead of the
negatively charged phosphorodiester linkage, and have a six-membered morpholine
moiety (morpholine = C4H9NO) instead of a five-membered deoxyribose ring. The
neutral nature of non-ionic PMOs overcomes the limitations of traditional nucleotides
in that they are not toxic at high concentrations, do not have non-specific interactions
with cellular proteins, and are more amenable to delivery in conjugation with cationic
54
peptides (150Iversen, 2001;151 Summerton et al., 1997). The morpholine ring renders
them resistant to enzymes and degradation (152Hudziak et al., 1996). In spite of these
differences, they bind to complementary sequences by Watson-Crick pairing. These
and other properties have made morpholinos very popular in the past decade,
especially in the field of vertebrate developmental biology (153Heasman, 2002). They
have been used in Xenopus laevis, Zebrafish, Sea urchin, and snails (154Haesman,
2000; 155Nasevicius & Ekker, 2000; 156Howard et al., 2001; 157Bogulavsky et al.,
2003). We decided to use this technique on two target proteins; arrestin and opsin.
Arrestin is a protein involved in quenching of metarhodopsin. Metarhodopsin
is formed by photoconversion of rhodopsin in which the chromophore 11-cis-retinal
isomerizes to form all-trans-retinal. Metarhodopsin initiates excitation and the
ensuing cascade of events results in a change in membrane potential. It was first
shown in vertebrates that quenching of metarhodopsin is a two-step process. Firstly,
metarhodopsin gets phosphorylated by rhodopsin kinase and subsequently it binds to
arrestin for complete silencing of activity (158Kuhn et al., 1984; 159Palczewski &
Benovic, 1991). In Drosophila, genes encoding two types of visual arrestins have
been isolated, arrestin 1 (arr1) and arrestin 2 (arr2) (160Hyde et al., 1990; 161Smith et
al., 1990; 162Levine et al., 1990). Arrestin in Drosophila mimics its role in
vertebrates. Severe arrestin mutants cause a prolonged depolarizing afterpotential
(PDA) indicating their role in metarhodopsin inactivation (163Dolph et al., 1993).
55
Dark noise in Limulus is seen in the form of events called “bumps”. The
bumps appear as small (1-10mV) depolarizing events. To reduce noise,
metarhodopsin needs to be kept quenched. Since arrestin is involved in inactivating
metarhodopsin, arrestin plays an important role in reducing noise. The question
addressed here is whether injecting arrestin morpholino into the Limulus ventral
photoreceptor would reduce the arrestin mRNA. If it does, the arrestin protein
concentration would go down and we would observe an increase in noise levels. To
complement these studies, we decided to use opsin. A reduction in opsin protein
content would presumably lead to a reduction in sensitivity to light, and decrease dark
noise.
There is one known arrestin gene in Limulus and two opsin genes (opsin1 &
opsin2) (164Smith et al., 1995; 165Smith et al., 1993). The morpholinos were designed
against the region near the start codon. The sequence of this region is identical in the
two Limulus opsin genes so we expect the morpholino sequence to target both these
genes. We injected known concentrations of the morpholinos into the ventral
photoreceptors and used predicted changes in the dark noise and sensitivity to light as
a measure of success. We observed an increase in dark noise in the presence of
arrestin morpholino and a decrease in sensitivity to light in the presence of opsin
morpholino.
56
3.2 MATERIALS and METHODS
3.2.1 Preparation of the nerve
Adult male horseshoe crabs, Limulus polyphemus, measuring about 5-7 inches
across the carapace were obtained from the Marine Biological Laboratory, Woods
Hole, Massachusetts. The crabs were maintained on a 12 hr light/dark cycle. The
ventral nerve was dissected as described by 166Clark et al. (1969). The nerves were
kept in artificial sea water (ASW) that contained (in mM): 435 NaCl, 10 KCl, 20
MgCl2, 25 MgSO4, 10 CaCl2, and 10 HEPES. The nerves were desheathed, and
treated with 1% pronase (Calbiochem, San Diego, CA) for 1 min.
3.2.2 Morpholino injections
Three different morpholinos were used in this study. One was directed against
the 16-40 nt of Limulus arrestin and had the sequence 5‟-
AATCATTGGGCTGCCGTTTTACTTT -3‟. A second morpholino was directed
against 16-40 nt of Limulus opsin and had a sequence of 5‟-
GGCATTACCATTAGTTGACTCGAT-3‟. The third morpholino was an unrelated
standard control 5‟-CCTCTTACCTCAGTTACAATTTATA-3‟. All morpholinos
were designed and prepared by Gene Tools (Philomath, OR, USA).
Three concentrations of all of these PMOs were injected into cells, 0.1 µM, 1
µM, and 10 µM, all diluted in a carrier solution (100mM potassium aspartate, 10 mM
57
Hepes, pH 7.0). PMO was delivered into the cells by pulse-pressure injections with a
glass micropipette of 20MΩ resistance. The nerves were kept in a moist chamber
covered with aluminum foil at 100C. Control nerves with cells injected with the
carrier solution were also treated similarly.
Ten injections were made in each cell with a total volume of injected solution
being ~ 120pl. This resulted in a final concentration of ~17pl inside the cell. The
reliability of the injections was monitored by observing a disturbance in the cell‟s
cytoplasm with each pressure pulse.
3.2.3 Electrophysiology
A glass micropipette containing PMO (resistance ~ 20MΩ) was used to test
the bump rate before injections. The cells were kept in the dark for about 30 min so
that their bump rate was at the dark adapted level (1/s). Arrangement of light source
and neutral density (ND) filters was similar to that described in 167Wang et al.,
(2002). Attenuation by log10 -10 typically elicited about one single photon event per
second. Before exposing the cells to the next flash of light, the cells were kept in dark
till the spontaneous bump rate recovered to that of dark-adapted state.
The spontaneous dark bump rate, bump rate in response to dim light, and
membrane depolarization in response to bright light were recorded for uninjected
cells. The same micropipette was used to inject morpholino into cells. The cells were
kept in a chamber covered with aluminum foil at 10oC. At 24, 48, 72, 96, 108, 120,
58
and 144 hrs after injections (n = at least 6), the injected and uninjected cells were
tested for the spontaneous dark bump rate, bump rate in response to dim light, and
membrane depolarization in response to bright light
3.2.4 Immunocytochemistry
The anti-arrestin and anti-opsin antibodies were a generous gift from Dr.
Barbara Battelle (The Whitney Laboratory & The Department of Neuroscience, Univ.
of Florida). The antibody treatment protocol as described in Battelle at al., (2001) was
used. Briefly, nerves left in the modified organ culture medium (MOCM) overnight in
the dark were treated with 4% paraformaldehyde and 0.1M PBS for 2 hrs. They were
then washed with PBS, permeabilized by incubation for 1 hour with PBST (PBS plus
0.1% Triton X-100), blocked for 1 hour with PBST containing 2% BSA and 2%
normal goat serum, and rinsed with 2% BSA in PBST (PBST/BSA).The nerves were
then incubated for 1 hour at room temperature with 1:200 dilutions of the primary
antibodies in PBST/BSA, and rinsed three times with PBST/BSA. The secondary
antibody conjugated to Molecular Probes' Alexa Fluor 488 fluorescent dye was
diluted 1:200 in PBST/BSA. The nerves were incubated with this antibody for 1 hr at
room temperature. Finally, the nerves were rinsed three times with PBS.
Immunofluorescence staining was detected using a Zeiss LSM 510 laser-scanning
confocal microscope.
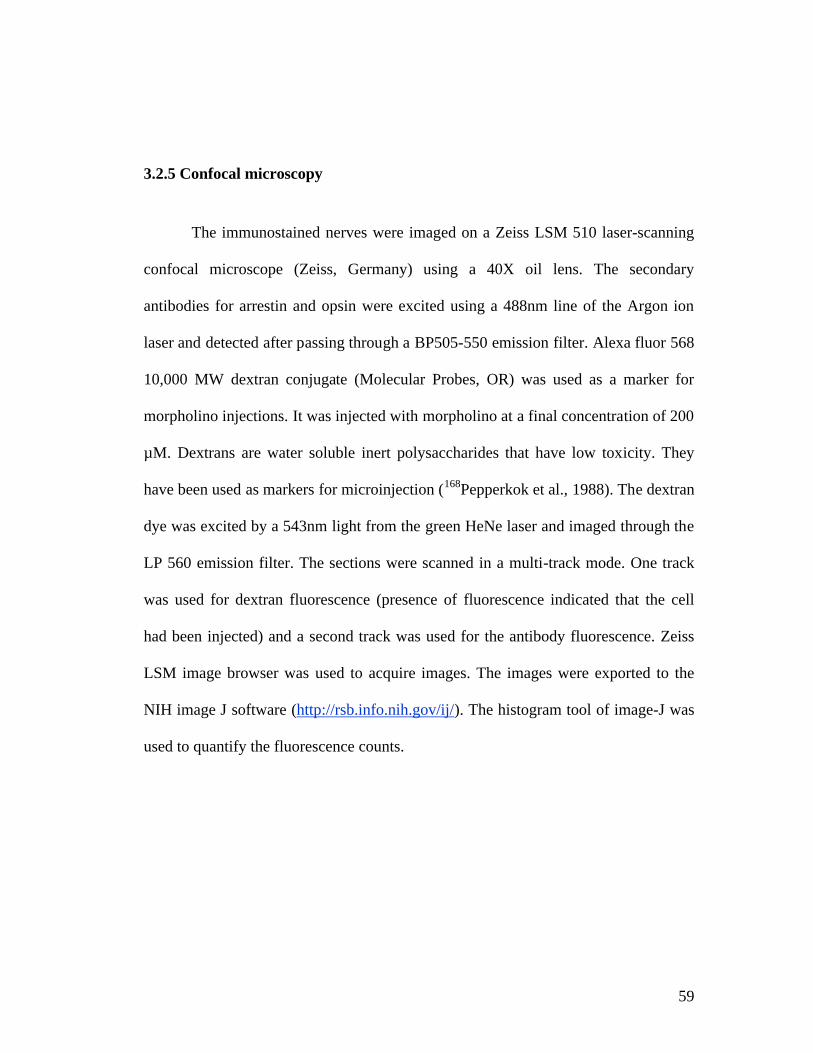
59
3.2.5 Confocal microscopy
The immunostained nerves were imaged on a Zeiss LSM 510 laser-scanning
confocal microscope (Zeiss, Germany) using a 40X oil lens. The secondary
antibodies for arrestin and opsin were excited using a 488nm line of the Argon ion
laser and detected after passing through a BP505-550 emission filter. Alexa fluor 568
10,000 MW dextran conjugate (Molecular Probes, OR) was used as a marker for
morpholino injections. It was injected with morpholino at a final concentration of 200
µM. Dextrans are water soluble inert polysaccharides that have low toxicity. They
have been used as markers for microinjection (168Pepperkok et al., 1988). The dextran
dye was excited by a 543nm light from the green HeNe laser and imaged through the
LP 560 emission filter. The sections were scanned in a multi-track mode. One track
was used for dextran fluorescence (presence of fluorescence indicated that the cell
had been injected) and a second track was used for the antibody fluorescence. Zeiss
LSM image browser was used to acquire images. The images were exported to the
NIH image J software (http://rsb.info.nih.gov/ij/). The histogram tool of image-J was
used to quantify the fluorescence counts.
60
3.3 RESULTS
3.3.1 Arrestin morpholino leads to a 5-fold increase in bump rate 24 hrs after injection.
In previous studies with arrestin RNAi injections, we showed that arrestin
suppression is most effective at 24 hrs after injection (section 2.3.2). To investigate
the effects of arrestin morpholino, we decided to use this time-point and a later time
point (48 hrs), which would give us an insight into the longevity of the morpholino-
induced effect. We compared uninjected cells, cells injected with a control
morpholino, and cells injected with 1 µM arrestin morpholino. We tested them at 24
hrs and 48 hrs after injection. The cells were “mapped” while injecting the
morpholino by drawing a diagram of the nerve with cells and marking the injected
and uninjected cells on this diagram.
Representative traces from cells in these three categories (uninjected, injected
with control morpholino, and injected with arrestin morpholino) are shown in Fig.3.1.
The traces of uninjected control, and cells injected with the control morpholino look
identical. However, in the cell injected with arrestin morpholino there appear to be
many more bumps. Quantification of the data is indicated in Fig. 3.2A. The dark
bump rate in cells injected with arrestin morpholino and tested 24 hrs after injection
was 5.1 + 0.4. This was about a five-fold increase over that of the bump rate in
uninjected cells (1 + 0.1) (p<0.05), and in cells injected with control morpholino (1.2
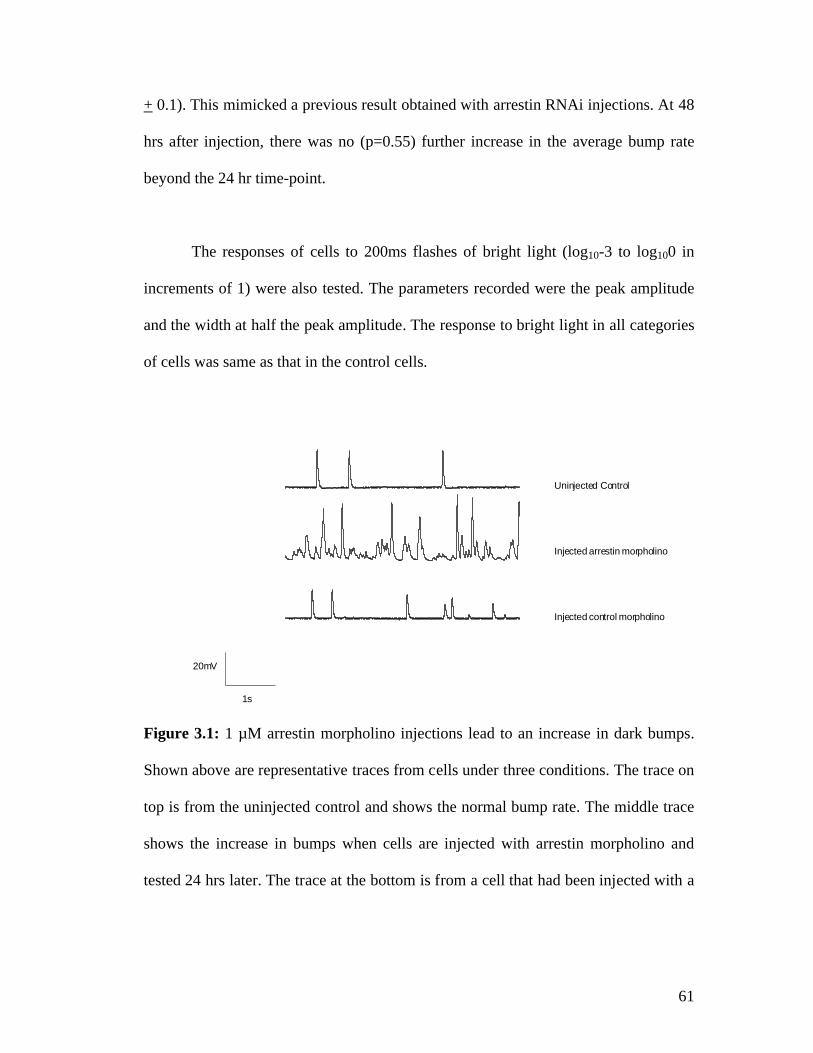
61
+ 0.1). This mimicked a previous result obtained with arrestin RNAi injections. At 48
hrs after injection, there was no (p=0.55) further increase in the average bump rate
beyond the 24 hr time-point.
The responses of cells to 200ms flashes of bright light (log10-3 to log100 in
increments of 1) were also tested. The parameters recorded were the peak amplitude
and the width at half the peak amplitude. The response to bright light in all categories
of cells was same as that in the control cells.
20mV
1s
Uninjected Control
Injected arrestin morpholino
Injected control morpholino
Figure 3.1: 1 µM arrestin morpholino injections lead to an increase in dark bumps.
Shown above are representative traces from cells under three conditions. The trace on
top is from the uninjected control and shows the normal bump rate. The middle trace
shows the increase in bumps when cells are injected with arrestin morpholino and
tested 24 hrs later. The trace at the bottom is from a cell that had been injected with a

62
control morpholino and tested at 24 hrs. This trace indicates that the process of
injecting 25nt long morpholino in itself does not have any effect on the bump rate.
1 M arrestin morpholino injections
Bum
ps/s
0
1
2
3
4
5
6
Uninj CM 24 AM 24 CM 48 AM 48
* *
n=9
Figure 3.2: Dark bumps in cells injected with arrestin morpholino. Cells were
injected with 1 µM arrestin morpholino and checked at 24 and 48 hrs after injections
for their bump rate. Uninj= uninjected control cells CM= cells injected with the
control morpholino AM= cells injected with the arrestin morpholino. The bumps in
cells tested at 24 hrs after injection (AM 24) (5.1 + 0.4) and 48 hrs after injection
(AM 48) (4.8 + 0.3) show about a 5-fold increase as compared to cells injected with
control morpholino and tested at similar times (1.2 + 0.1 and 1.3 + 0.2 respectively).
Control morpholino did not induce any increase in bump rate when compared to the
uninjected cells (1 + 0.1). n=9. Error bars indicate SEM.

63
3.3.2 Dose-dependence in arrestin morpholino injected cells Typically in oligonucleotide studies, multiple sequences and/or multiple
concentrations are used to verify that the effect seen is not spurious. We used two
additional concentrations of arrestin morpholino (0.1 µM, and 10 µM) with
corresponding concentrations of control morpholinos. We tested the effect of these
concentrations at 24 hrs after injection (Fig. 3.3). Cells injected with 0.1 µM arrestin
morpholino had a bump rate of 3 + 0.3 which is lower than that observed with 1µM
arrestin morpholino injections (4.8 + 0.33). However, with 10 µM morpholino
injections, we did not observe any further (p=0.71) increase in bump rate as compared
to 1 µM morpholino injections. This indicates that morpholino injections at 1µM may
have a saturating effect.
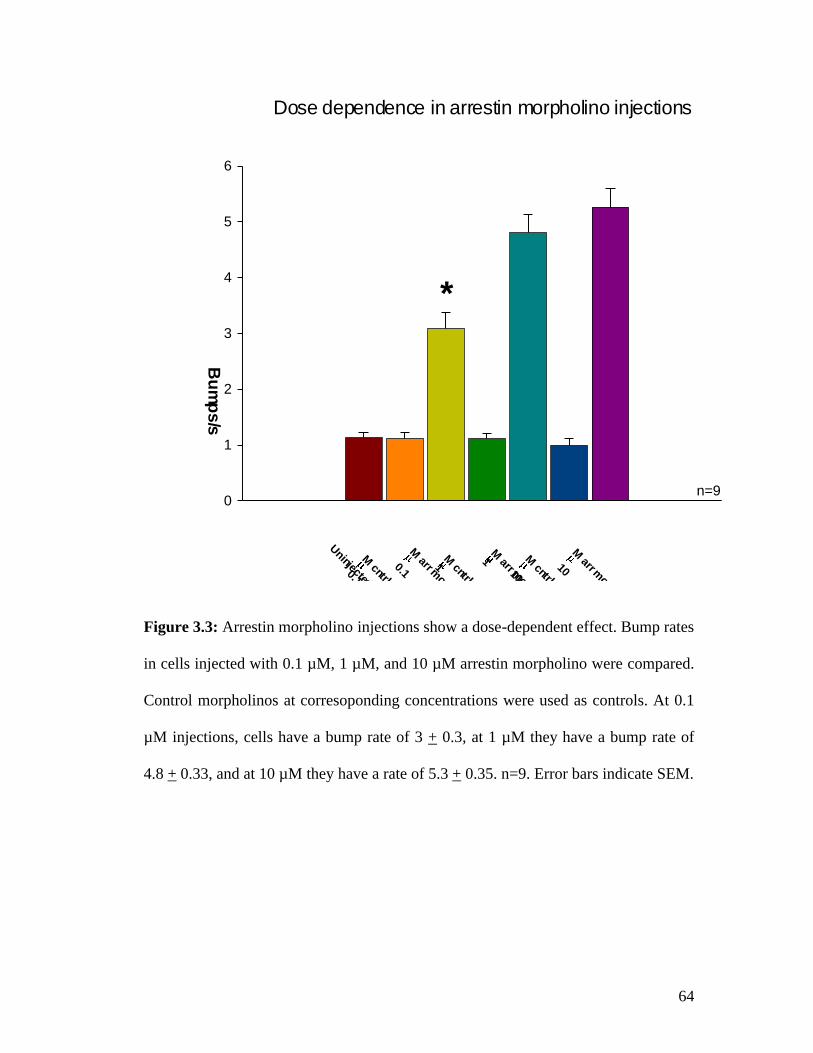
64
Dose dependence in arrestin morpholino injections
Bum
ps/s
0
1
2
3
4
5
6
Uninjected 0.1
M cntrl morph
1M cntrl morph
1M arr morph
10
M cntrl morph
0.1
M arr morph
10
M arr morph
*
n=9
Figure 3.3: Arrestin morpholino injections show a dose-dependent effect. Bump rates
in cells injected with 0.1 µM, 1 µM, and 10 µM arrestin morpholino were compared.
Control morpholinos at corresoponding concentrations were used as controls. At 0.1
µM injections, cells have a bump rate of 3 + 0.3, at 1 µM they have a bump rate of
4.8 + 0.33, and at 10 µM they have a rate of 5.3 + 0.35. n=9. Error bars indicate SEM.
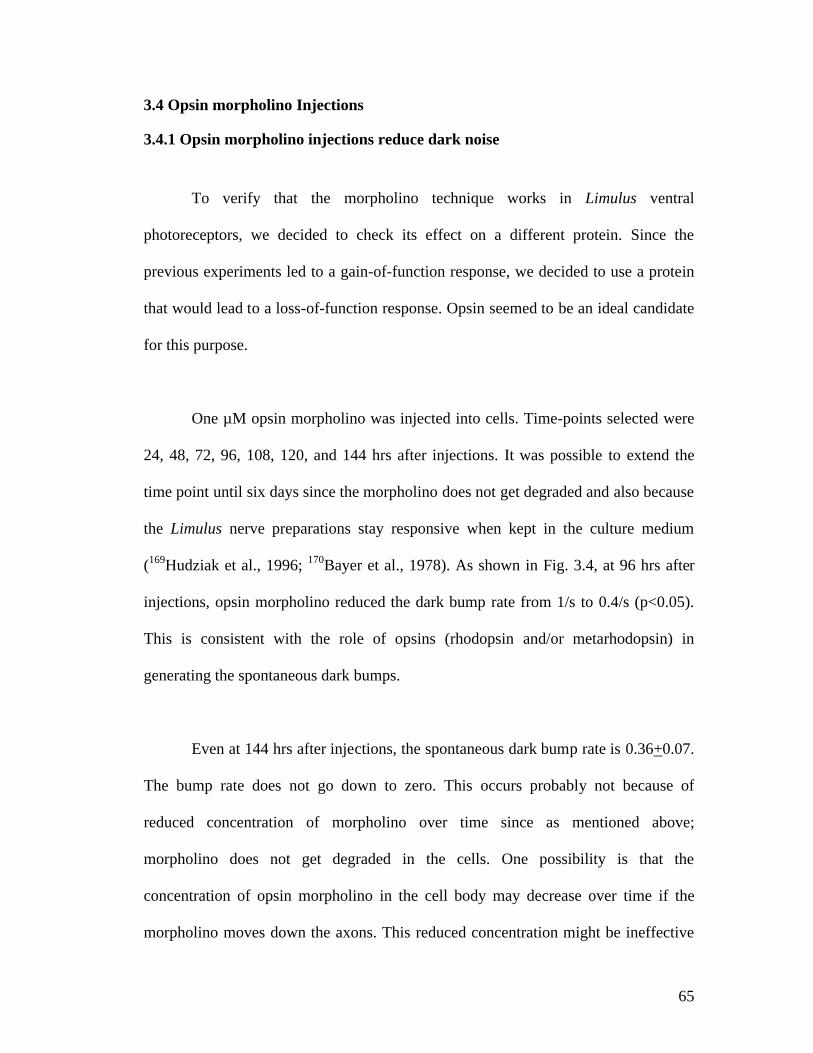
65
3.4 Opsin morpholino Injections
3.4.1 Opsin morpholino injections reduce dark noise
To verify that the morpholino technique works in Limulus ventral
photoreceptors, we decided to check its effect on a different protein. Since the
previous experiments led to a gain-of-function response, we decided to use a protein
that would lead to a loss-of-function response. Opsin seemed to be an ideal candidate
for this purpose.
One µM opsin morpholino was injected into cells. Time-points selected were
24, 48, 72, 96, 108, 120, and 144 hrs after injections. It was possible to extend the
time point until six days since the morpholino does not get degraded and also because
the Limulus nerve preparations stay responsive when kept in the culture medium
(169Hudziak et al., 1996; 170Bayer et al., 1978). As shown in Fig. 3.4, at 96 hrs after
injections, opsin morpholino reduced the dark bump rate from 1/s to 0.4/s (p<0.05).
This is consistent with the role of opsins (rhodopsin and/or metarhodopsin) in
generating the spontaneous dark bumps.
Even at 144 hrs after injections, the spontaneous dark bump rate is 0.36+0.07.
The bump rate does not go down to zero. This occurs probably not because of
reduced concentration of morpholino over time since as mentioned above;
morpholino does not get degraded in the cells. One possibility is that the
concentration of opsin morpholino in the cell body may decrease over time if the
morpholino moves down the axons. This reduced concentration might be ineffective
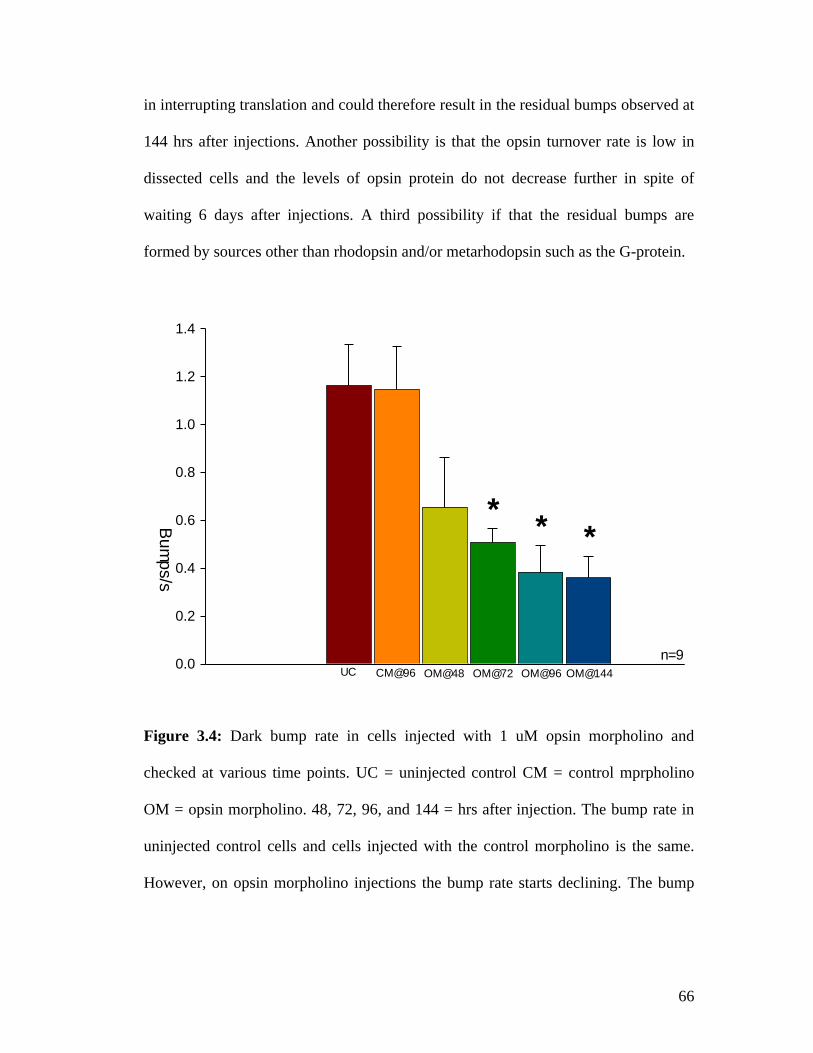
66
in interrupting translation and could therefore result in the residual bumps observed at
144 hrs after injections. Another possibility is that the opsin turnover rate is low in
dissected cells and the levels of opsin protein do not decrease further in spite of
waiting 6 days after injections. A third possibility if that the residual bumps are
formed by sources other than rhodopsin and/or metarhodopsin such as the G-protein.
Bum
ps/s0.0
0.2
0.4
0.6
0.8
1.0
1.2
1.4
UC CM@96 OM@48 OM@72 OM@96 OM@144
* * *
n=9
Figure 3.4: Dark bump rate in cells injected with 1 uM opsin morpholino and
checked at various time points. UC = uninjected control CM = control mprpholino
OM = opsin morpholino. 48, 72, 96, and 144 = hrs after injection. The bump rate in
uninjected control cells and cells injected with the control morpholino is the same.
However, on opsin morpholino injections the bump rate starts declining. The bump
67
rate is lowest at 96 hrs after injections (0.4/s). There is no further significant decrease
beyond 96 hrs. n=8. Error bars indicate SEM.
3.4.2 Opsin morpholino injections lead to a 1.5 log10 reduction in sensitivity at 96 hrs after injection.
We decided to explore the effect of 1 µM opsin morpholino injections by
checking the cells for their light sensitivity. Cells were tested 24, 48, 72, 96, 108, 120,
and 144 hrs after injections. We observed their response to dim light of intensities
ranging from log10 -10 to log10 - 7 in increments of 0.5. In all cases, the bump rate
was lower in cells injected with opsin morpholino as compared to cells injected with
control morpholino, or those not injected at all (Fig. 3.5). However, the largest
difference, reduction in light sensitivity by 1.5 log10, was observed at 96 hrs after
injection.
These results are consistent with opsin morpholino reducing the rhodopsin
content.
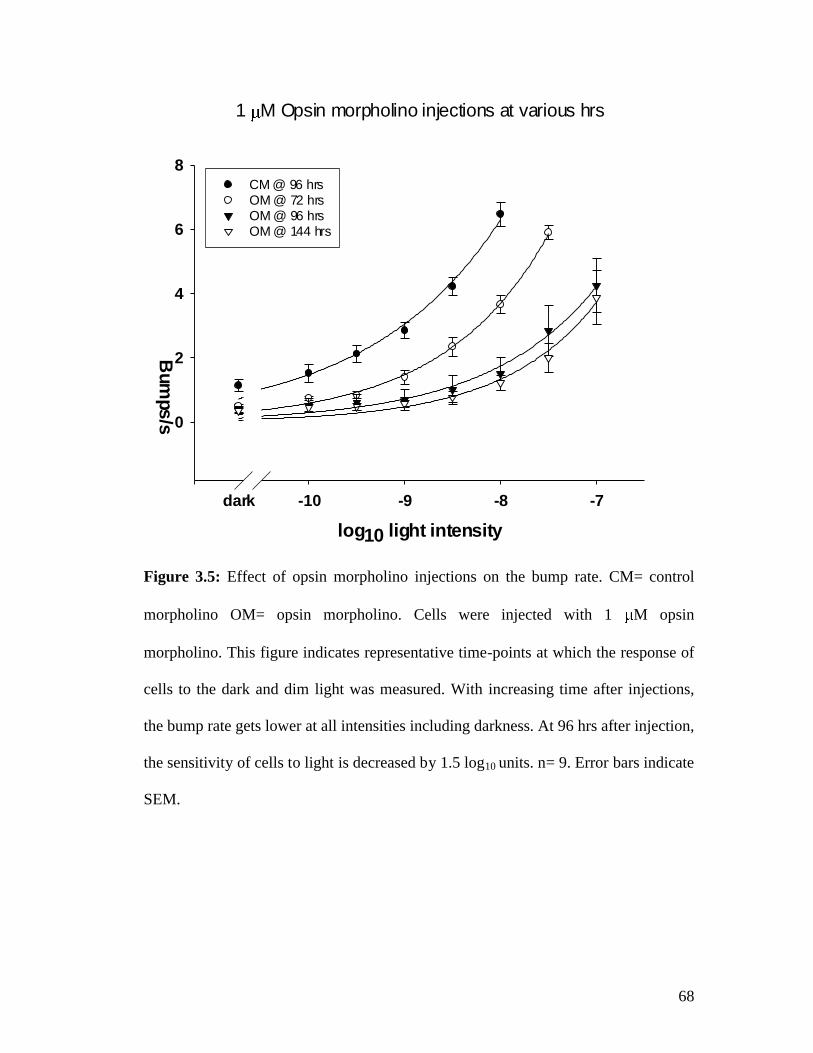
68
1 M Opsin morpholino injections at various hrs
log10 light intensitydark -10 -9 -8 -7
Bum
ps/s 0
2
4
6
8CM @ 96 hrsOM @ 72 hrsOM @ 96 hrsOM @ 144 hrs
Figure 3.5: Effect of opsin morpholino injections on the bump rate. CM= control
morpholino OM= opsin morpholino. Cells were injected with 1 M opsin
morpholino. This figure indicates representative time-points at which the response of
cells to the dark and dim light was measured. With increasing time after injections,
the bump rate gets lower at all intensities including darkness. At 96 hrs after injection,
the sensitivity of cells to light is decreased by 1.5 log10 units. n= 9. Error bars indicate
SEM.
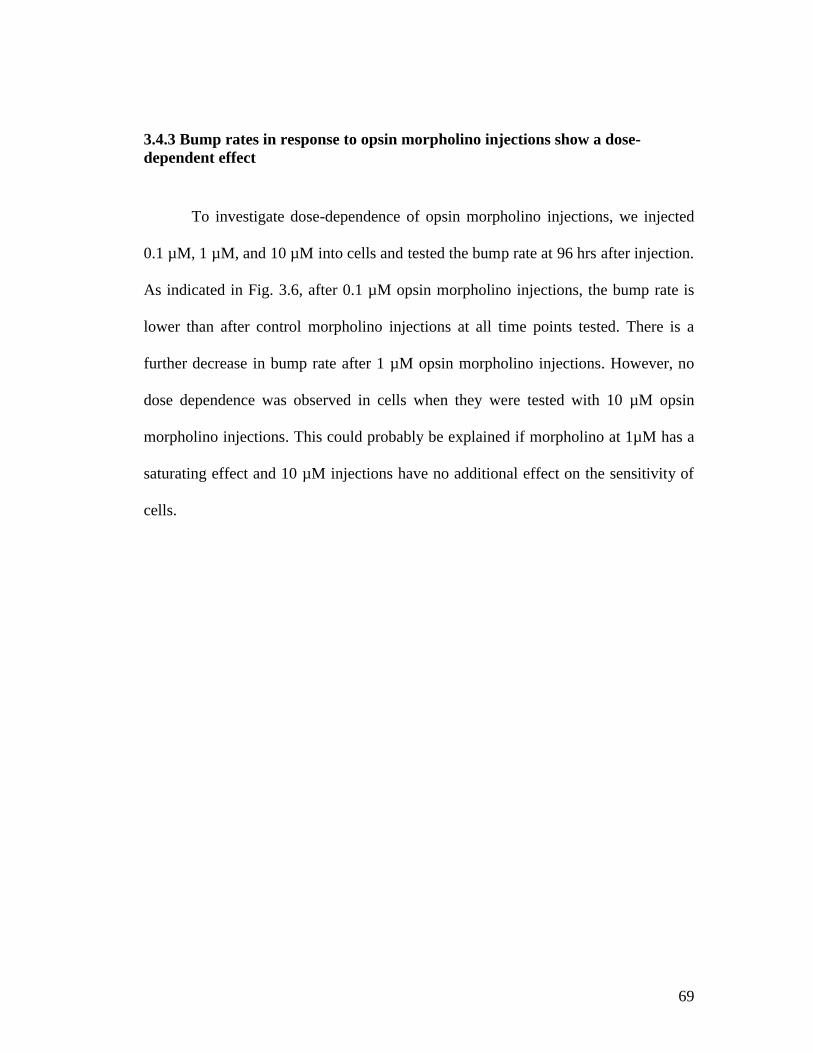
69
3.4.3 Bump rates in response to opsin morpholino injections show a dose-dependent effect
To investigate dose-dependence of opsin morpholino injections, we injected
0.1 µM, 1 µM, and 10 µM into cells and tested the bump rate at 96 hrs after injection.
As indicated in Fig. 3.6, after 0.1 µM opsin morpholino injections, the bump rate is
lower than after control morpholino injections at all time points tested. There is a
further decrease in bump rate after 1 µM opsin morpholino injections. However, no
dose dependence was observed in cells when they were tested with 10 µM opsin
morpholino injections. This could probably be explained if morpholino at 1µM has a
saturating effect and 10 µM injections have no additional effect on the sensitivity of
cells.
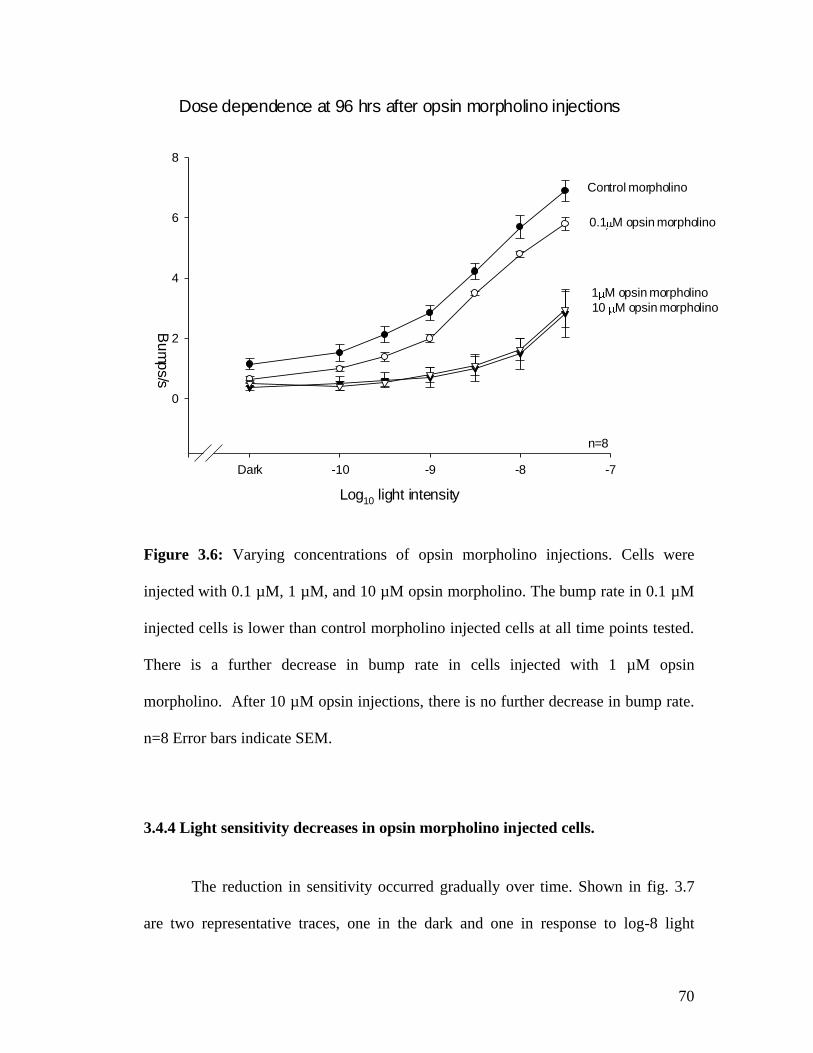
70
Dose dependence at 96 hrs after opsin morpholino injections
Log10 light intensity
Dark -10 -9 -8 -7
Bum
ps/s
0
2
4
6
8
Control morpholino
0.1 M opsin morpholino
1 M opsin morpholino10 M opsin morpholino
n=8
Figure 3.6: Varying concentrations of opsin morpholino injections. Cells were
injected with 0.1 µM, 1 µM, and 10 µM opsin morpholino. The bump rate in 0.1 µM
injected cells is lower than control morpholino injected cells at all time points tested.
There is a further decrease in bump rate in cells injected with 1 µM opsin
morpholino. After 10 µM opsin injections, there is no further decrease in bump rate.
n=8 Error bars indicate SEM.
3.4.4 Light sensitivity decreases in opsin morpholino injected cells.
The reduction in sensitivity occurred gradually over time. Shown in fig. 3.7
are two representative traces, one in the dark and one in response to log-8 light
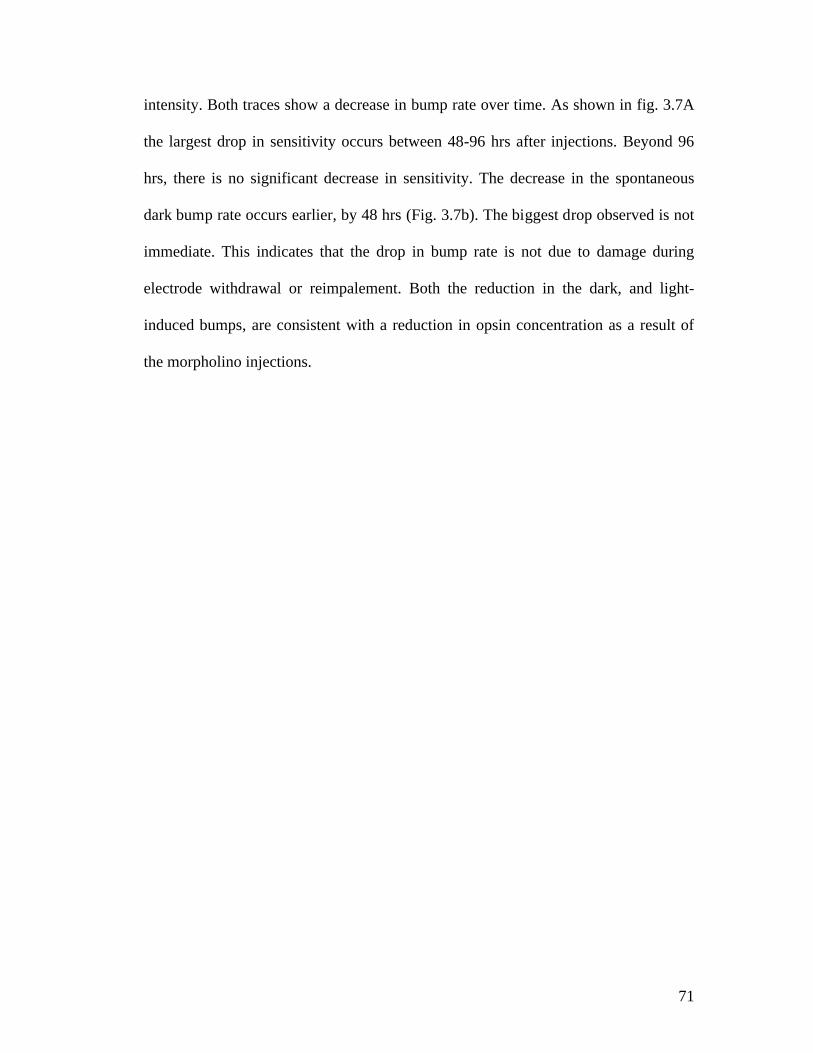
71
intensity. Both traces show a decrease in bump rate over time. As shown in fig. 3.7A
the largest drop in sensitivity occurs between 48-96 hrs after injections. Beyond 96
hrs, there is no significant decrease in sensitivity. The decrease in the spontaneous
dark bump rate occurs earlier, by 48 hrs (Fig. 3.7b). The biggest drop observed is not
immediate. This indicates that the drop in bump rate is not due to damage during
electrode withdrawal or reimpalement. Both the reduction in the dark, and light-
induced bumps, are consistent with a reduction in opsin concentration as a result of
the morpholino injections.
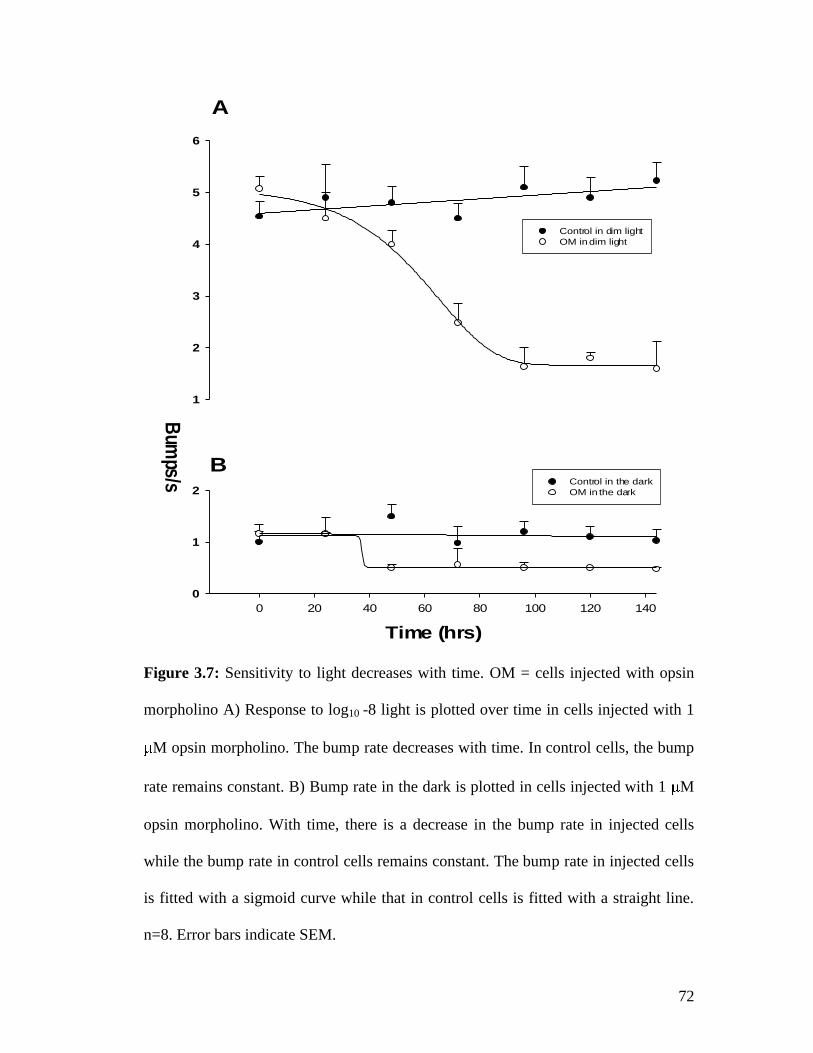
72
Bumps/s
1
2
3
4
5
6
Control in dim lightOM in dim light
Time (hrs)0 20 40 60 80 100 120 140
0
1
2Control in the darkOM in the dark
A
B
Figure 3.7: Sensitivity to light decreases with time. OM = cells injected with opsin
morpholino A) Response to log10 -8 light is plotted over time in cells injected with 1
M opsin morpholino. The bump rate decreases with time. In control cells, the bump
rate remains constant. B) Bump rate in the dark is plotted in cells injected with 1 M
opsin morpholino. With time, there is a decrease in the bump rate in injected cells
while the bump rate in control cells remains constant. The bump rate in injected cells
is fitted with a sigmoid curve while that in control cells is fitted with a straight line.
n=8. Error bars indicate SEM.
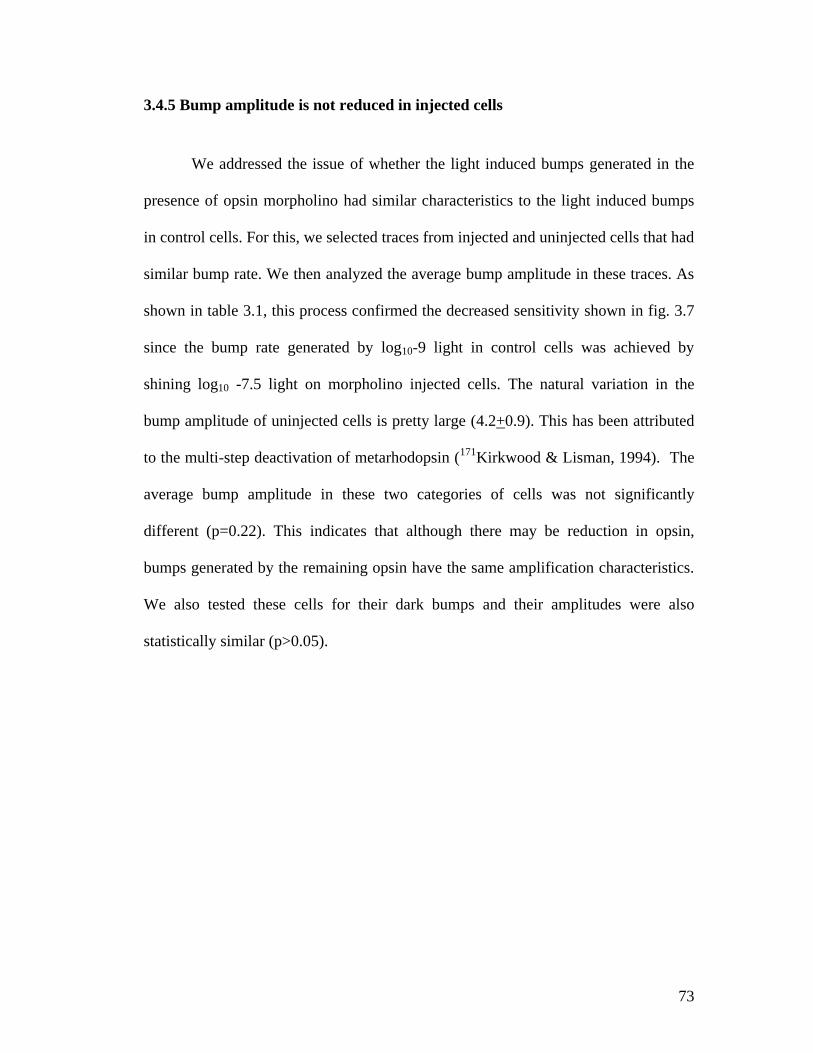
73
3.4.5 Bump amplitude is not reduced in injected cells
We addressed the issue of whether the light induced bumps generated in the
presence of opsin morpholino had similar characteristics to the light induced bumps
in control cells. For this, we selected traces from injected and uninjected cells that had
similar bump rate. We then analyzed the average bump amplitude in these traces. As
shown in table 3.1, this process confirmed the decreased sensitivity shown in fig. 3.7
since the bump rate generated by log10-9 light in control cells was achieved by
shining log10 -7.5 light on morpholino injected cells. The natural variation in the
bump amplitude of uninjected cells is pretty large (4.2+0.9). This has been attributed
to the multi-step deactivation of metarhodopsin (171Kirkwood & Lisman, 1994). The
average bump amplitude in these two categories of cells was not significantly
different (p=0.22). This indicates that although there may be reduction in opsin,
bumps generated by the remaining opsin have the same amplification characteristics.
We also tested these cells for their dark bumps and their amplitudes were also
statistically similar (p>0.05).
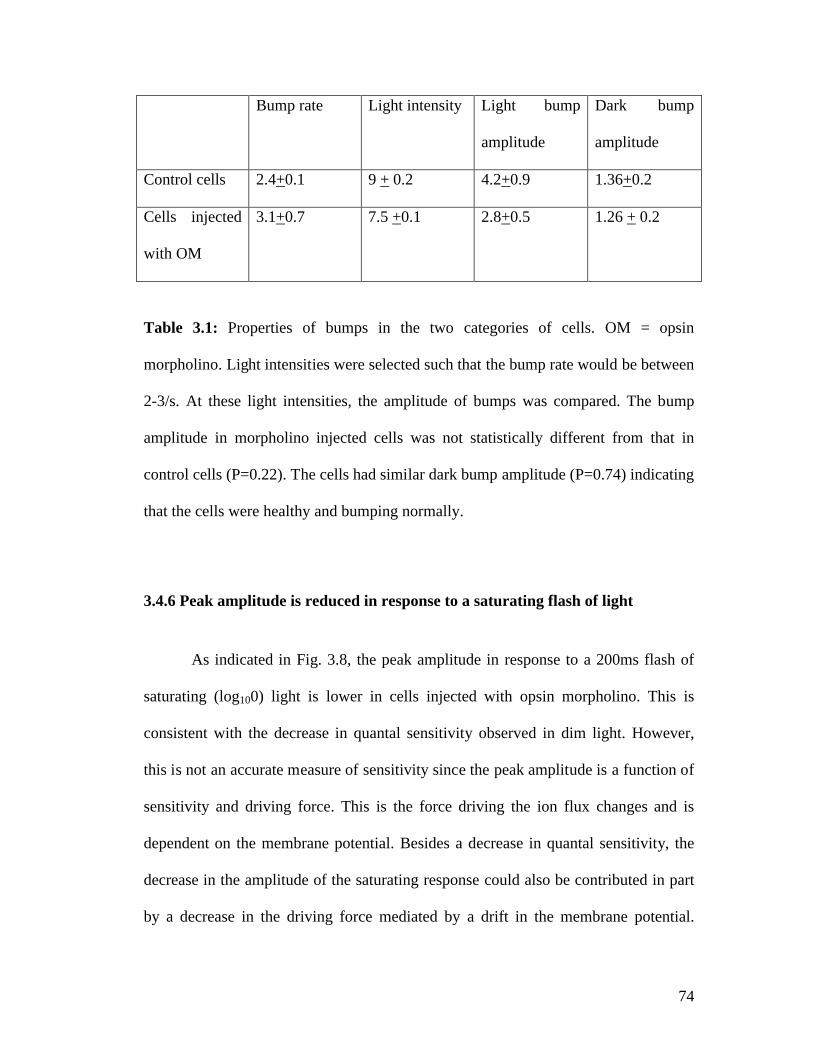
74
Bump rate Light intensity Light bump
amplitude
Dark bump
amplitude
Control cells 2.4+0.1 9 + 0.2 4.2+0.9 1.36+0.2
Cells injected
with OM
3.1+0.7 7.5 +0.1 2.8+0.5 1.26 + 0.2
Table 3.1: Properties of bumps in the two categories of cells. OM = opsin
morpholino. Light intensities were selected such that the bump rate would be between
2-3/s. At these light intensities, the amplitude of bumps was compared. The bump
amplitude in morpholino injected cells was not statistically different from that in
control cells (P=0.22). The cells had similar dark bump amplitude (P=0.74) indicating
that the cells were healthy and bumping normally.
3.4.6 Peak amplitude is reduced in response to a saturating flash of light
As indicated in Fig. 3.8, the peak amplitude in response to a 200ms flash of
saturating (log100) light is lower in cells injected with opsin morpholino. This is
consistent with the decrease in quantal sensitivity observed in dim light. However,
this is not an accurate measure of sensitivity since the peak amplitude is a function of
sensitivity and driving force. This is the force driving the ion flux changes and is
dependent on the membrane potential. Besides a decrease in quantal sensitivity, the
decrease in the amplitude of the saturating response could also be contributed in part
by a decrease in the driving force mediated by a drift in the membrane potential.
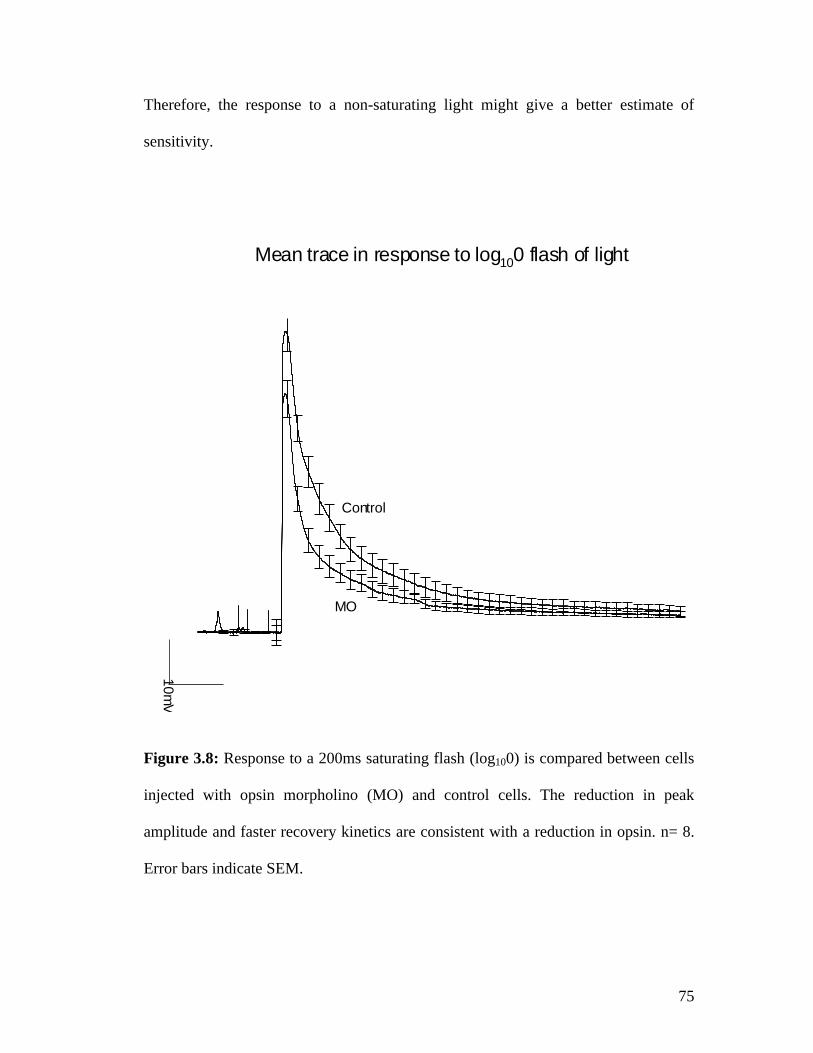
75
Therefore, the response to a non-saturating light might give a better estimate of
sensitivity.
Mean trace in response to log100 flash of light
10mV
Control
MO
Figure 3.8: Response to a 200ms saturating flash (log100) is compared between cells
injected with opsin morpholino (MO) and control cells. The reduction in peak
amplitude and faster recovery kinetics are consistent with a reduction in opsin. n= 8.
Error bars indicate SEM.

76
3.4.7 Response kinetics affected in the presence of a non-saturating flash of light
Cells were exposed to a 200ms flash of log10-4 light. At this intensity, the
response of the cell is not saturated. As compared to control cells, opsin morpholino
injected cells had smaller peak amplitude and the response terminated earlier (Fig.
3.9). This is consistent with the decrease in sensitivity of cells to light as observed in
the analysis of bump responses.
Control
OM
5mV 50ms
n=8
Response to a flash of log10 -4
Figure 3.9: Response to a 200ms non-saturating flash (log10-4) is compared between
opsin morpholino injected (MO) and control cells. Reduction in peak amplitude is
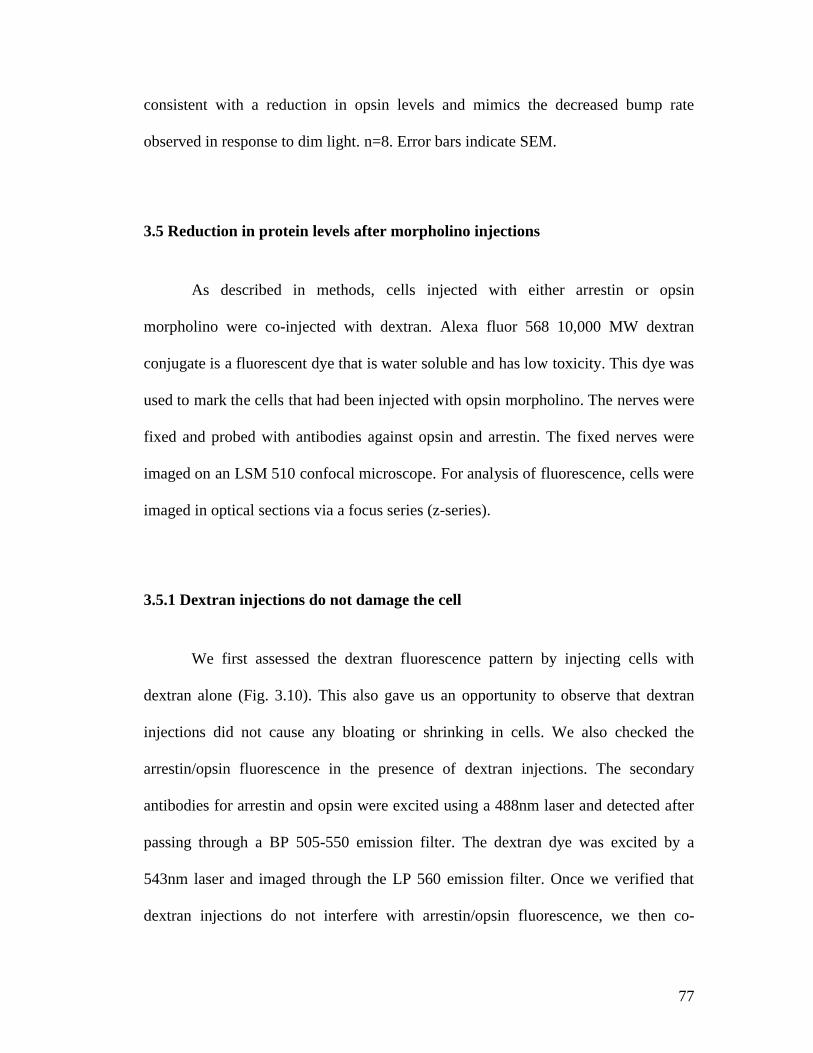
77
consistent with a reduction in opsin levels and mimics the decreased bump rate
observed in response to dim light. n=8. Error bars indicate SEM.
3.5 Reduction in protein levels after morpholino injections
As described in methods, cells injected with either arrestin or opsin
morpholino were co-injected with dextran. Alexa fluor 568 10,000 MW dextran
conjugate is a fluorescent dye that is water soluble and has low toxicity. This dye was
used to mark the cells that had been injected with opsin morpholino. The nerves were
fixed and probed with antibodies against opsin and arrestin. The fixed nerves were
imaged on an LSM 510 confocal microscope. For analysis of fluorescence, cells were
imaged in optical sections via a focus series (z-series).
3.5.1 Dextran injections do not damage the cell
We first assessed the dextran fluorescence pattern by injecting cells with
dextran alone (Fig. 3.10). This also gave us an opportunity to observe that dextran
injections did not cause any bloating or shrinking in cells. We also checked the
arrestin/opsin fluorescence in the presence of dextran injections. The secondary
antibodies for arrestin and opsin were excited using a 488nm laser and detected after
passing through a BP 505-550 emission filter. The dextran dye was excited by a
543nm laser and imaged through the LP 560 emission filter. Once we verified that
dextran injections do not interfere with arrestin/opsin fluorescence, we then co-
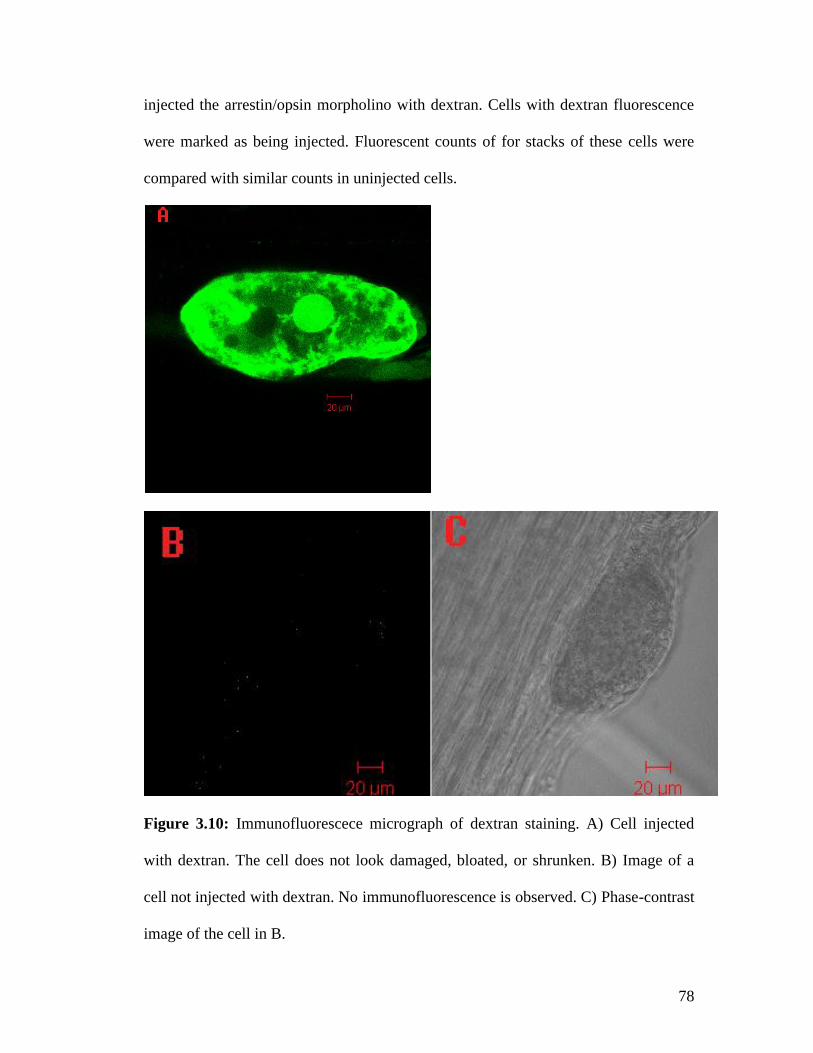
78
injected the arrestin/opsin morpholino with dextran. Cells with dextran fluorescence
were marked as being injected. Fluorescent counts of for stacks of these cells were
compared with similar counts in uninjected cells.
Figure 3.10: Immunofluorescece micrograph of dextran staining. A) Cell injected
with dextran. The cell does not look damaged, bloated, or shrunken. B) Image of a
cell not injected with dextran. No immunofluorescence is observed. C) Phase-contrast
image of the cell in B.
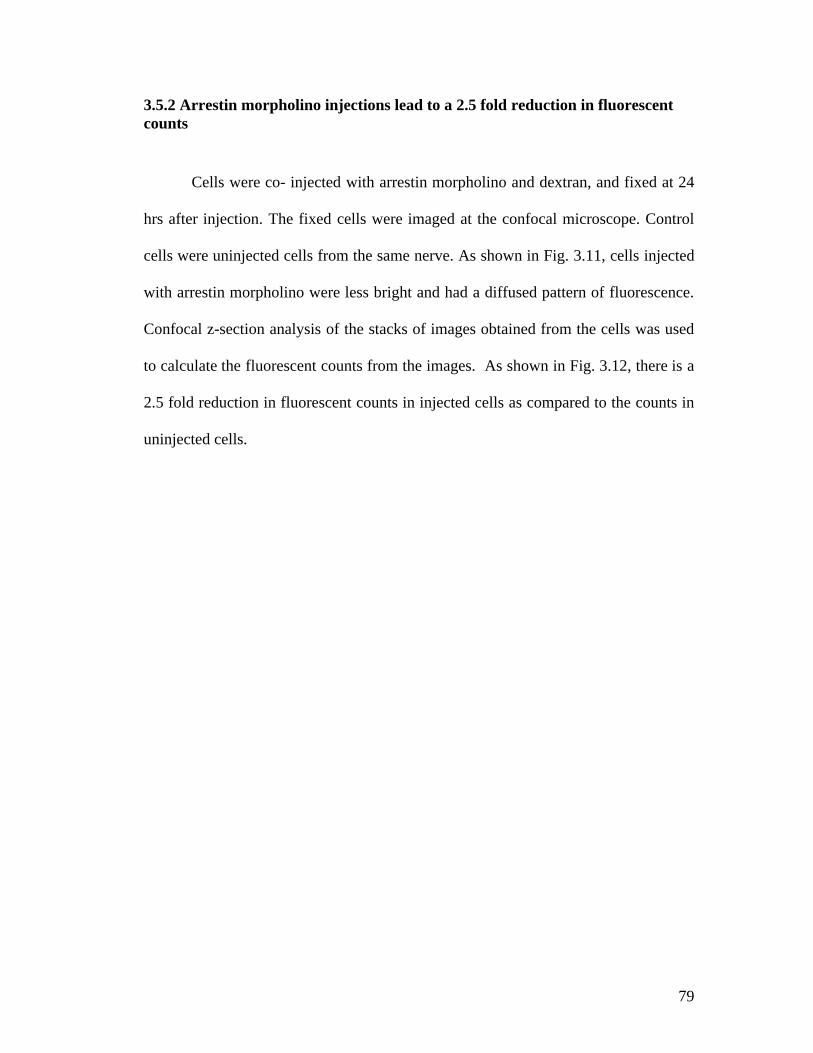
79
3.5.2 Arrestin morpholino injections lead to a 2.5 fold reduction in fluorescent counts
Cells were co- injected with arrestin morpholino and dextran, and fixed at 24
hrs after injection. The fixed cells were imaged at the confocal microscope. Control
cells were uninjected cells from the same nerve. As shown in Fig. 3.11, cells injected
with arrestin morpholino were less bright and had a diffused pattern of fluorescence.
Confocal z-section analysis of the stacks of images obtained from the cells was used
to calculate the fluorescent counts from the images. As shown in Fig. 3.12, there is a
2.5 fold reduction in fluorescent counts in injected cells as compared to the counts in
uninjected cells.
80
Figure 3.11: Fluorescent counts are lower in the images of cells injected with arrestin
morpholino. Immunofluorescence micrograph recorded from cells that have been
probed with anti-arrestin antibody. The green indicates arrestin and red indicates
dextran fluorescence. A and B are images from a cell that has not been injected with
arrestin morpholino and dextran. C and D are images from a cell that has been
injected. A- Cell with a characteristic arrestin staining pattern. B- Absence of dextran
fluorescence indicates that the cell was not injected C- Arrestin staining is diffused
and less bright. D- Cell injected with morpholino as indicated by the dextran staining.

81
PMT counts
0
5
10
15
20
25
UninjectedInjected with AM
n=5
*
Figure 3.12: Fluorescent counts from z-section images of cells. AM= arrestin
morpholino. Images of cells injected with arrestin had an average of 6.3 + 1.3
fluorescent counts as compared with the uninjected control cells that had an average
count of 16.9 + 2.2. This indicates about 2.5 fold decrease in fluorescence in injected
cells. n=3. Error bars indicate SEM.
82
3.5.3 Opsin morpholino injections lead to a 17 fold reduction in fluorescent counts
The opsin morpholino injected cells were also less bright (Fig. 3.13) and had a
diffused pattern of fluorescence. Quantitative analysis of the fluorescent counts from
the confocal images indicated a 17 fold reduction in fluorescent counts in injected
cells (Fig. 3.14).
Although we can not quantify actual protein levels by this method, the
decrease in fluorescent counts arising from the antibody staining is consistent with a
decrease in protein levels in the injected cells.
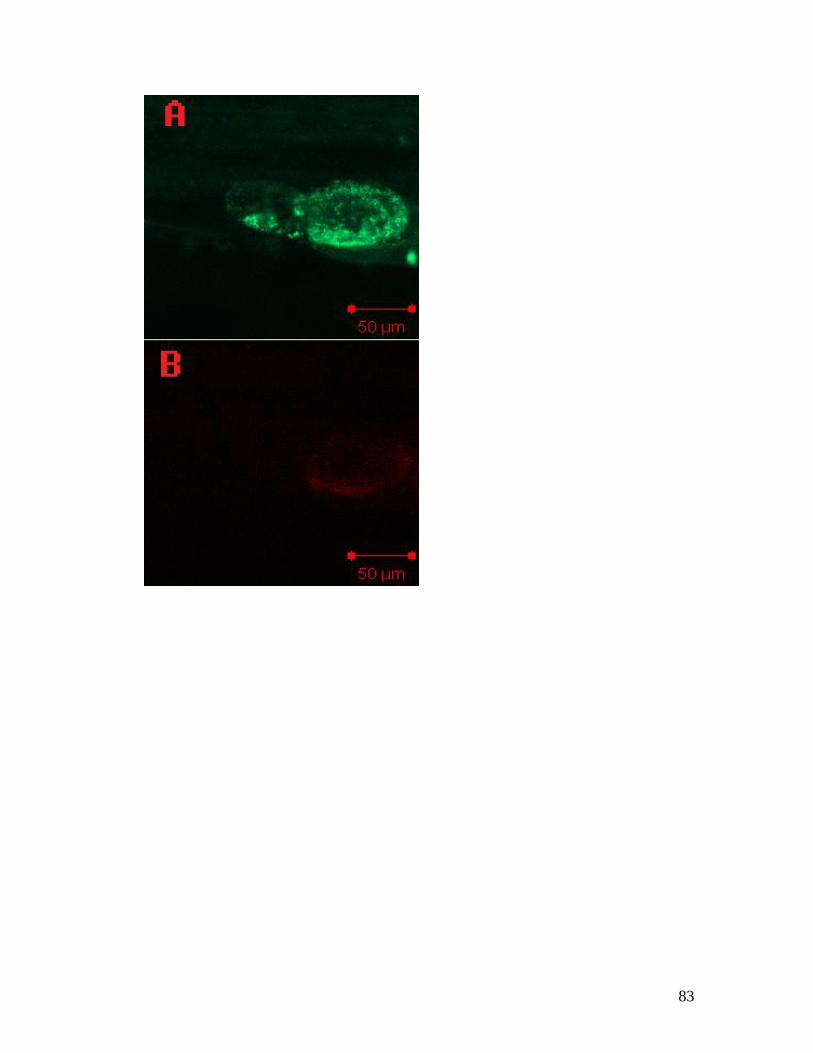
83
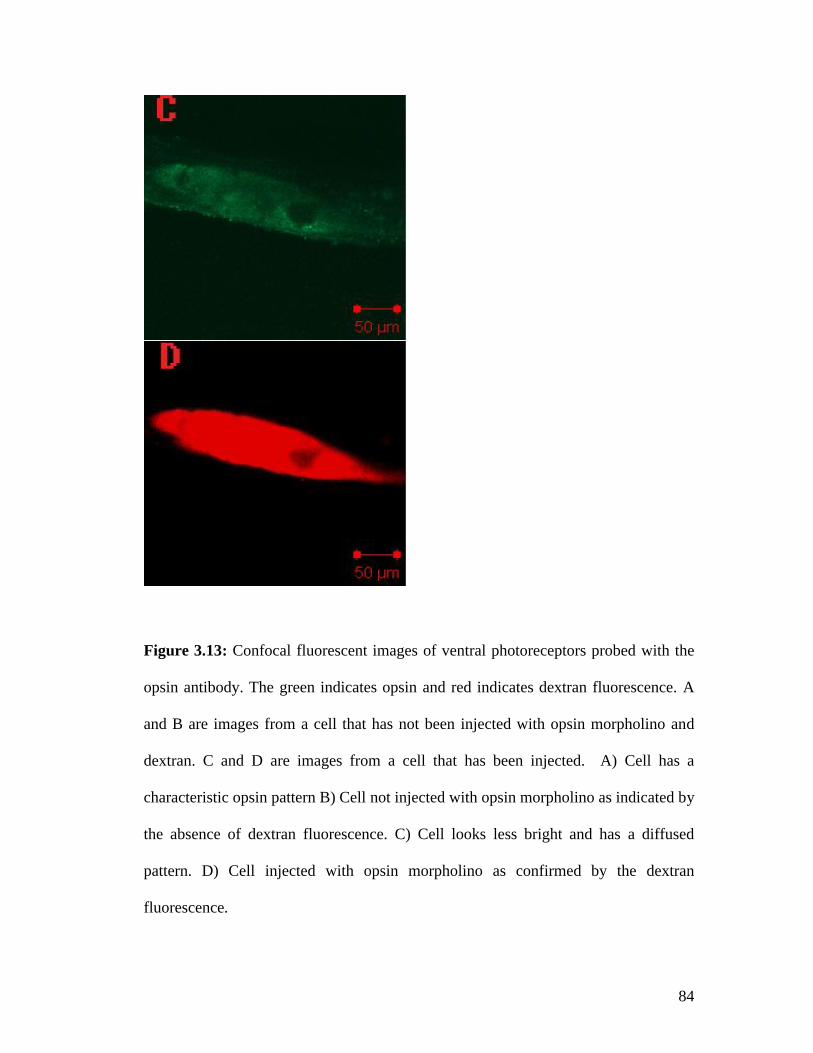
84
Figure 3.13: Confocal fluorescent images of ventral photoreceptors probed with the
opsin antibody. The green indicates opsin and red indicates dextran fluorescence. A
and B are images from a cell that has not been injected with opsin morpholino and
dextran. C and D are images from a cell that has been injected. A) Cell has a
characteristic opsin pattern B) Cell not injected with opsin morpholino as indicated by
the absence of dextran fluorescence. C) Cell looks less bright and has a diffused
pattern. D) Cell injected with opsin morpholino as confirmed by the dextran
fluorescence.
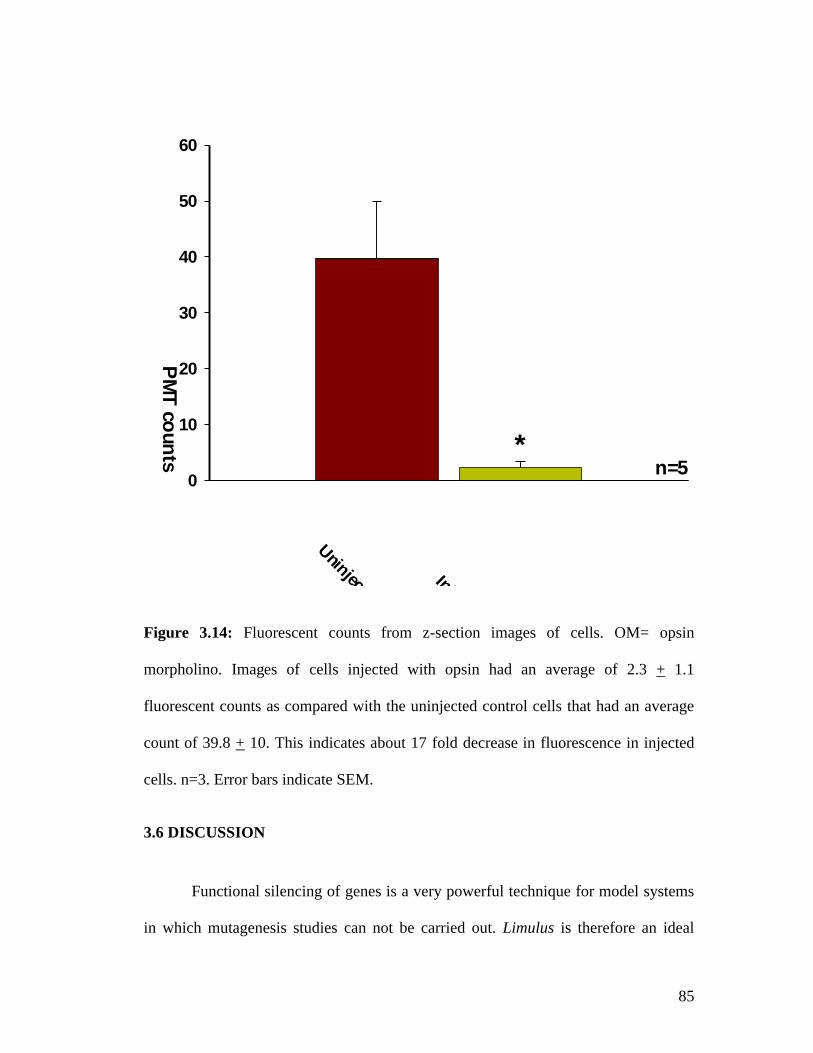
85
PMT counts
0
10
20
30
40
50
60
UninjectedInjected with OM
n=5*
Figure 3.14: Fluorescent counts from z-section images of cells. OM= opsin
morpholino. Images of cells injected with opsin had an average of 2.3 + 1.1
fluorescent counts as compared with the uninjected control cells that had an average
count of 39.8 + 10. This indicates about 17 fold decrease in fluorescence in injected
cells. n=3. Error bars indicate SEM.
3.6 DISCUSSION
Functional silencing of genes is a very powerful technique for model systems
in which mutagenesis studies can not be carried out. Limulus is therefore an ideal
86
candidate to make the most use of this technique. We have shown here that
morpholino can be injected directly into individual ventral photoreceptor cells and its
long term effects can be investigated. It is possible to study the effect of morpholino
up to 6-7 days after injections because morpholino is very stable and the cells
themselves can be maintained in culture for a long time.
The results with the arrestin morpholino support the data obtained from
arrestin RNAi studies since both these procedures lead to a 5-fold increase in bump
rate 24 hrs after injections. It is interesting to note that although RNAi and
morpholino work through different mechanisms, their functional output in our studies
was very similar. At the same time there were some differences too. The bump rate at
48 hrs after arrestin RNAi injections decreased significantly from that at 24 hrs after
injections. However, morpholino injections at 48 hrs had no significant difference in
bump rate from those at 24 hrs. This could be due to low toxicity of morpholinos
observed both in vitro and in vivo (172Iversen et al., 2003).
Opsin morpholino injections lead to a loss of sensitivity to light. The degree of
the loss increases with longer time points after injections. However, after about 96
hrs, there is no further significant reduction observed in the bump rate. Although the
decrease in sensitivity is maintained at later hours, there is an increase in cell death
and difficulty in obtaining good recordings from cells. Thus we decided that 96 hrs
after injections was the optimum time to readily test the effectiveness of opsin
morpholino. We hypothesize that failure of injections to further reduce bump rate
87
could be due to morpholino diffusing out of the cell body into the axon. Another
possibility is that the morpholino significantly reduces the content of the freshly
synthesized opsin but the residual bumps at 96 hrs are produced due to the opsin that
was already present in the system before the injections.
The reduction in bump rate at 96 hrs after morpholino treatment is indicative
of a slow turnover of opsin in Limulus ventral photoreceptors. Turnover of opsin in
vertebrates is rapid. In the presence of light, the discs in the outer segment of rods get
degraded and new discs are continuously assembled. Each photoisomerization event
leads to the formation of the active photoproduct, metarhodopsin. To replenish the
rhodopsin concentration, fresh opsin needs to bind the chromophore in the pigment
epithelium. This mechanism requires rapid turnover of opsin. In invertebrates,
however, rhodopsin regeneration is not long and involved but occurs when
metarhodopsin absorbs a photon. Thus the rate of synthesis of opsin is much slower.
In Drosophila, there is no change in opsin mRNA or opsin protein levels over a 24 hr
D/L cycle (173Hartman et al., 2001). In Limulus lateral photoreceptors, opsin mRNA
levels spike at 9-12 hrs after sunrise but stay constant for the rest of the day and night
(174Dalal et al., 2003). However, no information is available on the opsin protein
levels. Morpholino injections reduce the production of fresh opsin protein but have no
effect on the opsin that was already present in the system before the injections. Since
it takes about 96 hrs to maximally reduce the bump rate, this might indicate a slow
turnover of opsin in Limulus.
88
3.6.1 Consequence of Rhodopsin and metarhodopsin with similar spectral properties
Rhodopsin and metarhodopsin in most species absorb light maximally at
different wavelengths. In Drosophila, a 480nm (blue) light can convert about 80% of
rhodopsin to metarhodopsin and a 580nm (orange) light can convert > 80% of
metarhodopsin back to rhodopsin (175Matsumoto et al., 1982). However, in Limulus,
both forms of rhodopsin have the same absorption maxima. This means that light that
photo-converts rhodopsin to metarhodopsin also photo-converts metarhodopsin to
rhodopsin. This process quickly reaches equilibrium and there is a 1:1 ratio of
rhodopsin and metarhodopsin present in the ventral photoreceptors. As a consequence
of this, we observed some unique results in the opsin experiments.
In cells injected with opsin morpholino, the dark bump rate is significantly
lower than those of control cells (Fig. 3.3). This is presumably because the opsin
morpholino injections reduce the opsin content in the cell. This results in reduction in
both rhodopsin and metarhodopsin. So the dark bump rate goes down.
The confocal experiments were designed to get an idea about the protein
levels in the injected cells. Analysis of fluorescent counts indicates that in the
presence of arrestin morpholino and opsin morpholino, there might be a reduction in
protein levels. This is in agreement with the electrophysiology data and is indicative
of the success of the morpholino technique in Limulus ventral photoreceptors.

89
We have demonstrated here that morpholino technique can be used to study
the different proteins involved in Limulus phototransduction. It is a powerful
technique that can be used to overcome the inability to do genetic studies in this
system.
90
Chapter 4
Discussion
4.1 Controls used in the experiments.
For the arrestin RNAi experiment, we tried two delivery methods. First was
adding RNAi to the bath in the culture medium. The controls for this experiment were
nerves placed in a separate dish that had no RNAi added to the culture medium.
Although this experiment resulted in an increased dark bump rate in the RNAi treated
cells, there was a lot of variability from cell to cell. So we decided to inject RNAi into
the cells instead. This also gave us the opportunity to use an internal control.
Experimental cells were the ones on a nerve that were injected while control cells
were the ones on the same nerve that were not injected. This meant that both
categories of cells were exposed to the same conditions of light, temperature, pH, and
osmolarity. Another control group was cells injected with the carrier solution. This
served to test the effect of injecting a specific volume of solution into the cells and
testing them at various time points after that.
For the morpholino experiment, there were two types of control. On a nerve,
some cells were injected with opsin morpholino and formed the experimental set. The
cells from the same nerve that were not injected formed the uninjected control set. In
some cells, an unrelated standard control morpholino was injected and these formed
another set of control. These controls addressed the issues of injecting large
91
molecules into cell, keeping the cells in the culture medium for up to 6 days, and of
specificity. For some experiments, the cells injected with opsin morpholino, cells
injected with control morpholino, and uninjected control cells were all from the same
nerve. These provided us with an excellent internal control.
4.2 RNAi vs. Morpholino; Morpholino is recommended.
What I have shown here is that the complementary oligonucleotide technique
seems to work for Limulus ventral photoreceptors. The arrestin data indicates that
although RNAi and morpholino work through different mechanisms, their effect on
the electrophysiology of cells is similar; that of a five-fold increase in bump rate.
Either of these techniques can be further used to understand the role of membrane
channels and other proteins in the photoreceptors. However, I would recommend
using morpholino as opposed to RNAi. This recommendation is based on the
production of these oligonucleotides and their mechanism of action. RNAi is targeted
against a long length of the gene (in case of arrestin RNAi it is about 300 base pairs).
Once the RNAi is delivered into the cells it breaks down into 25 bp –long strands and
gets amplified. This introduces a lot of uncertainties. We can neither identify specific
sequences that might have had the silencing effect nor can we estimate the
concentration of RNAi that was reached inside the cells. Once inside the cell, the
RNAi gets amplified and the concentration inside the cell can not be determined.
92
Morpholino on the other hand is manufactured as a 25bp long sequence
against an intentionally chosen site on the gene. Once delivered to the cell it does not
get amplified but functions for a long time because of its resistance to degradation by
endonucleases. Therefore it introduces a lot of specificity in our system. We can
control the sequence and the concentration of morpholino and study its effects on the
ventral photoreceptors. Although RNAi has been used as a preferred method in
several systems, in our system morpholino seems to be a better choice.
4.3 Arrestin reduces dark noise.
Visual arrestins forms a part of a large family of arrestins found in both
vertebrates and invertebrates (176review Palczewski 1994). In mammals, four
members of the arrestin gene family have been identified. Two of these are visual
arrestins. One is a form present in the rods and is called the s-antigent or arrestin
(177Review Krupnick & Benovic, 1998). The second occurs in the cones and in pineal
glands and is called x-arrestin, arrestin 4, or cone arrestin (CAR) (178Sakuma et al.,
1996). The other two types of arrestins are expressed ubiquitously and are called β-
arrestin1, and arrestin2. The first invertebrate arrestin homologue was characterized
in Drosophila (179Yamada et al., 1990; 180Smith et al., 1990).
Functionally, visual arrestin has been implicated in termination of light
response and retinal degeneration. To terminate the light response, it binds to
phosphorylated metarhodopsin (181Kuhn et al., 1984). Arrestin knock-out mice exhibit
93
prolonged photoresponses (182Xu et al., 1997). In Drosophila arrestin mutants there is
an increase in the prolonged depolarizing afterpotential (PDA) (183Dolph et al., 1993).
The observations above are indicative of a role of arrestin in terminating the light
response. In humans, a frameshift mutation in the arrestin gene causes slowed dark
adaptation and reduced sensitivity, a condition called Oguchi's disease (184Fuchus et
al., 1995). This suggests that arrestin is involved in dark adaptation. Dark adaptation
is the process that occurs when photoreceptors have been exposed to intense bright
light and are then exposed to darkness. Immediately after the onset of darkness, the
photoreceptors can not return to pre-light exposure sensitivity because their pigment
is “bleached”. The process in which this pigment recovers its sensitivity may take
tens of minutes in vertebrates and is called dark adaptation.
Arrestin plays a crucial role in retinal degeneration, a process in which it
forms stable arrestin-rhodopsin complexes that lead to apoptosis (185Alloway et al.,
2000). Higher arrestin levels have been observed in retinal degeneration slow (rds)
mutant mice. In these mice the inner segments are normal but the outer segments fail
to form. Accumulation of high concentration of arrestin is implicated in this
degeneration (186Agarwal et al., 1994). In arrestin KO mice, light driven degeneration
is observed in the photoreceptors (187Chen et al., 1999). In Drosophila, failure to
dissociate arrestin from the arrestin-rhodopsin complexes eventually leads to light-
dependent apoptosis of retinal photoreceptors (188Alloway et al., 2000).
94
Arrestin in Limulus has been implicated in internalization of rhodopsin in
response to light (189Sacunas et al., 2002). However, the function of arrestin in the
quenching of the light response has not been investigated. In our experiments we
show that a reduction in arrestin leads to an increase in dark noise. This was
demonstrated by the use of two different methods; RNAi, and morpholino injections.
Both of these techniques work through different mechanisms but have the same end
effect on the photoreceptor cells; that of increasing the spontaneous dark noise 5-fold.
This supports a role of arrestin in keeping the spontaneous dark noise level down.
4.4 Opsin confirmed as the photopigment in Limulus.
Visual pigments across different species are all made of a 7-transmembrane
protein (opsin) covalently linked to a chromophore. Most species have multiple opsin
genes. In vertebrates several „visual‟ and „non-visual‟ opsins have been identified
(190review Kumbalasiri & Provencio 2005). In humans, there are four visual opsins.
The one expressed in rods is the rhodopsin and the ones expressed in cones are S, M,
and L cone opsins. Invertebrates also have multiple opsin genes. In Drosophila, there
are 6 opsin genes, Rh1 to Rh-6, that are expressed in different cell types and no cell
expresses more than one type of opsin.
In Limulus, about four opsin genes have been sequenced (191Dalal et al.,
2003). Of those, two proteins generated from genes opsin1, and opsin 2, have been
identified. Opsin 1 and opsin 2 express in both the lateral and ventral eyes and opsin 1
95
is the more abundant transcript in the ventral photoreceptors. Information about the
expression of the other two possible opsin genes is not available.
Although these studies strongly indicate that opsins form the photopigment in
Limulus, there have been no functional studies to confirm that. Our
immunocytological studies show that there is a reduction in opsin content in the
presence of opsin morpholino. Our electrophysiological studies indicate that the
functional consequence of reducing opsin content through opsin morpholino is a 30-
fold decrease in sensitivity to light. This is consistent with the gene product of opsin 1
and opsin 2 forming the photopigment in Limulus ventral photoreceptors.
4.5 Consequence of opsins with similar spectral properties not resolved.
Multiple opsins occurring within a single eye have different spectral
properties. In humans, rhodopsin absorbs maximally at 500nm whereas the three cone
opsins S, M, and L absorb maximally at <500nm, ~530nm, and ~560nm respectively.
In some vertebrates there is a fifth opsin gene that senses ultraviolet light. Mice,
rabbits, guinea pigs, and probably marsupials appear to coexpress two opsins per cell
(192Rohlich et al., 1994; 193Applebury et al., 2000194Hemmi & Grunert, 1999). Fish,
eels, tiger salamander, and gecko express two or three opsins in the same cell
(195Archer & Lythgoe, 1990; 196Hope et al., 1998; 197Makino & Dodd, 1996; 198Loew
et al., 1996).Each of the six opsins expressed in Drosophila has different absorption
maxima (199Review Montell 1999). Butterfly photoreceptors express two visual
96
pigments per cell (200Kitamoto et al., 1998). The distinct absorption maxima of the
opsins work towards avoiding sensory overlap and broadening spectral sensitivity of
eyes.
Interestingly, the two opsins expressed in the ventral photoreceptors
presumably have the same spectral sensitivity since the domain thought to influence
this property is the same in both genes (201Briscoe, 2000; Dalal et al., 2003). A similar
phenomenon has been observed in the crab Hemigrapsus sanguineus where the two
opsins presumably have similar spectral properties (202Sakamoto et al., 1996).
However, the physiological significance of having multiple opsins with similar
spectral properties is not known.
In our experiments, the opsin morpholino was targeted against the 5‟ region of
the gene. In the two opsin genes that express in the ventral photoreceptors have
identical sequence in this region. So presumably the morpholino was targeted against
both the gene products. The antibody used was made against the C-terminus of the
opsin DNA. This antibody also presumably recognizes both the opsin products. We
observed a decrease in opsin levels in morpholino injected cells as indicated by a
decrease in fluorescence counts. Although this experiment indicates the success of the
morpholino technique, it still does not give any indication as to the significance of
multiple opsins with similar spectral properties.
97
4.6 Regulation of metarhodopsin deactivation is extremely critical in Limulus.
In Limulus, both rhodopsin and metarhodopsin share the same absorption
maxima (λmax =500nm). This phenomenon is also observed in the squid
photoreceptors but is unlike other animals in which the absorption maxima for
rhodopsin and metarhodopsin are different. For example, in Drosophila, rhodopsin
λmax =480nm (blue) and metarhodopsin λmax = 580nm (orange). Blue light converts
rhodopsin to metarhodopsin and orange light converts metarhodopsin to rhodopsin.
However, in Limulus, a photon that can activate rhodopsin to form metarhodopsin is
equally likely to change a metarhodopsin back into rhodopsin. As a result of this,
unlike vertebrates that have no metarhodopsin in the dark, and invertebrates such as
Drosophila, that has about 20% metarhodopsin in the dark, Limulus photoreceptor
cells have equal number of rhodopsin and metarhodopsin molecules. Since the total
opsin is estimated to be 109 molecules, it means that there are about 5* 108
metarhodopsin molecules present at any time (203Lisman et al., 1977).
The metarhodopsin stays inactive due to phosphorylation and arrestin binding.
However, sometimes it can spontaneously lose arrestin and become
dephosphorylated. This reaction, even though rare, may produce spontaneous bumps
in the dark. The rate of dark bump production in dissected Limulus photoreceptors
from about 5* 108 metarhodopsin molecules is about 1/s. In the event of reduction in
quenching by arrestin even by a fraction, the dark noise would go up several folds.
This shows that it is very crucial to tightly regulate metarhodopsin activation and
deactivation and arrestin forms an important part of this cycle.
98
This is consistent with our observation in arrestin RNAi and arrestin
morpholino experiments wherein a reduction in arrestin levels led to a five-fold
increase in the spontaneous dark bump rate.
4.7 Membrane channels involved in phototransduction.
Two types of photoreceptors have been identified in vertebrates and
invertebrates, ciliary, and rhabdomeric. The ciliary photoreceptors occur primarily in
vertebrates but are also seen in invertebrates. They respond to light either by
hyperpolarization or depolarization. However, they all use the cGMP pathway for
transduction. The membrane channels in these photoreceptors, the CNG channels,
either close or open during phototransduction. CNG channels were first implicated in
rod photoreceptors (204Fesenko et al., 1985). The same year these channels were
found to be involved in cone phototransduction (205Haynes & Yau, 1985). The
channel was cloned and expressed a few years later (206Kaupp et al., 1989).
Involvement of cGMP as a second messenger in the ciliary photoreceptors of scallop
was shown by 207Gomez & Nasi (1995). Scallop photoreceptors hyperpolarize in
response to light (208McReynolds, 1976).
The rhabdomeric photoreceptors, on the other hand, occur only in
invertebrates and absorption of photons always results in depolarization.
Phototransduction involves activation of the phorphoinositide second messenger
pathway and the membrane channels in Drosophila have been reported to be
99
TRP/TRPL channels that are part of the transient receptor potential (TRP) family
(209Hardie & Minke, 1992). However, the second messenger involved in activating
these channels is not known. Heterologous studies indicated a role of InsP3 in
activating these channels since addition of thapsigargin reduced Ca2+ levels and
activated these channels (210Vaca et al., 1994; 211Xu et al., 1997). However, this result
has not been duplicated in vivo. When Ca2+ was depleted using thapsigargin in vivo,
phototransduction was not affected (212Ranganathan et al., 1994). Caged InsP3 did not
activate any light sensitive channels (213Hardie and Raghu, 1998). InsP3R null mutant
did not have any defect in phototransduction (214Acharya et al., 1997). All of these
studies indicate that the TRP/TRPL channels are probably not activated via the
InsP3-mediated pathway. There is some indication that the DAG branch of the
phototransduction might be involved in the activation process. These channels were
shown to be activated in the presence of polyunsaturated fatty acids (PUFAs) which
are presumably produced after DAG hydrolysis (215Chyb et al., 1999). TRP channel
was shown to be constitutively active in Drosophila retinal degeneration A (rdgA)
mutants (216Raghu et al., 2000). The rdgA are diacylglycerol kinase mutants.
Diacylglycerol kinase converts DAG to phosphotidic acid and so the DAG
concentration in these mutants is expected to be high. These experiments support the
idea of DAG pathway to be involved in channel activation.
The success of the complementary oligonucleotide technique studied with
respect to arrestin and opsin provides us with a valuable tool that can be used to
manipulate the expression of CNG and/or TRP channels and study their effect on
100
phototransduction. As mentioned in the introduction section, the identity of the
membrane channel leading to membrane depolarization in Limulus is not known.
Injection of InsP3 and Ca2+ in the photoreceptors activates light-dependent
conductance (217Fein et al., 1984; 218Payne et al., 1986). This supports the role of Ca2+
in activating the channels. However, cGMP injections also activate light-dependent
conductance and indicate involvement of this second messenger (219Johnson et al.,
1986). Further evidence in support of this pathway comes from the work that shows
that the light-dependent channels open by cGMP and not by Ca2+ (220Bacigalupo et
al., 1991). In our laboratory, the cGMP and TRP channels have been cloned and
sequenced from the Limulus eye cDNA (221Chen at al., 1999; 222Bandyopadhyay and
Payne, 2004). We can now use this technique to study the functional consequence of
lowering the concentration of cGMP and trp.
4.8 Future directions.
The success of the RNAi and morpholino injection techniques opens new
doors to study phototransduction in Limulus ventral photoreceptors. These techniques
give us a handle on manipulating protein levels in the cells and thus overcoming the
shortcomings imposed by inability to perform mutagenesis.
An ERP experiment can be performed in the immediate future to show the
changes in pigment concentration in the presence of morpholinos. ERP occurs in the
presence of very bright light, has virtually no latency, and is hypothesized to be
101
generated directly by charge displacements produced by the isomerization of
rhodopsin (223Cone & Pak, 1971). Therefore, ERP is a direct measure of the amount
of rhodopsin and its intermediates present in the photoreceptor. The hydroxylamine
experiments indicate that the increased bumps are generated due to unquenched
metarhodopsin. The results from the hydroxylamine experiments are consistent with
the idea that bumps in the dark are generated by rhodopsin while bumps in the light
are generated by metarhodopsin. ERP experiments will be another way to prove this
point.
As mentioned before, a big question in Limulus phototransduction concerns
the identity of the membrane channel. There is indirect evidence supporting the
finvolvement of both cGMP and TRP channels. Since the sequences for both Limulus
TRP and cCMP are available, morpholinos against them can me made. It may now be
possible to use cGMP morpholino and trp morpholino to manipulate the levels of
these proteins and study the electrophysiological consequences. Defects in
electrophysiological responses in the presence of the cGMP morpholino or trp
morpholino would strongly indicate the involvement of that channel in Limulus
phototransduction. This technique can be extended to the study of any protein in the
ventral photoreceptors. Currently sequences are available for Gq and myosin.
Morpholinos can be made against these. As more and more sequences become
available, this technique can be extended to those proteins and play a valuable role in
understanding their function.
102
References 1 Fesenko EE, Kolesnikov SS, Lyubarsky AL. (1985) Induction by cyclic GMP of cationic conductance in plasma membrane of retinal rod outer segment. Nature. Jan 24-30; 313(6000):310-3. 2 Kaupp UB, Niidome T, Tanabe T, Terada S, Bonigk W, Stuhmer W, Cook NJ, Kangawa K, Matsuo H, Hirose T, et al. (1989) Primary structure and functional expression from complementary DNA of the rod photoreceptor cyclic GMP-gated channel. Nature. Dec 14; 342(6251):762-6.
3 Yarfitz S, Hurley JB. (1994) Transduction mechanisms of vertebrate and invertebrate photoreceptors. J Biol Chem. May 20; 269(20):14329-32.
4 Niemeyer BA, Suzuki E, Scott K, Jalink K, Zuker CS. (1996) The Drosophila light-activated conductance is composed of the two channels TRP and TRPL. Cell. May 31; 85(5):651-9.
5 Bloomquist BT, Shortridge RD, Schneuwly S, Perdew M, Montell C, Steller H, Rubin G, Pak WL. (1988) Isolation of a putative phospholipase C gene of Drosophila, norpA, and its role in phototransduction. Cell. Aug 26; 54(5):723-33.
6 Ranganathan R, Malicki DM, Zuker CS. (1995) Signal transduction in Drosophila photoreceptors. Annu Rev Neurosci.; 18:283-317. 7 Berridge MJ. (1993) Inositol trisphosphate and calcium signalling. Nature. Jan 28; 361(6410):315-25.
8 Bayer DS, Barlow RB Jr. (1978) Limulus ventral eye. Physiological properties of photoreceptor cells in an organ culture medium. J Gen Physiol. Oct; 72(4):539-63. 9 Dorlochter M, Stieve H. (1997) The Limulus ventral photoreceptor: light response and the role of calcium in a classic preparation. Prog Neurobiol. Nov; 53(4):451-515.
10 Stern J, Chinn K, Bacigalupo J, Lisman J. (1982) Distinct lobes of Limulus ventral photoreceptors. I. Functional and anatomical properties of lobes revealed by removal of glial cells. J Gen Physiol. Dec; 80(6):825-37. 11 Calman BG, Chamberlain SC. (1982) Distinct lobes of Limulus ventral photoreceptors. II. Structure and ultrastructure. J Gen Physiol. Dec; 80(6):839-62. 12 Payne R, Fein A. (1986) Localization of the photocurrent of Limulus ventral photoreceptors using a vibrating probe. Biophys J. Jul; 50(1):193-6.
103
13 Brown JE, Rubin LJ. (1984) A direct demonstration that inositol-trisphosphate induces an increase in intracellular calcium in Limulus photoreceptors. Biochem Biophys Res Commun. Dec 28; 125(3):1137-42. 14 Fein A, Payne R, Corson DW, Berridge MJ, Irvine RF. (1984) Photoreceptor excitation and adaptation by inositol 1, 4, 5-trisphosphate. Nature. Sep 13-19; 311(5982):157-60. 15 Payne R, Corson DW, Fein A, Berridge MJ. (1986) Excitation and adaptation of Limulus ventral photoreceptors by inositol 1, 4, 5 triphosphate result from a rise in intracellular calcium. J Gen Physiol. Jul; 88(1):127-42. 16 Fein A, Payne R, Corson DW, Berridge MJ, Irvine RF. (1984) Photoreceptor excitation and adaptation by inositol 1,4,5-trisphosphate. Nature. Sep 13-19; 311(5982):157-60. 17 Payne R, Corson DW, Fein A, Berridge MJ. (1986) Excitation and adaptation of Limulus ventral photoreceptors by inositol 1, 4, 5 triphosphate result from a rise in intracellular calcium. J Gen Physiol. Jul;88(1):127-42.
18 Shin J, Richard EA, Lisman JE. (1993) Ca2+ is an obligatory intermediate in the excitation cascade of limulus photoreceptors. Neuron. Nov; 11(5):845-55.
19 Payne R, Corson DW, Fein A. (1986) Pressure injection of calcium both excites and adapts Limulus ventral photoreceptors. J Gen Physiol. Jul; 88(1):107-26.
20 Frank TM, Fein A. (1991) The role of the inositol phosphate cascade in visual excitation of invertebrate microvillar photoreceptors. J Gen Physiol. Apr; 97(4):697-723.
21 Johnson EC, Robinson PR, Lisman JE. (1986) Cyclic GMP is involved in the excitation of invertebrate photoreceptors. Nature. Dec 4-10; 324(6096):468-70. 22 Bacigalupo J, Johnson EC, Vergara C, Lisman JE. (1991) Light-dependent channels from excised patches of Limulus ventral photoreceptors are opened by cGMP. Proc Natl Acad Sci U S A. Sep 15; 88(18):7938-42.
23 Garger A, Richard EA, Lisman JE. (2001) Inhibitors of guanylate cyclase inhibit phototransduction in limulus ventral photoreceptors. Vis Neurosci. Jul-Aug; 18(4):625-32. 24 Chen FH, Ukhanova M, Thomas D, Afshar G, Tanda S, Battelle BA, Payne R. (1999) Molecular cloning of a putative cyclic nucleotide-gated ion channel cDNA from Limulus polyphemus. J Neurochem. Feb; 72(2):461-71.
104
25 Bandyopadhyay BC, Payne R. (2004) Variants of TRP ion channel mRNA present in horseshoe crab ventral eye and brain. J Neurochem. Nov; 91(4):825-35. 26 Fire et al., (1998) Potent and specific genetic interference by double-stranded RNA in Caenorhabditis elegans. Nature, 391, 806–811. 27 Hammond et al., (2000) An RNA-directed nuclease mediates post-transcriptional gene silencing in Drosophila cells. Nature. Mar 16; 404(6775):293-6. 28 Chuang CF and Meyerowitz EM (2000) Specific and heritable genetic interference by double-stranded RNA in Arabidopsis thaliana. Proc Natl Acad Sci U S A. Apr 25; 97(9):4985-90. 29 Misquitta L and Paterson BM (1999) Targeted disruption of gene function in Drosophila by RNA interference (RNA-i): a role for nautilus in embryonic somatic muscle formation. Proc Natl Acad Sci U S A. Feb 16; 96(4):1451-6. 30 Caplen NJ, Parrish S, Imani F, Fire A, and Morgan RA (2001) Specific inhibition of gene expression by small double-stranded RNAs in invertebrate and vertebrate systems. Proc Natl Acad Sci U S A. Aug 14; 98(17):9742-7. 31 Tuschl T, Zamore PD, Lehmann R, Bartel DP and Sharp PA (1999) Targeted mRNA degradation by double-stranded RNA in vitro. Genes Dev. Dec 15; 13(24):3191-7. 32 Summerton J, Weller D. (1997) Morpholino antisense oligomers: design, preparation, and properties. Antisense Nucleic Acid Drug Dev. Jun; 7(3):187-95. 33 Hudziak RM, Barofsky E, Barofsky DF, Weller DL, Huang SB, Weller DD. (1996) Resistance of morpholino phosphorodiamidate oligomers to enzymatic degradation. Antisense Nucleic Acid Drug Dev. Winter; 6(4):267-72. 34 Summerton J. (1999) Morpholino antisense oligomers: the case for an RNase H-independent structural type. Biochim Biophys Acta. Dec 10; 1489(1):141-58. 35 Ekker SC, Larson JD. (2001) Morphant technology in model developmental systems. Genesis. Jul; 30(3):89-93. 36 Wald G. (1968) Molecular basis of visual excitation. Science. Oct 11; 162(850):230-9. 37 Bownds D. (1967) Site of attachment of retinal in rhodopsin. Nature. Dec 23; 216(121):1178-81.
38 Wang JK, McDowell JH, Hargrave PA. (1980) Site of attachment of 11-cis-retinal in bovine rhodopsin. Biochemistry. Oct 28; 19(22):5111-7.
105
39 Baldwin JM, Schertler GF, Unger VM. (1997) An alpha-carbon template for the transmembrane helices in the rhodopsin family of G-protein-coupled receptors. J Mol Biol. Sep 12; 272(1):144-64. 40 Wang Q, Schoenlein RW, Peteanu LA, Mathies RA, Shank CV. (1994) Vibrationally coherent photochemistry in the femtosecond primary event of vision. Science. Oct 21; 266(5184):422-4. 41 Okada T, Ernst OP, Palczewski K, Hofmann KP. (2001) Activation of rhodopsin: new insights from structural and biochemical studies. Trends Biochem Sci. May; 26(5):318-24.
42 Shichida Y, Imai H. (1998) Visual pigment: G-protein-coupled receptor for light signals. Cell Mol Life Sci. Dec; 54(12):1299-315.
43 Stryer L. (1986) Cyclic GMP cascade of vision. Annu Rev Neurosci.; 9:87-119.
44 Nathans J. (1992) Rhodopsin: structure, function, and genetics. Biochemistry. Jun 2; 31(21):4923-31.
45 Dryja TP, McGee TL, Reichel E, Hahn LB, Cowley GS, Yandell DW, Sandberg MA, Berson EL. (1990) A point mutation of the rhodopsin gene in one form of retinitis pigmentosa. Nature. Jan 25; 343(6256):364-6.
46 Olsson JE, Gordon JW, Pawlyk BS, Roof D, Hayes A, Molday RS, Mukai S, Cowley GS, Berson EL, Dryja TP. (1992) Transgenic mice with a rhodopsin mutation (Pro23His): a mouse model of autosomal dominant retinitis pigmentosa. Neuron. Nov; 9(5):815-30. 47 Toda K, Bush RA, Humphries P, Sieving PA. (1999) The electroretinogram of the rhodopsin knockout mouse. Vis Neurosci. Mar-Apr; 16(2):391-8. 48 Humphries MM, Rancourt D, Farrar GJ, Kenna P, Hazel M, Bush RA, Sieving PA, Sheils DM, McNally N, Creighton P, Erven A, Boros A, Gulya K, Capecchi MR, Humphries P. (1997) Retinopathy induced in mice by targeted disruption of the rhodopsin gene. Nat Genet. Feb; 15(2):216-9. 49 Lee YJ, Dobbs MB, Verardi ML, Hyde DR. (1990) dgq: a drosophila gene encoding a visual system-specific G alpha molecule. Neuron. Dec; 5(6):889-98. 50 Scott K, Becker A, Sun Y, Hardy R, Zuker C. (1995) Gq alpha protein function in vivo: genetic dissection of its role in photoreceptor cell physiology. Neuron. Oct; 15(4):919-27.
106
51 Yoshizawa T, Wald G. (1964) TRANSFORMATIONS OF SQUID RHODOPSIN AT LOW TEMPERATURES. Nature. Jan 25; 201:340-5.
52 Kropf A, Brown PK, Hubbard R. (1959) Lumi- and meta-rhodopsins of squid and octopus. Nature. Feb 14; 183(4659):446-8.
53 Fesenko EE, Kolesnikov SS, Lyubarsky AL. (1985) Induction by cyclic GMP of cationic conductance in plasma membrane of retinal rod outer segment. Nature. Jan 24-30; 313(6000):310-3.
54 Hagins WA, Zonana HV, Adams RG. (1962) Local membrane current in the outer segments of squid photoreceptors. Nature. Jun 2; 194:844-7.
55 Bortoff A. (1964) Localization of slow potential responses in the Necturus retina. Vision Res. Dec;4(11):627-35.
56 O'Tousa JE, Baehr W, Martin RL, Hirsh J, Pak WL, Applebury ML. (1985) The Drosophila ninaE gene encodes an opsin. Cell. Apr; 40(4):839-50.
57 Zuker CS, Cowman AF, Rubin GM. (1985) Isolation and structure of a rhodopsin gene from D. melanogaster. Cell. Apr; 40(4):851-8.
58 O'Tousa JE, Leonard DS, Pak WL. (1989) Morphological defects in oraJK84 photoreceptors caused by mutation in R1-6 opsin gene of Drosophila. J Neurogenet. Sep; 6(1):41-52.
59 Leonard DS, Bowman VD, Ready DF, Pak WL. (1992) Degeneration of photoreceptors in rhodopsin mutants of Drosophila. J Neurobiol. Aug; 23(6):605-26.
60 Colley NJ, Cassill JA, Baker EK, Zuker CS. (1995) Defective intracellular transport is the molecular basis of rhodopsin-dependent dominant retinal degeneration. Proc Natl Acad Sci U S A. Mar 28; 92(7):3070-4. 61 Kurada P, O'Tousa JE. (1995) Retinal degeneration caused by dominant rhodopsin mutations in Drosophila. Neuron. Mar; 14(3):571-9.
62 Iakhine R, Chorna-Ornan I, Zars T, Elia N, Cheng Y, Selinger Z, Minke B, Hyde DR. (2004) Novel dominant rhodopsin mutation triggers two mechanisms of retinal degeneration and photoreceptor desensitization. J Neurosci. Mar 10; 24(10):2516-26.
63 Dalal JS, Jinks RN, Cacciatore C, Greenberg RM, Battelle BA. (2003) Limulus opsins: diurnal regulation of expression. Vis Neurosci. Sep-Oct; 20(5):523-34.
107
64 Smith WC, Price DA, Greenberg RM, Battelle BA. (1993) Opsins from the lateral eyes and ocelli of the horseshoe crab, Limulus polyphemus. Proc Natl Acad Sci U S A. Jul 1; 90(13):6150-4.
65 Hargrave PA, McDowell JH. (1992) Rhodopsin and phototransduction: a model system for G protein-linked receptors. FASEB J. Mar; 6(6):2323-31.
66 Krupnick JG, Benovic JL. (1998) The role of receptor kinases and arrestins in G protein-coupled receptor regulation. Annu Rev Pharmacol Toxicol.; 38:289-319. 67 Sakuma H, Inana G, Murakami A, Higashide T, McLaren MJ. (1996) Immunolocalization of X-arrestin in human cone photoreceptors. FEBS Lett. Mar 11; 382(1-2):105-10. 68 LeVine H 3rd, Smith DP, Whitney M, Malicki DM, Dolph PJ, Smith GF, Burkhart W, Zuker CS. (1990) Isolation of a novel visual-system-specific arrestin: an in vivo substrate for light-dependent phosphorylation. Mech Dev. Dec; 33(1):19-25. 69 Yamada T, Takeuchi Y, Komori N, Kobayashi H, Sakai Y, Hotta Y, Matsumoto H. (1990) A 49-kilodalton phosphoprotein in the Drosophila photoreceptor is an arrestin homolog. Science. Apr 27; 248(4954):483-6. 70 Wilden and Kuhn (1982) Light-dependent phosphorylation of rhodopsin: number of phosphorylation sites. Biochemistry. Jun 8; 21(12):3014-22. 71 Schleicher A, Kuhn H, Hofmann KP. (1989) Kinetics, binding constant, and activation energy of the 48-kDa protein-rhodopsin complex by extra-metarhodopsin II. Biochemistry. Feb 21; 28(4):1770-5. 72 Mendez A, Burns ME, Roca A, Lem J, Wu LW, Simon MI, Baylor DA, Chen J. (2000) Rapid and reproducible deactivation of rhodopsin requires multiple phosphorylation sites. Neuron. Oct; 28(1):153-64.
73 Gurevich VV, Gurevich EV. (2004) The molecular acrobatics of arrestin activation. Trends Pharmacol Sci. Feb; 25(2):105-11. 74 Kuhn, Hall and Wilden (1984) Light-induced binding of 48-kDa protein to photoreceptor membranes is highly enhanced by phosphorylation of rhodopsin. FEBS Lett. Oct 29; 176(2):473-8. 75 Wilden U, Hall SW, Kuhn H. (1986) Phosphodiesterase activation by photoexcited rhodopsin is quenched when rhodopsin is phosphorylated and binds the intrinsic 48-kDa protein of rod outer segments. Proc Natl Acad Sci U S A. Mar; 83(5):1174-8.
108
76 Palczewski K, Jager S, Buczylko J, Crouch RK, Bredberg DL, Hofmann KP, Asson-Batres MA, Saari JC. (1994) Rod outer segment retinol dehydrogenase: substrate specificity and role in phototransduction. Biochemistry. Nov 22; 33(46):13741-50.
77 Palczewski et al., (1989) The catalytic subunit of phosphatase 2A dephosphorylates phosphoopsin. Biochemistry. Jan 24; 28(2):415-9. 78 Fuchs S, Nakazawa M, Maw M, Tamai M, Oguchi Y, Gal A. (1995) A homozygous 1-base pair deletion in the arrestin gene is a frequent cause of Oguchi disease in Japanese. Nat Genet. Jul; 10(3):360-2. 79 Oguchi, C. (1970) Uber eine Abart von Hemeralopie. Acta Soc Ophthalmol Jpn 11:123-134. 80 Maw, M. A.; John, S.; Jablonka, S.; Muller, B.; Kumaramanickavel, G.; Oehlmann, R.; Denton, M. J.; Gal, A. (1995) Oguchi disease: suggestion of linkage to markers on chromosome 2q. J. Med. Genet. 32: 396-398. 81 Mizuo, G. (1993) A new discovery in dark adaptation in Oguchi disease. Acta Soc. Ophthalmol. Jpn. 17, 1148–1150. 82 Carr, R.E. and Ripps, H. (1991) Rhodopsin kinetics and rod adaptation in Oguchi disease. Invest. Ophthalmol. 6, 426–436. 83 Xu et al.; (1997) Prolonged photoresponses in transgenic mouse rods lacking arrestin. Nature. Oct 2; 389(6650):505-9. 84 Bentrop J, Plangger A, Paulsen R. (1993) An arrestin homolog of blowfly photoreceptors stimulates visual-pigment phosphorylation by activating a membrane-associated protein kinase. Eur J Biochem. Aug 15; 216(1):67-73. 85 Byk T, Bar-Yaacov M, Doza YN, Minke B, Selinger Z. (1993) Regulatory arrestin cycle secures the fidelity and maintenance of the fly photoreceptor cell. Proc Natl Acad Sci U S A. Mar 1; 90(5):1907-11. 86 Vinos et al., (1997) A G protein-coupled receptor phosphatase required for rhodopsin function. Science. 1997 Aug 1; 277(5326):687-90. 87 Dolph PJ et al., (1993) Arrestin function in inactivation of G protein-coupled receptor rhodopsin in vivo. Science. Jun 25; 260(5116):1910-6. 88 Smith et al., (1995) Isolation and expression of an arrestin cDNA from the horseshoe crab lateral eye. J. Neurochem. 1995 Jan; 64(1):1-13.
109
89 Battelle et al., (2001) Immunocytochemical localization of opsin, visual arrestin, myosin III, and calmodulin in Limulus lateral eye retinular cells and ventral photoreceptors. J Comp Neurol. 2001 Jun 25; 435(2):211-25. 90 Smith WC, Greenberg RM, Calman BG, Hendrix MM, Hutchinson L, Donoso LA, Battelle BA. (1995) Isolation and expression of an arrestin cDNA from the horseshoe crab lateral eye. J Neurochem. Jan; 64(1):1-13.
91 Calman BG, Andrews AW, Rissler HM, Edwards SC, Battelle BA. (1996) Calcium/calmodulin-dependent protein kinase II and arrestin phosphorylation in Limulus eyes. J Photochem Photobiol B. Aug; 35(1-2):33-44.
92 Bowes C, van Veen T, Farber DB. (1988) Opsin, G-protein and 48-kDa protein in normal and rd mouse retinas: developmental expression of mRNAs and proteins and light/dark cycling of mRNAs. Exp Eye Res. Sep; 47(3):369-90. 93 McGinnis JF, Whelan JP, Donoso LA. (1992) Transient, cyclic changes in mouse visual cell gene products during the light-dark cycle. J Neurosci Res. Mar; 31(3):584-90.
94 Korenbrot JI, Fernald RD. (1989) Circadian rhythm and light regulate opsin mRNA in rod photoreceptors. Nature. Feb 2; 337(6206):454-7. 95 Schwemer J (1984) Renewal of visual pigment in photoreceptors of the blowfly. Journal of Comparative Physiology A: Neuroethology, Sensory, Neural, and Behavioral Physiology 154(4): 535-547. 96 Dalal JS, Jinks RN, Cacciatore C, Greenberg RM, Battelle BA. (2003) Limulus opsins: diurnal regulation of expression. Vis Neurosci. Sep-Oct; 20(5):523-34. 97 Bowes C, van Veen T, Farber DB. (1988) Opsin, G-protein and 48-kDa protein in normal and rd mouse retinas: developmental expression of mRNAs and proteins and light/dark cycling of mRNAs. Exp Eye Res. Sep; 47(3):369-90. 98 Craft CM, Whitmore DH, Donoso LA. (1990) Differential expression of mRNA and protein encoding retinal and pineal S-antigen during the light/dark cycle. J Neurochem. Nov;55(5):1461-73. 99 McGinnis JF, Whelan JP, Donoso LA. (1992) Transient, cyclic changes in mouse visual cell gene products during the light-dark cycle. J Neurosci Res. Mar; 31(3):584-90.
100 McGinnis JF, Austin BJ, Stepanik PL and Lerious V. (1994) Light-dependent regulation of the transcriptional activity of the mammalian gene for arrestin. J Neurosci Res. Jul 1; 38(4):479-82.
110
101 Agarwal N, Nir I and Papermaster DS. (1994) Loss of diurnal arrestin gene expression in rds mutant mouse retinas. Exp Eye Res. Jan; 58(1):1-8. 102 Organisciak DT, Xie A, Wang HM, Jiang YL, Darrow RM, Donoso LA. (1991) Adaptive changes in visual cell transduction protein levels: effect of light. Exp Eye Res. Dec; 53(6):773-9. 103 Hartman SJ, Menon I, Haug-Collet K, Colley NJ. (2001) Expression of rhodopsin and arrestin during the light-dark cycle in Drosophila. Mol Vis. Apr 17; 7:95-100. 104 Green CB, Besharse JC. (1996) Use of a high stringency differential display screen for identification of retinal mRNAs that are regulated by a circadian clock. Brain Res Mol Brain Res. Apr; 37(1-2):157-65.
105 Battelle BA, Williams CD, Schremser-Berlin JL, Cacciatore C. (2000) Regulation of arrestin mRNA levels in Limulus lateral eye: separate and combined influences of circadian efferent input and light. Vis Neurosci. Mar-Apr; 17(2):217-27.
106 Scholes J. (1965) Discontinuity of the excitation process in locust visual cells. Cold Spring Harb Symp Quant Biol.; 30:517-27.
107 DeVoe RD. (1972) Dual sensitivities of cells in wolf spider eyes at ultraviolet and visible wavelengths of light. J Gen Physiol. Mar; 59(3):247-69.
108 Takeda T. (1982) Discrete potential waves in the photoreceptors of a gastropod mollusc, Hermissenda crassicornis Vision Res.; 22(2):303-9.
109 Baylor DA, Lamb TD, Yau KW. (1979) Responses of retinal rods to single photons. J Physiol. Mar; 288:613-34.
110 Barlow RB, Birge RR, Kaplan E, Tallent JR. (1993) On the molecular origin of photoreceptor noise. Nature. Nov 4; 366(6450):64-6.
111 Aho AC, Donner K, Hyden C, Larsen LO, Reuter T. (1988) Low retinal noise in animals with low body temperature allows high visual sensitivity. Nature. Jul 28; 334(6180):348-50.
112 Birge and Barlow (1995) On the molecular origins of thermal noise in vertebrate and invertebrate photoreceptors. Biophys Chem. Jun-Jul; 55(1-2):115-26. 113 Yeandle S, Spiegler JB. (1973) Light-evoked and spontaneous discrete waves in the ventral nerve photoreceptor of Limulus. J Gen Physiol. May; 61(5):552-71.
111
114 Baylor DA, Matthews G, Yau KW. (1980) Two components of electrical dark noise in toad retinal rod outer segments. J Physiol. Dec; 309:591-621. 115 Lisman (1985) The role of metarhodopsin in the generation of spontaneous quantum bumps in ultraviolet receptors of Limulus median eye. J Gen Physiol. 85: 171-187. 116 Dodge FA Jr, Knight BW, Toyoda J. (1968) Voltage noise in Limulus visual cells. Science. Apr 5; 160(823):88-90.
117 Fire et al., (1998) Potent and specific genetic interference by double-stranded RNA in Caenorhabditis elegans. Nature, 391, 806–811. 118 Hammond et al., (2000) An RNA-directed nuclease mediates post-transcriptional gene silencing in Drosophila cells. Nature. Mar 16; 404(6775):293-6. 119 Chuang CF and Meyerowitz EM (2000) Specific and heritable genetic interference by double-stranded RNA in Arabidopsis thaliana. Proc Natl Acad Sci U S A. Apr 25; 97(9):4985-90. 120 Misquitta L and Paterson BM (1999) Targeted disruption of gene function in Drosophila by RNA interference (RNA-i): a role for nautilus in embryonic somatic muscle formation. Proc Natl Acad Sci U S A. Feb 16;96(4):1451-6. 121 Caplen NJ, Parrish S, Imani F, Fire A, and Morgan RA (2001) Specific inhibition of gene expression by small double-stranded RNAs in invertebrate and vertebrate systems. Proc Natl Acad Sci U S A. Aug 14; 98(17):9742-7. 122 Tuschl T, Zamore PD, Lehmann R, Bartel DP and Sharp PA (1999) Targeted mRNA degradation by double-stranded RNA in vitro. Genes Dev. Dec 15; 13(24):3191-7 123 Timmons L, Fire A. (1998) Specific interference by ingested dsRNA. Nature. Oct 29; 395(6705):854. 124 Nakano H, Amemiya S, Shiokawa K, Taira M. (2000) RNA interference for the organizer-specific gene Xlim-1 in Xenopus embryos. Biochem Biophys Res Commun. Aug 2; 274(2):434-9. 125 Crescitelli F (1958) The natural history of visual pigments. Ann. N.Y. Acad. Sci. 74: 230-255. 126 Abrahamson et al., (1974) Comparative properties of vertebrate and invertebrate photoreceptors. Expl Eye Res. 18: 51-67.
112
127 Leibrock CS, Lamb TD. (1997) Effect of hydroxylamine on photon-like events during dark adaptation in toad rod photoreceptors. J Physiol. May 15; 501 (Pt 1):97-109.
128 Cone R.A. & W. L. Pak (1971) The early receptor potential. In Handbook of sensory physiology. Vol I. Principles of receptor physiology. W.R. Lowenstein, editor. Springer-verlag, Berlin. 345-365 129 Faddis and Brown (1992) Flash photolysis of caged compounds in Limulus ventral photoreceptors J Gen Physiol. 100: 547-570. 130 Wang Y, Deshpande M, Payne R. (2002) 2-Aminoethoxydiphenyl borate inhibits phototransduction and blocks voltage-gated potassium channels in Limulus ventral photoreceptors. Cell Calcium. Oct; 32(4):209-16. 131 Corson DW, Fein A. (1983) Quantitative pressure injection of picoliter volumes into Limulus ventral photoreceptors. Biophys J. Dec; 44(3):299-304. 132 Tabara et al., (1998) RNAi in C. elegans: soaking in the genome sequence. Science. Oct 16; 282(5388):430-1. 133 Ratliff F, Knight BW Jr, Dodge FA Jr, Hartline HK.( 1974) Fourier analysis of dynamics of excitation and inhibition in the eye of Limulus: amplitude, phase and distance. Vision Res. Nov; 14(11):1155-68.
134 Hardie RC, Minke B. (1994) Spontaneous activation of light-sensitive channels in Drosophila photoreceptors. J Gen Physiol. Mar; 103(3):389-407. 135 Bowes C, van Veen T, Farber DB. (1988) Opsin, G-protein and 48-kDa protein in normal and rd mouse retinas: developmental expression of mRNAs and proteins and light/dark cycling of mRNAs. Exp Eye Res. Sep; 47(3):369-90. 136 Craft CM, Whitmore DH, Donoso LA. (1990) Differential expression of mRNA and protein encoding retinal and pineal S-antigen during the light/dark cycle. J Neurochem. Nov; 55(5):1461-73. 137 McGinnis JF, Whelan JP, Donoso LA. (1992) Transient, cyclic changes in mouse visual cell gene products during the light-dark cycle. J Neurosci Res. Mar; 31(3):584-90.
138 Korenbrot JI, Fernald RD. (1989) Circadian rhythm and light regulate opsin mRNA in rod photoreceptors. Nature. Feb 2; 337(6206):454-7. 139 Hartman SJ, Menon I, Haug-Collet K, Colley NJ. (2001) Expression of rhodopsin and arrestin during the light-dark cycle in Drosophila. Mol Vis. Apr 17; 7:95-100.
113
140 Green CB, Besharse JC. (1996) Use of a high stringency differential display screen for identification of retinal mRNAs that are regulated by a circadian clock. Brain Res Mol Brain Res. Apr; 37(1-2):157-65.
141 Sacunas et al., (2002) Multiple mechanisms of rhabdom shedding in the lateral eye of Limulus Polyphemus. J Comp Neurol. Jul 15; 449(1):26-42. 142 Battelle et al., (2000) Regulation of arrestin mRNA levels in Limulus lateral eye: separate and combined influences of circadian efferent input and light. Vis Neurosci. Mar-Apr; 17(2):217-27. 143 Agarwal N, Nir I, Papermaster DS. (1994) Loss of diurnal arrestin gene expression in rds mutant mouse retinas. Exp Eye Res. Jan; 58(1):1-8.
144 Leibrock CS, Lamb TD. (1997) Effect of hydroxylamine on photon-like events during dark adaptation in toad rod photoreceptors. J Physiol. May 15; 501 (Pt 1):97-109. 145 Baylor DA, Matthews G, Yau KW. (1980) Two components of electrical dark noise in toad retinal rod outer segments. J Physiol. Dec; 309:591-621. 146 Xu et al.; (1997) Prolonged photoresponses in transgenic mouse rods lacking arrestin. Nature. Oct 2; 389(6650):505-9. 147 Dolph PJ et al., (1993) Arrestin function in inactivation of G protein-coupled receptor rhodopsin in vivo. Science. Jun 25; 260(5116):1910-6. 148 Summerton J, Weller D. (1997) Morpholino antisense oligomers: design, preparation, and properties. Antisense Nucleic Acid Drug Dev. Jun; 7(3):187-95. 149 Summerton J. (1999) Morpholino antisense oligomers: the case for an RNase H-independent structural type. Biochim Biophys Acta. Dec 10; 1489(1):141-58. 150 Iversen PL. (2001) Phosphorodiamidate morpholino oligomers: favorable properties for sequence-specific gene inactivation. Curr Opin Mol Ther. Jun; 3(3):235-8. 151 Summerton J, Stein D, Huang SB, Matthews P, Weller D, Partridge M. (1997) Morpholino and phosphorothioate antisense oligomers compared in cell-free and in-cell systems. Antisense Nucleic Acid Drug Dev. Apr; 7(2):63-70. 152 Hudziak RM, Barofsky E, Barofsky DF, Weller DL, Huang SB, Weller DD. (1996) Resistance of morpholino phosphorodiamidate oligomers to enzymatic degradation. Antisense Nucleic Acid Drug Dev. Winter; 6(4):267-72.
114
153 Heasman J. (2002) Morpholino oligos: making sense of antisense? Dev Biol. Mar 15; 243(2):209-14. 154 Heasman J, Kofron M, Wylie C. (2000) Beta-catenin signaling activity dissected in the early Xenopus embryo: a novel antisense approach. Dev Biol. Jun 1; 222(1):124-34. 155 Nasevicius A, Ekker SC. (2000) Effective targeted gene 'knockdown' in zebrafish. Nat Genet. Oct; 26(2):216-20.
156 Howard EW, Newman LA, Oleksyn DW, Angerer RC, Angerer LM. (2001) SpKrl: a direct target of beta-catenin regulation required for endoderm differentiation in sea urchin embryos. Development. Feb; 128(3):365-75. 157 Boguslavsky D, Ierusalimsky V, Malyshev A, Balaban P, Belyavsky A. (2003) Selective blockade of gene expression in a single identified snail neuron. Neuroscience. 119(1):15-8.
158 Kuhn, Hall and Wilden (1984) Light-induced binding of 48-kDa protein to photoreceptor membranes is highly enhanced by phosphorylation of rhodopsin. FEBS Lett. Oct 29; 176(2):473-8. 159 Palczewski K, Benovic JL. (1991) G-protein-coupled receptor kinases. Trends Biochem Sci. Oct; 16(10):387-91. 160 Hyde DR, Mecklenburg KL, Pollock JA, Vihtelic TS, Benzer S. (1990)Twenty Drosophila visual system cDNA clones: one is a homolog of human arrestin. Proc Natl Acad Sci U S A. Feb; 87(3):1008-12. 161 Smith DP, Shieh BH, Zuker CS. (1990) Isolation and structure of an arrestin gene from Drosophila. Proc Natl Acad Sci U S A. Feb; 87(3):1003-7.
162 LeVine H 3rd, Smith DP, Whitney M, Malicki DM, Dolph PJ, Smith GF, Burkhart W, Zuker CS. (1990) Isolation of a novel visual-system-specific arrestin: an in vivo substrate for light-dependent phosphorylation. Mech Dev. Dec; 33(1):19-25. 163 Dolph PJ, Ranganathan R, Colley NJ, Hardy RW, Socolich M, Zuker CS. (1993) Arrestin function in inactivation of G protein-coupled receptor rhodopsin in vivo. Science. Jun 25; 260(5116):1910-6. 164 Smith WC, Greenberg RM, Calman BG, Hendrix MM, Hutchinson L, Donoso LA, Battelle BA. (1995) Isolation and expression of an arrestin cDNA from the horseshoe crab lateral eye. J Neurochem. Jan; 64(1):1-13.
115
165 Smith WC, Price DA, Greenberg RM, Battelle BA. (1993) Opsins from the lateral eyes and ocelli of the horseshoe crab, Limulus polyphemus. Proc Natl Acad Sci U S A. Jul 1; 90(13):6150-4.
166 Clark AW, Millecchia R, Mauro A. (1969) The ventral photoreceptor cells of Limulus. I. The microanatomy. J Gen Physiol. Sep; 54(3):289-309. 167 Wang Y, Deshpande M, Payne R. (2002) 2-Aminoethoxydiphenyl borate inhibits phototransduction and blocks voltage-gated potassium channels in Limulus ventral photoreceptors. Cell Calcium. Oct; 32(4):209-16.
168 Pepperkok R, Zanetti M, King R, Delia D, Ansorge W, Philipson L, Schneider C. (1988) Automatic microinjection system facilitates detection of growth inhibitory mRNA. Proc Natl Acad Sci U S A. Sep; 85(18):6748-52. 169 Hudziak RM, Barofsky E, Barofsky DF, Weller DL, Huang SB, Weller DD. (1996) Resistance of morpholino phosphorodiamidate oligomers to enzymatic degradation. Antisense Nucleic Acid Drug Dev. Winter; 6(4):267-72. 170 Bayer DS, Barlow RB Jr. (1978) Limulus ventral eye. Physiological properties of photoreceptor cells in an organ culture medium. J Gen Physiol. Oct; 72(4):539-63. 171 Kirkwood A, Lisman JE. (1994) Determinants of single photon response variability. J Gen Physiol. Apr; 103(4):679-90.
172Iversen PL, Arora V, Acker AJ, Mason DH, Devi GR. (2003) Efficacy of antisense morpholino oligomer targeted to c-myc in prostate cancer xenograft murine model and a Phase I safety study in humans. Clin Cancer Res. Jul; 9(7):2510-9. 173 Hartman SJ, Menon I, Haug-Collet K, Colley NJ. (2001) Expression of rhodopsin and arrestin during the light-dark cycle in Drosophila. Mol Vis. Apr 17; 7:95-100. 174 Dalal JS, Jinks RN, Cacciatore C, Greenberg RM, Battelle BA. (2003) Limulus opsins: diurnal regulation of expression. Vis Neurosci. Sep-Oct; 20(5):523-34. 175 Matsumoto H, O'Tousa JE, Pak WL. (1982) Light-induced modification of Drosophila retinal polypeptides in vivo. Science. Aug 27; 217(4562):839-41. 176 Palczewski K. (1994) Structure and functions of arrestins. Protein Sci. Sep; 3(9):1355-61. 177 Krupnick JG, Benovic JL. (1998) The role of receptor kinases and arrestins in G protein-coupled receptor regulation. Annu Rev Pharmacol Toxicol.; 38:289-319.

116
178 Sakuma H, Inana G, Murakami A, Higashide T, McLaren MJ. (1996) Immunolocalization of X-arrestin in human cone photoreceptors. FEBS Lett. Mar 11; 382(1-2):105-10. 179 Yamada T, Takeuchi Y, Komori N, Kobayashi H, Sakai Y, Hotta Y, Matsumoto H. (1990) A 49-kilodalton phosphoprotein in the Drosophila photoreceptor is an arrestin homolog. Science. Apr 27; 248(4954):483-6. 180 Smith DP, Shieh BH, Zuker CS. (1990) Isolation and structure of an arrestin gene from Drosophila. Proc Natl Acad Sci U S A. Feb; 87(3):1003-7. 181 Kuhn, Hall and Wilden (1984) Light-induced binding of 48-kDa protein to photoreceptor membranes is highly enhanced by phosphorylation of rhodopsin. FEBS Lett. Oct 29; 176(2):473-8. 182 Xu et al.; (1997) Prolonged photoresponses in transgenic mouse rods lacking arrestin. Nature. Oct 2; 389(6650):505-9. 183 Dolph PJ et al., (1993) Arrestin function in inactivation of G protein-coupled receptor rhodopsin in vivo. Science. Jun 25; 260(5116):1910-6. 184 Fuchs S, Nakazawa M, Maw M, Tamai M, Oguchi Y, Gal A. (1995) A homozygous 1-base pair deletion in the arrestin gene is a frequent cause of Oguchi disease in Japanese. Nat Genet. Jul; 10(3):360-2.
185 Alloway PG, Howard L, Dolph PJ. (2000) The formation of stable rhodopsin-arrestin complexes induces apoptosis and photoreceptor cell degeneration. Neuron. Oct; 28(1):129-38. 186 Agarwal N, Nir I, Papermaster DS. (1994) Loss of diurnal arrestin gene expression in rds mutant mouse retinas. Exp Eye Res. Jan; 58(1):1-8.
187 Chen J, Simon MI, Matthes MT, Yasumura D, LaVail MM. (1999) Increased susceptibility to light damage in an arrestin knockout mouse model of Oguchi disease (stationary night blindness). Invest Ophthalmol Vis Sci. Nov; 40(12):2978-82.
188 Alloway PG, Howard L, Dolph PJ. (2000) The formation of stable rhodopsin-arrestin complexes induces apoptosis and photoreceptor cell degeneration. Neuron. Oct; 28(1):129-38. 189 Sacunas RB, Papuga MO, Malone MA, Pearson AC Jr, Marjanovic M, Stroope DG, Weiner WW, Chamberlain SC, Battelle BA (2002) Multiple mechanisms of rhabdom shedding in the lateral eye of Limulus polyphemus. J Comp Neurol. Jul 15; 449(1):26-42.
117
190 Kumbalasiri T, Provencio I. (2005) Melanopsin and other novel mammalian opsins. Exp Eye Res. Oct; 81(4):368-75. 191 Dalal JS, Jinks RN, Cacciatore C, Greenberg RM, Battelle BA. (2003) Limulus opsins: diurnal regulation of expression. Vis Neurosci. Sep-Oct; 20(5):523-34. 192 Rohlich P, van Veen T, Szel A. (1994) Two different visual pigments in one retinal cone cell. Neuron. Nov; 13(5):1159-66.
193 Applebury ML, Antoch MP, Baxter LC, Chun LL, Falk JD, Farhangfar F, Kage K, Krzystolik MG, Lyass LA, Robbins JT. (2000) The murine cone photoreceptor: a single cone type expresses both S and M opsins with retinal spatial patterning. Neuron. Sep; 27(3):513-23.
194 Hemmi JM, Grunert U. (1999) Distribution of photoreceptor types in the retina of a marsupial, the tammar wallaby (Macropus eugenii). Vis Neurosci. Mar-Apr; 16(2):291-302.
195 Archer SN, Lythgoe JN. (1990) The visual pigment basis for cone polymorphism in the guppy, Poecilia reticulata. Vision Res.; 30(2):225-33.
196 Hope AJ, Partridge JC, Hayes PK. (1998) Switch in rod opsin gene expression in the European eel, Anguilla anguilla (L.). Proc Biol Sci. May 22; 265(1399):869-74.
197 Makino CL, Dodd RL. (1996) Multiple visual pigments in a photoreceptor of the salamander retina. J Gen Physiol. Jul; 108(1):27-34.
198 Loew ER, Govardovskii VI, Rohlich P, Szel A. (1996) Microspectrophotometric and immunocytochemical identification of ultraviolet photoreceptors in geckos. Vis Neurosci. Mar-Apr; 13(2):247-56.
199 Montell C. (1999) Visual transduction in Drosophila. Annu Rev Cell Dev Biol.; 15:231-68. 200 Kitamoto J, Sakamoto K, Ozaki K, Mishina Y, Arikawa K. (1998) Two visual pigments in a single photoreceptor cell: identification and histological localization of three mRNAs encoding visual pigment opsins in the retina of the butterfly Papilio xuthus. J Exp Biol. May; 201(Pt 9):1255-61.
201 Briscoe AD. (2000) Six opsins from the butterfly Papilio glaucus: molecular phylogenetic evidence for paralogous origins of red-sensitive visual pigments in insects. J Mol Evol. Aug; 51(2):110-21.
118
202 Sakamoto K, Hisatomi O, Tokunaga F, Eguchi E. (1996) Two opsins from the compound eye of the crab Hemigrapsus sanguineus J Exp Biol.; 199(Pt 2):441-50.
203 Lisman and Bering (1977) Electrophysiological measurement of the number of rhodopsin molecules in single Limulus photoreceptors. J Gen Physiol. Nov; 70(5):621-33. 204 Fesenko EE, Kolesnikov SS, Lyubarsky AL. (1985) Induction by cyclic GMP of cationic conductance in plasma membrane of retinal rod outer segment. Nature. Jan 24-30; 313(6000):310-3.
205 Haynes L, Yau KW. (1985) Cyclic GMP-sensitive conductance in outer segment membrane of catfish cones. Nature. Sep 5-11; 317(6032):61-4. 206 Kaupp UB, Niidome T, Tanabe T, Terada S, Bonigk W, Stuhmer W, Cook NJ, Kangawa K, Matsuo H, Hirose T, et al. (1989) Primary structure and functional expression from complementary DNA of the rod photoreceptor cyclic GMP-gated channel. Nature. Dec 14; 342(6251):762-6.
207 del Pilar Gomez M, Nasi E. (1995)Activation of light-dependent K+ channels in ciliary invertebrate photoreceptors involves cGMP but not the IP3/Ca2+ cascade. Neuron. Sep; 15(3):607-18.
208 Gorman AL, McReynolds JS. (1969)Hyperpolarizing and depolarizing receptor potentials in the scallop eye. Science. Jul 18; 165(890):309-10.
209 Hardie RC, Minke B. (1992) The trp gene is essential for a light-activated Ca2+ channel in Drosophila photoreceptors. Neuron. Apr; 8(4):643-51.
210 Vaca L, Sinkins WG, Hu Y, Kunze DL, Schilling WP. (1994) Activation of recombinant trp by thapsigargin in Sf9 insect cells. Am J Physiol. Nov; 267(5 Pt 1):C1501-5.
211 Xu XZ, Li HS, Guggino WB, Montell C. (1997) Coassembly of TRP and TRPL produces a distinct store-operated conductance. Cell. Jun 27; 89(7):1155-64.
212 Ranganathan R, Bacskai BJ, Tsien RY, Zuker CS. (1994) Cytosolic calcium transients: spatial localization and role in Drosophila photoreceptor cell function. Neuron. Oct; 13(4):837-48. 213 Hardie RC, Raghu P. (1998) Activation of heterologously expressed Drosophila TRPL channels: Ca2+ is not required and InsP3 is not sufficient. Cell Calcium. Sep; 24(3):153-63.
119
214 Acharya JK, Jalink K, Hardy RW, Hartenstein V, Zuker CS. InsP3 receptor is essential for growth and differentiation but not for vision in Drosophila. Neuron. 1997 Jun; 18(6):881-7.
215 Chyb S, Raghu P, Hardie RC. Polyunsaturated fatty acids activate the Drosophila light-sensitive channels TRP and TRPL. Nature. 1999 Jan 21;397(6716):255-9.
216 Raghu P, Usher K, Jonas S, Chyb S, Polyanovsky A, Hardie RC. Constitutive activity of the light-sensitive channels TRP and TRPL in the Drosophila diacylglycerol kinase mutant, rdgA. Neuron. 2000 Apr; 26(1):169-79.
217 Fein A, Payne R, Corson DW, Berridge MJ, Irvine RF. (1984) Photoreceptor excitation and adaptation by inositol 1,4,5-trisphosphate. Nature. Sep 13-19; 311(5982):157-60. 218 Payne R, Corson DW, Fein A, Berridge MJ. (1986) Excitation and adaptation of Limulus ventral photoreceptors by inositol 1,4,5 triphosphate result from a rise in intracellular calcium. J Gen Physiol. Jul;88(1):127-42.
219 Johnson EC, Robinson PR, Lisman JE. (1986) Cyclic GMP is involved in the excitation of invertebrate photoreceptors. Nature. Dec 4-10; 324(6096):468-70. 220 Bacigalupo J, Johnson EC, Vergara C, Lisman JE. (1991) Light-dependent channels from excised patches of Limulus ventral photoreceptors are opened by cGMP. Proc Natl Acad Sci U S A. Sep 15; 88(18):7938-42.
221 Chen FH, Ukhanova M, Thomas D, Afshar G, Tanda S, Battelle BA, Payne R. Molecular cloning of a putative cyclic nucleotide-gated ion channel cDNA from Limulus polyphemus. J Neurochem. 1999 Feb; 72(2):461-71.
222 Bandyopadhyay BC, Payne R. (2004) Variants of TRP ion channel mRNA present in horseshoe crab ventral eye and brain. J Neurochem. Nov; 91(4):825-35. 223 Cone R.A. & W. L. Pak (1971) The early receptor potential. In Handbook of sensory physiology. Vol I. Principles of receptor physiology. W.R. Lowenstein, editor. Springer-verlag, Berlin. 345-365