abstract title of document: state-resolved quenching juan du
TRANSCRIPT

ABSTRACT
Title of Document: STATE-RESOLVED QUENCHING
DYNAMICS IN COLLISIONS OF
VIBRATIONALLY EXCITED MOLECULES
Juan Du, Doctor of Philosophy, 2010
Directed By: Professor Amy S. Mullin, Department of
Chemistry and Biochemistry
The collisional relaxation of highly excited molecules plays a very important role
in many chemistry processes. The work presented in this thesis studies the collisional
quenching dynamics of highly vibrationally excited molecules using high-resolution
transient IR absorption spectroscopy. This work investigates “weak” (small energy
transfer) and “strong” (large energy transfer) collisions between donor and bath
molecules. The experimental results illustrate how the properties of donor molecules
influence the collisional energy transfer. These properties include the molecular structure,
internal energy, state density. In several weak collision studies, this thesis studies the
vibration-rotation/translation pathway for pyrazine/DCl, pyrazine/CO2 with different
internal energies and for three excited alkylated pyridine molecules/CO2 systems. A
single-exponential rotational distribution and J-dependent translational energy
distributions of scattered DCl molecules are observed. For CO2 collisions, the scattered
CO2 has a biexponential rotational distribution and J-dependent translational energy
distributions for all collision pairs. Recoil velocities scale with product angular momenta.
The observed collision rates for these collision pairs match Lennard-Jones rates. The full
energy transfer distribution for these pairs is determined by combining data for weak and
strong collisions. Lowering the internal energy of donor molecules reduces the amount
of rotational and translational energy transfer to CO2. Reducing the internal energy of
pyrazine decreases the probabilities of strong collision and increases the probabilities of
weak collision. The average energy transfer reduces by ~ 50% when the internal energy
is decreased by only 15%. The collision rates are independent on the internal energy for
these systems. Methylation of donor molecules decreases the magnitude of VRT energy
transfer. The collision results are affected by the number of methyl-groups, and not by
the position of the group. Increasing the number of methyl groups increases the ratio of
the measured collision rate to the Lennard-Jones collision rate. In the strong collision
studies, the effects of alkylation and internal energy are studied. In collisions with
alkylated pyridine donors with E ~ 39000 cm-1
, CO2 molecules gain less energy from
alkylpyridine than from pyridine. The alkylated donors undergo strong collisions with
CO2 via a less repulsive part of the intermolecular potential compared to pyridine. For
azulene/CO2 collisions with two different internal energies, scattered CO2 molecules gain
double the amount of rotational and translational energy when the azulene energy is
doubled. The rate of strong collisions increases four times when the internal energy is
doubled.

STATE-RESOLVED OF COLLISIONAL QUENCHING DYNAMICS OF
VIBRATIONALLY EXCITED MOLECULES
By
Juan Du
Dissertation submitted to the Faculty of the Graduate School of the
University of Maryland, College Park, in partial fulfillment
of the requirements for the degree of
Doctor of Philosophy
2010
Advisory Committee:
Professor Amy S. Mullin, Chair
Professor Millard H. Alexander
Professor Daniel Falvey
Professor John T. Fourkas
Professor Christopher Monroe

© Copyright by
Juan Du
2010

ii
Acknowledgements
At the completion of my graduation thesis, I wish to express my sincere
appreciation to all those who have offered me invaluable help during the last several
years of my graduate study in University of Maryland, College Park.
Firstly, I would like to express my heartfelt gratitude to my advisor, Professor
Amy S. Mullin, for her constant encouragement and guidance. Her enthusiasm and
creativity in problem solving are inspirational. Without her valuable suggestions and
constant support over the last several years, this doctoral thesis cannot be finished forever.
All knowledge and experiences in this lab will benefit the rest of my career and life.
Secondly, I should give my hearty thanks to Dr. Ziman Li, Dr. Liwei Yuan, Dr.
Daniel K. Havey, Dr. Qingnan Liu, Dr. Nicolas A. Sassin, and Professor Shizuka Hsieh.
Dr. Ziman Li and Dr. Qingnan Liu helped me set up the experimental system and taught
me so much when I just joined this group. I got a lot of help from Dr. Qingnan Liu in my
first three years in the lab. Dr. Liwei Yuan and I investigated two strong collision
dynamics projects and one weak collision project for DCl system in Chapter 3, Chapter 7
and Chapter 8. Dr. Daniel K. Havey and I worked together for three weak collision
projects in Chapter 4 to Chapter 6. Dr. Nicolas A. Sassin and I studied the effect of
internal energy in Chapter 5. With Professor Shizuka Hsieh’s help, we finished our DCl
project smoothly. I also learned much theoretical physical chemistry knowledge from her.
They are all fantastic science mentors to me.
I would also like to express my thanks to all Mullin Group members, Samuel
Teitelbaum, Junmei Chao, Allision Robinson, Geraldine O. Echebiri, Matthew D. Smarte
and Felix Lin. I got a lot help from them in the lab.

iii
I want to express my thanks to all teachers in my last several years in Boston
University and University of Maryland, College Park.
Lastly, my thanks would go to my beloved family for their loving considerations
and great confidence in me all through these years. Their love supports me to face all
difficulties bravely in my life and to realize my dreams. Their affection and support
enable me to finish this work successfully.

iv
Table of Contents
Acknowledgements……………………………………………………………........... ii
Table of Contents…………………………………………………………………….. iv
List of Tables………………………………………………………………….............. ix
List of Figures………………………………………………………………...………. xii
Abbreviations…………………………………………………………………………. xxii
Chapter 1: Introduction of Collisional Quenching Dynamics………..………….…… 1
1.1 Significance of Collision Energy Transfer……………………………..………... 1
1.2 “Weak” and “Strong” Collisions……………………………………...……….… 4
1.3 Methods for Studying the Collisional Relaxation of Highly Vibrationally
Excited Donors……………..………………………..………………………...…
7
1.4 High Resolution Transient IR Absorption Spectroscopy………………………... 10
1.5 Molecules in this Thesis…………….……………………………………............ 11
1.5.1 Highly Vibrationally Excitation for Azabenzene Molecules………….…... 11
1.5.2 Bath Molecules………………………………………..…………………… 15
1.6 Overview of the Work in this Thesis………………….………………………..... 17
Chapter 2: Experimental Methods…………………………………………………..... 21
2.1 Introduction…………………………………………………………...…………. 21
2.2 High-Resolution Transient IR Laser Absorption Spectrometers…………............ 21
2.2.1 Diode Laser Spectrometer…………………………………………………. 23
2.2.2 F-Center Laser Spectrometer……………………………………...……….. 25
2.3 Laser Systems………………………………………………………..................... 29
2.3.1 Nd:YAG Laser…………………………………………………………….. 29
2.3.2 Dye Laser………………………………………………………………….. 31
Chapter 3: Dynamics of Weak and Strong Collisions: Highly Vibrationally Excited
Pyrazine(E = 37900 cm-1) with DCl….……………..........................……
33
3.1 Introduction ………………….………………………………………………….. 33
3.2 Experimental Methods………………………….………………………….......... 34

v
3.3 Results and Discussion………….……………………………………………….. 36
3.3.1 Transient Line Profiles of Scattered DCl Molecules in (v = 0) and (v = 1).. 36
3.3.2 Energy Profiles of Scattered DCl (v = 0) Molecules………….…………… 42
3.3.3 Energy Transfer Rates: Pyrazine(E = 37900 cm-1) + DCl………..………... 54
3.3.4 Full Energy Transfer Distribution Function P(E)…………….………….. 61
3.3.5 Comparison with Pyrazine(E)-HOD collisions………………...………….. 64
3.4 Conclusion…………………………………………………….…………………. 67
Chapter 4: Full State-Resolved Energy Gain Profiles of CO2(J = 280) from
Collisions of Highly Vibrationally Excited Pyrazine(E=37900 cm-1
)…….
68
4.1 Introduction……………………………………….…………………………...… 68
4.2 Experimental Methods………………………………………………................... 69
4.3 Results……………………………………………………………………….…... 70
4.3.1 Appearance and Depletion Processed for Scattered CO2 (0000, J)
Collisions……………………………………………………….…………..
70
4.3.2 Rotational and Translational Energy Gained for Scattered CO2 at J = 280
through Collisions with Excited Pyrazine(E)……………….……………...
79
4.3.3 State-Resolved VRT Energy Transfer Rate Constants and the Total
Collision Rate………………………………………………….……….…..
83
4.4 Discussion…………………………………………………………..……………. 87
4.4.1 Branching Ratio for Inelastic Collisions……………………..…………….. 88
4.4.2 The Scattered Population Distributions from Weak and Strong Collisions.. 89
4.4.3 The Effect of Angular Momentum Changes for VRT Energy Transfer….. 93
4.4.4 Full Energy Gain Distribution Function P(E)……………………….…… 97
4.5 Conclusions……………………………………………………………………..... 106
Chapter 5: Internal Energy Effects on Full Energy Transfer Distribution for CO2
through Collisions with Highly Vibrationally Excited Pyrazine (E =
32700 and 37900 cm-1) …...........................................................................
107
5.1 Introduction…………………………………………………………..…..……… 107
5.2 Experimental Methods………………….……………………………….………. 109
5.3 Results…………………………………………………..…………..…………… 110

vi
5.3.1 Transient IR Absorption Measurement of CO2 (0000) State……….……… 110
5.3.2 Appearance Profile for CO2 High-J States (J = 5678)……………….….... 115
5.3.3 Translational and Rotational Energy Gain of Scattered CO2 (J = 278)….. 120
5.3.4 Appearance Energy Transfer Rates for CO2/pyrazine System………….… 124
5.3.5 Depletion Collision Process…………………….………………..………... 126
5.4 Discussion………………………………………………………………..………. 128
5.4.1 Angular Momentum Changes in VRT Energy Transfer……………...….. 128
5.4.2 Branching Ratio of Weak and Strong Collisions………………..…..…….. 132
5.4.3 The Full Energy Transfer Distribution P(E)……………………..…….… 133
5.5 Conclusions…………………………………………………………….………… 139
Chapter 6: Full Collisional Energy Gain Profiles of CO2 (0000) from Collisions with
Highly Vibrationally Excited Molecules: 2-Methylpyridine, 2,6-
Dimethylpyridine and 3,5-Dimethylpyridine (E ~ 38500 cm-1)……………
140
6.1 Introduction……………………………………………………………..……….. 140
6.2 Experimental Methods………………………………………………………..….. 143
6.3 Results and Discussion………………………………………………….……….. 143
6.3.1 Transient IR Absorption of Scattered CO2 (0000) at J= 264……………... 144
6.3.2 Translational Excitation of Scattered CO2 (0000) with Three Donor
molecules………………………………………………………...........…...
148
6.3.3 Rotational Energy Gain of Scattered CO2 (0000)……………………..…… 154
6.3.4 Appearance Collision Rate kapp for CO2 with 2MP, 2,6MP and 3,5MP…... 166
6.3.5 The Full VRT Energy Transfer Distribution P(E) for CO2 with
Vibrationally excited 2MP, 2,6MP and 3,5MP………………….…………
170
6.4 Conclusions………………………………………………………………….…... 173
Chapter 7: Energy Dependence of Strong Collision Dynamics for Highly
Vibrationally Excited Azulene(E = 20390 and 38580 cm-1
) with
CO2………………………………………………………………….
174
7.1 Introduction………………………………………………………………... 174
7.2 Experimental Methods…………………………………………………….. 177
7.3 Results and Discussion…………………………….………………………. 179

vii
7.3.1 CO2 Rotational Energy Gain from Azulene(E)-CO2 Strong Collisions……. 180
7.3.2 Translational Energy Release from Azulene(E)/CO2 Large-E Collisions.. 182
7.3.3 State-Resolved Rate Constants of Azulene(E)-CO2 large-E Energy
Transfer…………………………………………………………………….
190
7.3.4 P(E) Curves for Large-E Collisions of Azulene(E) and CO2………………… 194
7.4 Conclusion……………………………………………………………………….. 204
Chapter 8: Alkylation Effects on Strong Collisions of Highly Vibrationally Excited
Alkylated Pyridines with CO2………………………………………..…...
206
8.1 Introduction………………………………………………………………........... 206
8.2 Experimental Methods…………………………………………………………… 210
8.3 Results and Discussion…………………………………………………………... 211
8.3.1 Transient Absorption Signals for CO2 (0000) from Collisions with Three Highly
Vibrationally Excited Alkyl-pyridines (2EP, 2PP, and 2tBP)……........................
211
8.3.2 Translational Energy Distributions of Scattered CO2 (J = 6278) from
Collisions with Vibrationally Excited Donors……………………………..
212
8.3.3 Rotational Energy Gain of Scattered CO2 from Donors (2EP, 2PP and
2tBP)……………………………………………………………………….
219
8.3.4 State-Resolved Energy Transfer Rate Constant kappJ
for 2EP, 2tBP, and
2PP with CO2……..……………………………………………..................
228
8.3.5 Energy Transfer Distribution P(E) for Strong Collisions of Donors with
CO2…………………………………………………………………………
231
8.3.6 The Effect of State Density on Large-E Energy Transfer………………... 235
8.4 Conclusion……………………………………………………………………….. 242
Chapter 9: Conclusion…………………………….……………………………….….. 244
9.1 Summary and Conclusion………………………………………….…………….. 244
9.2 Future Directions…………………………………………...……………………. 246
Appendix A: Absorption Frequencies, Rotational Energies, and Transition Intensities
for the R Branch of the IR Fundamental of D35
Cl and D37
Cl…………………...…….
248

viii
Appendix B: Lennard-Jones Collision Model Calculation………………….………... 252
Appendix C: The Residual Test for Double-Gaussian Fitting Model……..………..... 259
Appendix D: A Two-Component Fitting Model Fitting with Constraints……............ 263
Bibliography...…………………………………………………….………………….. 267

ix
List of Tables
Table 1.1 The decay pathways and life times for donor molecules.
Table 3.1 Nascent Doppler-broadened line widths and translational
temperatures for low-J states of DCl through collisions with
vibrationally excited pyrazine(E = 37900 cm-1
).
Table 3.2 Angular momentum and recoil velocities for individual states of
DCl J = 220 due to collisions with highly vibrationally excited
pyrazine(E = 37900 cm-1
)
Table 3.3 State-specific rate constants for appearance of DCl products due to
collisions of Pyrazine(E = 37900 cm-1) + DCl → Pyrazine(EE) +
DCl (v = 0, J).
Table 3.4 Depletion rate constant measurements for collisions of Pyrazine(E =
37900 cm-1) + DCl (J) → Pyrazine(EE) + DCl (v’, J’) at 300K.
Table 4.1 Nascent Doppler-broadened linewidths, translational temperatures
and rate constants for appearance of CO2 (0000, J) from collisions
with vibrationally excited pyrazine(E = 37900 cm-1
).
Table 4.2 State-resolved depletion linewidths, translational temperatures and
rate constants for collisions with vibrationally excited pyrazine(E =
37900 cm-1
).
Table 4.3 State-resolved rate constants for appearance of CO2 (0000, J)
through collisions with highly vibrationally excited pyrazine(E =
37900 cm-1
).
Table 4.4 The average changes in linear and angular momentum in CO2
through collisions with highly vibrationally excited pyrazine(E).
Table 5.1 State-specific nascent Doppler-broadened linewidths, translational
temperatures and average translational energy gain for appearance
of CO2 (0000, J) at t = 1 s following collisions with vibrationally
excited pyrazine(E = 32700 cm-1
).
Table 5.2 State-resolved energy transfer rate constants kappJ
for pyrazine(E =
32700 cm-1
)/CO2 collision pair.

x
Table 5.3 Depletion process Doppler-broadened linewidths, translational
temperatures and depletion collision rates.
Table 5.4 Angular momentum and recoil velocities for individual states of
CO2 J = 278 through collisions with highly vibrationally excited
pyrazine(E = 32700 cm-1
).
Table 6.1 Nascent appearance Doppler-broadened line widths and
translational temperatures for 2MP/CO2, 2,6MP/CO2 and
3,5MP/CO2 collision pairs.
Table 6.2 Angular momentum and recoil velocities for individual states of
CO2 J = 278 through collisions with highly vibrationally excited
2MP, 2,6MP and 3,5MP (E ~ 38500 cm-1
).
Table 6.3 State-specific energy transfer rate constants.
Table 7.1 Doppler-broadened linewidths and translational temperatures for
strong collisions of CO2 with highly vibrationally excited azulene(E
= 20100 or 38500 cm-1
).
Table 7.2 State-specific energy transfer rate constants for collisions of highly
excited azulene with CO2.
Table 8.1 Doppler broadened linewidth for scattered CO2 (0000) for strong
collisions with three vibrationally excited alkylpyridine donors:
2EP, 2PP, and 2tBP.
Table 8.2 The average changes in angular and linear momentum in CO2 from
collisions with highly vibrationally excited alkylated pyridine (2EP,
2PP and 2tBP).
Table 8.3 Appearance energy transfer rate constants of scattered CO2 (0000, J)
through collisions with highly vibrationally excited donors: 2EP,
2PP, 2tBP.
Table A.1 IR probe transients for rotational states of DCl. DCl (v = 0, J) + h
( 4.3 m) DCl (v = 1, J+1)
Table B.1 Lennard-Jones parameters for CO2 and DCl bath molecules.
Table B.2 Critical temperature Tc and critical volume Vc of molecules.
xi
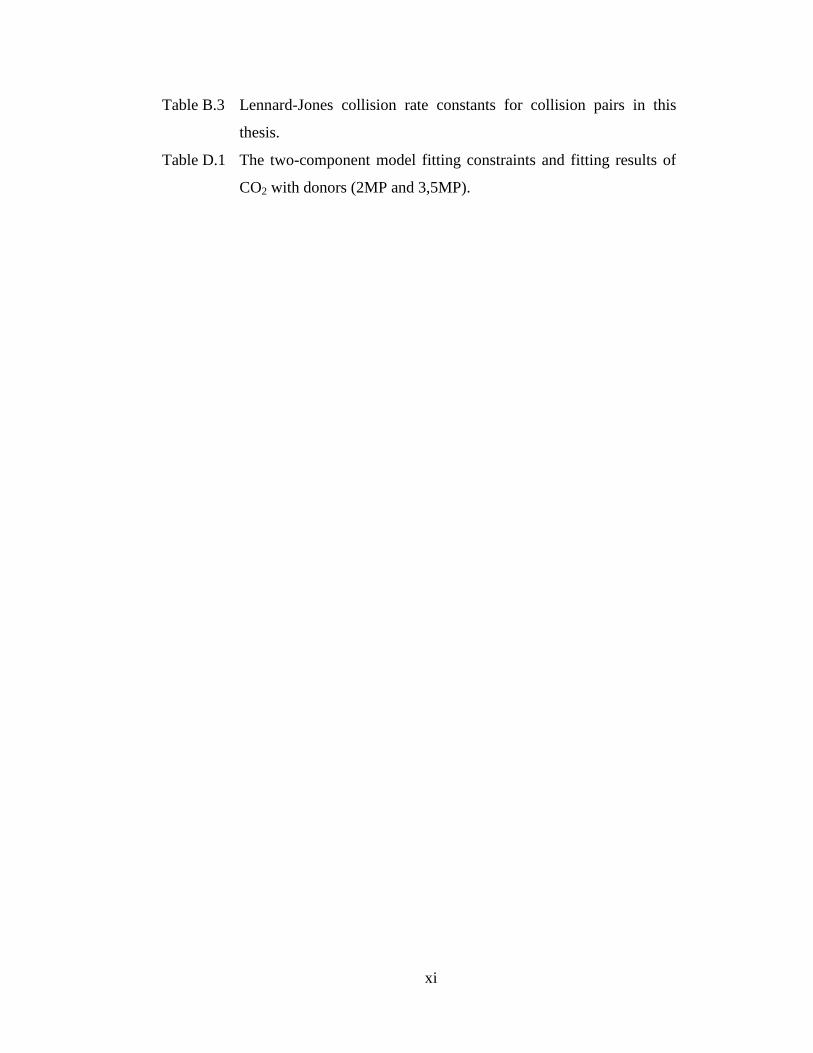
Table B.3 Lennard-Jones collision rate constants for collision pairs in this
thesis.
Table D.1 The two-component model fitting constraints and fitting results of
CO2 with donors (2MP and 3,5MP).

xii
List of Figures
Figure 1.1 Schematic illustrating collisional deactivation by strong and weak
collisions.
Figure 1.2 Energy transfer distribution function shows that weak collisions
(small E) occur more often than strong collisions (large E) of
excited molecules.
Figure 1.3 Highly vibrationally excited donor molecules studied in this thesis.
Figure 1.4 IR probing for strong and weak collision for DCl and CO2 bath
molecules.
Figure 2.1 High-resolution transient IR absorption spectroscopy uses two laser
systems: a pulsed UV laser and IR laser.
Figure 2.2 Diode Laser Spectrometer
Figure 2.3 F-center Laser Spectrometer
Figure 2.4 Burleigh F-center Laser
Figure 2.5 The oscillator cavity of Nd:YAG laser
Figure 2.6 The visible output beam of the dye Rhodamine 640 methanol
solution in ND6000 dye laser. The peak intensity is at 615.5 nm.
Figure 3.1 Transient absorption signals for the J = 5 state of DCl collisions due
to collisions with highly vibrationally excited pyrazine(E = 37900
cm-1
) at two different IR frequencies. Panel a shows depletion of
initial population at line center 0. In panel b, the appearance of DCl
molecules that are products of collisional energy transfer is
observed at frequency 00.003 cm-1
.
Figure 3.2 (a) Transient IR absorption of appearance of DCl (v = 1, J = 6) that
results from collisions of pyrazine(E) and DCl (v = 0). (b) Transient
absorption line profile for the J = 6 state of DCl (v = 1) measured 1
μs after the UV excitation of pyrazine.
Figure 3.3 (a) Transient absorption line profile for the J = 5 state of DCl (v = 0)
measured 1 μs after the UV pulse and a double-Gaussian function
curve. (b) Residuals of the fit are shown as solid circles.

xiii
Figure 3.4 Separate appearance and depletion components of the transient line
profile for DCl (v = 0) J = 5.
Figure 3.5 Rotational state dependence of the nascent center-of-mass
translational temperatures for pyrazine(E = 37900 cm-1
)/DCl
collisions.
Figure 3.6 Nascent rotational distribution for the J = 221 states of DCl that are
populated through collisions with vibrationally excited pyrazine.
The appearance of DCl molecules due to weak and strong collisions
is described by a single Boltzmann distribution with Trot = 880
100 K.
Figure 3.7 The energy transfer distribution function P(E) for collisions of
vibrationally excited pyrazine(E = 37900 cm-1
) and DCl as
determined from state-resolved appearance measurements. .
Figure 3.8 Comparison of the full energy transfer distribution function P(E)
curves for vibrationally excited pyrazine with HOD and DCl. In the
upper plot, the energy transfer data are scaled to the Lennard-Jones
collision rate, and in the lower plot, the energy transfer data are
scaled to the measured collision rate.
Figure 4.1 Nascent transient IR absorption signals of scattered CO2 (0000) at
rotational state J = 26 through collisions with vibrationally excited
pyrazine(E = 37900 cm-1
) at two IR frequencies within the R26
probe transition. (a) shows a depletion of initial CO2 populations at
line center. (b) shows the appearance of scattered CO2 molecules at
frequency 00.003 cm-1
.
Figure 4.2 The transient absorption line profiles for scattered CO2 (0000) at
from low to high rotational states (J = 2, 26, 36, and 54).
Figure 4.3 The appearance and depletion curves are separated by a double-
Gaussian function for CO2 at J = 26 at t = 1 s after UV pulse.
Figure 4.4 Nascent biexponential rotational distribution for the J = 280 states
of CO2 (0000) due to collisions with vibrationally excited pyrazine.
xiv
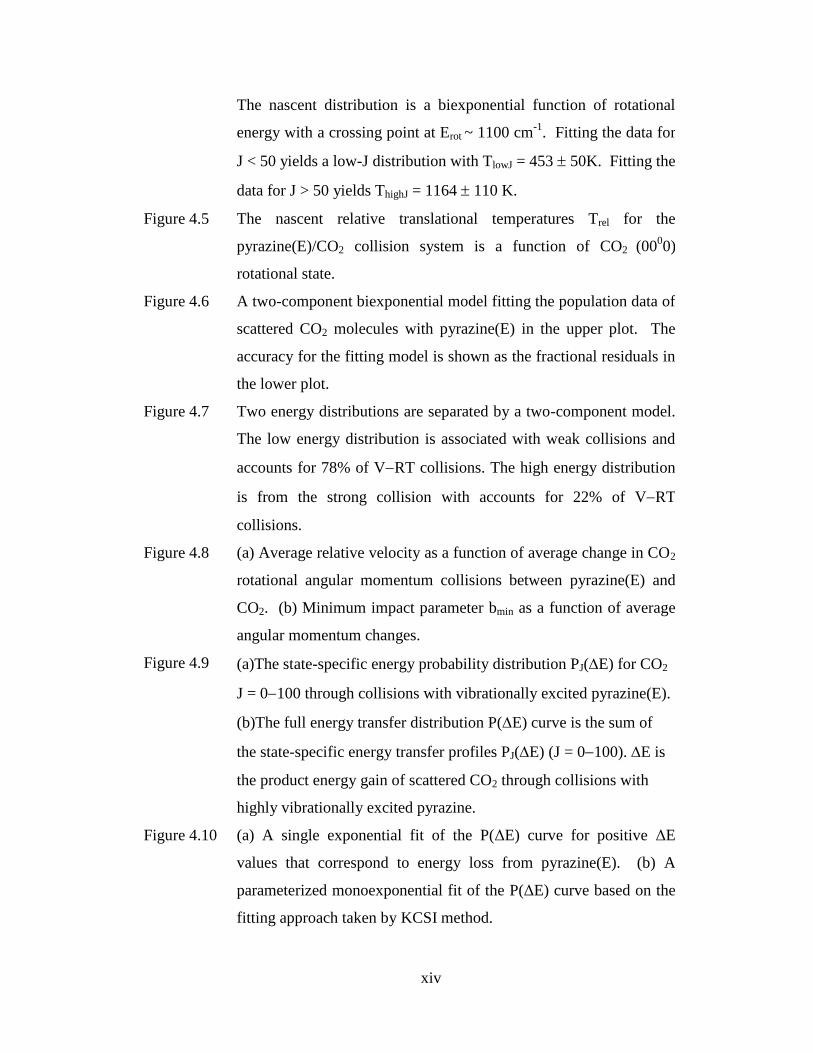
The nascent distribution is a biexponential function of rotational
energy with a crossing point at Erot ~ 1100 cm-1
. Fitting the data for
J < 50 yields a low-J distribution with TlowJ = 453 50K. Fitting the
data for J > 50 yields ThighJ = 1164 110 K.
Figure 4.5 The nascent relative translational temperatures Trel for the
pyrazine(E)/CO2 collision system is a function of CO2 (0000)
rotational state.
Figure 4.6 A two-component biexponential model fitting the population data of
scattered CO2 molecules with pyrazine(E) in the upper plot. The
accuracy for the fitting model is shown as the fractional residuals in
the lower plot.
Figure 4.7 Two energy distributions are separated by a two-component model.
The low energy distribution is associated with weak collisions and
accounts for 78% of VRT collisions. The high energy distribution
is from the strong collision with accounts for 22% of VRT
collisions.
Figure 4.8 (a) Average relative velocity as a function of average change in CO2
rotational angular momentum collisions between pyrazine(E) and
CO2. (b) Minimum impact parameter bmin as a function of average
angular momentum changes.
Figure 4.9 (a)The state-specific energy probability distribution PJ(E) for CO2
J = 0100 through collisions with vibrationally excited pyrazine(E).
(b)The full energy transfer distribution P(E) curve is the sum of
the state-specific energy transfer profiles PJ(E) (J = 0100). E is
the product energy gain of scattered CO2 through collisions with
highly vibrationally excited pyrazine.
Figure 4.10 (a) A single exponential fit of the P(ΔE) curve for positive ΔE
values that correspond to energy loss from pyrazine(E). (b) A
parameterized monoexponential fit of the P(ΔE) curve based on the
fitting approach taken by KCSI method.

xv
Figure 5.1 Transient absorption signals for scattered CO2 (0000) in the J = 26
state following collisions with highly vibrationally excited
pyrazine(E = 32700 cm-1
) at two different IR frequencies.. (a) shows
a depletion of initial CO2 populations at line center. (b) shows the
appearance of scattered CO2 molecules at frequency 00.003 cm-1
.
Figure 5.2 The transient absorption line shape for CO2 (0000) J = 26 resulting
from collisions with highly vibrationally excited pyrazine(E =
32700 cm-1
).
Figure 5.3 Transient absorption line profile for the J = 26 rotational state of
CO2 (0000). The double-Gaussian fitting parameters separate
appearance process and depletion process.
Figure 5.4 Energy transfer data for CO2 (J = 56–80) that result from collisions
with hot pyrazine excited at different UV wavelengths. Data at =
308.8 nm is estimated from previous wavelength-dependent data.
Figure 5.5 The current and previous data for scattered CO2 molecules at high-J
states after collisions with excited pyrazine are compared. Within
the error, the rotational distributions of current data (Trot = 845 K) is
agreement with the previous results (Trot = 918 ± 100 K). The
absolute populations for CO2 J = 7274 in this work are bigger than
the values at the same states in previous study.
Figure 5.6 Nascent center-of-mass translational temperatures for individual
rotational states of scattered CO2 (0000) molecule resulting from
collisions with highly vibrationally excited pyrazine(E).
Figure 5.7 Nascent rotational distribution of scattered CO2 (0000) following
collisions with vibrationally excited pyrazine( = 308.8 nm). The
distribution for the low-J states is characterized by Trot = 359 40
K. For high-J states, Trot = 918 90 K.
Figure 5.8 The upper plot investigates the correlation between the average
change in angular momentum Jbath of CO2 molecule and the
average change of recoil velocity vrel for CO2:pyrazine(E)
system, where E = 32700 cm-1
and E = 37900 cm-1
. The open

xvi
circles in the lower plot illustrate the ratios of vrel of two internal
energies of pyrazine.
Figure 5.9 (a) A two-component biexponential function fitting curve of the
nascent rotational distribution of scattered CO2 through collisions
with pyrazine(E = 32700 cm-1
); (b) the results of fitting residuals at
CO2 rotational states are shown as the circles.
Figure 5.10 Population distributions of scattered CO2 at t = 1 s after weak or strong
collisions with pyrazine(E= 32700 and 37900cm-1
). (a) Populations of
CO2 through collisions with pyrazine(E = 32700 cm-1
). 76% of the
observed CO2 populations (open circles) are from the cold population with
Trot = 214 K which is the product of weak collisions. The hot population
with Trot = 909 K from the strong collisions is 24% of the whole observed
population. (b) Strong and weak collisions contribute similar percent
populations for pyrazine(E = 37900 cm-1
). Trot = 1241 K of hot population
and Trot = 329 K of cold population for pyrazine(E = 37900 cm-1
) .
Figure 5.11 Energy-dependent full energy transfer probability distribution
function P(E) for pyrazine(E)/CO2 at E = 32700 cm-1
and 37900
cm-1
. Both of distribution functions are normalized to the Lennard-
Jones collision rate in the upper plot while they are normalized to
the appearance collision rate in the lower plot.
Figure 6.1 The molecular structure for three methylated pyridine donors.
Figure 6.2 Transient absorption signals for scattered CO2 (0000) in the J = 26
state after collisions with highly vibrationally excited 2MP, 2,6MP
and 3,5MP (E ~ 38500 cm-1
). The three plots on the left show
depletion signals at line center 0. The right-hand plots show CO2’s
appearance signals measured at a frequency of 00.003 cm-1
.
Figure 6.3 The transient IR absorption line shape for CO2 (0000) J = 26 at t = 1
µs after single collisions with three highly vibrationally excited
donor molecules, 2MP, 2,6MP and 3,5MP.
Figure 6.4 Transient absorption line profile for the J = 26 rotational state of
CO2 (0000) at t = 1 µs from collisions with vibrationally hot 2MP,

xvii
2,6MP and 3,5MP. The black lines are double-Gaussian fitting
curves. The fitting curves are made up of appearance and depletion
of populations, respectively.
Figure 6.5 Nascent center-of-mass translational temperatures for individual
rotational states of scattered CO2 (0000) molecule resulting from
collisions with highly vibrationally excited 2MP, 2,6MP and 3,5MP.
Figure 6.6 The average velocity changes for CO2 (J = 2–80) through collisions
with highly vibrationally excited pyrazine, 2MP, 2,6MP and 3,5MP.
Figure 6.7 Nascent rotational distribution for the J = 280 states of CO2 due to
collisions with three highly vibrationally excited donors, 2MP, 2,6MP and
3,5MP. The populations of scattered CO2 after collisions with three donors
are fitted by the single-exponential mode (left plots) and the bi-
exponential mode (right plots).
Figure 6.8 A two-component biexponential function fitting curve of the nascent
rotational distributions of scattered CO2 through collisions with
excited 2MP, 2,6MP and 3,5MP. The plots to the right are the
residuals for the fitting results.
Figure 6.9 Two energy sub-distributions are separated by the two-component
model. The cold population distribution with Ta ~ 300 K is
associated with weak collisions shown as three alkylpyridine
molecules with CO2. The hot populations of scattered CO2 from the
strong collisions with three alkylpyridine molecules are 592 K for
2MP, 852 K for 2,6MP, and 600 K for 3,5MP. The contributions of
cold and hot populations for the observed populations are 88:22 for
2,6MP/CO2, 58:42 for 2MP/CO2 and 85:15 for 3,5MP/CO2.
Figure 6.10 The ratios of experimental appearance collision rate kapp with
Lennard-Jones collision rate kLJ for different collision systems.
Figure 6.11 The full energy transfer distribution function P(E) curves for CO2
with four highly vibrationally excited donors: 2MP, 2,6MP, 3,5MP
and pyrazine. (a) shows three curves normalized to the Lennard-
Jones collision rate kLJ and (b) is normalized to the experimental

xviii
appearance collision rates kapp for three collision systems.
Figure 7.1 The GRETCHEN model is based on Fermi’s golden rule and the
idea that collisions of a highly excited molecule provide time-
dependent perturbations that induce energy transfer between
molecules. The probability for an energy exchange of the amount
E is predicted to be proportional to the final state density
(EE). .
Figure 7.2 Transient IR absorption for CO2 (0000) J = 66 following excitation
of azulene at = 266 and 532 nm. The appearance signals of
specific CO2 rotational high-states result from collisions with highly
vibrationally excited azulene with different internal energies.
Figure 7.3 Nascent population distributions of CO2 (0000) in high-J states
(6278) through from collisions with highly vibrationally excited
azulene which was prepared with = 532 and 266 nm.
Figure 7.4 Doppler-broadened transient absorption line profile for CO2 (0000) J
= 68 collected at t = 1 s following laser excitation of azulene at =
266 and 532 nm. Transient absorption data are fitted by a Gaussian
function.
Figure 7.5 CO2 rotational state dependence of the average relative translational
energy distribution through collisions with highly vibrationally
excited azulene at λ = 532 and 266 nm.
Figure 7.6 Energy transfer distributions P (E) for strong collisions between
highly vibrationally excited azulene(E = 38580 and 20390 cm-1
)
with CO2. P (E) curves are obtained in terms of the energy
transfer rates and rotational/translational gain.
Figure 7.7 Energy transfer probability for strong collisions of azuelene(E =
38580 and 20390 cm-1
) with CO2. For each azulene internal energy
in two plots, the transient IR probing data is compared with the
results from KCSI experiment and PECT calculation.
Figure 7.8 Semilogarithmic plot for azulene vibrational state density (EE)

xix
as a function of internal energy for initial E= 38580 and 20390 cm-1
.
Figure 7.9 The linear correlation of the experimental shape parameter obs and
the state density shape parameter for strong collisional quenching
of CO2 with a series of highly vibrationally excited donor
molecules: azulene, 2,6-lutidine, picoline isomers, pyrazine,
pyridine, C6F6 and toluene.
Figure 8.1 The structures of aromatic species discussed in this Chapter
Figure 8.2 Transient IR absorption signals for appearance of CO2 (0000, J = 62)
through collisions with three donors, 2EP, 2PP, and 2tBP, initially
excited with = 266 nm.
Figure 8.3 Nascent Doppler-broadened line profiles for CO2 (0000, J = 72)
following collisions with vibrationally excited 2EP (a), 2PP (b) and
2tBP (c). The experimental data collected at 1 μs after UV pulse are
fitted by the Gaussian function.
Figure 8.4 The relative translational temperatures Trel that describe the
translational energy distributions between recoiling donors and CO2
(0000, J = 6278). The upper plot compares the translational energy
distributions of the alkylated-pyridines with that for pyridine.
Donor alkylation reduces the translational energy of the scattered
CO2 molecules. The lower plot compares Trel for different alkylated
donors. The increase in Trel with CO2 J-state is consistent with an
impulsive energy transfer mechanism. For a give J-state, Trel
generally follows the ordering of 2MP > 2PP > 2tBP > 2EP.
Figure 8.5 Nascent rotational distributions of scattered CO2 (0000, J = 6278)
at t = 1 μs following collisions with highly vibrationally excited
three alkylated pyridine: 2EP, 2tBP, and 2PP. The products of
rotational distributions of scattered CO2 through collisions with
three donors are similar Trot ~ 590 ± 60 K.
Figure 8.6 The effective impact parameter beff is a function of the average
change of CO2 angular momentum ΔJbath . Values of beff for CO2
with pyridine and alkylated pyridine pairs are compared.
xx
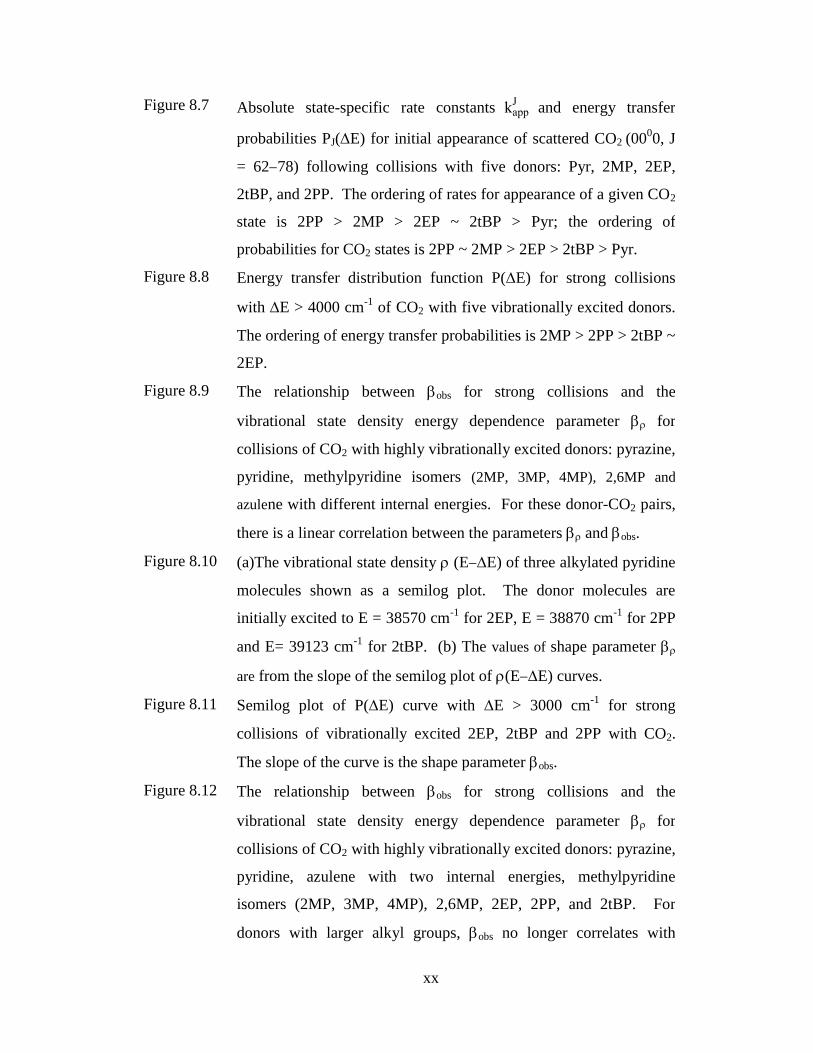
Figure 8.7 Absolute state-specific rate constants kappJ
and energy transfer
probabilities PJ(E) for initial appearance of scattered CO2 (0000, J
= 6278) following collisions with five donors: Pyr, 2MP, 2EP,
2tBP, and 2PP. The ordering of rates for appearance of a given CO2
state is 2PP > 2MP > 2EP ~ 2tBP > Pyr; the ordering of
probabilities for CO2 states is 2PP ~ 2MP > 2EP > 2tBP > Pyr.
Figure 8.8 Energy transfer distribution function P(E) for strong collisions
with E > 4000 cm-1
of CO2 with five vibrationally excited donors.
The ordering of energy transfer probabilities is 2MP > 2PP > 2tBP ~
2EP.
Figure 8.9 The relationship between obs for strong collisions and the
vibrational state density energy dependence parameter for
collisions of CO2 with highly vibrationally excited donors: pyrazine,
pyridine, methylpyridine isomers (2MP, 3MP, 4MP), 2,6MP and
azulene with different internal energies. For these donor-CO2 pairs,
there is a linear correlation between the parameters and obs.
Figure 8.10 (a)The vibrational state density (EE) of three alkylated pyridine
molecules shown as a semilog plot. The donor molecules are
initially excited to E = 38570 cm-1
for 2EP, E = 38870 cm-1
for 2PP
and E= 39123 cm-1
for 2tBP. (b) The values of shape parameter
are from the slope of the semilog plot of (EE) curves.
Figure 8.11 Semilog plot of P(E) curve with E > 3000 cm-1
for strong
collisions of vibrationally excited 2EP, 2tBP and 2PP with CO2.
The slope of the curve is the shape parameter obs.
Figure 8.12 The relationship between obs for strong collisions and the
vibrational state density energy dependence parameter for
collisions of CO2 with highly vibrationally excited donors: pyrazine,
pyridine, azulene with two internal energies, methylpyridine
isomers (2MP, 3MP, 4MP), 2,6MP, 2EP, 2PP, and 2tBP. For
donors with larger alkyl groups, obs no longer correlates with

xxi
changes in state density associated with E.
Figure B.1 The linear relationship between and kB for two series of
alkylated cyclic molecules (benzene and cyclopentane) is used to
estimate parameters for alkylated pyridines with CO2.
Figure C.1 The experimental data for DCl (J = 5) from collisions with vibrationally
excited pyrazine are fitted by a double-Gaussian function. The data are
illustrated as grey circles and the fitting result is shown as a solid line.
One set of fitting results for six parameters are also shown in the upper
plot. The residual value for each point is shown as the grey circles in the
lower plot.
Figure C.2 The sum of residuals based on 3 parameters fitting with one parameter
constained.
Figure D.1 The residuals for fitting results of the two-component mode at different
constraints.

xxii
Abbreviations
A rotational constant
absorption strength
AC alternating current
B rotational constant
c speed of light
C rotational constant
cm centimeter
cm-1
wavenumber
CO carbon monoxide
CO2 carbon dioxide
cw continuous wave
DC direct current
DCl deuterium chloride
E energy change
Erot rotational energy
Etrans translational energy
Evib vibrational energy
Lennard-Jones well depth
F-center F-center laser
FWHM full width at half maximum
HCl hydrogen chloride
H2O water
HOD hydrogen deuterium oxide
InSb indium antimonide
IR infrared
J total angular momentum quantum number
K Kelvin
kint integrated energy transfer rate constant

xxiii
appearance rate constant
kB Boltzmann constant
kLJ Lennard-Jones collision rate constant
path length
LJ Lennard-Jones
wavelength
m meter
mol mole
s microsecond
m micrometer
MW megawatt
vibrational frequency
Nd Neodymium
ns nanosecond
p pressure
P probability
pop population
R ideal gas constant
RT rotation and translation
vibrational state density
S0 electronic ground state
S1 first excited singlet electronic state
S2 second excited singlet electronic state
S4 forth excited singlet electronic state
Lennard-Jones diameter
s second
t time
T0 initial temperature
T1 first excited triplet electronic state
Trot rotational temperature

xxiv
Ttrans translational temperature
UV ultraviolet
v velocity
VV vibration to vibration
VRT vibration to rotation and translation
- 1 -
Chapter 1: Introduction of Collisional Quenching Dynamics
1.1 Significance of Collision Energy Transfer
Collisional energy transfer is a key step in many chemical reactions.1-5
When
molecules have energies near their reaction thresholds, collisions between these excited
molecules and cold bath molecules determine the fate of the reactions of the activated
molecules.6 Therefore, understanding the mechanisms of the collisional relaxation of
highly excited molecules is of both fundamental interest and practical value for the
modeling of combustion and atmospheric chemistry. Knowledge of the collisional
energy transfer dynamics between molecules can help us to predict the rates of reactions
in combustion and atmospheric chemistry.5,7,8
A general theory for thermal unimolecular reactions was developed by
Lindemann in 1922 and later improved upon by Hinshelwood in 1927.9-11
The
Lindemann-Hinshelwood Model incorporates collisional energy transfer to explain the
pressure dependence of unimolecular reaction rates.12
This model shows that inelastic
collisions play a key role in the mechanism of unimolecular reactions. The mechanism
for the unimolecular reaction in the presence of collisions is described by three steps:
A+Mk1 A
*+M (collisional activation) (1.1)
A*+M
k-1
A +M (collisional deactivation) (1.2)
A* k2 B (unimolecular reaction) (1.3)

- 2 -
Here, A is the reactant molecule, M is an inert collision partner, A* is the excited species
with high internal energy and B is the product of dissociation of A*. Eq 1.1 shows that
the reactant A becomes excited to A* through collisions with M and the rate of
appearance of A* from this step is shown as Eq 1.4:
d A*
dt = k1 A M (1.4)
Eq 1.2 tells us that excited A* can be deactivated following collisions with M with a rate
given as Eq 1.5:
d A
*
dt = k-1 A
* M (1.5)
The Lindemann-Hinschelwood Model assumes that every collision is effective at
removing enough energy from A* so that it is not reactive. This assumption is known as
the strong collision assumption. Excited A* can also dissociate to product B. The rate
for the reaction is shown by Eq 1.6:
d A*
dt = k2 A
* (1.6)
Applying the steady-state approximation to A* yields an overall reaction rate given by Eq
1.7:
- 3 -
Reaction rate = k1k2 A M
k-1
M + k2 (1.7)
At low pressures, Eq 1.1 is the rate determining step and the reaction rate has 2nd
order kinetics. At high pressures, the collisional activation and deactivation establish a
rapid equilibrium, and Eq 1.3 becomes the rate determining step. In this case, the
observed rate for the reaction has 1st order kinetics.
After the Lindemann-Hinshelwood Model, other theories were developed, such as
the Statistical Adiabatic Channel Model (SACM), to describe unimolecular reactions.
Most of these theories use the strong collision assumption, so understanding collisional
dynamics and the role of collisions on the fate of excited molecules is an important goal.
Many important questions about the collisional dynamics of highly excited
molecules remain unanswered: How does energy transfer between two molecules occur
through collisions? Which pathways are the predominant channels of energy transfer in
collisions of two molecules? What properties of highly excited molecules are important
in the collisional activation and deactivation? How does the internal energy of the
excited molecules affect the energy transfer?
The work presented in this thesis seeks to find the answers for these questions.
Using high resolution transient IR absorption spectroscopy, my doctoral research
illustrates how excited molecules transfer energy to cold bath molecules through
collisions. This work provides a detailed picture of the collisional quenching of high
energy molecules and will serve as a benchmark for future models of molecular energy
transfer.

- 4 -
1.2 “Weak” and “Strong” Collisions
Lindeman recognized that collisions are often the means by which molecules gain
sufficient energy to react. Without detailed knowledge of energy transfer mechanisms,
Hinschelwood introduced the “strong” collision assumption to account for collisional
deactivation by equating the deactivation rate (Eq 1.2) with the collision rate. He
assumed that every collision would remove enough energy to deactivate a reactive
molecule. Since collisions actually involve a distribution of energy transfer values, the
strong collision assumption greatly overestimates the effect of deactivating collisions.
Strong collisions, by definition, involve large amounts of energy. On the other
extreme, collisions that induce small energy changes are known as weak collisions. Troe
introduced the concept of “weak” collisions to account for the discrepancy between
observed and calculated rates for unimolecular reactions in the presence of collisions.13,14
Some studies on unimolecular reactions have illustrated this phenomenon, such as in
Figure 1.1.13,15,16
This thesis uses the terms “strong” and “weak” as relative descriptors for
collisions that induce large and small changes of energy, respectively. A representative
energy transfer distribution function for the relaxation of a highly excited molecule is
shown in Figure 1.2, where we see that weak collisions occur far more often than strong
collisions. In this thesis, the dynamics of energy transfer for strong and weak collisions
are investigated. Projects described in Chapters 36 measure the complete energy
transfer distribution from both weak and strong collisions. Work in Chapter 7 and 8
focuses on studying the strong collisions for different highly excited molecules.

- 5 -
Figure 1.1 Schematic illustrating collisional deactivation by strong and weak collisions.

- 6 -
E, cm-1
P(
E) weak collisions
strong collisions
Figure 1.2 Energy transfer distribution function shows that weak collisions of excited
molecules (small E) occur more often than strong collisions (large E).

- 7 -
1.3 Methods for Studying the Collisional Relaxation of Highly Vibrationally Excited
Donors
A number of theoretical studies have investigated the collisional quenching of
highly excited large molecules. In the 1970’s, Troe and Rabinovitch independently
developed semiempirical master equation theories using microcanonical transition state
theory to describe collisional relaxation.14,17-20
Since the exact nature of the distribution
function was not known at that time, they introduced different model functions such as
stepladder, exponential and Gaussian forms for the distribution function. Due to the
unknown functional form of the distribution, a consistent picture of how collisional
relaxation depends on fundamental molecular properties did not emerge. Schlag and co-
workers developed a statistical model wherein a collision complex is formed and energy
randomization occurs among all degrees of freedom.21-23
Nordholm and coworkers
proposed that the energy of the colliding molecules is redistributed microcanonically, as
it would be in a quasibound collision complex. Based on this idea, they developed the
ergodic collision theory (ECT).24-26
This theory correctly predicts observed collision
trends but overestimates average collision energy transfer values E. Recently,
Nordholm and coworkers have developed a semiempirical extension of ECT, called the
partially ergodic collision theory (PECT), which describes energy redistribution using a
variable subset of donor and bath degrees of freedom that are involved in the energy
redistribution.27-30
Developing a detailed physical picture of energy transfer in molecular collisions
is challenging because of the high dimensionality of the available phase space. Classical
and semiclassical trajectories are powerful tools for providing insight into molecular

- 8 -
collisions, particularly when coupled with experimental results. Trajectory calculations
have been performed on collisions that quench high energy molecules by a number of
investigators, including Lendvay and Schatz,31,32
Gilbert and co-workers,33,34
Lim,35,36
Bernshtein and Oref,37,38
Luther and co-workers,39-41
Yoder and Barker,42
Chapman and
co-workers,43,44
and Li et al.45
Most studies have focused on atomic collision partners.
These studies show that most of the energy transfer involves the low-frequency donor
modes, that chattering collisions are involved in both large- and small-E collisions
(particularly when the collision partner is a molecule), and that large-E collisions occur
through repulsive interactions.
A number of experimental methods such as UV absorption (UVA),46-52
IR
fluorescence (IRF),53-60
and time-resolved FTIR emission61-63
have been used to measure
the collisional deactivation of high-energy molecules. The experimental data from these
studies have been fit using various model distribution functions such as single-, double-,
and extended-parameter exponentials. Luther and co-workers have used kinetically
controlled selective ionization (KCSI) and fluorescence (KCSF) techniques to measure
relaxation distributions of highly excited molecules.27,29,64-68
These approaches measure
the complete energy transfer distribution function P(E,E’) using two-color, two-photon
ionization to monitor the highly excited molecules as they relax by collisions.
Distributions of highly excited molecules with initial energy E are monitored as the
molecules pass through experimentally determined energy windows at the energy E’.
KCSI experiments are “self-calibrating” and do not require an empirical calibration curve.
Their results are best described using a parameterized mono-exponential distribution.
There is good agreement between their results and the predictions of Nilsson and

- 9 -
Nordholm’s partially ergodic collision theory (PECT).27
Recently, a new technique used
molecular beam ion imaging to determine the energy transfer distribution functions for
highly excited molecules with atomic collision partners.69-73
Our group has investigated the collision dynamics for a number of collision pairs
using high-resolution transient IR absorption spectroscopy.74-88
This approach measures
energy gain of the energy-accepting molecules after collisions with highly excited
molecules. This technique tells us directly about the bath molecule’s energy gain in the
vibrational, rotational and translational degrees of freedom resulting from collisions with
high energy molecules. In addition, the energy transfer probability distribution function
P(ΔE), the collision rate, and the average transfer energy ΔE rate for the single collisions
are measured experimentally.
The work in this thesis uses pulsed optical excitation to generate a highly excited
molecule and monitors energy gain in small bath molecules using high-resolution
transient IR spectroscopy. State-resolved product distributions yield a detailed picture of
the collision dynamics. Energy transfer distribution functions are determined from the
perspective of the bath molecules. Michaels and Flynn developed the formalism for
converting rotational state-specific energy gain distributions and rate constants into an
overall probability distribution function.89
Flynn and coworkers studied the strong
collision dynamics for a number of excited molecules (E) with CO2 system firstly using
transient IR absorption.74,90-100
Sevy and co-workers have studied the interplay of
photodissociation dynamics with collisional deactivation for several donor molecules
with CO2 using a similar IR probe technique.96,101-103

- 10 -
1.4 High Resolution Transient IR Absorption Spectroscopy
This thesis presents studies of the collisional relaxation of highly vibrationally
excited molecules using high resolution transient IR absorption. The experiments can be
described by three processes.
Highly vibrationally excited donor molecules are prepared by pulsed visible or
UV light.
(1) Donor + h (UV or vis) Donor (E)
Collisions with small bath molecules induce energy losses in the high energy
molecules and energy gain in the bath molecule. The scattered bath molecule will have
energy in vibration (v), rotation (J), and/or translation (V).
(2) Donor (E) + Bath Donor (EE) + Bath (v, J, V)
The nascent scattered bath molecules are measured with high resolution transient
IR absorption.
(3) Bath (v, J, V) + h ( ~ 2.74.3 µm) Bath (v’, J’, V’)
where, v is the vibrational state of bath molecule, J is the rotational angular momentum
quantum number of bath molecule and V denotes the component of the recoil velocity
- 11 -
along the IR probe axis. The details of the experimental method will be described in
Chapter 2.
1.5 Molecules in this Thesis
1.5.1 Highly Vibrationally Excited for Azabenzene Molecules
This thesis explores how the properties of donor molecules affect collisional
energy transfer dynamics. A number of different azabenzene molecules were used as
highly vibrationally excited molecules. Figure 1.3 illustrates the azabenzene donor
molecules investigated in this thesis.
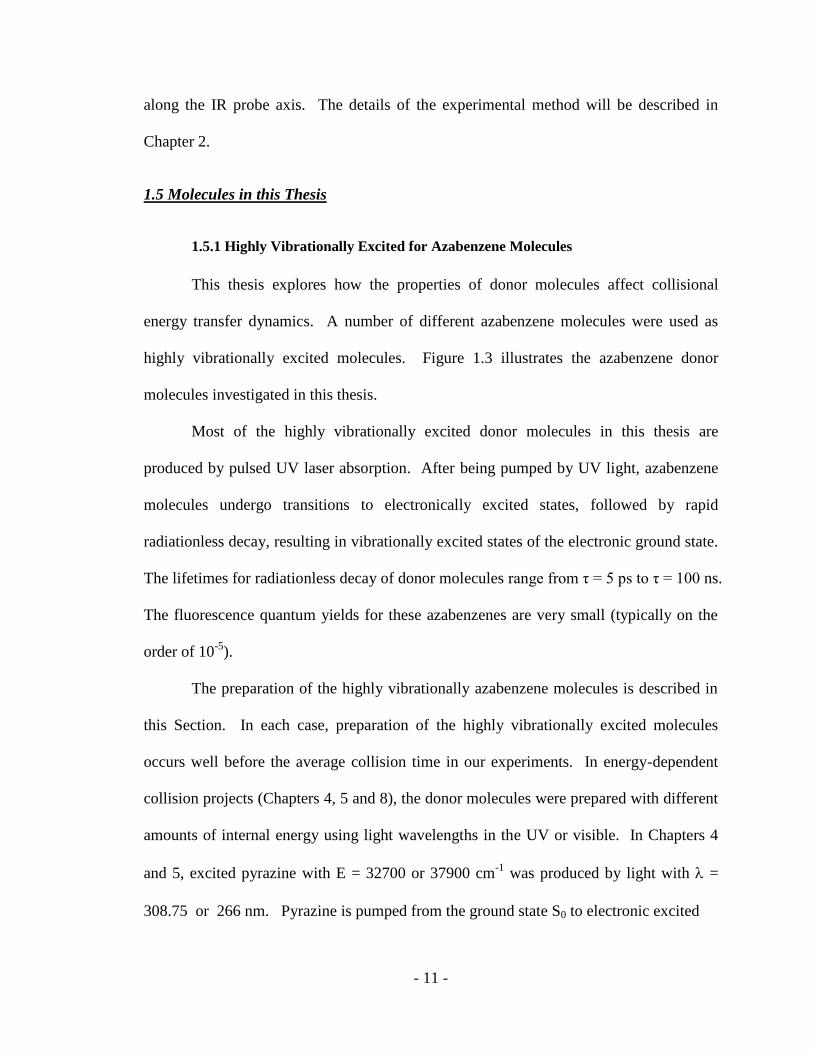
Most of the highly vibrationally excited donor molecules in this thesis are
produced by pulsed UV laser absorption. After being pumped by UV light, azabenzene
molecules undergo transitions to electronically excited states, followed by rapid
radiationless decay, resulting in vibrationally excited states of the electronic ground state.
The lifetimes for radiationless decay of donor molecules range from τ = 5 ps to τ = 100 ns.
The fluorescence quantum yields for these azabenzenes are very small (typically on the
order of 10-5
).
The preparation of the highly vibrationally azabenzene molecules is described in
this Section. In each case, preparation of the highly vibrationally excited molecules
occurs well before the average collision time in our experiments. In energy-dependent
collision projects (Chapters 4, 5 and 8), the donor molecules were prepared with different
amounts of internal energy using light wavelengths in the UV or visible. In Chapters 4
and 5, excited pyrazine with E = 32700 or 37900 cm-1
was produced by light with =
308.75 or 266 nm. Pyrazine is pumped from the ground state S0 to electronic excited

- 12 -
N
N
N
pyrazine 2-methylpyridine
(2MP)
N
N
2,6-dimethylpyridine
(2,6MP)
3,5-dimethylpyridine
(3,5MP)
N
N
(2-ethylpyridine)
(2EP)
2-t-butylpyridine
(2tBP)
N
2-propylpyridine
(2PP)
azulene
Figure 1.3 Highly vibrationally excited donor molecules studied in this thesis.
- 13 -
state S1 by 308.75 nm UV light. Electronically excited pyrazine then transforms a
transition to vibrationally excited ground state pyrazine S0(E) through two paths.104,105
One process is internal conversion from S1 to S0(E) directly and the other process
involves two intersystem crossings, S1 T1 S0(E). The first intersystem crossing S1
T1 is rapid ( < 50 ps) and has almost unity quantum yield.106
The lifetime for the
second intersystem crossing T1 S0(E) is a single-exponential function of the UV laser
wavelength with τ = 180 ns for T1 S0(E) at 308.75 nm. At = 266 nm, pyrazine is
pumped from the ground state to the S2 state, and then converts rapidly to S1. From S1,
pyrazine intersystem crossing undergoes to T1 and then to S0(E) with a life time of ~ 50
ns.95,107
The state-decay information of pyrazine at different pump wavelengths is listed
in Table 1.1.
Highly vibrationally excited azulene(E = 20390 or 38580 cm-1
) in Chapter 8 is
prepared light with = 532 or 266 nm. At these wavelengths, azulene molecules are
excited to the S1 and S4 electronic singlet states, respectively. Internal conversion is the
dominant relaxation process from both the S1 and S4 states, with near unity quantum
yields for forming highly vibrationally excited S0(E) azulene molecules. The lifetime of
the S1 state is several picoseconds.108
The S4 state initially relaxes to S2 by fast internal
conversion and then S2→S0 internal conversion forms high vibrational levels of the
electronic ground state.65,109
The lifetime of the S2 state following 266 nm excitation is
less than 3.4 ns.110
The internal energy E includes the photon energy and the thermal
vibrational energy. The decay paths and lifetimes for azulene are listed in Table 1.1.
Several vibrationally excited alkylated pyridine molecules are prepared in
alkylation-effect projects (Chapter 6 and 7). The excitation processes for these alkylated

- 14 -
Table 1.1 The decay pathways and life times for donor molecules.
Donor , nm Evib, cm-1
Major Pathway
pyrazine 266 37900 1) S2 S1
2) S1 T1
3) T1 S0(E) <50 ns
308.8 32700 1) S1T1 < 50 ps
2) T1S0(E) 180 ns
pyridine 266 37920 1) S1 S0(E) 60 ps
2) S1T1 50 ps
3) T1S0(E) <100 ns
azulene 266 38580 1) S4 S2
2) S2 S0(E) < 3.4 ns
532 20390 S1 S0(E) < 10 ps
- 15 -
pyridine molecules are similar to those of pyridine and the rates are faster than those for
pyridine. Therefore, the preparation of the highly vibrationally excited pyridine is
described as a representive sample here. Pyridine molecules are pumped to the single
electronic excited state S1 by 266 nm light. Excited pyridine molecules in the S1 state
undergo relaxation to the vibrationally excited state S0(E) in two ways. Pyridine(S1)
internally converts to S0(E) with 60 ps. Pyridine molecules also undergo double
intersystem crossing of the form S1 T1 S0(E). The life time for the intersystem
crossing S1 T1 is 50 ps, while that for the intersystem crossing T1 S0(E) is <
100 ns.111-113
The state-decay information for pyridine molecules are also listed in Table
1.1.
1.5.2 Bath Molecules
Two bath molecules are studied in this thesis: DCl and CO2. Both species have
strong IR absorption and spectral features that are sparse enough so that their energy gain
profiles can be measured using transient high-resolution absorption.
High-resolution transient IR absorption was used to measure the rotational and
translational energy gain profiles of DCl (v = 0) through collisions with excited pyrazine
in Chapter 3. The IR probe is the DCl (v = 1) (v = 0) transition at = 4.3 m shown
in Figure 1.4. In addition to studying the v= 0 state of DCl, this work measured
appearance of DCl (v = 1) using the (v = 2) (v = 1) hot band transition. DCl (v = 1)
population at 300 K is almost zero and < 1% of the scattered molecules is observed in the
v =1 state. The transient signal levels for the DCl (v = 1) state are small compared to
those for population changes in the (v = 0) state. Therefore, the population changes for

- 16 -
DCl CO2
Figure 1.4 IR probing for strong and weak collision for DCl and CO2 bath molecules.
v=1
2210 cm-1
v =0 Low J
High J
Strong Collision
Probing
Weak Collision
Probing
1001
3700 cm-1
Weak Collision
Probing
0000 Low J
Strong Collision
Probing 0001
2350 cm-1
High J

- 17 -
low and high J states of DCl can be measured using the (v = 1) (v = 0) transition
without interference from collisions populating the upper state of the probe transition.
After collisions with highly vibrationally excited donor molecules, the population
changes for CO2 in low and high-J states are measured by IR light with = 4.3 or 2.7 m,
as shown in Figure 1.4. The number density of scattered CO2 in high-J states is measured
with the single-quantum (0001) ← (00
00) transition using a diode laser at = 4.3 m.
The outcome of weak collisions involving CO2 low-J states is probed using combination
band CO2 (1001) ← (00
00) transitions near = 2.7 m from a F-center laser. Two factors
limit diode laser probing to CO2 high-J states. The low-J (0001) ← (00
00) CO2 transitions
are saturated due to the large oscillator strength and populations of CO2 in these
states.78,79,114
The oscillator strength of the (1001) (00
00) transition is small enough
that thermally populated CO2 states do not absorb the probe light completely. In addition,
the (1001) (00
00) combination band is an effective probe of population changes for
low-J CO2 (0000) states since direct vibration-to-vibration energy transfer into the (10
01)
state is negligible and does not interfere with transient absorption measurements within
the (0000) state. It is known that the CO2 (00
01) state is a product of collisions with
highly vibrationally excited molecules.74
1.6 Overview of the Work in this Thesis
The research in this thesis is designed to address questions about the collisional
relaxation of the highly vibrationally excited molecules. The various projects study how
the properties of excited molecules affect the collisional quenching. Chapters 36 report
the dynamics of weak collisions for a number of collision systems. Combining these data

- 18 -
with prior data for strong collisions yields information about the full distribution of
energy transfer. Chapters 7 and 8 consider how molecular structure affects strong
collisions.
The organization of this thesis is as follows:
Chapter 2 describes the setup of two types of high resolution transient IR
absorption spectrometers: the diode laser spectrometer and the F-center laser
spectrometer. These two spectrometers cover the IR probe regions for CO2 and DCl.
Chapter 3 explores the weak collisions between pyrazine(E = 37900 cm-1
) and
cold DCl bath molecules. With the results of a previous study of DCl high-J states, the
whole vibration-to-rotation/translation (VRT) pathway energy transfer information is
obtained. The rotational distribution of scattered DCl is a single Boltzmann distribution.
J-dependent translational distributions are observed. This Chapter provides a direct
measurement of the collision rate that is close to the predicted value from the Lennard-
Jones collision model. The VRT pathway is a dominant channel of collision energy
transfer. This study has been published in the Journal of Physical Chemistry A.115
Chapter 4 investigates the weak collisions of pyrazine(E = 37900 cm-1
) and CO2
molecules. In combination with previous data for CO2 high-J states, the whole
distribution for VRT energy transfer between pyrazine(E = 37900 cm-1
) and cold CO2
bath molecules is presented. The scattered CO2(0000) molecules have a biexponential
rotational energy distribution. The distribution shows evidence for distinct weak and
strong collision pathways. VRT energy transfer is the dominant pathway through which
pyrazine(E) is relaxed by collisions with CO2. The experimental collision rate is in good
agreement with the Lennard-Jones model. The full energy transfer distribution function

- 19 -
P(E) is presented. This study has been published in the Journal of Physical Chemistry
A.116
Chapter 5 investigates the internal energy effect on the collision dynamics of
pyrazine(E)/CO2 pair by comparing the experimental results at E = 32700 cm-1
and 37900
cm-1
. The distributions of both rotational and translational energy in scattered CO2
molecules are sensitive to the internal energy of pyrazine. Within experimental error, the
observed collision rates are not very sensitive to the internal energy of pyrazine.
However, increasing the donor internal energy reduces the probability of weak collision
and induces more strong collisions.
Chapter 6 addresses how the structure of vibrationally excited molecules affects
the collisions. Scattering dynamics for several donor species are compared: pyrazine, 2-
methylpyridine, 2,6-dimethylpyridine, and 3,5-dimethylpyridine. Methyl-group addition
has a large impact on the collisional quenching of vibrationally excited molecules. The
energy transfer distributions are affected by the number of methyl groups, but not by the
positions of the groups in the aromatic ring relative to nitrogen atom in the ring.
Biexponential population distributions for the scattered CO2 are observed in collisions
with each of these donors. Donor alkylation also increases the appearance collision rates,
which are higher than Lennard-Jones collision rates.
Chapter 7 reports the energy dependence of strong collisions of CO2 with highly
vibrationally excited azulene for two initial energies, E = 20390 and 38580 cm-1
. Both
the distribution of transferred energy and the energy transfer rates are sensitive to the
azulene energy. For strong collisions, the average rotational and translational energies of
the scattered CO2 molecules double when the azulene energy is increased by a factor of 2.

- 20 -
The rate of energy transfer via strong collisions increases by nearly a factor of 4 when the
azulene energy is doubled. The energy transfer probability distribution function for E >
3000 cm-1
at each initial energy is an exponential decay with curvature that correlates
with the energy dependence of the state density. This result is in excellent agreement
with predictions from GRETCHEN, a model that uses Fermi’s Golden Rule to describe
collisional quenching of highly excited molecules. This study has been published in the
Journal of Chemical Physics.117
Chapter 8 focuses on the strong collisions of a series of alkylated pyridine
molecules on strong collisions. The collisions of CO2 with three alkylated pyridine
species (2-ethylpyridine, 2-propylpyridine, and 2-t-butylpyridine) are reported in this
Chapter. The alkylated donors impart less rotational and translational energy to CO2 than
does pyridine. Alkyl chains reduce the average energy per mode, and the probability of
strong collisions is reduced. Comparison of effective impact parameters shows that the
alkylated donors undergo strong collisions with CO2 via a less repulsive part of the
intermolecular potential than does pyridine. Some of this work has been published in the
Journal of Physical Chemistry A.118

- 21 -
Chapter 2: Experimental Methods
2.1 Introduction
The collisional quenching dynamics of high energy molecules was studied using
high-resolution transient IR absorption spectroscopy. The spectroscopy was performed
using two types of laser systems: a pulsed UV laser to generate highly excited molecules
and an IR laser for probing the outcome. This spectroscopy is described in Section 2.2.
The high vibrational excitation in the azabenzene donor molecules shown in Figure 1.3
was produced by a pulsed Nd:YAG laser or a dye laser as described in Sections 2.3.1 and
2.3.2. IR light was used to probe scattered CO2 and DCl bath molecules after collisions
with vibrationally hot donor molecules. Two types of IR lasers were utilized to measure
the transient absorption spectra of these bath molecules. IR light with ~ 4.34.5 µm
was produced by lead-salt diode lasers and light at ~ 2.7 µm was produced by an F-
center laser.
2.2 High-Resolution Transient IR Laser Absorption Spectrometers
The collisional energy transfer between bath molecules and highly vibrationally
excited donor molecules was measured using the transient IR absorption. This technique
interrogates the details of collisional energy transfer from vibrationally hot donors to bath
molecules. In these experiments, the UV pulse and IR beam were propagated collinearly
through a 3 meter flowing-gas Pyrex collision cell as shown in Figure 2.1. A 1:1 mixture
of bath and donor vapor was flowed through the collision cell a total pressure near Ptotal =
20 mTorr.

- 22 -
Figure 2.1 High-resolution transient IR absorption spectroscopy uses two laser systems: a
pulsed UV laser and a cw IR laser.
Detector cw
Collision cell Time-resolved
IR absorption
UV
Ptotal ~ 20 mTorr
IR
UV pulsed

- 23 -
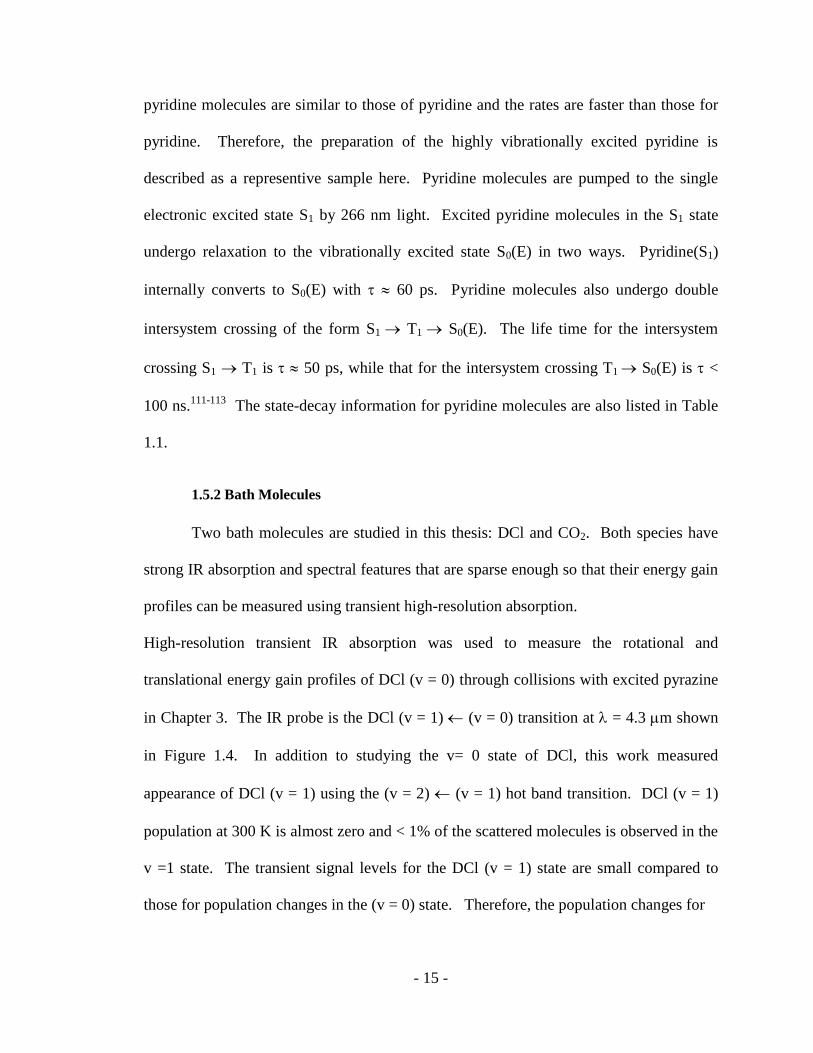
2.2.1 Diode Laser Spectrometer
The diode laser spectrometer uses a diode laser as the IR probe and a Nd:YAG
laser as the pump laser, as shown in Figure 2.2. The wavelength of the IR output from
the diode laser is ~4.3 µm and was used to probe CO2 high-J states and DCl low-J states.
After passing through the collision cell, the IR beam goes through a monochromator to
ensure that the intensity changes for a single mode of the diode laser are monitored by a
liquid-nitrogen-cooled InSb detector with risetime of τ = 100 or 300 ns.
The spectrometer uses a lock-in technique to decrease IR frequency drifts of the
diode laser. 10% of IR beam was passed through a reference cell and the signal after the
reference cell was collected by a liquid-nitrogen-cooled InSb detector, the output of
which was directed into a lock-in amplifier. The lock-in amplifier sends an error signal
to the diode laser to correct for drifts in the diode laser current. The reference feedback
loop locks the diode laser either to the center of a single rovibrational transition of the
bath molecules or to a fringe of a scanning Fabry-Perot etalon.
The translational energy distributions of scattered bath molecules in individual
rotational states were measured from nascent Doppler-broadened line profiles at t = 1 µs
after excitation of donors. This measurement was performed by collecting transient
absorption at ~ 40 frequencies over a spectral transition.
A master timer based on the 1 kHz diode laser modulation synchronizes the timing of the
diode laser, Nd :YAG laser and a shutter. The frequency of the shutter is set at 1 Hz to
ensure that the 3-meter cell is refreshed with new gas prior to the pulsed excitation.
- 24 -
Figure 2.2 Diode Laser Spectrometer
Lock-in
Amplifier
InSb
Detector
Tuning
Etalon
Diode Laser Controller
Mono
Chromator InSb
Detector
Digitizing
Oscilloscope Computer
Master
Timer Nd : YAG
Laser
UV Dump
Photo diode
Trigger
Shutter
Reference Cell
Collision Cell
Diode Laser

- 25 -
In a diode laser, the surface of a crystal wafer is doped with a very thin layer of
semiconductor materials. The top of the doped crystal is an n-type region and the bottom
is a p-type region, resulting in a p-n junction or diode. When current goes through the
diode, electrons move from the n-type region to the p-type region while the electron holes
move from the p-type region to the n-type region. The IR output is provided by the
stimulated emission an electron-hole recombination. The energy gaps of electron-hole
pairs determine the frequency of emitted photons.
The output power of the diode laser is ~ 200 W and the frequency resolution is
0.0003 cm-1
. For comparison, Doppler-broadened line profiles at 300 K and = 4.3 m
have Dop = 0.004 cm-1
. The IR output from a diode laser at ~ 4.3 m was used to
probe single quantum transitions CO2 (0001) (00
00) and results are presented in
Chapters 7 and 8. A different diode laser operating at ~ 4.5 m was used for DCl (v =
1) (v = 0) and (v = 2) (v =1) transitions at 2100 cm-1
, as discussed in Chapter 3.
2.2.2 F-Center Laser Spectrometer
Many aspects of the F-center laser spectrometer are similar to the diode laser
spectrometer. In this spectrometer, the IR probe laser is a F-center laser and the pump
laser is a Nd:YAG laser or a dye laser, as shown in Figure 2.3. The F-center laser
provides a tunable single-mode IR light with ~ 2.7 m. The output wavelength was
determined to within 0.1 cm-1
by a wavemeter. The intensity of the F-center laser is
modulated by low frequency power fluctuations in the Kr pump laser. Therefore, a
second InSb detector (τ = 1 µs) was used to measure the IR light and background
subtraction techniques were employed to correct for the fluctuations.

- 26 -
A single-mode tunable Burleigh FCL-20 F-center laser was used for studies at ~
2.7 m. The F-center laser uses an alkali halide crystal (RbCl:Li) that contains lattice
defects as the gain medium. These lattice defects occur when two adjacent anion
vacancies share one electron. Visible light at = 647 nm from a Kr+ laser pumps the F-
center crystal to an excited state of the center. A tunable IR beam with ~ 2.73.3
µm was produced following the lattice relaxation of the crystal.
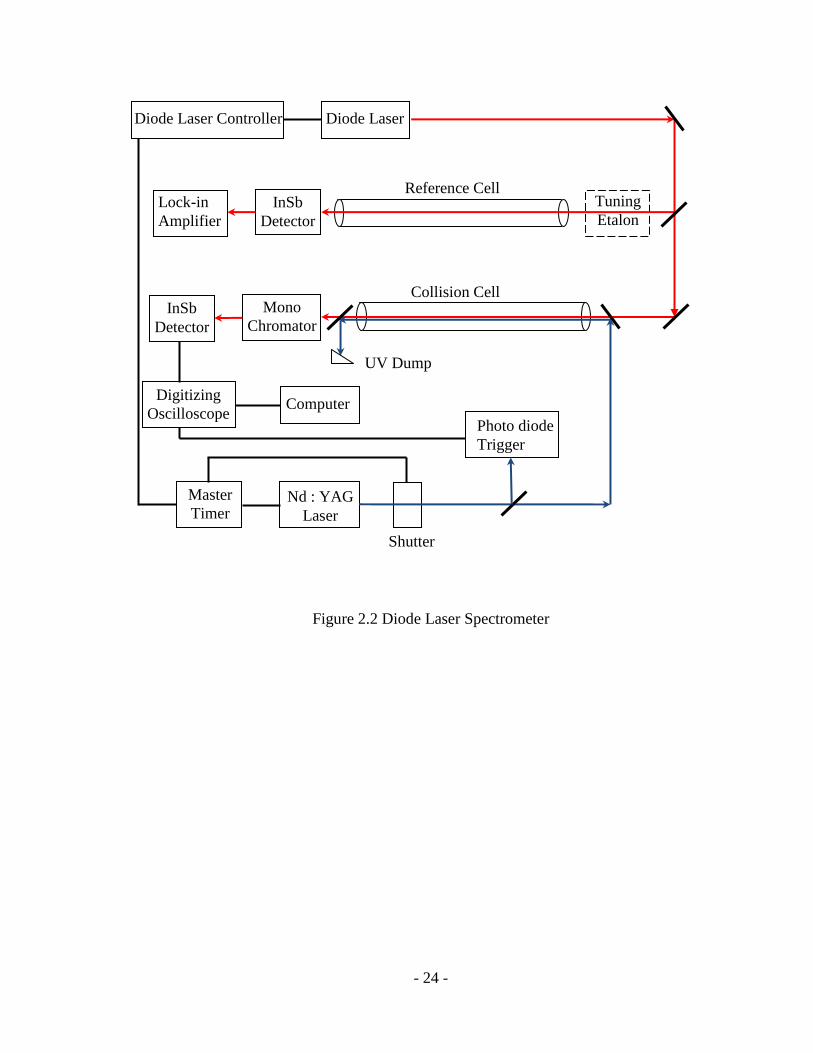
The tuning range of the IR output is relatively broad due to the amount of coupled
lattice vibrations of the crystal. The cavity of the F-center laser was designed to obtain
tunable and single mode IR light. The design of the F-center laser is shown by Figure 2.4.
The laser cavity consists of an end mirror and a diffraction grating. Coarse frequency
selection was achieved by scanning the diffraction grating. A piezoelectric air spaced
etalon was used to achieve a single cavity mode. Fine adjustment and scanning of the
wavelength was performed by rotating a pair of intracavity CaF2 plates and
simultaneously scanning the etalon using active feedback in order to maintain single
mode operation.
The output of the F-center was used to measure weak collisions of CO2 using the
(1001) (00
00) transition near 3700 cm
-1.

- 27 -
Figure 2.3 F-center Laser Spectrometer.
Lock-in
Amplifier
Photo
Diode
Kr Laser
Mono-
chromator
InSb
Detector 1 Digitizing
Oscilloscope
Computer
Dye
Laser Nd:YAG
Laser
UV Dump
Shutter
Reference Cell
Collision Cell
F-center Laser
Fabry-Perot
Etalon
Wavemeter
Confocal
Etalon
InSb
Detector 3
InSb
Detector 2
- 28 -
Figure 2.4 Burleigh F-center Laser

- 29 -
2.3 Laser Systems
2.3.1 Nd:YAG Laser
A Nd:YAG laser was used to generate pulsed UV light at = 532 or 266 nm. The
Nd:YAG laser is a flash lamp-pumped Q-switched oscillator-amplifier system. Nd:YAG
(Yittrium aluminum garnet, Y3Al5O12, doped with Nd ion) is a four-level gain medium.
A 6 mm diameter Nd:YAG rod with antireflective coatings on both ends is optically
pumped using two linear flash-lamps and generates an IR output beam at a wavelength
= 1064 nm. The Q-switch in the oscillator cavity generates a pulsed output with a
duration of 5 ns by controlling the lasing of the cavity via polarization. By adjusting the
Q-switch delay time relative to the flash lamp firing, lasing occurs when the maximum
population inversion is reached.
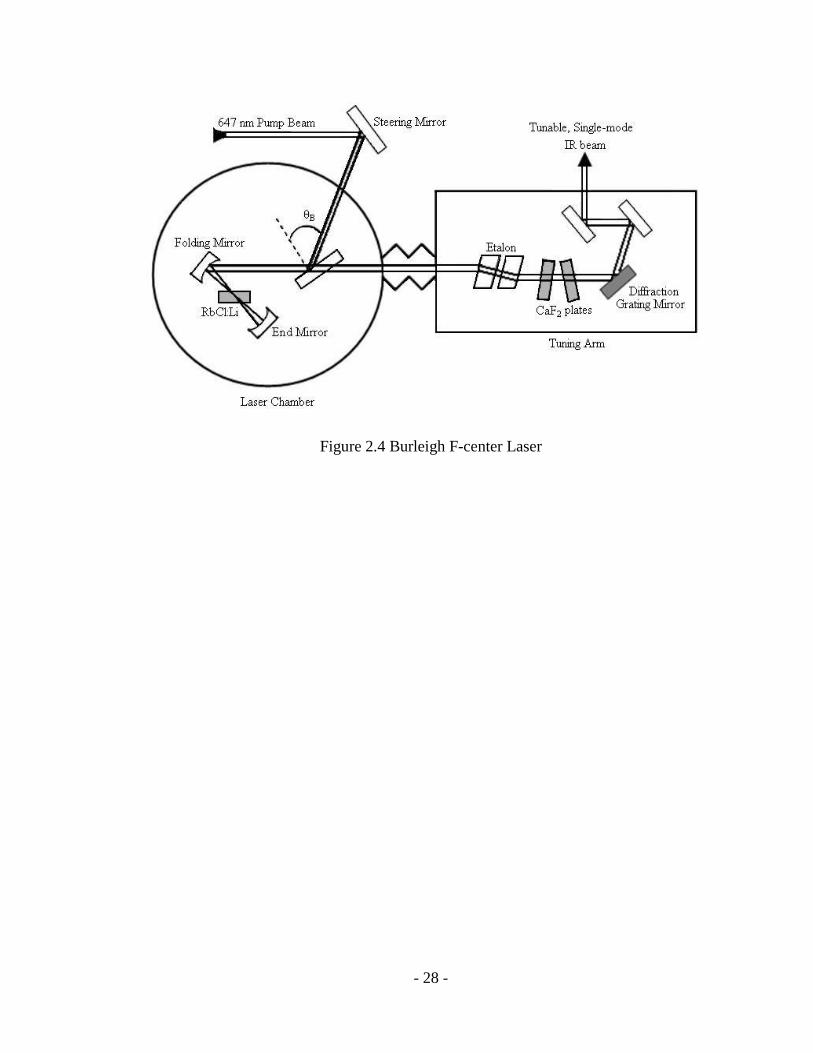
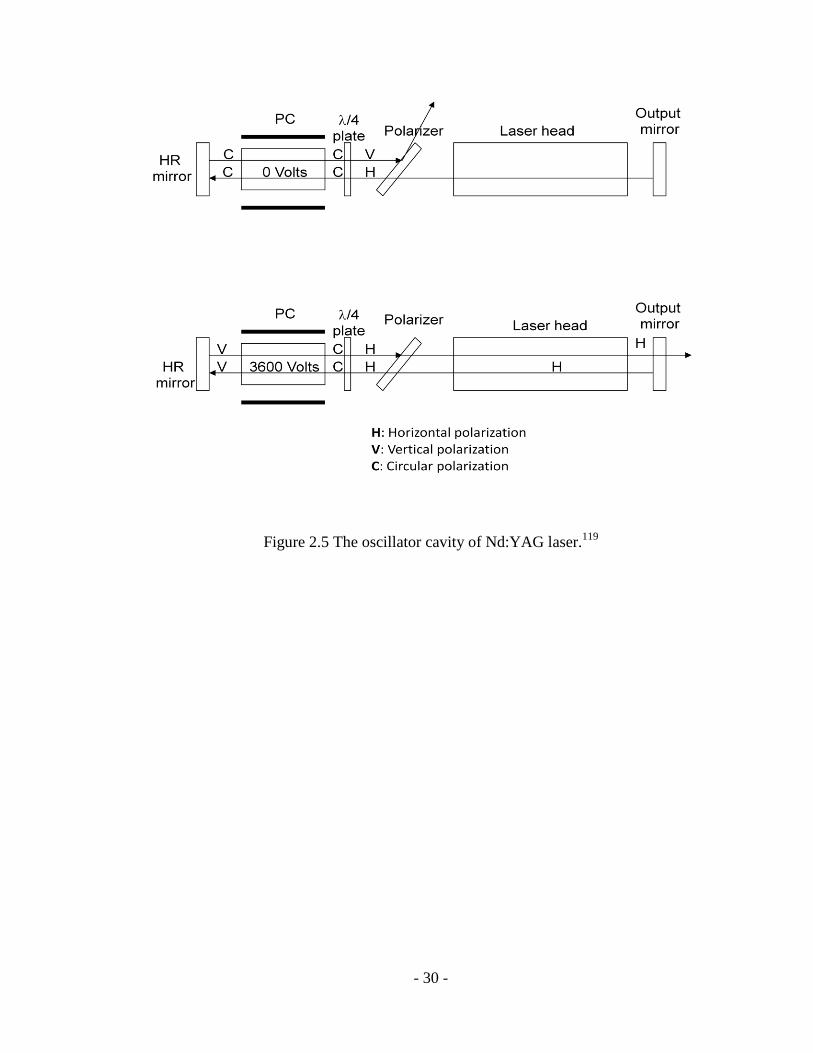
Figure 2.5 illustrates how the Q-switch technique works in the Nd:YAG oscillator
cavity. The beam produced from the oscillator cavity makes a double pass through a
pockels cell (PC), which has a longitudinal field KD*P (KH2(1-x)D2xPO4) crystal inside.
A plate polarizer is highly transparent (> 95%) to horizontal polarization while being
highly reflective (> 99%) to vertical polarization. A quarter-wave plate in the cavity adds
45 rotation with each pass. When 3000 V is applied to the PC, another 45 rotation is
added for each pass. At last, the returned pass is rotated 180 and its direction remains
horizontal. This horizontal beam is transmitted through the plate polarizer. When the PC
has 0 V applied, it does not add +45 for each pass. Therefore, the returned pass with
total rotation of 90 is changed from horizontal to vertical and is rejected by the polarizer.
- 30 -
Figure 2.5 The oscillator cavity of Nd:YAG laser.119

- 31 -
2.3.2 Dye Laser
In Chapter 5, UV light with = 308.75 nm was provided from a ND6000 dye
laser using 2nd
harmonic generation. The main parts of the ND6000 laser are a dye
oscillator and two amplifier cells, which are all pumped by 532 nm light from a Nd:YAG
laser. The dye oscillator contains a Moya dye laser cavity, which includes a tuning
mirror, a grating, a beam expander, a dye cell and a cavity mirror to generate tunable
beams in terms of different dyes. Using different dye solutions, the Moya oscillator
provides tunable visible beams with narrow linewidths and low background fluorescence.
The dye laser output beam with = 605630 nm is shown in Figure 2.6.
Methanol solutions for the dye Rhodamine 640 were used. A strong solution (214 mg /1)
was used for the oscillator cell and a more dilute solution (110 mg/1) was used for the
amplifier cell. Harmonic generation of the dye output was obtained by doubling in KD*P.
A Pellin-Broca prism separates the doubled dye beam from the fundamental dye beam.

- 32 -
Wavelength, nm
540 560 580 600 620 640 660 680 700
Inte
nsity,
mJ/p
uls
e
10
20
30
40
50
60
70
Figure 2.6 The visible output beam of the dye Rhodamine 640 methanol solution in
ND6000 dye laser. The peak intensity is at 615.5 nm.

- 33 -
Chapter 3: Dynamics of Weak and Strong Collisions: Highly
Vibrationally Excited Pyrazine(E = 37900 cm-1
) with DCl
3.1 Introduction
Strong collisions that deactivate highly excited molecules compete with reactive
processes when they remove enough energy to put the molecule below a critical reaction
threshold energy.2,6
However, a number of studies on unimolecular reactions illustrate
the importance of “weak” collisions that induce small changes in energy.13,15,16
Energy
transfer distribution functions obtained from experiments show that weak collisions occur
far more often than strong collisions, but dynamical information on weak collisions is
difficult to obtain experimentally. By their very nature, weak collisions induce only
small changes to the energies and quantum states of the colliding molecules, making it
difficult to distinguish their initial and final energy profiles.
Chapter 1 discusses how weak and strong collisions can be measured by the high-
resolution transient IR spectroscopy. This Chapter reports the rotational and translational
energy gain profiles of DCl (v=0) molecules in low-J states that are populated by weak
collisions with vibrationally excited pyrazine (E = 37900 cm-1
). Combined with earlier
high-J data,120
the complete range of weak and strong collisions is characterized.
The dynamics of pyrazine(E)/DCl collisions are reported here. The experimental
data show that the low-J states of DCl have recoil velocity distributions near Trel = 700 K
for J = 215 states. The average recoil velocities increase for higher J-states of DCl. A
single rotational distribution with Trot = 880 K describes the scattered DCl (v = 0)
molecules with J = 221. In addition to VRT energy transfer measurements, this
- 34 -
Chapter also reports vibration-to-vibration (VV) energy transfer and finds that VRT
energy transfer is the primary relaxation pathway for highly excited pyrazine(E) through
collisions with DCl bath molecules.
Another important aspect of high-resolution IR energy transfer measurements in
this Chapter is that absolute rate constants for specific energy transfer pathways are
determined. The observed collision rate includes the full distribution of collision
outcomes. Since VRT energy transfer is the primary outcome of pyrazine(E)-DCl
collisions, the experimental rate constant for VRT energy transfer is the lower limit to
the inelastic collision rate. Data of this type are extremely useful in testing the quality of
model potential that are commonly used to describe molecular collisions, such as the
Lennard-Jones potentials, and in establishing guidelines for combining parameters in
collision systems that can have hydrogen-bonding interactions.121
The scattered DCl (v =
0) molecules have an appearance rate constant that is ∼85% of the Lennard-Jones
collision rate. A small amount of population in DCl (v = 1) is observed as a collision
product with an estimated energy transfer rate that is a few percent of the Lennard-Jones
collision rate. The energy transfer probability distribution function based on these data is
reported. The results are compared with Lennard-Jones collision rates and average
energy transfer values from the literature.
3.2 Experimental Methods
The measurements of scattered DCl molecules were performed on a high-
resolution transient IR diode laser absorption spectrometer which has been discussed in
Chapter 2. The specifics are given here. A 1:1 gas mixture of DCl and pyrazine flowed
through a 3 meter collision cell at a total pressure of ~20 mTorr. Highly vibrationally

- 35 -
exited pyrazine was prepared by absorption of 266 nm light from the Nd: YAG laser.
266 nm light excited pyrazine to the S2 state which undergoes radiationless decay
ultimately leading to high vibrational levels in the S0 state. This process occurs with near
unity quantum yield in ~50 ns.104,105
The UV power density was kept lower than 1.7
MW/cm2 to avoid multiphoton absorption and to keep the fraction of excited pyrazine
molecules at less than 15%.
A liquid-nitrogen-cooled cw IR diode laser at = 4.3 m was passed through the
sample cell overlapped with the UV beam. State-specific populations of scattered DCl in
the (v = 0) vibrational state were probed by transient IR absorption of DCl (v = 0, J) → (v
= 1, J+1) R-branch transitions. The IR light was also used to probe the appearance of
scattered DCl molecules in the (v = 1) state by measuring DCl (v = 1, J) → (v = 2, J+1)
R-branch transitions.
The average time between collisions in the DCl/pyrazine mixture was col 4 s.
Nascent DCl populations resulting from single collisions with hot pyrazine were
determined at t = 1 s after UV pulse using the DCl spectral information listed in Table
A.1.122-124
Nascent Doppler-broadened line profiles for a number of DCl rotational states
with J = 212 were obtained by collecting transient absorption signals as a function of IR
wavelength. Approximately 10% of the IR light passed through a scanning Fabry-Perot
etalon. The IR frequency was locked at the center of an etalon fringe by using a lock-in
amplifier. Transient signals were collected at roughly 40 frequency increments across a
given line profile.

- 36 -
Pyrazine(Aldrich, 99%+) was degassed by freeze-pump-thawing before use. DCl
(Cambridge Isotope Laboratories, chemical purity 98% and deuterium purity 99%) was
used directly without purification. The DCl sample contained the natural abundance (3:1
ratio) of Cl isotopes (35
Cl:37
Cl).
3.3 Results and Discussion
This Chapter shows the energy gain profiles for DCl (v = 0) molecules that are
scattered into the J = 212 states due to collisions with vibrationally excited pyrazine (E
= 37900 cm-1
). Doppler-broadened line profiles based on high-resolution transient IR
absorption measurements yield nascent J-specific velocity distributions, populations, and
energy transfer rates. Results are combined with earlier data on the J = 1521 states of
DCl to consider the full distributions of collisional energy transfer.120
The following
Sections will present and discuss the translational and rotational energy profiles of the
scattered DCl molecules in the v = 0 state, the energy transfer rate constant for the VRT
pathway, its connection to the collision rate, and the full energy transfer distribution
function for VRT collisions between pyrazine(E) and DCl. This Chapter also reports on
the observation of collisions that lead to vibrationally excited DCl (v = 1).
3.3.1 Transient Line Profiles of Scattered DCl Molecules in (v = 0) and (v= 1)
To measure the outcome of weak collisions using state-resolved IR probing, it is
necessary to distinguish the ambient background from molecules that are scattered in the
low-J states. Appreciable background absorption is observed for the J = 27 states of
DCl (v = 0) at 300 K. When highly vibrationally excited pyrazine is generated with 266
nm pulsed light, the transient absorption of the DCl low-J states contains two components.

- 37 -
When the IR laser is tuned to line center ν0 of a low-J transition, depletion of the initial
DCl population is observed as the molecules in this state undergo collisions with
pyrazine(E). In Figure 3.1a, the negative-going signal represents net depletion of the DCl
J = 5 population at ν0. The second component corresponds to appearance of collision
products and is seen in the Doppler-broadened wings. In Figure 3.1b, the IR laser
frequency is tuned 0.003 cm-1
away from the transition center, where a positive-going
absorption signal indicates the appearance of DCl molecules in the J = 5 state that result
from collisions with pyrazine(E).
This Chapter also reports the observation of transient IR absorption that
corresponds to appearance of the DCl (v = 1) state from collisions of pyrazine(E) with
DCl (v = 0). Linear absorption is directly proportional to the population difference
between the lower and the upper states, so measurements of DCl (v = 0) are affected by
any population in the DCl (v = 1) state. At 300 K, the DCl (v = 1) population cannot be
detected in this experiment, but DCl molecules in the (v = 1) state are formed in small
amounts through collisions with pyrazine(E).
The transient signal for appearance of DCl in the (v = 1, J = 6) state is shown in
Figure 3.2a. The (v = 1, J = 6) state is the upper state of the (v = 0) R5 probe transition
shown in Figure 3.1a, b. Figure 3.2b shows the Doppler-broadened line profile for the (v
= 1, J = 6) state measured at t = 1 μs following the UV excitation of pyrazine. This
transition is broadened with a full width half-maximum that corresponds to a translational
temperature of T ∼ 2000 K, suggesting that vibrational energy gain in DCl occurs
through impulsive collisions. The population of scattered DCl molecules in the (v = 1, J
= 6) state is less than 1% of the transient population in the (v = 0, J = 5) state and has

- 38 -
Time, s
-2 0 2 4 6 8
0.000
0.004
0.008
0.012
Fra
ctio
nal IR
Absorp
tio
n
-0.2
-0.1
0.0
b) Appearance
at 0-0.003 cm-1
a) Depletion at 0
IR Probe: DCl (v=0, J=5)
Figure 3.1 Transient absorption signals for the J = 5 state of DCl collisions due to
collisions with highly vibrationally excited pyrazine(E = 37900 cm-1
) at two different IR
frequencies. Panel a shows depletion of initial population at line center 0. In Panel b,
the IR probe is tuned to the wings of the absorption profile at frequency 00.003 cm-1
.
Here, the appearance of DCl molecules that are products of collisional energy transfer is
observed.

- 39 -
pyrazine(E) + DClAppearance of DCl(v=1, J=6)
Time, s
-4 -2 0 2 4 6 8
Fra
ctional IR
Absorp
tion
-0.001
0.000
0.001
0.002
0.003
0.004
DCl (v=1, J=6)
Frequency Shift, cm-1
-0.04 -0.02 0.00 0.02 0.04
Fra
ctio
na
l IR
Ab
so
rptio
n
-0.0003
0.0000
0.0003
0.0006
Figure 3.2 (a) Transient IR absorption of appearance of DCl (v = 1, J = 6) that results
from collisions of pyrazine(E) and DCl (v = 0), collected at the transition center. (b)
Transient absorption line profile for the J = 6 state of DCl (v = 1) measured 1 μs after the
UV excitation of pyrazine.
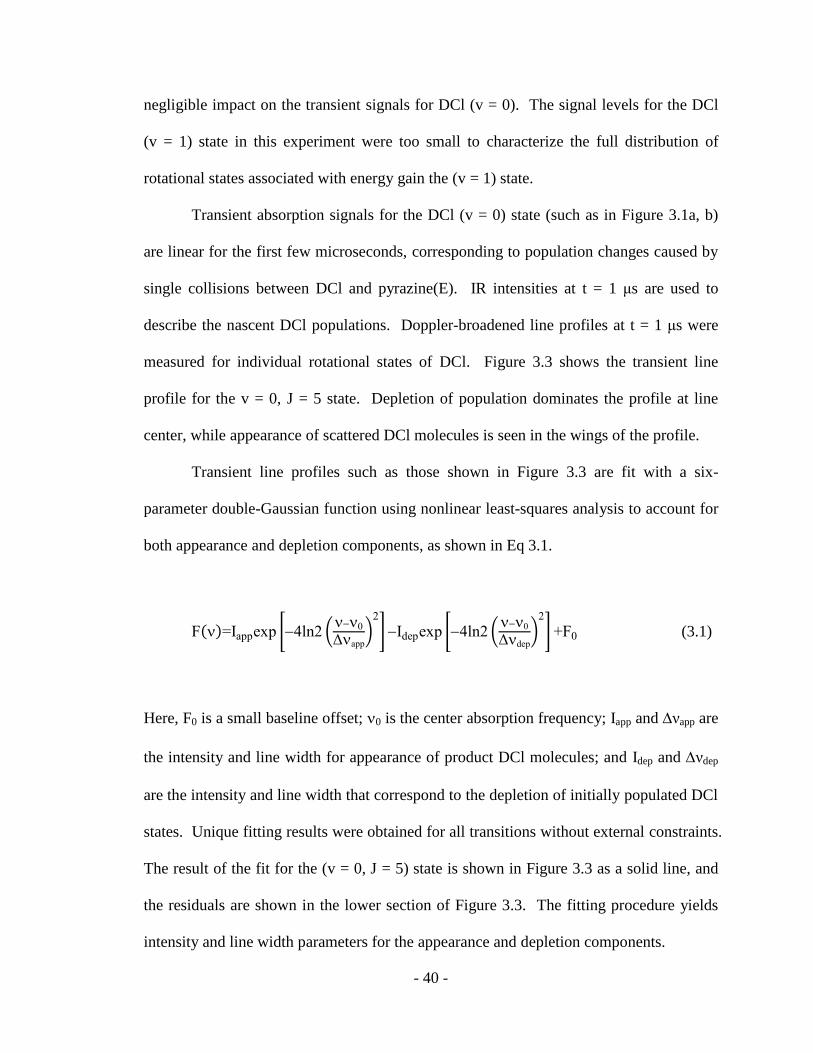
- 40 -
negligible impact on the transient signals for DCl (v = 0). The signal levels for the DCl
(v = 1) state in this experiment were too small to characterize the full distribution of
rotational states associated with energy gain the (v = 1) state.
Transient absorption signals for the DCl (v = 0) state (such as in Figure 3.1a, b)
are linear for the first few microseconds, corresponding to population changes caused by
single collisions between DCl and pyrazine(E). IR intensities at t = 1 μs are used to
describe the nascent DCl populations. Doppler-broadened line profiles at t = 1 μs were
measured for individual rotational states of DCl. Figure 3.3 shows the transient line
profile for the v = 0, J = 5 state. Depletion of population dominates the profile at line
center, while appearance of scattered DCl molecules is seen in the wings of the profile.
Transient line profiles such as those shown in Figure 3.3 are fit with a six-
parameter double-Gaussian function using nonlinear least-squares analysis to account for
both appearance and depletion components, as shown in Eq 3.1.
F =Iappexp 4ln2 0
Δapp 2
Idepexp 4ln2 0
Δdep 2
+F0 (3.1)
Here, F0 is a small baseline offset; 0 is the center absorption frequency; Iapp and νapp are
the intensity and line width for appearance of product DCl molecules; and Idep and νdep
are the intensity and line width that correspond to the depletion of initially populated DCl
states. Unique fitting results were obtained for all transitions without external constraints.
The result of the fit for the (v = 0, J = 5) state is shown in Figure 3.3 as a solid line, and
the residuals are shown in the lower section of Figure 3.3. The fitting procedure yields
intensity and line width parameters for the appearance and depletion components.
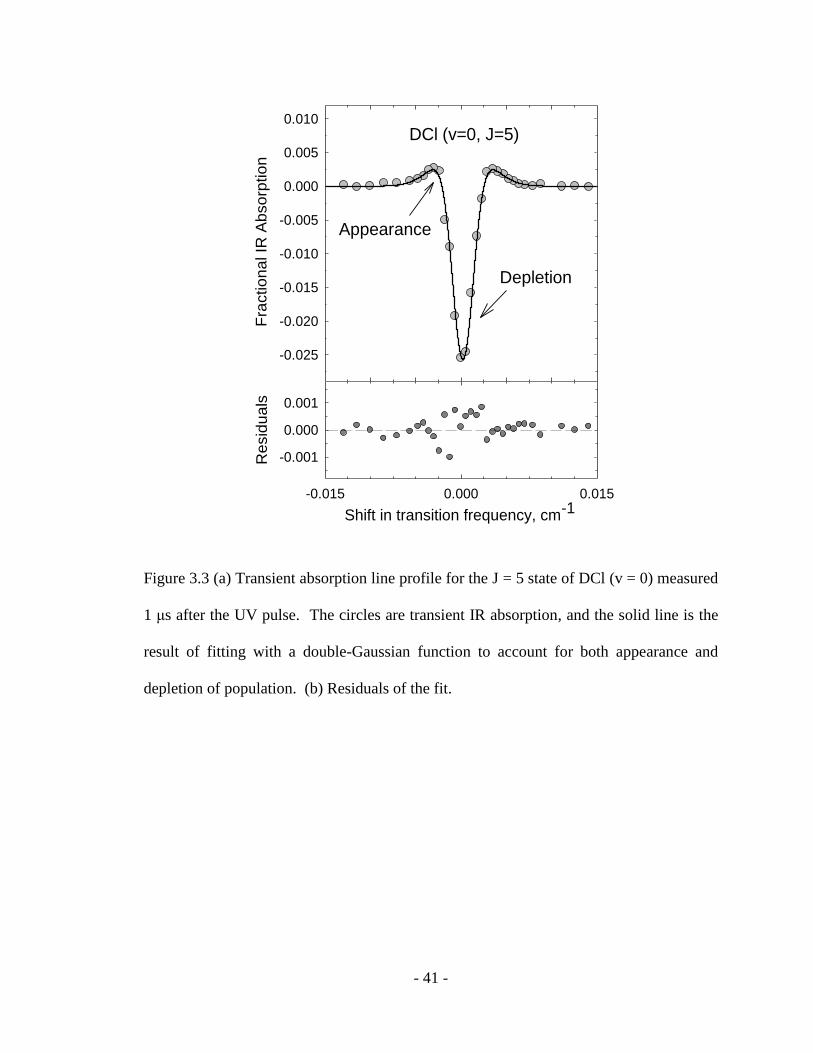
- 41 -
Shift in transition frequency, cm-1-0.015 0.000 0.015
Resid
ua
ls
-0.001
0.000
0.001
Fra
ctio
na
l IR
Ab
so
rptio
n
-0.025
-0.020
-0.015
-0.010
-0.005
0.000
0.005
0.010
DCl (v=0, J=5)
Depletion
Appearance
Figure 3.3 (a) Transient absorption line profile for the J = 5 state of DCl (v = 0) measured
1 μs after the UV pulse. The circles are transient IR absorption, and the solid line is the
result of fitting with a double-Gaussian function to account for both appearance and
depletion of population. (b) Residuals of the fit.

- 42 -
In Figure 3.4, the appearance component is shown in red and that for depletion is
shown in blue. The integrated area under the red appearance curve corresponds to the
total population of DCl (v = 0) molecules that have scattered into the J = 5 state at t = 1
μs. The integrated area under the blue curve corresponds to the total population of DCl
(v = 0) J = 5 molecules that are scattered away by collisions. Similar curves were
obtained for each J state investigated. The distribution of recoil velocities in these
measurements is expected to be isotropic (with Gaussian line shapes) since collisions do
not occur preferentially along a particular laboratory axis. To check for any such
preference, we have performed a series of polarization-dependent studies and verified
that transient line profiles are invariant to the polarization and crossing orientation of the
UV and IR beams.
3.3.2 Energy Profiles of Scattered DCl (v = 0) Molecules
Line widths for appearance Δνapp describe the nascent velocity distributions of the
scattered DCl molecules in the J = 212 states and correspond to laboratory frame
translational temperatures of Tapp = 480640 K. Values of line widths and translational
temperatures are listed in Table 3.1.
The line widths for depletion Δνdep describe the velocity distribution of the DCl
molecules prior to collisions with pyrazine(E). The observed depletion line widths are
narrower than 300 K line widths, suggesting that collisions of pyrazine(E) with DCl may
preferentially involve a subset of slower molecules. This result is somewhat surprising
given that molecules with higher relative velocities have higher collision rates. In other
studies, our group has found that collisions of pyrazine(E) with other bath molecules,
such as HOD78,79
and CO2 (Chapter 4) have depletion line widths that correspond to 300K

- 43 -
Shift in transition frequency, cm-1
-0.015 0.000 0.015
Fra
ctional IR
Absorp
tion
-0.03
-0.02
-0.01
0.00
0.01Appearance
Depletion
DCl (v=0,J=5)
Figure 3.4 Separate appearance and depletion components of the transient line profile for
DCl (v = 0) J = 5. The grey circles are transient IR data, and the dashed line is the
double-Gaussian fitting curve. The appearance component (red line) is broadened due to
collisions, with a line width that corresponds to a translational temperature of Tapp = 480
130 K. The depletion component (blue line) is caused by population loss of the J = 5
state and has a translational temperature of Tdep = 170 80 K.

- 44 -
Table 3.1 Nascent Doppler-broadened line widths and translational temperatures for low-
J states of DCl that are populated/depopulated through collisions with vibrationally
excited pyrazine(E = 37900 cm-1
).
J state
Appearance of scattered
DCl(v = 0,J)
Depletion of initial
DCl(v = 0, J)
app, cm-1a
Tapp, Kb Trel, K
c dep, cm
-1a Tdep, K
d
2 0.0058 570 140 710 170 0.0034 200 100f
3 0.0054 490 130 590 150 0.0028 140 80
4 0.0064 640 140 800 180 0.0031 150 80
5 0.0054 480 130 570 150 0.0033 170 100
7 0.0064 620 140 770 170 0.0033 170 100
12 0.0060 520 120 630 150
aFull width at half-maximum (FWHM) line widths app and dep for appearance and
depletion components, respectively, of individual states of DCl (v = 0) measured 1 s
after UV excitation of pyrazine. Line widths are reported to 0.001 cm-1
.
bThe lab-frame translational temperatures for appearance (Tapp) and depletion (Tdep) are
determined from line widths using Ttrans,lab= mc2
8Rln2
Δobs
0 2
, where m is the mass of
DCl, c is the speed of light, R is the gas constant, the full width at half-maximum widths
obs is app for appearance and dep for depletion, and 0 is the center frequency of the
absorption line.
cTrel in K, the center-of-mass frame translational temperature for appearance of scattered
DCl, is determined for an isotropic distribution:

- 45 -
Trel=Ttrans,lab+ Ttrans.labT0 , where, mDCl and mpyz are the masses of DCl
and pyrazine, respectively and T0 =300 K.
dThe translational temperatures based on depletion line widths for initial DCl states.

- 46 -
velocity distributions. There is some precedent however for collision cross-section that
increase as a function of decreasing velocity. A negative velocity dependence for
collision cross-sections has been observed in collisions of Li2 (v = 1) with Xe, Ar, and Ne
that lead to quasi-resonant vibration to rotation energy transfer.125
It is also known that in
cases where collisions are dominated by attractive interactions (such as in thermal atomic
beams), the collision cross-section is inversely proportional to the relative velocity. For a
purely attractive potential where V r = C r6 , the velocity-dependent collision cross-
section σ(v) is proportional to v and a negative temperature dependence is observed.
126
It is not entirely clear why pyrazine(E)-DCl collisions have low initial velocities, while
HOD and CO2 show no such preference.
The distributions of recoil velocities are described by the center-of-mass frame
translational temperatures Trel. The distributions of relative recoil velocities for the J =
212 states of DCl have values of Trel = 570800 K. These values are listed in Table 3.2
and are shown in Figure 3.5 along with earlier high-J results. The recoil velocity
distributions for the low-J data have values of Trel ~ 700 cm-1
until J = 15. For J > 15, the
translational energy distributions broaden substantially.
Impulsive collisions can impart large changes in both angular momentum and
recoil velocity. Figure 3.5 shows that in collisions of pyrazine(E) with DCl, a threshold
for the onset of increasing recoil velocities occurs near J = 15. The correlation of angular
momentum changes and recoil velocity is consistent with the Angular Momentum Model
by McCaffery and co-workers.127-130
Based on an initial J = 5 state at 300 K, the average
change in recoil velocity of the scattered DCl molecules is compared with average
changes in angular momentum in Table 3.2.

- 47 -
Table 3.2 Angular momentum and recoil velocities for individual states of DCl J = 220
due to collisions with highly vibrationally excited pyrazine(E = 37900 cm-1
)
final J state ΔJbath a app
b vlab
c vrel
d Δvrel
e
2 4.6 0.0058 603 817 285
3 4.0 0.0054 559 744 212
4 3.0 0.0064 659 890 348
5 0 0.0054 554 736 203
7 4.9 0.0064 650 877 335
12 10.9 0.0060 600 800 254
15f 14.1 0.0063 619 828 286
16 15.2 0.0064 627 840 298
17 16.2 0.0065 635 853 311
18 17.3 0.0068 663 897 355
19 18.3 0.0069 671 910 368
20 19.4 0.0075 728 998 456
aThe average angular momentum changes ΔJbath in units of of DCl after collisions
with vibrationally excited pyrazine are estimated using ΔJbath 2= Jbath
, 2 Jbath 2 .
Jbath, is the average final angular momentum vector of DCl determined. The average
initial angular momentum vector of DCl at 300 K is Jbath ~ 5.
bFWHM appearance line widths app in cm
-1 for DCl (v = 0) as described in Table 3.1.
cThe average lab-frame velocity in m (s
-1) of individual DCl states following collisions
with vibrationally excited pyrazine, determined from

- 48 -
vlab = 3kBTapp mDCl 1 2
, where, kB is the Boltzmann constant, Tapp is listed in Table
3.1, and mDCl is the mass of DCl.
dThe average center-of-mass frame velocity vrel in m (s
-1) for scattered pyrazine and
DCl molecules, determined by vrel = M mpyz vlab 2 3kBT M 1 2 , where M is the
total mass of pyrazine and DCl, mpyz is the mass of pyrazine, and T = 300 K.
eThe average change in relative velocity vrel = vrel 3kBT μ 1 2 , where is the
reduced mass for DCl + pyrazine collisions.
fData for the J = 1520 states are for the D
35Cl isotope and are taken from Ref. 87.

- 49 -
DCl Rotational Quantum Number J
0 5 10 15 20
Recoil
Ene
rgy T
rel, K
200
400
600
800
1000
1200
1400
Depletion
Appearance
Pyrazine(E) + DCl
Figure 3.5 Rotational state dependence of the nascent center-of-mass translational
temperatures for pyrazine(E)/DCl collisions. Squares show the translational temperatures
for appearance of DCl states with J = 220 due to collisions with highly vibrationally
excited pyrazine(E = 37900 cm-1
). Data for the J = 1520 states are shown as diamonds
and are from Ref. 87. Circles are lab-frame temperatures for depletion of DCl via
collisions with hot pyrazine.

- 50 -
Our group discussed how the angular momentum changes were determined before
this thesis.120
Measurements of the product translational energies for a large range of
CO2 rotational states gave us the opportunity to consider how the angular momentum of
the scattered bath molecules correlates with recoil velocity. Classically, the change in
total angular momentum vector ΔJ total due to collisions is related to the reduced mass μ,
the change in recoil velocity v rel and the impact parameter b as shown in Eq 3.2.
J total= L +J rot = L +J bath+J donor =μ v relb (3.2)
For molecules, the change in total angular momentum is the vector sum of
changes in orbital angular momentum L and rotational angular momentum J rot (which
includes rotation of both collision partners). Ideally, one would like to have state-
resolved data on the rotational changes in both bath and donor molecules. The state-
resolved measurements here exactly specify Jbath for the scattered CO2 bath molecules but
do not give information about the state-to-state changes in DCl or about the angular
momentum changes of the high-energy donor molecules. Lawrence and Waclawik report
that angular momentum changes for donor and bath molecules of the type considered
here generally have the same sign, so that the final J bat is a lower limit to the final J rot, in
cases of small L .131 Changes in orbital angular momentum are zero for scattering in a
central force potential, such as used in a Lennard-Jones model. The agreement between
the Lennard-Jones collision rate and our measured collision rate therefore suggests that
the changes in orbital angular momentum in these collisions are small. On the basis of
these considerations, the change in bath rotational angular momentum J bat represents a
- 51 -
lower limit to the overall change in angular momentum. Pyrazine(E)-DCl collisions with
ΔJbath = 016 correspond to changes in recoil velocity of Δvrel = 300 ms-1
. For the
highest angular momentum changes ΔJbath = 1719, the changes in recoil velocity
increase to as much as Δvrel = 450 ms-1
.
In Chapter 4, a correlation between angular momentum and recoil velocity is also
observed in collisions of pyrazine(E = 37900 cm-1
) with CO2, but in this case, values of
ΔJ and Δvrel are substantially greater than when DCl is the bath molecule. Scattered
CO2 molecules are observed in high angular momentum states with J = 6080 with
average velocity changes of Δvrel ~ 12002200 ms-1
, respectively.76,91
Rotational
states of CO2 with J = 6080 have comparable amounts of energy (Erot = 1442 and 2553
cm-1
, respectively) as DCl states with J = 1620 (Erot = 1452 and 2242 cm-1
, respectively),
but CO2 molecules in these high-J states are scattered from pyrazine(E) with much more
translational energy. This effect may be due in part to the larger angular momentum
changes that are observed for CO2 and in part to differences in the mass distributions of
DCl and CO2. The amount of rotational and translational energy in the scattered
molecules (as well as the partitioning of this energy) depends in a nontrivial way on the
collision dynamics, the anisotropy of the intermolecular potential, and the kinematics of
the collisions, so a direct comparison of energy partitioning for CO2 and DCl is not
possible. However, when similar amounts of rotational energy are imparted to bath
molecules in collisions, the experimental data in these Chapters show that bath molecules
with more closely spaced rotational states (and higher angular momentum) are scattered
with larger recoil velocities. The rotational constant for CO2 (B = 0.39 cm-1
) is relatively
small as compared to that for DCl (B = 5.4 cm-1
).

- 52 -
In other work, no such J-dependent increases in Trel were observed for collisions
of pyrazine(E) with H2O or HOD.79
Water has small moments of inertia (A = 27.9 cm-1
,
B = 14.5 cm-1
, and C = 9.3 cm-1
), and scattered H2O molecules are observed with
rotational energies up to Erot = 1800 cm-1
in states with J = 12. It is not known whether a
threshold to the recoil energy distributions exists for higher J states of water, such as seen
for DCl and CO2. Detection of higher J states of water following collisions with
pyrazine(E) requires better experimental sensitivity than is currently realized. If the
recoil velocities do increase with the higher J states of water, then the onset occurs at J
values higher than J = 12. It is possible that the mass distribution of water reduces the
likelihood of translational energy gain relative to rotational energy in the scattered
molecules. It may also be the case that attractive interactions between pyrazine(E) and
water influence the energy gain partitioning between the rotational and the translational
degrees of freedom. There is evidence from other measurements in the Mullin labs that
preferential interactions of water with the π- and σ-hydrogen bonding sites on pyridine
(C5H5N) may favor rotational energy gain in water over translational energy gain.80
Whether these types of interactions play a role in determining energy partitioning from
collisions remains to be seen. Computer simulations should be useful in clarifying the
importance of this phenomenon.
The rotational distribution of scattered DCl (v = 0) molecules that results from
collisions with pyrazine(E) is determined directly from the nascent populations of DCl J
= 221 states. A semilog plot of the rotationally resolved populations of scattered DCl (v
= 0) molecules measured 1 μs following collisions with pyrazine(E) is shown in Figure
3.6. The scattered molecules are well-described by a single Boltzmann distribution with

- 53 -
DCl Rotational Energy, cm-1
0 500 1000 1500 2000 2500
ln(P
op/g
)
21
22
23
24
25
26
Scattered DCl (v=0)
Trot = 880 K
Figure 3.6 Nascent rotational distribution for the J = 221 states of DCl that are
populated through collisions with vibrationally excited pyrazine. Data for the J = 1520
states are from Ref. 87. The appearance of DCl molecules due to weak and strong
collisions is described by a single Boltzmann distribution with Trot = 880 100 K.
- 54 -
a rotational temperature of Trot = 880 ± 100 K. This result is in good agreement with the
previous analysis that considered only the high-J states.87
3.3.3 Energy Transfer Rates: Pyrazine(E = 37900 cm-1
) + DCl
State-specific rate constants for energy transfer that populates individual
rotational states of DCl (v=0) products were determined from J-specific appearance
signals (as shown in Figure 3.4). The rate constant kappJ
describes the rate of appearance
of DCl (v = 0, J) population that comes from quenching collisions of pyrazine(E), as
shown in Eq 3.2.
Pyrazine E + DCl 300 K kappJ
Pyrazine E + DCl v = 0, J (3.2)
The appearance rate of DCl (v = 0, J) is given by Eq 3.3.
d DCl J
dt= kapp
J DCl 0 Pyrzine E 0 (3.3)
Based on the method of initial rates, the appearance rate constant kappJ
is determined using
Eq 3.4, where [DCl]0 and [Pyrazine(E)]0 are the concentrations at t = 0.
kappJ
= DCl J
t
1 DCl
0 Pyrazine E
0
(3.4)
- 55 -
The absolute rate constant for energy gain into the J = 3 state was measured using Eq 3.4,
and rate contants for the other rotational states of DCl (J = 212) were determined using
the nascent rotational temperature (Figure 3.6). Values of kappJ
are listed in Table 3.3 for
the J = 221 states of DCl (v = 0). These experimental results are in very good
agreement with the rates published previously for the J = 1521 states.120
The kinetics of the VRT energy transfer pathway is described by the rate
constants listed in Table 3.3. The total rate constant for VRT energy transfer based on
appearance measurements is obtained by summing over the J states of the scattered DCl
molecules as shown in Eq 3.5.
kapp= kappJ = 4.6 1.4 10-10
cm3molecule-1J s-1 (3.5)
VRT energy transfer is just one pathway for inelastic collisions of pyrazine(E) with DCl.
The value of kapp represents a lower limit to the collision rate constant and is ∼85% of the
Lennard-Jones collision rate constant (kLJ = 5.4 × 10⁻¹⁰
cm3 molecule
-1 s
-1 at 300 K). As
discussed previously, energy gain into the (v = 1) state of DCl occurs rarely with a rate
that is roughly 1% of the Lennard-Jones collision rate, and it is unlikely that higher
vibrational states of DCl are populated by collisions. Therefore, kapp is essentially the
collision rate constant for pyrazine(E)-DCl collisions and is in reasonably good
agreement with the Lennard-Jones collision rate.
State-resolved population depletion measurements can also be used to get a lower
limit to the collision rate. The depletion component of the Doppler-broadened transient

- 56 -
Table 3.3 State-specific rate constants for appearance of DCl products due to collisions of
Pyrazine(E = 37900 cm-1
) + DCl → Pyrazine(EE) + DCl (v = 0, J).
DCl J-State Erot, cm-1
kappJ
, 10-12 cm
3molecule
-1s
-1
2 32.2539 26 8
3 64.4979 23 7
4 107.7895 23 7
5 161.1696 40 12
7 301.5287 26 8
12 837.7971 30 9
15a 1286.115 19 ± 5
16 1456.389 16 ± 4
17 1636.995 12 ± 3
18 1827.878 8.9 ± 2
19 2028.978 6.0 ± 1
20 2240.233 4.8 ± 1
21 2461.58 3.9 ± 1
kapp= kappJ
J (4.6 ± 1.4)10-10
cm3molecule
-1s
-1b
kLJ 5.4 10-10
cm3molecule
-1s
-1c
aRate constants for the J = 1521 states are taken from Ref. 87.
bTotal appearance rate constant kapp for VRT energy transfer of pyrazine(E)/DCl system,
obtained by summing over the J-specific appearance rates kappJ
.

- 57 -
cThe Lennard-Jones collision rate at 300 K for pyrazine/DCl determined in Appendix B.
The Lennard-Jones parameters were used:
σDCl=3.36 10-10
m,132
kB DCl=328 K,133
σpyz=5.35 10-10
m, kB DCl=435.5 K 134
.

- 58 -
line profiles consists of DCl molecules that undergo collisions with pyrazine(E).
Collisions between highly excited donor molecules and DCl move population out of low-
lying J states of DCl that are populated at 300 K as shown in Eq 3.6 and into a
distribution of final J′ states that have recoil velocities with component vrel along the IR
probe axis.
Donor E + DCl J →Donor E + DCl J , vrel (3.6)
It is not necessary for J and J′ to have different values to be measured as a
scattering event since we measure Doppler-resolved profiles. Depletion of population is
observed as long as either the velocity component along the IR probe axis or the
rotational quantum number changes during collisions. The depletion rate of population in
the J state is given in Eq 3.7.
Ratedep J = d DCl J
dt=kdepf J DCl 0 Donor E 0 (3.7)
In Eq 3.7, f(J) is the fractional population in the J state of DCl at 300 K and kdep is the
depletion rate constant. It is a reasonable to assume that at 300 K the collision rate does
not depend on J. The total depletion rate is a sum of J-specific depletion rates as given by
Eq 3.8.
Ratedep = Ratedep J =J kdepfJ DCl 0J Donor E 0
= kdep DCl 0 Donor E 0 (3.8)

- 59 -
The total depletion rate constants are reported in Table 3.4 based on
measurements of double Gaussian transient line profiles for low J states of DCl. The
population weighted average of the depletion rate constants is kdep=(4.3 ± 1.5) × 10-10
cm3
molecule-1
s-1
. This result is in very good agreement with the total appearance rate
constant of kapp = (4.6 ± 1.4) × 10-10
cm3 molecule
-1 s
-1. The agreement of rates based on
depletion and appearance gives us confidence in the consistency of this approach for
measuring collision rates experimentally.
The agreement between the observed collision rate and the Lennard-Jones rate for
DCl-pyrazine(E) collisions is somewhat surprising. HCl is known to form 1:1 hydrogen-
bonded complexes with aromatic molecules.135-138
Lennard-Jones parameters typically
do not account for the effects of hydrogen bonding and often underestimate actual
collision rates for molecules that are hydrogen-bonded or have other strong
intermolecular interactions. In the case of HOD-pyrazine(E) collisions, the measured
collision rate constant is ∼70% larger than the Lennard-Jones rate constant.78,79
The
energy minima for interactions of benzene-water and benzene-HCl have similar energies
(∼1100 cm-1
) and intermolecular distances (∼3 Å).136,139
If these interactions played an
important role in collisions at 300 K, we might expect the collision rate constants for
these two systems to show similar enhancements over the Lennard-Jones estimates. The
fact that the Lennard-Jones collision rate for DCl-pyrazine(E) is fairly accurate indicates
that hydrogen-bonding forces may not be so important in collisions of these molecules at
300 K.

- 60 -
Table 3.4 Depletion rate constant measurements for collisions of
Pyrazine(E = 37900 cm-1
) + DCl (J) → Pyrazine(EE) + DCl (v’, J’) at 300K.
DCl J State Erot, cm-1
kdep, 10-10
cm3molecule
-1s
-1
2 32.2539 5.6
3 64.4979 3.6
4 107.7895 4.4
5 161.1696 5.1
7 301.5287 2.1
kdep (4.3 ± 1.5) 10-10
cm3molecule
-1s-1
kLJ 5.4 10-10
cm3molecule
-1s
-1

- 61 -
3.3.4 Full Energy Transfer Distribution Function P(E)
This study has characterized the complete distribution of DCl molecules that are
scattered from vibrationally hot pyrazine and determined the absolute rate constant for
collisions, as described in the preceding Section. This Section uses these results to
convert J-indexed energy transfer data into an energy transfer probability distribution that
is indexed by ΔE, the amount of energy lost from pyrazine(E). The state-resolved
probability distributions PJ(ΔE) are determined for each rotational state of DCl based on
the Doppler-broadened line widths, the energy transfer rate constants kappJ
and the
collision rate.
The full energy transfer probability function P(ΔE) is the sum of the state-specific
PJ(ΔE) over all DCl rotational states, as shown by Eq 3.9.
P E = PJ E all (3.9)
The initial rotational and translational energy values for DCl and pyrazine were taken to
be the average values at 300 K. Currently, it is not known whether there is any
correlation between the initial and final J states of DCl. If such a correlation exists, it is
likely that our analysis overestimates the rotational energy changes in DCl. This effect
will be most pronounced for weak collisions that lead to small changes in rotational
angular momentum. Future experiments that identify the initial J-state of DCl would be
useful in addressing this issue.
In the upper plot of Figure 3.7 shows the P(ΔE) distribution function for energy
transfer in collisions of pyrazine(E) and DCl where the probability is referenced to the

- 62 -
P(
E),
1/c
m-1
0
1e-4
2e-4
3e-4
4e-4
5e-4
6e-4
Pyrazine(E) + DCl
E, cm-1
-1000 0 1000 2000 3000 4000 5000
P(
E),
1/c
m-1
0
2e-4
4e-4
6e-4
Relative to kLJ
Relative to kapp
Figure 3.7 The energy transfer distribution function P(E) for collisions of vibrationally
excited pyrazine(E = 37900 cm-1
) and DCl as determined from state-resolved appearance
measurements. P(E) is obtained by the adding state-specific energy transfer
distributions PJ(E) for individual J-states of DCl, such that P E = PJ E all .
Probabilities are relative to Lennard-Jones collision rate kLJ (upper plot) and relative to
appearance collision rate kapp (lower plot).

- 63 -
Lennard-Jones collision rate constant. In the lower plot of Figure 3.7, the experimental
value of the collision rate kapp has been used to reference the overall probability of the
distribution function. The P(ΔE) curve accounts for all VRT energy transfer processes
that are observed for pyrazine(E)-DCl collisions. The Lower P(ΔE) curve in Figure 3.7
has an integrated probability of unity.
The redistribution of pyrazine’s vibrational energy is the driving force for the
energy transfer investigated here. The ΔE index in P(ΔE) accounts for pyrazine internal
energy that is lost due to collisions with DCl. ΔE includes the rotational energy gain in
DCl and the change in translational energy for DCl and pyrazine(E) based on recoil
velocity distribution measurements. It does not account for rotational energy gain in
pyrazine(E) that results from collisions with DCl. The measurements in this Chapter
clearly identify how energy is partitioned in the scattered DCl molecules, but the
rotational and the vibrational energy content in the scattered pyrazine molecules still
cannot be distinguished. In Figure 3.7, the P(ΔE) curve has a maximum intensity near
ΔE = 250 cm-1
, which may be related to the distribution of rotational energy that is
imparted to pyrazine through collisions with DCl. The P(ΔE) curve for pyrazine(E)-DCl
collisions is dominated by a major feature at positive ΔE values corresponding to energy
loss from pyrazine and a smaller feature for negative ΔE values that correspond to
collisional energy gain in pyrazine.
Based on the data in the lower plot of Figure 3.7, the average energy transfer in
collisions of pyrazine(E = 37900 cm-1
) with DCl is E = 888 cm-1
. Barker and Miller
have reported average energy transfer values for pyrazine(E = 3000033000 cm-1
) with a
number of atomic, diatomic, and polyatomic collision partners.56
However, HCl or DCl

- 64 -
is not among the bath molecules studied, so a direct comparison cannot be made with
their work. Extrapolating their quenching data to E = 38000 cm-1
gives the following
average energy transfer values: E ∼ 50 cm-1
for Ar, ∼ 90 cm-1
for CO, ∼ 290 cm-1
for
CO2 and CH4, and ∼ 750 cm-1
for NH3 and SF6. Our value of E = 888 cm-1
for
pyrazine/DCl collisions is larger than expected based on their results but is within the
same order of magnitude for small polyatomic species.
3.3.5 Comparison with Pyrazine(E)-HOD Collisions
Full energy transfer distribution functions based on state-resolved IR studies have
been determined for three collision systems so far: DCl, HOD and CO2. The HOD
studies have been reported previously79
and the CO2 data are reported in the next Chapter.
The P(ΔE) curves for collisions of pyrazine(E = 38000 cm-1
) with DCl and with HOD79
are compared in Figure 3.8. Figure 3.8 plots the distribution functions using two
different collision rates for defining the probability. The intensity of P(ΔE) curves comes
directly from the ratio of observed energy transfer rates to the collision rate. In the upper
plot, the Lennard-Jones collision rate is used to define the molecular collision rate for
each collision pair. In the lower plot, the experimentally determined collision rate is used
to normalize each distribution function.
It is apparent from Figure 3.8 that a comparison of different collision systems
depends on the choice of collision rate. From the upper plot, it is clear that water is a
more efficient quencher of pyrazine(E) because of the larger area under the HOD curve.
The data in the upper plot show that the collision cross-section for pyrazine(E)/HOD at
300 K is σ = 160 Å2, while that for DCl with pyrazine is σ = 92 Å
2. DCl is a larger
collision partner than HOD, but HOD has stronger long-range attractive forces that

- 65 -
E, cm-1
0 1500 3000 4500
P(
E),
1/c
m-1
re
lative t
o k
LJ
0.0
4.0e-4
8.0e-4
1.2e-3
pyrazine(E)+DCl
pyrazine(E)+HOD
E, cm-1
0 1500 3000 4500
P(
E),
1/c
m-1
re
lative t
o k
ap
p
0
2e-4
4e-4
6e-4
8e-4
pyrazine(E)+HOD
pyrazine(E)+DCl
Figure 3.8 Comparison of the full energy transfer distribution function P(E) curves for
vibrationally excited pyrazine with HOD (taken from Ref. 79) and DCl. In the upper plot,
the energy transfer data are scaled to the Lennard-Jones collision rate, and in the lower
plot, the energy transfer data are scaled to the measured collision rate.

- 66 -
enhance the collision cross-section and are underestimated in the Lennard-Jones collision
model. The fact that the collision rate for DCl-pyrazine is close to the Lennard-Jones rate
suggests that long-range interactions are not very important in the collisional energy
transfer between these molecules. It is important to recognize that efficient quenching by
water is due in large part to its high collision rate and not from the presence of a
prominent large ΔE component in the tail of the distribution function. In fact, the ΔE
distribution for HOD is notably narrower than for DCl, as illustrated in the lower plot of
Figure 3.8, where the observed collision rates are used to determine probabilities and the
area under each curve is unity. Long-range attractive forces between pyrazine and HOD
enhance the cross-section for inelastic collisions by effectively extending the range at
which collisions are sufficiently strong to cause some energy transfer to take place but, at
the same time, decrease the average energy transfer. In the lower plot, there are more
strong collisions for quenching with DCl, which lead to DCl molecules scattered into
high rotational states with broad velocity distributions. For HOD, it may be that the
additional collisions caused by enhanced long-range attraction lead only to relatively
weak energy transfer.
It may also be the case that HOD collisions are weaker due to details of the
energy transfer involving preferential hydrogen-bonding configurations. There is
evidence from other work in our laboratory that the likelihood of large ΔE collisions
involving water is affected by preferred geometries of water in collisions with pyridine
molecules. While it is unlikely that long-lived complexes form at 300 K, details of the
collision dynamics will be sensitive to anisotropy in the intermolecular potential energy
surface. One definite conclusion that can be reached from the relatively modest amounts

- 67 -
of energy transferred overall and the low probability of forming DCl in the (v = 1) state is
that long-lived complex formation leading to anything even approaching a full statistical
redistribution of energy is extremely rare.
3.4 Conclusion
The ability to measure state-resolved energy gain profiles for weak collisions
opens up exciting opportunities for understanding the full spectrum of collision dynamics
of highly excited molecules. Detailed information about weak collisions and their energy
transfer properties complements earlier studies on strong collisions and allows us to
profile the entire distribution of energy transfer events from a quantum-resolved
perspective. These studies also provide a direct measurement of the collision rate.
Comparison of experimental collision rates and Lennard-Jones rates clarifies the role of
hydrogen bonding and other specific interactions in energy transfer collisions. The work
reported here shows that DCl/pyrazine(E) collisions primarily lead to VRT energy
transfer with an integrated rate that is ∼85% of the Lennard-Jones collision rate. Very
small amounts of vibrational excitation of DCl in the v = 1 state are observed. A
threshold for strong collisions is observed for DCl products near the J = 15 state where
the velocity distributions show J-dependent broadening. The energy transfer distribution
function contains evidence of a strong collision component and yields an average energy
transfer value of E = 888 cm-1
. Studies of this kind provide important guidelines in
developing theoretical models of molecular collisions under high temperature conditions.
- 68 -
Chapter 4: Full State-Resolved Energy Gain Profiles of CO2 (J =
280) from Collisions of Highly Vibrationally Excited Pyrazine(E
= 37900 cm-1
)
4.1 Introduction
Collisional energy transfer from highly excited molecules to cold bath molecules
involves two types of collisions: weak and strong collisions. Neither of the two can be
neglected when studying collisional quenching dynamics. Chapter 3 investigated the
complete dynamics of pyrazine(E)/DCl collisions by measuring both types of collisions.
This Chapter reports the state-resolved energy gain profiles for “strong” and “weak”
collisions of pyrazine(E = 37900 cm-1
) and CO2 molecules.
Several approaches have been used to characterize energy transfer distributions
for excited pyrazine(E)-CO2 collisions, including IRF56,57
and KCSI.29,64-68
The
experimental data from these studies has been fit using various model distribution
functions such as single-, double-, and extended parameter exponentials. The studies
quantify energy loss and involve multiple sequential collisions. Here, the nascent state-
resolved dynamics of pyrazine(E)/CO2 collisions are investigated.
This Chapter investigates the collisional energy transfer dynamics for CO2 in low
rotational states through collisions with pyrazine(E = 37900 cm-1
) using high-resolution
transient IR absorption spectroscopy. Our group already measured the strong collision
dynamics for collisions of CO2 with hot pyrazine(E) that scatter CO2 molecules in high-J
states (J = 5880). Here IR transient absorption experiments measured the state-resolved
energy gain profiles for low rotational states (J = 264) of CO2 (0000) that come from
collisions with highly vibrationally excited pyrazine(E = 37900 cm-1
). This experiment

- 69 -
uses rotationally resolved CO2 (1001) CO2 (00
00) transitions near = 2.7 m to
measure the outcome of weak collisions. The low-J state results are combined with the
previous data for high-J states to yield the complete state-resolved VRT energy gain
distributions for CO2 (0000) that result from collisions with highly vibrationally excited
pyrazine(E).
Rate measurements for both appearance and depletion of population in individual
CO2 states are obtained by this experiment. The data show that the collision rate is well
described by the Lennard-Jones model and that the VRT pathway accounts for ∼ 85%
of all collisions. Product distributions indicate the presence of two distinct relaxation
pathways that scatter CO2 (0000). A two-component model based on the data shows that
78% of collisions are elastic or weakly inelastic and induce only minor changes in CO2
rotation. The remaining 22% of collisions are highly inelastic and lead to large gains in
rotational energy for CO2. The probability distribution function P(ΔE) based on product
energy gain is reported for ΔE values of -500 < ΔE < 8000 cm-1
and compared to results
from other collision studies.
4.2 Experimental Methods
In this Chapter, state-resolved rotational and translational energy gain of CO2
molecules at low-J states was measured using the high-resolution F-center laser transient
absorption spectrometer. This spectrometer was described in Chapter 2. Additional
relevant information is presented here. Highly vibrationally excited pyrazine(E) was
prepared by 266 nm UV light from the pulsed Nd:YAG laser. The UV power density
was kept below 4.9 MW/cm2 to minimize multiphoton absorption by pyrazine while <15%
of the total pyrazine concentration was excited. A 1:1 mixture of pyrazine and CO2

- 70 -
vapors with a total pressure of ~ 20 mTorr flowed through a 300 cm collision sample cell.
The absolute cell pressure was determined spectroscopically using a low-J CO2 rotational
transition with known absorption strength. The UV and IR beams were propagated
collinearly through the cell. Individual rotational states of scattered CO2 molecules were
probed using (1001, J’) (00
00, J) with the = 2.7 m output of a single-mode F-center
laser.
Pyrazine(Aldrich, 99%+) was degassed by the freeze-pump-thaw method before
use and CO2 (Matheson Tri-gas, 99.995% purity) was used directly.
4.3 Results
4.3.1 Appearance and Depletion Processes of CO2 (0000, J) Collisions
The outcome of collisions between pyrazine(E) and CO2 was investigated by
measuring nascent population changes for CO2 (0000) in the J = 264 rotational states
using high resolution transient absorption. CO2 states with J < 50 have measurable
population at 300 K and transient IR absorption of these states is a measure of the net
population changes that include both depletion of initial population and appearance of
scattered population caused by collisions. The population changes for appearance and
depletion were distinguished by measuring the nascent Doppler-broadened IR line
profiles for CO2.
Figure 4.1 shows transient absorption signals for CO2 (0000) J = 26 at two
different IR wavelengths within the R26 transition centered at 0 = 3733.4684 cm-1
. In

- 71 -
Time, s-1 0 1 2 3 4 5
I/
I 0
-0.003
0.000
0.003
0.006
0.009
0.012
I/
I 0
-0.03
-0.02
-0.01
0.00
0.01
(a) depletion
at 0
(b) appearance
at 0-0.003cm-1
Pyrazine+CO2 (R26)
Figure 4.1 Nascent transient IR absorption signals of scattered CO2 (0000) at rotational
state J = 26 through collisions with vibrationally excited pyrazine(E = 37900 cm-1
) at two
IR frequencies within the R26 probe transition. The UV pulse happens at probe time t =
0 s and the signals to t = 0 s illustrate the initial populations of CO2 at J = 26 before
collisions with excited pyrazine. (a) shows a depletion of initial CO2 populations at line
center 0. (b) shows the appearance of scattered CO2 molecules for J = 26 at by tuning the
IR probe of the Doppler-broadened line profile to the frequency = 0 0.003 cm-1
.

- 72 -
Figure 4.1a, negative-going population depletion is observed at the center frequency 0.
Figure 4.1b shows positive-going appearance in the Doppler-broadened wings at =
00.003 cm-1
. Figure 4.2 shows Doppler-broadened transient line profiles for a number
of CO2 states with J = 2 to 54 measured at t = 1 s following the UV pulse. The positive-
going appearance signals increase relative to the negative-going depletion signals as the
initial thermal population of the CO2 state decreases.
CO2 population initially in state J is depleted by collisions with highly excited
pyrazine, Pyz (E), as described by Eq 4.1.
Pyz E +CO2 0000, J, V
kdep Pyz E +CO2 any state (4.1)
Simultaneously, CO2 molecules are scattered into state J as described by Eq 4.2.
Pyz E +CO2
kappJ
Pyz E +CO2 0000, J,V (4.2)
In Eq 4.1 and 4.2, V is the velocity component of CO2 along the IR propagation axis and
E and E’ are the initial and final pyrazine energies. Population changes associated with
depletion or appearance are induced by any collisions that change the initial rotational
state and/or velocity component along the IR probe axis. Therefore transient line profiles
such as shown in Figure 4.2 include contributions from both elastic and inelastic
collisions.
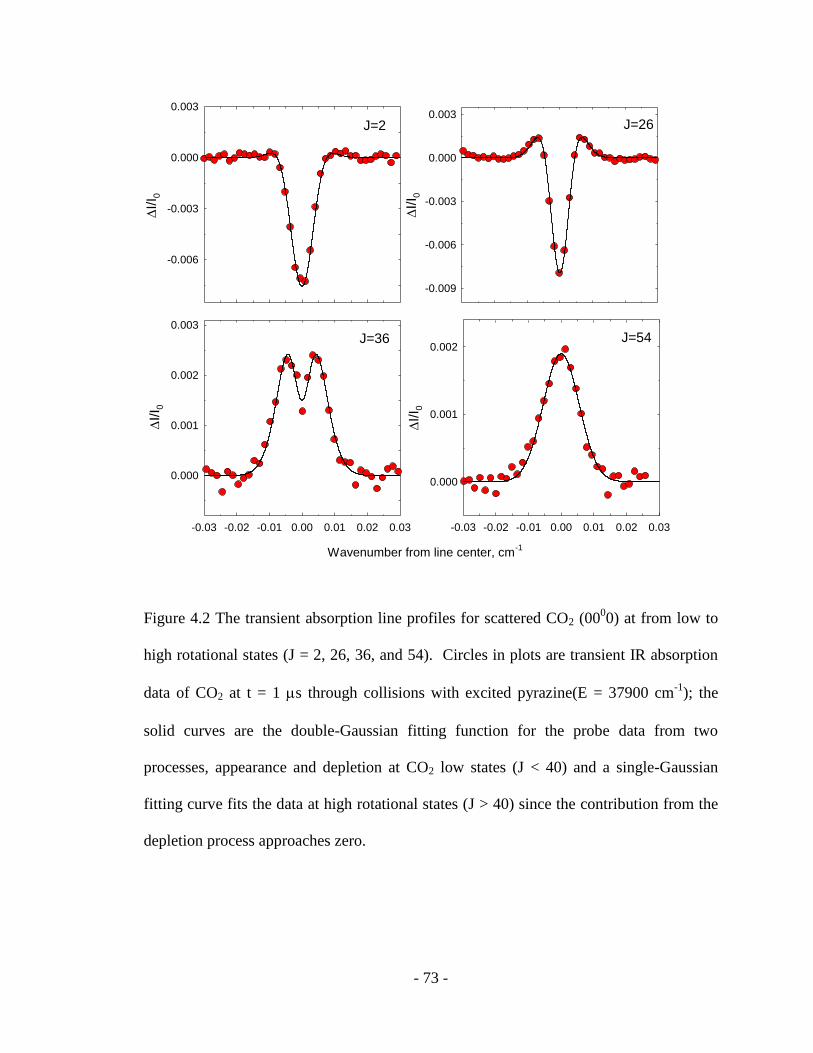
- 73 -
I/I 0
-0.006
-0.003
0.000
0.003
I/I 0
-0.009
-0.006
-0.003
0.000
0.003
Wavenumber from line center, cm-1
-0.03 -0.02 -0.01 0.00 0.01 0.02 0.03
I/I 0
0.000
0.001
0.002
0.003
-0.03 -0.02 -0.01 0.00 0.01 0.02 0.03
I/I 0
0.000
0.001
0.002
J=2 J=26
J=36 J=54
Figure 4.2 The transient absorption line profiles for scattered CO2 (0000) at from low to
high rotational states (J = 2, 26, 36, and 54). Circles in plots are transient IR absorption
data of CO2 at t = 1 s through collisions with excited pyrazine(E = 37900 cm-1
); the
solid curves are the double-Gaussian fitting function for the probe data from two
processes, appearance and depletion at CO2 low states (J < 40) and a single-Gaussian
fitting curve fits the data at high rotational states (J > 40) since the contribution from the
depletion process approaches zero.

- 74 -
Nascent CO2 populations are determined from transient IR line profiles measured
at short times relative to the time between collisions. Transient absorption measurements
at t = 1 s are made well before the average time between collisions (tcol ~ 4 s) and
correspond to populations of scattered CO2 molecules for which secondary quenching
collisions are unlikely.
Each transient line profile is fit with a double Gaussian function (Eq 4.3) to
separate the nascent appearance and depletion populations.
F = Iappexp 4ln2 νν0
Δνapp 2
Idepexp 4ln2 νν0
Δνdep 2
+ F0 (4.3)
Here, Iapp and Idep are appearance and depletion intensities at 0, app and dep are the
full widths at half maximum (FWHM) for the appearance and depletion components,
respectively, and F0 accounts for small baseline fluctuations from instrumental noise.
Dynamic information about collisions that lead to population appearance and
depletion is obtained from the fitting parameters in Eq 4.3. Figure 4.3 shows the separate
appearance and depletion components from fitting J = 26 data with Eq 4.3.
The area under each curve in Figure 4.3 corresponds to the nascent sub-
population (at t = 1 s) of molecules (in J = 26) that has either appeared as collision
products or been depleted by collisions. J-specific line widths and translational energy
distributions (in the lab frame and the center of mass frame) for appearance are listed in
Table 4.1. Table 4.2 lists line widths and translational temperatures for depletion.
Appearance line widths are all broader than 300 K. Depletion line widths measured for J
= 238 have values near those for a 300 K distribution.

- 75 -
Wavenumber from line center, cm-1
-0.03 -0.02 -0.01 0.00 0.01 0.02 0.03
I/I 0
-0.016
-0.008
0.000
0.008 appearance
depletion
Tapp = 629 K
Tdep = 309 K
Iapp
Idep
CO2 J=26
Figure 4.3 The appearance and depletion curves are separated by a double-Gaussian
function. Transient absorption line profile for CO2 (0000) at J = 26 (open circles) were
measured at t = 1 s after UV pulse. The solid curve is a double-Gaussian function that
includes both appearance and depletion processes. Due to the fitting parameters, two
processes were measured: the appearance component (red line) is broadened with a
translational temperature Tapp = 629 K and the blue line shows the depletion component
with Tdep = 309 K through collisions.

- 76 -
Table 4.1 Nascent Doppler-broadened linewidths, translational temperatures and rate
constants for appearance of CO2 (0000, J) from collisions with vibrationally excited
pyrazine(E = 37900 cm-1
)
CO2 J Erot, cm-1
0, cm-1
app, cm-1a
Tapp, Kb Trel, K
c
2 2.3413 3717.0853 0.0103 664±91 865±119
8 28.0951 3721.5215 0.0104 658±89 855±116
22 197.4166 3730.9893 0.0097 579±85 734±107
26 273.868 3733.4684 0.0101 629±88 811±114
36 519.535 3739.2323 0.0115 820±101 1106±136
38 578.0115 3740.3115 0.0111 755±96 1006±128
44 772.1107 3743.4040 0.0126 970±109 1339±151
52 1074.4305 3747.1946 0.0120 875±03 1193±141
54 1157.774 3748.0840 0.0131 1052±113 1466±158
58 1333.7678 3659.4029 0.0118 916±110 1255±150
64 1621.0035 3652.5720 0.0135 1173±123 1654±174
aFull width at half-maximum (FWHM) linewidth app for appearance of CO2 rotational
states at 1 s following UV excitation of pyrazine. Values of app have an uncertainty
of ± 0.001 cm-1
.
bThe lab-frame translational temperature Tapp for appearance of CO2 rotational states due
to collisions obtained using Tapp= mc2 (8Rln2) 2 Δνapp ν0 2, where m is the mass of
CO2, c is the speed of light, R is the gas constant and 0 is the center frequency of the
absorption line.

- 77 -
cCenter-of-mass translational temperature Trel for appearance of scattered CO2 is
determined by assuming an isotropic distribution of collisions and using
Trel= Tapp+ mCO2mpyz TappT0 , where, mCO2
and mpyz are the masses of CO2 and
pyrazine respectively and T0 = 298K.

- 78 -
Table 4.2 State-resolved depletion linewidths, translational temperatures and rate
constants for collisions with vibrationally excited pyrazine(E = 37900 cm-1
)
Pyrazine E + CO2 0000, J
kdep Pyrazine E + CO2 any state
CO2, J 0, cm-1a
dep, cm-1b
Tdep,lab, Kc kdep, 10
-10 cm
3 molecule
-1 s
-1
2 3717.0853 0.0077 364 94 7.4 2.2
8 3721.5215 0.0083 422 102 6.2 1.9
22 3730.9893 0.0082 409 100 8.9 2.7
26 3733.4684 0.0071 309 87 5.1 1.5
36 3739.2323 0.0073 323 88 3.5 1.0
38 3740.3115 0.0064 248 78 2.6 0.8
kdep , cm3 molecule
-1 s
-1d 5.6( 2.2) 10
-10
kLJ, cm3 molecule
-1 s
-1e 5.6 10
-10
a0 is the IR transition frequency of probe transition at line center.
bFull width at half-maximum (FWHM) line widths and dep for depletion of individual
CO2 J states. Line widths have uncertainties of 0.001 cm-1
.
cThe lab-frame translational temperature Tdep for depletion of CO2 due to collisions with
pyrazine(E) are obtained using Tdep= mc2 8Rln2 νdep ν0 2, where m is the mass of
CO2, c is the speed of light, R is average the gas constant, and 0 is the center frequency
of the absorption line.
dThe average depletion rate constant kdep is the population-weighted average of kdep
eThe Lennard-Jones collision rate constant kLJ is determined using the model which is
shown in the appendix B with the following Lennard-Jones parameters:
σCO2=4.5 10
-10m kB CO2
=190 K, andσpyz = 5.35 10-10
m, kB pyz = 435.5 K.

- 79 -
4.3.2 Rotational and Translational Energy Gained for Scattered CO2 at J = 280
through Collisions with Excited Pyrazine(E).
The nascent CO2 rotational distribution and the J-specific product translational
energy distributions are determined directly from the appearance parameters Iapp and
app. Figure 4.4 shows the rotational distribution of scattered CO2 molecules (J = 280)
based on appearance intensities and line widths measured at t = 1 s. The data for CO2 J
= 264 states are shown as red circles. Previous measurements for the J = 5880 states
are shown as white circles.77
Data for the J = 58 and 64 states of CO2 are in very good
agreement with the earlier high-J measurements. Based on the consistency of the
overlapping data, no rescaling of either data set was needed. The distribution is a bi-
exponential function of energy with a transition point near Erot = 1100 ± 110 cm-1
.
Exponential fitting of the data in each region indicates that the lower energy states with J
< 50 have a rotational temperature of Trot = 453 ± 50 K and that states with J > 50 have a
temperature of Trot = 1164 ± 110 K. The residuals are shown in the lower plot of Figure
4.4. These data show that there are two distinct populations of scattered CO2 molecules.
Given the high state density of pyrazine(E) and the structure of CO2, it is unlikely that a
threshold for enhanced energy transfer occurs at Erot = 1100 cm-1
. It is more likely that
the two populations of scattered CO2 molecules each span the full range of J states. This
Chapter will use this information to develop a two component model to describe the
energy transfer.
The J-specific nascent translational energy distributions (based on Trel in Table
4.1) for scattered CO2 molecules in J = 280 are shown in Figure 4.5. The Trel values for
J = 264 are shown as red circles and previously reported values for the J = 5880 states

- 80 -
ln([
CO
2]/
g)
18
20
22
24
26
CO2 E
rot, cm
-1
0 500 1000 1500 2000 2500 3000
Re
sid
ua
ls
-0.4
0.0
0.4
Pyrazine(E) + CO2
Tlow-J = 453 K
Thigh-J = 1164 K
Figure 4.4 Nascent rotational distribution for the J = 280 states of CO2 (0000) due to
collisions with vibrationally excited pyrazine. Measurements of the J = 264 states are
shown in red circles. Previous data for the J = 5880 states (from Ref. 77) are shown as
open circles. The nascent distribution is a biexponential function of rotational energy
with a crossing point at Erot ∼ 1100 cm-1
. Fitting the data for J < 50 yields a low-J
distribution with TlowJ = 453 ± 50 K. Fitting the data for J > 50 yields ThighJ = 1164 ± 110
K.

- 81 -
are shown as white circles.75-77
There is good agreement between the two data sets in the
overlapping region of J = 5864. Overall, the data are well described by an exponential
increase in Trel as a function of J with an offset of Trel = 780 K at J = 0. The low-J states
of CO2 are scattered with translational energies near Trel ~ 800 K. The J-dependence of
Trel becomes stronger for J > 40 where much larger recoil energies are observed.
The data in Figure 4.5 illustrate the impulsive nature of the VRT collisions
between pyrazine(E) and CO2. It has long been recognized that the scattering of CO2 in
very high J states results from strongly impulsive collisions.90,91
The measured
translational energy profiles for the low-J scattering states presented here are consistent
with an impulsive mechanism. The classical physics of impulsive collisions indicates
that the smallest recoil velocities result from collisions that have the smallest changes in
angular momentum. It is interesting that the smallest value of Trel in Figure 4.5 is for the
J = 22 state which is near the peak of the initial CO2 distribution. Appearance of
population in this state is most likely to result from small J collisions. Given the scatter
in the data and the small number of states measured in this region, however, we cannot
conclusively identify the presence of a minimum. To address this question, it would be
useful to perform scattering experiments where initial J states can be correlated with final
states.

- 82 -
CO2 rotational state J
0 20 40 60 80
Tre
l, K
0
1000
2000
3000
4000
5000
6000
300 K
Pyrazine (E) + CO2
Figure 4.5 The nascent relative translational temperatures Trel for the pyrazine(E)/CO2
collision system is a function of CO2 (0000) rotational state. The red circles are the
experimental appearance translational temperatures for CO2 J = 264 while the data for
CO2 high-J states (J = 5880) from the previous paper77
are shown as the open circles.

- 83 -
4.3.3 State-Resolved VRT Energy Transfer Rate Constants and the Total Collision
Rate
This Chapter reports appearance and depletion rates of individual CO2 states
using transient IR absorption. Rate constants for depletion and appearance are based on
Eqs. 4.1 and 4.2, respectively. The early time population changes associated with
depletion are determined using Eq 4.4.
CO2 J dep t
=kdep Pyz(E) 0 CO2 J 0 (4.4)
In Eq 4.4 the transient population depletion Δ[CO2(J)]dep is determined from the
integrated depletion line profile at Δt = 1 μs (as in Figure 4.3). The initial number density
of excited pyrazine, [Pyz(E)]0 is determined by measuring UV absorption. The initial
CO2 number density [CO2]0 is determined by measuring equilibrium IR absorption of a
well-populated state.
The initial thermal population of CO2 is depleted by collisions, and kdep is a
measure of the collision rate constant, assuming that the collision rate is independent of J.
Depletion rate constants are listed in Table 4.2 for CO2 J = 238 states. The rate
constants for these states range from kdep = 2.6 × 10⁻¹⁰
to 8.5 × 10⁻¹⁰
cm3·molecule
-1·s
-1.
The population-weighted average is kdep = (5.6 ± 2.2) × 10-10
cm3·molecule
-1·s
-1 which
is in excellent agreement with the Lennard-Jones collision rate of kLJ = 5.6 × 10⁻¹⁰
cm3·molecule
-1·s
-1. The collision cross section based on these data is σcol = kdep vrel ∼
120 ± 50 Å2.
State-specific rate constants for appearance of CO2 (0000) are defined by Eq 4.5.

- 84 -
CO2 J app t
= kappJ
Pyz(E) 0 CO2 J 0 (4.5)
The appearance populations Δ[CO2(J)]app are determined from the integrated appearance
profiles at Δt = 1 μs (as in Figure 4.3). Values of kappJ
for J = 264 are listed in Table 4.3
and values for J = 5880 are taken from Ref. 95. Appearance rate constants for
unmeasured CO2 states (up to J = 100) are determined based on rates for measured states
and the Trot values of Figure 4.4. Summing the rate constants for product state
appearance yields an overall rate constant for VRT energy transfer between pyrazine(E)
and CO2 of kapp= kappJ
(4.8 ± 1.4) 10-10
cm3molecule
-1 s
-1. This overall rate
constant corresponds to a cross section for VRT energy transfer of σVRT= kapp vrel ∼
100 ± 30 Å2.
The VV energy transfer pathways from pyrazine(E) to CO2 have been measured
for a number of CO2 vibrational states at a pyrazine energy of E = 40680 cm-1
.74,95
The
total rate constant for energy transfer into the (1000r1), (10
00r2), (02
20) and (00
01) states
(2349 cm-1
) is kv = (3 ± 1) × 10-11
cm3·molecule
-1·s
-1. The total energy transfer rate
constant based on appearance measurements is a sum of the rates for the VRT and VV
pathways, given by ktot = kapp + kv = (5.1 ± 1.8) × 10-11
cm3·molecule
-1·s
-1. The value of
ktot is consistent with our measured depletion rate and is in very good agreement with the
Lennard-Jones collision rate.

- 85 -
Table 4.3 State-resolved rate constants for appearance of CO2 (0000, J) through collisions
with highly vibrationally excited pyrazine(E = 37900 cm-1
).
pyrazine E + CO2 300 K kappJ
pyrazine E + CO2 0000, J
CO2 J CO2 Erot, cm-1
10-12
cm3‧molecule
-1‧s-1a
2 2.3413 6.72.0
8 28.095 20.56.2
22 197.4 33.09.9
26 273.9 23.87.1
36 519.5 13.94.2
38 578.0 10.63.2
44 772.1 7.12.1
52 1074.4 5.01.5
54 1157.8 3.71.1
58 1333.8 2.60.8
64 1521.0 2.20.7
kapp, cm3‧molecule
-1‧s-1b
(4.8 1.8) 10-10
kv, cm3‧molecule
-1‧s-1c
> (3 1) 10-11
ktot, cm3‧molecule
-1‧s-1d
> (5.1 1.8)10-10
kLJ, cm3‧molecule
-1‧s-1e
5.6 10-10
aThe state-specific rate constant
for appearance of CO2 (00
00, J = 264) are
determined from appearance data at t = 1 s using

- 86 -
kappJ = CO2 J app Pyz E 0 CO2 0t , Pyz E 0 and CO2 0 are the number
densities of excited pyrazine and 300 K CO2, respectively, immediately following optical
excitation of pyrazine.
bThe overall rate constant for VRT energy transfer, kapp, is determined by summing
appearance rate constants for all CO2 product states by using the equation kapp= kappJ
J .
Rate constants were measured for the states listed in Table 4.2 and values of
for the
remaining products states were determined using the nascent rotational temperature Trot
of the scattered CO2 molecules. The appearance rate constant kapp for the VRT pathway
is a lower limit to the total collision rate constant.
cThe rate constant kv for appearance of vibrationally excited CO2 in the (10
00r1), (10
00r2),
(0220) and (00
01) vibrational states following collisions with pyrazine(E), taken from
Refs.74,95
.
dThe total energy transfer rate constant ktot = kapp + kv includes VRT and VV channels
of energy transfer from pyrazine(E) to CO2.
eThe Lennard-Jones collision rate constant kLJ is determined as described in Table 4.2.
- 87 -
The discrepancy between ktot and the actual collision rate constant is likely to be
due to the energy transfer into the (0110) bending state of CO2 at 667 cm
-1. This state is
the only low-lying vibrational state that is not included in the VV rate
measurements.74,95
Because of its relatively small energy gap, the (0110) state should be
readily accessed through collisions with pyrazine(E). It is likely that the rate for energy
gain in the bend is greater than that in the stretching modes, based on the rates for the
nearly degenerate 1000 and 02
20 states. Relative to the Lennard-Jones collision rate, the
results in this Chapter show that the VRT pathway accounts for ∼ 85% of collisions.
The measured VV pathways account for ∼ 6% of collisions, suggesting that the
remaining ∼ 9% of collisions may involve excitation of the bending mode. This
branching ratio is consistent with our current understanding of vibrational excitation in
small molecules and provides evidence that the Lennard-Jones collision rate constant is a
fairly accurate representation of pyrazine(E)/CO2 collisions.
4.4 Discussion
The data presented here provide an in-depth description of the dynamics for the
full range of collisions by which CO2 quenches highly excited pyrazine molecules
through VRT energy transfer. The ability to measure the outcome of both weak and
strong collisions that scatter CO2 (0000) gives us the most complete description to date of
this type of collisional relaxation process. These data provide insight into the first set of
collisions that lead off the collisional cascade that eventually brings molecules into
thermal equilibrium.

- 88 -
4.4.1 Branching Ratio for Inelastic Collisions
The measurements of weak collisions presented in this Chapter confirm that the
VRT pathway is the predominant channel by which highly excited pyrazine molecules
are quenched with CO2. The VRT pathway includes strong and weak collisions and
accounts for ∼ 85% of all pyrazine(E)/CO2 collisions, based on rates measured for
appearance of products and depletion of initial states. The VV pathways for
pyrazine(E)/CO2 account for the remainder of collisions. Similar behavior was seen in
classical trajectory calculations of pyrazine(E)/CO2 collisions, where Luther and
coworkers found the VV energy transfer in pyrazine(E)/CO2 collisions make an almost
negligible contribution to the overall relaxation.64
State-resolved scattering
measurements illustrate that the VV pathways for the stretching modes of CO2 occur
primarily via long-range near-resonant energy transfer, so it is not surprising that they are
not seen in classical trajectories.74,95
The agreement between our measured collision rate and that calculated with a
Lennard-Jones model indicates that the relaxation is not particularly sensitive to
anisotropy in the intermolecular potential between pyrazine(E) and CO2. Lennard-Jones
collision rates are commonly used to model molecular collisions and they should be valid
for collisions of weakly interacting species such as CO2 at 300 K. Caution must be used
however for the case of strongly interacting species such as water. In other studies we
have measured total appearance rates for scattered HOD molecules that are as much as
3.5 times larger than the Lennard-Jones collision rate.79,81,118
For these systems, state-
resolved scattering data indicate that anisotropy in the intermolecular potential plays an
important role in quenching pathways involving water.118

- 89 -
4.4.2 The Scattered Population Distributions from Weak and Strong Collisions
The rotational distribution for scattered CO2 molecules (Figure 4.4) shows clear
evidence for the presence of two distinct scattering populations. In Eq 4.6, a two-
component model is used to describe the population in each J state as the sum of two
Boltzmann distributions,
PopJ=g
J(Iaexp(
EJ
kBTa) + Ibexp(
EJ
kBTb)) (4.6)
where gJ is the rotational degeneracy, EJ is the rotational energy, Ia and Ib are intensity
parameters, kB is the Boltzmann constant, and Ta and Tb are rotational temperatures.
Figure 4.6 shows the results of a four-parameter nonlinear least-squares fit of Eq 4.6 to
the data with no initial constraints. Modeling the data with the biexponential function in
Eq 4.6 yields smaller residuals than the fit shown in Figure 4.6.
The two subpopulations based on the best fit values of Ia, Ib, Ta, and Tb are shown
in Figure 4.7. The low-energy rotational states are best described by a cooler distribution
with Ta = 329 K while population in the high-energy states comes almost entirely from a
hotter rotational distribution with Tb = 1241 K. The value of Ta is very close to the initial
300 K distribution, showing that this subset of collisions is elastic or nearly inelastic and
falls into the category of weak collisions. The relatively large value of Tb shows that the
second subset of collisions induces large changes in CO2 rotation, thereby putting this
group in the category of strong collisions. The integrated intensity of the weak collision
component is 78% of the total population of scattered CO2 (0000) molecules, while the
high-energy component accounts for 22%. Thus, nearly four out of five collisions involve

- 90 -
ln(p
op
/g)
18
20
22
24
Data
Biexponential Fit
pyrazine (E) + CO2
CO2 E
rot, cm
-1
0 500 1000 1500 2000 2500 3000
Re
sid
ua
ls
-0.2
0.0
0.2
Figure 4.6 A two-component biexponential model fitting the population data of scattered
CO2 molecules with pyrazine(E) in the upper plot. The circles are the measured data and
the fitting result is shown as a solid curve. The accuracy for the fitting model is shown as
the fractional residuals in the lower plot.

- 91 -
CO2 E
rot, cm
-1
0 500 1000 1500 2000 2500 3000
Fra
ctio
na
l C
O2 p
op
ula
tio
n,
10
11 m
ole
cu
le c
m-3
0
2
4
6
8
Full distribution from fit
"weak" collisions Trot=329 K
"Strong" collisions Trot=1241 K
Figure 4.7 Two energy distributions are separated by a two-component model. The low
energy distribution is associated with weak collisions and accounts for 78% of VRT
collisions. The high energy distribution is from the strong collision with accounts for 22%
of VRT collisions.

- 92 -
only minor changes to CO2 rotation, while the remaining one-fifth of collisions induce
large changes in rotational energy.
It is interesting that there are two distinct scattering populations for CO2. Prior to
the current measurements of the full distribution for this system, neither the CO2
rotational distribution nor the collision rate was known. Extrapolating the full
distribution based only on high-J data yielded an energy transfer rate that was much
smaller than the Lennard-Jones collision rate and was inconsistent with measurements of
the VV energy transfer rates. The data presented here clearly illustrate the
predominance of the weak collision pathway and establish the validity of the Lennard-
Jones collision rate for quenching collisions of CO2 and pyrazine(E). In a somewhat
related study, Nesbitt and co-workers have measured CO2 scattering from liquid surfaces
and found that the products have a two-component distribution.140-142
They estimate that
about 50% of the scattered molecules undergo desorption trapping, which leads to a
cooler distribution of products, while the hotter distribution comes from impulsive
scattering.
For gas-phase collisions with high-energy molecules, the presence of a two-
component scattering distribution for CO2 seems to be the norm. Chapters 5 and 6 report
other studies on CO2 collisions with similar scattering behavior. This behavior is not
found for collisional quenching in other small bath species such as HOD79
and DCl
(Chapter 3). These bath molecules scatter from highly excited molecules via VRT
collisions with single rotational distributions.
The presence of a strong collisional channel involving large amounts of CO2
rotation is most likely due to CO2’s length and relatively uniform mass distribution.
- 93 -
Impulsive collisions involving the oxygen atoms on CO2 are likely to be effective at
inducing torque on the molecule. This idea is supported by classical trajectory studies
both from our group and from Chapman, Flynn, and co-workers. For the
pyrazine(E)/CO2 collisions in this Chapter, the average recoil energy has little
dependence on CO2 rotational energy until Erot ∼ 750 cm-1
above which the recoil
energies increase substantially.45
Chapman and co-workers found a biexponential
rotational distribution for CO following single collisions with pyrazine(E).43,44
When
they doubled the length of the CO molecule to mimic CO2, while preserving other
potential parameters, they found reasonable agreement with the high-energy tail from
pyrazine(E)/CO2 collisions.
4.4.3 The Effect of Angular Momentum Changes for VRT Energy Transfer
Chapter 3 discussed how the angular momentum changes were determined using
the experimental data for pyrazine(E)-DCl collision pair. Table 4.4 lists the average
changes in CO2 angular momentum Jbath and recoil velocity vrel based on the J-
specific values of Tapp (Table 4.1) for J = 264. Our calculations are based on an initial J
state of J = 22 and an initial average velocity at 300 K, as described in Table 4.4. Figure
4.8a shows vrel as a function of Jbath for the J = 280 states of CO2. Figure 4.8a
shows that vrel increases monotonically as a function of Jbath . This figure also
illustrates that there is a slight minimum in vrel at Jbath = 0. Small changes in recoil
velocity (∼300 m/s) correlate to small Jbath and more substantial increases in recoil
velocity changes for Jbath > 40. This behavior is entirely consistent with the angular
momentum model for collisional energy transfer by McCaffery and co-workers.128-130,143-
146

- 94 -
Table 4.4 The average changes in linear and angular momentum in CO2 through
collisions with highly vibrationally excited pyrazine(E).
CO2 J Tapp, Ka vlab , m/s
b vrel , m/s
c vrel , m/s
d J , e
bmin, Åf
2 664 ± 91 612 42 869 120 357 49 -21.9 1.36
8 658 ± 89 609 41 864 117 352 48 -20.5 1.27
22 579 ± 85 571 42 800 117 288 42 0 0
26 629 ± 88 595 42 841 118 329 46 13.9 0.92
36 820 ± 101 680 42 983 121 471 58 28.5 1.33
38 755 ± 96 652 42 937 120 425 54 31.0 1.59
44 970 ± 109 739 42 1081 122 569 64 38.1 1.47
52 875 ± 103 702 42 1020 121 508 60 47.1 2.03
54 1052 ± 113 770 41 1131 122 619 67 49.3 1.76
58 916 ± 110 718 43 1046 125 535 64 53.7 2.20
64 1173 ± 123 813 43 1202 126 690 72 60.1 1.91
aNascent translational temperature for appearance of scattered CO2 molecules in
rotational quantum state J.
bAverage velocity in the lab frame of scattered CO2 molecules determined using
vlab = 3kBTapp
mCO2
1
2
, where kB is the Boltzmann constant, mCO2is the mass of CO2
molecule.
- 95 -
c vrel , the average velocity in the center-of-mass of pyrazine(E)/CO2 system is calculated
by using vrel = vlab 2
3kBTapp
M
1
2 Mmpyrazine
, where the sum of mass M = mpyz+ mCO2 and
mpyz is the mass of pyrazine.
dAverage change in center-of-mass velocity vrel is calculated by an equation:
vrel = vrel 3kBT0
μ
1
2
, where µ is the reduced mass for pyrazine/CO2 pair and T0 =
298 K.
e J is the average change of CO2 angular momentum which is determined using
Jbath = Jfinal2 Jinitial
2 , where Jinitial ~ 22.
fbmin, minimum impact parameter for pyrazine(E)/CO2 system is from Jbath =
μ vrel bmin.
.

- 96 -
<
vre
l>,
m/s
0
300
600
900
1200
1500
1800
<Jbath
>
-40 -20 0 20 40 60 80
Impact
Para
mete
r A
ngstr
om
s
0
1
2
3
pyrazine (E) + CO2a)
b)
Figure 4.8 (a) Average relative velocity as a function of average change in CO2 rotational
angular momentum collisions between pyrazine(E) and CO2. (b) Minimum impact
parameter bmin as a function of average angular momentum changes.
- 97 -
The data in Figure 4.8a further illustrate the impulsive nature of collisions that
lead to VRT energy transfer between pyrazine(E) and CO2. Increases in recoil velocity
are seen even for collisions with small angular momentum changes. On the basis of these
data, we estimate that lower limits to the impact parameter have values of bmin = 02 Å,
as shown in Figure 4.8b. These features are consistent with an impulsive mechanism for
energy transfer in molecules of the size considered here.
4.4.4 Full Energy Gain Distribution Function P(E)
The nascent product state measurements for CO2 (J = 280) are used to determine
the energy transfer probability distribution function P(ΔE). The P(ΔE) distribution
function is related to, but not equivalent to, the P(E′,E) distributions from UVA, IRF, and
KCSI studies. P(E′,E) curves describe the distribution of vibrational energy loss as high
energy molecules initially with energy E undergo collisions to end up at a lower energy
E′. The P(ΔE) distribution from transient IR measurements is obtained by converting the
J- and velocity-indexed product state data into an energy transfer distribution indexed by
ΔE using the method of Michaels and Flynn.89
The state-specific probability distribution
function PJ(ΔE) for energy gain in a single CO2 product state is based on measurements
of the state-resolved appearance rate and the product translational energy distribution (in
the center of mass). The ΔE index includes the change in CO2 rotational energy and the
change in relative translational energy of the pyrazine/CO2 pair. For this calculation we
use an estimated initial value of J0 = 22 based on temperature-dependent measurements
and an initial velocity corresponding to the average relative velocity at 300 K.91
At present there are not any methods to measure the energy changes associated
with rotation of vibrationally excited donor molecules such as pyrazine(E). For this

- 98 -
reason, ΔErot for pyrazine is not included in ΔE. Therefore the ΔE values in P(ΔE) are
smaller than the amount of vibrational energy lost (E E′) from pyrazine due to
collisions. This distinction is particularly important in comparing results from state-
resolved transient IR measurements with those from KCSI, IRF, and UVA techniques.
Individual PJ(ΔE) curves for the J = 0100 states of CO2 are shown in Figure 4.9a.
The integrated intensity of each PJ(ΔE) curve is equal to the ratio of kappJ
kLJ and
corresponds to the relative population in that product state, based on the measured
rotational distribution (Figure 4.4) for the J = 280 states. The initial ΔE value for each
curve is given by ΔE0 = E(J) E(J0 = 22) ΔErel, and ΔE0 is negative for rotational
states with J 32. Within our assumptions for the initial energies, negative ΔE values
correspond to collisions where pyrazine(E) gains energy from CO2 and positive ΔE
values are for collisions where CO2 gains energy from pyrazine(E). The overall energy
gain distribution P(ΔE) for the VRT pathway is the sum of PJ(ΔE) curves and the
resulting P(ΔE) curve extends from ΔE = 500 to 8000 cm-1
, as shown in Figure 4.9a.
Figure 4.9b illustrates a number of interesting features. Most collisions between
pyrazine(E) and CO2 lead to energy exchanges of ΔE < 2000 cm-1
, showing the
propensity for small energy transfer in single collisions. Strong collisions that induce
larger ΔE values are detectable out to ΔE ∼ 10000 cm-1
, but the probability for these
events is dwarfed by that for the low ΔE collisions. The P(ΔE) distribution is dominated
by the spread of translational energy in the products and is mostly a smoothly varying
function of ΔE except near ΔE = 0 where the effect of the CO2 rotational states structure
can be seen as undulations in P(ΔE).

- 99 -
E, cm-1
0 2000 4000 6000 8000
P(
E),
1/c
m-1
1e-11
1e-10
1e-9
1e-8
1e-7
1e-6
1e-5
1e-4
1e-3
1e-2
E, cm-1
0 2000 4000 6000 8000
P(
E),
1/c
m-1
0
1e-4
2e-4
3e-4
4e-4
5e-4
6e-4
P(E)=PJ(E)
PJ(E)
for J=0-100
Pyrazine(E) + CO2
P(E)=PJ(E)
Figure 4.9 (a) The state-specific energy probability distribution PJ(E) for CO2 J = 0100
through collisions with vibrationally excited pyrazine(E). (b) The full energy transfer
distribution P(E) curve is the sum of the state-specific energy transfer profiles PJ(E) (J
= 0100). E is the product energy gain of scattered CO2 through collisions with highly
vibrationally excited pyrazine.

- 100 -
The rotational state structure of both the donor and energy accepting bath
molecules will affect the shape of P(ΔE) in the low ΔE region. Rotational degeneracy
favors collisions that move population into higher J states, given that there is sufficient
energy to populate those states. The availability of a greater number of states at
increasing J is balanced by larger energy gaps between states. The impact of the
rotational ladders on P(ΔE) will be most apparent for the collision partner with the
smaller moment of inertia. For CO2, the rotational state density levels out at J = 24 to 97%
of its ultimate value. This state has an energy of Erot = 236 cm-1
. For pyrazine, the
rotational states are more closely spaced and the rotational state density becomes uniform
at lower energies. Pyrazine reaches 97% of its ultimate rotational state density near J =
11 where Erot ∼ 26 cm-1
. At 300 K, the most populated states of CO2 have energy gaps
on the order of 50 cm-1
while for pyrazine the energy gaps are closer than 15 cm-1
. This
means that in the first set of collisions that quench pyrazine(E), CO2 will undergo larger
energy changes for the same changes in angular momentum, thereby leading to larger
gaps between ΔE0 for sequential PJ(ΔE) curves. This effect is particularly pronounced
for CO2 since only even J states exist for the (0000) state. It is likely that bath molecules
with more closely spaced rotational states will be scattered with a narrower distribution
of rotational energy since there are more states available with small energy gaps. In
addition, in cases where the velocity distributions of the scattered molecules are broad,
probability density is shifted out to larger ΔE values, leaving the low ΔE region more
sensitive to the rotational state density.
The P(ΔE) curve in Figure 4.9b has a maximum value at ΔE = 240 cm-1
rather
than at ΔE = 0 as expected from P(E,E′) curves reported elsewhere and used in traditional
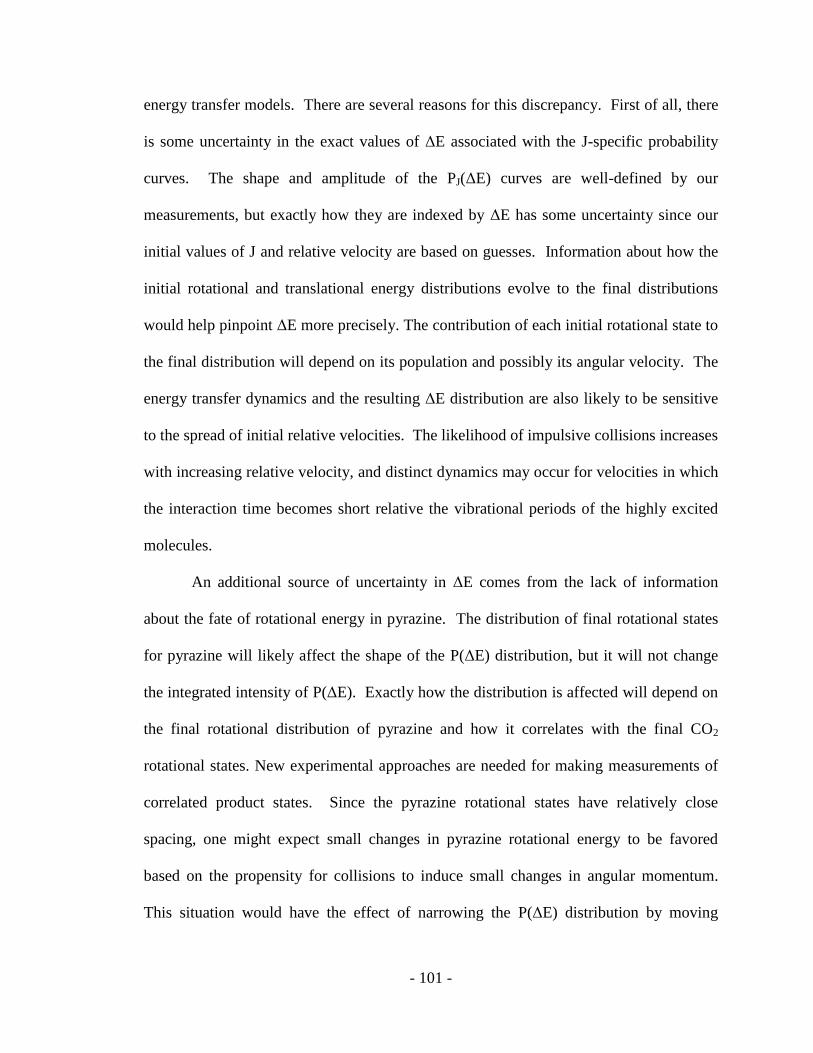
- 101 -
energy transfer models. There are several reasons for this discrepancy. First of all, there
is some uncertainty in the exact values of ΔE associated with the J-specific probability
curves. The shape and amplitude of the PJ(ΔE) curves are well-defined by our
measurements, but exactly how they are indexed by ΔE has some uncertainty since our
initial values of J and relative velocity are based on guesses. Information about how the
initial rotational and translational energy distributions evolve to the final distributions
would help pinpoint ΔE more precisely. The contribution of each initial rotational state to
the final distribution will depend on its population and possibly its angular velocity. The
energy transfer dynamics and the resulting ΔE distribution are also likely to be sensitive
to the spread of initial relative velocities. The likelihood of impulsive collisions increases
with increasing relative velocity, and distinct dynamics may occur for velocities in which
the interaction time becomes short relative the vibrational periods of the highly excited
molecules.
An additional source of uncertainty in ΔE comes from the lack of information
about the fate of rotational energy in pyrazine. The distribution of final rotational states
for pyrazine will likely affect the shape of the P(ΔE) distribution, but it will not change
the integrated intensity of P(ΔE). Exactly how the distribution is affected will depend on
the final rotational distribution of pyrazine and how it correlates with the final CO2
rotational states. New experimental approaches are needed for making measurements of
correlated product states. Since the pyrazine rotational states have relatively close
spacing, one might expect small changes in pyrazine rotational energy to be favored
based on the propensity for collisions to induce small changes in angular momentum.
This situation would have the effect of narrowing the P(ΔE) distribution by moving
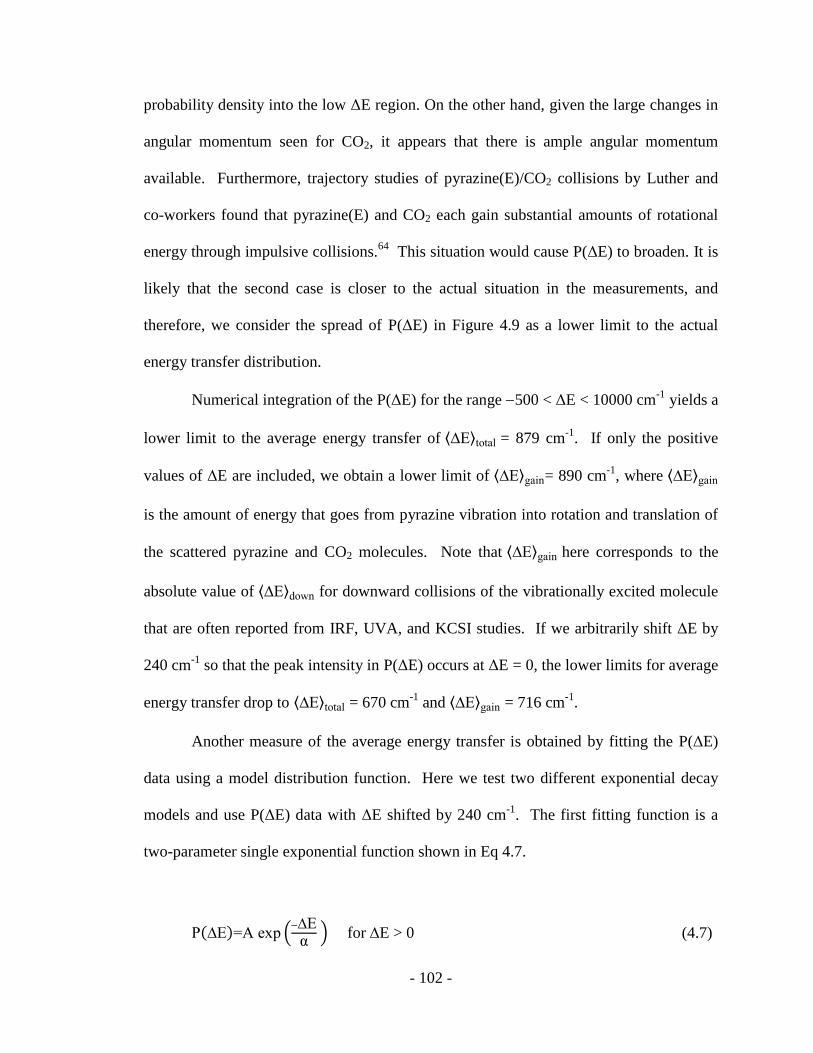
- 102 -
probability density into the low ΔE region. On the other hand, given the large changes in
angular momentum seen for CO2, it appears that there is ample angular momentum
available. Furthermore, trajectory studies of pyrazine(E)/CO2 collisions by Luther and
co-workers found that pyrazine(E) and CO2 each gain substantial amounts of rotational
energy through impulsive collisions.64
This situation would cause P(ΔE) to broaden. It is
likely that the second case is closer to the actual situation in the measurements, and
therefore, we consider the spread of P(ΔE) in Figure 4.9 as a lower limit to the actual
energy transfer distribution.
Numerical integration of the P(ΔE) for the range 500 < ΔE < 10000 cm-1
yields a
lower limit to the average energy transfer of E total = 879 cm-1
. If only the positive
values of ΔE are included, we obtain a lower limit of E gain= 890 cm-1
, where E gain
is the amount of energy that goes from pyrazine vibration into rotation and translation of
the scattered pyrazine and CO2 molecules. Note that E gain here corresponds to the
absolute value of E down for downward collisions of the vibrationally excited molecule
that are often reported from IRF, UVA, and KCSI studies. If we arbitrarily shift ΔE by
240 cm-1
so that the peak intensity in P(ΔE) occurs at ΔE = 0, the lower limits for average
energy transfer drop to E total = 670 cm-1
and E gain = 716 cm-1
.
Another measure of the average energy transfer is obtained by fitting the P(ΔE)
data using a model distribution function. Here we test two different exponential decay
models and use P(ΔE) data with ΔE shifted by 240 cm-1
. The first fitting function is a
two-parameter single exponential function shown in Eq 4.7.
P E =A exp E
for E > 0 (4.7)

- 103 -
The results are shown in Figure 4.10a. Eq 4.7 is similar to that used by Miller and
Barker to fit IRF results on pyrazine(E)/CO2 collisions.56
The parameter is a measure
of E down. P(ΔE) is fit reasonably well with Eq 4.7 and using Barker’s notation, we
find that E down = 1042 cm-1
. For comparison, Miller and Barker report a value of
E down = 370 cm-1
for pyrazine(E)/CO2 collisions.
The second model function is a three-parameter monoexponential decay shown in
Eq 4.8.
P E =A exp E
for E > 0 (4.8)
Eq 4.8 is similar to one used by Luther and co-workers to fit KCSI data.29,64
The
fitting results are shown in Figure 4.10b and yield = 1190 cm-1
and Y = 1.3. KCSI
studies have been performed by Luther and co-workers for a number of collision pairs,
but pyrazine(E)/CO2 is not among the systems studied. However, they do report that for
azulene(E)/CO2 collisions at E = 19776 cm-1
, = 294 cm-1
and Y = 0.80.29
For
azulene(E)/Ar collisions, they found that = 116 cm-1
and Y = 0.65. They also report
that for pyrazine(E)/Ar collisions at E = 38000 cm-1
, = 258 cm-1
, and Y = 0.80.64
From
these results we estimate that ∼ 650 cm-1
for pyrazine(E)/CO2 collisions.
It is informative to contrast the values for P(ΔE) with those based on IRF and
KCSI measurements. The P(ΔE) curve is fit reasonably well by both of the model
distributions shown above. The width of P(ΔE) based on either fitting method is
noticeably broader than the width reported by the IRF study and the estimated width from

- 104 -
P(
E),
1/c
m-1
0
2e-4
4e-4
6e-4
0 1000 2000 3000 4000
Re
sid
ua
ls
-1e-4
-5e-5
0
5e-5
(E)=1042 cm-1
(a)P
( E
), 1
/cm
-1
0
2e-4
4e-4
6e-4
E, cm-1
0 1000 2000 3000 4000
Re
sid
ua
ls
-2e-5
-1e-5
0
1e-5
2e-5
(E) = 1190 cm-1
Y = 1.3
(b)
Figure 4.10 (a) A single exponential fit (in black) of the P(ΔE) curve (in blue) for positive
ΔE values that correspond to energy loss from pyrazine(E). (b) A parameterized
monoexponential fit (in black) of the P(ΔE) curve (in blue) based on the fitting approach
taken by Luther and co-workers (Ref. 68 and 120), as described in the text.

- 105 -
KCSI data. The widths from the fit should be considered lower limits since P(ΔE) does
not include ΔErot for pyrazine(E). The values from fitting to our data are nearly a
factor of 2 larger than the estimated KCSI value and a factor of 3 larger than the IRF
results. Values of from IRF studies are often smaller than values from KCSI
experiments. Data from IRF studies are sensitive to calibration of the IR signals, and
Luther has suggested that the difference in their results is caused by relatively small
errors in the IR calibration.64
It is not surprising that P(ΔE) is broader than P(E′,E). This feature highlights an
important difference between nascent energy transfer distributions from transient IR
absorption measurements and those that result from multiple, sequential collisions in
KCSI and IRF studies. A P(ΔE) profile based on nascent energy profiles of collision
products describes just the first step in a collisional cascade that eventually brings highly
excited molecules into thermal equilibrium. On the other hand, multicollision
measurements monitor energy loss from hot donor molecules as they not only undergo
collisions with molecules at 300 K but also interact with molecules containing additional
rotational and translational energy obtained by prior collisions. From the two types of
measurements, a clear picture emerges. The first set of collisions leads to a broad
distribution of product states as donor molecules lose relatively large chunks of
vibrational energy. Then the energy transfer distribution narrows as subsequent
collisions continue to dissipate the vibrational energy of the highly excited molecules.
The narrowing of the distribution results in part from the reduced vibrational energy of
the hot donor molecules as they are quenched. Additional narrowing comes from the
smaller energy gaps that are involeved in the rotation-to-rotation energy transfer that

- 106 -
occurs in the collisional cascade.
It is worth noting that substantial rotational energy gain in highly excited pyrazine
molecules has been seen in trajectory studies of CO2 and this behavior is likely to be a
general phenomenon for relatively stiff bath molecules such as CO2. The situation is
much different for floppy bath molecules, such as propane and aromatic molecules.
Simulations by Luther,64
Oref,147-149
and others150,151
indicate that quenching collisions
with floppier bath species are dominated by vibration-to-vibration energy transfer and
that the VRT pathway is almost negligible.
4.5 Conclusions
This Chapter describes studies on the complete energy transfer profiles for
quenching collisions between highly vibrationally excited pyrazine molecules ( = 266
nm) and CO2 measured using high-resolution transient IR spectroscopy. By measuring
the time dependence of nascent changes for population appearance and depletion, the
branching ratio for inelastic collisions is quantified. The experimental results indicate
that 85% of pyrazine(E)/CO2 collisions involve VRT energy transfer and that, within
this pathway, two distinct rotational populations exist. 78% of VRT collisions are weak
collisions that are elastic or nearly inelastic and only impart minor changes in rotational
angular momentum to CO2. The remaining 22% of VRT collisions are strong collisions
that impart large changes in CO2 angular momentum. Nascent recoil velocity
measurements establish the impulsive nature of the quenching collisions, even for small
values of CO2 rotation. Measurements of this type lay the groundwork for the
development of future models to describe molecular collisions and the exchange of
energy.

- 107 -
Chapter 5: Internal Energy Effects on Full Energy Transfer
Distribution for CO2 through Collisions with Highly Vibrationally
Excited Pyrazine(E = 32700 and 37900 cm-1
)
5.1 Introduction
This Chapter addresses the question of how collisional quenching is affected by
the internal energy of a highly excited donor molecule. The full outcome of collisions
between highly vibrationally excited pyrazine(E = 32700 cm-1
) with CO2 are reported in
this Chapter. The effect of internal energy on the collision dynamics is explored by
comparing the energy transfer dynamics of CO2/pyrazine(E) collisions where E = 32700
cm-1
or 37900 cm-1
(Chapter 4).
Techniques such as UV absorption (UVA),48,152-155
IR fluorescence (IRF),156-158
kinetically controlled selective ionization (KCSI)29,64-66,68,159
and a crossed-beam time-
sliced velocity map ion imaging160-163
have been used to study energy-dependent effects.
Using the UVA technique, Troe and co-workers found that the average transfer energy
E is proportional to the internal energy of excited molecules. They also found that the
energy dependence of E decreases with increasing excitation energy. Using the IFR
method, Barker and co-workers found that E depends strongly on internal energy of
excited molecules and there is a near-linear correlation between E and E at low
internal energy (E < 35000 cm-1
). Luther and co-workers observed in KCSI studies that
E is nearly directly proportional to the internal energy of the excited donors at E =
30000 cm-1
and less. On the other hand, the molecular beam results of Ni and co-workers
suggest that energy transfer probabilities and total collision cross sections are

- 108 -
independent of the internal energy of the hot donor molecules. The discrepancies among
these results illustrate the challenges associated with characterizing the collision behavior
of high energy molecules.
Using high-resolution transient IR absorption spectroscopy, our group has
previously studied the energy-dependent behavior of strong collisions of CO2 with
pyrazine(E)77
and pyridine(E)85
where the initial energy was varied by up to 25%. This
work measured the appearance of the J = 6080 states of CO2. These studies showed that
for collisions of pyrazine(E) and pyridine(E) with CO2, the amount of energy transferred
via VRT collisions does not change much for different internal energies. However, for
these collision systems the state-resolved energy transfer rate constants increase with
increasing internal energy of the donors.
This Chapter reports the outcome of weak collisions for the CO2 low states (J =
254) through collisions with vibrationally hot pyrazine(E = 32700 cm-1
) using high-
resolution transient IR absorption spectroscopy. The full distribution for E = 32700 cm-1
is obtained by combining low-J data with the previously reported high-J data.77
The
results are compared with the results at E = 37900 cm-1
that were presented in Chapter 4.
For the two different donor internal energies, our results show that the translational
energy distributions are roughly independent of the CO2 rotational energy for low J states,
but increase sharply for higher J states. Our results show that the CO2 energy gain
profiles are affected by the pyrazine energy. The translational energy of the scattered
molecules increases as a function of pyrazine energy. CO2 gains of approximately twice
the amount of translational energy from pyrazine(E = 37900 cm-1
) as it does from
pyrazine(E = 32700 cm-1
). The rotational distributions of the scattered CO2 are double-

- 109 -
exponential for both donor energies, but include larger J values at the higher donor
energy. The full energy transfer probability distribution and average transfer energy
during a single pyrazine(E)/CO2 collision with two different pyrazine internal energies
are compared.
5.2 Experimental Methods
This Chapter reports the collision dynamics for vibrationally excited pyrazine(E =
32700 cm-1
) with CO2 by measuring the population changes in CO2 low-J states (J =
254) using the same approach as described in Chapter 4.
Pyrazine(Aldrich, 99%) was degassed by several freeze-pump-thaw cycles.
Pyrazine molecules in the gas-phase were excited by at = 308.8 nm with the doubled
output of a Nd:YAG-pumped dye laser that uses the dye Rhodamine 640. The intensity
of the 308.8 nm laser beam was kept below 4.6 MW/cm2 in order to prevent multiphoton
absorption by the pyrazine and to ensure that <15% of the pyrazine molecules are excited.
Tunable single cavity mode IR light at ~ 2.7 m from a F-center laser was used
to probe the population changes of scattered CO2 (Matheson Tri-gas, 99.995% purity)
molecules from collisions with vibrationally excited pyrazine. The collimated,
overlapping IR and UV beams were propagated collinearly through a 3 m collision cell.
A 1:1 mixture gas of pyrazine and CO2 with a total pressure ~ 20 mTorr flowed through
the cell. The populations of specific CO2 states were measured using transient IR
absorption at t = 1 s after UV pulse in order to obtain nascent information resulting from
single collisions of pyrazine(E) and CO2.

- 110 -
5.3 Results
5.3.1 Transient IR Absorption Measurement of CO2 (0000) State
Transient IR absorption signals for individual CO2 rotational states were collected
immediately following the UV pulse. Two types of IR transient absorption signals for
CO2 (J = 26) from collisions with pyrazine(E = 32700 cm-1
) are shown in Figure 5.1:
negative-going depletion signals are observed at line center of the IR transition (Figure
5.1a) and positive-going appearance signals are observed in the Doppler broadened wings
(Figure 5.1b). For CO2 low-J states (J < 38), the thermal populations of CO2 are large
enough to be observed prior to collisions with pyrazine(E = 32700 cm-1
) and the signals
at 0 show a decrease in the IR absorption, corresponding to a net flow of CO2 molecules
out of individual J-states due to collisions with pyrazine(E). The depletion process for an
initial J-state is shown in Eq 5.1.
Pyrazine E +CO2 0000, J
kdep Pyrazine E E +CO2 0
0 , J (5.1)
The appearance of CO2 population due to collisions in Eq 5.2:
Pyrazine E + CO2(300 K) kappJ
Pyrazine E E + CO2(0000, J) (5.2)
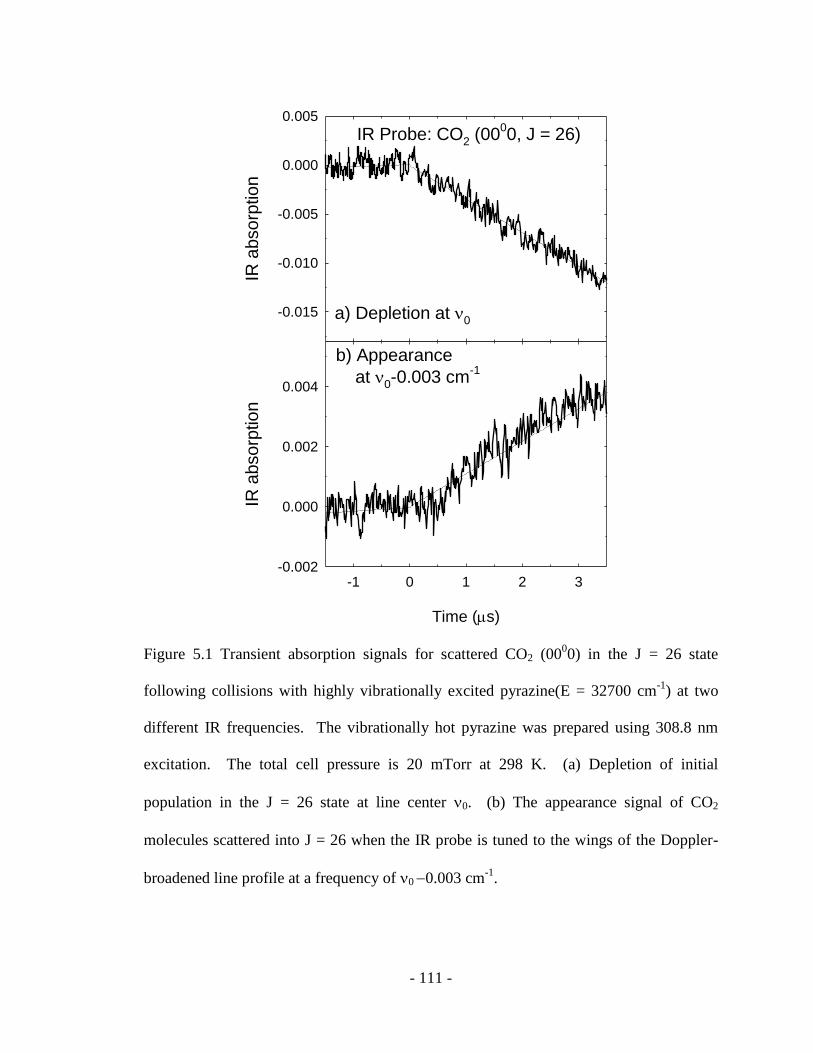
- 111 -
IR a
bsorp
tion
-0.015
-0.010
-0.005
0.000
0.005
IR Probe: CO2 (0000, J = 26)
a) Depletion at 0
Time (s)
-1 0 1 2 3
IR a
bsorp
tion
-0.002
0.000
0.002
0.004
b) Appearance
at 0-0.003 cm-1
Figure 5.1 Transient absorption signals for scattered CO2 (0000) in the J = 26 state
following collisions with highly vibrationally excited pyrazine(E = 32700 cm-1
) at two
different IR frequencies. The vibrationally hot pyrazine was prepared using 308.8 nm
excitation. The total cell pressure is 20 mTorr at 298 K. (a) Depletion of initial
population in the J = 26 state at line center 0. (b) The appearance signal of CO2
molecules scattered into J = 26 when the IR probe is tuned to the wings of the Doppler-
broadened line profile at a frequency of 0 0.003 cm-1
.

- 112 -
States with J > 38 have negligible population at 300 K, so these states only have
appearance signals.
Doppler-broadened transient absorption profiles were measured at t = 1 s
following collisions with vibrationally hot pyrazine, as shown in Figure 5.2. The grey
circles in Figure 5.2 are the IR absorption signal at t = 1 s for CO2 (J = 26). The
transient absorption profile was fitted using a double-Gaussian function as shown in Eq
5.3. The fit results are shown as a solid line.
F ν =Iappexp 4ln2 νν0
Δνapp 2
Idepexp 4ln2 νν0
Δνdep 2
+ F0 (5.3)
In Eq 5.3, Iapp and app are the intensity and full width at half-maximum (FWHM)
describing the appearance population. The depletion process also has intensity Idep and a
linewidth dep. F0 is a minor base line correction that adjusts for instrumental noise, and
0 is the transition line center.
Figure 5.2 shows the results of the double-Gaussian fit as the black solid line. In
Figure 5.3, the red and blue curves are the appearance and depletion components,
respectively, based on the fitting results. Tapp and Tdep are the lab-frame translational
temperatures for the appearance and depletion processes calculated from the linewidth
parameters app and dep. The transient absorption profiles for CO2 states with J > 38
are fitted by a single-Gaussian function that results from setting Idep = 0 in Eq 5.3.

- 113 -
Wavenumber from line center, cm-1
-0.02 -0.01 0.00 0.01 0.02
Fra
ctional IR
absorp
tion
-0.002
-0.001
0.000
0.001
CO2 (0000, J = 26)
Figure 5.2 The transient absorption line shape for CO2 (0000) J = 26 resulting from
collisions with highly vibrationally excited pyrazine(E = 32700 cm-1
). The circles are
measured at t = 1 μs after the UV pulse. The solid curve is the result of fitting a double-
Gaussian function to the data.

- 114 -
Wavenumber from the line center, cm-1
-0.02 -0.01 0.00 0.01 0.02
IR a
bsorp
tion
-0.008
-0.006
-0.004
-0.002
0.000
0.002
0.004
0.006 CO2(00
00, J = 26)
appearance
depletionTdep = 290 K
Tapp = 430 K
Idep
Iapp
Figure 5.3 Transient absorption line profile for the J = 26 rotational state of CO2 (0000).
Circles are transient IR absorption data and the black line is a double-Gaussian fit. The
double-Gaussian parameters separate appearance process (the red line) and depletion
process (the blue line) are from the Double-Gaussian fitting parameters. The appearance
curve yields a FWHM linewidth of app = 0.0078 0.001 cm-1
and Tapp(lab) = 370 70
K. For depletion dep = 0.0068 ± 0.001 cm-1
and Tdep,lab = 290 ± 60 K.

- 115 -
5.3.2 Appearance Profile for CO2 High-J States (J = 5678)
The work reported in this Chapter used = 308.8 nm as an excitation source
because this wavelength is at the peak of the wavelength range of dye laser output.
Previously the Mullin group investigated the strong collisions of pyrazine(E) with CO2 by
measuring the appearance profiles for high-J states of CO2 (J = 5678) at different UV
weavelengths ( = 302, 306.5, 310.1, 317.9, and 323.9 nm) as shown in Figure 5.4.76
The
previous study did not measure the collision dynamics exactly at = 308.8 nm, so the
scattering results at this wavelength are estimated based on the previous results.
Figure 5.4a shows the J-dependent FWHM linewidths app for a number of CO2
states (J = 5678) as a function of UV wavelength for = 286 to 323.9 nm. The values
of app for J = 5678 at = 308.8 nm (black points) are established based on a linear fit
to the data. The estimated linewidths app translational temperatures Tapp and Trel at =
308.8 nm are listed in Table 5.1 for CO2 J = 56, 62, 68 and 72.
Figure 5.4b shows that the rotational energy distributions of the high-J scattered
CO2 molecules are independent pyrazine internal energy for = 302323.9 nm. We
estimate that Trot = 918 100 K for CO2 J = 5678 at = 308.8 nm. Figure 5.4c shows
appearance rate constants J
appk for 3 high-J states of CO2 as a function of UV wavelengths.
The J
appk values for = 308.8 nm are estimated from fitting the data to linear functions.
To combine the low and high J data sets, we repeated measurements of three
high-J states (J = 7074) that overlapped with the previous measurements. Figure 5.5 is a
semilog plot of the J = 7074 measurements and the estimated high J results at 308.8 nm
from the previous study. The rotational distribution of scattered CO2 (J = 7074) has a

- 116 -
CO
2 (
00
00
) T
rot,
K
600
800
1000
1200308.8 nm
ap
pcm
-1
0.006
0.009
0.012
Pyrazine () + CO2
b)
J = 56
J = 78
J = 68
UV wavelength, nm
300 305 310 315 320 325
kJ
ap
p,
10
-13 c
m3
mo
lecu
le-1
s-1
5
10
15
20
J=56
J=68
J=78
c)
a)
Figure 5.4 Energy transfer data for CO2 (J = 56–78) that result from collisions with hot
pyrazine excited at different UV wavelengths. Data for = 308.8 nm (dark symbols) are
estimated from previous wavelength-dependent data (open symbols).

- 117 -
Table 5.1 State-specific nascent Doppler-broadened linewidths, translational
temperatures and average translational energy gain for appearance of CO2 (0000, J) at t =
1 s following collisions with vibrationally excited pyrazine(E = 32700 cm-1
).
CO2 J 0, cm-1a
app, cm-1b
Tapp, Kc Trel, K
d Erel
e
2 3717.085 0.0080 400 80 460 90 169
8 3721.522 0.0072 320 70 330 70 34
22 3730.989 0.0071 310 70 320 70 23
26 3733.468 0.0078 370 70 410 80 117
36 3739.232
0.0088 480 90 580 100 294
38 3740.311
0.0098 600 100 760 110 482
44 3743.404
0.0105 680 100 890 120 617
52 3747.195
0.0096 560 90 710 110 430
54 3748.084
0.0102 640 1000 820 120 545
56f 2296.056 0.0057 527 131 652 162 370
62f 2289.248 0.0071 816 163 1100 220 837
68f 2282.227 0.0084 1164 196 1640 276 1400
78f 2270.050 0.0110 2009 259 2950 380 2767
a0 is the IR transition frequency of CO2 molecule.
bFull width at half-maximum (FWHM) linewidths app in cm
-1 for appearance of CO2
rotational states at 1 s through highly vibrationally excited pyrazine(E = 32700 cm-1
).
The uncertainty in linewidths obs is 0.001 cm-1
.

- 118 -
cThe lab-frame translational temperatures Ttrans,lab (K) for CO2 rotational states is
determined using Ttrans,lab = mc2 8kBln2 νapp ν0 2 , where m is the mass of CO2, c is
the speed of light, kB is Boltzmann’s constant, 0 is the IR transition frequency, and app
is the nascent Doppler broadened line width.
dThe center-of-mass frame translational temperature, Trel (K), for appearance of scattered
CO2 through collisions with excited pyrazine(E = 32700 cm-1
) is obtained from the
equation: Trel = Ttrans,lab+ Ttrans,labT0 mCO2m , where mCO2
and m
are the mass of CO2 and pyrazine molecules respectively; T0 = 298 K.
e Erel in cm
-1 is the average change in translational energy of pyrazine(E = 32700 cm
-
1)/CO2 system, which is calculated by ΔErel =
32 kB TrelT0 , where kB is the
Boltzmann constant and T0 = 298 K.
fEstimated values for CO2 high-J states from the previous paper(Ref. 77) are based on
Figure 5.4.

- 119 -
CO2 E
rot, cm
-1
1200 1600 2000 2400 2800
ln(p
op
/g)
16
17
18
19
20
70
74
Trot
= 845 K
(current data)
Trot
= 918 K
(previous data)
Figure 5.5 The current and previous data for scattered CO2 molecules at high-J states
after collisions with excited pyrazine are compared. Within the error, the rotational
distribution of current data (Trot = 845 K) is in agreement with the previous results (Trot =
918 ± 100 K). The absolute populations for CO2 J = 7274 in this work are larger than
the values for the same states in previous study.77

- 120 -
temperature of Trot = 845 K, which is in good agreement with the previous data.
However, the current results yield populations that are larger by a factor of 2 than in the
previous study. This result indicates that the rate constants kappJ
are a factor of two larger
than those measured previously. A number of factors may account for this difference,
including poorly defined beam overlap profiles, slightly divergent UV and/or IR beams,
and errors in the “pressure” reading of highly excited donors and CO2. We note that the
current study was performed using a new transient IR spectrometer with a number of
improvements that should yield more accurate absolute population results. We have
scaled the previous distribution to our current results for the J = 7074 states.
5.3.3 Translational and Rotational Energy Gain of Scattered CO2 (J = 278)
Translational energy gain of CO2 (0000) from collisions with pyrazine(E = 32700
cm-1
) was obtained by measuring transient absorption line profiles for individual CO2
states. The appearance linewidths app for scattered CO2 (J = 254) were obtained by
fitting the double-Gaussian function in Eq 5.3 to transient line profiles. The lab-frame
translational temperatures Tapp for appearance of scattered CO2 molecules and the center-
of-mass translational temperatures Trel for pyrazine(E)/CO2 collisions were determined
based on app measurements. The values of app, Tapp and Trel for CO2 (J = 2–54) are
listed in Table 5.1, along with data for J = 5678.
The upper plot of Figure 5.6 shows the relative translational temperatures Trel
associated with CO2 J-states (278) after single collisions with pyrazine at E =37900 cm-1
(circles) and E = 32700 cm-1
(triangles). At both energies, the amount of translational
energy in the products has a similar J-dependence. For low-J states (J < 36) of CO2, the
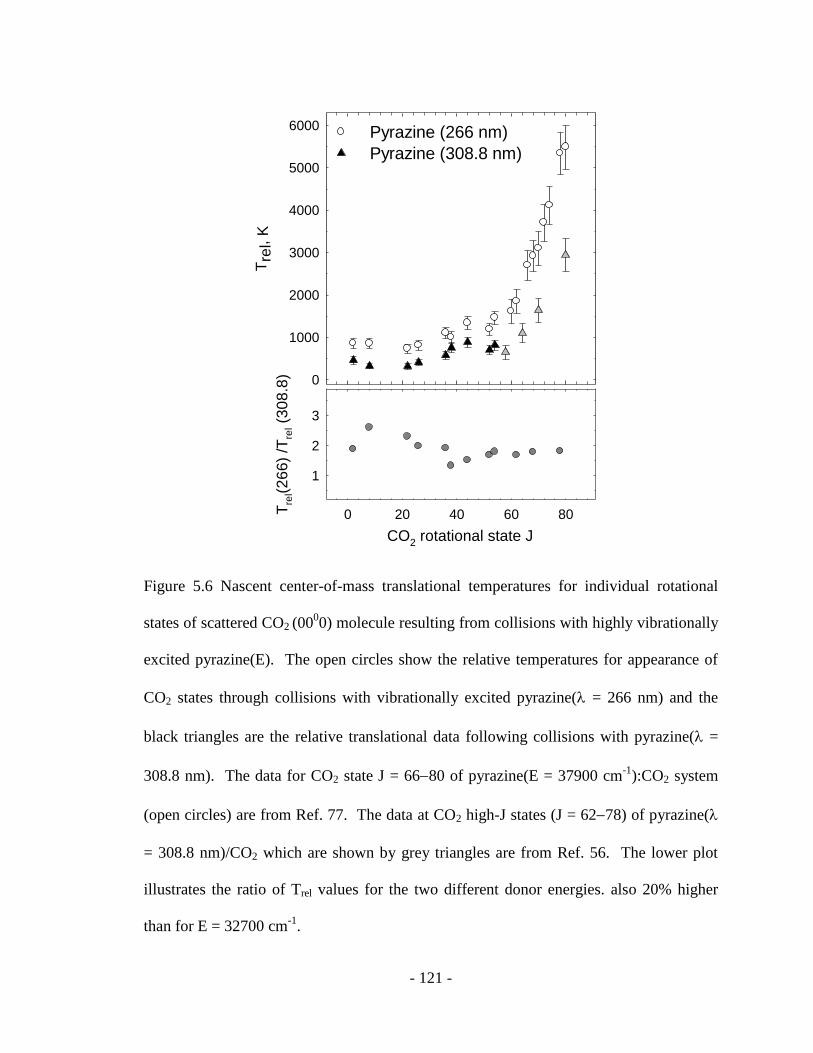
- 121 -
Tre
l, K
0
1000
2000
3000
4000
5000
6000 Pyrazine (266 nm)
Pyrazine (308.8 nm)
CO2 rotational state J
0 20 40 60 80Tre
l(2
66
) /T
rel (
30
8.8
)
1
2
3
Figure 5.6 Nascent center-of-mass translational temperatures for individual rotational
states of scattered CO2 (0000) molecule resulting from collisions with highly vibrationally
excited pyrazine(E). The open circles show the relative temperatures for appearance of
CO2 states through collisions with vibrationally excited pyrazine( = 266 nm) and the
black triangles are the relative translational data following collisions with pyrazine( =
308.8 nm). The data for CO2 state J = 6680 of pyrazine(E = 37900 cm-1
):CO2 system
(open circles) are from Ref. 77. The data at CO2 high-J states (J = 6278) of pyrazine(
= 308.8 nm)/CO2 which are shown by grey triangles are from Ref. 56. The lower plot
illustrates the ratio of Trel values for the two different donor energies. also 20% higher
than for E = 32700 cm-1
.

- 122 -
pyrazine/CO2 pair with two energies has low Trel values. The values of Trel at high-J
states of CO2 increase sharply as a function of J. The amount of translational energy gain
of CO2 is different at the two pyrazine energies, as shown in the lower plot in Figure 5.6,
where the ratio of Trel values is roughly a factor of 2 for the range J = 278. Thus, a 14%
increase in donor vibrational energy doubles the translational energy of the collision
products.
The nascent rotational distribution of scattered CO2 molecules following
collisions with pyrazine(E) where E = 32700 cm-1
is shown in Figure 5.7. The rotational
distribution of scattered CO2 is biexponential. The distribution has two sub-distributions
that cross near Erot = 1100 100 cm-1
. The rotational temperature for the low rotational
states is Trot = 359 50 K. For CO2 Erot > 1100 cm-1
, the distribution for scattered CO2 is
characterized by Trot = 918 100 K.
The CO2 rotational distribution for pyrazine/CO2 at E = 37900 cm-1
also showed
biexponential behavior, as discussed in Chapter 4. In that case, the two individual
distributions apparently cross at ~ 1100 cm-1
. The low CO2 rotational states have Trot =
439 K for E = 37900 cm-1
which is 20% higher than the rotational temperature for E =
32700 cm-1
. The high CO2 rotational states have Trot = 1160 K, also 20% higher than for
E = 32700 cm-1
.

- 123 -
CO2 E
rot, cm
-1
0 500 1000 1500 2000 2500
ln(P
op
/g)
14
16
18
20
22
24
26
Pyrazine (308.8 nm)
Trot=359 K
Trot = 918 K
Figure 5.7 Nascent rotational distribution of scattered CO2 (0000) following collisions
with vibrationally excited pyrazine( = 308.8 nm). The current experimental data for
CO2 (J = 274) are shown as red circles. The open circles are based on previous
measurements for J = 56–80.56
The distribution for the low-J states is characterized by
Trot = 359 40 K. For high-J states, Trot = 918 90 K.
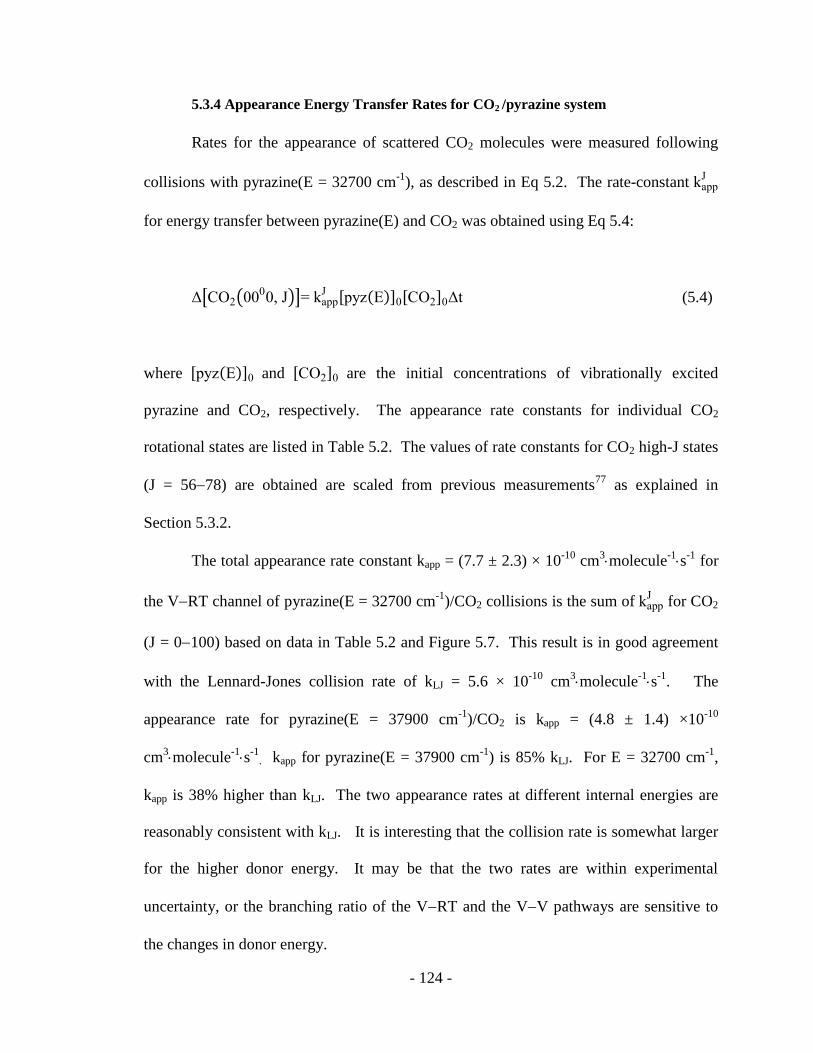
- 124 -
5.3.4 Appearance Energy Transfer Rates for CO2 /pyrazine system
Rates for the appearance of scattered CO2 molecules were measured following
collisions with pyrazine(E = 32700 cm-1
), as described in Eq 5.2. The rate-constant kappJ
for energy transfer between pyrazine(E) and CO2 was obtained using Eq 5.4:
Δ CO2 0000, J = kapp
J pyz E 0 CO2 0Δt (5.4)
where pyz E 0 and CO2 0 are the initial concentrations of vibrationally excited
pyrazine and CO2, respectively. The appearance rate constants for individual CO2
rotational states are listed in Table 5.2. The values of rate constants for CO2 high-J states
(J = 5678) are obtained are scaled from previous measurements77
as explained in
Section 5.3.2.
The total appearance rate constant kapp = (7.7 ± 2.3) × 10-10
cm3molecule
-1s
-1 for
the VRT channel of pyrazine(E = 32700 cm-1
)/CO2 collisions is the sum of kappJ
for CO2
(J = 0100) based on data in Table 5.2 and Figure 5.7. This result is in good agreement
with the Lennard-Jones collision rate of kLJ = 5.6 × 10⁻¹⁰
cm3molecule
-1s
-1. The
appearance rate for pyrazine(E = 37900 cm-1
)/CO2 is kapp = (4.8 ± 1.4) ×10-10
cm3molecule
-1s
-1. kapp for pyrazine(E = 37900 cm
-1) is 85% kLJ. For E = 32700 cm
-1,
kapp is 38% higher than kLJ. The two appearance rates at different internal energies are
reasonably consistent with kLJ. It is interesting that the collision rate is somewhat larger
for the higher donor energy. It may be that the two rates are within experimental
uncertainty, or the branching ratio of the VRT and the VV pathways are sensitive to
the changes in donor energy.
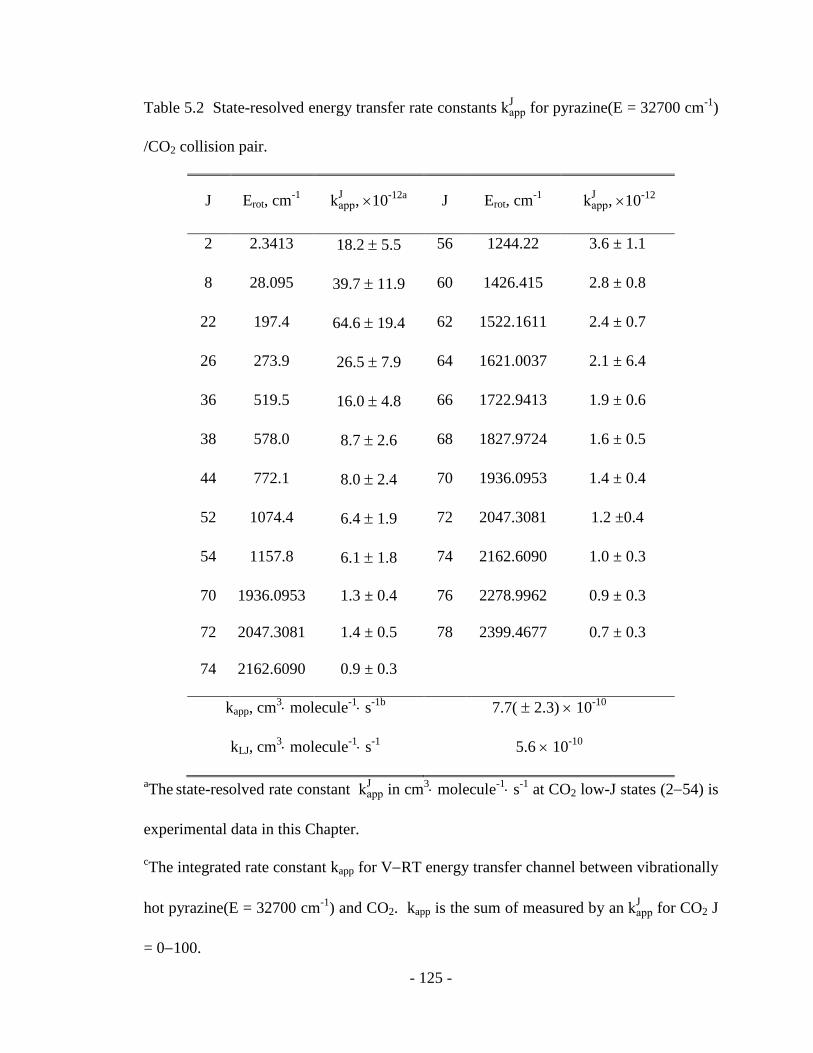
- 125 -
Table 5.2 State-resolved energy transfer rate constants kappJ
for pyrazine(E = 32700 cm-1
)
/CO2 collision pair.
J Erot, cm-1
kappJ
, 10-12a
J Erot, cm-1
kappJ
, 10-12
2 2.3413 18.2 5.5 56 1244.22 3.6 ± 1.1
8 28.095 39.7 11.9 60 1426.415 2.8 ± 0.8
22 197.4 64.6 19.4 62 1522.1611 2.4 ± 0.7
26 273.9 26.5 7.9 64 1621.0037 2.1 ± 6.4
36 519.5 16.0 4.8 66 1722.9413 1.9 ± 0.6
38 578.0 8.7 2.6 68 1827.9724 1.6 ± 0.5
44 772.1 8.0 2.4 70 1936.0953 1.4 ± 0.4
52 1074.4 6.4 1.9 72 2047.3081 1.2 ±0.4
54 1157.8 6.1 1.8 74 2162.6090 1.0 ± 0.3
70 1936.0953 1.3 ± 0.4 76 2278.9962 0.9 ± 0.3
72 2047.3081 1.4 ± 0.5 78 2399.4677 0.7 ± 0.3
74 2162.6090 0.9 ± 0.3
kapp, cm3 molecule
-1 s
-1b 7.7( 2.3) 10
-10
kLJ, cm3 molecule
-1 s
-1 5.6 10
-10
aThe
state-resolved rate constant kapp
J in cm
3 molecule
-1 s
-1 at CO2 low-J states (254) is
experimental data in this Chapter.
cThe integrated rate constant kapp for VRT energy transfer channel between vibrationally
hot pyrazine(E = 32700 cm-1
) and CO2. kapp is the sum of measured by an kappJ
for CO2 J
= 0100.

- 126 -
5.3.5 Depletion Collision Process
The depletion of population in CO2 (0000, J) due to collisions with pyrazine(E) is
described by Eq 5.1. The state-resolved population changes and velocity distributions
associated with depletion are measured from the Doppler-broadened transient line
profiles of CO2 low-J states at J < 40. The translational temperatures Tdep describing CO2
molecules scattered out of the low J-states are obtained from the linewidths of depletion
curve (Figure 5.4). All values of Tdep for CO2 low J-states are approximately 300 K. The
experimental linewidth data and values of Tdep for CO2 (J = 238) are listed in Table 5.3.
The depletion rate for a given CO2 state is described by Eq 5.5.
ratedep J = d CO2 J
dt = kdepf J CO2 0 pyz E 0 (5.5)
Here f(J) is the fractional population in individual J-states of CO2 at 300K, kdep is the
depletion rate constant, [CO2]0 is the total number density of the CO2 bath gas, and
[pyz(E)]0 is the initial number density of pyrazine(E). To first order, we assume that the
depletion rate constant is J-independent at room temperature.
Table 5.3 lists the depletion rates measured for CO2 low rotational states (J =
238). The average depletion rate of low J-states is kdep = 7.8 4.0 10-10
cm3 molecule-1 s-1 . This result is in good agreement with the depletion rate for
pyrazine(E = 37900 cm-1
), where kdep = 6.0 1.8 10-10
cm3 molecule-1 s-1 . This
result suggests that the collision rate of the pyrazine(E)/CO2 system is independent of the
internal energy in pyrazine.

- 127 -
Table 5.3 Depletion process Doppler-broadened linewidths, translational temperatures
and depletion collision rates.
CO2 J 0, cm-1
dep, cm-1a
Tdep, Kb kdep, × 10
-10 cm
3 molecule
-1 s
-1
2 3717.085 0.0067 280 60 13.3 3.9
8 3721.522 0.0063 250 55 10.6 3.3
22 3730.989 0.0063 250 55 11.3 3.3
26 3733.468 0.0068 290 60 5.5 1.8
36 3739.232
0.0070 300 60 4.7 1.5
38 3740.311
0.0073 340 65 1.6 0.6
kdep , × 10-10
cm3 molecule
-1 s
-1c 7.8 4.0
aFull width at half-maximum (FWHM) linewidths dep for depletion process at CO2 J-
states. The uncertainty of linewidths is reported to 0.001 cm-1
.
bThe depletion lab-frame translational temperatures Tdep,lab in K for CO2 rotational states,
is determined by the equation: Tdep = mc2 8kBln2 ν ν0 2 , where m is the mass of
CO2, c is the speed of light, kB is Boltzmann’s constant, 0 is the IR transition frequency,
and dep is the nascent Doppler broadened line width.
c kdep the average of the rate constants kdep at CO2 low-J states.

- 128 -
5.4 Discussion
This Section considers the effect of the internal energy in pyrazine on the
collision dynamics with CO2 by comparing the VRT energy transfer pathway at E =
32700 and 37900 cm-1
.
5.4.1 Angular Momentum Changes in VRT Energy Transfer
The studies presented in Chapters 3 and 4 illustrated how angular momentum of
bath molecules is correlated with the translational energy of collision products. Here we
consider this for the pyrazine(E = 32700 cm-1
)/CO2 system.
Table 5.4 lists the average changes in CO2 angular momentum Jbath and recoil
velocity vrel determined from the state-resolved translational temperatures Tapp (Table
5.1). The initial rotational state of CO2 bath molecule is taken to be Jbath = 22 at 298 K.
The correlation of vrel and Jbath for CO2 J = 278 at E =32700 cm-1
are shown as
triangles in Figure 5.8. Figure 5.8 shows that vrel is a function of Jbath with smaller
values of Jbath correlating to smaller vrel of CO2 molecules. The smallest vrel is
at Jbath ~ 0. For Jbath > 40 part, vrel values more substantial increases in recoil
velocity changes.
Figure 5.8 illustrates the similar correlations of vrel and Jrel for
pyrazine(E)/CO2 pair at two different internal energies. For both each internal energies of
pyrazine in Figure 5.8, smaller values of Jbath correlate to smaller vrel of CO2
molecules, and smallest vrel is at Jbath ~ 0, but the values of vrel are smaller for
the lower donor energy. The same range of much different at different internal energies.

- 129 -
Table 5.4 Angular momentum and recoil velocities for individual states of CO2 J = 278
through collisions with highly vibrationally excited pyrazine(E = 32700 cm-1
).
Final J State Jbath a vlab
b vrel
c vrel
d
2 -21.9 476 633 121
8 -20.5 426 540 28
22 0.0 419 527 16
26 13.9 458 560 88
36 28.5 521 713 202
38 31.0 583 820 308
44 38.1 621 884 372
52 47.1 563 786 275
54 49.3 602 852 341
56 51.5 546 757 246
62 58.0 680 983 471
68 64.3 812 1200 688
78 74.8 1067 1609 1097
aThe average angular momentum changes Jbath in units of of CO2 through collisions
with vibrationally excited pyrazine. Jbath for CO2 is calculated due to the equation:
Jbath 2= Jbath
2 Jbath 2 . Jbath
is average final angular momentum vector of CO2
bath molecule. The average initial angular momentum vector of CO2 at 300K
is Jbath 22.
bThe average lab-frame velocity vlab in m s
-1 of scattered CO2 at CO2 states (J = 2 – 78)
following collisions with vibrationally excited pyrazine, are determined from
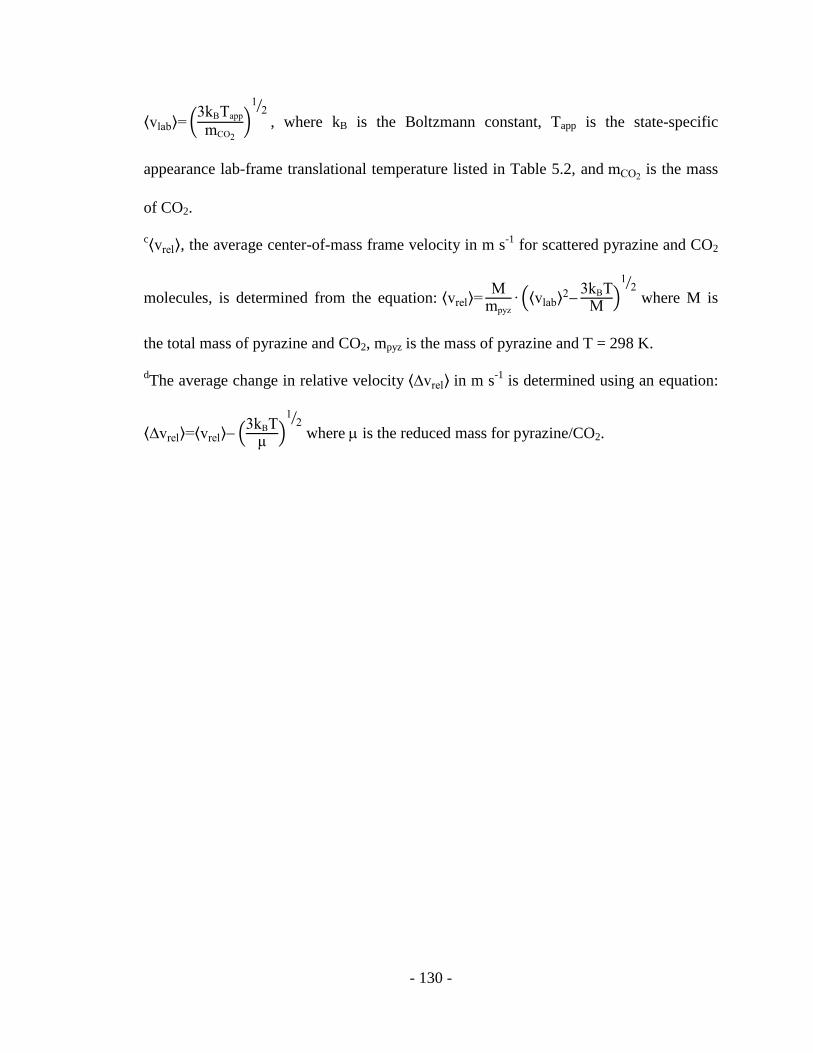
- 130 -
vlab = 3kBTapp
mCO2
12
, where kB is the Boltzmann constant, Tapp is the state-specific
appearance lab-frame translational temperature listed in Table 5.2, and mCO2 is the mass
of CO2.
c vrel , the average center-of-mass frame velocity in m s-1
for scattered pyrazine and CO2
molecules, is determined from the equation: vrel =Mmpyz
vlab 2
3kBTM
12
where M is
the total mass of pyrazine and CO2, mpyz is the mass of pyrazine and T = 298 K.
dThe average change in relative velocity vrel in m s
-1 is determined using an equation:
vrel = vrel 3kBTμ
12
where is the reduced mass for pyrazine/CO2.

- 131 -
<
vre
l>,
m s
-1
0
400
800
1200
1600
pyrazine (266 nm)
pyrazine (308.8 nm)
CO2 <J>
-20 0 20 40 60 80<v
rel>
(26
6)/
<v
rel>
(30
9)
0.0
0.5
1.0
1.5
2.0
Figure 5.8 The upper plot shows the correlation between the average change in angular
momentum Jbath of CO2 molecule and the average change of recoil velocity vrel for
CO2:pyrazine(E) collisions, where E = 32700 cm-1
(grey triangles) and E = 37900 cm-
1(open circles). Data for E = 37900 cm
-1 are from Chapter 4. The open circles in the
lower plot illustrate the ratios of vrel of two internal energies of pyrazine.

- 132 -
For the same J values are observed. For E = 37900 cm-1
, the minimum value vrel ~
300 m s-1
while for E = 32700 cm-1
.
The ratio of the average recoil velocity is shown in the lower plot of Figure 5.8 as
a function of J . In general, the recoil velocities at 266 nm are ~ 1.5 times larger than
at 308.8 nm excitation. By increasing the donor energy by 14%, the recoil velocities
increase by ~ 50%.
5.4.2 Branching Ratio of Weak and Strong Collisions
The rotational distribution of scattered CO2 molecules through collisions with
pyrazine(E = 37900 cm-1
) was analyzed with a two-component model in Chapter 4. This
model describes the population changes in each CO2 rotational state using the sum of two
Boltzmann distributions, as in Eq 5.6.
PopJ= g
J Iaexp
EJ
kBTa + Ibexp
EJ
kBTb (5.6)
Here gJ is the rotational degeneracy, EJ is the rotational energy, Ta and Tb are rotational
temperatures, and Ia and Ib are the intensity parameters. A two-component model is used
to describe the population distribution of scattered CO2 molecules after collisions with
pyrazine(E = 32700 cm-1
) as shown in Figure 5.9a. The grey circles in Figure 5.9a are
the J-specific populations of scattered CO2 from collisions with pyrazine(E = 32700 cm-1
).
The solid line is the nonlinear least squares fitting of Eq 5.6 to the data with no initial
constraints. The results of the fit have small residuals, as shown in Figure 5.9b.

- 133 -
The four fitting parameters Ia, Ib, Ta and Tb are used to describe the two sub-
populations of scattered CO2 molecules, as, shown in Figure 5.10. CO2 low-J rotational
states are described mostly by the cooler distribution with Ta= 214 K while high-J
rotational states are mostly from the hotter population with a rotational temperature of Tb
= 909 K. The cooler distribution corresponds to the outcome of weak collisions that are
elastic or nearly elastic. The cooler population represents 76% of the observed
population. The hotter population results from strong collisions between CO2 and hot
pyrazine and represents 24% of the entire population of scattered CO2. In comparison,
for the pyrazine(E = 37900 cm-1
) /CO2 system, the ratio of cool and hot populations is
78% : 22%. The similar ratios of weak and strong collisions for the two different internal
energies shows that the contributions of strong and weak collisions for the whole
population distribution of scattered CO2 bath molecules are not affected by this change in
donor energy. We do note that the strong component is diminished in strength for the
lower initial energy, as seen in the reduced Tb value at E = 32700 cm-1
. This observation
suggests that as the internal energy in the donor is reduced, Tb will drop as well and
eventually become indistinguishable from Ta. It is likely that some point, the donor
energy will be low enough that a single distribution of scattered molecules will be
observed.
5.4.3 The Full Energy Transfer Distribution P(E)
The state-resolved energy gain data is used to generate an energy transfer
probability distribution function P(E) for the pyrazine(E)/CO2 collision pair at E =
32700 cm-1
. P(E) is generated directly from Doppler-broadened linewidths and energy-
transfer rate constants using the method described by Michaels et al.89
The E includes

- 134 -
CO2 E
rot, cm
-1
0 500 1000 1500 2000 2500
Re
sid
ua
ls
-1
0
1
ln(p
op/g
)
18
20
22
24
Data
Fit
Pyrazine (308.8 nm) + CO2a)
b)
Figure 5.9 (a) A two-component biexponential function fitting curve (Eq 5.6) of the
nascent rotational distribution (grey circles) of scattered CO2 through collisions with
pyrazine(E = 32700 cm-1
); (b) the results of fitting residuals at CO2 rotational states are
shown as the circles.

- 135 -
Ap
pea
ran
ce
Po
pula
tio
n,
mo
lecu
le c
m-3
0
1e+11
2e+11
3e+11
4e+11
5e+11
Cold Population (76%)Ta = 214 K
Observed
Hot Population (24%)Tb = 909 K
Pyrazine (308.8 nm)
Erot, cm-10 1000 2000 3000
0
2e+11
4e+11
6e+11
8e+11
Observed
Pyrazine (266 nm)
Cold Population (78%)Ta = 329 K
Hot Population (22%)Tb = 1241 K
a)
b)
Figure 5.10 Population distributions of scattered CO2 at t = 1 s after weak or strong
collisions with pyrazine(E). (a) Populations of CO2 through collisions with pyrazine(E =
32700 cm-1
). 76% of the observed CO2 populations (open circles) are from the cold
population with Trot = 214 K which is the product of weak collisions. The hot population
with Trot = 909 K from the strong collisions is 24% of the whole observed population. (b)
Strong and weak collisions contribute similar percent populations for pyrazine(E = 37900
cm-1
). However, Trot = 1241 K of hot population is 300 K bigger than E = 32700 cm-1
and Trot = 329 K of cold population for pyrazine(E = 37900 cm-1
) is close to room
temperature.

- 136 -
the change in CO2 rotation energy plus the change in translational energy of pyrazine(E)
and CO2.
The P(E) curves for the two pyrazine energies are shown in Figure 5.11. Figure
5.11a shows P(E) distributions relative to kLJ while Figure 5.11b shows P(E) curves
relative to kapp. 95% of the energy transfer between the pyrazine(E = 32700 cm-1
)/CO2
pair happens at E < 1650 cm-1
. The maximum intensity of P(E) curve is at E ~ 0
which illustrates that the most collisions between hot pyrazine(E = 32700cm-1
) with CO2
elastic are the most probable occurrence.
Figure 5.11 compares two P(E) functions for CO2/pyrazine(E) at E = 32700 cm-1
and 37900 cm-1
. 95% of the energy transfer between the pyrazine(E = 37900 cm-1
) and
CO2 pair happens at E < 3100 cm-1
, which is almost twice as high as for E = 32700 cm-1
.
This result illustrates that CO2 molecules are more likely to gain large amounts of energy
from pyrazine with higher vibrational energy and the probability of weak collision
decreases between CO2 and hot pyrazine with higher internal energy. The work in
Chapter 4 that illustrates the maximum intensity of P(E) curve of pyrazine(E =
37900cm-1
)/CO2 pair is at E ~ 240 cm-1
. Base on this P(E) curve, the average energy
transfer E = 950 cm-1, which is 2 times bigger than the value for E = 32700 cm-1
.
Chapter 4 explains that there are several reasons why P(E) for E = 37900 cm-1
has a
maximum value at E > 0. If we shift E by 240 cm-1
to let the peak intensity of P(E)
occur at E ~ 0, the average energy transfer drops to E = 670 cm-1 which is ~20 %
higher than E = 525 cm-1 for E = 32700 cm-1
.

- 137 -
P(
E),
1/c
m-1
re
lative
to
kL
J
0.0
3.0e-4
6.0e-4
9.0e-4
1.2e-3
1.5e-3
Pyrazine (266 nm)
Pyrazine (308.8 nm)
E, cm-1
0 1000 2000 3000 4000 5000
P(
E),
1/c
m-1
re
lative
to
ka
pp
0.0
3.0e-4
6.0e-4
9.0e-4
1.2e-3
Pyrazine (308.8 nm)
Pyrazine (266 nm)
Figure 5.11 Energy-dependent full energy transfer probability distribution function P(E)
for pyrazine(E)/CO2. The red solid line is P(E) of E = 32700 cm-1
and the dash line is
the one of E = 37900 cm-1
. Both of the distribution functions are normalized to the
Lennard-Jones collision rate in the upper plot, while they are normalized to the
appearance collision rate in the lower plot.

- 138 -
Barker and co-workers measured the collisional deactivation of pyrazine(E =
24000 cm-1
) with CO2 using the IRF technique.56
They reported that the average energy
E of CO2/pyrazine(E = 24000 cm-1
) is ~ 180 cm-1
. In addition, they found that E is
approximately linearly dependent on the vibrational energy of pyrazine at low internal
energy range (E = 5000 35000 cm-1
) and they proposed a near-linear equation to model
this correlation. If we estimate the average transfer energy using their near-linear
equation for pyrazine(E = 32700 cm-1
), the value of E is ~258 cm-1
which is half of
our result. Given the differences in the experimental approaches, it is encouraging that
the E values are in the same order of magnitude. Luther and co-workers also obtained
the higher average transfer energies than the data of IRF methods for pyrazine(E)/Ar and
pyrazine(E)/Ne pairs at high internal energy (E > 35000 cm-1
).64
For example, at E =
32700 cm-1, Luther’s E value for pyrazine:Ne system is three times bigger than the
result of IRF for the same collision system. For pyrazine/Ar system, the value of E
from the KCSI technique is four times bigger than the result of IRF. Therefore, Barker’s
near-linear model might underestimates by a factor of 2-4.
The Luther group studied the collisional energy transfer from pyrazine with
internal energies 32700 and 37900 cm-1
through collisions with Ar and Ne atoms. For
both collision systems, the ratio of E for pyrazine(E = 32700 cm-1
) is ~ 70% of the
value from pyrazine(E = 37900 cm-1
). This result shows E to have a near-linear
dependence on donor internal energy. The results from KCSI, IRF and high IR resolution
probing all illustrate that the average energy transfer E is sensitive to the internal
energy of highly excited donor molecules and has a near-linear correlation to the internal
energy.

- 139 -
5.5 Conclusions
This Chapter has investigated the effects of internal energy of donor molecules on
collision energy transfer dynamics. The V-RT channel is observed to be the main energy
transfer pathway between CO2 and pyrazine with E= 32700 cm-1
and E = 37900 cm-1
.
CO2 bath molecules are scattered with twice the relative translational energy from
pyrazine (E = 37900 cm-1
) as from pyrazine(E = 32700 cm-1
). Biexponential rotational
distributions of scattered CO2 from collision with the hot pyrazine at both internal
energies are observed. The extent of CO2 rotational energy is reduced for the lower
donor energy. The ratio of the hot/cold populations is independent of internal energy.
Internal energies do not influence the collision rate of pyrazine(E)/CO2 system either.
The full energy transfer distribution P(E) confirms that collisions between molecules of
lower internal energy transfer less energy than do collisions between hotter molecules.
The data showed that the average collision energy E is near-linear dependent on the
internal energy of pyrazine.

- 140 -
Chapter 6: Full Collisional Energy Gain Profiles of CO2(0000)
from Collisions with Highly Vibrationally Excited Molecules: 2-
Methylpyridine, 2,6-Dimethylpyridine and 3,5-Dimethylpyridine
(E ~ 38500 cm-1
)
6.1 Introduction
The ability to measure the full product state distribution from collisions of high
energy molecules opens up exciting new possibilities for understanding the role of
collisional relaxation and chemical reactivity. The work presented in this Chapter
focuses on how the molecular structure of the energy donor affects the energy transfer
dynamics. A series of methylated pyridines are used as energy donors and the full energy
gain profiles in energy-accepting CO2 molecules are measured with high resolution
transient IR absorption. The addition of methyl groups increases the number of
vibrational modes in the donor molecules, adds low frequency modes in the form of
methyl rotors and lowers the average energy per mode when the excitation energy is held
constant. By characterizing the distribution of weak and strong collisions that come from
methylated donors, we gain insight into how different types of molecular motion impact
overall energy transfer profiles.
A number of techniques have been used to study the role of donor methylation in
collisional quenching under multi-collision conditions. Using the IRF technique for
donors with E = 24000 cm-1
, Miller and Barker found that the average energy loss from
toluene (C6H5CH3) is larger than for benzene (C6H6).55,59
In collisions with rare gases,
toluene(E) loses 3-4 times more energy on average per collision than does benzene. In
UVA studies on cycloheptatriennes with E = 41900 cm-1
, Troe and coworkers showed

- 141 -
that average energy transfer values increased as a function of the donor size in collisions
with a given bath gas.47-49,52,152-155,164-167
Previous studies in the Mullin group have used high resolution transient IR
absorption to measure the outcome of strong collisions for a series of highly excited
azabenzenes (pyrazine,77,106
pyridine,85
2-methylpyridine and 2,6-dimethylpyridine86
)
with H2O and CO2 as collision partners. These studies found that the rotational and
translational energy distributions of the scattered bath molecules were substantially
reduced for the methylated donors. For CO2 collisions, only the states with J = 6080
were investigated. To understand more fully how donor methylation impacts the energy
transfer dynamics, the work in this Chapter focuses on the appearance of low-J CO2
states that come primarily from weak collisions.
This Chapter reports the scattering profiles for CO2 (0000) in low-J states (J = 2-
64) that result from weak collisions with highly vibrationally excited methylpyridine
donors: 2-methylpyridine (2MP), 2,6-dimethylpyridine (2,6MP) and 3,5-
dimethylpyridine (3,5MP). The structures of the three methylpyridine molecules are
shown in Figure 6.1. For 2MP and 2,6MP, strong collision data are combined with the
current measurements to generate the full energy transfer profiles for scattered CO2
molecules. The energy transfer profiles for the three methylated donors are compared
and discussed in light of the results presented in Chapters 3-5.

- 142 -
N
N
N
2-methylpyridine
(2MP)
2,6-dimethylpyridine
(2,6MP)
3,5-dimethylpyridine
(3,5MP)
Figure 6.1 The molecular structures of the three methylated pyridine donors.

- 143 -
6.2 Experimental Methods
The work reported in this Chapter was performed using the high-resolution F-
center transient IR absorption spectrometer at = 2.7 m. The three highly vibrationally
excited donor molecules (2MP, 2,6MP and 3,5MP) were prepared with = 266 nm light
from a Nd:YAG laser. To minimize multiphoton absorption, the UV power density was
kept below 4.9 MW/cm2. The fraction of excited donors was lower than 15%. Through
collisions with excited donors, the number densities of scattered CO2 at low states (J = 2-
64) were probed by IR absorption.
The overlapped IR/UV beams passed through a 3 m collision sample cell. A 1:1
mixture of donor and CO2 gases at a total pressure of approximately 20 mTorr flowed
through the cell. The average collision time in these studies was approximately 4s.
The transient IR absorption intensities obtained at t = 1 s ensures that the signals result
from single collisions of CO2 with vibrationally excited donors.
Three donors, 2MP (Aldrich, 98%), 2,6MP (Sigma-Aldrich 99+%) and 3,5MP
(Aldrich, 98+%) were degassed by the freeze-pump-thaw method before use and CO2
(Matheson Tri-gas, 99.995% purity) was used directly.
6.3 Results and Discussion
The V-RT energy transfer dynamics of three highly vibrationally excited
alkylpyridine donors with CO2 are reported here for CO2 rotational states J = 280. The
rotational and translational energy profiles for CO2 are reported. Collision rates and full
energy transfer distributions P(E) are also reported. The effect of donor structure on
collisional quenching is discussed by comparing the results for the methylated donors
with those for pyrazine(E).

- 144 -
6.3.1 Transient IR Absorption of Scattered CO2 (0000) at J= 2-64
For a given CO2 J-state, two processes are responsible for the transient signals
observed through collisions with highly vibrationally excited donors(E) as described in
Chapters 35. Following collisions with vibrationally hot donors, appearance signals
correspond to CO2 molecules scattering into a specific J-sate while depletion signals
show CO2 population leaving the state. Figure 6.2 shows the transient IR absorption for
the CO2 J = 26 state following collisions with the three donors at two different probe
wavelengths. Depletion is seen at the center absorption frequency 0 in the three plots on
the left in Figure 6.2. Appearance on the other hand is seen in the Doppler-broadened
wings, as shown in the right side of Figure 6.2.
CO2 states have appreciable population up to J = 38 and depletion signals are
observed at 0 for J 38. For higher J states, only appearance signals are observed in our
measurements. Figure 6.3 shows Doppler-broadened transient line profiles for CO2 J = 26
at t = 1 s after excitation of the donors: 2MP (circles), 2,6MP (triangles) and 3,5MP
(squares). The black solid curves are the fitting result for the Doppler-broadened line
using a double-Gaussian function (Eq 6.1).
F v =Iappexp -4ln2 ν-ν0
νapp 2
-Idep -4ln2 ν-ν0
Δνdep 2
+F0 (6.1)
Here, Iapp and Idep are the intensities for appearance and depletion at the center frequency
ν0; νapp and νdep are the full widths at half maximum (FWHM) for the appearance and

- 145 -
-0.03
-0.02
-0.01
0.00
0.01
0.000
0.004
0.008
0.012
0.016
a) Depletion at
b) Appearance
at -0.003 cm
-1
Donor: 2MP(E)
Fra
ctio
na
l IR
ab
so
rptio
n
-0.06
-0.04
-0.02
0.00
0.02
0.000
0.008
0.016
0.024 d) Appearance
at -0.003 cm
-1
c) Depletion at
Time, s
-2 0 2 4-0.015
-0.010
-0.005
0.000
Donor: 3,5MP(E)
Time, s
-2 0 2 4-0.01
0.00
0.01
0.02
0.03 f) Appearance
at -0.003 cm
-1
e) Depletion at
Donor: 2,6MP(E)
Figure 6.2 Transient absorption signals for scattered CO2 (0000) in the J = 26 state after
collisions with highly vibrationally excited 2MP (E = 37900 cm-1
), 2,6MP (E = 38500
cm-1
) and 3,5MP (E = 38500 cm-1
) which were prepared by 266 nm. The three plots on
the left show depletion signals at line center 0. The right-hand plots show CO2’s
appearance signals measured at the wings of the Doppler-broadened line profile at a
frequency of 0 0.003 cm-1
.

- 146 -
I/
I 0
-0.006
-0.003
0.000
0.003 2MP(E) + CO2 (0000, J=26)
I/
I 0
-0.008
-0.004
0.000
0.0042,6MP(E) + CO2 (00
00, J=26)
Wavenumber from line center, cm-1-0.02 -0.01 0.00 0.01 0.02
I/
I 0
-0.006
-0.003
0.000
0.003 3,5MP(E) + CO2 (0000, J=26)
a)
b)
c)
Figure 6.3 The transient IR absorption line shape for CO2 (0000) J = 26 at t = 1 µs after
single collisions with three highly vibrationally excited donor molecules: (a) 2MP, (b)
2,6MP and (c) 3,5MP. The solid curves are the double-Gaussian fitting results.

- 147 -
I/
I 0-0.06
-0.03
0.00
0.03
0.06 2MP(E) + CO2 (0000, J=26)
I/
I 0
-0.06
-0.03
0.00
0.03
0.06
2,6MP(E) + CO2 (0000, J=26)
Appearance
Appearance
Depletion
Depletion
Wavenumber from line center, cm-1
-0.02 -0.01 0.00 0.01 0.02
I/
I 0
-0.030
-0.015
0.000
0.015
0.030 3,5MP(E) + CO2 (0000, J=26)
Appearance
Depletion
Figure 6.4 Transient absorption line profile for the J = 26 rotational state of CO2 (0000) at
t = 1 µs following excitation of vibrationally hot 2MP (triangles), 2,6MP (circles) and
3,5MP (squares). The black lines are the double-Gaussian fitting results. Red lines
illustrated the appearance process and blue lines show the depletion process.

- 148 -
depletion. From the intensity and line width parameters, the appearance (in red) and
depletion (in blue) profiles are shown in Figure 6.4.
6.3.2 Translational Excitation of Scattered CO2 (0000) with Three Donor Molecules
The appearance line widths app of the Doppler-broadened transient line profiles
are obtained from the double-Gaussian fitting function Eq 6.1. The values for state-
specific app and the lab-frame and center-of-mass translational temperatures for
individual CO2 states after are listed in Table 6.1.
The full translational energy profiles are plotted in Figure 6.5 for the three donors.
The current results for 2MP and 2,6MP are combined with previous high-J results from
Ref. 56. The translational distributions of CO2 with 2,6MP and 3,5MP are very similar.
For CO2 low J-states (J < 60), the values of Trel are CO2 J-independent and have values at
approximately 500 K. For CO2 high rotational states with J > 60, the values of Trel
increase as a function of the CO2 J-state.
Chapter 4 reported the translational energy profiles collisions of pyrazine(E) with
CO2 when E = 37900 cm-1
. Here the effects of donor methylation are explored by
comparing results for 2MP, 2,6MP and 3,5MP collisions with pyrazine collisions. The
overall trends of J-dependent product translational energies of the four donors are similar.
However, compared to pyrazine collisions, the translational energy profiles from the
methylated donors are much smaller.
The correlation of changes in angular momentum and recoil velocity was
determined for pyrazine(E)-DCl in Chapter 3 and for pyrazine(E)-CO2 in Chapter 4.
Based on the state-specific Tapp values for J = 278, the average changes in CO2 angular
momentum Jbath and recoil velocity vrel for three methylpyridine donors were

- 149 -
Table 6.1 (a) Nascent appearance Doppler-broadened line widths and translational
temperatures for 2MP/CO2 collision pairs.
2MP (E = 38500 cm-1
) + CO2 (0000)
J 0, cm-1
app, cm-1a
Tapp,lab,Kb Trel, K
c
2 3717.0853 0.0087 477 78 561 91
8 3721.5215 0.0087 471 77 553 90
22 3730.9893 0.0080 396 70 443 78
26 3733.4684 0.0085 459 76 535 88
36 3739.2323 0.0088 472 76 554 89
38 3740.3115 0.0081 403 70 452 79
44 3743.4040 0.0097 581 84 715 104
54 3748.08398 0.0100 613 87 762 108
58 3659.40288 0.0093 553 84 673 102
aState-resolved full width at half-maximum (FWHM) line widths, app, for appearance
process of CO2 at 1 s after collisions with highly vibrationally excited 2MP, 2,6MP or
3,5MP. The uncertainty of app is 0.001 cm-1
.
bThe lab-frame translational temperatures Ttrans,lab for CO2 rotational states are calculated
from the formula Ttrans,lab= mc2 8Rln2 Δνobs ν0 2, where m is the mass of CO2, c is
the speed of light, R is the gas constant and 0 is the center frequency of the absorption
line.
cThe center of mass translational temperature Trel in K for an isotropic distribution of
scattered CO2 molecules is obtained from the equation:

- 150 -
Trel = Ttrans,lab+ Ttrans,labT0 mCO2mdonor , where T0 = 298 K and three donors are
2MP, 2,6MP and 3,5MP.

- 151 -
(b) Nascent appearance Doppler-broadened line widths and translational temperatures for
2,6MP/CO2 collision pairs.
2,6MP (E = 38500 cm-1
) + CO2 (0000)
J 0, cm-1
app, cm-1a
Tapp,lab,Kb Trel, K
c
2 3717.0853 0.0086 446 75 506 85
8 3721.5215 0.0079 387 69 424 76
22 3730.9893 0.0082 410 71 456 79
26 3733.4684 0.0085 444 74 504 84
36 3739.2323 0.0090 494 78 574 91
38 3740.3115 0.0094 546 82 649 97
44 3743.4040 0.0091 510 79 598 93
52 3747.1946 0.0097 577 84 691 101
54 3748.08398 0.0093 537 81 635 96
58 3659.40288 0.0102 671 93 824 114

- 152 -
(c) Nascent appearance Doppler-broadened line widths and translational temperatures for
3,5MP/CO2 collision pairs.
3,5MP (E = 38500 cm-1
) + CO2 (0000)
J 0, cm-1
app, cm-1a
Tapp,lab,Kb Trel, K
c
2 3717.0853 0.0074 340 ± 65 358 ± 69
8 3721.5215 0.0078 381 ± 69 415 ± 75
22 3730.9893 0.0087 466 ± 76 535 ± 87
26 3733.4684 0.0084 442 ± 74 500 ± 84
36 3739.2323 0.0104 663 ± 90 812 ± 111
38 3740.3115 0.0093 529 ± 81 623 ± 95
44 3743.4040 0.0086 455 ± 74 519 ± 85
52 3747.1946 0.0097 577 ± 84 692 ± 101
66 2387.2578 0.0072 871 ± 162 983 ± 193
70 2388.64 0.0076 783 ± 154 1106 ± 206

- 153 -
Tre
l ,
K0
500
1000
1500
2000
a) 2MP(E)+CO2
Tre
l ,K
0
500
1000
1500
2000
b) 2,6MP(E)+CO2
CO2 Rotational State
0 20 40 60 80
Tre
l ,K
0
500
1000
1500
2000c) 3,5MP(E)+CO2
Figure 6.5 Nascent center-of-mass translational temperatures for individual rotational
states of scattered CO2 (0000) molecule resulting from collisions with highly vibrationally
excited 2MP (triangles), 2,6MP (circles) and 3,5MP (squares). The grey symbols are
state-resolved translational temperatures at CO2 high-J states from the previous paper
(Ref. 86).

- 154 -
determined and are listed in Table 6.2. The initial average rotational state for CO2 at 300
K is Jini = 22. The correlation of Δvrel and ΔJbath for CO2 with four donors (pyrazine,
2MP, 2,6MP and 3,5MP) is shown in Figure 6.6. For each donor, Figure 6.6 shows that
vrel is a function of Jbath for the J = 280 states of CO2. The smallest values of
vrel are approximately 100 ms-1
for three alkylpyridine-CO2 pairs which is
approximately 200 ms-1
smaller than the value of pyrazine/CO2. For ΔJbath > 40, larger
changes in recoil velocity vrel are seen for each CO2/donor system. The values of
Δvrel for CO2/pyrazine are larger than for the methylated pyridine donors. The
correlation of ΔJbath and Δ rel is similar for the methylpyridine/CO2 systems.
Methylation slightly reduces the initial velocity of collision pairs which could lead to
collisions that are less impulsive and recoil velocities that are smaller for a given J state.
It is likely however that the most important source of the reduction in recoil velocity is
that addition of methyl groups increases the low-frequency motions of the high energy
molecules and pulls energy out of the high frequency modes.
6.3.3 Rotational Energy Gain of Scattered CO2 (0000)
The rotational distributions of scattered CO2 molecules (J = 280) are reported
here from collisions with 2MP(E), 2,6MP(E) and 3,5MP(E). Semilog plots of transient
populations are shown in Figure 6.7. Two models are used for fitting to the data. A
single-exponential population model is fit to the data in the left-hand plots. The values of
rotational temperatures for three distributions are Trot=476 K for 2MP, Trot = 472 K for
2,6MP and Trot = 417 K for 3,5MP. There is evidence, particularly in the 2MP and
2,6MP data, that the rotational distributions have two components, one for the low-J data
and a hotter distribution for the high-J data. The plots on the right side of Figure 6.7 show

- 155 -
Table 6.2 (a) Angular momentum and recoil velocities for individual states of CO2 J =
278 through collisions with highly vibrationally excited 2MP molecule(E = 38500 cm-1
).
2MP (E = 38500 cm-1
) + CO2
Final J State ΔJbath a vlab
b vrel
c Δvrel
d
2 -21.9 519.6 684.0 185.4
8 -20.5 516.7 679.3 180.7
22 0.0 473.8 607.7 109.2
26 13.9 509.7 667.7 169.1
36 28.5 517.2 680.0 181.5
38 31.0 477.5 614.0 115.5
44 38.1 573.7 772.1 273.5
54 49.3 589.3 797.3 298.7
58 53.7 559.5 749.2 250.6
60 55.8 567.7 762.5 263.9
62 58.0 564.7 757.6 259.1
64 60.1 657.4 905.4 406.8
66 62.2 689.0 954.9 456.3
68 64.3 689.0 954.9 456.3
70 66.5 694.3 963.2 464.6
72 68.6 706.8 982.8 484.2
74 70.7 720.3 1003.8 505.2
76 72.7 790.8 1112.9 614.3
78 74.8 915.3 1303.5 804.9

- 156 -
aThe average angular momentum changes Jbath in units of of CO2 through collisions
with vibrationally excited 2MP, 2,6MP and 3,5MP. Jbath for CO2 is calculated due to
the equation: Jbath 2= Jbath
2 Jbath 2 . Jbath
is average final angular momentum
vector of CO2 bath molecule. The average initial angular momentum vector of CO2 at
300K is Jbath 22.
bThe average lab-frame velocity vlab in m s
-1 of scattered CO2 at rotational states (J = 2–
78) following collisions with vibrationally excited 2MP, 2,6MP or 3,5MP, is calculated
from vlab = 3kBTapp
mCO2
12
, where kB is the Boltzmann constant; Tapp is the state-specific
appearance lab-frame translational temperature listed in Table 6.1; mCO2 is the mass of
CO2.
c vrel , the average center-of-mass frame velocity in ms-1
for hot donors (2MP, 2,6MP or
3,5MP) and CO2 molecules, is determined from the equation:
vrel =M
mdonor vlab
23kBTM
12
where M is the total mass of donors (2MP, 2,6MP or
3,5MP) and CO2, mdonor is the mass of two donors and T = 298 K.
dThe average change in relative velocity vrel in ms
-1, is obtained from an equation:
vrel = vrel 3kBTμ
12
where is the reduced mass for donor/CO2 collisions system
(donor: 2MP, 2,6MP or 3,5MP).

- 157 -
(b) Angular momentum and recoil velocities for individual states of CO2 J = 278
through collisions with 2,6MP molecule (E = 38500 cm-1
).
2,6MP (E = 38500 cm-1
) + CO2
Final J State ΔJbath a vlab
b vrel
c Δvrel
d
2 -21.9 502.4 636.0 148.1
8 -20.5 468.4 582.1 94.1
22 0.0 481.9 603.6 115.6
26 13.9 501.5 634.6 146.6
36 28.5 528.8 677.3 189.3
38 31.0 556.3 719.7 231.8
44 38.1 537.8 691.3 203.3
52 47.1 571.5 743.0 255.0
54 49.3 551.4 712.1 224.2
58 53.7 616.5 811.5 323.5
60 55.8 514.9 655.5 167.6
62 58.0 584.9 763.6 275.6
64 60.1 620.2 817.1 329.1
66 62.2 636.4 841.5 353.5
68 64.3 666.8 887.2 399.2
70 66.5 640.4 847.5 359.5
72 68.6 686.5 916.5 428.6
74 70.7 702.0 939.6 451.6
76 72.7 701.6 939.0 451.0
78 74.8 719.9 966.2 478.2

- 158 -
(c) Angular momentum and recoil velocities for individual states of CO2 J = 270
through collisions with highly excited 3,5MP molecule (E = 38500 cm-1
).
3,5MP (E = 38500 cm-1
) + CO2
Final J State ΔJbath a vlab
b vrel
c Δvrel
d
2 -21.9 439.2 534.9 46.9
8 -20.5 464.7 576.3 88.2
22 0.0 513.6 653.8 165.7
26 13.9 500.1 632.5 144.5
36 28.5 612.6 805.9 317.8
38 31.0 547.2 705.9 217.8
44 38.1 507.6 644.4 156.3
52 47.1 571.7 743.6 255.6
66 62.2 666.1 886.4 398.3
70 66.5 702.4 940.6 452.5

- 159 -
CO2 <J>
-20 0 20 40 60 80
<
vre
l>,
m s
-1
0
400
800
1200
1600
pyrazine
2MP
2,6MP
3,5MP
Figure 6.6 The average velocity changes for CO2 (J = 2–80) through collisions with
highly vibrationally excited pyrazine (diamonds), 2MP (triangles), 2,6MP (circles) and
3,5MP (squares). The data for pyrazine/CO2 were reported in Chapter 4. The data at
CO2 high-J states (J = 5680) following collisions with 2MP and 2,6MP are obtained
from Ref. 86.

- 160 -
ln{[
CO
2(0
000
,J)]
/g}
18
20
22
24
26
ln{[
CO
2(0
000
,J)]
/g}
16
18
20
22
24
26
CO2 E
rot, cm
-1
0 500 1000 1500 2000 2500
ln{[
CO
2(0
000
,J)]
/g}
16
18
20
22
24
26
Trot=399K
Trot=543K
Trot = 374 K
Trot = 538 K
2MP(E)+CO2
2,6MP(E)+CO2
CO2 E
rot, cm
-1
0 500 1000 1500 2000 2500
3,5MP(E)+CO2
Trot=417 K
Trot = 476 K
Trot = 472 K
Trot = 460 K
Trot = 288 K
Figure 6.7 Nascent rotational distribution for the J = 280 states of CO2 due to collisions
with three highly vibrationally excited donors, 2MP (triangles), 2,6MP (circles) and
3,5MP (squares). The populations of scattered CO2 after collisions with three donors are
fitted by two methods. The three left plots show the single-exponential modes for the
rotational distributions while the bi-exponential model is used to fit the three
experimental results in the right plots.

- 161 -
the results of fitting the low and high-J regions separately. The crossing points of the two
distributions is near Erot = 750 cm-1
for 2MP, Erot = 550 cm-1
for 2,6MP and Erot = 400
cm-1
for 3,5MP. The low energy rotational distributions have temperatures near 300400
K while the distributions for the higher J states have temperatures near 500 K.
The methylated pyridine donors at E near 38500 cm-1
impart substantially less
rotational energy to CO2 than does pyrazine with E=37900 cm-1
. For pyrazine(E)/CO2
collisions, the scattered CO2 molecules also have two rotational temperatures (as
discussed in Chapter 4), and the low energy component is near room temperature.
However, the crossing point of the two distributions for pyrazine/CO2 collisions occurs at
a much higher rotational energy of approximately 1160 cm-1
. The rotational temperature
of the high energy component (Trot = 1164 110 K) is substantially larger than that seen
for the methylated donors. It is clear from Figure 6.7 that the methylated donors impart
less rotational energy transfer to CO2 than pyrazine.
Here the rotational distributions for CO2 J=280 are characterized by a two
component model. This model treats the total population in a given J state as the sum of
two sub-populations using Eq. 6.2.
PopJ= g
J Iaexp
EJ
kBTa +Ibexp
EJ
kBTb (6.2)
Here gJ is the rotational degeneracy; EJ is the rotational energy; Ta and Tb are rotational
temperatures; and Ia and Ib are the intensity parameters. The fitting results are shown as
solid lines in Figure 6.8 for collisions of CO2 with 2MP, 2,6MP and 3,5MP. The
residuals from the fit are shown in the plots on the right in Figure 6.8.

- 162 -
CO2 E
rot, cm
-1
0 500 1000 1500 2000 2500
ln(p
op
/g)
16
18
20
22
24
26
28
CO2 E
rot, cm
-1
0 500 1000 1500 2000 2500
Re
sid
ua
ls (
ln(p
op
/g))
-1.0
-0.5
0.0
0.5
1.0
c) 3,5MP + CO2
a) 2MP + CO2
0 500 1000 1500 2000 2500
ln(p
op
/g)
16
18
20
22
24
26
0 500 1000 1500 2000
Re
sid
ua
ls (
ln(p
op
/g))
-1.0
-0.5
0.0
0.5
1.0
b) 2,6MP + CO2
0 500 1000 1500 2000 2500
ln(p
op
/g)
18
20
22
24
26
0 500 1000 1500 2000 2500 3000
Re
sid
ua
ls (
ln(p
op
/g))
-1.0
-0.5
0.0
0.5
1.0
Figure 6.8 A two-component biexponential function fitting curve (Eq 6.4) of the nascent
rotational distributions of scattered CO2 through collisions with excited 2MP, 2,6MP and
3,5MP. (a) The fitting curve for 2MP/CO2 data (triangles). (b) The fitting curve for
2,6MP data (circles). (c) The fitting curve for 3,5MP/CO2 data (squares). The plots to
the right are the residuals for the fitting results.
- 163 -
The two-component model fits the experimental data of CO2/2,6MP pair without
any constraints. However, the model cannot uniquely fit the CO2/2MP and CO2/3,5MP
data sets without imposing initial constraints on the fitting parameters. These data sets
were fit by setting Ta at 300 K and varying the relative values of Ia and Ib until the
residuals were minimized. This process is described in more detail in Appendix D.
The two sub-populations that result from donor/CO2 collisions are shown in Figure 6.9,
based on fitting the data with Eq. 6.4. The cold populations of CO2 molecules have Ta is
near 300 K, indicating that these are elastic or weakly inelastic collisions. The
temperatures for the high energy tail are Tb =592 K for 2MP, 852 K for 2,6MP and 600 K
for 3,5MP. The elevated rotational temperatures indicate that the collisions are impulsive
and involve non-zero J values for CO2. The ratios of the number densities for the cold
and hot populations are 88:22 for 2,6MP and 85:15 for 3,5MP-CO2. The population ratio
for 2MP is 58:42. It is interesting that the donors with two methyl groups have
comparable population ratios. However, given the experimental uncertainties, the spread
in the data and the constraints that were imposed in the fitting procedure, it is best not to
compare these ratios quantitatively. Instead, a clear qualitative picture of the energy
transfer emerges. When CO2 is the collision partner, two distinct types of collisions are
involved in quenching high energy molecules: elastic and nearly elastic collisions
dominate the CO2 populations in low-J states while the higher rotational states have
population from more impulsive collisions that involve larger J values.

- 164 -
Pop
ula
tio
n
0.0
4.0e+11
8.0e+11
1.2e+12
CO2 E
rot, cm
-1
0 500 1000 1500 2000 2500 3000
Pop
ula
tio
n
0.0
5.0e+12
1.0e+13
1.5e+13
2.0e+13
Pop
ula
tio
n
0.0
5.0e+11
1.0e+12
1.5e+12
2.0e+12
2.5e+12
Cold Population
Ta = 299 K, 88%
Hot population
Tb = 852 K, 12%
3,5MP + CO2
2MP + CO2
Observed
2,6MP + CO2
Cold Population
Ta = 299 K, 58%
Hot population
Tb = 592 K, 42%
Observed
Cold Population
Ta = 301 K, 85%
Hot population
Tb ~ 600 K, 15%
Observed
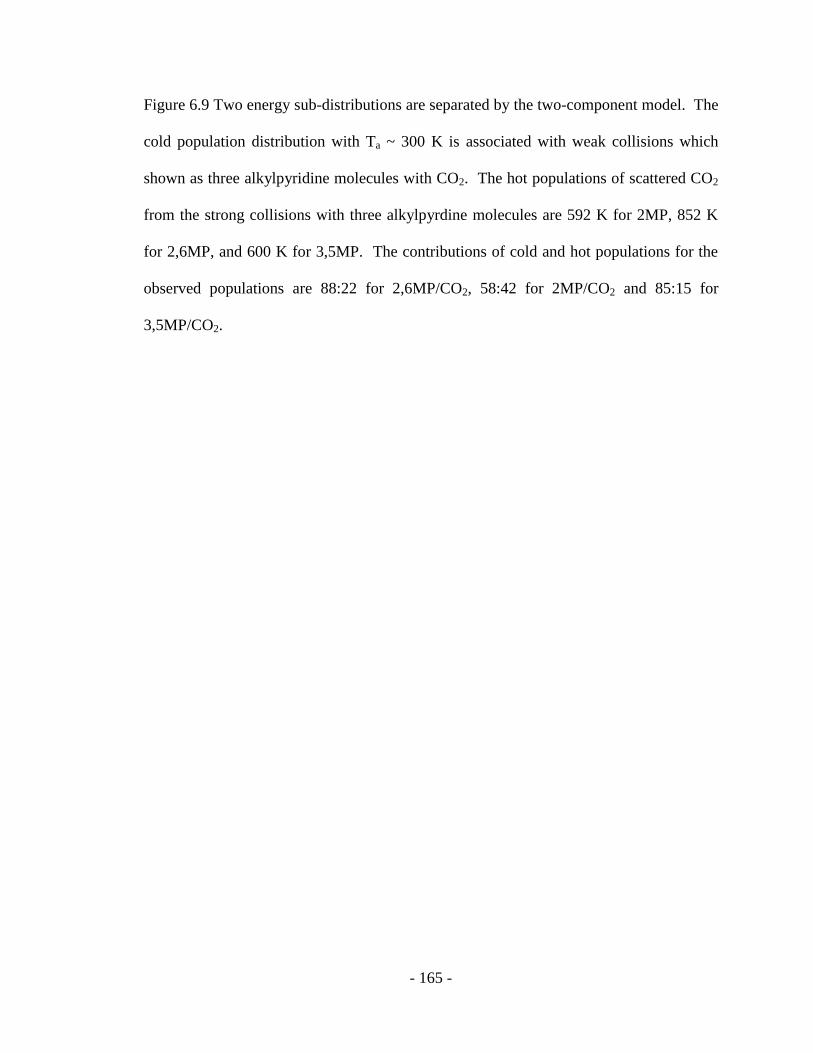
- 165 -
Figure 6.9 Two energy sub-distributions are separated by the two-component model. The
cold population distribution with Ta ~ 300 K is associated with weak collisions which
shown as three alkylpyridine molecules with CO2. The hot populations of scattered CO2
from the strong collisions with three alkylpyrdine molecules are 592 K for 2MP, 852 K
for 2,6MP, and 600 K for 3,5MP. The contributions of cold and hot populations for the
observed populations are 88:22 for 2,6MP/CO2, 58:42 for 2MP/CO2 and 85:15 for
3,5MP/CO2.

- 166 -
6.3.4 Appearance Collision Rate kapp for CO2 with 2MP, 2,6MP and 3,5MP
The appearance of CO2 molecules in specific J states due to collisions with
2MP(E), 2,6MP(E) and 3,5MP(E) is described by Eq 6.1. The state-resolved rate
constant kappJ
for individual J states is obtained using Eq 6.3:
CO2
J
t= kapp
J donor E 0 CO2 0 (6.3)
Here, donor E 0 and CO2 0 are the initial concentrations for donors (2MP, 2,6MP and
3,5MP) and CO2; CO2J is the change in CO2 J-specific number density at t=1 s after
UV pulse. The state-specific rate constant
for CO2 states J = 258 with three
methylated pyridine donors are listed in Table 6.3.
The appearance collision rate constant kapp in Table 6.3 is the sum of state-
resolved rate-constants for CO2 J = 098, based on kapp= kappJ
J=0 . Since the V- RT
channel to which kapp corresponds is one pathway for collisions between donor and bath
molecules, kapp is a lower limit to the total collision rate constant. The values of kapp are
(8.12.4) × 10-10
cm3 molecule
-1 s
-1 for 2MP, (1.20.4) × 10
-9 cm
3 molecule
-1 s
-1 for
2,6MP and (9.83.0) × 10-10
cm3 molecule
-1 s
-1 for 3,5MP.
In Table 6.3, values of the Lennard-Jones collision rates kLJ are listed for 2MP,
2,6MP and 3,5MP with CO2 at 300 K. The ratio of kapp to kLJ is greater than unity for
each of these donors: 1.4 for 2MP, 2.0 for 2,6MP and 1.6 for 3,5MP. In comparison, the
ratios for pyrazine are 0.85 at E = 37900 cm-1
(Chapter 4) and 1.2 at E = 32700 cm-1
(Chapter 5). These ratios are illustrated in Figure 6.10. This comparison gives some

- 167 -
Table 6.3. State-specific energy transfer rate constants.
Erot, cm-1
10-11
cm3 molecule
-1 s
-1a
2MP 2,6MP 3,5MP
2 2.3413 1.1 0.3 1.9 0.6 2.0 0.6
8 28.0951 3.1 0.9 6.3 1.9 4.4 1.3
22 197.4 6.4 1.9 8.5 2.6 8.7 2.6
26 273.9 5.1 1.5 6.2 1.9 4.0 1.2
36 519.5 2.5 0.8 2.3 0.7 1.7 0.5
38 578.0 2.2 0.7 2.1 0.6 1.7 0.5
44 772.1 0.8 0.2 1.7 0.5 2.0 0.6
52 1074.4 0.5 0.2 0.5 0.2
54 1157.8 0.4 0.1 0.6 0.2
58 1333.8 0.3 0.1 0.4 0.1
66 1722.9 0.10 0.03
68 1828.0 0.07 0.02
kapp, cm3 molecule
-1 s
-1b (8.1 ± 2.4) 10
-10 (1.2 ± 0.4) 10
-9 (9.8 ± 3.0) 10
-10
kLJ, cm3 molecule
-1 s
-1c 5.8 10
-10 6.1 10
-10 5.8 10
-10
kapp
kLJ
~1.4 ~2 ~1.6

- 168 -
aThe state-specific rate constant kapp
Jfor appearance of CO2 (00
00, J = 270) through
collisions with 2MP, 2,6 MP or 3,5 MP are determined from appearance data at t = 1 s
after UV pulse.
bkapp is the overall rate for VRT energy transfer. It is obtained by summing appearance
state-resolved rate constants kappJ
for CO2 product states (J = 098) shown an equation:
kapp= kappJ
J=098 .
cThe Lennard-Jones collision rate constant kLJ is determined as described in Appendix B
with following Lennard-Jones parameters:
σCO2=4.5 10
-10m, kB CO2
=190 K;
σ2MP=5.6 10-10
m, kB 2MP=466 K;
σ2,6MP=5.9 10-10
m, kB 2,6MP=468 K (same as 3,5MP).

- 169 -
insight into the collisions of high energy molecules. First of all, we see again that the
VRT channel is the dominant pathway in the collision quenching process for these
donors with CO2. This feature appears to be general for CO2 collisions with high energy
molecules of this type. Secondly, the fact that the energy transfer for methylated donors
is greater than the Lennard-Jones collision rate shows that the model collision rate
undershoots the actual collision rate by an amount that is not insubstantial.
It would be very interesting to measure the branching ratios for the VV
pathways of these donors with CO2 to determine the actual total collision rates. The VV
pathways for pyrazine(E)/CO2 collisions account for about 1015% of all collisional
energy transfer, as reported elsewhere.74
For 2MP, 2,6MP and 3,5MP, initial attempts to
characterize the VV pathways were not successful due to small signal levels. This
channel would be worth revisiting in the future.
It may also be that the internal energy content of the high energy methylated
donors increases the collision cross section. Energy dependent measurements may reveal
that the collision rates are enhanced for the highly excited methylated donors, but not for
pyrazine, because of large amplitude low frequency motions of the methyl groups. Other
quenching studies with HOD as the energy acceptor also find that methylated donors
have VRT energy transfer rates that are larger than the Lennard-Jones collision rate and
that increase with the extent of methylation, as shown in Figure 6.10. One difference in
the HOD collisions is that kLJ does a rather poor job at accounting for H-bonding
interactions so that it underestimates the rate for HOD with pyrazine as well.
- 170 -
6.3.5 The Full VRT Energy Transfer Distribution P(E) for CO2 with
Vibrationally excited 2MP , 2,6MP and 3,5MP.
The state-resolved CO2 energy gain profiles and rate constants are used to
determine J-specific energy gain distribution functions PJ(E) that are indexed by E.
The full energy transfer distribution P(E) is the sum of PJ(E), shown as
P E = PJ E 98i=0 . P(E) curves describe the whole VRT collision process between
hot donors (pyrazine, 2MP, 2,6MP and 3,5MP) and CO2 molecules in Figure 6.11.
Figure 6.11a shows P(E) distributions relative to kLJ and Figure 6.11b shows P(E)
curves relative to kapp. For E > 0, the P(E) curves correspond to the probability of high
energy donor molecules losing their internal energy in collisions with CO2. For E > 0,
the P(E) curves correspond to the probability that donor molecules gain energy in
collisions with CO2. The maximum probability of energy transfer for pyrazine(E)
collisions is at E = 240 cm-1
. For donors with one or two methyl groups (2MP, 2,6MP
or 3,5MP), the maximum P(E) shifts slightly to E = 120 cm-1
. Figure 6.11b shows that
the P(E) curves for 2,6MP and 3,5MP are similar after being normalized to kapp. In
addition, Figure 6.11b shows that the presence of at least one methyl group decreases the
probability of large transfer energy (E >800 cm-1
).

- 171 -
donors
Pyrazine 2MP 2,6MP 3,5MP
ka
pp/k
LJ
0
1
2
3
4
5
HOD
CO2
HOD
HOD
CO2
CO2
CO2
Figure 6.10 The ratios of experimental appearance collision rate kapp with Lennard-Jones
collision rate kLJ for different collision systems. The red bars show ratio data for CO2
with vibrationally hot pyrazine, 2MP, 2,6MP and 3,5MP. The ratios of HOD with the
first three excited donor species are shown by the green bars.

- 172 -
P(
E)
rela
tive
to
kL
J,
1/c
m-1
0.0000
0.0005
0.0010
0.0015
0.0020
E, cm-10 1000 2000 3000 4000
P(
E)
rela
tive
to
kco
l, 1
/cm
-1
0.0000
0.0002
0.0004
0.0006
0.0008
0.0010
2,6MP(E)+CO2
2MP(E)+CO2
Pyrazine(E)+CO2
2,6MP(E)+CO2
2MP(E)+CO2
Pyrazine(E)+CO2
3,5MP(E)+CO2
3,5MP(E)+CO2
a)
b)
Figure 6.11 The full energy transfer distribution function P(E) curves for CO2 with four
highly vibrationally excited donors: 2MP (long dash line), 2,6MP (solid line), 3,5MP
(short dash line) and pyrazine(green dot line). (a) P(E) curves normalized to the
Lennard-Jones collision rate kLJ and (b) P(E) curves normalized to the experimental
appearance collision rates kapp.

- 173 -
6.4 Conclusions
This Chapter reported the complete VRT collision dynamics of 2MP/CO2,
2,6MP/CO2 and 3,5MP/CO2 systems. In comparison with pyrazine(E) quenching studies,
this work shows how the presence of methyl groups in the high energy molecules affects
the energy transfer dynamics. The state-resolved measurements show the presence of
both strong and weak collisions for three collision systems. The translational energy
partitioning at J = 280 for scattered CO2 from the methylated pyridine donors is
dependent on CO2 J-state. It minimizes near the peak of the 300 K thermal distribution
of CO2 and increases significantly as J increases for J > 60. The product translational
energies from collisions of 2MP, 2,6MP and 3,5MP are about half as large as those seen
for collisions with pyrazine(E). Weak and strong collisions result in two sub-populations
for CO2 rotational energy. The collision rates and the full energy transfer distributions
for three donors with CO2 were measured. The appearance collision rates of three
collision systems are 1.4~2 times higher than Lennard-Jones models. This result shows
that VRT energy transfer is the dominant process for these collision systems.

- 174 -
Chapter 7: Energy Dependence of Strong Collision dynamics for
Highly Vibrationally Excited Azulene(E = 20390 and 38580 cm-1
)
with CO2
7.1 Introduction
Collisional energy transfer of high energy molecules is a key step in many
chemical processes but fundamental questions remain unanswered. One such question is
how the amount of vibrational energy in the highly excited molecules affects the energy
transfer dynamics in terms of product energy partitioning and energy transfer rates.
Strong collisions remove large amounts of internal energy in single encounters and
effectively compete with unimolecular decomposition when the molecule’s internal
energy approaches the dissociation limit. Currently, there are no first principles models
for predicting how large vibrationally excited molecules lose their energy through strong
collisions. The dynamics of strong collisions of highly excited molecules with CO2 has
been well documented for a number of highly excited donor molecules using high-
resolution IR probing.75-77,85,86,90,91,94,96,102,103,106,168-170
The energy dependence of strong
collisions of high energy donor molecules, pyridine (E)85
and pyrazine(E)75-77,106
with
CO2 has been investigated with state-resolved probing. Chapter 5 reported the energy
dependence of full energy transfer of pyrazine(E)/CO2. These studies were able to vary
the donor energy by 1030%. This Chapter reports on the dynamics of strong collisions
of vibrationally excited azulene(E) with CO2 where E = 20390 and 38580 cm−1
. Azulene
is an ideal target molecule for this type of study since it can be prepared with internal
energy that can be varied by a factor of 2.

- 175 -
The collisional relaxation of azulene(E) has been the subject of a large body of
work at energies as high as E = 40000 cm−1
.38,41,50,51,65-67,69-73,92,148,149,155,156,171-174
Azulene
has five electronic states from which highly vibrationally excited molecules are readily
prepared.65
The states are accessed by visible or UV light that converts azulene to highly
vibrationally excited states in S0 by rapid radiationless decay with near unity quantum
yield.171,175
UVA and IRF studies on azulene(E) relaxation have reported that average
energy transfer values for a number of azulene(E)/bath systems depend roughly linearly
on the internal energy.50,51,155,156,171,172
These studies showed that E levels off near E ~
30000 cm−1
. More recent KCSI studies indicate that the linear energy dependence
continues to E = 40000 cm−1
.29,65
In other experiments, Flynn and co-workers studied
vibration-to-vibration energy transfer in azulene(E)/CO2 collisions for E = 30600 and
40980 cm−1
and report a slight negative energy dependence for the energy transfer
rates.92,174
The work presented in this Chapter focuses on in establishing how the dynamics
of strong collisions is affected when the azulene energy is increased from E = 20390 to
38580 cm−1
. By doubling the internal energy of the hot azulene molecule, the strong
collision dynamics can be investigated over a much broader range than in earlier state-
resolved studies. Previously, our group investigated the energy dependence of strong
collisions of CO2 with pyridine (E = 37000–41000 cm−1
) and with pyrazine(E = 32000–
41000 cm−1
).75-77,85,86,106
These studies showed that the energy dependence of large-E
energy transfer is donor dependent but is not particularly sensitive to these changes in
donor energy. The distribution and rates for large-E collisions of pyridine/CO2 are
essentially constant for an approximately 10% increase in donor energy. For pyrazine,

- 176 -
the distribution of large-E collisions does not vary uniformly over an ~30% increase in
donor energy. Instead, this component is nearly constant until the internal energy reaches
E = 38000 cm−1
, where a stepwise increase in the energy transfer is observed. It is
known that pyrazine(E) undergoes dissociation at E = 38000 cm−1
with a lifetime (~70
s) that is much longer than the energy transfer measurement time of t = 1 s.93
Dissociation has not been observed at lower energies. At vibrational energies above this
threshold, the energy gain distribution broadens and the energy transfer rate increases
monotonically as a function of donor energy. It is interesting that for both pyrazine and
pyridine, there are energy ranges where the dynamics of large-E collisions are invariant
to the donor energy. In the limit of small internal energies, the probability of large-E
collisions must diminish due to energy conservation. This Chapter explores this issue by
examining a broader range of internal energy for azulene(E)/CO2 collisions.
Energy-dependent studies of this kind provide an opportunity to test the role of
state density in strong collisions of high energy molecules. Statistical treatments of
collisional energy transfer inherently describe energy redistribution in terms of the state
density. UVA, IRF, and KCSI experiments have shown that increasing donor state
density tends to enhance energy transfer probabilities. The role of the state density
energy dependence in controlling the curvature of the energy transfer probability
distribution function has been established by experiments on large-E collisions of other
donor molecules with CO2.86
The GRETCHEN (Golden Rule Modeling of Excitation
Transfer in Collisions of High ENergy molecules) model for strong collisions, based on
Fermi’s Golden Rule, outlines the state density dependence for different donors.83,86
This
model predicts that the distribution of energy transfer of large-E collisions will be

- 177 -
sensitive also to changes in the donor energy, provided that the energy changes are large
enough to influence the energy dependence of the state density in Figure 7.1.
In this Chapter, the nascent state-resolved rotational and translational energy
distributions and rate constants for scattered CO2 (0000) in high rotational states through
collisions with azulene(E = 20390 and 38580 cm-1
) are presented. Energy transfer
distributions were obtained at both azulene energies. Rotational and translational
distributions of scattered CO2 bath are broadened with increasing azulene’s energy. The
rate for energy transfer via strong collisions with E >3000 cm-1
increases by a factor of
4 when the internal energy of the azulene molecule is doubled. The large-E energy
transfer distribution functions agree well with predictions from the GRETCHEN model.
7.2 Experimental Methods
The high resolution diode-laser transient IR absorption spectrometer described in
Chapter 2 was used to probe the energy-dependent relaxation experiments. A brief
outline is given here. The frequency-doubled or quadrupled pulsed output of a Nd:YAG
laser ( = 532 or 266 nm, respectively) was used to excite azulene with different internal
energies as Eq 7.1.
Azulene+h(=532 or 266 nm)→Azulene(E=20390 or 38500 cm-1
) (7.1)
The laser power at = 532 and 266 nm was kept under 2 MW/cm2 to minimize
multiphoton absorption. Experiments at = 266 nm were performed at T = 300 K. Due
to the much lower absorption strength of azulene at = 532 nm, the experiments at this

- 178 -
Figure 7.1 The GRETCHEN model is based on Fermi’s golden rule. The key idea is that
collisions of a highly excited molecule provide time-dependent perturbations that induce
energy transfer between molecules. The probability for an energy exchange of the
amount E is predicted to be proportional to the final state density (E-E).

- 179 -
excitation wavelength were performed at 360 K to increase the azulene’s vapor pressure.
For the elevated temperature studies, the collision cell and gas inlet system were wrapped
in copper foil, heating tape, and insulation176,177
and the ambient cell temperature was
determined by IR absorption of well-populated CO2 states. Roughly 5% of the azulene
molecules are excited to azulene(E = 20390 or 38500 cm-1
).
A 1:1 mixture of azulene and CO2 with a total pressure of about 15 mTorr was
flowed through a 3-m flowing-gas collision cell. The average time between collisions is
tcol ~ 4 s. The diode laser( = 4.3 m) with a resolution of 0.0003 cm-1
probed the
populations of scattered CO2 (0000) molecules at high rotational states J = 6078. The
nascent transient IR absorption signals are collected at t = 1 s after the UV pulse.
Doppler-broadened transient absorption line profiles were collected by locking the diode
laser to a fringe of a scanning Fabry-Perot etalon.
Azulene (Aldrich, >99%) was degassed by the freeze-pump-thaw method before
use. Research-grade CO2 (Matheson, 99.995% purity) was used directly without further
purification.
7.3 Results and Discussion
This Section reports on the dynamics of strong collisions of CO2 with azulene(E)
for two initial energies, E =20390 and 38580 cm−1
. The appearance rates and nascent
rotational and translational energy distributions of scattered CO2 molecules with J = 60–
78 were measured using high-resolution transient IR absorption at = 4.3 m. Both the
average rotational energy of the scattered CO2 molecules with J 60 and the average
translational energy of the scattered molecules double when the azulene energy increases

- 180 -
by a factor of 2. The energy transfer rates also depend on the azulene internal energy,
increasing by a factor of about 4 for a doubling of the initial azulene energy.
7.3.1 CO2 Rotational Energy Gain from Azulene(E)-CO2 Strong Collisions
The IR probe transitions involve excitation of one quantum of the CO2 3
antisymmetric stretch mode for either the P or R branch,
CO2 0000, J, V + h 4.3 m CO2(00
01,J 1,V) (7.2)
In Eq 7.2, 0000 represents the CO2 ground vibrationless state, 00
01 corresponds to one
quantum in the 3 stretch, J is the rotational angular momentum quantum number, and V
is the component of the velocity along the diode laser propagation axis. Figure 7.2 shows
the transient IR absorption signals for the J = 66 state of CO2 (0000) resulting from
collisions with excited azulene at 532 and 266 nm. The appearance signals correspond to
population increases in the J = 66 state of CO2 (0000) as a function of time. Population
data collected at t = 1 s following the UV pulse result essentially from single collisions
between highly excited azulene and CO2 since the average collision time is tcol = 4 s.
Differences in the signal intensities in Figure 7.2 are due to differences in the number
density of photoexcited azulene molecules and in the energy transfer cross sections at the
two excitation wavelengths.
The nascent rotational distributions of scattered CO2 in high-J states were
determined from fractional absorption measurements at t = 1 s for both azulene
excitation wavelengths. Absorption signals were converted to nascent CO2 populations
using IR absorption coefficients178
and the transient Doppler-broadened linewidths

- 181 -
Time, s
-2 0 2 4 6 8 10
Fra
ctio
na
l IR
Ab
so
rptio
n
0.00
0.02
0.04
0.06
0.08
266 nm
532 nm
Azulene(E)+CO2
Probing CO2(00
00,J=66)
Figure 7.2 Transient IR absorption for CO2 (0000) J = 66 following excitation of azulene
at = 266 (red line) and 532 nm (blue line). The appearance signals of specific CO2
rotational high-states result from collisions with highly vibrationally excited azulene with
different internal energies. The population data were collected at t = 1 s after
UV/visible pulse.

- 182 -
described in the next Section. The nascent CO2 rotational distributions are broader for
the higher donor energy, as shown in Figure 7.3. Each data set in Figure 7.3 is an
average of six individual measurements of the rotational distribution which is then fitted
using a Boltzmann distribution. For azulene excited at = 532 nm, the scattered CO2
molecules (with J 60) have a rotational temperature of Trot = 470 ± 100 K. For
excitation at = 266 nm, the CO2 rotational temperature is Trot = 805 ± 80 K. Based on
the rotational temperatures, the average rotational energy of CO2 molecules (with J 60)
increases by nearly a factor of 2 when the azulene internal energy is doubled. The
average change in the CO2 rotational energy Erot has a stronger dependence on the
azulene initial energy. Erot is determined from Erot = kB Trot T0 , where T0
describes the initial rotational distribution. Using the ambient cell temperature for T0,
Erot 266 is around ~4.5 times bigger than Erot 532 for the set of strong collisions under
investigation.
7.3.2 Translational Energy Release from Azulene(E)/CO2 Large-Collisions
The nascent distributions of recoil velocities for strong collisions were determined
from transient absorption line profiles of individual CO2 rotational states (J = 62–78)
measured at t = 1 s following azulene excitation at = 532 and 266 nm. The transient
linewidths for a number of individual CO2 states are listed in the Table 7.1 along with the
nascent translational temperatures. The transient CO2 line profiles are broadened relative
to those at the ambient cell temperature and they increase in width as a function of
azulene excitation energy. Transient absorption line shapes for the CO2 (0000) J = 68
state following azulene excitation at 532 and 266 nm are shown in Figure 7.4. The 1 s
population data have isotropic velocity distributions that are each fit with a Gaussian

- 183 -
CO2 Rotational Energy, cm
-1
1600 1800 2000 2200 2400
ln(p
op
/g)
15
16
17
18
19
266 nm,Trot
= 805 K
532 nm,Trot
= 470 K
Figure 7.3 Nascent population distributions of CO2 (0000) in high-J states (6278)
through from collisions with highly vibrationally excited azulene that was prepared with
= 532 (blue circles) and 266 nm (red diamonds).

- 184 -
Table 7.1 Doppler-broadened linewidths and translational temperatures for strong
collisions of CO2 with highly vibrationally excited azulene(E=20100 or 38500 cm-1
).
CO2 (0000) J app, cm
-1a Tapp, K
b Trel, K
c
exc =532 nm
E = 20100 cm-1
66 0.0051 43080 45484
68 0.0055 50085 54893
70 0.0054 47595 515103
72 630150d 723172
d
74 0.0060 605100 689113
76 657130d 759151
d
78 0.0069 690110 803186
exc =266 nm
E =38500 cm-1
62 0.0067 740159 891214
64 854186d 1045251
d
66 0.0078 1015225 1261302
68 0.0073 893196 1097263
70 0.0081 1073184 1339248
72 0.0071 876190 1074255
74 0.0080 1058235 1319316
76 1067213d 1331221
d
78 0.0081 1103245 1379330
aFull width at half maximum linewidths app of transient absorption line profiles at 1 s
following azulene excitation. Each app value is the average of three experimental line
profile measurements. The 1 uncertainty in experimental linewidths is ± 0.001 cm−1
.

- 185 -
bLaboratory frame translational temperatures for scattered CO2 molecules determined
using Tapp= mc2 8kBln2 vapp v2 2 in units of K where m is the mass of CO2, kB is
Boltzmann’s constant, c is the speed of light, and 0 is the rovibrational transition
frequency at line center.
cCenter-of-mass translational temperatures determined using
Trel= Tapp+ mCO2mazulene Ta T0 , where T0 is taken to be the cell temperature of 360
K for 532 nm experiments or 300 K for 266 nm experiments.
dFor states with low signal to noise levels, the translational energy distributions were
interpolated from the data in Figure 7.5.

- 186 -
-0.02 -0.01 0.00 0.01 0.02
0.000
0.001
0.002
0.003 app
=0.0055 cm-1
Ttrans
=500 K
0.000
0.003
0.006
0.009
app =0.0073 cm
-1
Ttrans
=893 K
CO2 J=68
= 266 nm
Fra
ctional IR
Absorp
tion
CO2 J=68
= 532 nm
Wavenumber from Linecenter, cm-1
Figure 7.4 Doppler-broadened transient absorption line profile for CO2 (0000) J = 68
collected at t = 1 s following laser excitation of azulene at = 266 (red circles) and 532
nm (blue circles). Transient absorption data are fit by a Gaussian function shown as solid
lines.

- 187 -
profile. For azulene with E = 20390 cm−1
, the full width at half maximum linewidth of
the J = 68 state is app = 0.0055 cm−1
, which corresponds to a laboratory-frame velocity
distribution with a temperature of Tapp = 500 ± 85 K. For azulene with E = 38580 cm−1
,
the nascent velocity distribution for the CO2 J = 68 state is broadened and has Tapp = 893
± 196 K.
The distribution of relative recoil energies for scattered azulene and CO2 is
obtained by converting into the center of mass frame and is a measure of the amount of
azulene internal energy that goes into translation of the scattered molecules. For
excitation at = 532 nm, the relative translational energy distribution for the CO2 J = 68
state has a temperature of Trel = 548 ± 93 K corresponding to an average translational
energy of Erel = 1.5kBTrel = 571 101 cm-1, based on an isotropic velocity distribution.
For excitation at = 266 nm, the values increase to Trel= 1097 ± 263 K and Erel = 1144
± 272 cm−1
. For the CO2 J = 68 state, the average product translational energy increases
by a nearly a factor of 2 when the azulene energy is doubled.
Figure 7.5 shows post-collision Erel values as a function of final CO2 rotational
state for quenching collisions of azulene with E = 20390 and 38580 cm−1
. For both initial
energies, the translational energy in the scattered molecules increases roughly linearly as
a function of CO2 J state for J > 60. The increase in translational energy with CO2 J state
shows that the relative velocity changes are accompanied by angular momentum
increases as expected for impulsive collisional energy transfer.
Linear fits to both data sets in Figure 7.5 have roughly the same slope but are
offset from one another by about 20 units of J. The higher energy donor imparts roughly

- 188 -
CO2 Rotational State
20 40 60 80 100
<E
rel>
, cm
-1
300
600
900
1200
1500
1800
Azulene(E) + CO2
Jth~34
Jth~62
=266 nm
=532 nm
Figure 7.5 CO2 rotational state dependence of the average relative translational energy
distribution through collisions with highly vibrationally excited azulene at λ = 532 (blue)
and 266 nm (red).
- 189 -
700 cm−1
more translational energy to individual CO2 product states than the lower
energy donor in large-E collisions. For low energy azulene, scattered CO2 molecules
with J = 64–78 have center of mass translational energies of Erel = 473–837 cm−1
. For
azulene with E = 38580 cm−1
, the J = 62–78 states of CO2 have larger velocity
distributions with Erel = 930–1440 cm−1
.
Average changes in translational energy Erel for the scattered molecules are
dependent on donor energy. Values of Erel for these states are determined using
Erel = 1.5kB Trel T0 . For azulene with E = 20390 cm−1
, Erel = 98–460 cm−1
.
Substantially larger average changes in translational energy are seen for azulene with E =
38580 cm−1
, which has Erel = 616–1124 cm−1
, indicating that the strong collisions are
more impulsive for the higher energy donor.
The data in Figure 7.5 also provide some insight into the product translational
energy from low-E collisions (i.e., those producing low-J CO2 states). Based on
propensity rules for collisions that favor small changes in energy and angular momentum,
it is reasonable that low-J CO2 states will have lower translational energies than the high-
J states. Figure 7.5 shows that for azulene excited at = 532 nm, the low-J CO2 states
are likely to have translational energy distributions that lie within a fairly narrow range
with Erel between 300 and 500 cm−1
. There also appears to be a threshold for the onset
of Erel values that increase strongly with J. Extrapolating the 532 nm data to the initial
relative translational energy of E0 = 320 cm−1
gives an estimate of the threshold state near
Jth = 62. For the 266 nm data, the low-J states of CO2 have a larger range of likely
translational energies with values between Erel of 300 and 900 cm−1
. Extrapolation to
the initial translational energy of E0 = 270 cm−1
suggests that the minimum threshold J-

- 190 -
state for the high energy azulene is near Jth ~ 34. Of course, it is possible that a linear
extrapolation to low-J states is not valid and that the J-state dependence of Erel is a
smoothly varying function of J. If this is the case, the onset of large Erel is likely to
occur at J states that are larger than Jth. Energy gain measurements for low-E collisions
would shed light on this behavior.
7.3.3 Sate-Resolved Rate Constants of Azulene(E)-CO2 large-E Energy Transfer
State-resolved energy transfer rate constants for large-E collisions between
azulene(E) and CO2 with E = 20390 and 38580 cm−1
have been measured. Collisions of
azulene(E) with CO2 lead to the appearance of individual CO2 (0000, J) states with energy
transfer rate constants kappJ
, as shown in Eq 7.3.
Azulene E +CO2 0000
kappJ
Azulene E E +CO2(0000,J) (7.3)
Under single-collision conditions, the initial appearance rate of CO2 (0000, J) is due
solely to collisions of azulene(E) with CO2 and is determined using Eq 7.4,
CO2 0000, J
t= kapp
J Azulene E 0 CO2 0 (7.4)
where [Azulene(E)]0 is the number density of excited azulene initially prepared from the
pulsed excitation and [CO2]0 is the number density of bulk CO2. The energy transfer rate
for production of an individual CO2 state is measured directly as [CO2(0000, J)]/t,

- 191 -
based on transient absorption data collected at t = 1 s following the azulene excitation
pulse (e.g., Figures 7.2 and 7.3).
Rate constants kappJ
increase as a function of azulene’s internal energy and are
listed in Table 7.2. For azulene excited at = 532 nm, the appearance rate constant for
CO2 J = 68 is kappJ=68 = 3.1 0.9 10-13
cm3 molecule
−1 s
−1. At = 266 nm, the J = 68
appearance rate increases by a factor of 3 to kappJ=68 = 1.1 0.3 10-12
cm3 molecule
−1 s
−1.
Rate constants for the appearance of other high-J CO2 states show comparable energy
dependencies, with rates of individual CO2 states that increase by a factor of 3–6 when
the azulene energy is doubled.
The large-E component for energy transfer is described by the appearance of the
high-J CO2 states. One way to compare the 532 and 266 nm data is to compare the
integrated rate for appearance of high-J CO2 states. Here, the integrated rate constant kint
is the sum of kappJ
values for CO2 J = 62–78 states. For excitation at = 532 nm, kint =
(2.2 ± 0.6) 10−12
cm3 molecule
−1 s
−1. At = 266 nm excitation, the integrated rate is
nearly four times larger with kint = (8.5 ± 2.8) 10−12
cm3 molecule
−1 s
−1. Relative to the
Lennard-Jones collision rate of kLJ = 6.4 10−10
cm3 molecule
−1 s
−1, appearance of
scattered CO2 (0000) with J 62 due to collisions with azulene( = 532 nm) results from
one in 290 collisions. When the azulene vibrational energy is increased by a factor of 2,
the strong collisions occur roughly once in 75 collisions. Thus, the probability of energy
transfer between azulene(E) and CO2 due to large-E collisions increases by a factor of 4
when the azulene energy is doubled, based on appearance of CO2 states with J 62.

- 192 -
Table 7.2 State-specific energy transfer rate constants for collisions of highly excited
azulene with CO2: Azulene E + CO2 → Azulene E E + CO2 (0000, J, V)
Excitation wavelength
Thermal vibrational energy
Azulene internal energy
532 nm
1303 cm-1
20390 cm-1
266 nm
906 cm-1
38580 cm-1
CO2 (0000) J state
( 10
-13 cm
3 molecule
-1 s
-1)
62 6.0 ± 1.9 15.8 ± 4.7
64 4.5 ± 1.4 14.0 ± 4.2
66 3.2 ± 1.0 11.8 ± 3.5
68 3.1 ± 0.9 10.9 ± 3.3
70 1.6 ± 0.5 9.8 ± 2.9
72 1.5 ± 0.4 6.6 ± 2.0
74 0.8 ± 0.2 6.3 ± 1.9
76 0.7 ± 0.2 5.1 ± 1.5
78 0.6 ± 0.1 4.2 ± 1.3
kinta (2.2 ± 0.6) 10
-12 (8.5 ± 2.5) 10
-12
kint
kLJ b 1
290
1
75
aIntegrated bimolecular rate constants kint in cm
3molecule
-1s
-1 for collisions of azulene(E)
that result in CO2 (0000) with J = 6278.
bThe collision number is the ratio of the integrated rate constant kint to Lennard-Jones
collision rate constant kLJ. Lennard-Jones collision rate is kLJ = 6.4 10-10
cm3 molecule
-
- 193 -
1 s
-1 which was calculated in Appendix B. The Lennard-Jones parameters and for
mixed systems are:
azulene [σazulene = 6.61 Å, azulene kB = 523 K]50
and CO2 [σCO2 = 3.94 Å, CO2kB = 201
K]65
.

- 194 -
7.3.4 P(E) Curves for Large-E Collisions of Azulene(E) and CO2
The energy dependence of large-E collisions from the point of view of energy
loss from azulene(E) is described by transforming the state-resolved CO2 scattering data
into an energy transfer distribution function. Maxwell-Boltzmann translational energy
distributions in the center-of-mass frame are obtained from J-specific Doppler widths
(Table 7.1) and appearance rates for individual J states of CO2 (Table 7.2). The
probability distribution function P(E) for energy loss from azulene(E) is obtained by
summing energy gain distributions for individual CO2 J states with J 60 as a function of
E.94
The P(E) curve for each donor energy is based on thermal averages for the initial
CO2 rotational and translational energies. The index E corresponds to the amount of
internal energy lost from azulene(E) in single collisions with CO2 and does not include
changes in azulene rotational energy. The data reported here are for the high-J CO2 states
and P(E) curves are complete for E > 3000 cm−1
. Contributions to P(E) from
collisions with E < 3000 cm−1
are not known without appearance measurements for
lower J states of CO2. Figure 7.5 shows that the translational energy spread narrows for
decreasing J, so that the low-J states should not contribute much to P(E) for E > 3000
cm−1
.
Figure 7.6 shows the P(E) probability functions with E > 4000 cm−1
for both
initial azulene energies. The large-E collisions of the higher energy azulene occur with
greater probability and the probability diminishes more slowly as a function of E than
for the lower energy donor in Figure 7.6. Both distribution curves in Figure 7.6 are fitted
well using a single exponential decay function Eq 7.5.

- 195 -
Ecm-1
4000 5000 6000 7000 8000 9000
P(
E)
0.0
8.0e-9
1.6e-8
2.4e-8
P(
E)
0.0
4.0e-7
8.0e-7
1.2e-6 Azulene(E) + CO2
=266 nm
Azulene(E) + CO2
=532 nm
Figure 7.6 Energy transfer distributions P (E) for strong collisions between highly
vibrationally excited azulene(E = 38580 and 20390 cm-1
) with CO2. P (E) curves are
obtained in terms of the energy transfer rates and rotational/translational gain.

- 196 -
P E = obs exp obs E (7.5)
A semilog plot of the P(E) curves is shown in Figure 7.7. A fit of the 266 nm data
yields a shape parameter of obs = 1.05 10-3
per cm-1
and an intensity parameter of obs
= 7.5 10−5
per cm−1
. The 532 nm data is fitted with obs = 2.45 10−3
per cm−1
and obs
= 4.5 10−4
per cm−1
.
The full probability distribution for azulene(E)/CO2 collisions has been measured
with KCSI and calculated independently with PECT.29,65
Figure 7.7 compares our strong
collision results (for E > 3000 cm−1
) with those from KCSI and PECT studies. There is
fairly good agreement at E = 38580 cm−1
, both in the curvature of the distribution
function and the order of magnitude of the probability. The IR and KCSI results at E =
38580 cm−1
have a similar E dependence, which is seen by the parallel semilog plots in
Figure 7.7. At E = 3000 cm−1
, the probabilities are approximately 10−5
/cm−1
but the
KCSI value is about 4 times larger than the IR value. The PECT probability curve agrees
very well with the KCSI results at E = 3000 cm−1
but shows a E dependence that is not
as strong as that from either the IR or KCSI results. The weaker E dependence of the
PECT results somewhat overestimates the large-E component relative to both KCSI and
IR studies, suggesting that a smaller subspace of active degrees of freedom may be
involved.
The comparison of IR data with the KCSI and PECT data results is less favorable
for azulene with E = 20390 cm−1
. The KCSI and PECT results are in relatively good
agreement with each other, but the IR data indicate that large-E collisions are greatly
diminished by the reduction in donor energy. All three methods find that the probabilities
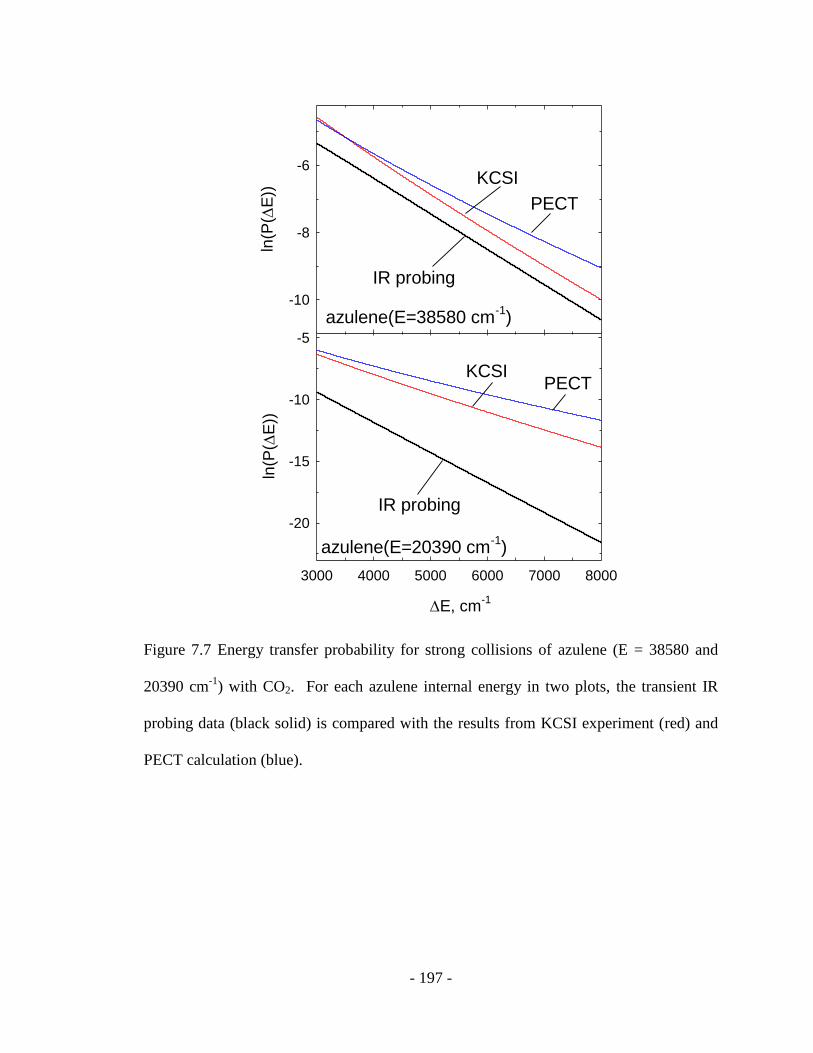
- 197 -
E, cm-1
3000 4000 5000 6000 7000 8000
ln(P
( E
))
-20
-15
-10
-5
ln(P
( E
))
-10
-8
-6
PECT
KCSI
KCSIPECT
azulene(E=38580 cm-1
)
azulene(E=20390 cm-1
)
IR probing
IR probing
Figure 7.7 Energy transfer probability for strong collisions of azulene (E = 38580 and
20390 cm-1
) with CO2. For each azulene internal energy in two plots, the transient IR
probing data (black solid) is compared with the results from KCSI experiment (red) and
PECT calculation (blue).

- 198 -
at E = 20390 cm−1
are lower than those at E = 38580 cm−1
, but the energy dependence is
more pronounced for the IR data. For E=3000 cm−1
, the KCSI results indicate a
probability ratio of 4 between high- and low-energy azulene. The PECT results find a
probability ratio of 3 for high- and low-energy donors. The IR data show a difference of
a factor of 14.
The large-E data from IR and KCSI studies can also compared by modeling the
shape of the distribution functions. Luther and co-workers use a stretched exponential
function to describe P (E’, E) from KCSI studies. The IR data for E > 3000 cm-1
are
fitted using an exponential decay function (Eq 7.5) with a shape parameter obs. The P
(E’, E) curve for E > 3000 cm−1
from the KCSI study are fitted well by Eq 7.5 with a
value of obs (KCSI) = 1.05 10−3
per cm−1
for E = 38580 cm−1
. This result is in exact
agreement with our result of obs (IR) = 1.05 10−3
per cm−1
at 266 nm excitation. For
azulene with E = 20390 cm−1
, however, the agreement is not as good. The KCSI data are
fitted best with obs (KCSI) =1.46 10−3
per cm−1
for azulene with 20390 cm−1
, while the
IR results indicate that obs (IR) = 2.45 10−3
per cm−1
for azulene excited at 532 nm.
The agreement between the IR and KCSI results is less than satisfactory,
particularly for the low-energy donor. One source of the discrepancy may come from
uncertainty in the high-energy tail of the IR data at E = 20390 cm−1
since only high-J
states of CO2 have been measured. It is possible that the lower-J states of CO2 (J < 60)
contribute to collisions with E > 3000 cm−1
. This explanation is not likely, however,
given that the energy gain distributions at E = 20390 cm−1
are substantially compressed
compared to the higher energy data. It is possible that for low-energy azulene, the E
distribution is so compressed that quantitative information about collisions with E >

- 199 -
3000 cm−1
pushes our experimental limits. Future measurements of energy gain into CO2
states with J < 60 should address this issue.
Another consideration is that differences in experimental methods lead to a
slightly different definition of energy change. In the KCSI and PECT distributions, EE’
is the change of donor vibrational energy due to collisions. In the IR measurements, E
corresponds to the amount of donor vibrational energy that is deposited into rotation and
vibration of CO2 and into recoil velocity of the pair. Any donor vibrational energy that is
converted into donor rotational energy is not accounted for in E.
Another difference between the transient IR and KCSI results is that the transient
IR data correspond to single collisions between donor and acceptor molecules in which
vibrational energy in the donor is the only nonthermal energy. In the KCSI experiments,
data are collected over multiple collisions through which the rotational and translational
energy distributions of both donor and acceptor molecules are broadened. It is currently
not known how this difference impacts the distribution function without additional IR
data on the small-E collisions.
The P(E) curves in Figure 7.6 provide an excellent test of the GRETCHEN
model for predicting how large-E collisions depend on the internal energy of the donor
molecule. The GRETCHEN model is based on Fermi’s Golden Rule and the idea that
collisions of a highly-excited molecule provide time-dependent perturbations that induce
energy transfer between molecules. The probability for an energy exchange of the
amount E is predicted to be proportional to the final state density (EE). By
changing the initial state density of azulene, the curvature in the energy transfer

- 200 -
distribution function can be expected to scale with the energy dependence of the state
density.
In this study, the initial internal energy of the donor molecule is changed by a
factor of 2 leading to initial state densities that differ by nearly eight orders of magnitude.
The state densities of azulene are = 2 × 10²²
states per cm−1
at = 266 nm and = 5 ×
1014
states per cm−1
at = 532 nm, based on a direct count of harmonic states.179,180
A
semilogarithmic plot of the state density of azulene is shown in Figure 7.8 for both initial
energies as a function of E for E = 0–10000 cm−1
. The bulk of large-E collisions
between azulene(E) and CO2 induce transitions to azulene state densities that are one to
two orders of magnitude lower than the initial state density. For the energy range of
these experiments, the energy dependence of the state density for each donor is well
described by an exponential function of the form
E E = exp E (7.6)
where and are intensity and shape parameters for the state density. A fit of the two
data sets gives shape parameters of = 7.4 10−4
per cm−1
at = 266 nm and = 1.21
10−3
per cm−1
at = 532 nm. The experimental shape parameters obs are shown in
Figure 7.9 as a function of the state density parameters for azulene, along with data
from previous collisional studies of other donors with CO2. Azulene data are in excellent
agreement with the linear correlation seen for large-E collisions of other donor
molecules in collisions with CO2. This result is an important one that expands the
observed correlation of strong collision probability and state density by more than eight

- 201 -
E, cm-1
0 2000 4000 6000 8000 10000
ln ((E
-E
))
10
20
30
40
50 E=38580 cm-1
E=20390 cm-1
Azulene(E-E)
Figure 7.8 Semilogarithmic plot for azulene vibrational state density (EE) as a
function of internal energy for initial E = 38580 and 20390 cm-1
.

- 202 -
, 10
-4/cm
-1
4 6 8 10 12 14
ob
s,
10
-4 /
cm
-1
0
5
10
15
20
25
Pyrazine (266 nm)
Pyridine
Toluene
2,3,4-PicolineAzulene (266 nm)
2,6-Lutidine
Azulene
(532 nm)
C6F
6
Donor(E)+CO2
Pyrazine (309 nm)
Figure 7.9 The linear correlation of the experimental shape parameter obs and the state
density shape parameter for strong collisional quenching of CO2 with a series of
highly vibrationally excited donor molecules: azulene, 2,6-lutidine86
, picoline isomers88
,
pyrazine86
, pyridine85
, C6F694
and toluene67
.

- 203 -
orders of magnitude in state density for a single donor molecule.
The observation that large-E azulene/CO2 collisions exhibit significant energy-
dependent behavior is likely a result of the ability to change the donor energy by a factor
of 2. Previous energy-dependent experiments on pyrazine and pyridine relaxation with a
CO2 bath were carried out over smaller ranges of donor vibrational energy and showed
very little dependence on E. The pyridine experiments covered only a 10% increase in
donor energy and the pyrazine study covered a 30% increase. However the energy
dependent results presented here are consistent with the GRETCHEN model. While state
density is quite sensitive to changes in the donor energy, the shape parameters that
describe P(E) vary only slightly for relatively small changes in donor energy. This
small variation is true especially at higher donor energies. Figure 8.8 shows that for
azulene excited at 266 nm, a semilogarithmic plot of (E-E) is nearly linear for E = 0–
10000 cm−1
. According to GRETCHEN, this observation means that a single value of
obs will describe the strong collisions for this entire range of donor energies. This
behavior is not found at lower donor energies where the state density drops more strongly
as a function of E. In the pyrazine and pyridine relaxation studies, the variations in
donor energy are small enough that obs is essentially constant.
It is interesting that the correlation of the shape parameters (Figure 7.9) is best for
aromatic donor molecules that have relatively stiff structures. We have found that
aromatic donors containing ethyl or propyl groups deviate from the predictions of
GRETCHEN.118
It is the topic of Chapter 8 that strong collisions for ethylpyridine are
less significant than predicted while those for propylpyridine are more pronounced. It is
possible that donor molecules containing long chain alkyl groups exist in multiple-ring

- 204 -
configurations, at least temporarily, and that the state densities are different substantially
from those of molecules with the alkyl group in an extended configuration. It may also
be that the aromatic and aliphatic regions of these molecules do not share the vibrational
energy statistically on the time scale of collisional energy transfer.
7.4 Conclusion
We have used high resolution transient IR absorption to investigate the strong
collisions of azulene(E) with CO2 at E = 20390 and 38580 cm−1
in order to learn how
large-E collisional energy transfer is affected by nearly doubling the internal energy of
the donor molecule. The energy gain in scattered CO2 molecules that come from
collisions with E > 3000 cm−1
has been measured as a function of donor energy. Large-
E collisions with higher energy azulene produce scattered CO2 molecules that have
roughly twice the average rotational and translational energies when compared to
collisions with the lower energy azulene. The probability for large-E collisions is
roughly four times larger for the higher energy donor. The energy transfer distribution
functions for collisions with E > 3000 cm−1
have probabilities that decay exponentially
with E, and this decay is stronger for the lower energy azulene. The distribution
function for the 266 nm data agrees reasonably well with KCSI and PECT results
although the absolute probability based on IR data is lower by a constant amount. The
agreement is not as good at 532 nm. The decay parameters for the energy-dependent
distribution functions correlate extremely well with the energy dependence of the azulene
state density, as predicted by the GRETCHEN model of energy transfer. The bulk of
large-E collisions involve transitions to azulene state densities that are approximately

- 205 -
10–100 times lower than the state density at the initial vibrational energy. These
observations provide important information about the influence of state density in the
relaxation of highly excited molecules. The work reported here represents a significant
step toward a more fundamental understanding of how energy is exchanged in molecular
collisions.

- 206 -
Chapter 8: Alkylation Effects on Strong Collisions of Highly
Vibrationally Excited Alkylated Pyridines with CO2
8.1 Introduction
The weak and strong collision dynamics of CO2 with three different methylated
pyridine species were reported in Chapter 6. The study showed that the molecular
structure of the donor affects the energy transfer distribution from highly vibrationally
excited molecules. This Chapter considers how the strong collisions of highly
vibrationally excited molecules are affected by more extensive alkylation of the donor.
The strong collision component of the energy transfer distribution function is likely to be
most sensitive to the dynamics of energy transfer.
The chemistry and collisional properties of alkenes are often a function of chain
length.181,182
Walker and Morley reported that the product branching ratio in the reaction
of alkyl radicals + O2 at T = 753 K depends on the size of the alkyl reactant. The alkene
+ HO2 product channel accounts for 99% for ethyl reactants, 80% for propyl reactants,
and 50% for n-pentyl reactants.183
Tardy and Song used time-resolved optoacoustic
spectroscopy to measure energy transfer from a series of vibrationally excited fluorinated
alkenes in collisions with argon.184
For fluorinated propane through octane with Evib =
1500040000 cm-1
, they measured a decrease of 30% in energy transfer rates as the
number of modes in the donor was increased by a factor of 2.7. They attributed this
behavior to the presence of low-frequency vibrational gateway modes that remain well
populated through rapid intramolecular vibrational redistribution (IVR). Molecules with

- 207 -
longer chain lengths have a lower average energy per mode as the number of effective
vibrational modes increases for a given total energy.
The flexibility of alkylated molecules has also been recognized for enhancing
collisional energy transfer. Using the IRF technique, Toselli and Barker found that
toluene initially excited with 248-nm light has larger average energy transfer values than
does benzene for a number of atomic and molecular collision partners.55
Using the UVA
method, Troe and co-workers report that the collisional deactivation of substituted
cycloheptatrienes (E = 41900 cm-1
) with rare gases is 30 to 40% more efficient on
average for the isopropyl donor than for the ethyl donor.152,153
For molecular collision
partners, though, the dependence of the average energy loss on alkyl substitution is less
pronounced. Linhananta and Lim showed in quasiclassical trajectory calculations of
collisions of vibrationally hot ethane or propane with rare gases that methyl rotors act as
gateway modes and can introduce additional pathways that enhance collisional
relaxation.150,151
Hindered rotors at low energy act like normal vibrations, but torsional
rotors can enhance collisional energy transfer in two ways. For a free rotor, internal
torsion acts like internal rotation and converts vibrational energy to external rotation in
vibrationally hot molecules. This mechanism serves as a gateway for V (R, torsion)
energy transfer. At high energies, hindered rotors act like nearly free rotors, again
enhancing vibrational relaxation. Collisional relaxation of vibrationally hot propane is
more effective than that of ethane because propane has more torsional degrees of freedom
and a higher vibrational state density.
Not all studies agree that methyl rotors enhance collisional energy transfer.
Bernshtein and Oref compared the collisional relaxation of vibrationally excited benzene,

- 208 -
toluene, p-xylene, and azulene by collisions with argon and with cold benzene. The
structures of these donor molecules are shown in Figure 8.1.148,149
When the donor
molecules are prepared with the same initial vibrational energy (E 41000 cm-1
), the
average vibrational energy loss in collisions with cold benzene is smaller for the
methylated donors than for benzene or azulene. The fact that azulene has more efficient
energy transfer on average than p-xylene even though they have the same number of
modes suggests that the low-frequency methyl rotors of toluene and p-xylene actually
inhibit energy transfer by pulling energy away from the rest of the molecule. However,
the energy transfer values for the alkylated donors in collisions with argon are larger than
those for benzene. This result suggests that the presence of methyl rotors does not inhibit
collisional energy transfer. For both the atomic and polyatomic collision partners, large
energy transfer values correlate with the presence of low-frequency gateway modes in the
aromatic ring.
This Chapter considers the energy partitioning resulting from strong collisions of
CO2 with a series of alkylated donor species: 2-ethyl pyridine (2EP) at E = 38570 cm-1
, 2-
propylpyridine (2PP) at E = 38870 cm-1
and 2-t-butylpyridine (2tBP) at E = 39123 cm-1
.
The structures of the alkylated pyridines are shown in Figure 8.1.
The goal of this study is to develop a better understanding of how longer chain
alkyl groups impact collisional energy transfer. The experimental data show that the
probability for strong collisional energy transfer is reduced for 2EP and 2tBP relative to
2MP. The propylated donor 2PP, however, exhibits more strong collisions than does 2EP.
The curvature of the energy transfer distribution functions is compared to the state
density energy dependence for a series of donor molecules. Differences are observed for

- 209 -
N
benzene 2MP
N
toluene 2EP
N
p-xylene 2PP
N
azulene 2tBP
Figure 8.1 The structures of the aromatic donor species discussed in this Chapter.

- 210 -
the alkylated species relative to non-alkylated species. How the alkylation affects on
strong collision dynamics is discussed in terms of the competing roles of internal energy
content, vibrational mode frequencies, and larger amplitude motion that results from the
increased flexibility of longer alkyl chains.
8.2 Experimental Methods
This Chapter reports the state-resolved energy transfer to CO2 from three
alkylpyridine donors measured using a high-resolution transient IR diode laser
spectrometer. The highly vibrationally excited donor molecules (2EP, 2PP and 2tBP)
were prepared by 5 ns pulsed UV excitation at =266 nm from a Nd:YAG laser. The UV
power was kept at less than 1 MW/cm2
to minimize the multiphoton absorption. A 1:1
mixture of donor and CO2 gases was flowed into a 3 meter flowing collision cell with 20
mTorr total pressure. The average collision time was about 4 s. State-resolved energy
gain in individual CO2 rotational states was probed after the UV pulse using a single
mode diode laser operating near =4.3 µm. The transient IR probing signal was collected
at t = 1 s after the UV pulse. The amount of translational energy gained in the scattered
molecules was determined from transient Doppler broadened line profiles. Line profiles
for individual J-states of CO2 were measured by locking the IR laser to a scanning Fabry-
Perot etalon and frequency tuning over a CO2 rotational line.
The donor molecules used in this study are 2EP (C7H9N, ACROS 98+% purity),
2PP (C8H11N, Alfa Aesar 98% purity), 2tBP (C9H13N, Sigma-Aldrich) which were
degassed by the freeze-pump-thaw method before use. CO2 (Matheson, 99.995% purify)
is used directly.

- 211 -
8.3 Results and Discussion
This Section reports on the rotational and translational energy gain distributions
and rate constants of scattered CO2 molecules in high-J states (J = 6278) from strong
collisions with three alkyl-pyridine donors. Converting lab-frame translational energy
distributions into the center-of-mass frame yields the amount of donor vibrational energy
that goes into translation of the two collision partners. The rotational and translational
energy gain profiles are combined with absolute energy transfer rate measurements to
produce energy transfer distribution functions for strong collisions with E>3000 cm-1
.89
The probability distributions account for all transferred energy for the VRT pathway
except the amount that goes into rotation of the donor. There is currently not a definitive
way to measure the donor rotational energy after collisions. Here I present the nascent
energy gain results for CO2 and the resulting distribution functions. Results for 2EP, 2PP,
and 2tBP collisions are compared throughout with those from earlier studies on pyridine
(Pyr) and 2-methylpyridine (2MP).86
8.3.1 Transient Absorption Signals for CO2 (0000) From Collisions with Three
Highly Vibrationally Excited Alkyl-Pyridines (2EP, 2PP, and 2tBP)
The collisional quenching of excited donor molecules with CO2 is given by Eq 8.1.
donor E + CO2 0000
kappJ
donor E E + CO2 (0000,J,V) (8.1)
where, donor = 2EP, 2PP, 2tBP. The high-resolution transient IR diode laser probes the
appearance of scattered CO2 in high-J states (J = 6278) using P-branch transitions of the

- 212 -
anti-symmetric stretch mode at 3 = 2349 cm-1
. Figure 8.2 shows the transient absorption
signals for CO2 (0000, J = 62) that result from collisions with 2EP(E), 2PP(E) and
2tBP(E). The fractional absorption signals are converted to the state–specific number
density of scattered CO2 molecules using known IR transition line strengths.124,185
8.3.2 Translational Energy Distributions of Scattered CO2 (J = 62-78) From
Collisions with Vibrationally Excited Donors
Doppler broadened line profiles of scattered CO2 in high-J states (J = 6278) were
collected at t = 1 s after UV excitation. The three plots in Figure 8.3 show the Doppler-
broadened profiles of scattered CO2 (J = 74) following collisions with the vibrationally
excited donors (2EP, 2PP, 2tBP). In Figure 8.3, the sets of fractional IR absorption
signals (circles) are fitted by a single-Gaussian function (solid lines). The observed line
widths app are broader than the initial values at T = 300 K (dashed lines) and increase
with CO2 J state. These values are listed in Table 8.1. The data indicate that the large E
energy transfer occurs via impulsive collisions. The lab-frame translational temperature
Tapp of scattered CO2 and the center-of-mass translational temperature Trel for the
collision pairs are also reported in Table 8.1.
Figure 8.4 compares the J-dependent center-of-mass translational temperatures
Trel for collisions of CO2 with 5 different alkylated pyridine donors: Pyr, 2MP, 2EP, 2PP
and 2tBP. The effect of alkylation is clear from the top plot: pyridine releases much
more energy as translation in collisions than do the alkylated donors. However, when the
data for the four alkylated donors are compared together in the lower plot of Figure 8.4, it
is seen that 2MP consistently results in more product translational energy than do 2EP,
2PP and 2tBP. This observation is consistent with what one would expect for impulsive

- 213 -
Fra
ctio
na
l IR
Ab
so
rptio
n
0.00
0.10
0.20
Fra
ctio
na
l IR
Ab
so
rptio
n
0.00
0.05
0.10 2EP(E)
2PP(E)
Time, s
-2 0 2 4 6 8
Fra
ctio
na
l IR
Ab
so
rptio
n
0.00
0.04
0.08
0.12 2tBP(E)
Figure 8.2 Transient IR absorption signals for appearance of CO2 (0000, J = 62) through
collisions with three donors, 2EP, 2PP, and 2tBP, initially excited with = 266 nm. The
populations of scattered CO2 are collected at t=1 µs after UV pulse from the single
collision which average collision times are 45 s.

- 214 -
Fra
ctio
na
l IR
Ab
so
rptio
n0
2e-3
4e-3
6e-3
Fra
ctio
na
l IR
Ab
so
rptio
n
0
2e-3
4e-3
6e-3
Tapp,lab=830 K
Wavenumbers from Linecenter, cm-1
-0.02 -0.01 0.00 0.01 0.02
Fra
ctio
na
l IR
Ab
so
rptio
n
0.0
1.5e-3
3.0e-3
4.5e-3
Tapp,lab=730 K
2tBP(E) + CO2
T0=298 K
Tapp,lab=730 K
2PP(E) + CO2
2EP(E) + CO2
T0=298 K
T0=298 K
Figure 8.3 Nascent Doppler-broadened line profiles for CO2 (00
00, J = 72) following
collisions with vibrationally excited (a) 2EP, (b) 2PP and 2tBP (c). The solid circles are
the transient IR absorption signals at 1 μs after the UV pulse. The line profiles are
Gaussian fits shown as the solid curves. The full width at half-maximum of scattered
CO2 through collisions with the vibrationally excited donors is broader than 298 K
(dashed lines).
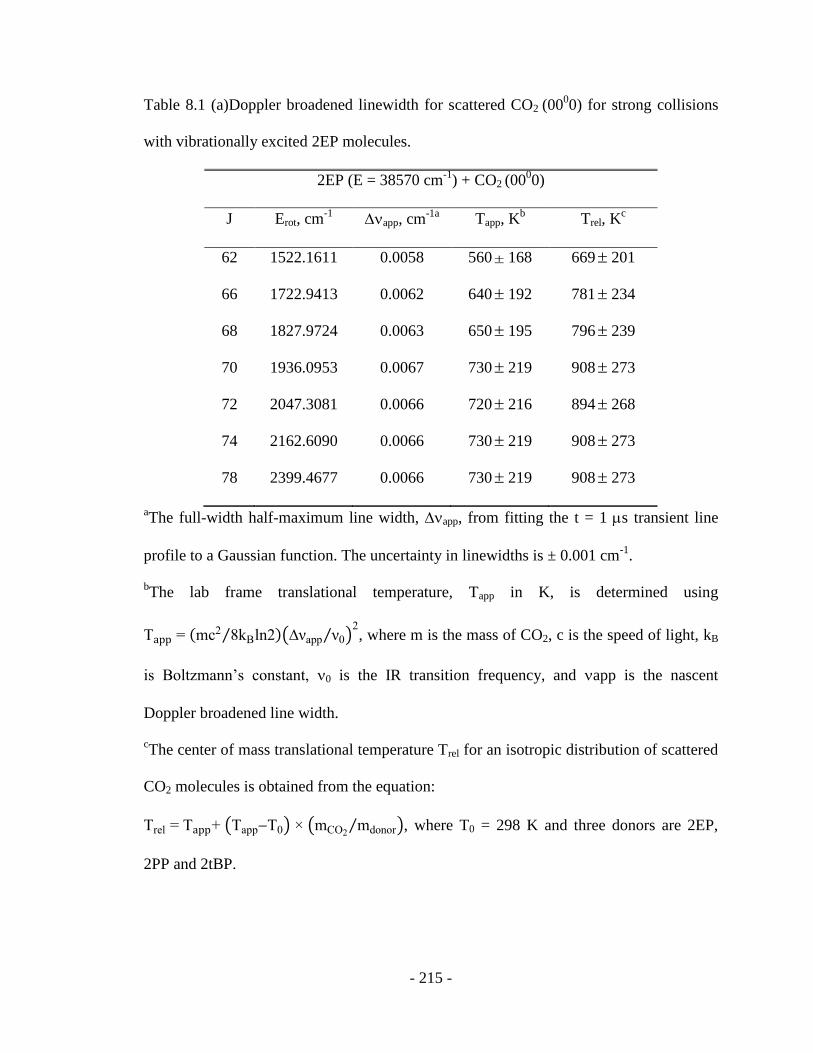
- 215 -
Table 8.1 (a)Doppler broadened linewidth for scattered CO2 (0000) for strong collisions
with vibrationally excited 2EP molecules.
2EP (E = 38570 cm-1
) + CO2 (0000)
J Erot, cm-1
app, cm-1a
Tapp, Kb Trel, K
c
62 1522.1611 0.0058 560 168 669 201
66 1722.9413 0.0062 640 192 781 234
68 1827.9724 0.0063 650 195 796 239
70 1936.0953 0.0067 730 219 908 273
72 2047.3081 0.0066 720 216 894 268
74 2162.6090 0.0066 730 219 908 273
78 2399.4677 0.0066 730 219 908 273
aThe full-width half-maximum line width, app, from fitting the t = 1 s transient line
profile to a Gaussian function. The uncertainty in linewidths is ± 0.001 cm-1
.
bThe lab frame translational temperature, Tapp in K, is determined using
T = mc2 8kBln2 νapp ν0 2, where m is the mass of CO2, c is the speed of light, kB
is Boltzmann’s constant, 0 is the IR transition frequency, and app is the nascent
Doppler broadened line width.
cThe center of mass translational temperature Trel for an isotropic distribution of scattered
CO2 molecules is obtained from the equation:
Trel = T + TappT0 mCO2mdonor , where T0 = 298 K and three donors are 2EP,
2PP and 2tBP.
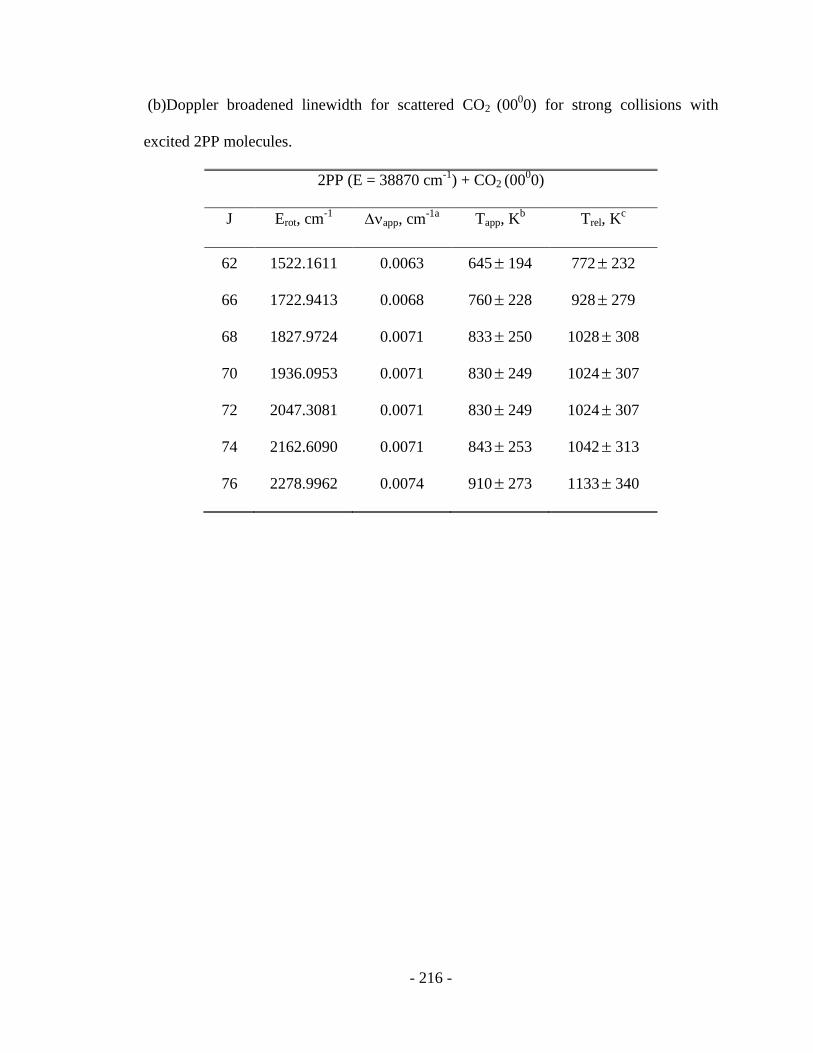
- 216 -
(b)Doppler broadened linewidth for scattered CO2 (0000) for strong collisions with
excited 2PP molecules.
2PP (E = 38870 cm-1
) + CO2 (0000)
J Erot, cm-1
app, cm-1a
Tapp, Kb Trel, K
c
62 1522.1611 0.0063 645 194 772 232
66 1722.9413 0.0068 760 228 928 279
68 1827.9724 0.0071 833 250 1028 308
70 1936.0953 0.0071 830 249 1024 307
72 2047.3081 0.0071 830 249 1024 307
74 2162.6090 0.0071 843 253 1042 313
76 2278.9962 0.0074 910 273 1133 340

- 217 -
(c)Doppler broadened linewidth for scattered CO2 (0000) for strong collisions with the
highly vibrationally excited 2tBP molecules.
2tBP (E = 39123 cm-1
) + CO2 (0000)
J Erot, cm-1
app, cm-1a
Tapp, Kb Trel, K
c
62 1522.1611 0.0062 620 186 730 219
66 1722.9413 0.0068 760 228 910 273
68 1827.9724 0.0078 910 273 890 267
70 1936.0953 0.0067 800 240 970 291
72 2047.3081 0.0065 720 216 860 258
74 2162.6090 0.0071 810 243 980 294
76 2399.4677 0.0071 840 252 1110 333
78 2278.9962 0.0079 1050 315 1290 387

- 218 -
Rela
tive T
ransla
tional E
nerg
y, K
1000
2000
3000
4000
5000
6000PYR
2MP
2PP
2tBP
2EP
CO2 Rotational State, J
60 62 64 66 68 70 72 74 76 78 80
600
800
1000
1200
14002MP
2PP
2tBP
2EP
Figure 8.4 The relative translational temperatures Trel that describe the translational
energy distributions between recoiling donors and CO2 (0000, J = 6278) are shown in
two plots. The upper plot compares the translational energy distributions of the alkylated-
pyridines with that for pyridine. Donor alkylation reduces the translational energy of the
scattered CO2 molecules. The lower plot compares Trel for different alkylated donors.
The increase in Trel with CO2 J-state is consistent with an impulsive energy transfer
mechanism. For a given J-state, Trel generally follows the ordering of 2MP > 2PP >
2tBP > 2EP.

- 219 -
collisions of different-sized donor molecules containing nearly the same internal energy.
The internal energy is spread among more degrees of freedom as the number of
vibrational modes increases and less energy is imparted through collisions. The addition
of longer chain alkyl groups in particular introduces low frequency torsions and hindered
or nearly free rotors that are preferentially populated by IVR.
For 2EP, 2PP and 2tBP, the amount of energy released into translation via strong
collisions does not correlate directly with the number of carbons in the alkyl group. The
observed trend in energy transfer via strong collisions as a function of alkyl group length
is propyl > t-butyl > ethyl. This observation suggests that chain length is an important
factor in strong collisional energy transfer. In this way, the translational energy of
products from strong collisions increases due to the larger amplitude motion that comes
from increased chain length. We note that the differences in the translational energies for
strong collisions of three alkyl pyridines are relatively small and that the translational
temperatures from three donors are within experimental error, as listed in Table 8.1.
Nonetheless, the recoil velocities from the propylpyridine are consistently larger than
those for 2tBP and 2EP. We estimated that the chain length for the propyl substituent is
~ 50% larger than for 2tBP and 2EP.
8.3.3 Rotational Energy Gain of Scattered CO2 from Donors (2EP, 2PP and 2tBP)
The nascent rotational energy gained by scattered CO2 (0000) in J = 6278 was
measured for collisions with vibrationally excited 2EP, 2tBP and 2PP. Figure 8.5 shows
the rotational distributions of scattered CO2 in high-J states. The high-J populations are
single-exponential distributions with rotational temperatures Trot that are determined from
the slope of the semi-log plot. The scattered CO2 rotational distributions for collisions

- 220 -
ln(p
op
/g)
15.2
16.0
16.8
17.6
18.4
ln(p
op
/g)
15.2
16.0
16.8
17.6
18.4
CO2 Rotational Energy, cm
-11400 1600 1800 2000 2200 2400
ln(p
op
/g)
16.0
16.8
17.6
18.4
19.2
2EP(E) + CO2
2tBP(E) + CO2
2PP(E) + CO2
Trot= 590 K
Trot= 600 K
Trot= 580 K
Figure 8.5 Nascent rotational distributions of scattered CO2 (00
00, J = 6278) at t = 1 μs
following collisions with highly vibrationally excited three alkylated pyridine: 2EP, 2tBP,
and 2PP. The rotational distributions of scattered CO2 through collisions with three
donors are similar Trot~ 590 60 K.

- 221 -
with the three donors are nearly the same: Trot = 590 ± 60 K for 2EP, Trot = 580 ± 60 K for
2PP and Trot = 600 ± 60 K for 2tBP.
Within the error, the values of Trot for strong collisions of the alkylated donors are
similar to the values for methylated donors: Trot = 610 ± 60 K for 2MP and Trot = 540 ± 60
K for 2,6MP. For the large-E component, the average rotational energy gained for
scattered CO2 from each alkylated pyridine donors is Erot = kB (TrotT0) ~ 210 cm-1
where kB is Boltzmann constant and T0 = 298 K. In contrast, when pyridine is the energy
donor, the scattered high-J CO2 molecules have a rotational temperature of Trot = 835 K.
Pyridine collisions result in a larger average increase in CO2 rotational energy of Erot
= 370 ± 60 cm-1
. Donor alkylation reduces the amount of energy that goes into CO2
rotation and this effect is same for methyl, ethyl, t-butyl, and propyl substituents.
The experimental results presented here and in previous several Chapters show
that angular momentum changes in collisions correlate with changes in recoil velocity.
The change in total angular momentum vector ΔJ total is the product of the impact
parameter b, the reduced mass µ, and the change in recoil velocity, as shown in Eq 8.2.
J total = L +J rot = L +J bath+J donor = μb v rel (8.2)
Here ΔJ total is the sum of changes in orbital angular momentum L and rotational angular
momentum J rot for both collision partners. Currently there is no direct way to measure
the product rotational states of the hot donor molecule. However, we take final J bath as a
lower limit to final J rot based on Lawrence and Waclawik’s study.131
In Table 8.2, the
values of ΔJbath and Δvrel for CO2 are listed.

- 222 -
Table 8.2 (a) The average changes in angular and linear momentum in CO2 from
collisions with highly vibrationally excited 2EP molecules.
2EP (E = 38570 cm-1
) + CO2
CO2 J J , a vlab , m/s
b vrel , m/s
c vrel , m/s
d bmin, Å
e
62 55.3 560 726 238 4.7
66 59.8 600 787 299 4.1
68 62.0 611 803 314 4.0
70 64.2 650 862 374 3.5
72 66.3 641 848 360 3.7
74 68.5 642 849 361 3.9
78 72.8 643 851 363 4.1
a J in is the average change of CO2 angular momentum which is determined using
Jbath = Jfinal2 Jinitial
2 , where Jinitial~22.
aAverage velocity in the lab frame of scattered CO2 molecules determined using
vlab = 3kBTapp
mCO2
1
2
, where kB is the Boltzmann constant, mCO2is the mass of CO2 molecule.
The values of Tapp are listed in Table 7.1.
c vrel , the average velocities in the center-of-mass of donor (E)/CO2 systems are
calculated by using vrel = M mdonor vlab 2 3kBT M 1 2 , where the sum of mass
M= mdonor+ mCO2 and mdonor is the mass of alkylated pyridine (2EP, 2PP and 2tBP).

- 223 -
dAverage change in center-of-mass velocity vrel in m s
-1 is calculated by an
equation: vrel = vrel 3kBT0
μ
1
2, where µ is the reduced mass for pyrazine/CO2 pair
and T0 = 298 K.
ebeff, effective impact parameter for donor (E)/CO2 system is from Jbath μ vrel beff
while donors are 2EP, 2PP and 2tBP.

- 224 -
(b) The average changes in angular and linear momentum in CO2 from collisions with
highly vibrationally excited 2PP molecules.
2PP (E = 38870 cm-1
) + CO2
CO2 J J , a vlab , m/s
b vrel , m/s
c vrel , m/s
d bmin, Å
e
62 55.3 609 778 298 3.7
66 59.8 658 850 370 3.2
68 62.0 688 892 413 3.0
70 64.2 689 893 414 3.1
72. 66.3 690 894 415 3.1
74 68.5 690 895 416 3.2
76 70.7 721 939 460 3.0

- 225 -
(c) The average changes in angular and linear momentum in CO2 from collisions with
highly vibrationally excited 2tBP molecules.
2tBP (E = 39123 cm-1
) + CO2
CO2 J J , a vlab , m/s
b vrel , m/s
c vrel , m/s
d bmin, Å
e
62 55.3 599 747 274 3.9
66 59.8 658 830 357 3.2
68 62.0 756 965 492 2.4
70 64.2 650 818 345 3.6
72. 66.3 631 792 319 4.0
74 68.5 690 874 401 3.3
76 70.7 691 875 402 3.4
78 72.8 770 984 511 2.7

- 226 -
An effective impact parameter beff for each donor/CO2 pair was determined by the
average change of CO2 angular momentum ΔJbath shown Jbath μbeff vrel . The
correlation between beff and ΔJbath for each donor is in Figure 8.6. The strong collisions
of the alkylated pyridine donors (2EP, 2PP and 2tBP) with CO2 are characterized by beff
= 4.0, 3.3 and 3.3 Å, respectively. From previous studies, pyridine and 2MP with CO2
have the impact parameters of beff = 1.4 and 2.9 Å respectively.87,91
This result indicates
that the alkylated donors undergo strong collisions at larger impact parameters than do
nonalkylated donors. This result suggests that large amplitude motion of the alkyl groups
is involved in strong collisions.
The ratio of beff to the Lennard-Jones parameter provides some information
about the region of the donor/CO2 interaction potential that is probed in these studies.
The Lennard-Jones parameters for the donor/CO2 pairs are = 4.87 Å (pyridine), 5.04
Å (2MP), 5.28 Å (2EP), 5.45 Å (2PP) and 5.58 Å (2tBP). The ratio of σ is 29% for
pyridine, while for the alkylated 2MP, 2EP, 2PP and 2tBP donors, σ 57, 75, 60
and 59%, respectively. This result shows that the collisions studied here probe different
regions of the intermolecular potential and are sensitive to donor alkylation. In each case,
the collisions have beff values that are less than , showing that the repulsive part of the
potential is involved in the strong collision relaxation, but collisions of the alkylated
donors are apparently less repulsive than the pyridine collisions. This effect is most likely
due to the lower average energy per mode in the alkylated donors. Other factors could
also contribute, including structural and electrostatic differences that are affected by high
levels of vibrational excitation. For example, the similarity of σ for 2MP and 2PP
may suggest that the propyl group in 2PP is not fully extended during collisions with CO2.

- 227 -
<Jbath
>
50 55 60 65 70 75 80
be
ff,
10
-10 m
1
2
3
4
5
Pyr
2MP
2EP
2PP
2tBP
Figure 8.6 The effective impact parameter beff is a function of the average change of CO2
angular momentum ΔJbath . Values of beff for CO2 with pyridine and alkylated pyridine
pairs are compared.

- 228 -
8.3.4 State-Resolved Energy Transfer Rate Constants
for 2EP, 2tBP, and 2PP
with CO2
State-resolved rate constants kappJ
for energy transfer from 2EP, 2tBP and 2PP to
CO2 via strong collisions were determined by measuring the early time appearance of
CO2 in high-J states, as described in Eq 8.1. CO2 populations were measured at t = 1 s
after donor excitation where the donor and CO2 bath concentrations are essentially given
by their respective values at t = 0. Under these early time conditions, rate constants were
determined for known initial donor and CO2 bath concentrations using Eq 8.3.
kappJ
= CO2 00
00, J
Donor E 0 CO2 0 t
(8.3)
The scattered CO2 populations include contributions from the Doppler-broadened line
widths. The rate constants for the strong collisions that quench 2EP, 2tBP and 2PP are
listed in Table 8.3.
Figure 8.7 compares the energy transfer rates for strong collisions of pyridine, 2MP, 2EP,
2PP and 2tBP with CO2. Generally, the ordering of rates goes as 2PP > 2MP > 2EP ~
2tBP > Pyr. To account for differences in the collision rates for the different donors, it is
useful to compare the energy transfer on a per-collision basis by normalizing the energy
transfer rate to the Lennard-Jones collision rate. The collision rate depends on the
collisional cross section reduced mass and translational temperature. The Lennard-Jones
collision rates for 2EP, 2PP and 2tBP with CO2 are listed in Table 8.3. Values of
collision rates for pyridine/ CO2 and 2MP/CO2 are kLJ = 5.58 10-10
cm3 molecule
−1 s
−1

- 229 -
Table 8.3 Appearance energy transfer rate constants of scattered CO2 (0000, J) through
collisions with highly vibrationally excited donors: 2EP, 2PP, 2tBP.
CO2 (0000) kapp
J, 10
-13 cm
3 molecule
-1 s
-1
J state Erot, cm-1
2EP 2PP 2tBP
E = 38570 cm-1
E = 38870 cm-1
E= 39123 cm-1
62 1522.1611 15.7 4.7 20.0 6.0 15.4 4.6
64 1621.0037 11.3 3.4 17.0 5.1 11.8 3.5
66 1722.9413 8.7 2.6 11.1 3.3 8.8 2.6
68 1827.9724 7.6 2.3 11.1 3.3 5.7 1.7
70 1936.3081 6.2 1.9 8.5 2.6 5.2 1.6
72 2047.3081 4.5 1.4 6.7 2.0 4.8 1.4
74 2162.6090 3.5 1.1 5.1 1.5 2.5 0.8
76 2278.9962 3.8 1.1
78 2399.4677 2.0 0.6 3.1 0.9 1.4 0.4
kint, 10-12
cm3 molecule
-1 s
-1a
for J = 6278
6.2 1.9 8.6 2.6 5.8 1.7
kLJ, 10-10
cm3 molecule
-1 s
-1b 6.39 6.76 7.05
aIntegrated collision constant, kint in cm
3 molecule
−1 s
−1 is the sum of state-specific
collision rates of CO2 at J = 6278 through collisions with three alkylpyridine donors.
bThe Lennard-Jones collision rate constant kLJ for three alkylpyridine donors with CO2
molecules are determined in Appendix B. The Lennard-Jones parameters are also
described there.

- 230 -
CO2 Rotational Quantum Number J
60 62 64 66 68 70 72 74 76 78 80
En
erg
y T
ran
sfe
r P
rob
ab
ility
PJ
0
1e-3
2e-3
3e-3
4e-3 2PP
2EP
2MP
2tBP
PYR
kJ
ap
p,
10
-12 c
m3 m
ole
cu
le-1 s
ec
-1
0.0
0.5
1.0
1.5
2.02PP
2EP
2MP
2tBP
PYR
Figure 8.7 Absolute state-specific rate constants kapp
J and energy transfer probabilities
PJ(E) for initial appearance of scattered CO2 (0000, J = 6278) following collisions with
five donors: Pyr, 2MP, 2EP, 2tBP, and 2PP. Probabilities are based on the Lennard-
Jones collision rate. The ordering of rates for appearance of a given CO2 state is 2PP >
2MP > 2EP ~ 2tBP > Pyr; the ordering of probabilities for CO2 states is 2PP ~ 2MP >
2EP > 2tBP > Pyr.

- 231 -
and 5.86 10-10
cm3 molecule
−1 s
−1, respectively.
Energy transfer probabilities PJ were calculated by PJ = kappJ
kLJ and are shown in
Figure 8.7 for the five donor-CO2 pairs. Compared on a per-collision basis, the ordering
of the energy transfer probability goes as 2PP ~ 2MP > 2EP > 2tBP > Pyr with the J-
specific probabilities for 2PP relaxation being about twice those of pyridine. The
observed ordering of energy transfer probabilities may be a result of increasing state
density in the larger donor molecules. However, comparison with the other donors shows
that 2MP has larger rates and probabilities than 2EP, which is not predicted on the basis
of donor size.
8.3.5 Energy Transfer Distribution P(E) for Strong Collisions of Donors with CO2.
Energy transfer distribution functions for strong collisions of 2EP, 2tBP and 2PP
with CO2 were determined from measurements of rate constants and CO2 energy gain by
considering the combined distribution of rotational and translational energy for the
scattered CO2 molecules. The procedure for this transformation has been presented
previously and the essential points are discussed here.89
The key idea is to convert from
state- and velocity- indexed data to a E-indexed probability. Each J state of CO2 has a
velocity distribution whose width is specified by the spectral Doppler-broadening and a
probability that is determined by the ratio of the rate constant to the collision rate. The
probability distribution for the change in energy E is obtained by subtracting the
average initial rotational and translational energies. The overall energy transfer
probability distribution function P(E) results from summing over the distribution
functions of individual CO2 J states. The only assumptions in this transformation are the
values of the precollision energies and the collision rate. Scattered CO2 molecules in low

- 232 -
J states have not been characterized in these studies so the P(E) curves are complete for
E > 3000 cm-1
. Contributions to E from donor rotation are not accounted for in the
probability distributions. Simulations indicate that donor molecules can gain rotational
energy through quenching collisions, but this effect is most pronounced in collisions with
rare gas atoms.186
The extent of rotational energy gain in the donors is expected to be
less than for CO2 based on the conservation of angular momentum and the relatively
small rotational constants for the donor molecules.
The energy transfer distribution functions P(E) for the strong collisions of Pyr,
2MP, 2EP, 2tBP and 2PP with CO2 are shown in Figure 8.8 based on Lennard-Jones
collision rates. Pyridine has the largest probability for strong collisions with E > 3000
cm-1
. Among the alkylated donors, 2MP and 2PP have similar P(E) curves while 2EP
and 2tBP have the lowest probabilities for strong collisions.
Figure 8.8 highlights several important features for strong collisions with CO2.
Strong collisional energy transfer is favored for smaller donor molecules that on average
have more energy per mode than do the larger donor molecules for the same initial
energies. The alkylated donors have less energy per mode on average than do non-
alkylated donors and in general the likelihood of strong collisions for these former donors
is reduced. For the alkylated donors, the probability of strong collisions is ordered as
2MP~2PP>2EP~2tBP. It is interesting that P(E) curves for 2EP and 2tBP are very
similar. The ethyl and t-butyl groups are believed to extend some distance from the ring,
suggesting that the alkyl chain is important in the collision dynamics. However, 2PP,
which has the longest propyl chain, imparts substantially more energy to the rotational
and translational degrees of freedom of CO2 in single collisions with E > 3000 cm-1
than
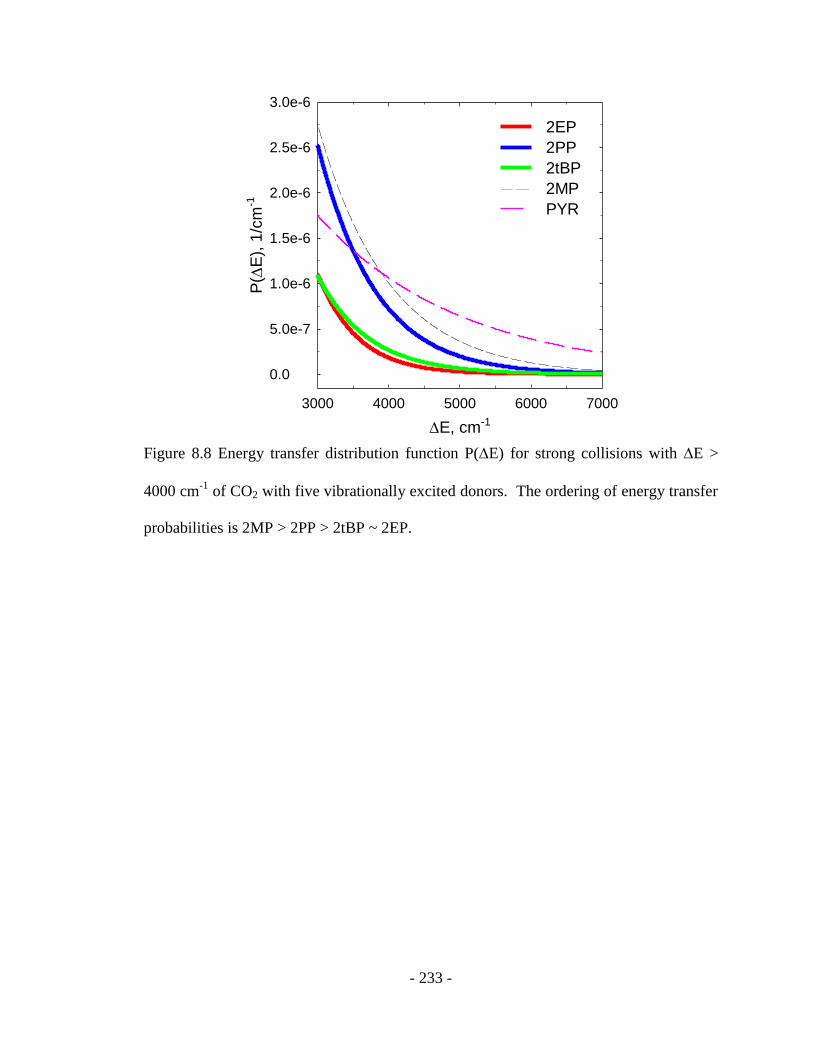
- 233 -
E, cm-1
3000 4000 5000 6000 7000
P(
E),
1/c
m-1
0.0
5.0e-7
1.0e-6
1.5e-6
2.0e-6
2.5e-6
3.0e-6
2EP
2PP
2tBP
2MP
PYR
Figure 8.8 Energy transfer distribution function P(E) for strong collisions with E >
4000 cm-1
of CO2 with five vibrationally excited donors. The ordering of energy transfer
probabilities is 2MP > 2PP > 2tBP ~ 2EP.

- 234 -
does 2EP and 2tBP. This result is not consistent with the lower average energy per mode
of 2PP. It is possible that differences in the potentials of the torsional and methyl rotor
vibrations of the various donors contribute to the observed differences in P(E) curves.
Simulations on smaller molecules such as ethane and propane have already provided
important clues as to how methyl and ethyl torsional motion can enhance vibrational
relaxation, and future theoretical studies on mixed alkyl aromatic molecules may provide
additional insight.150,151
It may be that the longer alkyl chain in 2PP introduces new dynamical effects that
are not present in aromatic and methylated aromatic species. Longer-chain alkyl groups
can undergo larger-amplitude motion, and whiplike motions of the propyl chain may
account for the enhanced strong collisions in 2PP. The possibility for such interactions
would be enhanced by chattering collisions in which the donor and bath molecules
undergo multiple impulsive encounters during a single “collision.” Trajectory
calculations of the strong collisions between pyrazine(E = 37900 cm-1
) with CO2 find that
nearly 50% of strong collisions have multiple direct encounters.45
The simulations show
that typical chattering collisions involve low relative translational energies and
correspondingly small increases in internal rotation of the collision pair. Linhananta and
Lim observed chattering collisions for propane (E = 41000 cm-1
) with argon and found
that collisional energy transfer increased with the number of encounters.36
The presence
of this type of long-lived collision complex could help facilitate energy transfer that
involves large amplitude motion of the propyl chain.
It is also possible that the longer chain length of 2PP introduces new possibilities
for constrained configurations that increase the mode frequencies of the propyl group.

- 235 -
Models based on simple geometric considerations indicate that the propyl group in 2PP is
long enough to form a secondary ringlike structure adjacent to the pyridine ring.
Constraining the propyl group configuration would actually increase the energy content
of the aromatic ring, which in turn could enhance the strong collisions. This scenario is
in agreement with the simulation results of Bernshtein and Oref showing that collisional
energy transfer from azulene(E) to benzene is larger than that for p-xylene(E).149
Even
though the two donors have the same number of modes, the stiffer ring system has higher
mode frequencies and more vibrational energy transfer. It is not clear, however, why the
simulations do not show a similar effect when argon is the quencher.
8.3.6 The Effect of State Density on Large-E Energy Transfer
The role of donor state densities in the collisional relaxation of vibrationally
excited azabenzenes with bath molecules has been discussed previously for non-alkylated
aromatic molecules. This Chapter explores the relationship between donor state density
and energy transfer for the alkylated pyridines.
Earlier studies in our laboratories and Chapter 7 have shown that the curvature of
the probability distribution function for strong collisions of highly excited azabenzenes
and methylated azabenzenes correlates with the energy dependence of the vibrational
state density, as shown in Figure 8.9. Figure 8.9 shows that there is a linear correlation
between the curvature of the probability distribution function (obs) and the curvature of
the vibrational state density (). Such a correlation is also seen for collisions of these
donors with H2O.83
Based on Fermi’s Golden Rule, Mullin and co-workers proposed a model called
GRETCHEN (Golden Rule Excitation Transfer in Collisions of High Energy Molecules),

- 236 -
, 10-4/cm
-1
4 5 6 7 8 9 10 11 12 13
o
bs, 1
0-4
/cm
-1
0
4
8
12
16
20
24
pyrazine
pyridine
2MP3MP4MP
2,6MP
azulene(266 nm)
azulene(532 nm)
Figure 8.9 The relationship between obs for strong collisions and the vibrational state
density energy dependence parameter for collisions of CO2 with highly vibrationally
excited donors: pyrazine, pyridine, methylpyridine isomers (2MP, 3MP, 4MP), 2,6MP
from the previous studies83,86,88
and azulene with different internal energies (Chapter 7).
For these donor-CO2 pairs, there is a linear correlation between the parameters and
obs.
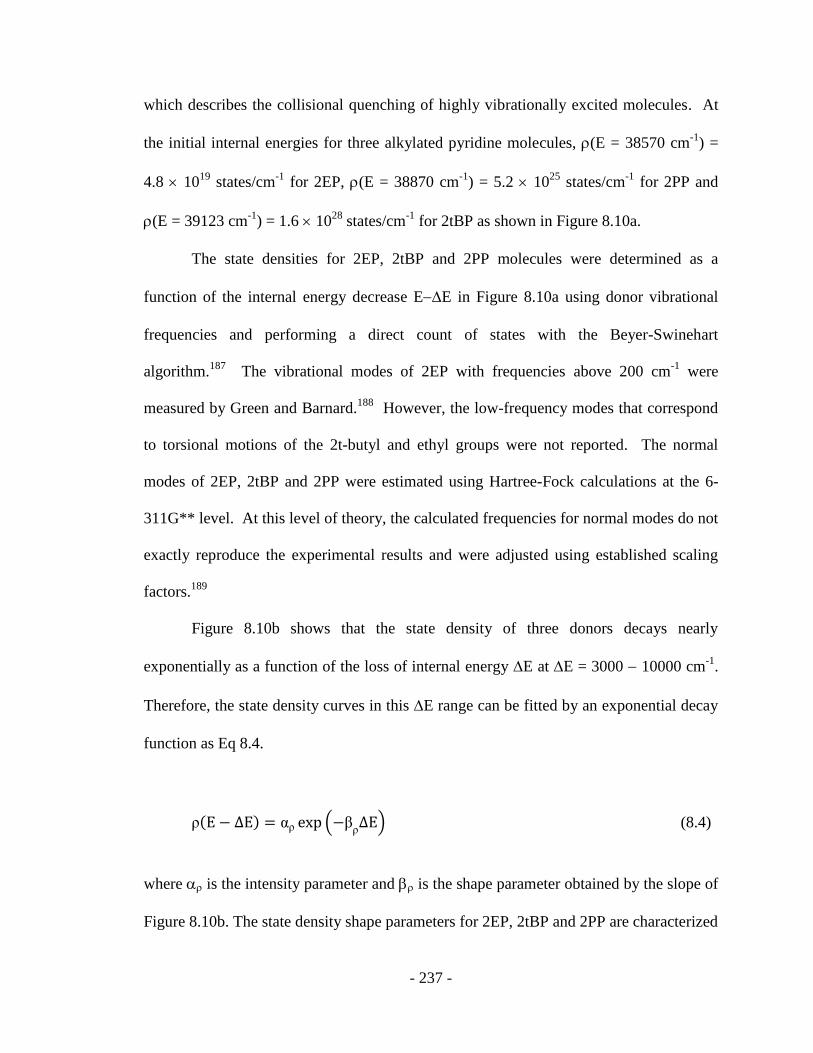
- 237 -
which describes the collisional quenching of highly vibrationally excited molecules. At
the initial internal energies for three alkylated pyridine molecules, (E = 38570 cm-1
) =
4.8 1019
states/cm-1
for 2EP, (E = 38870 cm-1
) = 5.2 1025
states/cm-1
for 2PP and
(E = 39123 cm-1
) = 1.6 1028
states/cm-1
for 2tBP as shown in Figure 8.10a.
The state densities for 2EP, 2tBP and 2PP molecules were determined as a
function of the internal energy decrease EE in Figure 8.10a using donor vibrational
frequencies and performing a direct count of states with the Beyer-Swinehart
algorithm.187
The vibrational modes of 2EP with frequencies above 200 cm-1
were
measured by Green and Barnard.188
However, the low-frequency modes that correspond
to torsional motions of the 2t-butyl and ethyl groups were not reported. The normal
modes of 2EP, 2tBP and 2PP were estimated using Hartree-Fock calculations at the 6-
311G** level. At this level of theory, the calculated frequencies for normal modes do not
exactly reproduce the experimental results and were adjusted using established scaling
factors.189
Figure 8.10b shows that the state density of three donors decays nearly
exponentially as a function of the loss of internal energy E at E = 3000 10000 cm-1
.
Therefore, the state density curves in this E range can be fitted by an exponential decay
function as Eq 8.4.
(8.4)
where is the intensity parameter and is the shape parameter obtained by the slope of
Figure 8.10b. The state density shape parameters for 2EP, 2tBP and 2PP are characterized
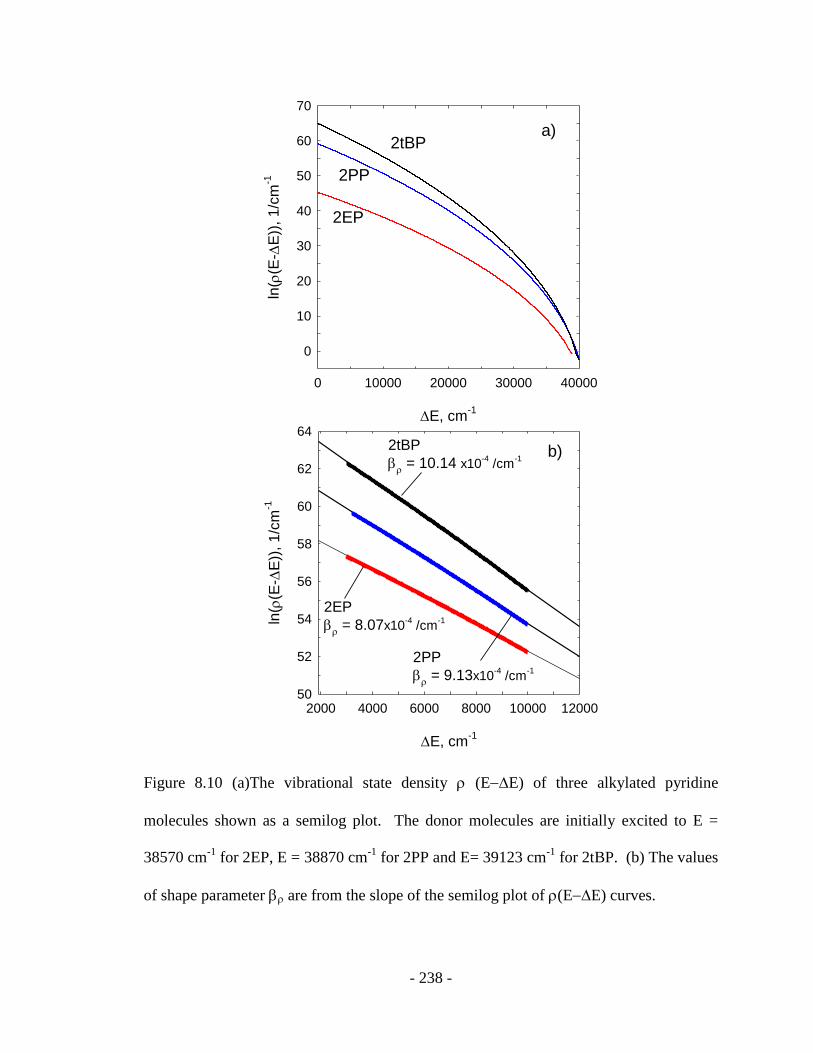
- 238 -
E, cm-1
0 10000 20000 30000 40000
ln(
(E-
E))
, 1
/cm
-1
0
10
20
30
40
50
60
70
2EP
2PP
2tBP
E, cm-1
2000 4000 6000 8000 10000 12000
ln(
(E-
E))
, 1
/cm
-1
50
52
54
56
58
60
62
64
2EP
= 8.07x10
-4 /cm
-1
2PP
= 9.13x10
-4 /cm
-1
2tBP
= 10.14 x10
-4 /cm
-1
a)
b)
Figure 8.10 (a)The vibrational state density (EE) of three alkylated pyridine
molecules shown as a semilog plot. The donor molecules are initially excited to E =
38570 cm-1
for 2EP, E = 38870 cm-1
for 2PP and E= 39123 cm-1
for 2tBP. (b) The values
of shape parameter are from the slope of the semilog plot of (EE) curves.

- 239 -
by = 8.0710-4
/cm-1
for 2EP, = 10.1410-4
/cm-1
for 2tBP,and = 9.1310-4
/cm-1
for 2PP. The ordering of the three is 2tBP > 2PP > 2EP.
P(E) curves such as those shown in Figure 8.8 characterize the probability that a
vibrationally hot molecule will lose an amount of energy E through collisions with CO2.
The curve for each donor is fit using a single-exponential decay with Eq 8.5.
E = obsexp( obs E) (8.5)
where obs and obs are fitting parameters. obs describes the relative weighting of weak
to strong collisions for a given donor. Figure 8.11 is the semilog plot of P(E) curves for
three alkylpyridine/CO2 pairs. The values of the slope are the shape parameters obs: obs
= 1.5310-3
/cm-1
for 2EP, obs = 1.2910-3
/cm-1
for 2PP and obs = 1.3210-3
/cm-1
for
2tBP. The ordering of obs for the three donors is 2tBP~2PP>2EP.
Figure 8.12 shows the obs values for 2EP, 2PP and 2tBP along with a number of
other donor molecules: pyrazine, pyridine, azulene, methylpyridine isomers (2MP, 3MP,
and 4MP), and 2,6-dimethylpyridine (2,6MP). In general, the data show that the larger
donor molecules have larger values of both obs and . For a given energy loss transition
of E, larger donor molecules have greater mismatches in their state densities before and
after the collision. This mismatch correlates with a reduction in the likelihood of energy
transfer relative to smaller E values and leads to a steeper slope in lnP(E) for the larger
donor molecules, hence a larger value. This behavior is evident from data for the non-
alkylated and methylated donors in Figure 8.9. It is important to clarify that the data in

- 240 -
E, cm-1
0 2000 4000 6000 8000 10000
lnP
(E
)
-24
-20
-16
-12
-8
-4
bobs
= 1.32x10⁻³
/cm-1
2tBP
2EP
2PP
obs
= 1.29x10⁻³
/cm-1
obs
= 1.53x10⁻³
/cm-1
Figure 8.11 Semilog plot of P(E) curve with E > 3000 cm-1
for strong collisions of
vibrationally excited 2EP, 2tBP and 2PP with CO2. The slope of the curve is the shape
parameter obs.

- 241 -
, 10-4/cm
-1
4 5 6 7 8 9 10 11 12 13
obs, 10
-4/c
m-1
0
4
8
12
16
20
24
pyrazine
pyridine
2MP3MP4MP 2,6MP
2EP
2PP 2tBP
azulene(532 nm)
azulene(266 nm)
Figure 8.12 The relationship between obs for strong collisions and the vibrational state
density energy dependence parameter for collisions of CO2 with highly vibrationally
excited donors: pyrazine, pyridine, azulene with two internal energies, methylpyridine
isomers (2MP, 3MP, 4MP), 2,6MP, 2EP, 2PP, and 2tBP. A linear correlation between
two parameters is shown for non-alkylated donors and donors containing methyl groups.
For donors with larger alkyl groups, obs no longer correlates with changes in state
density associated with E.

- 242 -
Figure 8.9 consider the curvature of the energy transfer distribution functions, not the
absolute probability itself. At a given internal energy, larger donor molecules have high
state densities and are predicted by Fermi’s Golden Rule to have larger energy transfer
probabilities. The experimental data in this Chapter are generally in agreement with this
prediction, but more specific correlation of the energy transfer probability with the donor
state density cannot be made without additional knowledge of the matrix elements that
couple the initial and final states.
The correlation of obs and for 2EP, 2PP and 2tBP in Figure 8.12 show
deviations from the linear correlation seen for the non-alkylated and methylated donors.
Collisions with E > 3000 cm-1
for 2EP are not as strong as predicted by the state density
energy dependence and for 2PP and 2tBP the collisions are stronger than predicted. It is
possible that the correlation of the probability distribution curvature (obs) correlates with
state density energy dependence () only holds for aromatic systems with hydrogen or
methyl substituents. It is also possible that dynamical effects such as large amplitude
motion of longer chain alkyl groups and ring closing mechanisms are responsible for the
observed deviations. Such effects are not accounted for by statistical state densities. The
effect of anharmonicity was not included in the state density calculations but it is unlikely
that anharmonicity would lead to the observed shifts in the obs values for 2EP, 2tBP and
2PP.
8.4 Conclusion
The effect of alkylation on the strong collisional energy transfer between CO2 and
a series of highly vibrationally excited alkylpyridines (E ~ 38400 cm-1
) where alkyl =
methyl, ethyl, and propyl have been investigated. The nascent rotational and translational

- 243 -
energy distributions for scattered CO2 molecules were measured under single collision
conditions using high-resolution transient IR absorption. Strong collisions between
pyridine and CO2 lead to substantially more rotational and translational energy in the
scattered molecules than for the alkylated donors. Differences are also seen in the
distribution functions for the strong collisions of the alkylated donors. The ordering of
strong collision probabilities with CO2 is pyridine > 2MP 2PP > 2EP 2tBP. The
probability for strong collisions with CO2 is twice as large for 2PP as for 2EP and 2tBP.
The Chapter’s results show that longer-chain alkyl groups actually enhance strong
collisional energy transfer.

- 244 -
Chapter 9: Conclusion
9.1 Summary and Conclusion
Understanding the collisional relaxation of highly vibrationally excited molecules
is important for many situations. In this thesis, the dynamics of collisional energy
transfer from vibrationally excited molecules to DCl or CO2 baths through VRT
pathway were investigated using high-resolution transient IR absorption spectroscopy.
The goal of this work was to investigate the influence of molecular structure, vibrational
state density and vibrational energy on collisional energy transfer. Using this technique,
detailed information about the state-resolved product distributions and rate constants for
the energy transfer of the collision pairs was obtained.
Six projects were presented in this thesis. Chapters 3 to 6 studied molecular
effects for the full collisional energy transfer dynamics of highly vibrational excited
donors with bath molecules. Chapter 7 and Chapter 8 studied the strong collision
dynamics for collision pairs.
Chapter 3 explored the full energy transfer distribution for the pyrazine(E = 37900
cm-1
)/DCl pair. The rotational distribution of scattered DCl has a single-exponential
distribution and J-dependent translational distributions are observed for this pair. A
direct measurement of the collision rate is close to the predictions of the Lennard-Jones
collision model. This result confirms that the VRT pathway is a dominant channel of
collision energy transfer.
Chapters 4 and 5 reported studied the weak collision dynamics of CO2 with
pyrazine(E = 32700 and 37900 cm-1
) respectively. The internal energy effect on the

- 245 -
collision dynamics of pyrazine(E)/CO2 pair was investigated by comparing the
experimental results at different internal energies. The distributions of rotational and
translational energy gain of scattered CO2 are sensitive to the internal energy of pyrazine.
Increasing the internal energy reduces the probability of weak collision and induces more
strong collisions. The collision rates are not sensitive to the internal energies. The
average collision energy is reduced when the internal energy decreases by 15%.
The influence of molecular structure for the donor molecules is addressed in
Chapter 6. This Chapter reported the weak collision dynamics of 2-methylpyridine (E =
37900cm-1
)/CO2, 2,6-dimethylpyridine(E = 38300 cm-1
)/CO2 and 3,5-demethylpyridine(E
= 38300 cm-1
)/CO2 systems. Combined with the previous strong collision results, full
energy transfer distributions were obtained. The collision results are affected by the
number of methyl groups, but not by the position of the methyl groups. Biexponential
rotational distributions of scattered CO2 through collisions with donors were observed.
Donor methylation increased the appearance collision rates for different collision systems.
In Chapter 7, the effect of internal energy on strong collisions was measured for
collisions of azulene(E = 20390 and 38580 cm-1
) with CO2. The VRT channel is such
sensitive to the internal energy of azulene molecule. The average rotational and
translational energies of the scattered CO2 molecules double when the azulene energy is
increased by a factor of 2. The rate of energy transfer into strong collisions increases by
nearly a factor of 4 when the azulene energy is doubled. The curvatures of the energy
transfer probability distribution functions for E > 3000 cm-1
at different initial energies
correlate with the energy dependence of the state density, in excellent agreement with

- 246 -
predictions from GRETCHEN theory for describing collisional quenching of highly
excited molecules.
The effect of alkylation on strong collisions was studied in Chapter 8. The
experimental data for 2-ethylpyridine(E = 38570 cm-1
)/CO2, 2-propylpyridine(E = 38870
cm-1
)/CO2 and 2-t-butylpyridine(E = 39123 cm-1
)/CO2 pairs are compared pyridine
(Evib=37920 cm-1
) and 2-methylpyridine data from our group’s previous projects.
Alkylation of donors decreases the rotational and translational energy of scattered CO2
molecules. Strong collisions are reduced for donors with alkyl chains by lowering the
average energy per mode but longer alkyl chain have increased flexibility and higher
state densities that enhance energy loss via strong collisions.
9.2 Future Directions
This thesis has presented new insights into the dynamics of collisional quenching
of highly vibrationally excited molecules. This thesis helped us to understand how the
properties of excited molecules play roles in the collision quenching. These properties
include the internal energy, state density, and structure. This thesis also suggests new
areas for future research.
The Chapters about the influence of donor structure for the collision quenching of
collision system studied the effect of alkylation. How the isotopic substitution of donor
molecules affects the collision energy transfer is another interesting topic. Before this
project, our group measured the collision dynamics of pyridine-h5, d5 and f5 with HOD as
the bath molecule. Due to H-bonding interactions between donor and bath molecules, the
experimental collision rates for these systems are several times larger than the Lennard-
Jones collision rates. It will be interesting to measure the collisional dynamics of highly

- 247 -
vibrationally excited pyridine-h5, d5 and f5 with CO2, where hydrogen bonding
interactions are not present.
The project on strong collisions of azulene/CO2 pairs with different internal
energies shows us that state-resolved translational energy gain of CO2 is dependent on the
internal energy and that there should be a threshold for this translational distribution. The
thresholds at different CO2 rotational energies were estimated at Jet = 62 for azulene(E =
20390 cm-1
) and Jet = 34 for azulene(E = 38580 cm-1
). Due to the experimental full
energy transfer results for pyrazine and alkylpyridine (E)/CO2 pairs, two translational
energy distributions for scattered CO2 through collisions with donor molecules were
obtained and the crossing points were found to be in the range J = 5060. An interesting
question is why the two thresholds for CO2/azulene collisions are different for different
azulene energies. In addition, the appearance collision rate for the azulene/CO2 pair with
different internal energies still has not been measured because of the lack of weak
collision measurements at CO2 low-J states. It will be very important to measure the
weak collision dynamics for CO2/azulene pair.

- 248 -
Appendix A: Absorption Frequencies, Rotational Energies, and
Transition Intensities for the R Branch of the IR Fundamental of
D35
Cl and D37
Cl
The DCl bath molecule was probed following collisions with highly excited
pyrazine molecules using high-resolution transient IR absorption spectroscopy in Chapter
3. DCl has two isotopes: D35
Cl and D37
Cl. For IR probing of DCl molecules in specific
rotational states, this Appendix collects the information on IR frequencies 0, rotational
energies Erot and absorption intensities SJ for the two isotopes.
The IR absorption frequencies 0 for DCl molecules were determined by
Parekunnel and co-workers.123
Rotational energies of DCl (v = 0) are determined using
Eq A.1.
Erot= B0 J J+1 D0 J J+1 2+H0 J J+1
3+L0 J J+1 4 (A.1)
For the 35
Cl isotope, B0 = 5.39227196(40) cm-1
, D0 = 1.39955(3) 10-4
cm-1
, H0 =
2.282(8) 10-9
cm-1
, and L0 = 5.8(5) 10-14
cm-1
. For the 37
Cl isotope, B0 =
5.3764904(2) cm-1
, D0 = 1.31341(21) 10-4
cm-1
, H0 = 2.2646(65) 10-9
cm-1
, and L0 =
6.0(5)10-14
cm-1
.123
The absorption line strength SJ of the DCl molecule is a function
of the line strength Sji, which is the absorption from a lower state j to an upper state i.
The line strength Sji is related to the Einstein coefficient Bji for spontaneous emission as
Eq A.2.124,178

- 249 -
Sji=8π3
3hc v0
Iagie
EikT
Q 1e
v0kT
3h2
8π3 Bji (A.2)
Eq A2 is taken from Ref 124. Here Ia is the naturally-occurring isotopic abundance for
chlorine (0.754 for D35
Cl and 0.246 for D37
Cl); gi is the degeneracy of the upper state; Ej
is the energy of the lower state; c is the speed of light; and Q is the partition function. The
Einstein Bji coefficient is related to the Aij coefficient spontaneous emission as shown in
Eq A.3:
Bji=g
i
gj
Aijλ
3
8πh (A.3)
Values for the Aij were determined by Setser and co-workers.122,178
The R-branch probe
transition for rotational states of DCl are listed in Table A.1.

- 250 -
Table A.1 IR probe transients for rotational states of DCl. DCl (v = 0, J) + h ( 4.3
m) DCl (v = 1, J+1)
D35
Cl (01) D35
Cl (01)
J
0 ,cm-1
Erot ,cm-1
SJ,
cm molecule-1
0 ,cm-1
Erot ,cm-1
SJ,
cm molecule-1
0 2101.6178 0.0000 6.4880 × 10⁻²⁰
2098.5880 0.0000 2.1136 × 10⁻²⁰
1 2111.9488 10.7840 1.2150 × 10⁻¹⁹
2108.8890 10.7524 3.9587 × 10⁻²⁰
2 2122.0483 32.3486 1.6190 × 10⁻¹⁹
2118.9600 32.2539 5.2784 × 10⁻²⁰
3 2131.9131 64.6871 1.8210 × 10⁻¹⁹
2128.7980 64.4979 5.9385 × 10⁻²⁰
4 2141.5398 107.7895 1.8220 × 10⁻¹⁹
2138.3980 107.4742 5.9459 × 10⁻²⁰
5 2150.9255 161.6423 1.6620 × 10⁻¹⁹
2147.7580 161.1696 5.4257 × 10⁻²⁰
6 2160.0668 226.2287 1.3980 × 10⁻¹⁹
2156.8750 225.5673 4.5699 × 10⁻²⁰
7 2168.9608 301.5287 1.0940 × 10⁻¹⁹
2165.7460 300.6475 3.5802 × 10⁻²⁰
8 2177.6042 387.5189 8.0040 × 10⁻²⁰
2174.3680 386.3869 2.6218 × 10⁻²⁰
9 2185.9942 484.1725 5.4910 × 10⁻²⁰
2182.7370 482.7588 1.8009 × 10⁻²⁰
10 2194.1277 591.4595 3.5410 × 10⁻²⁰
2190.8510 589.7334 1.1633 × 10⁻²⁰
11 2202.0018 709.3466 2.1510 × 10⁻²⁰
2198.7060 707.2777 7.0792 × 10⁻²¹
12 2209.6136 837.7971 1.2330 × 10⁻²⁰
2206.3010 835.3551 4.0649 × 10⁻²¹
13 2216.9602 976.7713 6.6760 × 10⁻²¹
2213.6310 973.9262 2.2051 × 10⁻²¹
14 2224.0389 1126.2261 3.4180 × 10⁻²¹
2220.6950 1122.9480 1.1312 × 10⁻²¹
15 2230.8468 1286.1152 1.6560 × 10⁻²¹
16 2237.3819 1456.3891 7.5970 × 10⁻²²
17 2243.6368 1636.9953 3.3040 × 10⁻²²
18 2249.6208 1827.8778 1.3620 × 10⁻²²
- 251 -
19 2255.3204 2028.9779 5.3320 × 10⁻²³
20 2260.7348 2240.2334 1.9810 × 10⁻²³
21 2265.8624 2461.5795 6.9920 × 10⁻²⁴

- 252 -
Appendix B: Lennard-Jones Collision Model Calculation
There are a number of theories to describe the rate constant of bimolecular
collisions. The model used in this thesis is Lennard-Jones model.190
The Lennard-Jones model includes long-range attractive forces and short-range
repulsive forces using the Lennard-Jones potential (Eq B.1).
V r =4 σr 12
σr 6
(B.1)
This thesis uses the Lennard-Jones model to calculate the collision rate for several
collision systems. The Lennard-Jones collision rate includes the collision cross section
and potential well for collision pairs at room temperature, as in Eq B.2.
kLJ= 8kBTπμ
1
2
2, 2 *
πσ2 (B.2)
where, 2,2 *
is the collision integral, kB is Boltzmann’s constant and is the Lennard-
Jones parameter.
The collision integral (2,2)*
is a function of the reduced temperature T*, Eq B.3.
2, 2 *
= 1.16145 T* 0.14874
+ 0.52487exp 0.7732T*
+ 2.16178exp 2.43787T* (B.3)

- 253 -
The reduced temperature T* is obtained from Eq B.4.
T*= kBT
(B.4)
The Lennard-Jones parameters and for the mixed donor/bath systems are
obtained using established combining rules, which are shown as Eq B.5 and B.6,
respectively.190
σ= 12 σdonor+ σbath (B.5)
kB = kB
donor
kB
bath
1
2
(B.6)
The Lennard-Jones parameters for two bath molecules in thesis are taken from the
literature, and are shown in Table B.1.
Two methods are used here to obtain the Lennard-Jones parameters for donor
molecules. Parameters for pyridine, 2MP and azulene come from critical temperatures Tc
and critical volume Vc.191
Lennard-Jones parameter values for 2EP, 2PP, 2,6MP and
3,5MP could not be found in the literature, therefore, these values were estimated based
other related donors.
Values of and for 2EP, 2PP, 2,6MP and 2tBP were estimated based on data
for pyridine and 2MP values and trends in benzene series192
and cyclopentane series192
as
shown in Figure B.1. Critical temperatures Tc and critical volume Vc of all molecules are

- 254 -
Table B.1 Lennard-Jones parameters for CO2 and DCl bath molecules.
, nm kB , K
CO2 0.45a 190
a
DCl 0.34b 328
c
aTwo Lennard-Jones parameters of CO2 are from Ref. 187.
bThe Lennard-Jones parameter of DCl is from Ref. 124.
cThe Lennard-Jones parameter kB is from Ref. 125.

- 255 -
/kB, K
360 380 400 420 440 460 480 500 520 540
,
nm
0.50
0.52
0.54
0.56
0.58
0.60
0.62
0.64
0.66
0.68
Benzene series
Cyclopentane series
Pyridine series (known)
Pyridine series (estimated)
Figure B.1 The linear relationship between σ and kB for two series of alkylated cyclic
molecules (benzene and cyclopentane) is used to estimate parameters for alkylated
pyridines with CO2. Blue triangles are for the benzene series: (in order from lower to
higher kB ) benzene, methylbenzene, ethylbenzene, propylbenzene and butylbenzene.192
Red squares are for the cyclopentane series: (in order from lower to higher kB )
cyclopentane, methyl-cyclopentane and ethyl-cyclopentane.192
Black circles are for the pyridine series, with open circles for estimated values for 2EP
and 2PP. The pyridine series is assumed to have a similar linear relationship as the other
ring molecules and a slope that is the average of the benzene and cyclopentane values. σ
values for 2EP and 2PP are assumed to be the same as for the ring molecules with the
same alkyl chains.

- 256 -
listed in Table B.2.
Two Lennard-Jones parameters, and , for the donor molecules are
calculated using Eq B.7 and B.8.193
σ3 98
vC
πNA (B.7)
34 Tc (B.8)
where NA is Avogadro’s number. Lennard-Jones collision rate constants kLJ for collision
systems in this thesis are shown in Table B.3.

- 257 -
Table B.2 Critical temperature Tc and critical volume Vc of molecules.
Molecule Tc, Ka Vc, cm
3a
Pyridine 620 243
2-methyl-pyridine 621 292
2,6-methyl-pyridine 623.8 343b
Benzene 562.16 259
Methyl-benzene 591.8 316
Ethyl-benzene 617.2 374
Propyl-benzene 638.32 440
Butyl-benzene 660.5 497
Cyclopentane 511.7 260
Methyl-cyclopentane 532.73 319
Ethyl-cyclopentane 569.5 375
Azulene 795.8c 406
c
aData are from Ref. 188.
bThe cristal volume Vc for a,6MP are estimated from extrapolation of Vc for pyridine and
2MP.
cData are Ref. 50.

- 258 -
Table B.3 Lennard-Jones collision rate constants for collision pairs in this thesis.
Collision
pair
donor,
nm
DB,
nma
kB donor,
K
kB DB,
Kb
kLJ, 10-10
cm3 molecule-1 s-1c
Pyz:DCl 0.535 0.436 435.5 377.9 5.40
Pyz:CO2 0.535 0.492 435.5 287.7 5.60
Pyr:CO2 0.523 0.487 465.0 297.2 5.58
2MP:CO2 0.558 0.504 465.7 297.5 5.86
2EP:CO2 0.606 0.528 503.5 309.3 6.39
2PP:CO2 0.640 0.545 523.5 315.4 6.76
2tBP:CO2 0.670 0.558 539 320.0 7.05
2,6MP:CO2 0.589 0.520 467.9 298.2 5.80
Azu:CO2 0.661 0.555 532 317.9 6.40
a
LJ parameter DB for donor/bath pair.
bLJ parameter kB DB for donor/bath pair.

- 259 -
Appendix C: The Residual test for Double-Gaussian Fitting Model
The number density of scattered bath molecules in a given rotational state after
collisions with vibrationally excited donors is from two processes, appearance and
depletion. The best fitting model for the experimental Doppler broadened line profiles is
a double-Gaussian function that is the sum of two Gaussian functions, as shown in Eq
C.1.
y= aexp 4ln2 xx0
b 2
-c exp 4ln2 xx0
d 2
+ y0 (C.1)
where, a and c are the amplitudes and b and d are the linewidths for each Gaussian, y0 is
a base line correction and xx0 is the deviation from the peak center. The double-
Gaussian function includes six parameters: a, b, c, d, x0 and y0. In the upper plot of
Figure C.1, the experimental data (eg: DCl (J = 5) for pyrazine(E = 37900 cm-1
)/DCl pair)
are fit by the double-Gaussian function without any constraints, as shown by a solid line.
The fitting results of six parameters are also shown in upper plot. The lower plot
illustrates the residual value for the fit. The residual value is the difference between the
experimental data and the fitting data.
The residual value is a useful factor that evaluates the goodness of fit. Here the
goodness of the double-Gaussian fit is tested. First, x0 and y0 are minor offsets and
shifting the data reduces the number of fitting parameters to 4. In this test, one of the
other four parameters (a, b, c or d) is constrained to a fixed value and a set of fitting

- 260 -
I/I 0
-0.03
-0.02
-0.01
0.00
0.01
a= 6.4 * 10-3
b= 2.7 * 10-3
c= 3.21 * 10-3
d= 1.2 * 10-3
x0= 2.0 * 10
-4
y0= 2.19 * 10
-5
Wavenumber from the centerline
-0.01 0.00 0.01
Re
sid
ua
l
-0.004
-0.002
0.000
0.002
0.004
Figure C.1 The experimental data for DCl (J = 5) from collisions with vibrationally
excited pyrazine are fitted by a double-Gaussian function. The data are illustrated as grey
circles and the fitting result is shown as a solid line. One set of fitting results for six
parameters are also shown in the upper plot. The residual value for each point is shown
as the grey circles in the lower plot.

- 261 -
of fitting parameters and residuals are obtained for a 3-parameter.
The sum of residual values at different fixed values of parameter a are shown in
Figure C.2a. Figure C.2a shows the residual data by scanning the value of parameter a
with small steps in a reasonable range. The best fit has the smallest residual. There is a
single minimum for the residual sum indicating the best fit for parameter a. In other two
plots of Figure C.2, parameters b and c are checked individually. There is only one point
with smallest residual for each plot. At the best fitting point for each fixed parameter, the
fitting results of four parameters are all similar as the fitting data without any constraints
in Figure C.1.
Due to this test, the fit results of the Double-Gaussian function without constraints
in Figure C.1 are the best and unique fit values.

- 262 -
a parameter
0.00 0.01 0.02 0.03 0.04
(|
resid
ua
l|)
0.010
0.012
0.014
0.016
0.018 a = 0.007
b = 0.0026c = 0.0327d = 0.001178
b parameter
0.002 0.004 0.006 0.008 0.010
(|
resid
ua
l|)
0.010
0.015
0.020
0.025
0.030b = 0.0027
a = 0.0064c = 0.0321d = 0.001167
c parameter
0.00 0.05 0.10 0.15 0.20
(|
resid
ua
l|)
0.010
0.015
0.020
0.025
0.030 c = 0.03209
a = 0.00636b = 0.00271d = 0.00117
Figure C.2 The sum of residuals based on 3 parameters fitting with one parameter
constained.
- 263 -
Appendix D: A Two-Component Fitting Model with Constraints
The weak collision research in Chapter 3 to Chapter 6 helps us to open a new door
to understand the collisional quenching dynamics for two molecules. Since the
populations in specific J states are the products of weak and strong collisions, we need to
find a good model to fit the experimental data and separate the two processes. This thesis
chooses a two-component model for fitting the data shown as Eq. D.1.
PopJ= g
J Iaexp
EJ
kBTa +Ibexp
EJ
kBTb (D.1)
where gJ is the rotational degeneracy; EJ is the rotational energy; Ta and Tb are rotational
temperatures; Ia and Ib are the intensity parameters. This model successfully fit
pyrazine/CO2 pair and 2,6MP/CO2 pair (Chapter 4, Chapter 5 and Chapter 6) data
without any constraints. However, this model cannot fit 2MP/CO2 and 3,5MP/CO2
without constraints. The way to obtain the best fitting results by finding the smallest
residual values.
In one limit, weak collisions can be treated as elastic collisions, and the cold
population temperature is estimated to be Ta = 300 K. The number of parameter drops to
three. Two ways are then used to find the smallest residuals: changing the ratio of two
intensity parameters Ia:Ib and tuning the value of the other temperature parameter Tb.
The experimental data for 2MP/CO2 pair are fitted by Eq D.1 at different ratios of
Ia:Ib. The fitting results for four parameters and constraints are listed in Table D.1.

- 264 -
Table D.1 The two-component model fitting constraints and fitting results of CO2 with
donors (2MP and 3,5MP).
Donor constraints Taa Tb Ia × 10
10 Ib× 10
10 Cold%
b Hot%
c
Tb 400 300 400 7.28 1.24 81.5% 18.5%
3,5MP 500 300 500 7.28 1.24 81.5% 18.5%
550 300 550 7.7 7.48 84.9% 15.1%
600 300 600 7.82 6.35 86.0% 14.0%
650 300 650 7.92 5.38 87.2% 12.8%
700 300 700 8.02 4.58 88.3% 11.7%
800 300 800 8.17 3.39 90.0% 10.0%
2MP Ia:Ib 4:1 300 643 4.63 1.16 65.1% 34.9%
2:1 300 559 3.78 1.89 51.7% 48.3%
3:1 300 605 4.31 1.44 59.8% 40.2%
7:3 300 576 3.99 1.71 54.9% 45.1%
73:27 300 592 4.18 1.55 57.8% 42.2%
aThe colder temperature Ta in K is fixed at room temperature for the two-component
mode.
bThe percent of cold distribution for the whole observed distribution.
cThe percent of hot distribution for the observed distribution.

- 265 -
At a given value of Ia:Ib, one set of fitting residuals is obtained in Figure D.1.
Figure D.1a shows that smallest residuals are at Ia:Ib = 7.3:2.7. The fitting results of this
collision pairs are chosen at this smallest residual place.
For 3,5MP/CO2 pair, we tune the values of another temperature parameter, Tb.
The constraint values of Tb and fitting results are listed in Table D.1. The smallest
residual is at Tb = 600 K from Figure D.1b. The smallest residual represents the bet fit
for the bi-exponential distribution.
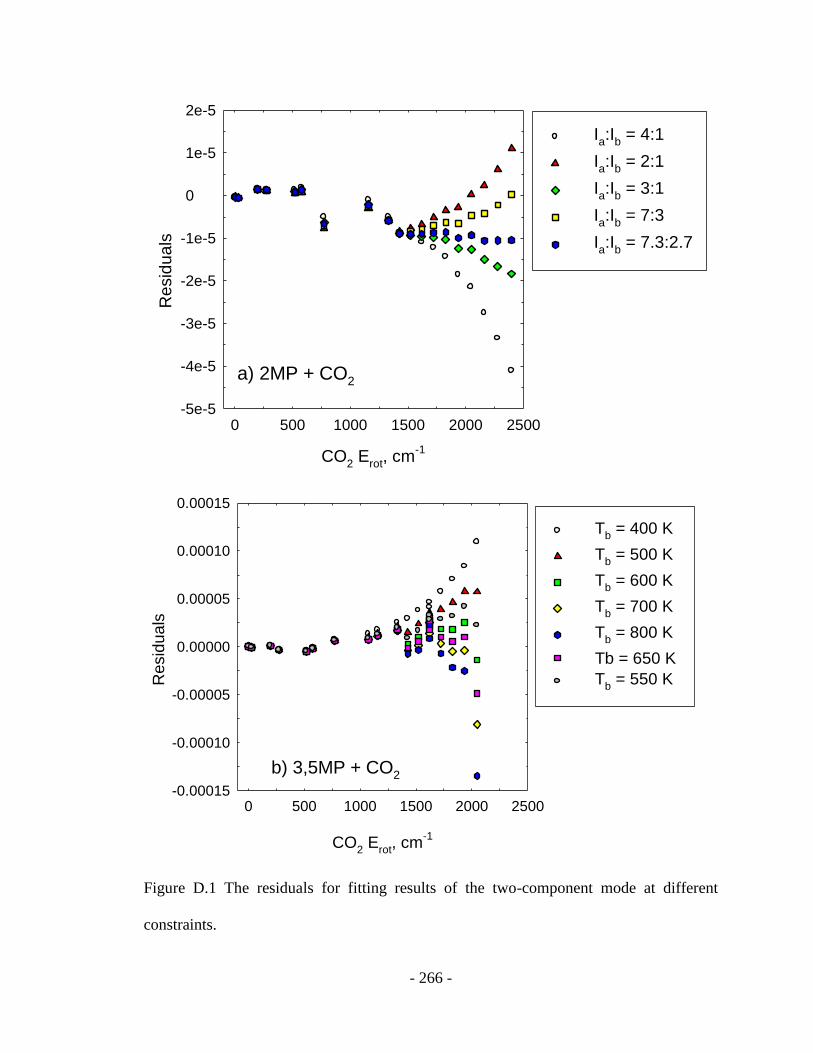
- 266 -
CO2 E
rot, cm
-1
0 500 1000 1500 2000 2500
Re
sid
ua
ls
-5e-5
-4e-5
-3e-5
-2e-5
-1e-5
0
1e-5
2e-5
Ia:I
b = 4:1
Ia:I
b = 2:1
Ia:I
b = 3:1
Ia:I
b = 7:3
Ia:I
b = 7.3:2.7
a) 2MP + CO2
CO2 E
rot, cm
-1
0 500 1000 1500 2000 2500
Re
sid
ua
ls
-0.00015
-0.00010
-0.00005
0.00000
0.00005
0.00010
0.00015
Tb = 400 K
Tb = 500 K
Tb = 600 K
Tb = 700 K
Tb = 800 K
Tb = 650 K
Tb = 550 K
b) 3,5MP + CO2
Figure D.1 The residuals for fitting results of the two-component mode at different
constraints.

- 267 -
Bibliography
(1) Lindemann, F. A. Trans. Faraday Soc. 1922, 17, 598.
(2) Unimolecular Reaction Dynamics: Theory and Experiments; Baer, T.; Hase, L.
M., Eds.; Oxford University Press: New York, 1996.
(3) Barker, J. R.; Yoder, L. M.; King, K. D. J. Phys. Chem. A 2001, 105, 796.
(4) Flynn, G. W.; Parmenter, C. S.; Wodtke, A. M. J. Phys. Chem. 1996, 100, 12817.
(5) Oref, I.; Tardy, D. C. Chem. Rev. 1990, 90, 1407.
(6) Tardy, D. C.; Rabinovitch, B. S. Chem. Rev. 1977, 77, 369.
(7) Krajnovich, D. J.; Parmenter, C. S.; Catlett, D. L. Chem. Rev. 1987, 87, 237.
(8) Weston, R. E.; Flynn, G. W. Annu. Rev. Phys. Chem. 1992, 43, 559.
(9) Molecular Energy Transfer in Gases; Cottrell, T. L.; C., M. J., Eds.; Butterworths
Scientific: London, 1961.
(10) Introduction to Molecular Energy Transfer; Yardley, J. T., Ed.; Academic: New
York, 1980.
(11) Keeton, R. G.; Bass, H. E. J. Acoust. Soc. Am. 1976, 60, 78.
(12) Unimolecular Reactions; Robinson, P. J.; Holbrook, K. A., Eds.; Wiley-
Interscience: London, 1972.
(13) Troe, J. J. Chem. Phys. 1977, 66, 4745.
(14) Troe, J. J. Chem. Phys. 1977, 66, 4758.
(15) Chan, S. C.; Rabinovi.Bs; Bryant, J. T.; Spicer, L. D.; Fujimoto, T.; Lin, Y. N.;
Pavlou, S. P. J. Phys. Chem. 1970, 74, 3160.
(16) Snavely, D. L.; Zare, R. N.; Miller, J. A.; Chandler, D. W. J. Phys. Chem. 1986,
90, 3544.

- 268 -
(17) Kohlmaier, G. H.; Rabinovitch, B. S. J. Chem. Phys. 1963, 38, 1692.
(18) Kohlmaier, G. H.; Rabinovitch, B. S. J. Chem. Phys. 1963, 38, 1709.
(19) Simons, J. W.; Rabinovitch, B. S.; Setser, D. W. J. Chem. Phys. 1964, 41, 800.
(20) Tardy, D. C.; Rabinovi.Bs; Larson, C. W. J. Chem. Phys. 1966, 45, 1163.
(21) Serauska.Rv; Schlag, E. W. J. Chem. Phys. 1965, 42, 3009.
(22) Valance, W. G.; Schlag, E. W. J. Chem. Phys. 1966, 45, 216.
(23) Weyssenh.Hv; Schlag, E. W. J. Chem. Phys. 1973, 59, 729.
(24) Nordholm, S.; Freasier, B. C.; Jolly, D. L. Chem. Phys. 1977, 25, 433.
(25) Freasier, B. C.; Jolly, D. L.; Nordholm, S. Chem. Phys. 1978, 32, 161.
(26) Schranz, H. W.; Nordholm, S. Int. J. Chem. Kinet. 1981, 13, 1051.
(27) Nilsson, D.; Nordholm, S. J. Chem. Phys. 2002, 116, 7040.
(28) Nilsson, D.; Nordholm, S. J. Chem. Phys. 2003, 119, 11212.
(29) Lenzer, T.; Luther, K.; Nilsson, D.; Nordholm, S. J. Phys. Chem. B 2005, 109,
8325.
(30) Nilsson, D.; Nordholm, S. J. Phys. Chem. A 2006, 110, 3289.
(31) Lendvay, G.; Schatz, G. C. J. Chem. Phys. 1993, 98, 1034.
(32) Lendvay, G.; Schatz, G. C.; Harding, L. B. Faraday Discuss. 1995, 102, 389.
(33) Clarke, D. L.; Oref, I.; Gilbert, R. G.; Lim, K. F. J. Chem. Phys. 1992, 96, 5983.
(34) Lim, K. F.; Gilbert, R. G. J. Phys. Chem. 1990, 94, 77.
(35) Lim, K. F. J. Chem. Phys. 1994, 100, 7385.
(36) Linhananta, A.; Lim, K. F. Phys. Chem. Chem. Phys. 2002, 4, 577.
(37) Bernshtein, V.; Oref, I. J. Phys. Chem. A 2004, 108, 8131.
(38) Bernshtein, V.; Oref, I. J. Chem. Phys. 2006, 125, 133105.

- 269 -
(39) Lenzer, T.; Luther, K.; Troe, J.; Gilbert, R. G.; Lim, K. F. J. Chem. Phys. 1995,
103, 626.
(40) Lenzer, T.; Luther, K. Ber. Bunsen. Phys. Chem. 1997, 101, 581.
(41) Grigoleit, U.; Lenzer, T.; Luther, K. Z. Phys. Chem. 2000, 214, 1065.
(42) Yoder, L. M.; Barker, J. R. J. Phys. Chem. A 2000, 104, 10184.
(43) Higgins, C. J.; Chapman, S. J. Phys. Chem. A 2004, 108, 8009.
(44) Higgins, C.; Ju, Q.; Seiser, N.; Flynn, G. W.; Chapman, S. J. Phys. Chem. A 2001,
105, 2858.
(45) Li, Z. M.; Sansom, R.; Bonella, S.; Coker, D. F.; Mullin, A. S. J. Phys. Chem. A
2005, 109, 7657.
(46) Hippler, H.; Troe, J.; Wendelken, H. J. Chem. Phys. Lett. 1981, 84, 257.
(47) Hippler, H.; Luther, K.; Troe, J.; Wendelken, H. J. J. Chem. Phys. 1983, 79, 239.
(48) Hippler, H.; Troe, J.; Wendelken, H. J. J. Chem. Phys. 1983, 78, 5351.
(49) Heymann, M.; Hippler, H.; Troe, J. J. Chem. Phys. 1984, 80, 1853.
(50) Hippler, H.; Lindemann, L.; Troe, J. J. Chem. Phys. 1985, 83, 3906.
(51) Hippler, H.; Otto, B.; Troe, J. Ber. Bunsen. Phys. Chem. 1989, 93, 428.
(52) Troe, J. J. Chem. Phys. 1992, 97, 288.
(53) Barker, J. R. J. Phys. Chem. 1984, 88, 11.
(54) Toselli, B. M.; Barker, J. R. J. Chem. Phys. 1991, 95, 8108.
(55) Toselli, B. M.; Barker, J. R. J. Chem. Phys. 1992, 97, 1809.
(56) Miller, L. A.; Barker, J. R. J. Chem. Phys. 1996, 105, 1383.
(57) Miller, L. A.; Cook, C. D.; Barker, J. R. J. Chem. Phys. 1996, 105, 3012.
(58) Barker, J. R.; Toselli, B. M. Int. Rev. Phys. Chem. 1993, 12, 305.
- 270 -
(59) Toselli, B. M.; Brenner, J. D.; Yerram, M. L.; Chin, W. E.; King, K. D.; Barker, J.
R. J. Chem. Phys. 1991, 95, 176.
(60) Brenner, J. D.; Erinjeri, J. P.; Barker, J. R. Chem. Phys. 1993, 175, 99.
(61) Hartland, G. V.; Qin, D.; Dai, H. L. J. Chem. Phys. 1994, 101, 8554.
(62) Hartland, G. V.; Qin, D.; Dai, H. L. J. Chem. Phys. 1994, 100, 7832.
(63) Hartland, G. V.; Qin, D.; Dai, H. L. J. Chem. Phys. 1995, 102, 8677.
(64) Grigoleit, U.; Lenzer, T.; Luther, K.; Mutzel, M.; Takahara, A. Phys. Chem. Chem.
Phys. 2001, 3, 2191.
(65) Hold, U.; Lenzer, T.; Luther, K.; Symonds, A. C. J. Chem. Phys. 2003, 119,
11192.
(66) Hold, U.; Lenzer, T.; Luther, K.; Reihs, K.; Symonds, A. C. J. Chem. Phys. 2000,
112, 4076.
(67) Lenzer, T.; Luther, K.; Reihs, K.; Symonds, A. C. J. Chem. Phys. 2000, 112, 4090.
(68) Frerichs, H.; Hollerbach, M.; Lenzer, T.; Luther, K. J. Phys. Chem. A 2006, 110,
3179.
(69) Liu, C. L.; Hsu, H. C.; Lyu, J. J.; Ni, C. K. J. Chem. Phys. 2006, 124, 054302.
(70) Liu, C. L.; Hsu, H. C.; Lyu, J. J.; Ni, C. K. J. Chem. Phys. 2006, 125, 204309.
(71) Hsu, H. C.; Lyu, J. J.; Liu, C. L.; Huang, C. L.; Ni, C. K. J. Chem. Phys. 2006,
124, 134303.
(72) Bernshtein, V.; Oref, I.; Liu, C. L.; Hsu, H. C.; Ni, C. K. Chem. Phys. Lett. 2006,
429, 317.
(73) Liu, C. L.; Hsu, H. C.; Lyu, J. J.; Ni, C. K. J. Chem. Phys. 2005, 123, 131102.

- 271 -
(74) Michaels, C. A.; Mullin, A. S.; Park, J.; Chou, J. Z.; Flynn, G. W. J. Chem. Phys.
1998, 108, 2744.
(75) Wall, M. C.; Lemoff, A. S.; Mullin, A. S. J. Phys. Chem. A 1998, 102, 9101.
(76) Wall, M. C.; Mullin, A. S. J. Chem. Phys. 1998, 108, 9658.
(77) Wall, M. C.; Lemoff, A. E.; Mullin, A. S. J. Chem. Phys. 1999, 111, 7373.
(78) Havey, D. K.; Liu, Q. N.; Li, Z. M.; Elioff, M.; Fang, M.; Neudel, J.; Mullin, A. S.
J. Phys. Chem. A 2007, 111, 2458.
(79) Havey, D. K.; Liu, Q. N.; Li, Z. M.; Elioff, M.; Mullin, A. S. J. Phys. Chem. A
2007, 111, 13321.
(80) Liu, Q. N.; Havey, D. K.; Mullin, A. S. J. Phys. Chem. A 2008, 112, 9509.
(81) Havey, D. K.; Liu, Q. N.; Li, Z.; Mullin, A. S. J. Phys. Chem. A 2009, 113, 4387.
(82) Elioff, M. S.; Sansom, R. L.; Mullin, A. S. J. Phys. Chem. A 2000, 104, 10304.
(83) Elioff, M. S.; Fang, M.; Mullin, A. S. J. Chem. Phys. 2001, 115, 6990.
(84) Elioff, M. S.; Fang, M.; Mullin, A. S. J. Chem. Phys. 2002, 117, 6880.
(85) Park, J.; Li, Z. M.; Lemoff, A. S.; Rossi, C.; Elioff, M. S.; Mullin, A. S. J. Phys.
Chem. A 2002, 106, 3642.
(86) Park, J.; Shum, L.; Lemoff, A. S.; Werner, K.; Mullin, A. S. J. Chem. Phys. 2002,
117, 5221.
(87) Li, Z. M.; Korobkova, E.; Werner, K.; Shum, L.; Mullin, A. S. J. Chem. Phys.
2005, 123, 174306/1.
(88) Miller, E. M.; Murat, L.; Bennette, N.; Hayes, M.; Mullin, A. S. J. Phys. Chem. A
2006, 110, 3266.
(89) Michaels, C. A.; Flynn, G. W. J. Chem. Phys. 1997, 106, 3558.
- 272 -
(90) Mullin, A. S.; Park, J.; Chou, J. Z.; Flynn, G. W.; Weston, R. E. Chem. Phys.
1993, 175, 53.
(91) Mullin, A. S.; Michaels, C. A.; Flynn, G. W. J. Chem. Phys. 1995, 102, 6032.
(92) Jalenak, W.; Weston, R. E.; Sears, T. J.; Flynn, G. W. J. Chem. Phys. 1988, 89,
2015.
(93) Michaels, C. A.; Tapalian, H. C.; Lin, Z.; Sevy, E. T.; Flynn, G. W. Faraday
Discuss. 1995, 102, 405.
(94) Michaels, C. A.; Lin, Z.; Mullin, A. S.; Tapalian, H. C.; Flynn, G. W. J. Chem.
Phys. 1997, 106, 7055.
(95) Michaels, C. A.; Mullin, A. S.; Flynn, G. W. J. Chem. Phys. 1995, 102, 6682.
(96) Sevy, E. T.; Muyskens, M. A.; Lin, Z.; Flynn, G. W. J. Phys. Chem. A 2000, 104,
10538.
(97) Sevy, E. T.; Rubin, S. M.; Lin, Z.; Flynn, G. W. J. Chem. Phys. 2000, 113, 4912.
(98) Eng, J.; Raghavachari, K.; Struck, L. M.; Chabal, Y. J.; Bent, B. E.; Banaszak-
Holl, M. M.; McFeely, F. R.; Michaels, A. M.; Flynn, G. W.; Christman, S. B.; Chaban,
E. E.; Williams, G. P.; Radermacher, K.; Mantl, S. J. Chem. Phys. 1998, 108, 8680.
(99) Hewitt, S. A.; Zhu, L.; Flynn, G. W. J. Chem. Phys. 1992, 97, 6396.
(100) Khan, F. A.; Kreutz, T. G.; Zhu, L.; Flynn, G. W.; Weston, R. E. J. Phys. Chem.
1988, 92, 6171.
(101) Sevy, E. T.; Michaels, C. A.; Tapalian, H. C.; Flynn, G. W. J. Chem. Phys. 2000,
112, 5844.
(102) Sevy, E. T.; Muyskens, M. A.; Rubin, S. M.; Flynn, G. W.; Muckerman, J. T. J.
Chem. Phys. 2000, 112, 5829.

- 273 -
(103) Duffin, A. M.; Johnson, J. A.; Muyskens, M. A.; Sevy, E. T. J. Phys. Chem. A
2007, 111, 13330.
(104) Dietz, T. G.; Duncan, M. A.; Pulu, A. C.; Smalley, R. E. J. Phys. Chem. 1982, 86,
4026.
(105) Knee, J.; Johnson, P. J. Phys. Chem. 1985, 89, 948.
(106) Elioff, M. S.; Wall, M. C.; Lemoff, A. S.; Mullin, A. S. J. Chem. Phys. 1999, 110,
5578.
(107) Bolovinos, A.; Tsekeris, P.; Philis, J.; Pantos, E.; Andritsopoulos, G. J. Mol.
Spectrosc. 1984, 103, 240.
(108) Ruth, A. A.; Kim, E. K.; Hese, A. Phys. Chem. Chem. Phys. 1999, 1, 5121.
(109) Lin, M. F.; Huang, C. L.; Lee, Y. T.; Ni, C. K. J. Chem. Phys. 2003, 119, 2032.
(110) Hirata, Y.; Lim, E. C. J. Chem. Phys. 1978, 69, 3292.
(111) Yamazaki, I.; Murao, T.; Yamanaka, T.; Yoshihara, K. Faraday Discuss. 1983,
75, 395.
(112) Sushida, K.; Fujita, M.; Yamazaki, I.; Baba, H. Bull. Chem. Soc. Jpn. 1983, 56,
2228.
(113) Yamazaki, I.; Sushida, K.; Baba, H. J. Chem. Phys. 1979, 71, 381.
(114) Sevy, E. T.; Flynn, G. W. Abstr. Paper Am Chem Soc Natl Meet 1998, 215, 318.
(115) Du, J.; Yuan, L. W.; Hsieh, S.; Lin, F.; Mullin, A. S. J. Phys. Chem. A 2008, 112,
9396.
(116) Havey, D. K.; Du, J.; Liu, Q. N.; Mullin, A. S. J. Phys. Chem. A 2010, 114, 1569.
(117) Yuan, L. W.; Du, J.; Mullin, A. S. J. Chem. Phys. 2008, 129, 014303.
- 274 -
(118) Liu, Q. N.; Du, J.; Havey, D. K.; Li, Z. M.; Miller, E. M.; Mullin, A. S. J. Phys.
Chem. A 2007, 111, 4073.
(119) Operation & Maintenance Manual for the Powerlite 8000 Series Laser;
Continuum Inc., 1996.
(120) Li, Z. M.; Korobkova, E.; Werner, K.; Shum, L.; Mullin, A. S. J. Chem. Phys.
2005, 123.
(121) Wormald, C. J.; Wurzberger, B. Phys. Chem. Chem. Phys. 2000, 2, 5133.
(122) Arunan, E.; Setser, D. W.; Ogilvie, J. F. J. Chem. Phys. 1992, 97, 1734.
(123) Parekunnel, T.; Hirao, T.; Le Roy, R. J.; Bernath, P. F. J. Mol. Spectrosc. 1999,
195, 185.
(124) Rothman, L. S.; Jacquemart, D.; Barbe, A.; Benner, D. C.; Birk, M.; Brown, L. R.;
Carleer, M. R.; Chackerian, C.; Chance, K.; Coudert, L. H.; Dana, V.; Devi, V. M.; Flaud,
J. M.; Gamache, R. R.; Goldman, A.; Hartmann, J. M.; Jucks, K. W.; Maki, A. G.;
Mandin, J. Y.; Massie, S. T.; Orphal, J.; Perrin, A.; Rinsland, C. P.; Smith, M. A. H.;
Tennyson, J.; Tolchenov, R. N.; Toth, R. A.; Vander Auwera, J.; Varanasi, P.; Wagner, G.
J. Quant. Spectrosc. Radiat. Transfer 2005, 96, 139.
(125) Scott, T. P.; Smith, N.; Magill, P. D.; Pritchard, D. E.; Stewart, B. J. Phys. Chem.
1996, 100, 7981.
(126) Bernstein, R. B. J. Chem. Phys. 1962, 34, 361.
(127) Clare, S.; Marks, A. J.; McCaffery, A. J. J. Phys. Chem. A 2000, 104, 7181.
(128) McCaffery, A. J.; Alwahabi, Z. T.; Osborne, M. A.; Williams, C. J. J. Chem. Phys.
1993, 98, 4586.
- 275 -
(129) McCaffery, A. J.; Osborne, M. A.; Marsh, R. J.; Lawrance, W. D.; Waclawik, E.
R. J. Chem. Phys. 2004, 121, 169.
(130) Osborne, M. A.; McCaffery, A. J. J. Chem. Phys. 1994, 101, 5604.
(131) Waclawik, E. R.; Lawrance, W. D. J. Chem. Phys. 1998, 109, 5921.
(132) Zeleznik, F. J.; Dugan, J. V. J. Chem. Phys. 1971, 54, 4523.
(133) Molecular Theory of Gases and Liquids; Hirschfelder, J. O.; Curtis, C. F.; Bird, R.
B., Eds. Wiley: New York, 1964.
(134) Bevilacqua, T. J.; Weisman, R. B. J. Chem. Phys. 1993, 98, 6316.
(135) Cheney, B. V.; Schulz, M. W. J. Phys. Chem. 1990, 94, 6268.
(136) Cheney, B. V.; Schulz, M. W.; Cheney, J.; Richards, W. G. J. Am. Chem. Soc.
1988, 110, 4195.
(137) Gotch, A. J.; Zwier, T. S. J. Chem. Phys. 1990, 93, 6977.
(138) Read, W. G.; Campbell, E. J.; Henderson, G.; Flygare, W. H. J. Am. Chem. Soc.
1981, 103, 7670.
(139) Zhao, Y.; Tishchenko, O.; Truhlar, D. G. J. Phys. Chem. B 2005, 109, 19046.
(140) Perkins, B. G.; Haber, T.; Nesbitt, D. J. J. Phys. Chem. B 2005, 109, 16396.
(141) Perkins, B. G.; Nesbitt, D. J. Proc. Natl. Acad. Sci. U. S. A. 2008, 105, 12684.
(142) Perkins, B. G.; Nesbitt, D. J. J. Phys. Chem. A 2008, 112, 9324.
(143) Alwahabi, Z. T.; Besley, N. A.; McCaffery, A. J.; Osborne, M. A.; Rawi, Z. J.
Chem. Phys. 1995, 102, 7945.
(144) McCaffery, A. J.; Marsh, R. J. J. Phys. B: At. Mol. Opt. Phys. 2001, 34, R131.
(145) Marsh, R. J.; McCaffery, A. J. J. Phys. B: At. Mol. Opt. Phys. 2003, 36, 1363.
(146) McCaffery, A. J. Phys. Chem. Chem. Phys. 2004, 6, 1637.

- 276 -
(147) Bernshtein, V.; Oref, I. J. Phys. Chem. B 2005, 109, 8310.
(148) Bernshtein, V.; Oref, I. J. Phys. Chem. A 2006, 110, 8477.
(149) Bernshtein, V.; Oref, I. J. Phys. Chem. A 2006, 110, 1541.
(150) Linhananta, A.; Lim, K. F. Phys. Chem. Chem. Phys. 1999, 1, 3467.
(151) Linhananta, A.; Lim, K. F. Phys. Chem. Chem. Phys. 2000, 2, 1385.
(152) Hippler, H.; Troe, J.; Wendelken, H. J. J. Chem. Phys. 1983, 78, 6709.
(153) Hippler, H.; Troe, J.; Wendelken, H. J. J. Chem. Phys. 1983, 78, 6718.
(154) Troe, J. J. Chem. Phys. 1982, 77, 3485.
(155) Damm, M.; Deckert, F.; Hippler, H.; Troe, J. J. Phys. Chem. 1991, 95, 2005.
(156) Rossi, M. J.; Pladziewicz, J. R.; Barker, J. R. J. Chem. Phys. 1983, 78, 6695.
(157) Barker, J. R.; Rossi, M. J.; Pladziewicz, J. R. Chem. Phys. Lett. 1982, 90, 99.
(158) Rossi, M. J.; Barker, J. R. Chem. Phys. Lett. 1982, 85, 21.
(159) Frerichs, H.; Lenzer, T.; Luther, K.; Schwarzer, D. Phys. Chem. Chem. Phys.
2005, 7, 620.
(160) Liu, C. L.; Hsu, H. C.; Ni, C. K. J. Chem. Phys. 2008, 128, 164316.
(161) Liu, C. L.; Hsu, H. C.; Hsu, Y. C.; Ni, C. K. J. Chem. Phys. 2008, 128, 124320.
(162) Hsu, H. C.; Liu, C. L.; Hsu, Y. C.; Ni, C. K. J. Chem. Phys. 2008, 129, 044301.
(163) Liu, C. L.; Hsu, H. C.; Hsu, Y. C.; Ni, C. K. J. Chem. Phys. 2007, 127, 104311.
(164) Dove, J. E.; Hippler, H.; Plach, J.; Troe, J. J. Chem. Phys. 1984, 81, 1209.
(165) Herzog, B.; Hippler, H.; Kang, L.; Troe, J. Chem. Phys. Lett. 1985, 120, 124.
(166) Schwarzer, D.; Troe, J.; Votsmeier, M.; Zerezke, M. Ber. Bunsen. Phys. Chem.
1997, 101, 595.
(167) Schwarzer, D.; Troe, J.; Zerezke, M. J. Phys. Chem. A 1998, 102, 4207.

- 277 -
(168) Johnson, J. A.; Duffin, A. M.; Hom, B. J.; Jackson, K. E.; Sevy, E. T. J. Chem.
Phys. 2008, 128, 054304.
(169) Johnson, J. A.; Kim, K.; Mayhew, M.; Mitchell, D. G.; Sevy, E. T. J. Phys. Chem.
A 2008, 112, 2543.
(170) Mitchell, D. G.; Johnson, A. M.; Johnson, J. A.; Judd, K. A.; Kim, K.; Mayhew,
M.; Powell, A. L.; Sevy, E. T. J. Phys. Chem. A 2008, 112, 1157.
(171) Barker, J. R.; Golden, R. E. J. Phys. Chem. 1984, 88, 1012.
(172) Shi, J.; Barker, J. R. J. Chem. Phys. 1988, 88, 6219.
(173) Damm, M.; Hippler, H.; Troe, J. J. Chem. Phys. 1988, 88, 3564.
(174) Jalenak, W.; Weston, R. E.; Sears, T. J.; Flynn, G. W. J. Chem. Phys. 1985, 83,
6049.
(175) Fujii, M.; Ebata, T.; Mikami, N.; Ito, M. Chem. Phys. 1983, 77, 191.
(176) Burkholder, J. B.; Mills, M.; McKeen, S. Geophys. Res. Lett. 2000, 27, 2493.
(177) Hintze, P. E.; Feierabend, K. J.; Havey, D. K.; Vaida, V. Spectrochim. Acta, Part
A 2005, 61, 559.
(178) Rothman, L. S.; Rinsland, C. P.; Goldman, A.; Massie, S. T.; Edwards, D. P.;
Flaud, J. M.; Perrin, A.; Camy-Peyret, C.; Dana, V.; Mandin, J. Y.; Schroeder, J.;
McCann, A.; Gamache, R. R.; Wattson, R. B.; Yoshino, K.; Chance, K. V.; Jucks, K. W.;
Brown, L. R.; Nemtchinov, V.; Varanasi, P. J. Quant. Spectrosc. Radiat. Transfer 1998,
60, 665.
(179) Beyer, T.; Swinehar.Df. Commun. ACM 1973, 16, 379.
(180) Chao, R. S.; Khanna, R. K. Spectrochim. Acta, Part A 1977, 33, 53.

- 278 -
(181) DeSain, J. D.; Taatjes, C. A.; Miller, J. A.; Klippenstein, S. J.; Hahn, D. K.
Faraday Discuss. 2001, 119, 101.
(182) DeSain, J. D.; Klippenstein, S. J.; Miller, J. A.; Taatjes, C. A. J. Phys. Chem. A
2003, 107, 4415.
(183) Walker, R. W.; Morley, C. Low Temperature Combustion and Autoignition;
Amsterdam, 1997.
(184) Tardy, D. C.; Song, B. H. J. Phys. Chem. 1993, 97, 5628.
(185) Roney, P. L.; Findlay, F. D.; Buijs, H. L.; Cann, M. W. P.; Nicholls, R. W. App.
Opt. 1978, 17, 2599.
(186) Lenzer, T.; Luther, K. J. Chem. Phys. 1996, 104, 3391.
(187) Stein, S. E.; Rabinovi.Bs. J. Chem. Phys. 1973, 58, 2438.
(188) Green, J. H. S.; Barnard, P. W. B. J. Chem. Soc. 1963, 640.
(189) Scott, A. P.; Radom, L. J. Phys. Chem. 1996, 100, 16502.
(190) Lim, K. F. Quantum Chem. Program Exchange Bull. 1994, 14, 3.
(191) McQuarrie, D. A. Statistical Mechanics; Harper & Row: New York, 1976.
(192) Lide, D. R. CRC Handbook of Chemistry and Physics; CRC Press Inc.: New York,
2004-2005.
(193) McQuarrie, D. A. Statistical Mechanics. In University Science Books New York,
2000.