abstract - eprints.utm.myeprints.utm.my/id/eprint/16355/7/adeerawanminhatmfke2010.pdf · v abstract...
TRANSCRIPT
v
ABSTRACT
Future satellite mobile communication systems designed for mobile user
applications will use extremely high frequency carriers to provide more capacity and
smaller equipment. At these frequencies, the extra attenuation due to rain is a
primary cause of communications impairment on satellite-earth paths, especially
above 10 GHz. Rain seriously influences the performance of a communications
satellite link. The ability of radar to scan a wide area around the radar site and not
just a particular path made it a very attractive for many types of investigations. Radar
can be used to measure the rainfall rate indirectly. The main objective of this project
is to find the rain rate, rain cell size distribution of local rain and compare the rain
rate and rain cell size distribution with ITU-R recommendations. For this study, the
data for 0.5 elevation angle and 0.5 km range bin is used by Plan Position Indicator
(PPI) scan. This project gives the value of two important parameters in microwave or
satellite link design. That is the rainfall rate ( . ) and the rain cell size ( . )
distributions. The results give an acceptable correlation with the international
telecommunication union- radio communication sector (ITU-R) recommendations.
The proposed rain rate distribution model can be used to determine the rain at the
percentage of interest. This is useful for microwave link system planning and link
budget estimation.
vi
ABSTRAK
Masa depan satelit sistem komunikasi yang direka untuk aplikasi pengguna,
pembekal khidmat akan menggunakan frekuensi sangat tinggi untuk menyediakan
kapasiti yang lebih besar dan peralatan yang lebih kecil. Pada frekuensi-frekuensi ini,
redaman tambahan kerana hujan adalah punca utama penurunan pada jalur
komunikasi satelit-bumi, terutama frekuensi melebihi 10 GHz. Hujan lebat
mempengaruhi prestasi saluran satelit komunikasi. Kemampuan radar untuk
mengimbas wilayah yang luas di sekitar lokasi radar dan bukan hanya pusat tertentu
membuatkan ia menjadi sangat menarik bagi pelbagai jenis penyelidikan. Radar
boleh digunakan untuk mengukur tahap curah hujan secara tidak langsung. Tujuan
utama projek ini adalah untuk mencari curah hujan, saiz sel hujan tempatan dan
membandingkan curah hujan dan saiz sel hujan dengan cadangan ITU-R. Untuk
kajian ini, data bagi sudut 0.5 dan 0.5 km bin rentang digunakan oleh sistem Plan
Position Indicator (PPI) scan. Projek ini memberikan dua nilai parameter penting
dalam ketuhar atau bentuk saluran satelit. Itu adalah peringkat curah hujan ( . )
dan saiz sel pengedaran hujan ( . ). Keputusan memberikan korelasi diterima
dengan cadangan Sektor Kesatuan-Radio Komunikasi Telekomunikasi Antarabangsa
(ITU-R). Model tingkat hujan yang dicadangkan boleh digunakan untuk menentukan
hujan pada peratusan tertentu. Ia berguna untuk perancangan sistem perhubungan
dan menilai anggaran perbelanjaan sistem perhubungan.

vii
TABLE OF CONTENTS
CHAPTER TITLE PAGE
DECLARATION ii
DEDICATION iii
ACKNOWLEDGEMENTS iv
ABSTRACT v
ABSTRAK vi
TABLE OF CONTENTS vii
LIST OF TABLES x
LIST OF FIGURES xii
LIST OF SYMBOLS xv
LIST OF ABBREVIATIONS xviii
LIST OF APPENDENCES xix
1 INTRODUCTION 1
1.1 Introduction 1
1.2 Problem Statement 2
1.3 Project Objective 4
1.4 Scope of Work 4
1.5 Project Methodology 5
1.6 Project Out line 7
2 LITERATURE REVIEW 8
2.1 Introduction 8
2.2 RADAR Review 9
2.2.1 Introduction 9
2.2.2 Target Information Extraction 11
2.3 Meteorological Radar 14
xviii
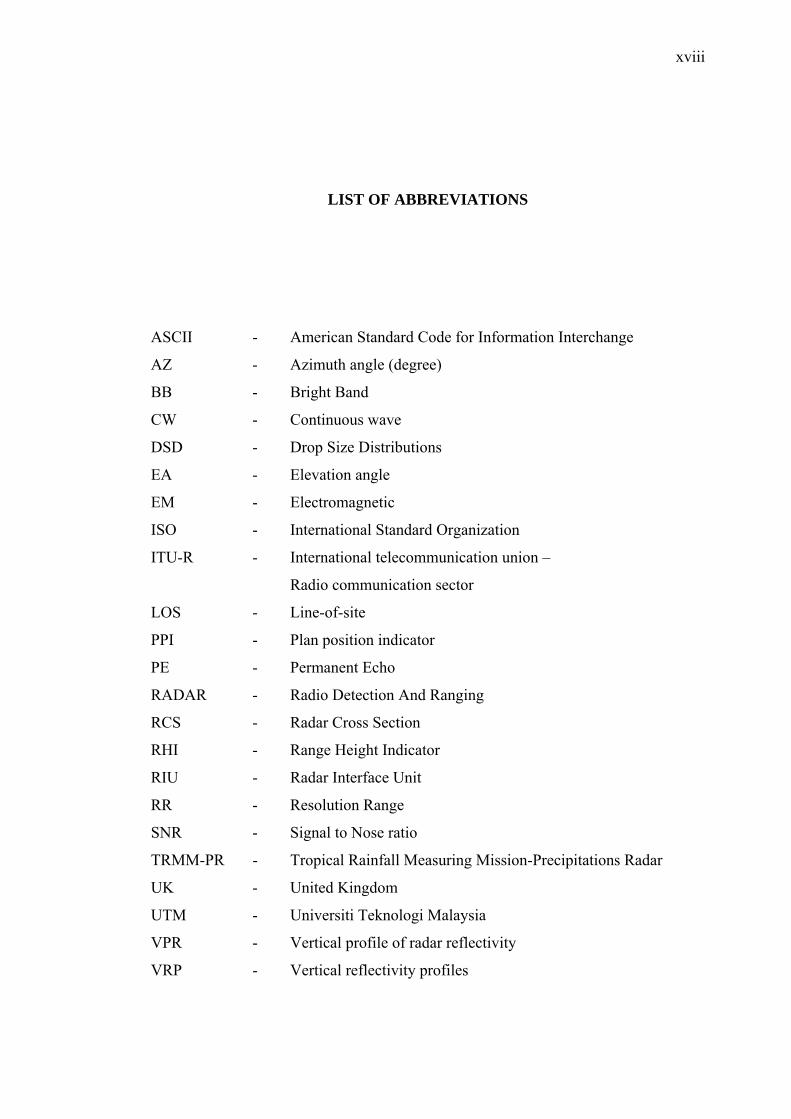
LIST OF ABBREVIATIONS
ASCII - American Standard Code for Information Interchange
AZ - Azimuth angle (degree)
BB - Bright Band
CW - Continuous wave
DSD - Drop Size Distributions
EA - Elevation angle
EM - Electromagnetic
ISO - International Standard Organization
ITU-R - International telecommunication union –
Radio communication sector
LOS - Line-of-site
PPI - Plan position indicator
PE - Permanent Echo
RADAR - Radio Detection And Ranging
RCS - Radar Cross Section
RHI - Range Height Indicator
RIU - Radar Interface Unit
RR - Resolution Range
SNR - Signal to Nose ratio
TRMM-PR - Tropical Rainfall Measuring Mission-Precipitations Radar
UK - United Kingdom
UTM - Universiti Teknologi Malaysia
VPR - Vertical profile of radar reflectivity
VRP - Vertical reflectivity profiles

xvii
σH - Backscatter cross section for horizontal polarization
σV - Backscatter cross section for vertical polarization
γg - Specific attenuation for atmospheric gases (dB/km)
γc - Specific attenuation for clouds (dB/km)
γp - Specific attenuation for precipitation (dB/km)
φ - Latitude of the earth-station location
ρco - Co-polar correlation
δco - Scattering differential phase

xvi
hbot - Bright band region bottom height (km)
hpeak - Height of peak of bright band reflectivity
hR - Rain height (km)
hT - Top border of bright band
htop - Bright band region top height (km)
h0 - 0°C isotherm height, peak of reflectivity
L - Losses of microwave measurement element
LDR. - Linear depolarization ratio
N - Concentration of particles in certain size
N (D) - The drop size distribution (DSD)
n - Complex index of refraction
P1(r) - Power transmitted in direction r (W)
P2(r) - Power transmitted by omni-directional antenna in direction r (W)
Pt - Transmitted power (W)
Pr - Received power (W)
R, r - Range, distance or radius (m)
Tx - Transmitter
V - Resolution volume (m3)
W - Power density (W/m2)
Z - Effective reflectivity factor (mm6/m3)
ZDR - Differential reflectivity
ZH - Reflectivity measured at horizontal polarization
ZV - Reflectivity measured at vertical polarization
Ze - Effective radar reflectivity factor (mm6/m3)
Zpeak - Peak of bright band reflectivity
Zrain - Reflectivity of rain
Zsnow - Reflectivity of snow
Ω - Antenna solid angle
ΦDP - Differential phase shift
η - Radar reflectivity (m2 m-3)
λ - Wavelength (m)
τ - Pulse duration (second)
σ - Effective area of the radar target (m2)
xv
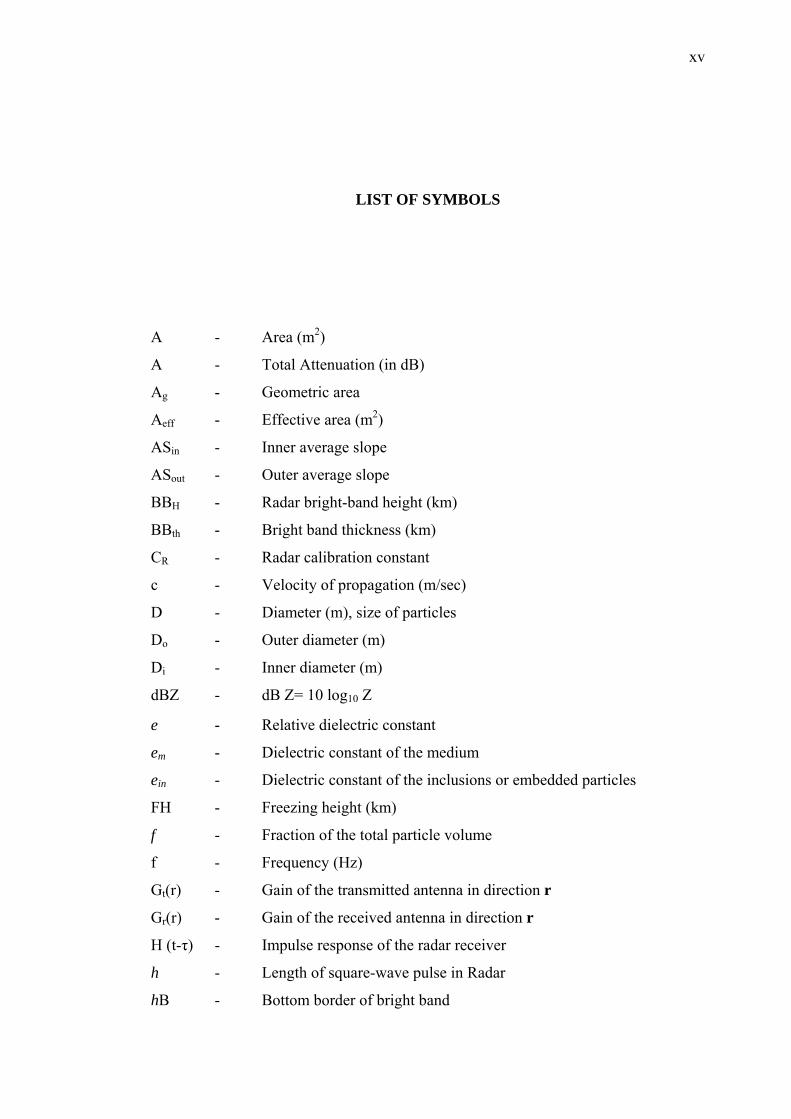
LIST OF SYMBOLS
A - Area (m2)
A - Total Attenuation (in dB)
Ag - Geometric area
Aeff - Effective area (m2)
ASin - Inner average slope
ASout - Outer average slope
BBH - Radar bright-band height (km)
BBth - Bright band thickness (km)
CR - Radar calibration constant
c - Velocity of propagation (m/sec)
D - Diameter (m), size of particles
Do - Outer diameter (m)
Di - Inner diameter (m)
dBZ - dB Z= 10 log10 Z
e - Relative dielectric constant
em - Dielectric constant of the medium
ein - Dielectric constant of the inclusions or embedded particles
FH - Freezing height (km)
f - Fraction of the total particle volume
f - Frequency (Hz)
Gt(r) - Gain of the transmitted antenna in direction r
Gr(r) - Gain of the received antenna in direction r
H (t-τ) - Impulse response of the radar receiver
h - Length of square-wave pulse in Radar
hB - Bottom border of bright band
xiv
to January 2007)
A5.2 Fitting process to get the general power (November 2006
to January 2007)
117
A5.3 Choose 0.01% radar data (November 2006 to January
2007)
117

xiii
3.12 The process of rain cell in Matlab workspace 53
4.1 The plots of original data and the curve-fit line. 57
4.2 The plots rain rate curve-fit line 59
4.3 The curve-fit line for overall month. 62
4.4 The general model power and coefficients for overall
month
62
4.5 Curve fitting Analysis November 2006 64
4.6 The general model power and coefficients for overall
month
66
4.7 Trend of rainfall rate distribution 68
4.8 Trend of rain cell size distribution 68
4.9 Graph of rain rate versus percentage of time 69
4.10 Graph of rain cell size versus percentage interest 69
A4.1.1 Analysis data in 0.01% at November 2006 97
A4.1.2 Curve Fitting Analysis at November 2006 97
A4.2.1 Analysis data in 0.01% at December 2006 99
A4.2.2 The plots of original data and the curve-fit line at
December 2006
99
A4.3.1 Analysis data in 0.01% at January 2007 101
A4.3.2 The plots of original data and the curve-fit line at January
2007
101
A4.4.1 Analysis data in 0.01% at February 2007 103
A4.4.2 The plots of original data and the curve-fit line at
February 2007
103
A4.5.1 Analysis data in 0.01% at March 2007 105
A4.5.2 The plots of original data and the curve-fit line at March
2007
105
A4.6.1 Fit Editor with general model of power (Nov 2006 ‐ Mac
2007)
107
A4.6.2 Graph rainfall rate versus percentage (Nov 2006 ‐ Mac
2007)
108
A4.6.3 Analysis data in 0.01% of the time (Nov 2006 ‐ Mac 2007) 108
A5.1 Fitting process to get the general power (November 2006 116
xii
LIST OF FIGURES
FIGURE NO. TITLE PAGE
2.1 Radar simplified block diagram (Edde, 1993) 10
2.2 Spherical coordinates (Edde, 1993) 12
2.3 PPI display of resolution (Edde, 1993) 14
2.4 Monostatic radar observation geometry 16
2.5 Tropical rainfall 24
2.6 The global rain rate regions (Crane, 1980). 27
2.7 Rain rate distribution curves for various regions (Crane,
1980).
27
2.8 Rainfall climatic zones (Allnutt, 1989) 29
2.9 Rainfall rate contours for 0.01% of the time for Asia (Allnutt, 1989)
30
2.10 Revised rainfall rate contours for 0.01% of the time
(ITU-R P.837)
31
3.1 RAPIC System 39
3.2 A typical sample of radar intensity scanned by RAPIC transmitter
43
3.3 The flow chart of selecting data 47
3.4 The folders of raw data separate by month 48
3.5 Types of raw data file inside the folders 48
3.6 Inside the klgN.txt after select the Kluang radar data 49
3.7 The flow chart of decoding data 50
3.8 Open the file.txt of radar data before decode process 50
3.9 The flow chart process to determine the rainfall rate 51
3.10 The running process of rainfall rate 52
3.11 The flow chart process to determine the rain cell size 53
xi
A2.3 Rainfall Rate January 2007 88
A2.4 Rainfall Rate February 2007 88
A2.5 Rainfall Rate March 2007 89
A2.6 Rainfall Rate (November 2006 to March 2007) 89
A3.1 Rain Cell Size November 2006 90
A3.2 Rain Cell Size December 2006 91
A3.3 Rain Cell Size January 2007 92
A3.4 Rain Cell Size February 2007 93
A3.5 Rain Cell Size March 2007 94
A3.6 Average of Rain Cell Size (November 2006 to84 March
2007)
95
A4.1 Rain rate distribution at November 2006 96
A4.2 Rain rate distribution at December 2006 98
A4.3 Rain rate distribution at January 2007 100
A4.4 Rain rate distribution at February 2007 102
A4.5 Rain rate distribution at March 2007 104
A4.6 Rain rate distribution at (Nov 2006 ‐ Mac 2007) 106
A5.1 Total of rain cell and percentage D at November 2006 109
A5.2 Total of rain cell and percentage D at December 2006 110
A5.3 Total of rain cell and percentage D at January 2007 111
A5.4 Total of rain cell and percentage D at February 2007 112
A5.5 Total of rain cell and percentage D at March 2006 113
A5.6 Total of rain cell and percentage D at
(November 2006 to January 2006)
114
A5.7 Generate graph to view data set (November 2006 to
January 2007)
115

x
LIST OF TABLES
TABLE NO. TITLE PAGE
2.1 Point Rain Rate (RP) Distribution Values (mm/h) Versus
Percent of Year Rain Rate is exceeded (Crane, 1980).
28
2.2 Rainfall rates in the climatic zones (Allnutt, 1989) 29
3.1 Radar Specifications 38
3.2 15 volumetric elevations angle 42
3.3 16 Volumetric signal strength thresholds and the
corresponding rain rate
44
3.4 The sixteen characters that define absolute levels 45
3.5 The forty-nine characters that define the deviation
encoding
45
4.1 One month rain rate distribution at November 2006 56
4.2 Rain rate distribution at December 2006 58
4.3 Rainfall Rate distribution indicates by month. (See
Appendix E)
60
4.4 Rainfall Rate distribution by all month 60
4.5 Rain cell size distribution in Nov 2006 63
4.6 Data set of rain cell overall month 65
4.7 Percentages of rain cell analysis for overall month. 67
4.8 Rain cell Size distribution indicates by month and average
month
67
4.9 Comparisons rainfall rate based on Malaysia, Thailand,
Laos and Singapore.
70
A2.1 Rainfall Rate November 2006 87
A2.2 Rainfall Rate December 2006 87
ix
3.5.2 Decoding data 49
3.5.3 Calculate the Rainfall Rate 51
3.5.4 Calculate the Rain Cell Size 52
3.6 Summary 54
4 RESULT AND ANALYSIS 55
4.1 Introduction 55
4.2 Distribution of Rainfall Rate from Radar Data 55
4.3 Distribution of Rain Cell Size from Radar Data 63
4.4 Comparison Results 70
4.5 Summary 71
5 CONCLUSION AND FUTURE STUDIES 72
5.1 Conclusion 72
5.2 Future Studies 74
REFERENCES 75
Appendices 1-5 79-117

viii
2.3.1 Introduction 14
2.3.2 The Role of the Antenna on
Transmission and Reception
15
2.3.3 Reflection from the Target 17
2.4 Resolution 18
2.5 Meteorological Radar Equation 19
2.5.1 General Radar Equation 19
2.5.2 Radar Equation for Distributed Target 21
2.6 Rainfall Rate Distributions Review 23
2.6.1 Rainfall Characteristics 23
2.6.2 Rainfall Rate for 0.01 % of the time or
R0.01
25
2.7 Rain Prediction Models 26
2.7.1 Crane’s Global Model 26
2.7.2 ITU-R Model 28
2.8 Rain in Malaysia 31
2.9 Rainfall Rate Review 32
2.10 Rain Cell Size Review 34
2.10.1 Determination of Rain Cell Size 35
2.11 Summary 36
3 RAINFALL RATE AND RAIN CELL SIZE
DISTRIBUTION
38
3.1 Introduction 37
3.2 Kluang Radar Station and RAPIC Transmitter 37
3.3 Radar Data Format 41
3.3.1 ASCII Asynchronous Format for Radial
Representation
41
3.3.2 Radar Data Encoding Types 44
3.3.3 Sixteen Level ASCII Encoding 44
3.3.4 Sixteen Level Run Length Encoding 46
3.4 Transmission of Radar Data 46
3.5 Methodology 47
3.5.1 Selecting data 47
xix
LIST OF APPENDICES
APPENDIX TITLE PAGE
A A MATLAB Programs 79
B Rainfall Rate Results (November 2006 to March
2007) Using Microsoft Excel
87
C Rain Cell Size Results (November 2006 to March
2007)
90
D Rain Rate Analysis 96
E Rain Cell Size Analysis 109
CHAPTER 1
INTRODUCTION
1.1 Introduction
Wireless communication has seen a tremendous amount of growth. No doubt
that the advancement in RF technology and the miniaturization of handheld devices
has popularized the appeal of such devices among public and commercial users.
Microwave links are an important part of telecommunication.
However, a major concern for microwave links is the attenuation due to rain.
For a tropical country like Malaysia, rain occur almost yearound and in most
instances, the rainfall rate is much higher when compared to temperate regions. Thus,
a proper model based on local study is needed to predict the rainfall rate in order to
estimate the rain attenuation. This information is useful for microwave applications
such as microwave link budget planning.
The rain attenuation also can affects for path reliability. It contributes in
power budget and fade margin considerations. Thus, it is very important to properly
quantify rain attenuation. A rain event occurring in an area is not constant. Rain does

6
angle with same azimuth from next 10 minutes until the end of level. When
calculated the rain rate for all azimuths, the Matlab software can not start
array from 0. Due to that, there were shifting in the azimuth angle by one
from 1 to 360o instead of 0 to 359o. Add to that, from the radar specification
will not read the first 4 Km. Also, only the 500 m range been where selected
to be consider. The determination of the rain rate for 0.01 percent of the time
or ( ) comes from the fact that a good system must provide at least
99.99% reliability. Design and system engineers use this value to construct
communications system such that the link is available for 99.99% of the time.
Any communication system built with this value to ensure customer
satisfaction. This project followed the ITU-R recommendation which
estimated the rain rate for Malaysia is 120 mm/hr.
.
.
4- Calculate the rain cell size:
The step of this processing is loading the levklg.mat file generates
during rainfall rate calculations. The processes to calculate the rain cell size
( ) depend on level distance. After finish running the program, we can
use the curve fit tool to get the result. The link budget for all wireless
communication systems at Ku band frequencies and above should consider
this novel computation for successful RF planning.
5- Compare the results:
Compare the results of rainfall rate and rain cell size with other
research papers and International Telecommunication Union (ITU-R)
recommendation.
5
Rain cell size distribution is also obtained from radar data. However, rain cell
size distribution from radar data is limited to 500m integration size. This is due to the
fact that the radar uses a range-bin size of 500m.
1.5 Project Methodology
1- Selecting data:
The study had been done according to one year tropical radar data, by
selecting Kluang data considering the terrestrial path (elevation angle 0.5o)
and for each 500m range been.
2- Decoding data:
To decode the data must understand the ASCII Encoding mechanism.
Sixteen characters that define the absolute levels and forty-nine characters
that define the deviation encoding. The run length encoding is utilized to
improve the compression of radials. A number occurring after a letter implies
that the last encoded video level repeats for the next number of range bins.
To do that, Matlab software had been applied on filtered data.
3- Calculate the rainfall rate:
The radar takes the data from azimuth angle 0o up to 359o for every 10
minutes. Program done to add the rain events which occur in each azimuth

4
Thus, the aim of this thesis is to find the profile of rain rate distribution inside
a rain cell and to determine the rain cell size distribution of local rain.
1.3 Project Objective
The main objective of this project is to find the rain rate distribution and to
determine the rain cell size distribution of local rain.
Comparisons the rain rate distribution and rain cell size with ITU-R
recommendations. The radar data is obtained from the Kluang Radar Station of the
Meteorological Department of Malaysia.
1.4 Scope of Work
The scope of study indicates the basic guidelines and techniques that this study examined in achieving the objectives. It also ensures that the work done stays within the intended study.
Radar data gives the averaged rainfall rate for a range-bin size of 500m each.
This rainfall data is used to calculate the rainfall rate, which is 4km to 20km path
lengths. The radar data is obtained from the Kluang Radar Station of the
Meteorological Department of Malaysia from November 2006 until March 2007.
3
A very important factor that affects path reliability is rain attenuation. It also
contributes in power budget and fade margin considerations. Thus, it is very
important to properly quantify rain attenuation. Due to the nature of rain events, a
reduction factor is needed in order to calculate rain attenuation. A rain event
occurring in an area is not constant. Rain does not distribute evenly in a region
experiencing precipitation. Even though specific attenuation due to rain for a specific
distance or per kilometer can be formulated; there arises a need to find a reduction
factor to account for the non-uniformity of rain for larger distances. This is especially
crucial in tropical regions as rain has been found to be more convective in nature
rather than widespread. Tropical region also suffers heavier rainfall rates as
compared to temperate regions.
To formulate the reduction factor, the experimental procedure would require
several links with different path lengths to be set up in close proximity. However,
this would be very difficult to be constructed. An alternative approach is to use radar
data to obtain attenuation statistics for simulated links of various lengths. In addition,
even after a proposed microwave link has been evaluated with regard to reliability,
the calculations may show that it will not meet the required standards. Or a designer
may want to improve the reliability of the telecommunication system. In this
situation, mitigation techniques such as diversity may be employed.
One such technique is space diversity where an additional receiver may be
constructed (Nor Hisham Khamis et al, 2000). By switching and/or combining the
signals received by the two receivers, the reliability of the communication link is
greatly increased. An important parameter to consider is site separation or the
distance between the two receivers. When spacing is adequate between the two
receivers, there should be little correlation between the two paths. Site separation or
distance is used to determine the diversity improvement factor and diversity gain
when employing diversity (ITU-R P.618-5, 1997). Knowing rain cell size
distribution will help to determine site separation.
2
not distribute evenly in a region experiencing precipitation. There arises a need to
find rain cell size distribution to account for the non-uniformity of rain for larger
distances. This is especially crucial in tropical regions as rain has been found to be
more convective in nature rather than widespread. Tropical region also suffers
heavier rainfall rates as compared to temperate regions. To formulate the rain cell
size distribution using rain gauges would requires many such devices to be installed.
This would be very difficult and expensive. An alternative approach is to use radar
data to obtain rain cell size statistics. The Meteorological Department of Malaysia
operated several meteorological radars throughout the Malay Peninsular, Sabah and
Sarawak. However, in this study, only the Kluang radar data, located in the southern
part of the Malay Peninsular is utilized.
1.2 Problem Statement
Power budget and fade margin are important factors to be considered in
designing microwave transmission systems. The world of telecommunication is very
competitive such that when providing for a system, careful infrastructure planning is
needed to avoid unnecessary costs.
Microwave links are designed to meet specific reliability factor. Reliability,
or sometimes is known as availability of a system, is usually expressed as a
percentage. It represents the percentage of the time the link is expected to operate
without an outage caused by propagation conditions. It has been widely accepted that
a good communication system must provide at least 99.99% reliability (IEEE, 2004;
ITU-R SA 1414). In other words, the system can only be down for 0.01% of the
time, which is usually referenced to a year. This means that the system can be
unavailable for no less than 52.6 minutes per year [365.25*24*60*0.01/100]. (For
emergencies, call 999; for no emergency, it is 99.99%!).

7
1.6 Project Outline
Chapter one concerns with the introduction of the study in hand, which starts
with brief introduction, and continues stating the problem, the objective, the scope of
the study and finally methods employed to achieve the goals.
Chapter two, which is the first chapter of the literature review, presents the
RADAR principles and characteristics, by focusing on meteorological radar, which
its data is used in this project.
Chapter three shows the methodology of the project. Introduction to radar
data format, transmission of radar data and shown the flow chart for calculate the
rainfall rate and rain cell size distribution.
Chapter four presents the obtained results and analysis data. The results were
interpreted and compared with the ITU-R recommendations and other findings in the
tropical region to measure the validity of the obtained results.
Chapter five concludes and emphasizes the obtained results and the
contribution of the study. This chapter also proposes the future work that can be
done.