abstract -...
TRANSCRIPT

St Louis Large Office Building Paper 3-Spring/Fall Operation & Control Kirby Nelson, PELife member ASSHRAE
PREFACE: ASHRAE approved this paper for presentation at St. Louis 2016. I agreed to present if DOE/PNNL or anyone would present EnergyPlus or other model papers dealing with the same large office building as defined here. No response so the papers were moved to Vegas 2017. Again no response so the papers were pulled.My effort to advance ASHRAE Building Energy Modeling capability will continue with development of Advanced Energy Design Guides for specific cities in varies parts of the World. Let me know a city you would like me to work on.
INTRODUCTION
This paper 3 is a continuation of paper 1 that addressed the design of two systems for a St Louis
large office building at peak design summer weather conditions, and Paper 2 that considered
operation and control of the two systems at typical summer weather conditions. This paper will
address the same two systems at assumed typical spring/fall weather conditions where
perimeter heating becomes a control issue. This paper will demonstrate that limiting perimeter
heating air temperature to about 94F results in significant increased heat energy compared to a
heating air temperature of 110F. Also raising the supply air temperature, as suggested by
several ASHRAE publications including (Higgins 2013), is not a good control strategy and can
result in a significant increase in a systems kW demand. This Paper 3 will also show that
thermostat settings and return air paths can have a major effect on the energy consumption of a
building.
1

Figure 1 (Left charts) Assumed spring/fall weather conditions & 24 hour kW demand. (Right charts from Paper 2) Assumed summer weather conditions & 24 hour kW demand
SYSTEMS PERFORMANCE AT SUMMER & SPRING/FALL WEATHER CONDITIONS
Figure 1 illustrates the change in operation of the two designs going from summer weather to spring/fall
weather conditions. The kW demand has significantly increased during spring/fall night hours due in large
part to the requirement for perimeter heat as shown by Figure 2. Figure 1 also illustrates that the day time
kW demand of the two systems decreased with spring/fall weather due to the reduced cooling load.
2
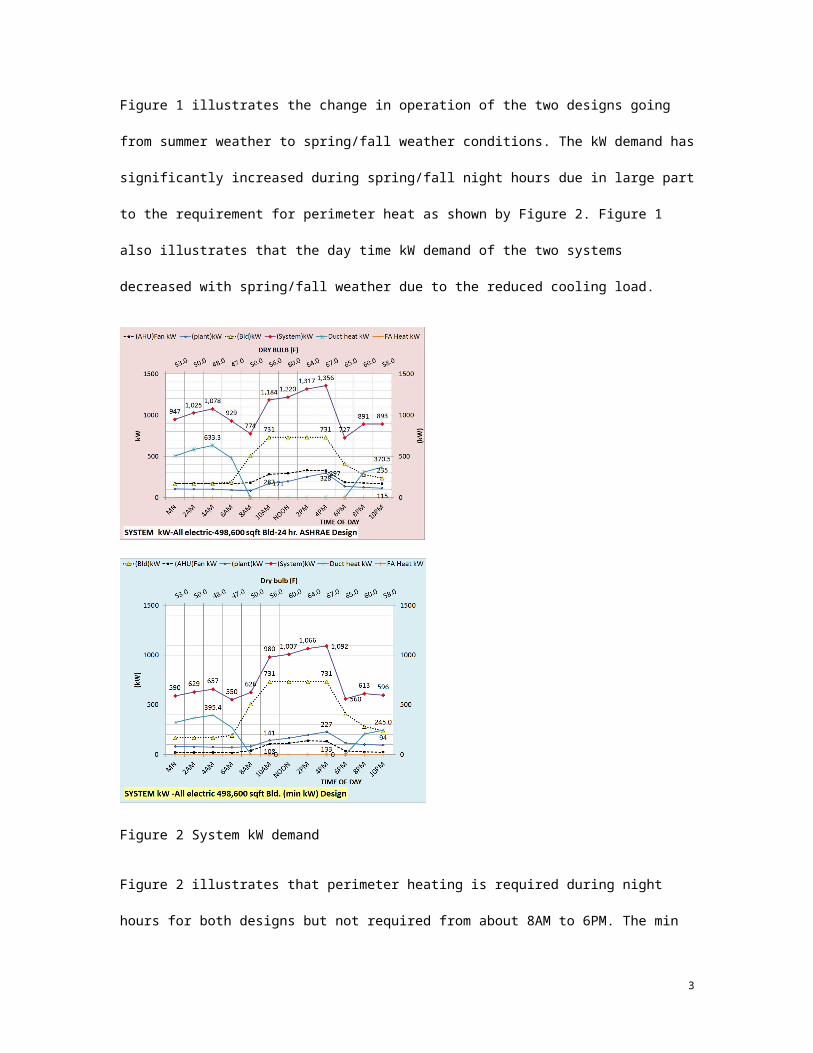
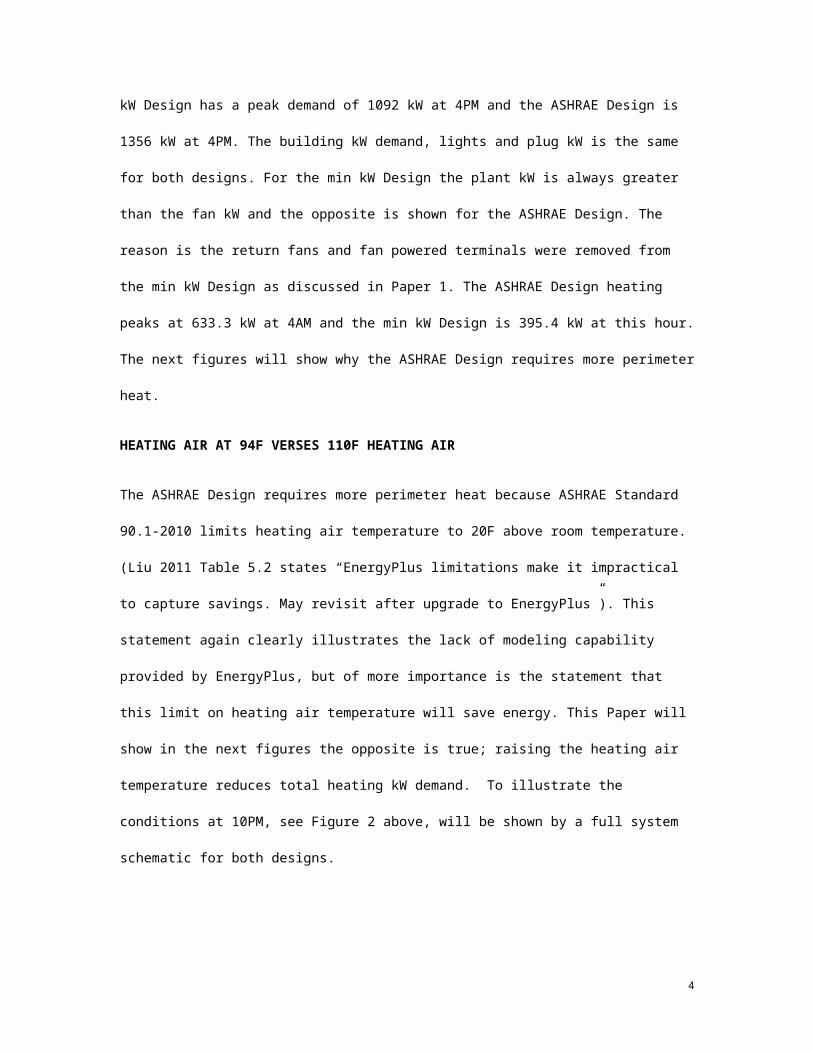
Figure 2 System kW demand
Figure 2 illustrates that perimeter heating is required during night hours for both designs but not required
from about 8AM to 6PM. The min kW Design has a peak demand of 1092 kW at 4PM and the ASHRAE
Design is 1356 kW at 4PM. The building kW demand, lights and plug kW is the same for both designs. For
the min kW Design the plant kW is always greater than the fan kW and the opposite is shown for the
ASHRAE Design. The reason is the return fans and fan powered terminals were removed from the min kW
Design as discussed in Paper 1. The ASHRAE Design heating peaks at 633.3 kW at 4AM and the min kW
Design is 395.4 kW at this hour. The next figures will show why the ASHRAE Design requires more
perimeter heat.
HEATING AIR AT 94F VERSES 110F HEATING AIR
3
The ASHRAE Design requires more perimeter heat because ASHRAE Standard 90.1-2010 limits heating
air temperature to 20F above room temperature. (Liu 2011 Table 5.2 states “EnergyPlus limitations make it
impractical to capture savings. May revisit after upgrade to EnergyPlus”). This statement again clearly
illustrates the lack of modeling capability provided by EnergyPlus, but of more importance is the statement
that this limit on heating air temperature will save energy. This Paper will show in the next figures the
opposite is true; raising the heating air temperature reduces total heating kW demand. To illustrate the
conditions at 10PM, see Figure 2 above, will be shown by a full system schematic for both designs.
Figure 3 min kW Design System at 10PM.
The kW of duct heat is shown on the right side of the Figure 3 schematic as 89.1 kW of reheat and 155.9
kW of heat for a total of 245 kW of duct heat also shown in the data at the lower left in the schematic. Duct
4
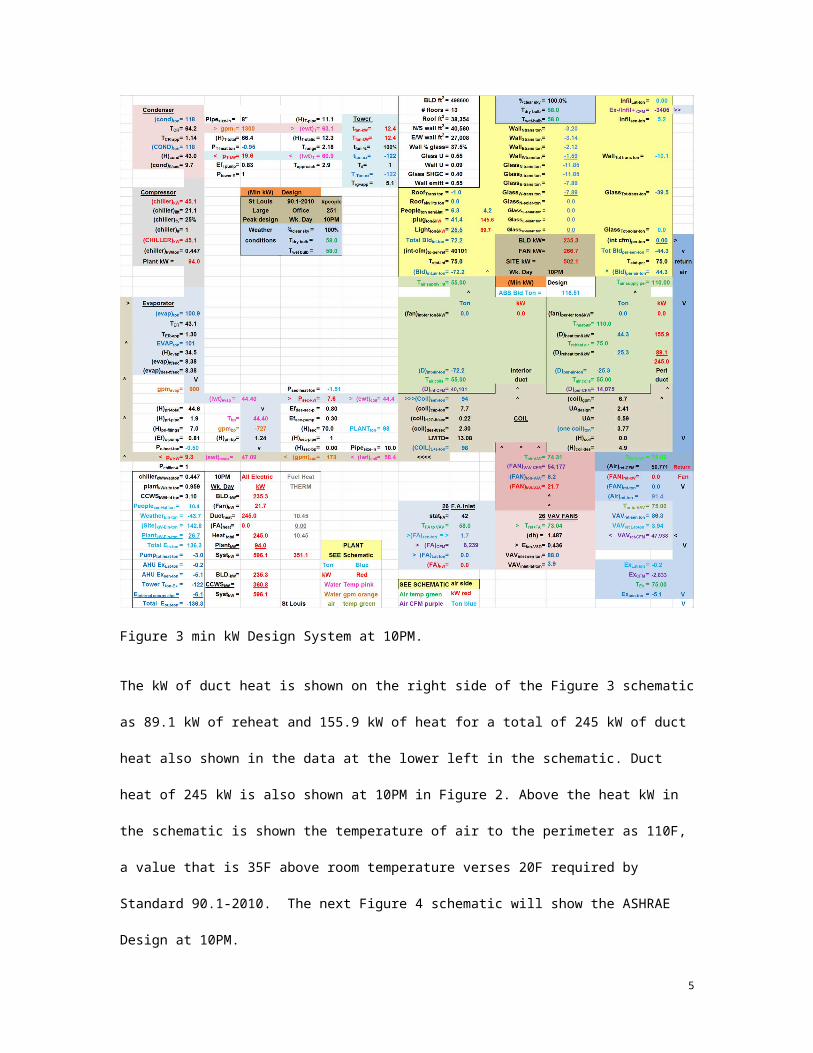
heat of 245 kW is also shown at 10PM in Figure 2. Above the heat kW in the schematic is shown the
temperature of air to the perimeter as 110F, a value that is 35F above room temperature verses 20F required
by Standard 90.1-2010. The next Figure 4 schematic will show the ASHRAE Design at 10PM.
Figure 4 ASHRAE Design System at 10PM.
The kW of duct heat is shown on the right side of the Figure 4 schematic as 222.0 kW of reheat and 148.5
kW of heat for a total of 370.5 kW of duct heat also shown in the data at the lower left in the schematic.
Duct heat of 370.5 kW is also shown at 10PM in Figure 2 for the ASHRAE Design. Note that the total heat
shown in the Figure 4 schematic is 432.9 kW which includes the kW heat of the powered terminal fans,
these fans also heat the supply air to the building interior. Above the heat kW in the schematic is shown the
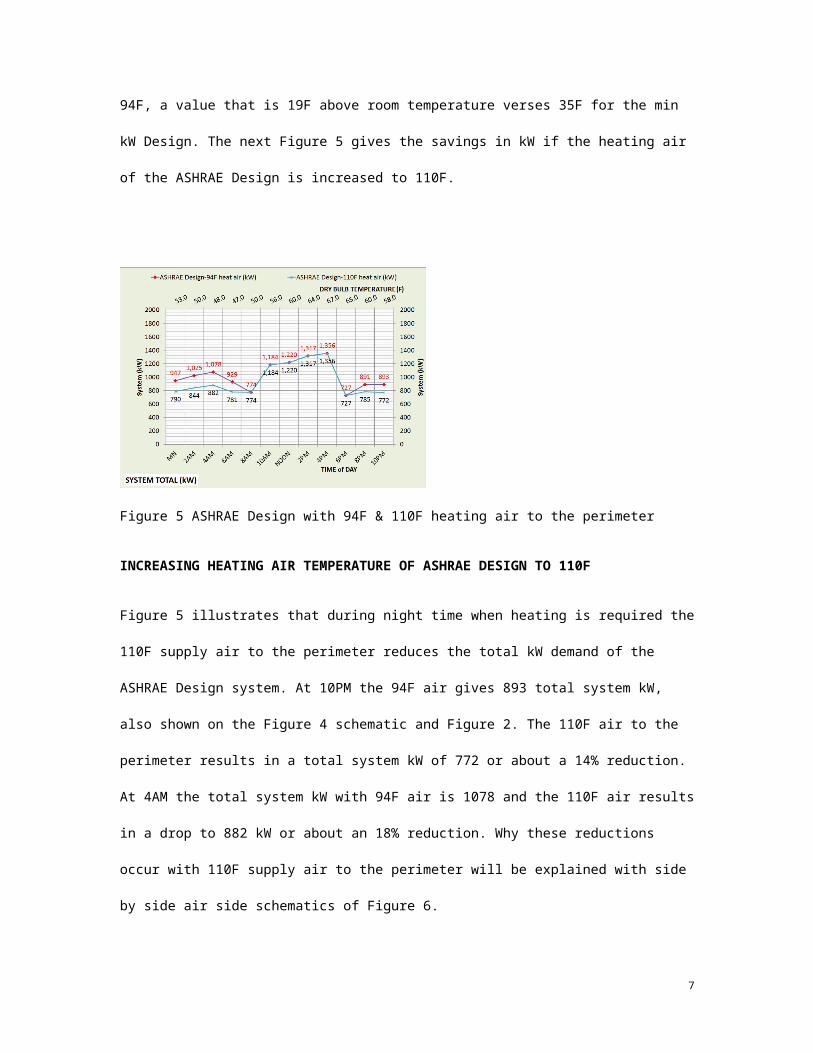
temperature of air to the perimeter as 94F, a value that is 19F above room temperature verses 35F for the
5

min kW Design. The next Figure 5 gives the savings in kW if the heating air of the ASHRAE Design is
increased to 110F.
Figure 5 ASHRAE Design with 94F & 110F heating air to the perimeter
INCREASING HEATING AIR TEMPERATURE OF ASHRAE DESIGN TO 110F
Figure 5 illustrates that during night time when heating is required the 110F supply air to the perimeter
reduces the total kW demand of the ASHRAE Design system. At 10PM the 94F air gives 893 total system
kW, also shown on the Figure 4 schematic and Figure 2. The 110F air to the perimeter results in a total
system kW of 772 or about a 14% reduction. At 4AM the total system kW with 94F air is 1078 and the
110F air results in a drop to 882 kW or about an 18% reduction. Why these reductions occur with 110F
supply air to the perimeter will be explained with side by side air side schematics of Figure 6.
6
7

Figure
6 ASHRAE Design site schematics. Left schematic 94F supply air to the perimeter and right schematic
110F supply air to the perimeter.
Changing the perimeter supply air temperature to 110F from 94F changes several parameters, most
importantly the air side kW or site kW is reduced from 777.7 kW to 665.8 kW a 14% reduction in total
system kW for this simple control change. The building loads do not change, 72.2 ton interior load and -60
ton perimeter load. Raising the perimeter supply air temperature reduces the CFM required to meet the
perimeter load of -60 ton. This in turn reduces the VAV fan CFM and therefore the VAV fan kW. The
reduced CFM to the perimeter reduces the reheat from 222.0 kW to 120.5 kW. The kW for heat does not
change at 148.5 kW. The net result is about a 14% reduction in total system kW just by raising the heating
air temperature to the perimeter from 94F to 110F. This statement in the ASHRAE Standard 90.1-2010
study, (Liu 2011 Table 5.2 states “EnergyPlus limitations make it impractical to capture savings. May
8

revisit after upgrade to EnergyPlus”) should cause ASHRAE to reconsider how 90.1 is being established.
The next two figures consider raising the supply air temperature off the coil from 55F to 60F.
Figure 7 ASHRAE Design 55F supply air verses 60F supply air.
RAISING SUPPLY AIR TEMPERATURE OFF THE COILS
Figure 7 illustrates that raising the supply air temperature is a bad idea for day time conditions, as discussed
in Paper 2, but gives less total system kW during night time when perimeter heat is required. To understand
this drop in total system kW at night with increased supply air temperature off the coils the following side
by side schematics will be reviewed.
9
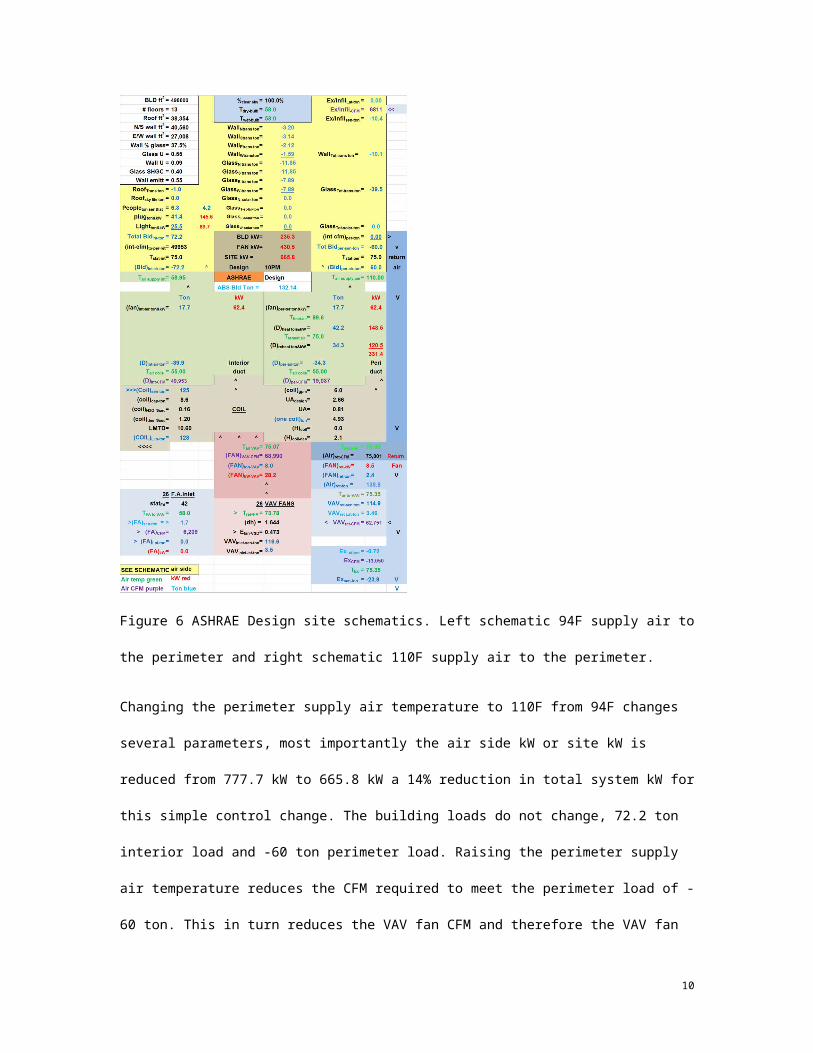
Figure 8 ASHRAE Design site schematics. Left schematic 55F supply air off the coil and right schematic 60F supply air off the coil.
As was discussed in Paper 2 raising the supply air increases the VAV CFM and therefore the VAV fan kW.
That is also true in Figure 8. The VAV fan CFM is 101,672 in the right schematic and 85,021 CFM in the
left schematic resulting in a VAV fan kW increase of (45.7 – 36.2 = 9.5 kW). The return fan also increases
2.9 kW for a total of 12.4 kW increase in fan kW by raising the supply air off the coil to 60F. Note that all
of the increased VAV fan CFM is going to the interior of the building, increasing from 49,953 CFM in the
left schematic to 66,603 CFM in the right schematic. The CFM of air to the perimeter does not change
because the heating load does not change. The reduction in kW demand for 60F supply air is the reduction
in reheat from 222.0 kW down to 166.5 kW due to the increased air temperature that must be reheated. The
net result is a site kW reduction of (777.7 - 734.6 = 43.1 kW). The general conclusion is that raising the
10

supply air temperature off the coil will increase VAV fan kW and reduce reheat if heating is occurring.
Figure 7 illustrates that the net system result will be an increase in system kW for the conditions
considered; again a bad control idea. The author has looked at lowering the supply air temperature off the
coils and found total system kW can be decreased with this control strategy. Perhaps a future paper? Stat
control will be considered next.
Figure 9 ASHRAE Design 75F perimeter stat set point verses 76F
THERMOSTAT CONTROL STRATAGIES
Return air paths coupled with internal and perimeter stat set points can result in energy increase or properly
controlled result in energy reduction. This analysis assumes all internal supply air returns to the perimeter
of the building. Figure 9 shows the total system kW demand for the ASHRAE design, in red, as defined
above by Figures 1, 5, &7. The other curve on Figure 9 is for 60F supply air off the coil and the perimeter
stat is set at 76F. The result is a significant increase in total system kW demand as shown by Figure 9.
Again we will look at side by side schematics to better understand.
11

Figure 10 ASHRAE Design site schematics. Left schematic 60F supply air off the coil and 75F perimeter
stat and right schematic 60F supply air off the coil and 76F perimeter stat.
The building in the schematic illustrates why the site kW increased from 734.6 (left schematic) to 825.5
kW (right schematic). The building internal zone air is at 75F and all air returns to the perimeter where the
stats are set at 76F. Therefore all the air is heated to 76F. As shown by comparing the two schematics, all
kW values increase, the VAV fans, the return fans, and the reheat and heat. Consider the possibility that the
perimeter stat was set at 74F. Heat from the interior would to transferred to the perimeter and drop all kW
values of the right schematic. (Hart, Reid 2015) states that the DOE/PNNL models cannot model
interactive effects, a major flaw in the (DOE) models. The next figure estimates (bEQ).
12

Figure 11 ASHRAE Design & min kW Design 24 hour kW demand & (bEQ) estimate.
ANNUAL (bEQ) ESTIMATE
The spring/fall (bEQ) estimate is based on 185 days. The summer estimate of Paper 2 was based on 90 days
and the winter will also be based on 90 days. As shown by Figure 11 the (bEQ) value for the ASHRAE
Design is about 48% more than the min kW value for spring/fall performance.
Table one summarizes the (bEQ) estimates of Paper 1 summer operation, and this Paper 2 spring/fall
operation. Table one also includes (bEQ) estimates for winter operation based on a (SEE) model analysis
not given in these three papers, a forth paper would be required. Table one estimates a (bEQ) for the min
kW Design of 46.81 and the ASHRAE Design estimate of 68.34, about 46% greater than the min kW
Design. Table one also breaks the annual (bEQ) values into the contribution of the building, fans, plant, and
heat. The building (bEQ) is the largest for both designs and also the same for both as required for a study of
the (CCWS) that serves the building. The ASHRAE Design fans are a much larger value than the min kW
Design, 15.16 (bEQ) verses 3.47 (bEQ). The reason is that the return fans and fan powered terminals were
eliminated from the min kW Design of Paper 1. The plant (bEQ) is a little less for the min kW Design, 8.11
verses 10.66, and the heat is significantly less for the min kW Design, 10.39 verses 17.68. Table one also
sums the summer, spring/fall, and winter values for each design. The spring/fall (bEQ) value is the largest
for both designs followed by winter (bEQ) and summer is the smallest (bEQ) for both designs. ASHRAE
13

publications largely focus on summer performance issues and plant design issues, clearly not the greatest
opportunity for improvement as shown by Table one.
min kW Design (bEQ) Component BLD. Fans Plant Heat Total
Summer 6.21 1.08 3.51 0.09 10.89Spring/Fall 12.42 1.67 3.52 4.63 22.24
Winter 6.21 0.72 1.08 5.67 13.68TOTALS 24.84 3.47 8.11 10.39 46.81
ASHRAE Design (bEQ) Component BLD. Fans Plant Heat Total
Summer 6.21 3.6 4.32 0 14.13Spring/Fall 12.42 8.14 4.63 7.96 33.15
Winter 6.21 3.42 1.71 9.72 21.06TOTALS 24.84 15.16 10.66 17.68 68.34
TABLE ONE (bEQ) Estimates
CONCLUSIONS
The following are conclusions for all three papers.
(1) The purpose of this series of three papers is to present a method of building energy analysis that
models real time building energy performance. The author does not suggest that the Microsoft
Excel model presented here is absolutely and totally complete after six years of development.
Note that after forty years of development the DOE and PNNL models do not have a good
infiltration or air side model; ASHRAE does not have a building energy model that is consistent
with the laws of thermodynamics and can provide real time 24 hour energy analysis.
(2) Chiller and tower performance data is given in Paper 2 and manufactures are requested to
provide critical review.
(3) DOE and PNNL are requested to provide detail analysis of the large office building defined in the
ASHRAE Standard 90.1-2010 study, (Liu 2011), the building used in this three paper study.
14

(4) The ideal research project would identify several office buildings in varies parts of the world and
install and monitor data hourly so that models could be verified and improved.
(5) An ASHRAE Journal article of 2015, (Hart, Reid 2015), states that the computer programs used to
establish 90.1 do not include the impact of improved controls or interactive effects and then
suggest in the conclusions that we may be at the end of significant reduction in building energy
consumption. The three papers presented here find significant opportunity to reduce building
energy consumption through better controls and interactive effects.
(6) The concept of stat control presented here is that internal and perimeter stats are set to
minimize energy consumption but at values that are reasonable to occupants. This means that
during the summer the stats are set the same, for this study 75F. During the winter the perimeter
stat should be set equal to or less than the internal stat so that heat is transferred from the
interior to the perimeter of the building assuming internal supply air goes to the perimeter for
return. A different return air pattern will change the stat control strategies.
(7) The ASHRAE Design requires more perimeter heat because ASHRAE Standard 90.1-2010 limits
heating air temperature to 20F above room temperature. (Liu 2011 Table 5.2 states “EnergyPlus
limitations make it impractical to capture savings. May revisit after upgrade to EnergyPlus”). This
statement again clearly illustrates the lack of modeling capability provided by EnergyPlus, but of
more importance is the statement that this limit on heating air temperature will save energy.
These study has shown the opposite is true; raising the heating air temperature to the perimeter
reduces heating kW demand.
(8) Annual (bEQ) estimates show that minor changes in design and control can have a major effect
on the annual energy consumption of a system.
(9) ASHRAE publications largely focus on summer performance issues and plant design issues,
clearly not the greatest opportunity for improvement as shown by Table one of Paper 3.
15

(10) The fundamental message of the author is that ASHRAE building energy models must be capable
of real time modeling of buildings energy consumption if ASHRAE is to fulfill its obligations to lead
the task of minimizing building energy consumption.
Models that attempt to model the last 8,760 hours were of value 40 years ago but of little value
today. The need is for System Energy Equilibrium (SEE) Models that can model the next hour, the
last hour, the last 24 hours within about 5%. Only then will we begin to understand how to fully
minimize building energy consumption.
And finally the author quotes a letter to the ASHRAE Journal (Nelson 2014); “Is it not time for all to admit
we have been on the wrong modeling path for more than 40 years?”
References
Hart, Reid 2015. “Have We Run Out Of Savings Potential In Standard 90.1?” ASHRAE Journal January 2015
Liu, B. May 2011. “Achieving the 30% Goal:
Energy and Cost Savings Analysis of ASHRAE Standard 90.1-2010” Pacific Northwest National Laboratory.
http://www.energycodes.gov/achieving-30-goal-energy-and-cost-savings-analysis-ashrae-standard-
901-2010
Nelson, Kirby 2014. Letters page 10. ASHRAE Journal September 2014
Ng, Lisa C., Persily, Andrew K., Emmerich, Steven J. 2014. “Improving Infiltration In Energy Modeling.”
ASHRAE Journal July 2014
Taylor, S. 2011. “Optimizing Design & Control of Chilled Water Plants.” ASHRAE Journal
(SEE) Modeling papers
Nelson, Kirby 2015. “High Performance Building Model” http://kirbynelsonpe.com
Nelson, Kirby 2012. “Simulation Modeling of a Central Chiller Plant” (CH-12-002) Chicago 2012
Conference.
Nelson, Kirby 2012.”Simulation Modeling of Central Chilled Water Systems” (CH-12-003) Chicago 2012
Conference.
Nelson, Kirby 2006. “7 Upgrades to Reduce Building Electrical Demand” ASHRAE Journal December 2006.
16

17