abstracts - 核融合科学研究所 · abstracts december 5 - december 8, 2006 toki-city, japan ....
TRANSCRIPT

16th International Toki Conference
Advanced Imaging and Plasma Diagnostics
Abstracts
December 5 - December 8, 2006 Toki-city, Japan

The 16th International Toki Conference “Advanced Imaging and Plasma Diagnostics” is the continuation of an annual series that was originally started in 1989, when the National Institute for Fusion Science was established. Each year, selected topics in plasma physics and fusion engineering research have been discussed. ITC-16 will address widely varying topics in the fields of advanced plasma diagnostics and in the fields of imaging sciences such as solar imaging, medical imaging, biological imaging, etc. by bringing together experts from research institutes and from industries.
INTERNATIONAL ORGANIZING COMMITTEE Osamu Motojima (Japan, Chair), Motoya Katsuki(Japan), Shoken Miyama(Japan), Noboru
Mizuno(Japan), Hiroki Nakamura(Japan), Teruji Cho (Japan), Tomoaki Hino(Japan), John
Howard(Australia), Jiang Hsieh (USA), Osamu Kaneko(Japan), Kazuo Kawahata(Japan), Akio
Komori(Japan), Gyung-Su Lee (Korea), Neville C. Luhmann (USA), Shinzaburo Matsuda(Japan), George
R. McKee(USA), Kunioki Mima(Japan), Takashi Mutoh(Japan), Nobuaki Noda(Japan), Yuichi
Ogawa(Japan), Nobuyoshi Ohyabu (Japan), Shigeki Okajima(Japan), Yukiharu Osawa (Japan), Hyeon K.
Park(USA), Fumimichi Sano(Japan), Yuka Sasaki(USA), Mamiko Sasao(Japan), Motoyasu Sato(Japan),
Rasmus R. Schroeder (Germany), Ernst Stelzer(Germany), Shigeru Sudo(Japan), Tatsuhiko Uda (Japan),
Hiroshi Yamada(Japan), Kenji Yamauchi(Japan), Naoaki Yoshida(Japan)
SCIENTIFIC PROGRAMME COMMITTEE Atsushi Mase (Japan, Chair), Ryusuke Kakigi (Japan), Hiroshi Karoji (Japan), Ryuji Kodama (Japan),
Katsumi Ida (Japan), Naofumi Iwama (Japan), Kuniaki Nagayama (Japan), Satoshi Ohdachi (Japan),
Hiromi Okamoto (Japan), Kuninori Sato (Japan), Kazuo Toi (Japan), Hiroshi Yamada (Japan)
LOCAL ORGANIZING COMMITTEE (NIFS, Japan) Kazuo Kawahata (Chair), Takeshi Akiyama, Mitsue Den, Masahiko Emoto, Hisayoshi Funaba, Katsumi
Ida, Satoshi Ido, Akifumi Iwamoto, Chie Iwata, Hiroshi Kasahara, Akemi Kato, Daiji Kato, Toshikazu
Kohmoto, Takashi Minami, Tomohiro Morisaki, Yasuo Morita, Sadatsugu Muto, Yoshio Nagayama,
Hideya Nakanishi, Kazumichi Narihara, Yoshiro Narushima, Shin Nishimura, Satoshi Ohdachi, Hiroaki
Ohtani, Byron J. Peterson, Toshihiro Sakaguchi, Satoru Sakakibara, Heiji Sanuki, Kazutaka Seo, Akihiro
Shimizu, Masao Takeuchi, Naoki Tamura, Kenji Tanaka, Kazuo Toi, Tokihiko Tokuzawa, Kiyomasa
Watanabe, Ichihiro Yamada, Hiroshi Yamada
9:00
9:00
4P
lasm
a (P
artic
le&
Fus
ion
Pro
duct
s )G
. McK
ee
9:00
7P
lasm
a(La
ser
& P
artic
leB
eam)
H. B
inds
lev
9:00
9P
lasm
aIm
agin
gJ.
How
ard
I4-1
M. T
anpo
30m
inI7
-1Y
. Ham
ada
30m
inI9
-1S
. Ohd
achi
30m
in9:
40I4
-2R
. Bar
nsle
y30
min
I7-2
G. R
. McK
ee30
min
O9-
2Y
. Agl
itsky
20m
inI4
-3H
. Bin
dsle
v30
min
O7-
3Y
. Hat
ae20
min
O9-
3M
. Tan
abe
20m
inO
7-4
K. K
awah
ata
20m
inO
9-4
B. J
. Pet
erso
n20
min
10:1
010
:30
10:4
010
:30
10:3
01
Ple
nary
A. M
ase
10:5
05
Ele
ctro
nM
icro
scop
yK
. Nag
ayam
a11
:00
8M
edic
alIm
a gin
gR
. Kak
igi
10:5
010
Bio
logi
cal
Ima g
ing
R. K
odam
a
I1-1
H. F
ukuy
ama
40m
in.
K. N
agay
ama
10m
inI8
-1Y
. Sas
aki
30m
inI1
0-1
E. S
telz
er30
min
I1-2
H. P
ark
40m
in.
I5-1
R. S
chro
eder
25
min
I8-2
N. S
adat
o30
min
I10-
2Y
. Ohm
iya
20m
inO
1-3
K. I
toh
20m
in.
I5-2
N. M
izun
o 25
min
O8-
3M
. Sug
iura
20m
inI1
0-3
T. N
emot
o20
min
I5-3
K. N
amba
25
min
O8-
4T.
Iida
ka20
min
I10-
4S
. Non
aka
20m
inI5
-4Y
. Kan
eko
25m
in12
:30
12:4
012
:40
12:2
0
13:5
02
Imag
eR
econ
stru
ctio
nN
. Iw
ama
13:5
013
:50
13:3
011
Mix
O. O
kam
oto
I2-1
H. K
udo
30m
inO
11-1
S. K
imur
a20
min
I2-2
J. H
sieh
30m
inO
11- 2
T. H
aseg
awa
20m
inI2
-3J.
How
ard
30m
inO
11-3
K. M
orita
20m
inI2
-4T.
Tak
eda
30m
inO
11-4
K. S
hiba
saki
20m
inO
11-5
L. P
rane
vici
us20
min
O11
-6S
. Sud
o20
min
15:5
015
:50
16:0
0
16:1
03
Pla
sma
(Imag
ing
Tech
nolo
gy)
H. P
ark
16:1
06
Ast
rono
my
(Hin
ode)
H. K
aroj
i
I3-1
N. L
uhm
ann,
Jr
30m
inI6
-1H
. Har
a30
min
I3-2
M. H
angy
o30
min
I6-2
K. I
chim
oto
30m
inI3
-3G
. Eto
h30
min
I6-3
R. K
ano
30m
inO
3-4
H. H
ojo
20m
inI6
-4T.
Wat
anab
e30
min
18:3
018
:30
18:3
0Y
. Nag
ayam
a
45m
in45
min
Cof
fee
Bre
ak
Cat
egor
ies
1-4,
6, 9
-12
Pos
ter (
Imag
ing)
Lunc
h B
reak
Lunc
h B
reak
Eve
ning
Cof
fee
Bre
akC
offe
e B
reak
Cof
fee
Bre
ak
Ope
n Le
ctur
e fo
rC
itize
nsH
. Kar
oji
R. K
akig
i
NIF
S T
echn
ical
Tou
r
Lunc
h B
reak
Cat
egor
ies
5, 7
, 8, 1
3
12/8
(Fri)
12/6
(Wed
)12
/7 (T
hu)
12/5
(Tue
)
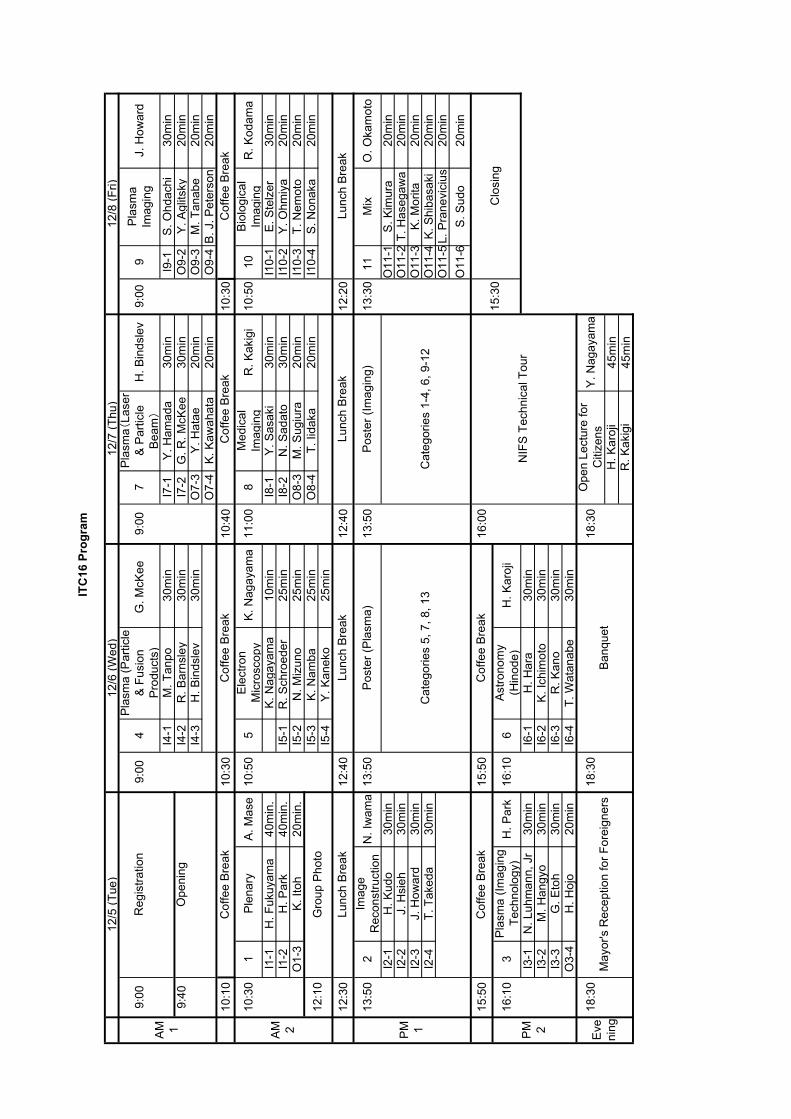
ITC
16 P
rogr
am
PM 2PM 1AM 2AM 1
Reg
istra
tion
Ope
ning
Cof
fee
Bre
ak
Lunc
h B
reak
Pos
ter (
Pla
sma)
May
or's
Rec
eptio
n fo
r For
eign
ers
Ban
quet
Cof
fee
Bre
ak
12:1
0G
roup
Pho
to
Clo
sing
15:3
0
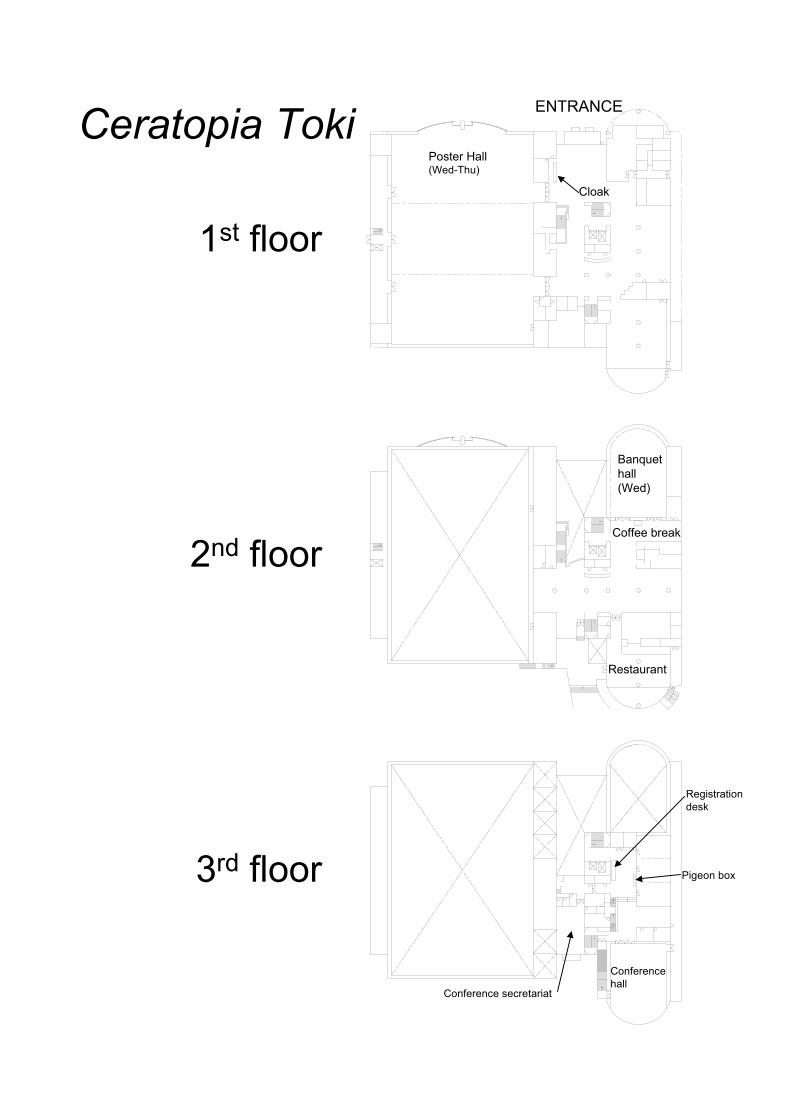
Poster Hall(Wed-Thu)
Cloak
ENTRANCE
Banquethall(Wed)
Coffee break
Restaurant
Conferencehall
Registrationdesk
Pigeon box
Conference secretariat
1st floor
2nd floor
3rd floor
Ceratopia Toki

Conference Program
DECEMBER 5, 2006 Tuesday09:00-09:40 Registration <2, 3rd Floor>
09:40-10:10 Opening <3rd Floor>-Coffee Break-
Plenary Session <3rd Floor>Chair: A. Mase
10:30-11:10 I1-1 H. Fukuyama Diffusion MRI
11:10-11:50 I1-2 H. Park
11:50-12:10 O1-3 K. Itoh On Imaging of Plasma Turbulence
-Group Photo--Lunch Break-
Oral Session Image Reconstruction <3rd Floor>Char: N. Iwama
13:50-14:20 I2-1 H. Kudo
14:20-14:50 I2-2 J. Hsieh
14:50-1520 I2-3 J. Howard
15:20-15:50 I2-4 T. Takeda
-Coffee Break-
Oral Session Plasma(Imaging Technology) <3rd Floor>Chair:H. Park
16:10-16:40 I3-1 N. Luhmann, Jr
16:40-17:10 I3-2 M. Hangyo
Study of the Complex Physics of the MagneticReconnection Process in High Temperature Plasmasusing a High Resolution Microwave Imaging System.
A Comprehensible Review on Analytical ImageReconstruction Methods for Tomography
Present and Future of Computed TomographyTechnology
Ionospheric Tomography by Neural NetworkCollocation Method
Optical coherence imaging for high resolution plasmaspectroscopy
Advanced Microwave/Millimeter-Wave ImagingTechnology
Spectroscopy and Imaging by Laser Excited TerahertzWaves

17:10-17:40 I3-3 G. Etoh
17:40-18:00 O3-4 H. Hojo
18:30-20:30 Mayor's Reception for Foreign Participants
DECEMBER 6, 2006 Wednesday
Oral Session Plasma(Particle & Fusion Products) <3rd Floor>Chair: G. McKee
9:00-9:30 I4-1 M. Tanpo
9:30-10:00 I4-2 R. Bamsley
10:00-10:30 I4-3 H. Bindslev
-Coffee Break-
Oral Session Electron Microscopy <3rd Floor>Chair: K. Nagayama
10:50-11:00 K. Nagayama Introduction
11:00-11:25 I5-1 R. Schroeder
11:25-11:50 I5-2 N.Mizuno
11:50-12:15 I5-3 K. Namba
12:15-12:40 I5-4 Y. Kaneko
-Lunch Break-
Poster Session I (Plasma) <1st Floor>
Evolution of Ultra-High-Speed CCD Imagers
Simulation Studies on Advanced MicrowaveDiagnostics and Related Technology
Optimizing Phase Contrast in TEM by the use of anelectrostatic Boersch Phase Plate
Molecular Mechanisms of Swimming and Tumbling inBacterial Motility
Cryo-EM study of dynein-microtubule interaction
The diagnosis of fast ions in fusion plasmas by means ofcollective Thomson scattering (CTS)
Visualization of in vivo macromolecules in iceembedded whole cyanobacterial cells by Hilbertdifferential contrast transmission electron microscopy.
High density plasma probing with pulse proton beamsgenerated in ultra-intense laser plasma interactions
Advanced imaging applications on ITER

P5-01~P5-20, P7-01~P7-19, P8-01~P8-32, P13-1~P13-7
-Coffee Break-
Oral Session Astronomy(Hinode) <3rd Floor>Chair: H. Karoji
16:10-16:40 I6-1 H. Hara
16:40-17:10 I6-2 K. Ichimoto
17:10-17:40 I6-3 R. Kano
17:40-18:10 I6-4 T. Watanabe
18:30-20:30 Banquet <2nd Floor>
DECEMBER 7, 2006 Thursday
Oral Session Plasma(Laser & Particle Beam) <3rd Floor>Chair: H. Bindslev
9:00-9:30 I7-1 Y. Hamada
9:30-10:00 I7-2 G. R. McKee
10:00-10:20 O7-3 Y. Hatae
10:20-10:40 O7-4 K. Kawahata
-Coffee Break-
Oral Session Medical Imaging <3rd Floor>Chair: R. Kakigi
Heavy Ion Beam Probe, Present status and futuredevelopment
Plasma Turbulence Imaging via Beam EmissionSpectroscopy on the DIII-D Tokamak
Development of Polarization Interferometer Based onFourier Transform Spectroscopy for ThomsonScattering Diagnostics
Hinode; A New Solar Observatory in Space - CurrentStatus -
Three-Dimensional Magnetic Structures of SolarPhotosphere and Chromosphere
Multiplicity of Solar X-Ray Corona in Time and Space
Emission Line Imaging Spectroscopy for Diagnosing ofSolar Outer Atmospheres
Advanced Laser Diagnostics for Electron DensityMeasurements.

11:00-11:30 I8-1 Y. Sasaki
11:30-12:00 I8-2 N. Sadato
12:00-12:20 O8-3 M. Sugiura
12:20-12:40 O8-4 I. Iidaka
-Lunch Break-
Poster Session II (Imaging) <1st Floor>
P1-01~P4-03, P6-01~P6-39, P9-01~P12-6
-Coffee Break-
16:00-18:00 Technical Tour To NIFS
18:30-20:30 Open Lectures to Citizens
DECEMBER 8, 2006 Friday
Oral Session Plasma(Plasma Imaging) <3rd Floor>Chair: J. Howard
9:00-9:30 I9-1 S. Ohdachi
9:30-9:50 O9-2 Y. Aglitskiy
9:50-10:10 O9-3 M. Tanabe
10:10-10:30 O9-4 B. J. Peterson
-Coffee Break-
Oral Session Biological Imaging <3rd Floor>Chair: R. Kodama
Neuroimaging Study of the Human Amygdala-Towardan Understanding of Emotional and Stress Responses-
MRI technologies in recent human brain mapping
Cross-modal integration and plasticity revealed byfunctional magnetic resonance imaging
Cortical Networks for Visual Self-Recognition
Tangential SX imaging for visualization of fluctuationsin toroidal plasmas
Monochromatic x-ray imaging and spectroscopy withspatial resolution for ICF experiments
X-ray spectroscopic diagnostics for laser-imploded coreplasmas with high spatial and temporal resolutions
Research and Development of Imaging Bolometers
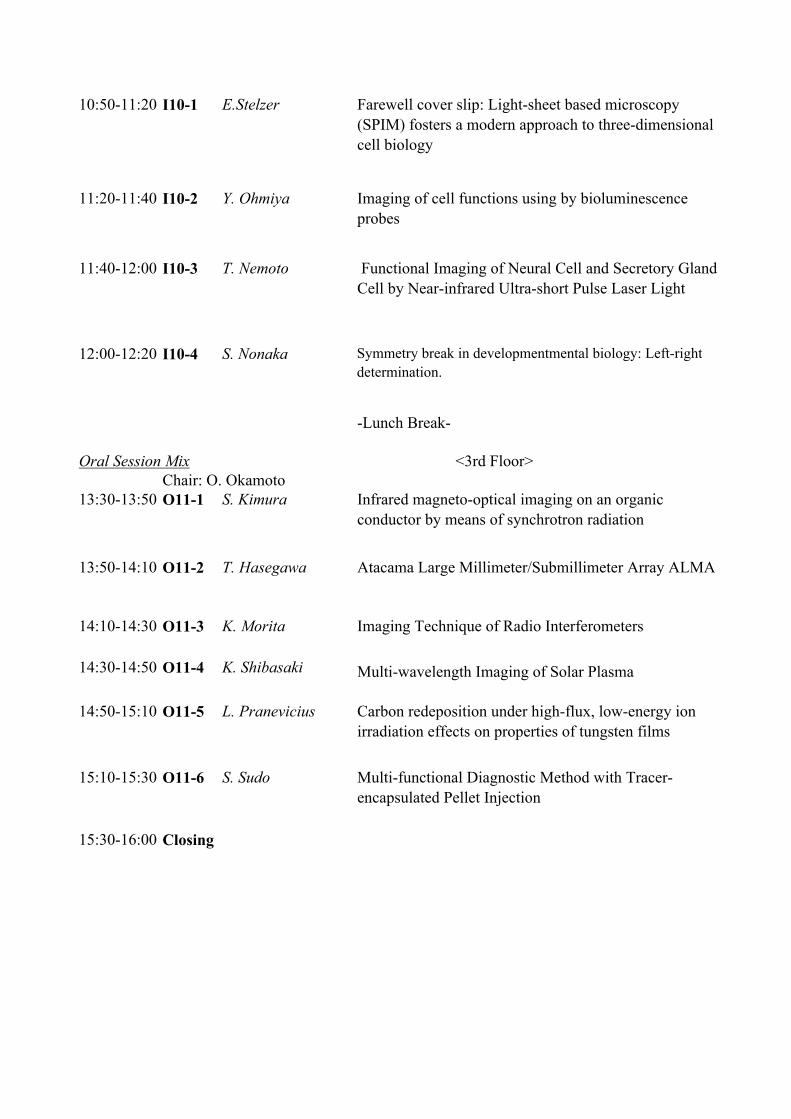
10:50-11:20 I10-1 E.Stelzer
11:20-11:40 I10-2 Y. Ohmiya
11:40-12:00 I10-3 T. Nemoto
12:00-12:20 I10-4 S. Nonaka
-Lunch Break-
Oral Session Mix <3rd Floor>Chair: O. Okamoto
13:30-13:50 O11-1 S. Kimura
13:50-14:10 O11-2 T. Hasegawa
14:10-14:30 O11-3 K. Morita
14:30-14:50 O11-4 K. Shibasaki Multi-wavelength Imaging of Solar Plasma
14:50-15:10 O11-5 L. Pranevicius
15:10-15:30 O11-6 S. Sudo
15:30-16:00 Closing
Infrared magneto-optical imaging on an organicconductor by means of synchrotron radiation
Imaging Technique of Radio Interferometers
Multi-functional Diagnostic Method with Tracer-encapsulated Pellet Injection
Carbon redeposition under high-flux, low-energy ionirradiation effects on properties of tungsten films
Atacama Large Millimeter/Submillimeter Array ALMA
Symmetry break in developmentmental biology: Left-rightdetermination.
Imaging of cell functions using by bioluminescenceprobes
Functional Imaging of Neural Cell and Secretory GlandCell by Near-infrared Ultra-short Pulse Laser Light
Farewell cover slip: Light-sheet based microscopy(SPIM) fosters a modern approach to three-dimensionalcell biology

Poster Session 1 – Plasma (Categories 5, 7, 8)
P5-01 Electron Temperature Measurement And Study Of Istabilities And Sawtooth Behavior In IR-T1 Toka-mak By E.C.E DiagnosticReza Shariatzadeh, Plasma Physics Reaserch Center,Islamic Azad University
P5-02 Effects of relativistic and absorption on ECE spectra in high temperature tokamak plasmaMasayasu Sato , Japan Atomic Energy Agency,Naka Fusion Institute
P5-03 Suprathermal electron distribution diagnostic for SST-1 tokamakSurya Kumar Pathak, Institute for Plasma Research
P5-04 Protection Filters in ECEI Systems for Plasma DiagnosticsLuhmann,jr. C. Neville, University of California, Davis, US
P5-05 Imaging meso-scale structures in TEXTORRoger Jaspers, FOM institute of Plasma Physics Rijnhuizen
P5-06 Development of ECE Imaging System on LHDYuichiro Kogi, Art,Science and Technology Center for Cooperative Reserch, Kyushu University
P5-07 Improvements of CO2 laser heterodyne imaging interferometer for density profile measurements onLHDKenji Tanaka, National Institute for Fusion Science
P5-08 Two dimensional phase contrast imaging of micro-turbulence in LHDClive Alvin Michael, National Institute for Fusion Science
P5-09 Instrumental capabilities and limitations of two-dimensional phase contrast imaging on LHDLeonid Nikolaevich Vyacheslavov, Budker Institute for Nuclear Physics
P5-10 Electron Density Measurement by Using a Multi-Channel Interferometer System in the Tandem MirrorGAMMA 10Masayuki Yoshikawa, University of Tsukuba
P5-11 Reflectometry for Density Fluctuation and Profile Measurements in TST-2Takuma Yamada, Research Institute for Applied Mechanics, Kyushu University
P5-12 Microwave Imaging Reflectometry in LHDSoichiro Yamaguchi, National Institute for Fusion Science
P5-13 Multi-channel Microwave Reflectometer with Fermi Antenna ReceiversKunihiko Hattori, Department of Electrical Engineering, Graduate School of Engineering, Tohoku Uni-versity
P5-14 Design of the 48, 57µ m Poloidal Polarimeter for ITERRostyslav Pavlichenko, National Institute for Fusion Science
P5-15 Weakly Relativistic K-band Oversized Backward Wave Oscillator with Bragg Reflector at Input End ofSlow Wave StructureKazuo Ogura, Graduate School of Science and Technology, Niigata University
P5-16 Advanced Fabrication Method of Planar Components for Plasma DiagnosticsNaoki Ito, Art, Science and Technology Center for Cooperative Research, Kyushu University, Japan
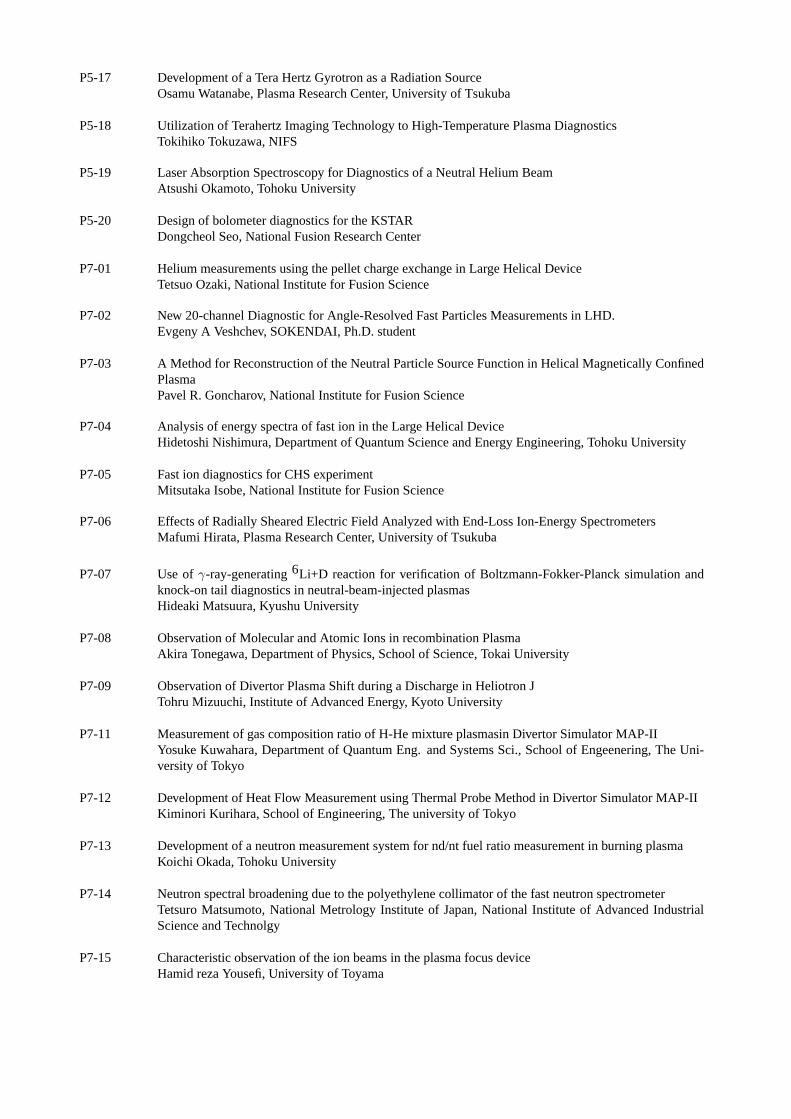
P5-17 Development of a Tera Hertz Gyrotron as a Radiation SourceOsamu Watanabe, Plasma Research Center, University of Tsukuba
P5-18 Utilization of Terahertz Imaging Technology to High-Temperature Plasma DiagnosticsTokihiko Tokuzawa, NIFS
P5-19 Laser Absorption Spectroscopy for Diagnostics of a Neutral Helium BeamAtsushi Okamoto, Tohoku University
P5-20 Design of bolometer diagnostics for the KSTARDongcheol Seo, National Fusion Research Center
P7-01 Helium measurements using the pellet charge exchange in Large Helical DeviceTetsuo Ozaki, National Institute for Fusion Science
P7-02 New 20-channel Diagnostic for Angle-Resolved Fast Particles Measurements in LHD.Evgeny A Veshchev, SOKENDAI, Ph.D. student
P7-03 A Method for Reconstruction of the Neutral Particle Source Function in Helical Magnetically ConfinedPlasmaPavel R. Goncharov, National Institute for Fusion Science
P7-04 Analysis of energy spectra of fast ion in the Large Helical DeviceHidetoshi Nishimura, Department of Quantum Science and Energy Engineering, Tohoku University
P7-05 Fast ion diagnostics for CHS experimentMitsutaka Isobe, National Institute for Fusion Science
P7-06 Effects of Radially Sheared Electric Field Analyzed with End-Loss Ion-Energy SpectrometersMafumi Hirata, Plasma Research Center, University of Tsukuba
P7-07 Use ofγ-ray-generating6Li+D reaction for verification of Boltzmann-Fokker-Planck simulation andknock-on tail diagnostics in neutral-beam-injected plasmasHideaki Matsuura, Kyushu University
P7-08 Observation of Molecular and Atomic Ions in recombination PlasmaAkira Tonegawa, Department of Physics, School of Science, Tokai University
P7-09 Observation of Divertor Plasma Shift during a Discharge in Heliotron JTohru Mizuuchi, Institute of Advanced Energy, Kyoto University
P7-11 Measurement of gas composition ratio of H-He mixture plasmasin Divertor Simulator MAP-IIYosuke Kuwahara, Department of Quantum Eng. and Systems Sci., School of Engeenering, The Uni-versity of Tokyo
P7-12 Development of Heat Flow Measurement using Thermal Probe Method in Divertor Simulator MAP-IIKiminori Kurihara, School of Engineering, The university of Tokyo
P7-13 Development of a neutron measurement system for nd/nt fuel ratio measurement in burning plasmaKoichi Okada, Tohoku University
P7-14 Neutron spectral broadening due to the polyethylene collimator of the fast neutron spectrometerTetsuro Matsumoto, National Metrology Institute of Japan, National Institute of Advanced IndustrialScience and Technolgy
P7-15 Characteristic observation of the ion beams in the plasma focus deviceHamid reza Yousefi, University of Toyama

P7-16 Development of a Simple and Tough Alpha-particle Detector Used at High TemperatureToshiyuki Iida, Osaka University
P7-17 Effects of ion orbits due to potential formation on transverse ion transport in thethermal barrier regionof GAMMA10Hiroshi Saimaru, Plasma Research Center, University of Tsukuba
P7-18 The Neutral Transport Analysis Based on Visible Light Measurement of Recycling and 3-dimensionalSimulation in GAMMA 10Yuta Higashizono, Plasma Research Center, University of Tsukuba
P7-19 Calculation of Fusion Condition of Hydrogen-Boron by I.C.F MethodBabak Malekyneia, Plasma Physics Research Center, Islamic Azad University
P8-01 Sheath Structure around Negatively Biased Probe in Electronegative PlasmaHiroto Matsuura, Osaka Prefecture University
P8-02 Electron Energy Distribution Functions in a Low Pressure Inductively Coupled CH4/H2 PlasmaKatsuyuki Okada, National Institute for Materials Science
P8-04 Advanced Probe Measurement System in TU-HeliacYutaka Tanaka, Department of Quantum Science and Energy Engineering, Tohoku University
P8-05 Mach Probe Measurements of Detached Plasmas in a Linear Plasma DeviceNaomichi Ezumi, Nagano National College of Technology
P8-06 Measurement of Electron Density and Temperature and Their Fluctuations Using a Triple LangmuirProbe Grounded through Finite ResistanceMasaki Takeuchi, Department of Energy Engineering and Science, Nagoya University
P8-07 Calibration of Fast Ion Flux Measured by a Directional ProbeKenichi Nagaoka, National Institute for Fusion Science
P8-08 Probing of toroidal electron plasmas confined in CHS magnetic surfacesYoshiaki Yamamoto, Kyoto Institute of Technology, Department of Electronics
P8-09 Technique of MHD mode analysis using magnetic measurements in heliotron plasmasSatoru Sakakibara, National Institute for Fusion Science
P8-10 Magnetic Diagnostics of Magnetic Island in LHDYoshiro Narushima, National Institute for Fusion Science (NIFS)
P8-11 Current Profile Dependence of CCS Method to Reproduce Spherical Tokamak Plasma ShapeWang Feng, AEES, Kyushu University
P8-12 Two-dimensional edge density measurements in the Large Helical DeviceHayato Tsuchiya, Graduate University for Advanced Studies
P8-13 Measurement of 3-D Mode Structure of the Edge Harmonic Oscillations in CHSusing Beam EmissionSpectroscopyTetsutarou Oishi, National Institute for Fusion Science
P8-14 Potential measurement with 6 MeV Heavy Ion Beam Probe on LHDAkihiro Shimizu, NIFS
P8-15 Estimate of ionization cross sections for a heavy ion beam probeMasaki Nishiura, National Instiute for Fusion Science

P8-17 Structure of sample volumes of the heavy ion beam probe in LHDTakeshi Ido, National Institute for Fusion Science
P8-18 Observation of the effects of radially sheared electric fields by the use of a gold neutral beam probeYoshiaki Miyata, Plasma Research Center, University of Tsukuba
P8-19 Beam Probe Imaging Method for Edge Plasma Modeling in CHSHarukazu Iguchi, National Institute for Fusion Science
P8-20 Two dimensional Li beam imaging to study the magnetic field configuration effects on plasma confine-ment in spherical tokamak CPDRajendraprasad Bhattacharyay, Interdisciplinary Graduate School of Engineering Science, Kyushu Uni-versity
P8-21 Numerical Simulation of a High-Brightness Lithium Ion gun for a Zeeman Polarimetry on JT-60UAtsushi Kojima, Japan Atomic Energy Agency
P8-22 Proof of principle experiment of a fast He0 beam production for alpha particle diagnosticsNozomi Tanaka, Tohoku University, Department of Quantum Science and Energy Engineering
P8-23 Raman and Rayleigh Calibrations of the LHD YAG Thomson ScatteringYamada Ichihiro, National Institute for Fusion Science
P8-24 Improving the Thomson Scattering Diagnostic installed on the Large Helical DeviceKazumichi Narihara, National Institute for Fusion Science
P8-25 Development of 2-D Thomson Scattering Measurement Using Multiple Reflection and the Time-of-Flight of Laser LightTakashi Sumikawa, The University of Tokyo
P8-26 Laser scattering measurement of the electron density fluctuations in CHSYoshifumi Azuma, Tokyo Institute of Technology
P8-27 Laser Thomson Scattering Measurements in Helium Recombining Plasmas in Divertor/Edge SimulatorMAP-II and its Comparison with SpectroscopyFilippo Scotti, The University of Tokyo
P8-28 Collective Thomson scattering for alpha-particle diagnostic in burning plasmasTakashi Kondoh, Japan Atomic Energy Agency
P8-29 Sensitivity study for the optimization of the viewing chord arrangement of the ITER poloidal polarimeterTaiki Yamaguchi, Japan Atomic Energy Agency
P8-30 Bench testing of polarimeter with Si photo elastic modulator for short wavelength FIR laserTsuyoshi Akiyama, National Institute for Fusion Science
P8-31 Development of Short Wavelength Far-Infrared Lasers and Optical Elements for Plasma DiagnosticsKazuya Nakayama, Chubu University
P8-32 Effect of pressure and magnetic field on parameters of plasma in a DC cylindrical magnetron sputteringdeviceKiomars Yasserian, Plasma Physics Research center, Science and Research Branch,Islamic Azad Uni-versity
P13-01 Electron Energy Distribution Functions in a Low Pressure Inductively Coupled CH4/H2 PlasmaKatsuyuki Okada, National Institute for Materials Science
P13-02 ECR heating and ECE diagnostic in W7-X stellarator: ray tracing simulations of non-thermal effectsNikolai B. Marushchenko, Max-Planck-Institut fuer Plasma Physik, EURATOM Association

P13-03 Carbon redeposition under high-flux, low-energy ion irradiation effects on properties of tungsten filmsLiudvikas Pranevicius, Vytautas Magnus University, Lithuania
P13-04 An exact linear dispersion relation for CRM instabilityKazuo Minami, Faculty of Engineering, Tokyo Denki University
P13-05 Mapping of flux quantities in the high beta heliotron plasmasKiyomasa Y. Watanabe, National Inststitute for Fusion Science
P13-06 Development of the Web Interface for FIT ProgramMasahiko Emoto, NIFS
P13-07a Physics of Radiative Collapse in the Large Helical DeviceYuri Igitkhanov, Max-Planck-Institut fuer Plasmaphysik, IPP-EURATOM Ass.
P13-07b Impurity Transport Studies on LHDYuri igitkhanov, Max-Planck-Institut fuer Plasmaphysik, IPP-EURATOM Ass.
P13-07c Stellarator Impurity STRAHL Code Development in NIFSYuri igitkhanov, Max-Planck-Institut fuer Plasmaphysik, IPP-EURATOM Ass.

Poster Session 2 – Imaging (Categories 1-4, 6, 9-13)
P1-01 Somato-motor inhibitory processing in humans: a study with MEG and ERPHiroki Nakata, National Institute for Physiological Sciences
P1-02 Somatosensory mismatch responses using oddball paradigm; an MEG studyKosuke Akatsuka, National Institute for Physiological Sciences
P1-03 Imaging mass spectrometry revealed abnormal distribution of phospholipids in colon cancer liver metas-tasisTakahiro Hayasaka, Okazaki Institute for Integrative Bioscience
P2-01 Constrained Electron Beam Tomography for Identifying 3-Dimensional Movements and TwistingMechanizm of Sperm Flagella of the Stag Beetle(PROSOPOCOILUS INCLINATES)Masaru Irie, Waseda University
P2-02 Developments of split reporter proteins for biomolecular imagingMasaki Takeuchi, Department of Molecular Structure, Institute for Molecular Science
P2-03 Direct Observation of Intracellular Materials Using a Phase Contrast Transmission Electron Microscope(TEM).Koji Nitta, National Institutes of Natural Sciences, Okazaki Institute for Integrative Biosciences
P2-04 Structural Analysis of Non-Selective Cation Channel TRPV4 using a Phase-Contrast Transmission Elec-tron MicroscopeHideki Shigematsu, National Institutes of Natural Sciences
P4-01 Imaging of tungsten impurity ejected from damaged material due to transient heat loadShin Kajita, Nagoya University
P4-02 Near-field optical imaging of electric field and wavefunctions in metal nanoparticlesHiromi Okamoto, Institute for Molecular Science
P4-03 Supported phospholipid bilayer membranes on SiO2 and TiO2 surfacesRyugo Tero, Institute for Molecular Science
P6-01 Charge transfer in collisions of proton with CH3 moleculesHida Ken-nosuke, Foundation for Promotion of Material Science and Technology of Japan
P6-02 Fulcher-α spectra in the mixed hydrogen isotope plasmaTaiichi Shikama, School of Engineering, The University of Tokyo
P6-03 Analyses of visible images of the plasma periphery observed with tangentially viewing CCD camerasin the Large Helical DeviceMamoru Shoji, National Institute for Fusion Science
P6-04 A new Doppler shift spectroscopy for the measurement of neutral beam profileYuejiang Shi, Institute of Plasma Physics,Chinese Academy of Sciences
P6-05 Observation of Hydrogen and Cesium Spectra in a Negative Ion Source for a Neutral Beam Injectorusing a Multi-channel SpectrometerKatsunori Ikeda, National Institute for Fusion Science
P6-06 A Multi-reflection Type Visible-laser Interferometer for High Density Plasma MeasurementsKunihiko Hattori, Department of Electrical Engineering, Graduate School of Engineering, Tohoku Uni-versity

P6-07 Development of real-time measurement system of charge exchange recombination spectroscopy and itsapplication to feedback control of ion temperature gradient in JT-60UShinji Kobayashi, Institute of Advanced Energy, Kyoto University
P6-08 Temperature Diagnostics for Field-Reversed Configuration Plasmas on the Pulsed High Density (PHD)ExperimentHiroshi Gota, Plasma Dynamics Laboratory, University of Washington
P6-09 A simultaneous spectroscopic measurement for the global and edge fine structures of the ion temperatureand plasma rotation profiles in the Compact Helical SystemShin Nishimura, National Institute for Fusion Science
P6-10 Simultaneous Measurement of Proton Ratio and Beam Divergence of Positive-ion-based Neutral Beamin the Large Helical DeviceKenichi Nagaoka, National Institute for Fusion Science
P6-11 Infrared Imaging Video Bolometer with a Double Layer Absorbing FoilIgor Vitalevich Miroshnikov, Saint-Petersburg State Polytechnical University, Plasma Physics Depart-ment
P6-12 Two-dimensional measurement of inward neutral flux in LHDMotoshi Goto, National Institute for Fusion Science
P6-13 Design of Impurity Influx Monitor (Divertor) for ITERHiroaki Ogawa, Japan Atomic Energy Agency
P6-14 2-d image diagnostic technique for edge turbulence using fast camerasNobuhiro Nishino, Hiroshima University
P6-15 Two-dimensional measurement of plasma dynamics with an ICCD fast camera based on HeI line inten-sity ratio methodYamamoto Norimasa, EcoTopia Science Institute, Nagoya University
P6-16 High-speed visible imaging of central-cell plasmas in the GAMMA 10 tandem mirrorYousuke Nakashima, Plasma Research Center, University of Tsukuba
P6-17 Behavior of Hydrogen Fueled by Pellet Injection in the GAMMA 10 Tandem MirrorYuusuke Kubota, Plasma Research Center, University of Tsukuba
P6-18 Measurements of Oxygen Ion Spectra for Estimation of Electric Field Profiles in Cylindrical PlasmasTakayuki Kobayashi, Plasma Research Center, University of Tsukuba
P6-19 Study of Edge Plasma Characteristics at H-mode Transition in Heliotron JShinya Watanabe, graduate school of energy science, Kyoto university
P6-20 Spectroscopic measurements of emission spectra by using multi-channel UV/visible impurity monitorKen Matama, Plasma Research Center, University of Tsukuba
P6-21 Line analysis of EUV spectra from molybdenum and tungsten injected in LHDMalay Bikas Chowdhuri, Graduate University for Advanced studies
P6-22 Fast XUV 16× 16 array hybrid module for plasma imaging applicationsAndrey Alekseev, Troitsk Institutre for Innovation and Fusion Research
P6-23 Comparison of Three Types of Impurity Diagnostics on Reheat Mode Discharges in the Compact HelicalSystemChihiro Suzuki, National Institute for Fusion Science

P6-24 Improvement of AXUV bolometric measurement system at a semi-tangential cross-section in LHDNaoki Tamura, National Institute for Fusion Science
P6-25 Spectroscopic Study of Plasma Flow Generated by Magnetoplasma Compessor with Transparent Elec-trodesJagos Puric, Faculty of Physics University of Belgrade
P6-26 Application of a soft-X ray imaging system to the STE-2 RFPOnchi Takumi, Kyoto Institute of Technology
P6-27 Development of a soft-X ray imaging system for MHD studies in an RFP plasmaAkio Sanpei, Kyoto Institute of Technology
P6-28 Soft X-ray measurement in IRE on the TST-2 tokamakKeisuke Sasaki, Graduate School of Engineering Sciences, Kyushu Univ.
P6-29 Soft X-ray emission profile and mode structure during MHD events in the TST-2 spherical tokamakHiroshi Hiroshi tojo, Graduate School of Frontier Sciences, The University of Tokyo
P6-30 Soft and Ultra-Soft X-ray Detector Array Systems for Measurement of Edge MHD Modes in the LargeHelical DeviceFumitake Watanabe, Department of Energy Engineering and Science, Nagoya University
P6-31 Runaway Electrons as a Diagnostic of Plasma Internal Magnetic FluctuationsYongzhen Zheng, Southwestern Institute of Physics,
P6-32 The Investigation of Major Disruption Based on Plasma Current Beat-wave Excitation in IR-T1 Toka-makMasoud Rezvani, Plasma physics research center,islamic azad university
P6-33 Development of a High Resolution X-Ray Imaging Crystal Spectrometer for Measurement of Ion-Temperature and Rotation-Velocity Profiles in Fusion Energy Research Plasmas*
Kenneth Wayne Hill, Princeton University Plasma Physics Laboratory
P6-34 Measurements of iron K lines using a wide band and compact X-ray crystal spectrometer in LHDIkuya Sakurai, EcoTopia Science Institute, Nagoya University
P6-35 Transport study of medium-Z impurities by means of X-ray Pulse-Height Analyzer in LHDSadatsugu Muto, National Institute for Fusion Science
P6-36 Development of advanced X-ray Imaging Crystal Spectrometer utilizing a large-area proportional countfor KSTARSang gon Lee, National Fusion Research Center
P6-37 Investigation of a novel X-ray tube for the calibration of the X-ray crystal spectrometer in the KSTARmachineJun-gyo Bak, National Fusion Reserach Center
P6-38 A hard x-ray tomography system for the MST Reversed Field PinchRob Oconnell, University of Wisconsin – Madison
P6-39 Current profile estimation in full LHCD plasmas using Hard X-ray measurement along the top andbottom identical line of sight on TRIAM-1MKazuaki Hanada, Research Institute for Applied MEchanics
P9-01 Measurement on spatial distribution of visible line spectra in LHDHisamichi Yamazaki, Department of Fusion Science, School of Physical Science, Graduate Universityfor Advanced Studies
P9-02 Spatial variation of the foil parameters from in situ calibration of the JT-60U imaging bolometer foilHomaira Parchamy, National Institute for Fusion Science
P9-03 Tracking and Visualization of Sharp Interfaces in a Three-dimensional Plasma SimulationsCaesar Ondlan Harahap, The Graduate University for Advanced Studies
P9-04 Nonstop Lose-less Data Acquisition and Storing Method for Plasma Motion ImagesHideya Nakanishi, National Institute for Fusion Science
P9-05 Acquisition of Data for Plasma Simulation by Automated Extraction of Terminology from Article Ab-stractsLukas Pichl, International Christian University
P10-01 2D tomographic imaging of the edge turbulence in RFX-modGianluigi Serianni, Consorzio RFX, Associazione EURATOM-ENEA sulla fusione
P10-02 Tomographic reconstruction of emissivity profile from tangentially viewed images using pixel methodSantanu Banerjee, Institute for Plasma Research
P10-03 Two-dimensional Spectroscopic Measurement of Deuterium Emission in JT-60U Detached DivertorPlasmasFujimoto Kayoko, Japan Atomic Energy Agency
P10-04 Soft x-ray tomography in fusion plasmas: the Reversed Field Pinch casePaolo Franz, Consorzio RFX
P10-05 Tomographic reconstruction of internal instability in a field-reversed configurationTomohiro Kiguchi, College of Science and Technology, Nihon University, Tokyo, Japan
P10-06 Quantitative evaluation of tomographic resolution by coded penumbral imagingShinya Nozaki, Information and Communication Systems Engineering, Okinawa National College ofTechnology
P10-07 Application of Tomographic imaging to multi-pixel bolometric measurementsYi Liu, National Institute for Fusion Science
P10-08 Spherical Harmonics Decomposition in 3-D Vector TomographyAlexander Leonidovich Balandin, Institute of System Dynamics and Control Theory of RussianAcademy of Sciences
P10-09 Single Particle Analysis of Image Data Acquired by Zernike Phase Contrast Transmission ElectronMicroscopeRadostin Stoyanov Danev, Okazak Institute for Integrative Bioscience, National Institutes of NaturalSciences (NINS)
P11-01 Neutron Radiographic Imaging of Irradiated Fission-, Spallation- and Fusion-MaterialsMasayoshi Tamaki, Graduate School of Engineering, Nagoya University
P11-02 Application of the Liquid-crystal-based tunable Lyot filter to the Optical Emission Imaging PlasmaSpectrometryShinichiro Kado, High Temperature Plasma Center, The University of Tokyo
P11-03 Development of the monitoring system of plasma behavior using a CCD camera in the GAMMA 10tandem mirrorHirokazu Kawano, Plasma Research Center, University of Tsukuba
P11-04 Development of phosphor screen having ”gridded energy analyzer” for two- fluid nonneutral plasmaexperimentsKohei Morita, Kyoto Institute of Technology, Department of Electronics

P12-01 Imaging challenges in long pulse nuclear fusion experimentsRalf Koenig, Max-Planck-Institute for Plasma Physics
P12-02 Observation of toroidal asymmetric radiation in the Large Helical DeviceNaoko Ashikawa, National Institute for Fusion Science
P12-03 Effects of face contour and features on occipitotemporal activity when viewing eye movementKensaku Miki, Department of Integrative Physiology, National Institute for Physiological Sciences
P12-04 Neural mechanism for processing of biological motion perception: An event-related potential studyMasahiro Hirai, Department of Integrative Physiology, National Institute for Physiological Science
P12-05 Centrifugal regulation of human cortical responses to a task-relevant somatosensory signal triggeringvoluntary movement: An MEG study.Tetsuo Kida, Department of Integrative Physiology, National institute for Physiological Sciences
P12-06 The magnetoencephalographic neural activity related to the perception of apparent motion defined byvarious cuesEmi Tanaka, National Institute for Physiological Science


Plenary / Invited / Oral sessions


I1-1
Diffusion MRI
H.Fukuyama
Human Brain Research Center, Kyoto University Graduate School of Medicine, 54 Shogoin Kawahara-cho, Sakyo-ku, Kyoto 606-8507, Japan
MRI has made a great impact on the imaging research as well as clinical practice since its introduction. The most significant feature of MRI is the ability to obtain the image itself and the chemical or physical characteristics of the tissues. It depends upon the imaging sequences for MRI. In clinical situations, T1 and T2 weighted images as well as MR angiography is the standard sequences, and T2* EPI is utilized in functional MRI to investigate the cognitive neurosciences, which have a great success in the localizations and connections of various brain areas in the living human brain. Diffusion is the phenomena of random motion (Brawnian motion). In order to visualize this phenomena by MRI, diffusion sequence was made by Denis Le Bihan, who had been working with us for one year and found the usefulness in functional brain imaging. Diffusion weighted images (DWI) were obtained routinely in the clinical examination for stroke patients to detect the very early phase of ischemic lesions in 1990s. This is a very sensitive image to find out the ischemic lesion as early as 30 min after ictus. DWI is also able to detect abnormalities in the cerebral cortex of Creitzfeldt-Jacob disease very specifically. The most significant impact by DWI on neuroscience is the tracing of nerve fibers in the humanbrain. This is plausible on the fact that the fine water movement occurs through the nerve fibers asaxonal flow. We can make the tracing images so-called “tractography” by using the data obtainedby DWI, calculating the value of tensor in each voxels. On this images, we can see the fiberconnections, such as optic radiation, pyramidal tract etc. We recently found DWI as a tool of functional imaging. In 2002, Le Bihan reported the signal changes of the visual cortex in DWI by visual stimulation. Collaborating with him, we could find the more accurate signal changes in the visual cortex by photic stimulation, and compared the signal change data with BOLD signal, suggesting that DWI showed the more prompt response to visual stimuli than BOLD, therefore, we assume that diffusion functional MRI will be more fruitful if we can get the good signal to noise ratio.
References
Le Bihan D, Urayama S, Aso T, Hanakawa T, Fukuyama H: Proc Natl Acad Sci U S A. 2006;103:8263-8268. Direct and fast detection of neuronal activation in the human brain with diffusion MRI.
I1-2
Study of the Complex Physics of the Magnetic Reconnection Process in High Temperature Plasmas using a High Resolution Microwave Imaging System.
H. Park1),C.W. Domier2),A.J.H. Donné3), N.C. Luhmann,jr.2), T. Munsat4), M.J. van de Pol3) and TEXTOR Team5)
(1)Princeton Plasma Physics Laboratory, Princeton, New Jersey, U.S.A (2)University of California at Davis, California, U.S.A.
(3)FOM-Institute for Plasma Physics Rijnhuizen*, Association EURATOM-FOM, P.O. Box 1207, 3430 BE Nieuwegein, The Netherlands
(4)University of Colorado at Boulder, Colorado, U.S.A. (5)Forschungszentrum Jülich GmbH*, Institut für Plasmaphysik, Association EURATOM-FZJ,
D-52425 Jülich, Germany *partners in the Trilateral Euregio Cluster
High resolution (temporal and spatial) 2-D images of electron temperature fluctuations measured by a microwave imaging system [1] based on Electron Cyclotron Emission were employed to unfold unresolved physics phenomena such as the magnetic reconnection process and local heat transport of the fundamental Magneto-Hydro-Dynamic (MHD) instability (sawtooth oscillation; m=1 mode) in tokamak plasmas. Verification of theoretical models for the common phenomenology is greatly benefitial to the broader areas such as astro and solar physics. Up to now, the physics models for this problem are too complex to decipher the underlying physics with the conventional diagnostic tools. The experimentally measured 2-D images are directly compared to the expected 2-D patterns of the plasma pressure (or electron temperature) from prominent theoretical models developed for the m=1 mode (sawtooth oscillation) over the last three decades [2,3]. They are full reconnection, quasi-interchange, and ballooning mode models. These images were able to demonstrate that none of these models are fully consistent with the experimental observation and have provided a detailed process of the local magetic reconnection during the sawtooth crash.
References
[1] H. Park, et al., Rev. Sci. Instrum. 75, 3787 (2004) [2] H. Park, et al., Phys. Rev. Lett. 96, 195003 (2006) [3] H. Park, et al., Phys. Rev. Lett. 96, 195004 (2006)
This work is supported by the US DOE contract Nos. DE-AC02-76-CH0-3073, DE-FG03-95ER-54295 and W-7405-ENG-48 and NWO and EURATOM.

O1-3
On Imaging of Plasma Turbulence
Kimitaka Itoh
National Institute for Fusion Science, Toki, Gifu 509-5292, Japan
‘Imaging’ is composed of various processes in human recognition. In one of thoughts, thevisualization of the subject is a central theme, but in the others, emphases are put upon the processof comparing the icon and knowledge with the models, to establish understanding. Thefundamental issue in studying (thus in making the imaging of) the turbulence is to identify thenonlinear interactions among excited degrees of freedoms, and to extract a law. In plasmaturbulence, turbulent fluctuations are composed of (nonlinear) collective modes and incoherentgranulations. Collective modes are considered to interact through wave-wave (W-W) interactionsand wave-particle (W-P) interactions. In the end, both of the nonlinear interactions must bemeasured and integrated into our understanding. Unfortunately, the measurement on the W-Pinteractions has been very limited so far, and experimental studies are more abundant for W-Winteractions. The latter interactions are dominated by the three-wave coupling. Therefore, theanalysis of the third order spectrum is a useful method to measure the nonlinear interactions inplasma turbulence. Quantitative studies of nonlinear interactions in plasma turbulence are nowpossible, as a result of the rapid progress of capabilities in data acquisitions and computations. Weshall discuss the image of plasma turbulence, through interpretations of observations, which aregiven by the higher order spectral analysis. By employing the bipspectral method, magnitudes ofinteractions among excited modes are estimated and comparisons with theoretical modeling areperformed. Interactions between microscopic turbulence and large-scale structures are alsodemonstrated, providing our understanding how global structures are generated by turbulence.This is a new step in establishing imaging of plasma turbulence.
References
[1] K. Itoh, et al., Phys. Plasmas 12 (2005) 102301 [2] Cluster papers on "Experiments of zonal flow and turbulence" (ed. S.-I. Itoh) Plasma Phys. Contr. Fusion 48 No.4 (2006)
This work was partly supported by the Grant-in-Aid for Specially-Promoted Research (16002005) and the Grant-in-Aid for Scientific Research (15360495), by the collaboration programmes of NIFS and of the RIAM of Kyushu University.

I2-1
Recent Progress on Analytical Image Reconstruction Methods for Tomography
H.Kudo
University of Tsukuba, Tennoudai 1-1-1, Tsukuba 305-8573, Japan
Image reconstruction from projections is a key step in tomographic imaging. In this paper, we provide a comprehensible review on recent progress on analytical image reconstruction methods. The paper mainly covers two types of image reconstruction problems in which significant progress has been achieved since 1990. The first problem we pick up is the region of interest (ROI) reconstruction from limited projection data, where our aim is to reconstruct a small portion of the object called the ROI from a set of line integrals less than the ordinary complete data set. In particular, we explain two image reconstruction methods (super-short-scan algorithms for fan-beam tomography and two-step Hilbert transform algorithms to enable exact reconstruction from truncated projections, developed by Noo and coworkers). The second problem we pick up is the cone-beam reconstruction, where our aim is to reconstruct a 3-D object from a set of cone-beam projections. We explain several key results on the cone-beam reconstruction (the Feldkamp algorithm for a circular source trajectory, Tuy's data sufficiency condition, Grangeat's algorithm based on the first derivative of 3-D Radon transform, cone-beam FBP algorithm by Defrise and Kudo, and Katsevich's algorithm). Due to the limited presentation time, we will not cover algebraic or iterative reconstruction methods.
I2-2
Present and Future of Computed Tomography Technology
J. Hsieh
Applied Science Laboratory GE Healthcare Technologies Waukesha, Wisconsin, USA
Cone Beam Computed Tomography (CBCT) is one of the most recent technological advancements in x-ray computed tomography. The state-of-the-art 64-slice scanners provideisotropic sub-millimeter spatial resolution, superior dose efficiency, large volumetric coverage, and markedly improved temporal resolution. These capabilities open doors to new clinicalapplications so that the entire human body can be scanned easily in a single breath-hold and a gated coronary artery imaging in 5 seconds. In the past few years, significant efforts have been focused on increasing volume coverage and improving scan speed. Not long ago, 4-slice CT with one-second gantry rotation was considered astate-of-the-art scanner. Today, the coverage spec has increased 16 times and the scan speed morethan tripled. This paper first discusses technical challenges that face the development of CBCT.These challenges include the detector design complexity, x-ray flux management, electrical and mechanical design difficulties, image reconstruction algorithms, dose, and information management. We then examine the new clinical applications that are enabled by the newtechnology, such as cardiac imaging, organ perfusion, triple-rule-out, and CT angiogram. The second part of the presentation discusses more recent developments in CBCT technology.These include advanced dose-reduction techniques, the dual-source CT, advanced reconstructionalgorithms that break the traditional noise vs. dose tradeoffs, and dual-energy CT for materialdecomposition. If the past 10 years of CT development is characterized by the “slice-war”, the CTtechnology today is truly at the cross-road where new developments are pointing at differentdirections.

I2-3
Optical coherence imaging for high resolution plasma spectroscopy
J Howard
Plasma Research Laboratory Research School of Physical Sciences and Engineering
Australian National University
We have recently obtained the first 2-d plasma Doppler spectroscopic images of transient, high-temperature plasma phenomena. Using compact polarization optical methods, quadratureimages of the optical coherence of an isolated spectral line are multiplexed to four quadrants of a fast CCD camera. The simultaneously captured, but distinct images can be simply processed tounfold the plasma brightness, temperature and flow fields. This static system is a spatial-multiplexvariant of previously reported electro-optically modulated, temporal-multiplex coherence imaging systems. It is based on a high throughput imaging polarization interferometer that employs crossedWollaston prisms and appropriate image plane masks. Because the information is capturedsimultaneously, it is well-suited to high-spectral-resolution, high-throughput 2-d imaging of transient or rapidly changing spectroscopic scenes.
More generally, when the spectral information content of a given scene can be characterized by a small number of parameters (MSE, Zeeman effect, thermography, bremmstrahhlung, Thomson scattering), it is possible to construct high-throughput interferometers that directly target thedesired information. For example, in the Doppler case, the visibility and phase of optical fringes atan optical delay close to the optical coherence length, vary sensitively to changes in plasma temperature and flow speed. When measuring relative line intensities (e.g. closely spaced isotopelines), the optical coherence varies most sensitively near the first zero of the beat pattern produced by the sum of the independent interferograms.
To demonstrate instrument performance we present recent results of static 4-quadrant Doppler coherence imaging on the H-1 heliac at the ANU. We also report coherence-based measurementsof spectral line ratios and discuss the application of birefringent filters for Thomson scattering imaging of plasma electron temperature.
This project is proudly supported by the Innovation Access Programme- International Science and Technologyunder the Australian Government’s innovation statement, Backing Australia's Ability

I2-4
Ionospheric Tomography by Neural Network Collocation Method
T.Takeda, X-F.Ma1)
The University of Electro-Communications, Chofu, Tokyo 182-8585, Japan 1) Xilisoft Corporation, Haidian District, Beijing, 100080, China
Computerized tomography (CT) is studied extensively in various fields to reconstruct material distributions from a dataset observed outside the region of interest. In the fields as medicalapplications where a large quantity of required observation data is obtained comparatively easily, high speed analysis methods with high precision are developed and practically used. In the casesof the physics experiments or outdoor observations, however, positions of observation equipments cannot be chosen arbitrarily and consequently the observation paths are not uniformly distributed and, often, the number of the projection paths is not sufficiently large. On the basis of the neuralnetwork collocation method we proposed the CT analysis method for a small qauantity of projection data and applied the method to reconstruction of the three dimensional electron density distribution of the ionospheric plasma from the TEC (Total Electron Content) data observed by the GPS system. The observed TEC value is the line integral of the electron density on the pathbetween a sattelite and a receiver. In this CT image reconstruction problem there exist some difficult issues; (1) there are not sufficiently large number of simultaneously observed data, (2) the distribution of the projection paths is not uniform, (3) there are no paths around the horizontal direction. It is, therefore, rather difficult to apply the conventional CT analysis methods to thisproblem. In this method the electron distribution of the ionospheric plasma is represented by a multilayer neural network. Training of the neural network is carried out by minimizing square of thedifference between the observed TEC for a projection path and the line integral of the electrondensity represented by the neural network along the path. This line integral is calculatednumerically from the output of the neural network at prescribed collocation points. For the successof the CT image reconstruction two additional techniques are important. First, absolute value ofthe electron density at one point within the region of interest is supplied by using the data observed by the ionosonde. Secondly, the input space should be discretized though the neuralnetwork can deal with continuous coordinates. We first applied the method to a model problem produced from the GCPM (Global Core Plasma Model) based on the IRI (International Reference Ionosphere) and attained a satisfactory result.Then we applied it to a real data observed by the 40 GPS receivers located from Wakkanai to Okinawa with the ionosonde data at Kokubunji and attained successful results. The reconstructedmaximum densities and the corresponding heights are confirmed to coincide with the observed data also at the three ionosonde sites other than Kokubunji.

I3-1
Advanced Microwave/Millimeter-Wave Imaging Technology
N. C. Luhmann, Jr.1), C. W. Domier1), N. Ito2), Y. Liang1), A. Mase2), H. Park3), E. Sakata4), Z. Shen1), W. Tsai1), Z.G. Xia1), Lu Yang 1), P. Zhang1)
1)Department of Electrical and Computer Engineering, UC Davis, USA 2)Art, Science and Technology Center for Cooperative Research, Kyushu University, Japan
3)Princeton Plasma Physics Laboratory, Princeton University, USA 4)Kyushu Hitachi Maxell, Ltd, Japan
Advances in millimeter wave technology have made possible millimeter wave imaging for advanced plasma diagnostics, radio astronomy, atmospheric radiometry, concealed weapon detection, all-weather aircraft landing, contraband goods detection, harbor navigation/surveillance in fog, highway traffic monitoring in fog, helicopter and automotive collision avoidance in fog, and environmental remote sensing data associated with weather, pollution, soil moisture, oil spill detection, and monitoring of forest fires, to name but a few. The primary focus of this talk will be on technology advances which have made advanced imaging and visualization of magnetohydrodynamic (MHD) fluctuations and microturbulence in fusion plasmas. Topics of particular focus include frequency selective surfaces, planar Schottky diode mixer arrays, electronically controlled beam shaping/steering arrays, and high power millimeter wave sources.
I3-2
Spectroscopy and Imaging by Laser Excited Terahertz Waves
M. Hangyo, M. Tani, and S. Nagashima
Institute of Laser Engineering, Osaka University
Up to very recently, terahertz (THz) electromagnetic waves (0.1 ~ 10 THz) have been an unexplored frequency region of electromagnetic waves. This electromagnetic wave region has become one of the most promising field by the recent development of the methods of THz generation by using femtosecond lasers.1) The THz time-domain spectroscopy (THz-TDS) using the pulsed THz waves is very effective for characterizing various materials, i. e. semiconductors, superconductors, polymers, ferroelectrics, biomolecules, liquids, and gases.2) For example, the complex dielectric function associated with the solid state plasma in semiconductors can be measured without electrical contact, giving the density and mobility of carriers.3) The time evolution of the density and collision time of the discharge gas plasma has been measured by the THz-TDS using the same analysis with that for solid state plasmas.4) The THz imaging systems have also been developed for diagnosis of various objects.5) In addition to the raster-scan type imaging systems, the real-time imaging system using the electro-optic crystal has been developed. Since the paper, ceramics, and plastics transmit the THz waves considerably, defects or objects in these materials can be visualized by the THz beams. For example, plastic bombs and illicit drugs in mails can be detected by the THz spectroscopy and imaging systems.6,7) The THz tomography is possible by measuring the waveforms of THz pulses reflected by the objects. The tomographic images of a tablet and nail are obtained. The THz tomographic imaging system will be also effective for diagnosis of fusion plasmas.8) The reflected pulse waveform carries information on the spatial distribution of plasma frequency or plasma density. The THz specteroscopy and imaging will be used in industries in near future.
References
1) Sensing with Terahertz Radiation, ed. D. Mittleman (Springer, Berlin, 2003). 2) M. Hangyo et al., Int. J. Infrared and Millimeter Waves 26, 1661 (2005). 3) S. Nashima et al., J. Appl. Phys. Lett. 90, 837 (2001). 4) S. P. Jamison et al., J. Appl. Phys. 93, 4334 (2003). 5) B. Ferguson and X. -C. Zhang, Nature Materials 1, 26 (2002). 6) K. Yamamoto et al., Jpn. J. Appl. Phys. 43, L414 (2004). 7) K. Kawase et al., Opt. Express 11, 2549 (2003). 8) T. Tokuzawa and K. Kawahata, private communication.

I3-3
Evolution of Ultra-High-Speed CCD Imagers
T. Goji Etoh, P. Karimov, Vo Le Cuong, T. Okinaka, K. Takehara and Y. Takano
School of Science and Engineering, Kinki University, Kowakae, Higashi-Osaka, JAPAN 577-8502
In 2001, a video camera operating at 1,000,000 fps (frames per second) was developed, mountinga custom CCD imager, the ISIS, the In-situ Storage Image Sensor. The ISIS was invented anddesigned by the authors[1]. Since then, various innovative technologies have been developed andapplied to improve the performance of the sensor, such as sensitivity, pixel count, dynamic range,etc. The sensor, recently designed, will achieve very high sensitivity as well as the ultra-highframe rate. Thus, the sensor was named the PC-ISIS, the Photon-Counting ISIS. The ultra-highframe rate is realized by the ISIS structure, and the ultra-high sensitivity is supported by thecombination of three technologies, backside illumination, cooling and the CCM, the ChargeCarrier Multiplier. The CCM is a very efficient amplification technology specific to the CCDimagers, that amplifies image signals with the increasing S/N ratio. The PC-ISIS is beingdeveloped originally for application to the ultra-high-speed video microscope for biologicalobservations, ”The Ultra-high-speed Bionanoscope”. Once it will be developed, it can be widelyapplied to high-speed imaging in the various scientific and engineering fields as well asbioscience. Furthermore, various CCD imagers with much higher performance in one or two specified functions can be developed by utilizing the technological components introduced for development of the PC-ISIS. For example, if we allow a lower dynamic range than that of the PC-ISIS, it ispossible to design an image sensor operating at 100 MHz. In addition to development of the PC-ISIS, many other technologies have been proposed and developed to support the ultra-high-speed imaging with higher image quality. Among them are abutting technology for larger pixel count, the video trigger system for synchronization of the image capture to occurrence of the target event, the terraced image sensor with the performance far beyond that of the ISIS, etc. In the first part of the paper, the structure and the performance of the ISIS developed in 2001 arebriefly summarized. Then, those of the PC-ISIS are presented with detailed explanation of thetechnological components supporting the performance. Other technologies developed forultra-high-speed imaging are also outlined.
References
References: [1] T. Goji Etoh, et al, IEEE Transactions of Electron Devices, 50(1), 144-151, 2003.

O3-4
Simulation Studies on Advanced Microwave Diagnostics and Related Technology
H. Hojo, A. Mase1), K. Kawahata2)
Plasma Research Center, University of Tsukuba, Tsukuba, Ibaraki 305-8577, Japan 1)Art, Science and Technology Center for Cooperative Research, Kyushu University, Kasuga,
Fukuoka 816-8580, Japan 2)National Institute for Fusion Science, Toki, Gifu 509-5292, Japan
Microwave diagnostics such as reflectometry are receiving growing attention in magnetic confinement fusion research. The detailed measurements on density profile and its fluctuationsmight be required in order to obtain the better understanding of plasma confinement physics.Especially, the new methods of microwave reflectometry such as ultrashort-pulse reflectometry and imaging reflectometry have been recently developed, and then we think that it is very important to demonstrate computationally the usefulness of these new diagnostic methods as well as these experiments. From such a reason, we wish to emphasize the importance of thedevelopment of microwave diagnostic simulator[1] and the related technology such as advanced beam former. We here study the relativistic effects of plasma in micro- and millimeter-wave propagation. Thisstudy is very important in understanding burning plasma physics related to the ITER project. Themost significant effect in wave propagation is the change of cutoff layer due to the relativistic electron mass modification[2]. In this case, the electron mass me is modified to me(1+5/μ)1/2,where μ= mec2/Te , Te being the electron temperature. Then, the change Δn of the cutoff densitync is given by Δn/nc = (1+5/μ)1/2-1 for the O-mode cutoff , and Δn/nc = [(1+5/μ)1/2-1]/(1-ωce/ω)for the upper X-mode cutoff. The shift in the cutoff density due to relativistic effects is moresignificant for X modes. By performing two-dimensional FDTD simulations on electromagneticwave propagation, we show that the numerical result for the cutoff density change is in goodagreement with the theoretical estimation. This relativistic change of the cutoff density mightbring us a new possibility of measuring the electron temperature profile. Finally, we discuss the possibility of a new type of beam former, which is composed of metallicwires and can be very flexibly constructed. This new beam former is applicable in the widefrequency range from microwave to light wave, and we report the wave transmission characteristics of this beam former.
References
[1] H. Hojo et al., Rev. Sci. Instrum. 70 (1999) 983. [2] E. Mazzucato, Phys. Fluids B 4 (1992) 3460.

I4-1
High density plasma probing with pulse proton beams generated in ultra-intense laser plasma interactions
M. Tampo1),H. Nakamura1)2)and R. Kodama1)2)
1) Institute of laser engineering, Osaka University 2) Graduate School of Engineering, Osaka University
A MeV proton beam generated in ultra-intense laser plasma interactions has advantages as a probebeam to measure the high-density and transient plasmas. The typical density of the beam is 1012within a few psec, which is useful for high time resolution of the images. The ultra low emittance is also one of the advantages of this laser proton beam since the typical emittance is 0.004 mm*mrad, resulting a high spatial resolution. Measurements of strong and fine structured electrostatic field generated in laser produced plasmas has been demonstrated using this protons as a prove beam [1]. Other interesting points of this proton beam could be broad energy spectra. These broad energy spectra of the pulse proton beam enable us to prove the plasma with a chirped pulse beam. The difference of the energy in the broad energy spectra can prove the plasma at different times corresponding to the proton energy since the flight time from the proton source to the proved plasmas decrease with the proton energy. For example, a high-density plasma will be imaged with 3MeV and 5MeV proton beams at a relative timing of 130 psec and 100 psec, respectively, if the distance between the probed plasma and the proton source is 3 mm. This technique has been applied to measure a time evolution of a strong electrostatic field generated in a laser plasma with a time resolution of 40 psec [2]. Taking account of the energy density and low emittance of the proton beam, nuclear reaction ofthe proton beam with high-density plasma such as Li doped plasmas could be also a useful tool to prove the plasmas. In this paper, we will present these high density prove techniques with high temporal resolution using the ultra-intense short pulse laser created MeV proton beam.
References
[1] L. Romagnani et al., Phys. Rev. Lett. 95, 195001 (2005). [2] Z. L. Chen et al., Phys. Rev. Lett. 96, 084802 (2006).
I4-2
Advanced imaging applications on ITER
R Barnsley 1) and ITER contributors
1) Queens University Belfast and EFDA/JET. Visiting researcher at ITER.
ITER is designed as a superconducting Tokamak, with additional heating from neutral beams and ion-cyclotron resonance heating. The projected energy multiplication for D-T fuel is Q = 10,yielding fusion output of around 500 MW,
The ITER plasma will radiate strongly throughout the electromagnetic spectrum, as well as emitting ions, neutrals and neutrons. This radiation will be monitored with a wide range of diagnostic techniques, many based on radiation imaging, both for machine control and protection, and to measure physics parameters.
Due to the severe radiation environment, and the difficult access to views of the plasma, advances are required in many areas of imaging, including: a) infra-red thermography to monitor the temperature of vessels walls and divertor targets, b) bolometry of radiated power for machine protection and power balance, c) visible imaging and spectroscopy for protection and control, d) VUV imaging and spectroscopy of ions characteristic of the cooler outer and divertor plasmas, e) x-ray imaging and spectroscopy of the hot core plasma, and f) gamma-ray and neutron spectroscopic imaging of nuclear reactions.

I4-3
The diagnosis of fast ions in fusion plasmas by means of collective Thomson scattering (CTS)
H. Bindslev

I5-1
Optimizing Phase Contrast in TEM by the use of an electrostatic Boersch Phase Plate
R.R. Schroeder1), B. Barton1), K. Schultheiss2), D. Gerthsen2)
1) Max-Planck-Institute of Biophysics, Max-von-Laue Str. 3, D-60438 Frankfurt/Main, Germany 2) Laboratorium für Elektronenmikroskopie and Center for Functional Nanostructures
(CFN), Universität Karlsruhe (TH), D-76128 Karlsruhe, Germany
Recently phase-plate-mediated Phase Contrast TEM has gained new interest with the successful use of a simple carbon film as a phase shifting device [1]. However, for high resolution imaging an electrostatic phase plate as proposed already by Boersch in 1947 [2] seems more suitable as it uses an electric field to affect the electron wave and thus avoids the additional interaction of electrons with matter. In our design an electrostatic micro-lens is placed in the centre of the diffraction plane of the objective lens. It is driven as a very weak einzel lens, which changes the phase of the unscattered electron wave while minimally affecting the focus of the unscattered electrons. After the successful fabrication of the necessary electrostatic micro-lens [3] we have now tested different Boersch phase plate prototypes in a Zeiss-NTS SESAM II. As test specimens we used amorphous films of carbon and tungsten, imaged at high defocus to visualize the expected change in the phase contrast transfer function (CTF). When applying the appropriate potential we find a cosine-like CTF, demonstrating the 90 degrees phase shift between scattered and unscattered electrons necessary for optimized phase contrast. To visualize the change of contrast in images, we then recorded images of the protein crystal catalase close to focus (negatively stained with UAc and also in cryo-EM/embedded in ice). In conventional defocus-based phase contrast such images have almost negligible contrast, whereas object contrast in images recorded with the electrostatic phase plate is greatly enhanced. However, such contrast is at present also affected by the support structures of the phase plate, which obstruct electrons in the diffraction plane. These obstructing structures lead to both, the elimination of the lowest spatial frequency components, and also to single-sideband imaging, which itself increases object contrast. Model calculations for ice embedded biological samples (ribosomes as weak phase objects) show, that such obstruction effects can be minimized, if the phase plate is placed in a magnified diffraction plane. This could be realized by the use of longer focal lengths objective lenses, or by simple magnification of the diffraction plane.
References
[1] Danev R. and Nagayama K., Ultramicroscopy 88 (2001) 243-252 [2] Boersch H., Z. Naturforsch. 2a (1947) 615-633 [3] Schultheiss et al., Rev. Sci. Instr., 77 (2006) 033701

I5-2
Cryo-EM study of dynein-microtubule interaction
N.Mizuno1), A.Narita2), T.Kon3), K.Suto3) and M.Kikkawa1)
1)University of Texas Southwestern Medical Center, 5323 Harry HinesBlvd. Tx, 75390, USA 2)Actin filament Dynamics Project, Exploratory Research for Advanced Technology, Japan
Science and Technology Corporation, Hyogo, Japan. 3)Graduate School of Arts and Sciences, University of Tokyo, Tokyo 153-8902, Japan
Recent biochemical studies of dynein, a minus-end-directed microtubule motor, have shownATP-cycle dependant conformational changes. However, most experiments have been based on a 2D negative staining classification of dynein and were carried out in the absence of microtubules. The present study has carried out an analysis using cryo-EM and 3D reconstruction methods to investigate the structural interaction of dynein bound to microtubules. Dynein is a minus-end-directed microtubule motor and uses ATP as the energy source to carrycargo along microtubules. Dynein is a large protein complex composed of two identical heavy chains (~500kDa), and several accessory chains. The heavy chain is responsible for its motor activity and consists of three structurally distinct domains: a globular head with ATPase activity, a cargo-binding tail, and a microtubule-binding stalk. The long slender tail, which is located in the N-terminus of the heavy-chain, binds to cargo and interacts with accessory chains. The globular head, which makes up 2/3rds of the heavy chain's C-terminal region, has a ring-like arrangement of seven sub-domains. The stalk protrudes from the head and is topped with a small globular domain that allows dynein to bind microtubules in an ATP-sensitive manner. The current investigation has used single particle analysis, in combination with helical imageanalysis of microtubules. Recombinant cytoplasmic dynein containing 2/3rds of the heavy chain's C-terminal region was expressed in Dictyostelium. Images were collected using a CCD cameraand (14.3) microtubules were selected manually according to their moire patterns. Approximately 300 microtubule filaments were analyzed. 1200 dynein particles, sparsely bound to microtubules, were selected. Images of microtubules were straightened and magnifications normalized. To select particles overlapped with microtubule density on images, the density from microtubules was computationally removed. The initial model was made from dynein decorated to the microtubule with sub-stoichiometric amount by reconstruction using microtubule helical symmetry. During the refinement process, cluster analysis was added to remove incorrect density of dynein. The reconstructed dynein microtubule complex showed a disk feature of dynein whose axis is orthogonal to the microtubule. Seven sub-domains of dynein were clearly visualized together with a short tail on top of the disk. In this conference, details of the computational methods used will be discussed and a mechanismof how dynein interacts with microtubules in order to perform the power stoke will be proposed.

I5-3
Molecular Mechanisms of Swimming and Tumbling in Bacterial Motility
Keiichi Namba
Graduate School of Frontier Biosciences, Osaka University & Dynamic NanoMachine Project, ICORP, JST, 1-3 Yamadaoka, Suita, Osaka 565-0871 Japan
The bacterial flagellum is made of a rotary motor and a long helical filament by means of which bacteria swim. The flagellar motor rotates at around 300 Hz and drives the rapid rotation of each flagellum to propel cell movements. The long helical filament, which is a tubular structure with a diameter of about 20 nm, is made of a single protein flagellin. The filament switches between left- and right-handed helical forms in response to the twisting force produced by reversal of the motor rotation, allowing bacteria to alternate their swimming pattern between run and tumble for taxis. The flagellum also has a short, highly curved segment called hook, which connects the motor and the helical propeller. Its bending flexibility makes it work as a nano-scale universal joint, while the filament is relatively more rigid to function as a propeller. The flagellum is constructed by self-assembly of proteins translocated from the cytoplasm through the narrow central channel to the distal end of the growing structure, where one of the three different cap complexes is attached to help efficient self-assembly of particular proteins that need to be assembled at each specific stage of assembly. Those flagellar proteins are exported from the cytoplasm into the central channel of the growing flagellum by the flagellar type III protein export apparatus, which consists of six membrane proteins and three soluble proteins. One of the proteins is FliI, an ATPase that provides energy for the export process. A few cytosolic chaperones are also involved to facilitate the export process. We have been trying to understand how those macromolecular nanomachines work by looking at their structures by X-ray crystallography, fiber diffraction and electron cryomicroscopy. X-ray crystallography is a powerful tool to visualize atomic structures of macromolecules. However, visualization of the structures at work is difficult because many proteins involved do not form stable complexes. For example, the flagellar basal body when isolated does not contain the stator unit and most of the type III export apparatus proteins. The subunit stoichiometry may also have distributions. Electron cryomicroscopy including single particle image analysis, helical image reconstruction and tomography would allow us to visualize those structures. I will describe how we have visualized some parts of the flagellar structure at nearly atomic resolution by complementary use of the two methods, what we have learned from them, and how we will proceed further to solve the flagellar structure as a whole for ultimate understanding of the mechanisms of its protein export, self-assembly, and rotation.
I5-4
Visualization of in vivo macromolecules in ice embedded whole cyanobacterial cells by Hilbert differential contrast transmission electron microscopy
Y.Kaneko11), K.Nitta2), K.Nagayama2)
1)Biology Section in Faculty of Education and Graduate School of Science and Engineering, Saitama University, Saitama 338-8570, JAPAN
2)Okazaki Institute for Integrative Bioscience, National Institute of Natural Sciences, Okazaki 444-8570, JAPAN
The ultimate goal of biological electron microscopy is to visualize molecular and cellular events in the living state with extremely high resolution. Currently, rapid freezing is considered to be the most reliable method to retain ultrastructure and molecular states of living cells for TEM observation. With the recently developed Hilbert differential contrast electron microscope (HDC TEM), it has become possible to visualize ultrastructures of rapidly frozen ice embedded whole cyanobacterial cells [1, 2]. The cells observed with HDC TEM were surrounded by a smooth cell wall and membrane and packed with numerous particles and filaments. Thylakoid membranes and carboxysomes with their detailed macromolecular structures were observed very clearly in the whole cells. Further, electrondense polyphosphate bodies were consistently found in rapidly growing cyanobacterial cells. Some of the filaments observed in the cells with HDC TEM appeared to be associated with the polyphosphate bodies. By applying various DNA staining techniques to visualize DNA at theultrastructural level, DNA localization and its association with polyphosphate bodies were examined. Incorporation of BrdU in newly synthesized DNA conferred electron density andincorporation of Br was confirmed by electron spectroscopic imaging (ESI). HDC TEM combinedwith ESI opens up a new approach to visualize DNA fibrils in vivo at high resolution.
References
[1]Y. Kaneko, R. Danev, K. Nitta and K. Nagayama, J. Electron Microsc., 54 (2005)7 0-84 [2]Y. Kaneko, R. Danev, K. Nagayama, H. Nakamoto, J. Bacteriol., 188 (2006) 805-808

I6-1
"Hinode"; A New Solar Observatory in Space
H. Hara and the Hinode Team 1)
National Astronomical Observatory of Japan/NINS, Mitaka, Tokyo 181-8588 Japan 1) Institute of Space and Aastonautical Science/JAXA, Sagamihara, Kanagawa, 229-8511 Japan
The third Japanese solar observing satellite, Solar-B, was launched on 2006 Sep 23 from theUchinoura Space Center of JAXA and it was named as "Hinode" (sunrise). Hinode carries threemajor telescopes: Solar Optical Telescope (SOT), X-ray Telescope (XRT), andExtreme-ultraviolet Imaging Spectrometer (EIS). These telescopes have been developed in aninternational collaboration of Japan, US, and UK for understanding the formation mechanism ofthe solar corona, dynamic events such as solar flares and coronal mass ejection, and magneticfields on the sun.
SOT consists of a diffraction-limited optical telescope of 50cm aperture and a focal-plane package. The solar photosphere and chromosphere are observed with broad and narrow bandpass imagers for high-cadence imaging observations and with a spectropolarimeter for detailed vector magnetic-field observations. Continuous observations of small-scale magnetic fields on the sun, which is an important key to understand the energy input to the corona, have never been achievedbefore SOT/Hinode.
XRT is a grazing-incidence X-ray telescope that has a three-times better spatial resolution with 1 arcsec pixel sampling and an order of magnitude higher sensitivity for the low-temperature corona, compared with the performance of the soft X-ray telescope on-board Yohkoh (Solar-A). All coronal phenomena with temperatures of 1-30 MK are studied in detail with the best performance that has ever been achieved.
EIS is an imaging spectrometer working at an extreme-ultraviolet wavelength range. It observes solar plasmas of log T = 4.7-7.3. The line-profile spectroscopy with narrow slits and imaging observations with wide slits are possible. Motions of hot plasmas and the process of plasma heating to coronal temperatures are investigated with a high-sensitivity spectrometer.
All telescopes have started their commissioning activities after the successful launch of spacecraft.The performance of spacecraft that supports the diffraction-limited SOT observations and some of initial observations are briefly introduced.

I6-2
Solar Optical Telescope onboard Hinode for Diagnosing the Solar Magnetic fields
K.Ichimoto, SOT Team
National Astronomical Observatory/NINS, Mitaka, Tokyo 181-8588, Japan
The Solar Optical Telescope (SOT) onboard Hinode is a 50cm aperture telescope to provide high resolution images of the sun in visible lights (388 - 668nm)[1,2]. The focal plane package of SOT consists of the Broad-band Filter Imager which provides the highest spatial resolution images of the solar photosphere, the Narrow-band Filter Imager which takes 2-dimentional chromospheric images, Dopplergram and Magnetogram in high cadence, and the Spectropolarimeter which takes full Stokes line profiles to provide the highest precesion magnetic field maps of the photosphere. The most outstanding characteristics of SOT is its continuous and uniform data quality with the unprecedentedly high precesion at the spatial resolution of 0.2 - 0.3 arcsec.
The door of the telescope was opened on 25th Oct. with the successful SOT first light. At the time of writing this abstract, inflight calibration of instruments of SOT is still on-going, but the data already reveals the excellent performance of the SOT. Some of the initial results will be presented.
References
[1] Shimizu, T., 2004, ASP conference series, 325, 3 [2] Ichimoto, K., and the Solar-B Team 2005, J.Korean Astron.Soc., 38, 307

I6-3
Multiplicity of Solar X-Ray Corona in Time and Space
R. Kano1), and the XRT Team1,2,3)
(1) National Astronomical Observatory of Japan (2) Institute of Space and Astronautical Science
(3) Smithsonian Astrophysical Observatory
The solar corona is filled with high temperature plasma. However, it is still unclear how the corona is heated up. The X-Ray Telescope (XRT) on the Hinode satellite observes the solar corona, to reveal its heating mechanism by coordinated observations with the other telescopes on the Hinode satellite (Solar Optical Telescope;SOT and EUV Imaging Spectrometer;EIS). In the solar corona, many transient events occurr; solar flares, micro-flares, coronal mass ejections, X-ray jets and so on. It is believed that every events are related with magnetic activities. Therefore, the coordination between the coronal obsertvation by XRT and the photospheric magnetic observation by SOT is important.
XRT is a graizing incident telescope like the Soft X-ray Telescope (SXT) on the Yohkoh satellite. However, the spatial resolution is improved to 1 arcsec/pixel, which is about 3 times higher than the SXT. The observable temperature range is also improved, espesially for low temperature (1MK) plasmas. Therefore, the XRT can observe not only active events (>5MK) but also quiet coronal bases (1MK). The XRT has the capability of the temperature diagnostics. It is hoped that the XRT observes fine scale temperature structures in the solar corona.

I6-4
Emission Line Imaging Spectroscopy for Diagnosing of Solar Outer Atmospheres
T. Watanabe, the EIS Team;1)
National Astronomical Observatory/NINS, Mitaka, Tokyo 181-8588, Japan 1)Institute of Space and Astronautical Science/JAXA, Sagamihara, Kanagawa 229-8511
The Extreme Ultraviolet Imaging Spectrometer (EUV) [1,2] on board the Japanese Sun Observing Satellite "Hinode" (launch date: 23-Sep-06) accommodates the multilayer coated mirror and concave grating with back-illuminated CCDs for detectors, and realizes the highest sensitivity ever achieved in the two EUV wavelengths, i.e. 17 - 21 nm and 25 - 29 nm. Thanks to the normal incidence optics, the spectrograph geometry and grating ruling were optimized to obtain excellent imaging capability.
The scientific goals of the instruments on board are: a) to identify the mechanisms responsible for heating the corona in active regions and the quiet Sun, b) to establish the mechanisms that give rise to transient phenomena, such as flares and coronal mass ejections, and c) to investigate the processes responsible for energy transfer from the photosphere to the corona. The instrument EIS will be able to provide the detailed diagnostic information on solar corona and transition region.
After opening of the instrument doors, the first light of EIS took place successfully on 28-Oct-06. At the time of writing this abstract, the in-flight calibrations and testings are still in operation, but a glimpse of these data reveals the expected performance of the instrument in orbit. Some of these initial results will be presented.
Further in collaboration with NIFS, a new tool of time-dependent collisonal-radiative model will be developed to analyse the data taken by this EIS instrument, and to diagnose temperatures and densities of those plasmas in the outer atmospheres of the Sun. Possibility of getting the atomic data required for these analyses is also in consideration.
References
[1] J.L. Culhane, L.K. Harra, G.A. Doschek, J.T. Mariska, T. Watanabe, H. Hara, Adv. Sp. Res., 36(2005) 1494 [2] J.L. Culhane et al., submitted to Solar Phys.(2006)
I7-1
Heavy Ion Beam Probe, Present status and future development
Yasuji Hamada
NIFS, Japan
Heavy ion beam probe was unique and powerful diagnostics, since it is a local and non-perturbedmeasurement of plasma potential. HIBP is the ideal diagnostics for the detection of zonal flow asthe non-linear interaction of drift-wave turbulence, since the sensitivity of small zonal flow asslow as ion diamagnetic drift velocity can be detected with high signal/noise ratio. It can be aLangmuire probe in the hot plasma core. We wish to report the recent results of zonal flow studyin JIPPT-IIU tokamak and desirable development and modifications for future study. It also maybe possible to detect plasma current profile in the tokamak plasma. The potential measurement ofHIBP depends on the total energy conservation law in the electrostatic and magnetic field, whilewe may be able to the magnetic flux function, RAφ at the ionization point (sample volume)through the by the angular canonical conservation law. We installed the several detectors tomeasure the toroidal deflection of the beam and RAφ and we wish to report the calucations andresults. The most serious problem of the HIBP when it is installed upon devices larger thanJIPPT-IIU tokamak, is the beam attenuation by the plasma electron and shortness of penetrationdepth of the primary beam. In JIPPT-IIU case, the highest average density for potential turbulencestudy is about 3x10¹³/cm3 for Tl (thallium) beam. When we changed the Thallium beam to Cs,Rb, K and Na, the toroidal field matched to the beam, steadily goes down, and the penetrationdepth, however, grows steadily larger with no penetration problem in Na case. We wish to report these results. The tandem accelerator has another possibility for the choice of the beam with good penetration. If the Al- beam is acceleratedto the central gas chamber of the tandem accelerator with Va voltage, it may be highly ionized to Al+3 in the gas chamber and got the final energy of 4 Va. The ionization energy of the Al+3 ismore 120 eV, compared to about 6.1 eV of Tl, the penetration depth may be so large and applicable to the large tokamak like JT-60U. We wish to report these calculations.

I7-2
Plasma Turbulence Imaging via Beam Emission Spectroscopy on the DIII-D Tokamak
G.R. McKee. R.J. Fonck, D.J. Schlossberg, M.W. Shafer,R.L. Boivin1)
University of Wisconsin-Madison, Madison, Wisconsin 53706, USA 1) General Atomics, San Diego, California 92121, USA
Plasma turbulence plays a critical role in energy, particle and momentum confinement inmagnetically-confined fusion plasmas. Beam Emission Spectroscopy (BES), a high-sensitivity,good spatial resolution imaging diagnostic system, has been deployed and recently upgraded andexpanded at the DIII-D tokamak to better understand such turbulence. The currently deployedsystem images density fluctuations over an approximately 5 x 7 cm region at the plasma mid-plane(radially scannable over 0.2 < r/a ≤ 1) with a 5 x 6 (radial x poloidal) grid of rectangular detectionchannels, at one microsecond time resolution. BES observes collisionally-induced,Doppler-shifted Dα fluorescence (λ = 652-656 nm) of a high-energy (75 keV) injected deuteriumneutral beam. Alignment of the sightline of high-throughput viewing optics and the local magneticfield at the beam-sightline intersection provides good spatial resolution. The diagnosticwavenumber sensitivity is approximately k⊥ < 2.5 cm-1, calculated via consideration of optical alignment and collimation, neutral beam dimensions, and finite lifetime effects of excited beam atoms. This resolution allows measurement of long-wavelength (k⊥ρi < 1) fluctuations associated with plasma ion turbulence (e.g., ion temperature gradient and trapped-electron modes). The recent upgrade includes expanded fiber optics bundles, custom-designed high-transmission,sharp-edge interference filters, ultra fast collection optics, and larger photodiode detectors thatprovide nearly an order of magnitude increase in sensitivity relative to an earlier generation BESsystem. A Linux-based data acquisition system (D-tAcq Solutions) provides simultaneoussampling of up to four megasamples per channel, or a 4.2 second continuous time record. The highsensitivity allows visualization of turbulence at normalized density fluctuation amplitudes ofδn(t)/no < 1%, typical of fluctuation levels in the core of low and high-confinement plasmas. The imaging array allows for sampling over 2-3 turbulent eddy scale lengths which captures the essential dynamics of eddy evolution, interaction and shearing. The imaging data allows for detailed study of poloidal flow and fluctuations therein resulting from such critical phenomenon as zonal flows. Examples of measured turbulence characteristics and movies (over 0.4 < r/a < 1.0) will be presented.
Supported by U.S. Department of Energy under DE-FG03-96ER54373 and DE-FG03-95R54294.

O7-3
Development of Polarization Interferometer Based on Fourier Transform Spectroscopy for Thomson Scattering Diagnostics
T. Hatae, J. Howard1), Y. Hirano2), M. Nakatsuka3), H. Yoshida3), O. Naito, S. Kitamura
Japan Atomic Energy Agency (JAEA), Naka, Ibaraki 311-0193, Japan 1) Plasma Research Laboratory, The Australian National University, Canberra ACT 0200,
Australia 2) National Institute of Advanced Industrial Science and Technology (AIST), Tsukuba, Ibaraki
305-8568, Japan 3) Institute of Laser Engineering, Osaka University, Suita, Osaka 565-0871, Japan
The Thomson scattering method is one of the standard diagnostic techniques for the measurement of local electron temperature Te and density ne. Usually a grating spectrometer or filter polychromator is used to analyze the scattered spectrum to obtain information on the electron temperature and density. Though these are established methods, there are some disadvantages such as small throughput (especially, in the case of grating spectrometer) or the necessity of relative calibration between wavelength channels. Recently, the use of a polarization interferometer based on Fourier transform spectroscopy for Thomson scattering diagnostics has been proposed [1]. This method can alleviate some of the disadvantages noted above. Furthermore, this method delivers a simple and compact system. For thermal electrons, the optical coherence of the Thomson scattered light at an appropriately chosen optical path delay, is a unique function of Te and ne. The detection system utilizes a single bandpass filter combined with imaging optics and dual detectors to simultaneously observe both dark and bright scattered light interference fringes. The normalized intensity difference between the bright and dark interference fringes gives a direct measure of Te, even for strongly blue shifted high temperature spectra. This paper describes the design and development plan for the wide field-of-view high transparency birefringent filter (polarization interferometer). For the first step, proof-of-principle tests will be carried out in TPE-RX reversed-field pinch device. The target Te range is 100-1000 eV, target ne
range is 5×10¹⁸ - 5×10¹⁹m-3. In the second step, time evolution of Te and ne profiles having 20 spatial points will be measured in JT-60U tokamak using 50-Hz YAG laser system[2]. The target Te range of the second step is considered up to 40 keV.
References
[1] J. Howard, Plasma Phys. Control. Fusion 48 (2006) 777. [2] T. Hatae, et al., J. Plasma Fusion Res. 80 (2004) 870.
This work is supported in part by Grant-in-Aid for Scientific Researches on Priority Area “AdvancedDiagnostics for Burning Plasmas” from MEXT (No. 18035016).
O7-4
Advanced Laser Diagnostics for Electron Density Measurements
K. Kawahata, T. Akiyama, K. Tanaka, T. Tokuzawa, Y. Ito, K. Nakayama1), Okajima1), S. Iio2)
National Institute for Fusion Science, Toki 509-5292, Japan 1)College of Engineering, Chubu University, Kasugai 487-8501, Japan
2)Tokyo Institute for technology, Megro-ku, Tokyo 152-8550, Japan
Measurements of the refractive index of the plasma by using electromagnetic waves are awell-established tool for measuring electron density profiles in high temperature plasmas. In the LHD, a 13-channel far infrared laser interferometer has been constructed and routinely operated for the precise measurements of the electron density profile almost every shot except in the case of a high-density plasma produced by an ice pellet injection. When a large sized pellet is injected into the plasma steep density gradient is formed, which sometimes causes the fringe jumps on the density traces measured by fringe counters. In order to overcome this difficulty there are sevral methods, which are classified into two categories, the interferometry and the polarimetry. In the first category, we need to develop short wavelength laser diagnostics to avoid the beambending effect. However, it is necessary to equip a second wavelength interferometer tocompensate mechanical vibrations of the optical components. In the LHD, a CO2 laser imaginginterferometer has been developed for detailed profile measurements of density and densityfluctuation. For the sake of vibration compensation a 1.06-μm YAG laser interferometer isemployed. As like this, the conventional two color interferometer system is composed of twoindependent laser interferometers. Therefore, the fringe shift caused by the mechanical vibrationscouldn’t be cancel out completely. A newly developed two color laser interferometer[1] canovercome this difficulty. The laser source is a optically pumped CH3OD laser, which oscillatessimultaneously at 57.2 and 47.6 μm. Some excellent features of the system are as follows:(i) thewavelength of 57.2 μm is considered to be optimum value to avoid refractive effects in highdensity operation of LHD and in future fusion devices, (ii) the optical components can beoptimized at both frequencies, (iii) an additional laser instrument is not needed to compensate thefringe shift due to mechanical vibrations, (iv) both laser beams pass the same optical path in theinterferometer without any optical path difference, and (v) one detector simultaneously detects thebeat signals of both laser lines. In the second category, polarimetry, the Faraday rotation and the Cotton-Mouton effect, can beconsidered to be robust measurements of the line integrated electron density, since the rotationangle is less than 2π radians by optimizing a laser wavelength for a target plasma. On CHS aCotton-Mouton polarimeter with a 337-μm HCN laser was developed in order to see the accuracyand limitation of the meter. A CO2 laser densitometer[2] measuring the Faraday rotation anglewas developed for the long-pulse operations of LHD. The values of these polarimeters depend onboth the density and the magnetic field strength. In the helical system the confining magnetic fieldcan be computed for low beta plasmas and then the density information can be derived. Details ofeach diagnostics and sample results will be presented in this conference.
References
[1] K. Kawahata,. Rev. Sci. Instrum. 75, 10 (2004) 3508. [2] T. Akiyama, et al., Rev. Sci. Instrum. 74, 5 (2003) 2695.

I8-1
MRI technologies in recent human brain mapping
Y. Sasaki
Athinoula A. Martinos Center for Biomedical Imaging, Mass Gen Hospital, Charlestown, MA 02129, USA
Harvard Med School, Boston, MA 02115, USA
Magnetic resonance imaging (MRI) is a tool that allows us to investigate human brain activity non-invasively. What can we do with it now? The research center I belong to is home to aboutsixty faculty members from various backgrounds to develop new imaging technologies, which will be applied to biologically and medically important questions. In my talk, I will describe some oftechnologies developed here, and then their applications. First, I will introduce brain images inexcellent spatial resolutions taken from 7T magnetic field, and whole brain diffusion tensor imaging. Next, I will show interictal spike localization in combination of magnetoencephalogram(MEG) and MRI. Finally, I will talk about our recent neuroscientific finding in symmetryperception in human and monkey functional MRI.
Supported by NIMH, NCRR, MIND institute, and Athinoula A. Martinos Center for Biomedical Imaging. The author is an ERATO Shimojo Implicit Brain Function Project Collaborative Researcher.

I8-2
Cross-modal integration and plasticity revealed by functional magnetic resonance imaging
N. Sadato
National Institute for Physiological Sciences, Okazaki, Aichi, 444-8585, Japan
Recent advances in functional neuroimaging and electrophysiological techniques are quite rapid, allowing human physiology to be investigated in ways that have previously been impossible. Thebrain is a dynamically changing structure. Braille reading by the blind recruits the visual cortex. The sign language activated the auditory cortex of the deaf. The cross-modal plasticity may becaused either by sensory deprivation or by long-term training. To evaluate the long term learning effect on the cross-modal plasticity, we conducted functional magnetic resonance imaging (fMRI) studies. First, normally-sighted participants who had undergone long-term training on the tactile shape discrimination of two dimensional Mah-Jong tiles were recruited. When participants performed tactile discrimination of Mah-Jong tiles, the left lateral occipital cortex (LOC) and V1 of the well-trained subjects were activated. In the naive subjects, the LOC was activated whereasV1 was deactivated. Both the LOC and V1 of the well-trained subjects were activated by Brailletactile discrimination tasks. The activation of V1 may be due to cross-modal plasticity resulting from long-term training. Second, we investigated "key-touch reading" by which well trained pianists were able to identify the familiar music whereas less trained subjects were not. The leftassociation auditory cortex of the well trained subjects was equally activated by observation of familiar music, unfamiliar music, and random sequences. As the naive and less trained groups didnot show activation of the left PT during any of the tasks, PT activation reflects a long-term learned process. These studies showed that long-term learning dynamically modify the brain organization for the multisensory integration.

O8-3
Cortical Networks for Visual Self-Recognition
M. Sugiura
Division of Cerebral Research, National Institute for Physiological Sciences, Okazaki, Aichi 444-8585, Japan
The ability to recognize one's own visual image has been studied in human infants and animals, having a particular interest in its relationship with self-awareness and the concept of self. Aninfant usually starts to show evidence of self-recognition in a mirror in the second year of life.Except for chimpanzees and orangutans, no animals have demonstrated this ability even with extended periods of exposure to a mirror. These observations suggest that the ability of visualself-recognition requires a special cognitive mechanism.
Evidence from cognitive neuroscience research suggests that the self-specific process during visual self-recognition is likely to involve multiple independent processes sustained by discrete brain mechanisms. In fact, split brain patients recognize their own face in either hemisphere, andtwo hemispheres appear to have different sensitivities to one's own face and familiar faces.However, hemispheric dominancy in self-recognition has been a matter of controversy.
A recent fMRI study demonstrated specific involvement of the left ventral occipitotemporal cortex and the right parietal and frontal cortices in visual self-recognition [1]. Evidence of distinct rolesof these regions in visual self-recognition was provided by the results of a subsequent fMRI study; sensitivity to self-image was different across three regions depending on the image attributes and subjects [2]. Taken together developmental and sociobehavioral views of visual self-recognitionand previous findings on these regions, it has been speculated that the left ventral occipitotemporal cortex processes one's own face as a symbol, and the right parietal and frontal cortices play roles in visuo-spatial and conceptual self-representations, respectively.
References
[1] Sugiura, M., Watanabe, J., Maeda, Y., Matsue, Y., Fukuda, H., Kawashima, R., 2005. Cortical mechanisms of visual self-recognition. Neuroimage 24, 143-149. [2] Sugiura, M., Sassa, Y., Jeong, H., Miura, N., Akitsuki, Y., Horie, K., Sato, S., Kawashima, R., 2006. Multiple brain networks for visual self-recognition with different sensitivity for motion and body part. Neuroimage 32, 1905-1917.

O8-4
Neuroimaging Study of the Human Amygdala -Toward an Understanding of Emotional and Stress Responses-
T. Iidaka
Nagoya University, Graduate School of Medicine, Department of Psychiatry
The amygdala plays a critical role in the neural system that is involved in emotional responses and conditioned fear. Dysfunction of this system is thought to be a cause of several neuropsychiatric disorders (e.g., schizophrenia, depression, and anxiety disorder). A neuroimaging study using functional magnetic resonance imaging provides a unique opportunity for noninvasive investigation of the human amygdala. We studied activity of this structure in normal young subjects, normal old subjects, and patients with schizophrenia using face recognition task. Our results showed that the bilateral amygdalae were significantly activated by the presentation of face stimuli, and negative face activated the amygdala to a greater extent as compared with neutral face. The amygdala also responded to the face that was shown implicitly. These observations indicate that the amygdala is extremely sensitive to face stimuli that have a biological value for humans. Activation of the amygdala was significantly lower in the old than in the young subjects, while schizophrenic patients showed enhanced activity in the amygdala. Single nucleotide polymorphism in the regulatory region of the serotonin type 3 receptor gene had significant modulation effects on the amygdaloid activity in normal subjects. The results indicate that there is a substantial difference in the amygdala activity among normal individuals. The variation in the amygdala responses that is explained by the genetic factors may be related to the variation in the susceptibility for socio-psychological stress. Thus, studies of the human amygdala would greatly contribute to elucidating the neural system that determines emotional and stress responses. To clarify the relevance of neural dysfunction and neuropsychiatric disorders, further studies using physiological, genetic, and hormonal approaches are essential.
References
[1] Iidaka T, et. al., J Cogn Neurosci 13 (2001) 1035-1047 [2] Iidaka T, et. al., J Neurosci 25 (2005) 6460-6466

I9-1
Tangential SX imaging for visualization of fluctuations in toroidal plasmas
S. Ohdachi, K. Toi, G. Fuchs1) and LHD experimental Group.
National Institute for Fusion Science, Toki, Gifu 509-5292, Japan 1)Institut fuer Plasmaphysik, Forschungszentrum Juelich, D--52425, Germany
In magnetically confined fusion devices, the plasma is confined by the nested magnetic surfaces. In order to realize economical fusion reactors, reduction of the strength of the magnetic field is required. However, when the ratio of the plasma pressure to the magnetic pressure decreases,various kinds of instabilities evolve. Among them, magnetohydrodynamics (MHD) instabilities, by which the plasma is deformed macroscopically, are in concern. Especially, non-linear evolutionof them is fairly complicated; further study for the understanding of the non-linear nature and its relation to the transport is needed. Since the perturbations tend to have the equal phase along the field lines, the tangential view, which is almost parallel to the field lines, give a good opportunity to visualize the 2D structure. We have been developing a tangentially viewing soft X-ray camera system[1]. This system is a pinhole camera having a fast framing video camera equipped with scintillator screen for the soft X-ray detection. It can record tangential image with a framing rate up to 20 kHz. We will discuss the various kind of MHD phenomena observed by this camera. Future improvements to study the fluctuations with higher mode number will be also discussed.
References
[1] S. Ohdachi, et.al. Rev. Sci. Instrum. 74 (2003) 2136.
This study is supported by NIFS06ULHH509, the MEXT Grant-in-Aid for Scientific Research (B), 17360446, 2005-. and the IAE TEXTOR agreement(NIFS05KETE001).
O9-2
Monochromatic x-ray imaging and spectroscopy with spatial resolution for ICF experiments
Y. Aglitskiy 1), M. Karasik, V. Serlin, J. Weaver
Plasma Physics Division, Naval Research Laboratory, Washington, DC 20375. (1)Science Applications International Corporation, McLean, VA, 22150
The success of the laser fusion program is critically dependent on our ability to simulate the target performance. We have to rely upon simulations to predict whether or not the target irradiated on a large-scale facility will actually ignite. Therefore, while the large-scale facilities for Inertial Confinement Fusion (ICF) like NIF or LMJ are being constructed, smaller facilities like NRL Nike are used to keep testing and improving the reliability of the codes. They should be fully validated and benchmarked vs. experiment in a single-mode regime. A key component, which made these test experiments possible, is our new powerful diagnostic technique, monochromatic x-ray imaging coupled either to a streak or framing camera. Here we report on our continued development of the x-ray plasma diagnostics based on spherically curved crystals and bent Bragg-Fresnel lenses. The diagnostics are complimentary to each other and include x-ray spectroscopy with 1D spatial resolution and 2D monochromatic self-imaging and backlighting. The system is mostly used, but not limited to the medium range (2 keV) diagnostics of the targets ablatively accelerated by the NRL Nike KrF laser. An enhancement of this technique to the higher (up to 8 keV) and lower (0.6 keV) x-ray energies will be reported. A progress in high energy backlighting and self-imaging has been made in cooperation with LULI, France, LLNL, USA and RAL, UK.
Work supported by the U. S. Department of Energy
O9-3
X-ray spectroscopic diagnostics for laser-imploded core plasmas with high spatial and temporal resolutions
M. Tanabe, H. Nishimura, Y. Inubushi, S. Fujioka, H. Ishimaru, K. Nagai, T. Norimatsu, H. Shiraga, H. Azechi, K. Mima, K.B. Fournier1), M.T. Tobin1), J.F. Davis2), F. Girard3), B.
Villette3), M. Primout3), A. Iwamae4), and A. Sakaue4)
Institute of Laser Engineering, Osaka University, Osaka, Japan 1) Lawrence Livermore National Laboratory, Livermore, CA 94550 USA
2) Alme & Associatess, Los Alamos, NM 87544 USA 3) CEA, DAM, Bruyères le Châtel, France
4) Kyoto University, Kyoto, Japan
For the study of energy transfer and deposition in fast igniter plasma [1], x-ray spectroscopy is an important method to obtain temperature and density profiles of the plasma given as a function of time and space. X-ray shadowgraphy is a standard method to investigate hydrodynamic behavior of laser-driven implosion and density profiles. To generate a blight x-ray source efficiently, laser-driven underdense targets have been suggested [2]: the laser deposits its energy volumetrically so that x-ray emitting ions are exited supersonically and power loss via plasma expansion is diminished. We have made experiments on x-ray generation using low-density, Ti-doped SiO 2 aerogel (6 atom% Ti) targets and GEKKO XII blue laser. Conversion efficiency of 2.3% into Ti-K shell radiation was attained and a propagation velocity of 108 cm/s for the ionization front was observed with an x-ray streak camera, which is ten times faster than the estimated sound velocity for ni = 1019 cm-3 and Te = 1 keV. The latter value was confirmed with the observed x-ray spectra.X-ray spectroscopic observation for self-emitted radiation from the imploded core plasma is also an important diagnostic method. A novel scheme, consisting of a monochromatic x-ray imager [3] and a sampling streak camera [4], has been suggested to obtain time- and space-resolved temperature profiles of the fast igniter plasma. We carried out implosion experiments using Cl-doped plastic shell targets and the x-ray monochromatic sampling camera on the GEKKO XII laser in order to demonstrate the feasibility of this scheme. Details of the experiments and analysis will be discussed.
References
[1] R. Kodama, et al., Nature 418, 933 (2002). [2] K.B. Fournier, et al., Phys. Rev. Lett. 92, 165005 (2004). [3] K. Fujita et al., Rev. Sci. Instrum. 72, 744 (2001). [4] H. Shiraga, et al., Rev. Sci. Instrum. 70, 620 (1999).

O9-4
Research and Development of Imaging Bolometers
B. J. Peterson1), S. Konoshima2), A. Yu. Kostryukov3), N. Ashikawa1), Yi Liu1), H. Parchamy 1), H. Kawashima2), D. C. Seo4), I. V. Miroshnikov3), M. Kaneko1) and the JT-60U Team2)
1 National Institute for Fusion Science, Toki, 509-5292, Japan 2 Japan Atomic Energy Agency, Naka Fusion Institute, Naka, 311-0193, Japan
3 St.Petersburg State Tech. Univ., St.Petersburg, 195251, Russia. 4 National Fusion Research Center, Daejeon, 305-806, Korea
An overview of the research and development of imaging bolometers giving a perspective on the applicability of this diagnostic to a fusion reactor is presented. Traditionally the total power lost from a high temperature, magnetically confined plasma through radiation and neutral particles has been measured using one dimensional arrays of resistive bolometers which utilize the electrical signal resulting from the temperature dependent resistance of a metal grid to measure the change in the temperature of the plasma radiation absorbing foil. The large number of signal wiresassociated with these resistive bolometers poses hazards not only at the vacuum interface, but also in the loss of electrical contacts that has been observed in the presence of fusion reactor levels of neutron flux [1]. Infrared imaging video bolometers (IRVB) [2], on the other hand, use theinfrared radiation from the absorbing metal foil to transfer the signal through the vacuum interface and out from behind a neutron shield. In that sense they represent a reactor relevant alternative tothe resistive bolometer which can provide hundreds of channels of bolometric signal in an image of the plasma radiation. Recently a prototype IRVB [3,4] has been deployed on the JT-60Utokamak which demonstrates the ability of this diagnostic to operate in a reactor environment. Video of the plasma radiation from the imaging bolometer on JT-60U will be shown along with plans for an upgrade of this diagnostic to better demonstrate its reactor relevance. In addition,recent work related to the IRVB in calibration, tomography, new detector foil development and applications to other fusion devices will be briefly reviewed.
References
[1] T. Nishitani et al, Fusion Eng. Des. 63-64, 437 (2002). [2] B. J Peterson, A. Yu. Kostryukov, et al., Rev. Sci. Instrum. 74, 2040 (2003). [3] S. Konoshima et al., 32nd EPS CPPCF, ECA Vol. 29C, P-4.092 (2005). [4] B.J.Peterson et al, to be published in J. Nucl. Mater.
This research is supported by MEXT grants # 16560729 and #16082207.

I10-1
Farewell cover slip: Light-sheet based microscopy (SPIM) fosters a modern approach to three-dimensional cell biology
Ernst H.K. Stelzer, Philipp Keller, Klaus Greger and Francesco Pampaloni
Cell Biology & Biophysics Unit (CBBU) European Molecular Biology Laboratory (EMBL) Meyerhofstrasse 1, D-69117 Heidelberg, Germany
Models relying on “Petri-dish based” 2D cellular assays seem to be inadequate in predicting thebehaviour of cells in tissues. They have often failed to provide clinically relevant infor-mation.This suggests that some essential cellular parameters are not captured by 2D assays. Certainly, onemissing link coupling individual cells to a tissue’s function is the cellular con-text. In a 2D culture,cells are grown under conditions poorly reproducing the three-dimensional architecture,biochemical specificity, and cell-cell communication mechanisms of tissues. On the other hand,three-dimensional cell biology has shown that gels mimicking the extra-cellular matrix inducecells to reproduce aspects of their native function in tissues. We suggest that a combination ofthree-dimensional sample preparation and dynamic three-dimensional observation, that we call3D2 (3D squared) improves the repeatability, the inter-nal consistency, and the physiologicalrelevance of cell-based assays, fostering cell biology to become a quantitative science. Bythree-dimensional we refer to experimental conditions that essentially avoid hard and flat surfacesand hence favour less constrained physiological sam-ple dynamics [1]. We suggest thatlight-sheet-based microscopes are particularly well suited for studies of sensitivethree-dimensional biological systems. The application of such in-struments can be illustrated withexamples from the biophysics of microtubule dynamics and the distinctly different behaviour ofthree-dimensional cell cultures. A new implementation of the theta principle [2] takes advantageof parallel recording. This high-resolution light mi-croscope [3] has been developed for themodern life sciences. It is designed to generate im-ages of large samples (embryos,three-dimensional cell cultures) down to the sub-cellular level. The fundamental principle ofEMBL’s Single Plane Illumination Microscope (SPIM) is the detection of fluorescence lightperpendicular to the illumination axis. The illumination system provides the excitation light alongthe side of an object and hence excites fluoropho-res within an entire plane. The illuminating lightsheet overlaps with the focal plane of a de-tection system that consists of a long working distancelens and a high-performance camera. SPIMaging provides optical sectioning directly.Photo-bleaching outside the thin volume of interest is completely avoided. The photo-toxicity ofthe illumination process is thus dra-matically reduced. Since a SPIM performs well with longworking distance lenses and has a good penetration depth, millimetre-sized specimens can beobserved in their entirety and as a function of time. To further increase the resolution and theinformation content of a data stack, rotation of the specimen adapts the excitation and detectionaxes to the sample. Parts of the sample that would otherwise be hidden or obscured becomeaccessible. Data stacks recorded along different angles can be combined in post-processing stepsto yield high-resolution images [4, 5]. The three-dimensional resolution is then dominated by thelateral resolution and becomes isotropic, i.e. identical, along all directions. Since the SPIMagingprocess provides for an excellent signal to noise ratio deconvolution and many other imagesprocessing procedures work extremely well [6]. During the past years various different spe-cies(mice, zebra fish, medaka, drosophila, yeast, …) were observed with our new micro-scopes.
References
[1] P. J. Keller, F. Pampaloni, E. H. K. Stelzer (2006) Life sciences require the thirddimension, Current Opin-ion in Cell Biology 18,117–124.
[2] E. H. K. Stelzer, S. Lindek (1994) Fundamental reduction of the observation volume in far-field light mi-croscopy by detection orthogonal to the illumination axis: confocal theta microscopy, Opt. Comm., 111, 536.
[3] J. Huisken, J. Swoger, F. Del Bene, J. Wittbrodt and E. H. K. Stelzer (2004) Optical Sectioning Deep Inside Live Embryos by Selective Plane Illumination Microscopy, Science 305, 1007.
[4] J. Swoger, J. Huisken, E. H. K. Stelzer (2003) Multiple imaging axis microscopy improves resolution for thick-sample applications, Opt Lett 28, 1654.
[5] C. J. Engelbrecht, E. H. K. Stelzer (2006) Resolution enhancement in a light-sheet-based microscope (SPIM), Opt Lett 31, 1477.
[6] Peter J. Verveer, Jim Swoger, Francesco Pampaloni, Klaus Greger1 & Ernst H. K. Stelzer, submitted, 2006.

I10-2
Imaging of cell functions using by bioluminescence probes
Yoshihiro Ohmiya1),2)
1)Hokkaido University, Graduate School of Medicine, Division of Molecular/Cellular Imaging, Sapporo, Hokkaido 060-8638, Japan, 2)National Institute of AIST, Research Institute for Cell
Engineering, Cell Dynamics Research Group, Ikeda, Osaka 563-8577, Japan
In the post genome era, molecular imaging is an essential approach to understanding the physiological system of the whole animal. The fact that bioluminescent probes based on luciferasetechnology utilize both natural and quantitative light energy in comparison with fluorescent probes such as GFP has resulted in their ability to visualize the molecular diversity of genes and proteins in living cells. We have created new luciferase technologies based on the novel bioluminescencesystem. In this presentation, I introduce our work as an example: Using beetle luciferases that emitvarious colors with a luciferin, we developed a revolutionary tricolor reporter in vitro assay system in which three gene expressions are monitored simultaneously using green-, orange- and red-emitting beetle luciferases. We used this novel system to analyze biological clock mechanismsthat are generated by the extremely complicated transcription-translation feedback loop of clock genes, and successfully monitored simultaneously three gene transcriptions in the living cells. Tofurther verify the applicability of this system, we used it in the development of tools for monitoring biological events in a single living cell. With the combination of the cooled CCDcamera, we can visualize the motion of organelles in the single living cell for several days. Thissystem could be utilized for detailed analysis in the new fields of transcriptome and promoterome, as well as in pharmacology or toxicology for the screening of new drugs or the detection of harmful chemicals.
References
[1] Yamagishi K, Enomoto T, Ohmiya Y, Anal Biochemi 354(2006)15-21. [2] Ohmiya Y, JJAP 22(2005) 1543-5. [3] Nakajima Y, Kimura T, Sugata K, Enomoto T, Asakawa T, Kubota H, Ikeda M and Ohmiya Y, Biotechniques 38 (2005) 891-894
This study is partially sponsored by NEDO (Dynamic Biology Project).

I10-3
In vivo Functional Imaging of Neural Cell and Secretory Gland Cell by Near-infrared Ultra-short Pulse Laser Light
Tomomi Nemoto1)
1) National Institute for Physiological Science, National Institutes of NaturalSciences,Okazaki,Aichi 444-8585, Japan
A molecule can transit with an extremely low probability from the ground state to the firstelectronically-excited one by simultaneous absorption of multiple photons. Such process is calledas multi-photon excitation process. A new optical microscopy based on such multi-photonexcitation process (“two-photon microscopy”) has been used widely in biological and medicalsciences, because two-photon microscopy can visualize living cells in near intact states for a longtime within deeper layers of organs. Such extremely low probability of two-photon excitationcauses a property that pigments are excited and fluorescence is generated only at the focal point ofthe objective lens. This is because it is at the focal point where the laser photon density ismaximized. Recently, we have recently succeeded in observing intact neurons deeper than 0.9 mmfrom the surface of the brain cortex in an anesthetized mouse. In the same preparation, we candetermine morphologically dendritic spines and axon terminals, suggesting that their long-termchanges can be chased in a living mouse. By another attractive property of two-photonmicroscopy, multicolor excitation capability, we have established a less-invasive imaging methodfor quantifying intracellular Ca2+, and simultaneously visualizing fluid transports and a single episode of fusion pore opening during exocytosis[1-3]. In pancreatic acinar cells, we have found a sequential compound exocyotsis for the first time. Sequential compound exocyotsis has been found in many kinds of secretory glands including salivary glands. Further exploration revealed dynamics and physiological roles of actin cytoskeleton[4], fusion-pores, and SNARE proteins. Furthermore, we have succeeded in visualizing calcium-dependent water and electrolyte transport in nasal mucosal epithelial and salivary glands, and these may be used as an assay system for allergic rhinitis. As discussed above, this extremely rare quantum mechanical process results in extremely localized excitation (< 10-15 L). By applying such localized two-photon excitation for photolysis of caged Ca2+ compund, we have achieved functional mapping of ion channels involved in water and electrolyte transport in pancreatic acinar cells. Because fluid transport is a general function of the exocrine gland, this technique may be applicable to various physiological and pathological studies. Two-photon microscopy will therefore advance the researches on mechanisms of exocytosis and fluid secretion in secretory cells in intact glands in vivo.
References
[1] T. Nemoto,et.al., Nature Cell Biol, 253-258 (2001) 3 [2] N. Takahashi,et.al., Science, 1349-52 (2002)297 [3] T. Kishimoto, et. al., EMBO J, 673-82 (2006) 25 [4] T. Nemoto, et.al., J Biol Cell, 37544-37550 (2004) 279
I would like to acknowledge Prof, Junichi Nabekura and Dr. Hiroaki Wake in NIPS for collaborative work of in vivo two-photon microscopic analysis on linving mouse brain cortex.

I10-4
Symmetry break in developmentmental biology: Left-right determination.
Shigenori Nonaka
National Institute for Basic Biology, Okazaki, Aichi 444-8585, Japan
Human body is highly asymmetric in organ arrangement along left-right axis regardless of superficial symmetry. Certain relationship between this asymmetry (L-R asymmetry) and cilia, small hairs of micrometer length protruding from cells, had been suggested for decades but the actual mechanism had remained unknown. We found that cilia on a patch on the surface of mouse early embryo, called “the node”, move inclockwise manner and generate fluid flow from the right to the left, named “nodal flow”. In amutant strain we produced, lack of the cilia and randomization of L-R asymmetry coincided [1].Thus we developed a device to culture mouse embryos under artificially reversed nodal flow toexamine its significance. This device effectively reversed their L-R asymmetry [2]. Then we further approached to a question why sum of clockwise rotations by the cilia can produce leftward flow rather than a big vortex. We found that the rotations have actually posterior tilt by intensive observations of the embryos, and such tilt can produce leftward flow by mechanical fluid model experiments [3]. Overall, our studies addressed the earliest step of L-R asymmetry determination in mammalian development, in other words, expansion of molecular chirality to the body level.
References
[1] S. Nonaka et al., Cell, 95 (1998) 829-837 [2] S. Nonaka et al., Nature, 418 (2002) 96-99 [3] S. Nonaka et al., PLoS Biol., 3 (2005) 1467-1472
O11-1
Infrared magneto-optical imaging on an organic conductor by means of synchrotron radiation
S. Kimura1,2), T. Nishi2), T. Takahashi3), H.J. Im2), Y.S. Kwon4), T. Ito1,2), K. Miyagawa5), H. Taniguchi6), A. Kawamoto7) and K. Kanoda5)
1)UVSOR Facility, Institute for Molecular Science, Okazaki 444-8585, Japan 2)School of Physical Sciences, The Graduate University for Advanced Studies (SOKENDAI),
Okazaki 444-8585, Japan 3)Research Reactor Institute, Kyoto University, Osaka 590-049, Japan
4)Department of Physics, Sungkyunkwan University, Suwon 440-746, Korea 5)Department of Applied Physics, The University of Tokyo, Hongo, Bunkyo-ku, Tokyo 113-8656,
and CREST, JST, Kawaguchi Saitama 332-0012, Japan 6)Department of Physics, Saitama University, Saitama 338-857, Japan
7)Department of Physics, Hokkaido University, Sapporo 060-0810, Japan
Infrared (IR) and far-infrared (terahertz, THz) spectroscopy is a powerful tool to investigatechemical bonding of organic materials and electrodynamics of solids. The experiments are usuallyperformed by using commercial FTIR spectrometers. However, the performance (the spatialresolution, wavenumber range and so on) is poor. High brilliant synchrotron radiation (SR) in theIR–THz region is a suitable light source to break the experimental limit of the conventionalsystemsand to produce new measurement methodology. Up to now, we have constructed two IR beamlines in Japan; one is BL43IR at SPring-8 and theother BL6B at UVSOR-II, Institute for Molecular Science. The former is used for a high spatialresolution spectroscopy of materials mainly in the mid-IR region. On the other hand, the lattergives the highest photon flux from SR in the world to cover down to the sub-THz region. Usingthese properties, we have performed some advanced spectroscopies in the IR–THz region. In thistalk, we present the infrared magneto-optical imaging on an organic conductor. The 50-% deuterated &kappa-(ET)2Cu[N(CN)2]Br in fast cooling conditions, which is just on the Mott boundary, indicates a superconductor (SC) - insulator (I) transition due to a magnetic field. The origin has been believed to be the phase separation of SC and I phases induced by a magnetic field but no direct observation has been performed. Then the magnetic field-induced SC-I transition was observed using the IRMO imaging technique. The infrared reflectivity image on the sample surface revealed that the metallic (or superconducting) and insulating phases coexist in contrast to the monochromatic metallic character in the slow cooling condition and they have different magnetic field dependences.

O11-2
Atacama Large Millimeter/Submillimeter Array ALMA
T. Hasegawa

O11-3
Imaging Technique of Radio Interferometers
K.-I. Morita
National Astronomical Observatory Japan
Radio interferometers for astronomical observations are indirect imaging devices. It directlymeasures spatial coherence function (visibility) of astronomical objects (brightness distribution).If we obtaine complete samples of the coherence function, then, we can easily estimate astronomical images by direct Fourier inversion. However, we only measure the visibility forlimited range of spatial frequency. Measured visibility often include some errors in amplitude orphase. Sometimes, imaging field of view is smaller than spaitial size of astronomical objects dueto main beam width limitation of each element antenna. For these problems, many kinds ofimaging techniques from design of instruments to data processing have been developed.
This paper reviews these techniques and shows how we apply those in design of Atacama Large Millimeter / Submillimeter Array (ALMA), which is being constructed in Northern Chile by National Astronomical Observatory Japan (NAOJ) with international collaboration.
O11-4
Multi-wavelength Imaging of Solar Plasma
K. Shibasaki
Nobeyama Solar Radio Observatory, Minamisaku, Nagano 384-1305, Japan
Solar atmosphere is filled with plasma and magnetic field. Activities in the atmosphere are due toinstabilities of the manetized plasma. To understand the physical mechanisms of activities /instabilities, it is necessary to know the physical conditions of magnetized plasma, such as temperature, density, magnetic field, their spatial structures and temporal developments. Remotesensing technique is necessary to measure physical parameters of solar atmosphere from the Earth.Multi-wavelength imaging is essential for this purpose. Imaging observations of the Sun atmicrowave (Nobeyama Radioheliograph), X-ray (GOES/SXI telescope), EUV (SOHO/EIT telescope, TRACE satellite) and optical (SOHO/MDI telescope and many ground based optical telescopes) are routinely going on. Due to free exchange of original data among solar physics andrelated field communities, we can easily combine images covering wide range of spectrum. By thecombination, we can get physical pictures of solar plasma and magnetic field at various location and temperature range.
The current standard model of solar activities is based on magnetic reconnections: release of stored energy in the form of magnetic field by reconnection causes various active phenomena on the Sun such as solar flares. However, recent X-ray, EUV and microwave observations with highspatial and temporal resolution show that dense plasma is involved in activities from the beginning. Based on these observations, I have been proposing high-beta scenario of solaractivities. This mechanism is very similar to high-beta disruptions in magnetically confined fusionexperiments such as TOKAMAKs. Magnetic field in the solar atmosphere is convex outwards andthis configuration is unstable when the loop is filled with high pressure plasma or high velocity flow along the loop.
Movies of solar flares at various wavelengths will be presented and the necessity of high-beta interpretation to understand solar activities will be shown.
O11-5
Carbon redeposition on tungsten under high-flux,low-energy ion irradiation at elevated temperatures
L.Pranevicius1), C.Templier2), L.L.Pranevicius1,3), D.Milcius3)
1)Vytautas Magnus University,44248, Kaunas, Lithuania 2)Universite de Poitiers, B.P. 179, 86960 Futuroscope, France
3)Lithuanian Energy Institute, 44403, Kaunas, Lithuania
This work concentrates on the studies of the anomalous deep penetration of C in W observed under high-flux (1017-1019 cm-2s-1) of 0.5 –1.0 keV ion bombardment at various temperatures, upto 1073 K. A carbon amount ranging from 0.5-10at% was deliberately introduced into anhydrogen ion beam as ions like CHx
+ and C2H4+ to study the formation of W and C mixed layers.
Using weight loss experiments, the carbon amount was measured after successive fluence steps ofabout 2·1017 cm-2 each. Surface atomic compositions were analyzed by X-ray photoelectronicspectroscopy. For profiling, the etching depth was measured with a surface profile-scanningtechnique. X-ray diffraction measurements were performed using characteristics X-rays from Cu(Cu KΑ). The samples were fabricated in the following way: 2 µm-thick tungsten films were deposited onstainless steel (AISI 304) substrates 20x5x0.2 mm3 in size using a magnetron sputter deposition technique. The XRD patterns of as-deposited W films demonstrated a nanocrystalline microstructure with the mean size of crystallites around 45 nm and characteristic peaks of c-W(200) at 35.5° and c-W(210) at 39.9°. The surface coverage of carbon atoms as a functionof carbon ion concentration in ion beam was studied. The C profiles in W demonstrate that up to 700K the C penetration depth does not exceed 30 nm and does not depend on the surface coverage by C atoms. As the temperature exceeds 700K, the efficiency of carbon transport from the surface in to the bulk starts to depend on the surface coverage of W by C atoms. Two cases can be distinguished: (i) when the W surface is completely covered by C atoms, the experimental distribution C profiles in W are in agreement with modeling results considering the balance equations including deposition, surface erosion and diffusion; (ii) when W surface is partially covered by C adatoms, anomalous deep C penetration depths in W have been registered. There is evidence that dynamic state of surface creates a quite imperfect near-surface layer. This layer is both physically and chemically distinct from the bulk material. In this way differences in chemical potentials between ions irradiation surface, bulk and grain boundaries are established. The excesschemical potential of the surface relative to grain boundaries produces a net flow of adatoms into the grain boundaries and generates compressive stress. It explains the deep tails of C penetrating nanocrystaline in W at elevated temperatures. The continuous amorphous C film on W blocks the access of activated C adatoms to grain boundaries.
O11-6
Multi-functional Diagnostic Method with Tracer-encapsulated Pellet Injection
S. Sudo1, 2), N. Tamura1), D.V. Kalinina1), K. Sato1, 2), E. Veshchev2), H. Funaba1), S. Inagaki1), P.R. Goncharov1), T. Ozaki1, 2), S. Mutoh1), Y. Igitkhanov3), D. Stutman4), M. Finkenthal4) and
LHD Experimental Group1)
1) National Institute for Fusion Science, Toki, Gifu 509-52922 Japan 2) Graduate Univ. Advanced Studies, Hayama 240-0193 Japan
3) Max Planck Institut fuer Plasma Physik, Greifswald, D-17491 Germany 4) Johns Hopkins University, Baltimore, MD 21218 USA
In recent years magnetic plasma confinement experiments for fusion energy have been well developed. The physical mechanisms of the particle and heat transport, however, are not yet well understood, although the knowledge about the transport will seriously affect the design of a reactor. Conventional techniques such as impurity pellet injection or laser blow-off method are not well suited for the local measurement because the impurity source profile becomes rather broad. Considering such present status, we developed a Tracer-Encapsulated Solid PELlet (TESPEL) for local transport study on the Large Helical Device (LHD). It is one of the simplest ideas to study the confinement of impurities and other plasma properties. A TESPEL consists of polystyrene polymer as an outer shell, the diameter of which ranges from 0.3 to 0.9 mm, and tracer particles as an inner core. The special features of this method are: (a) local deposition inside the plasma, (b) the deposited amount of the tracer in the plasma can be known precisely, (c) relatively wide selection of tracer material is possible. From the experience of developing the TESPEL production technique and injection experiments, it is found out that the TESPEL technique has a multi-functional diagnostic capability. This is essentially due to the flexibility of pellet size and wide selection of tracer material. The features of this TESPEL injection technique are: (a) to study impurity transport properties such as diffusion coefficient D and inward pinch velocity V with the temporal evolution of line emissions from the tracer particles measured by a soft x-ray pulse height analyzer and a vacuum ultraviolet spectrometer, respectively, (b) to investigate the temperature increase of the core plasma in case of a relatively small pellet injection, which is probably caused by a steep temperature gradient production in the edge region, (c) to observe heat diffusivity from the cold pulse propagation due to TESPEL injection, (d) to observe the difference in the transport property at the locations inside the magnetic island and outside of that, (e) to observe energy distribution of high energy particles with using charge exchange process in the pellet cloud together with the information about the cloud density of TESPEL obtained from the Stark broadening of a Hydrogen line in the ablation cloud, (f) to observe local transport property with light emission due to the charge exchange recombination of tracer particles with a heating neutral beam, and (g) to observe detailed line emissions from the various atoms under the relevant plasma condition. Furthermore, a Tracer-Encapsulated Cryogenic PELlet (TECPEL) has been also developed. This has an advantage in absence of carbon in the outer layer of the pellet. The TECPEL injector was already installed at LHD in the end of 2005, and the preliminary pellet injection experiments were done.


Poster Session 1(plasma)Categories 5, 7, 8, 13


P5-01
Electron Temperature Measurement And Study Of Istabilities And Sawtooth Behavior In IR-T1 Tokamak By E.C.E Diagnostic
M.Ghoranneviss, R.Shariatzadeh
Plasma Physics Reaserch Center,Islamic Azad University,Tehran,Iran
A suitable instrument for electron temperature measurement in tokamak is electron cyclotron emission(E.C.E) diagnostic.For measurement of this paremeter in IR-T1 tokamak heterodyne radiometer was used.this 5 channel system works in Kα-band and has a very fast response time and good resolution freguency for IR-T1 tokamak with R=45cm, a=12.5cm, Bt=0.6-0.8T, IP=20-40KA. This receiver was used outside the tokamak in horizontal and vertical direction to Bt,and with second harmonic Of X-mode,and electron temperature was measured. Also, instability and sawtooth behaviore in diagrams were observed,when plasma current is reached to certain value,and their characteristics according to E.C.E channel region with respect to plasma center and plasma edge was studied. And also effects of Bt,BΘ,RHF and gas pressure on electron temperature and sawtooth behavior have been studied. Details of results will be discuss in the full paper.

P5-02
Effects of relativistic and absorption on ECE spectra in high temperature tokamak plasma
M. Sato and A. Isayama
Japan Atomic Energy Agency, Naka Fusion Institute, Naka, Ibaraki, 311-0193, Japan
The importance of a relativistic frequency downshift effect on electron cyclotron emission (ECE) in high temperature plasma is well recognized since the relativistic effects modify the relation between the frequency and the spatial position. Before evaluating the total ECE radiation, the study of ECE spectra characteristic in various sight line of observation is important. For the measurement of electron temperature profile (Te(r)), the 2nd harmonic extraordinary mode of ECE in a tokamak is usually observed in perpendicular to the magnetic field (Bt) along the equatorial plane. When the angle between the observation sight line and the equatorial plane is increased or the angle between the sight line and the Bt is changed, the characteristics of the ECE spectra are changed by the effects of relativistic and absorption. The characteristics are also changed by the distribution function. The characteristic of ECE spectra on various sight line of observation in the tokamak has been studied in detail. We consider the features in the ECE spectra that are different from the normal Te(r) measurement that the sight line is perpendicular to Bt from low field side in the equatorial plane in tokamak. When the angle between the observation sight line and the equatorial plane is increased, the overlapping region between 2nd and 3rd harmonics shrinks and the relativistic effect of only one harmonics will be revealed. We consider the dependence of ECE spectra on the electron density (ne) in the case of the vertical sight line. The radiation is observed from only one resonance frequency region. For low ne case, the ECE spectra are similar to the shape of emissivity. That is, the 3rd harmonic ECE increases with frequency slowly at the just higher 2nd harmonic non-relativistic EC frequency (2fce
0) and decreases with the frequency rapidly at the just lower 3rd harmonic non-relativistic frequency (3fce
0). When the ne increases, the 3rd harmonic ECE on increases with frequency rapidly at the just higher 2fce
0, and decreases with the frequency slowly at the just lower 3fce
0. The high optical thickness due to the high ne results in these features. Next, in the case of the observation from the high field side in the equatorial plane, the relativistic effects reveals strongly compared with the observation from the low field side. The ECE shifts to the lower frequency by the relativistic effect. There is the overlapping region of frequency between 3fce
0 at the outer side of periphery and 2fce0 at the inner side of periphery. The emission
is absorbed at the overlapping region, and emission decrease. The combination between the relativistic and absorption effects results in the peak near the overlapping region. We will present the feature of ECE spectra in the case of oblique propagation to Bt.
P5-03
Suprathermal electron distribution diagnostic for SST-1 tokamak
Surya K. Pathak
Millimeter Wave Group Institute for Plasma Research, Bhat
Gandhinagar 382428, INDIA [email protected]
The interaction of high power microwaves with plasma, create non-Maxwellian high-energy electrons known as suprathermal electrons, results in parallel velocity as well as perpendicular velocity diffusion which competes with the collisional relaxation mechanism of the plasma, so that evolution of space averaged electrons distribution is governed, which describes both parallel and perpendicular velocity redistribution. These suprathermal electrons and its distributions are effectively collisionless and are especially interesting for the study of anomalous transport in thermonuclear plasmas, since neoclassical transport relies on collisions. The theories for the anomalous transport are based on microturbulence, of either electrostatics or magnetic origin. Probing of the microstructure of the magnetic field is possible because these electrons are virtually collisionless from certain energies onward and therefore follow the field lines. A suprathermal electron distribution diagnostic has been conceived and designed, using an ellipsoidal mirror, a plane mirror & broadband microwave corrugated waveguide, as wave collection and transport system, and a fast-scanning polarizing Michelson interferometer, which is capable of viewing the plasma vertically (constant magnetic field, Bf) along a chord having magnetic field 3.22 tesla and terminated by a highly absorptive SiC view dump. Both Extraordinary (X) mode and Ordinary (O) mode polarizations of Electron Cyclotron Emission(ECE) at optically thin harmonics will be collected under a variety of plasma conditions, during high power microwave injection (for example, lower hybrid current drive, LHCD) in theupcoming SST-1 Tokamak. A simplified theoretical model has been developed for the signal estimation by considering single particle emissivity and drifted Maxwellian distribution function during LHCD. The intensity distribution as a function of frequency of ECE at several harmonics for different parameters of suprathermal electrons having: temperature 50 - 500 KeV, density 0.1 to 10% of bulk electrons, magnetic field 1.5 to 3.5 tesla and different phase velocities of LHCD system have been computed. Analysis consisted of putting a variety of distribution functions into developed ECE code. The quasi-optical systems, using mirrors and corrugated waveguide as a wave collection and transport it through the interferometer (which will scan 100-1000 GHz spectrums) to the detector, have been designed using the concept of Gaussian beam optics in order to produce a system that is efficient over the entire spectral range.

P5-04
Protection Filters in ECEI Systems for Plasma Diagnostics
Z. Shen1), N. Ito2), C. W. Domier1), N. C. Luhmann, Jr.1), , A. Mase2), E. Sakata3)
1)Department of Electrical and Computer Engineering, UC Davis, USA 2)Art, Science and Technology Center for Cooperative Research, Kyushu University, Japan
3)Kyushu Hitachi Maxell, Ltd, Japan
For plasma diagnostic imaging systems such as the electron cyclotron emission imaging (ECEI) system, spurious rf heating power may saturate or even damage the mixer arrays. Withoutprotection, the sensitivity of the mixers can significantly decrease or in the extreme case, the diodes can even be burnt. A metallic dichroic plate is usually used to rejection the spurious rf heating power. However, as a low pass filter, the dichroic plate can not be used when the frequency of the heating power is in the middle of the frequency range of interest. Consequently, a frequency selective surface (FSS) has been introduced as a planar filter in ECEI systems. FSSs can work as low pass, high pass, and band stop filters according to the various system requirements. Also, as a thin, light, planar filter, it is very easy to mount in imaging systems. This paper willfocus on the design and fabrication of the FSS notch filter applied in TEXTOR, which is used to protect the imaging array from stray 140 GHz ECRH power. The filter is used in TEXTOR due to its deep rejection, and excellent angle insensitivity. The design procedure will be presented. The new fabrication technique Electro Fine Forming technology (EF2) will also be introduced. FSS filters in the millimeter wave range also have possible applications in imaging systems in other fusion machines such as KSTAR, DIIID, and LHD.

P5-05
Imaging meso-scale structures in TEXTOR
I.G.J. Classen1), R.J.E. Jaspers1), H.K. Park2), G.W. Spakman1), C.W. Domier3), A.J.H. Donne1), N.C. Luhmann Jr3), E.Westerhof1) and the TEXTOR team 4)
1) FOM Institute for Plasma Physics Rijnhuizen, Association Euratom-FOM, Partner in the Trilateral Euregio ClusterNieuwegein, Netherlands
2) Princeton Plasma Physics Laboratory, Princeton, New Jersey, U.S.A 3) University of California at Davis, Dept. of Applied Science, Davis, California, U.S.A
4) Forschungszentrum Jülich, Institut für Plasmaphysik, Association EURATOM-FZJ, Partner inthe Trilateral Euregio Cluster, D-52425 Jülich,Germany
The detection and control of instabilities in a tokamak is and will continue to be one of the exciting challenges in fusion research on the way to a reactor, as will be the understanding of these mechanisms. Thanks to a combination of an innovative 2D temperature imaging technique, the ECE-Imaging (ECEI) system, a versatile ECRH/ECCD system and a unique possibility to externally induce tearing modes in the plasma, TEXTOR is able to make pioneering contributions in this field. Whereas previously the strength of the ECEI system in unraveling the sawtooth physics has been demonstrated, this paper focuses on three other meso-scale phenomena in tokamaks: m=2 tearing modes, ELM events and structures in the stochastic boundary. In all cases the 2D-ECEI diagnostic can resolve features not attainable before, allowing a direct comparison with theory.
Tearing modes can be induced externally at TEXTOR by the Dynamic Ergodic Divertor (DED). Operation of the DED at sufficiently high current will excite an m/n=2/1 tearing mode. The suppression of these with the ECRH/ECCD system has contributed to a deeper insight in the relevant processes. With the ECEI data the m=2 island evolution can be visualized. From this it is concluded that heating rather than current drive is responsible for the stabilization in these experiments.
If the DED system is operated at another mode configuration, only the plasma edge is affected by the perturbation fields. In that case temperature structures appear on ECEI at the very edge, mainly determined by the connection length in the laminar zone. The lower edge temperature during DED confirm the enhanced transport levels due to the perturbation field.
One possible application of the stochastisation of the edge by the DED could be the mitigation ofELM’s. Recently experiments are performed to access the H-mode in TEXTOR, revealingELM-like events. Although temperature information of these instabilities are partly obscured bydensity related effects, ECEI can provide valuable information on the ELM’s.

P5-06
Development of ECE Imaging System on LHD
Y.Kogi, T.Sakoda, A.Mase, N.Ito S.Yamaguchi1), Y.Nagayama1), K.Kawahata1)
Art,Science and Technology Center for Cooperative Reserch, Kyushu University Kasuga, Fukuoka 816-8580, Japan
1)National Institute for Fusion Science, Toki, Gifu 509-5292, Japan
It is considered to be one of the major issues to clarify the behavior of various instabilities and relations between instabilities and plasma confinement. ECE imaging (ECEI) is a promising method to measure electron-temperature profile and its fluctuations precisely. An ECEI system is composed of a detector array, quasi-optical system, and IF system. Each subsystem plays following roles. The optical system is composed of optical mirrors and dielectric lens. These optics are utilized to focus ECE from plasma on the detector array within the specific bandwidth. In the present plan of the beginning experiment, we will collect the fundamental component of ECE with frequency range from 70 to 76 GHz. The ECE is then received by the detector array, and is frequency-converted to IF signal by means of LO wave. In the IF system, signal is then fed to power dividers and bandpass filters to resolve radial temperature distribution, since the frequency of ECE is proportional to magnetic field strength. While poloidal and toroidal temperature distribution is obtained by 2D arrangement of the ECE detector, since the signal obtained by each detector element is corresponding to individual poloidal and troidal measurement point. The filtered IF signals are then detected by squared detection, and digitized by A/D converters. By utilizing the detector array and the IF system, measurement of 3D temperature distribution can be achieved. Our research has dedicated to develop high-performance ECE detector array and the IF system on a dielectric substrate by means of microwave integrated circuit (MIC) technology for measurement of precise electron temperature distribution. In the recent experimental cycle of LHD, we have confirmed that the signals which are proportional to electron temperature have been obtained by using prototype 3 by 1 detector array and the IF system. In the conference, we will present details of these measurement and the system and more multi-channel plan which will be utilized in the next experimental cycle on LHD.

P5-07
Improvements of CO2 laser heterodyne imaging interferometer for density profile measurements on LHD
K.Tanaka, C.Michael, L.N.Vyacheslavov1), A.Sanin1), K.Kawahata, S.Okajima2), T.Akiyama, T.Tokuzawa, Y.Ito
National Institute for Fusion Science, Toki, 509-5952,Japan 1) Budkar Institute of Nuclear Physics, Budker Institute of Nuclear Physics, 630090, Novosibirsk,
RUSSIA 2) Chubu University, , Kasugai 487-8501, Japan
After installation of CO2 laser (wavelength 10.6 μm) heterodyne imaging interferometer (CO2 HI) in 2001, continuous developments were done to improve capability and stability of the operation. The CO2 HI works without phase jumping at high density (>1x10 20m -3),where the existing farinfrared laser (wavelength 118.9μm) interferometer suffers from phase jumping due to thereduction of signal intensity caused by refraction. However the second interferometer is requiredto compensate mechanical vibration. A Yag laser (wavelength 1.06 μm) heterodyne imaginginterferometer are presently used for the vibration compensation. Frequency drifts of YAG lasermade vibration compensation unreliable and sometimes caused phase run away effects. In order tosolve this problem, the path length of probe beam and local beam was equalized, and then phasedrifting was eliminated under frequency shifting. The feedback control of pellet injection becamepossible by this improvement. Three imaging optics will be installed in 10th experimentalcampaign in 2006~2007. The whole region of the plasma cross section are covered with three slabbeams. Two 32 ch and one 16ch HgCdTe photoconductive detector (total 80ch) will be used andchord separation 7.5mm~15mm. Image of integrated line density are measured from imagingoptics. Imaging optics consists of combination of parabolic mirrors and spherical lenses. Thespherical aberration was minimized by the adjusting the distance of these optics. It was foundcross talk of signal deforms measured image. This was reduced by the use of lower heterodynebeating frequency and completely eliminated by the modification of elements structure.

P5-08
Two dimensional phase contrast imaging of micro-turbulence in LHD
C.A. Michael, K. Tanaka, L. Vyacheslavov1), A. Sanin1), K. Kawahata, S. Okajima2)
National Institute for Fusion Science, Toki, Gifu 509-5292, Japan 1) Budker Institute for Nuclear physics, Novosibirsk, Russia
2) Chubu University, Kasugai 487-8501, Japan
Phase contrast imaging, a well-established technique to image phase differences within an object, is employed on LHD to measure the spatial structure of plasma density fluctuations. The novelaspect of the diagnostic is the use of 2D imaging, which delivers spatial resolution along the line of sight, providing tremendous advantage in physical interpretation. Similar systems on otherfusion devices have used only 1D imaging can therefore only provide longitudinal spatial resolution either time-multiplexed or in different shots. Concomitantly, a novel analysis methodhas been developed. The images are processed using correlation techniques and maximum entropy power spectrum estimation, to aid in improving the spatial resolution and reducing artifacts. A CO2 laser (λ=10.6μm) is injected as a probing beam vertically in a near-poloidal cross-sectionalplane, passing close the the magnetic axis. A two dimensional image of the beam (size 87x30mm)is captured using a 6x8 detector array, in the toroidal and major radial directions respectively. Thepropagation direction of fluctuations within this image is used to provide localization along theline of sight, on the well-established basis that fluctuations are filamentary structures along fieldlines, and the fact that the variation of the magnetic pitch angle, within the image, is large acrossthe line of sight (~80°). The attained radial resolution better than ~0.05 of the minor radius, andthe measurable fluctuation wave numbers (k) are in the region 0.1<k<3mm-1. A flexible optical system has been designed to adjust the measurable range of k. Radial profiles of the fluctuation phase velocity are computed, which may help to classify the physical nature of the instabilities (e.g. TEM or ITG). The fluctuating component of the (spatiallyaveraged) phase velocity can also be extracted, valuable for assessing electromagnetic component of the fluctuations, as well as provide an upper bound on the anomalous particle flux.
P5-09
Instrumental capabilities and limitations of two-dimensional phase contrast imaging on LHD
L.N.Vyacheslavov1), K.Tanaka, C.Michael, A.Sanin1), K.Kawahata, S.Okajima2)
National Institute for Fusion Science, Toki, 509-5952,Japan 1) Budker Institute of Nuclear Physics, 630090, Novosibirsk, RUSSIA
2) Chubu University, Kasugai 487-8501, Japan
A novel phase contrast imaging is employed for diagnostics of plasma density fluctuations on LHD. With the use of two dimensional 48ch (6x8) detector array and CO2 laser probe beam this technique permits observation of radial profiles of density fluctuation during single discharge either within entire plasma diameter in overview mode or within some fraction of the diameter in zoom mode. Simultaneously velocities of fluctuation in laboratory frame can be determined as well as velocity fluctuations. Analysis of system performance was made with the use of numerical calculations and experimental tests. The targets for the analysis include wave number and spatial resolution of the method, contrast of instrumental function, which determined low k signal leakage into high k spectral region, focal depth of optical system for different wave numbers of fluctuations and others. Possible instrumental contribution into effects observed in plasma experiment as up/down asymmetry in intensity of density fluctuations and strong poloidal velocity shear are discussed. The role of shortcomings of optical system like distortion of optical front by diffraction on system apertures and by aberration on optical elements as well as not perfect collimating of probe beam are studied with numerical simulation and experimental tests. Suggestions for future upgrading of the diagnostics based on the obtained data of the system performance are advanced.
P5-10
Electron Density Measurement by Using a Multi-Channel Interferometer System in the Tandem Mirror GAMMA 10
M. Yoshikawa, Y. Shima, T. Matsumoto, A. Nakahara, N. Yanagi, A. Itakura, H. Hojo, Y. Kubota, T. Kobayashi, Y. Higashizono, Y. Nakashima, Y. Tatematsu, T. Imai, and T. Cho
Plasma Research Center, University of Tsukuba, Tsukuba, Ibaraki 305-8577, Japan
The tandem mirror GAMMA 10 utilizes an electron cyclotron resonance heating (ECRH) for forming a confinement potential. Fluctuation in the plasma is important to be measured forstudying the improvement of the plasma confinement by the formation of the plasma confinement potential. Density fluctuation is observed using microwaves, such as interferometer, reflectometryand Fraunhofer diffraction method, and electrostatic probes. We have constructed a newmulti-channel microwave interferometer system for measuring the line integrated plasma density profile and density fluctuation profile in a single plasma shot. It is designed using Gaussian-beampropagation theory and ray tracing code. The system is configured as a heterodyne interferometerconsisting of a 70 GHz (1 W) IMPATT oscillator and a 150 MHz oscillator. The main plasmaconfined in GAMMA 10 is produced and heated by ion cyclotron range of frequency power deposition. The potentials are produced by means of ECRH at the plug/barrier region. Moreover,the electron heating is achieved by the central-ECRH at central region. They cause the density andtemperature increase in the central cell. The typical electron density, electron and ion temperaturesare about 2 × 1012 cm-3, 100 eV and 5 keV, respectively. Fluctuation with coherent mode inseveral kHz is excited in the hot-ion mode plasma. When the ECRH is applied, the intensity of thedensity fluctuation of coherent mode is suppressed. In that time, radial potential distribution, i.e.,electric fields change along with the formation of plug potential. From this behaviour it is deducedthat the fluctuation deeply relates to the potential formation and improvement of the confinement.Moreover, we made pellet injection experiments for density increase. We successfully obtainedthe radial density profiles in the pellet injection experiments for the first time.
This work was partly supported by Ministry of Education, Culture, Sports, Science and Technology, Grant-in-Aid for Scientific Research in Priority Areas, No 16082203. This work is performed with the supportand under the auspices of the NIFS Collaborative Research Program.

P5-11
Reflectometry for Density Fluctuation and Profile Measurements in TST-2
T. Yamada, A. Ejiri1), Y. Shimada1), T. Oosako1), J. Tsujimura1), Y. Takase1), Y. Torii1), M. Sasaki2), H. Tojo1), T. Masuda1), H. Nuga2), N. Sumitomo2), S. Kainaga1) and J. Sugiyama1)
Research Institute for Applied Mechanics, Kyushu University, Kasuga 816-8580, Japan 1)Graduate School of Frontier Sciences, University of Tokyo, Kashiwa 277-8561, Japan
2)Graduate School of Science, University of Tokyo, Bunkyo 113-0033, Japan
Microwave reflectometry is a useful diagnostic and is applied in many fusion plasma devices. It is able to measure the electron density fluctuation and the density profile. The Tokyo Spherical Tokamak-2 (TST-2) at the University of Tokyo is a spherical tokamak (ST) device with a central density of about 2x10¹⁹m-3 [1]. At TST-2, a radio frequency (RF) heating experiment using high harmonic fast wave (HHFW) is in progress now [2]. The frequency of HHFW is 21MHz and the power is up to 400kW. To measure the density oscillation induced by this RF heating, a reflectometer with the frequency range from 26.5GHz to 40.0GHz was designed, constructed and applied to TST-2. RF heating using HHFW is an efficient method for STs [3]. Electron cyclotron waves and lower hybrid waves, which are often used to heat conventional tokamaks cannot propagate to the core of plasmas which have large dielectric constants. HHFW has a good accessibility to these large dielectric plasmas and is believed to be efficiently absorbed by electrons. The reflectometer is designed to measure this density oscillation and the density profile. The performance of the reflectometer was simulated by Kirchhoff integration method before construction. Kirchhoff integration is useful to calculate the propagation of the microwave in three-dimensional arrangement assuming the electric field is a scalar field. The arrangement of the mirrors and the horn antennas were optimized by the calculation, and the performance of the reflectometer was evaluated. Microwave launched from the horn antenna is reflected with two concave aluminum mirrors to make a spot at the cutoff surface inside the plasma. The reflected wave from the cutoff surface includes information on fluctuations and is received by another horn antenna next to the launching antenna. The received signal is quadrature demodulated by reference wave and sampled by 25MHz ADCs. The fast oscillating signal around 21MHz is used for density fluctuation measurement induced by RF and the slow oscillating signal is used for density profile measurement.
References
[1]Y. Takase et al, Nucl. Fusion 41 (2001) 1543. [2]Y. Takase et al, Nucl. Fusion 46 (2006) S598. [3]M. Ono, Phys. Plasmas 2 (1995) 4075.

P5-12
Microwave Imaging Reflectometry in LHD
S.Yamaguchi1), Y.Nagayama1), R.Pavlichenko1), S.Inagaki1), Y.Kogi2) and A.Mase2)
1)National Institute for Fusion Science, Toki, Gifu 509-5292, Japan 2)Art Science and Technology Center for Cooperative Research,
Kyushu Univ., Kasuga 816-8580, Japan
The microwave reflectometry is a radar technique for the measurement of the electron densityprofiles and fluctuations by probing the density-dependent cutoff layer in the plasma . Amulti-channel reflectometry system equipped with an imaging optics has been developed for the microwave imaging reflectometry (MIR). It has a potential to obtain the 2-D/3-D image of theMHD turbulences and instabilities with good time and spatial resolutions. The MIR system isunder development in the Large Helical Device (LHD), which is a superconducting heliotron-type fusion device. The right-hand cutoff layer is utilized as a reflection surface. The angle of anellipsoidal mirror installed inside the vacuum chamber is remotely adjustable with the ultrasonic motor in order to optimize the illumination angle for the wider range of the plasma parameters.The beam paths near the reflection surface are calculated with the ray tracing code, and the beam patterns are numerically calculated by using the FDTD method. Experimental examples in theLHD 10th campaign are presented at the conference.
This work is supported by the budgets of the National Institute for Fusion Science, NIFS05KEIN0021, NIFS05KEIN0031 and NIFS05ULPP525.

P5-13
Multi-channel Microwave Reflectometer with Fermi Antenna Receivers
K.Hattori, A.Ando, M.Inutake
Department of Electrical Engineering, Graduate School of Engineering,Tohoku University Aoba-yama 6-6-05, Sendai 980-8579, Japan
Reflectometry is now widely used in both Tokamak and other magnetically confined plasmas[1].It has an advantage of detecting local plasma density behavior with a high spatial resolution.Microwave imaging reflectometry[2] is recently develop as an advanced diagnostic system andprovides excellent advantages compared with conventional systems. To compose this system, it isnecessary both to design an optical system and to develop an imaging antenna array. Severalimaging antennas, such as a bow-tie antenna, a Yagi-Uda antenna, a dual-dipole antenna etc, havebeen developed. The tapered slot antenna(TSA) that we are developing is one of the candidates. ATSA has been firstly developed in electrical communication researches. It has a nearlysymmetrical radiation pattern compared with that of a bow-tie antenna and its bandwidth isrelatively broad. It can be adopted as an array antenna owing to its planer shape and fabricatedwith a low cost due to its compactness and a light-weighted structure. Recently, a new TSA called“Fermi antenna” in the frequency range of 35GHz and 60GHz has been developed in TohokuUniversity[3]. This has a tapered structure defined by the Fermi-Dirac function and a corrugatedstructure along the outer edge of the antenna to reduce side-lobe intensity. It is foundexperimentally that the radiation-beam widths in the E- and H-plane are almost equal to each otherand the side-lobe levels are low in the Fermi antenna. We designed a Fermi antenna with a corrugated structure for X-band according to a scaling law shown in Ref. 3. We attained a 3dB-beamwidth of 32 degrees in the E-plane and 37 degrees in the H-plane at 12GHz. Directivity of a Fermi antenna with corrugated structure is 2dB better than that of a linear TSA. By optimizing the strip line structure according to the equivalent circuit model, a VSWR less than 2 is obtained in the bandwidth of 8-18GHz. Plasma behaviors in the HITOP device[4] are measured with a reflectometer with two Fermi antenna receivers. Time evolution of the cutoff layer and plasma rotation velocity measured by the reflectometer are in good agreement with an electrostatic probe measurement.
References
[1] C. Laviron et al., Plasma Phys. Control Fusion 38(1996)905. [2] H. Park et al., Rev. Sci. Instrum., 74(2003)4239. [3] S.Sugawara et al., IEEE MTT-S International Microwave Symposium Digest,(1997)959. [4] M. Inutake et al., Journal of Plasma and Fusion Research, 78(2002)135.
P5-14
Design of the 48, 57 μm Poloidal Polarimeter for ITER
R.Pavlichenko, K.Kawahata, A.J.H.Donné1)
National Institute for Fusion Science, Toki, Gifu 509-5292, Japan 1)FOM-Institute for Plasma Physics Rijnhuizen, NL-3439, Nieuwegein, Netherlands
Control of the current density profile becomes a paramount issue for the modern tokamakexperiments. Polarimetry, a powerful diagnostic tool, can provide information on the density andmagnetic field, utilizing the Faraday and the Cotton–Mouton effects in a magnetized plasma. Thepolarimeter under study is based on the system that was originally proposed for ITER-98 and thepresent ITER[1] designs. The modified system featured two fans of quasi-perpendicular chords viewing the plasma through equatorial and upper ports. The updated system[2] will be operating ata wavelength of 48, 57 μm (instead of originally proposed 118 μm). The main advantage of thesmaller wavelength is the significantly smaller beam refraction along laser beam lines. It willallow increasing the maximum number of chords via the equatorial port for viewing the plasma bypenetration through the blanket modules, as well. The beams are reflected back along the samepath through the plasma by means of circular shaped retroreflectors. For the best optimization ofthe plasma coverage up to six chords in vertical direction via an upper plug are proposed. Theupper chords can give a possibility to monitor the Shafranov shift, independently. This article willpresent the present status of the on-going design and will address issues as sensitivity andaccuracy, refraction, Gaussian beam ray-tracing, beams and mirrors alignment as well as someother specific details.
References
[1]A.J.H.Donné, et.al.,Rev.Sci.Instrum.75,(2004)4694 [2]K.Kawahata, et.al.,Rev.Sci.Instrum.75,(2004)3508

P5-15
Weakly Relativistic K-band Oversized Backward Wave Oscillator with Bragg Reflector at Input End of Slow Wave Structure
K.Ogura, Y.Miyazawa, H.Tanaka, Y.Kiuchi, S.Aoyama, Y.Takamura, S.Tamura, A.Sugawara
Graduate School of Science and Technology, Niigata University, 8050 Igarashi Ninocho, Niigata 950-2181, Japan
Microwaves at moderate-power level or high-power level are demanded for widespreadapplications including plasma heating, plasma diagnostics, telecommunication systems and radar systems. Slow-wave devices such as backward wave oscillator (BWO) and traveling wave tube can be driven by an axially injected electron beam without initial perpendicular velocity and has been studied extensively as a candidate for a high-power microwave source. We study oversized BWOs driven by weakly relativistic electron beams less than 100 kV. In order to increase the frequency and/or the power handling capability, oversized slow-wave structures (SWSs) have been successfully used, in which diameter of SWS is larger than free-space wavelength of output electromagnetic wave by several times or more [1, 2]. Recently, the performance of oversized BWO is improved by improving the SWS and the beam shape. The output power increases up to about 500 kW in K-band (around 25 GHz) and about 200 kW in Q-band (around 41 GHz) [2]. The input end of SWS (beam entrance) is usually terminated to a mesh anode or a cutoffwaveguide in order to reflect the microwave radiation. In oversized BWOs, electromagnetic modes responsible for the radiation are a surface wave. The field decreases sharply from the SWS wall. For an efficient beam interaction with the surface wave, the beam should propagate near the wall. Hence, the beam radius became too small to interact with the surface waves if a cutoff waveguide was used. In the oversized BWOs, a mesh or a RF reflector at the anode was used in order to separate the SWS region from the electron beam diode [1, 2]. For practical high-power devices, it is desirable to remove such obstacles which may intersect the high current electron beam. In this work, a Bragg reflector is tested in the K-band BWO experiments as a reflector of microwave at the input end of SWS. The effects of Bragg reflector on the high-power performance of the weakly relativistic oversized BWO are examined experimentally.
References
[1] A. N. Vlasov, A. G. Shkvarunets, J. C. Rodgers et al. IEEE Trans. Plasma Sci. 28(2000)550 [2] S. Aoyama, Y. Miyazawa, K. Ogura et al., 6th International Conference on Open Magnetic Systems for Plasma Confinement, 19P40, Tsukuba, Japan, July 17-21, 2006
P5-16
Advanced Fabrication Method of Planar Components for Plasma Diagnostics
N.Ito1), A.Mase1), Y.Kogi1), Z.Shen2), N.C.Luhmann,Jr.2) N.Seko3), M.Tamada3), E.Sakata4),
(1)Art, Science and Technology Center for Cooperative Research, Kyushu University, Japan (2)Department of Electrical and Computer Engineering, UC Davis, USA
(3)Takasaki Advanced Radiation Research Institute, Japan Atomic Energy Agency, Japan (4)Kyushu Hitachi Maxell, Ltd, Japan
As the importance of microwave imaging diagnostics and satellite communications are increasing, the fabrication of high performance millimeter-wave planar antennas and high-frequency filters are essential. One of the methods is to use fluorine resin as an antenna substrate. If the planar antennas are used as transmitting or receiving antennas, we can control the beam direction of the antennas and decrease the height of the antenna against that of horn antenna. However, there are two problems to be solved, low degree of adhesion between copper foil and fluorine substrate and the edge shape of antenna pattern. We have proposed several methods to solve those problems. One solution is a surface treatment of fluorine substrate to increase the peel strength of copper foil. The other is a fabrication method using electro fine forming (EF2) technology that gives excellent pattern without side edges. We report on the results of surface treatment of fluorine films by using graft polymerization and the measurement of dielectric constant before and after the treatment. The antennas fabrication using EF2 technology is also introduced. And the measurement results of characteristic evaluation of millimeter-wave antennas will also be presented.

P5-17
Development of a Tera Hertz Gyrotron as a Radiation Source
O. Watanabe1), H. Tsuchiya, H. Mori, La Agusu, S. Mitsudo, I. Ogawa, T. Saito, T. Idehara
Research Center for Development of Far-Infrared Region, University of Fukui 1)Plasma Research Center, University of Tsukuba
Gyrotron development is being advanced in two ways. The major way is development of high power, millimeter wave gyrotrons for heating and current drive for fusion plasma. It is going world-widely and has achieved around 1MW output power for long pulse operation (longer than several tens second or quasi CW) at the frequency of 170 GHz or 140 GHz. On the other hand, medium power, high frequency gyrotrons are being developed in several institutions in the world. In the cases, high magnetic field and higher harmonic operations are used for increasing operation frequency. Such gyrotrons have already covered wide frequency range in millimeter to submillimeter wavelength region and been applied as submillimeter wave radiation sources for wide fields including plasma diagnostics, electron spin resonance (ESR) specroscopy, new medical technology, and so on. These gyrotrons are only one high power stable THz radiation source and will be important and useful in future for development of high power THz technologies. Our gyrotrons developed in FIR FU named Gyrotron FU Series belongs to the second typegyrotrons, that is, medium power high frequency gyrotrons. The series has achieved followingitems1), 1) frequency step-tuneability in wide range in millimeter to submillimeter wavelengthregion (from 38 to 889 GHz), 2) highest frequency (889 GHz) corresponding to the wavelength of377μm by using second harmonic operation at the field intensity of around 17 T, 3) modulation ofamplitude and frequency of the output, 4) stabilization of amplitude and frequency, 5) higherharmonic operations up to fifth and 6) high-purity mode operations at many cavity modes byinstallation of a carefully designed cavity. Also, we have achieved mode conversion from circularwaveguide modes to a Gaussian mode for applications of our gyrotrons to many fields. However, up to the present, gyrotrons have not achieved the operation at the frequency of one terahertz. This paper presents that a THz gyrotron with a pulse magnet has been designed, constructed and operated in FIR FU. It is developed as one of high frequency gyrotrons included in Gyrotron FU Series. The gyrotron has already achieved the first experimental result for high frequency operations whose radiation frequency exceeds 1 THz. In this presentation, the design detail and the operation test results for sub-terahertz to terahertz range are described. The second harmonic operation is confirmed experimentally at the expected frequency of 1.005 THz due to TE6,11 cavity mode at the magnetic field intensity of 19.0 T.
References
[1]T. Idehara, I. Ogawa, S. Mitsudo, M. Pereyaslavets, N. Nishida and Y. Yoshida, IEEE Trans. Plasma Sci. 27, pp. 340-354(1999)
P5-18
Utilization of Terahertz Imaging Technology to High-Temperature Plasma Diagnostics
T. Tokuzawa, K. Kawahata, M. Hangyo1), and M. Tani1)
National Institute for Fusion Science, Toki, Gifu 509-5292, Japan 1)Institute of Laser Engineering, Osaka University, 2-6 Yamadaoka, Suita, Osaka 565-0871,
Japan
Recently development of the terahertz imaging technology is making rapid progress. Especially the technique utilized of the terahertz pulse such as terahertz time domain spectroscopy has been applied to the material physics and making a new research field. On the other hand, in the field ofthe fusion plasma experiment the high temperature and high number dense plasma has been achieved to generate in the experimental device and there is need to develop a new diagnostic tool.The frequency range connecting from the millimeter to the infrared, that is terahertz, is expected to develop for the plasma diagnostics. Here we will report the recent terahertz technology and the possibility and problem of the application to the plasma diagnostics.
This work was partially supported by JSPS and also by NIFS06ULHH507 from NIFS.

P5-19
Laser Absorption Spectroscopy for Diagnostics of a Neutral Helium Beam
A. Okamoto, K. Shinto, S. Kitajima, M. Sasao
Tohoku University, Sendai, Miyagi 980-8579, Japan
Diagnostic neutral beam is required to be well controlled on population in metastable state in terms of accurate evaluation of the beam-attenuation length. In this paper, measurement method of population density of metastable state in neutral beams is described, where metastable helium atom is measured using laser absorption spectroscopy. Laser absorption spectroscopy is a popular method to measure atomic density in laboratory plasmas. On the other hand, applying the method to beam diagnostic is sometimes ambitious since beam density is much lower than that of the plasma. In laser absorption spectroscopy, density resolution, which corresponds to the lowest measurable density, is mainly determined by dynamic range of the detector. The density resolution is estimated to be 106 cm-3 for metastable helium atom if an infrared photomultiplier tube is used without any synchronizing technique. Using a lock-in detection technique is proposed to detect metastable state in the neutral helium beam produced in a tabletop ion source. Experiments are performed in a hollow cathode device for production of metastable atoms (PROMESTA device). Inner diameter of the cathode is 10 mm and its length is 40 mm. Two anodes, which have the same inner diameter with the cathode, are positioned at both ends of the cathode with 2 mm gaps. Helium gas flowing from one end through the hollow cathode is excited to a metastable state, 2 3S, by electron collision in the hollow cathode plasma. An external cavitydiode laser (λ = 1083 nm) is used to measure the 2 3S metastable state exciting to 3 3P state. The laser beam, which is directed along the hollow cathode axis, passes through the excitation region and downstream free-diffusion region, then it is detected by a photo diode. From the absorption spectrum line density of the metastable atom is obtained.
This work was partly supported by the Ministry of Education, Culture, Sports, Science and Technology of Japan (MEXT) Grant-in-Aid for "Priority area of Advanced BurningPlasma Diagnostics" and also supported by that for Young Scientists (B), 17740362, 2005.

P5-20
Design of bolometer diagnostics for the KSTAR
Dongcheol Seo1) and B. J. Peterson2)
1National Fusion Research Center, Yuseong, Daejeon 305-806, Korea 2National Institute for Fusion Science, Toki-shi, Gifu-Ken, 509-5292, Japan
A 12 channel resistive bolometer[1] array and an infrared imaging video bolometer (IRVB)[2] have been designed for the Korean Superconducting Tokamak Advanced Research (KSTAR). In the 2nd campaign (2009), the 12 channel resistive bolometer array will be installed at the mid-plane tangential port, with the array viewing horizontally, and an Abel inversion will be carried out for a major radial profile of the radiation emissivity of the circular cross-section plasma. In the 3rd campaign (2010), an IRVB will be installed at the port of the resistive bolometers and the results of the resistive bolometer and the IRVB will be compared. In the 4th
campaign (2011), the 12 channel resistive bolometer array will be moved to the divertor. The calibration constants of the 12 channel resistive bolometer such as the sensitivity, K, and thecooling time, τc , have been obtained by the In situ calibration[4].
References
[1] K.F. Mast et al., Rev. Sci. Instrum. 62, 744 (1991). [2] B.J. Peterson et al., Rev. Sci. Instrum. 74, 2040 (2003). [3] G.S. Lee et al., Nucl. Fusion 41, 1515 (2001). [4] E.R. Müller and F. Mast, J. Appl. Phys. 55, 2653 (1984).
This work is supported by the Korea Ministry of Science and Technology under the KSTAR Project and the Korea-Japan Fusion Collaboration Program.

P7-01
Helium measurements using the pellet charge exchange in Large Helical Device
T.Ozaki, P.Goncharov, E.Veschev1), S.Sudo, N.Tamura, TESPEL Group and LHD Experimental Group
National Institute for Fusion Science, Toki, Gifu 509-5292, Japan 1) Graduate University for Advanced Studies, Hayama, Kanagawa, 240-0193, Japan
In Large Helical Device (LHD), it is possible to perform the simulation experiment of the αparticle heating by using the ion cyclotron resonance heating (ICH) because high-energy particlegenerated by ICH is well confined in the plasma. The neutral particles (mainly hydrogen), whichare generated by the charge exchange between the high-energy ion and the background neutrals,can be observed by using them. However a few neutral helium particles can be observed because αparticle (or fully ionized helium) can emit only by double charge exchange process. Therefore wealso introduce the pellet charge exchange system (PCX). The diagnostic pellet is injected to theplasma in order to obtain the charge exchange neutral particle, which is produced by the chargeexchange reaction between the ablated pellet cloud and α particle or high-energetic particle. Thehelium distribution measurement in helium plasma is demonstrated.

P7-02
New 20-channel Diagnostic for Angle-Resolved Fast Particles Measurements in LHD.
E.A.Veshchev1), T. Ozaki2), P.R. Goncharov2), S. Sudo2) and LHD Experimental Group2)
1) Graduate University for Advanced Studies, Hayama, Kanagawa, 240-0193, Japan 2) National Institute for Fusion Science, Toki, Gifu 509-5292, Japan
A new multi-channel diagnostic for fast particles has been developed and successfully tested on the Large Helical Device (LHD) during 2005-2006 experimental campaign. The number of simultaneously used channels was significantly improved from 2 to 20 channels and additional improvements for noise reduction have been made. Same time location of the diagnostic has been changed that allowed one to make measurements in a much wider range of pitch angles from perpendicular to tangential (90-160 degrees). All these improvements allow one to make time, energy, and angle-resolved measurements of charge exchange neutral particles in a single plasma discharge and to check the presence of fast particles loss-cones from LHD plasma in different heating regimes. This new diagnostic can be a very helpful and powerful tool in studying of fast particle distribution in such a complex helical plasma geometry like the one of LHD. Example data from plasma discharges are presented.

P7-03
A Method for Reconstruction of the Neutral Particle Source Function in Helical Magnetically Confined Plasma
P.R. Goncharov1), T. Ozaki1), E.A. Veshchev2), S. Sudo1)
1) National Institute for Fusion Science, Toki, Gifu 509-5292, Japan 2) Graduate University for Advanced Studies, Hayama, Kanagawa, 240-0193, Japan
Multidirectional nonperturbing diagnostics based on high resolution atomic energy spectrometersare used on the Large Helical Device (LHD) to study the ion component heating mechanisms andfast ion confinement by measuring the escaping neutral particle fluxes. The particle source g(E, ρ)is not localized in contrast to the methods employing a diagnostic neutral beam or chargeexchange on a pellet cloud. Several possible approaches to the localization of such measurementson LHD were overviewed in [1]. A new 20-channel analyzer for simultaneous measurements ofthe energy resolved neutral particle flux along twenty observation lines at the angles ζi was described in [2]. This paper presents a numerical method realized in FORTRAN for the calculation of the neutralparticle source function radial distribution g(E, ρ) from line-integrated passive measurement dataΓ(E, ζi). The basic integral relation between these quantities was given in [3] for LHD geometryalong with the numerical simulation of the measured fluxes. The source function reconstructionalgorithm requires the integral kernel calculation using the known geometry of measurements andthe magnetic equilibrium data, a certain treatment of the singularity at ρ = ρmin, and a regularization of the first kind Volterra integral equation. The algorithm is suitable not only in particle diagnostic data analysis, but for any kind of radiation source function reconstruction as well, assuming the source to be equal on a magnetic surface. The reconstructed radial dependence provides additional information for comparisons and cross-checks using the local diagnostic data.
References
[1] P.R. Goncharov, J.F. Lyon et al., J. Plasma Fusion Res. Series, vol. 6 (2004), 314 [2] E.A. Veshchev, T. Ozaki et al., Rev. Sci. Instrum., 77 (2006), scheduled for publication [3] E.A. Veshchev, P.R. Goncharov et al., Rev. Sci. Instrum., 77 (2006), scheduled for publication
P7-04
Analysis of energy spectra of fast ion in the Large Helical Device
H. Nishimura1), M. Isobe2), M. Nishiura2), M. Sasao1)
1)Tohoku University, Sendai, Miyagi 980-8579, Japan 2)National Institute for Fusion Science, Toki, Gifu 509-5292, Japan
In toroidal helical devices, due to the absence of symmetry of magnetic field structure, fast ion orbits are much more complicated than those in tokamak devices. It is important to understand their behavior for future fusion reactor. As the simulation, the energy spectra of fast ions produced by tangentially injected neutral beams (NBs) have been measured by using a neutral particle analyzer (NPA) based on natural diamond detectors (NDDs) in the Large Helical Device (LHD).
As an evaluation formula of the energy spectra of fast ion produced by NB, on the basis of kinetic equation the analytical formula is derived. Kinetic equation is consisted of four terms, Fokker-Planck drag term describing the velocity relaxation, particle production term originating from neutral beam injection heating, particle loss term due to the charge exchange reaction with neutral particles, and particle loss term due to the loss cone in the velocity space. In the last term, whether fast ions are gone outside of the confinement field or not is determined by using the adiabatic invariants method. The distribution function is derived by integrating the kinetic equation as possible as analytical methods are used to reduce a computational time. The validity of the derived solution is appraised by comparing the energy spectra of fast ion numerically calculated based on the solution with those experimentally measured by NDD in LHD.

P7-05
Fast ion diagnostics for CHS experiment
M. Isobe, S. Okamura, M. Sasao1), K. Toi, K. Nagaoka, A. Shimizu, Y. Yoshimura, K. Matsuoka and CHS team
National Institute for Fusion Science, Toki, Gifu, 509-5292, Japan 1)Tohoku University, Sendai, Miyagi, 980-8579, Japan
The Compact Helical System (CHS) project since June 1988 comes to a close at the end of August 2006. The CHS is a medium size helical device characterized by a low aspect ratio (R/a=1 m/~0.2m). This project has primarily aimed at clarifying confinement properties of low aspect ratiohelical plasma. Study on fast ion confinement has been one of key physics targets in CHS becauseof the symmetry breaking of the system and enhanced toroidicity. For this reason, various types offast ion diagnostics have been developed and applied to the CHS device. In the early days'experiment of CHS which was in operation at the Higashiyama site of Nagoya University, our interest was mainly focused on issues related to ion orbit and/or loss cone structure. This wasinvestigated through measurements of energy spectra of fast ions generated by NBI and ICRH by use of charge exchange neutral particle analyzer (NPA). Because NPA on CHS is capable ofchanging its viewing angle, it allows us to study confinement of fast ions over a wide range in their pitch angles. Neutron diagnostics consisting of proportional counters and plastic scintillatorwere also employed for similar purpose. We generated intentionally d-d neutrons due tobeam-target reactions by injecting 1 % deuterium-doped hydrogen NB into deuterium target plasmas at the Higashiyama site. This is because decay of neutron emission rate after NB turn-offcontains information of beam ion confinement. These diagnostics clearly showed that confinementof perpendicularly injected fast ions is poor as expected while tangentially co-injected transit fast ions are well confined. In the latter half of CHS project at the Toki site, we stressed on the studieson fast-ion-driven MHD instabilities and their effects on fast ion transport although the studies had already been started in the former half of CHS project. For this experiment, we have developedscintillator-based lost fast ion probe (SLIP), Faraday cup type lost fast ion probe (FLIP) and directional Langmuir probe (DLP) to detect flux of lost fast ions near the outermost magnetic flux surface, in addition to NPA. These have played an important role in study of anomalous transportdue to fast-ion-driven MHD instabilities. In this paper, we review these fast ion diagnostics forCHS experiment. Also, experimentally obtained knowledge on the issues related to fast ions inCHS will be summarized.
P7-06
Effects of Radially Sheared Electric Field Analyzed with End-Loss Ion-Energy Spectrometers
M.Hirata, T.Cho, J.Kohagura, Y.Numakura, K.Shimizu, S.Kiminami, M.Ito, N.Morimoto, K.Hirai, T.Yamagishi, T.Ikuno, S.Namiki, Y.Miyata, R.Minami, K.Ogura1), T.Kondoh2),
T.Kariya3), T.Imai and S.Miyoshi
Plasma Research Center, University of Tsukuba, Ibaraki, 305-8577, Japan 1)Graduate School of Science and Technology, Niigata University, Niigata, Japan
2)Japan Atomic Energy Agency, Naka, Ibaraki, Japan 3)Toshiba Electron Tubes and Devices, Tochigi, Japan
Remarkable effects of radially produced shear of electric fields Er on the suppression of turbulent fluctuations with plasma confinement improvement are found in the tandem mirror GAMMA 10 by the use of signals of end-loss currents flowing from the central cell as well as the central-cell soft x-ray brightness [1-3]. Here, electron-cyclotron heating (ECH) for the formation of ion-confining potentials, φc, simultaneously leads to a significant rise in the absolute value of the central-cell potential and the associated formation of a strong Er shear. The effects are observed in the form of remarkably different fluctuation levels and Fourier spectrum shapes. In association with the reduction of the fluctuations due to strong Er shear formation, increases in ion and electron temperatures are found. Recently, higher-power ECH in the central cell (200 kW) and plug (430 kW) regions produces stable central-cell plasmas (Te=600 eV, Ti⊥=6.6 keV, and Ti// for φc trapped ions of 2.0 keV with φc=2.3 kV) with azimuthal Er×B sheared flow. As a result, the stored energy of φc trapped ions exceeds that of central-cell mirror trapped ions (represented by diamagnetism). This first result in tandem mirrors is based on the importance of Er×B sheared flow effects on improvement in stabilization and confinement of plasmas.
References
[1]T.Cho et al., Phys. Rev. Lett, 94 (2005) 085002 [2]T.Cho et al., Phys. Rev. Lett, 97 (2006) 055001 [3]M.Hirata et al., Trans. Fusion Sci. Tech, 47 (2005) 215

P7-07
Use of γ-ray-generating 6Li+D reaction for verification of Boltzmann-Fokker-Planck simulation and knock-on tail diagnostics in neutral-beam-injected plasmas
H.Matsuura, M.Nakamura, Y.Nakao
Kyushu University, Hakozaki, Fukuoka 812-8581, Japan
It is well known that the nuclear elastic scattering (NES) contributes to a certain extent to theslowing-down of suprathermal ions in fusion plasmas. In conceptual designs of next-generationfusion devices, 3.52-MeV α-particles are continuously produced and use of beam injection withenergy more than 1 MeV is also considered. In such a case, the NES effects on slowing down ofenergetic ions may not be negligible compared with those due to Coulomb collisions. To know theNES effect on reaction rate coefficient and diagnose the plasma parameters inknock-on-tail-created plasmas, the analysis model which can consistently treat the distortion ofbulk component of fuel-ion velocity distribution functions is required. We have evaluated the NESeffect on burning plasma properties in ITER-like plasmas[1-3] on the basis of theBoltzmann-Fokker-Planck (BFP) model. For forthcoming burning experiments, verification of theBFP model by comparing with measured data in currently existing fusion devices would bemeaningful. In this paper, the BFP calculations are performed assuming 50~200keV proton beaminjection into the 6Li containing deuterium plasmas ( ne~1019m-3 and T=1~10keV) and knock-ontail formation in deuteron distribution function due to NES by injected proton is examined. Usingthe obtained deuteron distribution function, the 0.5MeV γ-ray emission rate by 6Li(d,p)7Li*, 7Li*→7Li+γ[4,5] is evaluated for various plasma states. The experiment to verify the BFPnumerical model is proposed.
References
[1] H.Matsuura, Y.Nakao, K.Kudo, Nucl. Fusion, 39 (1999) 145. [2] H.Matsuura, Y.Nakao, Phys. Plasmas, 13 (2006) 062507. [3] H.Matsuura, Y.Nakao, J. Plasma Fusion Research Series, 7 (2006) 98. [4] V.T. Voronchev, et al., Phys. Rev. E, 63 (2001) 26413-1. [5] M.Nakamura, et al., J. Phys. Soc. Japan, 75 (2006) 024801.

P7-08
Observation of Molecular and Atomic Ions in recombination Plasma
A.Tonegawa, H.Mastumoto, T.Nishijima, M.Ono and K.Kawamura
Department of Physics, School of Science, Tokai University, 1117 Kitakaname, Hiratsuka 259-1292, Japan.
The knowledge of atomic and molecular processes in hydrogen plasma has become increasingly important for plasma processing, space plasma, and fusion reactors. In a recombination plasma atlow temperature, vibrationally excited molecules, such as H2(v) or D2(v), persist in dissociation and ionization processes of the plasma volume. Thus, the plasma volume recombination associated with molecules in the recombination plasma is effective in enhancing the reduction of ion particle flux. However, the role of molecular ions in the plasma is still under discussion and variousconclusions have been derived from the analysis of different experiments. In this study, we havecarried out the experimental observation of molecular ions in H2, D2, and He mixture plasma in alinear plasma device, TPD-SheetIV. Measurements of the densities of molecular and atomic ionswere carried out in hydrogen plasma with a hydrogen/deuterium gas puff. An “omegatron” massanalyzer, situated behind a small hole (Φ 0.5 mm) in the endplate with a differential pumpingsystem, is used for analyzing ion species, while the electron density and temperature weremeasured using a Langmuir probe and a double probe.
This work is part of a program supported by the LHD Joint Project, the National Institute for Fusion Science (NIFS04KOBP007) and is partially supported by a Grant-in-Aid No. 16540455 (2004-2005) from the Ministry of Education, Culture, Sports, Science and Technology of Japan.

P7-09
Observation of Divertor Plasma Shift during a Discharge in Heliotron J
T.Mizuuchi, Z.Feng1), N.Nishino2), K.Nagasaki, H.Okada, S.Kobayashi, H.Arimoto3), G.Motojima3), S.Watanabe3), S.Matsuoka3), M.Nosaku3), T.Tomokiyo3), N.Watanabe3),
K.Kondo3), F.Sano
Institute of Advanced Energy, Kyoto Univ., Gokasho, Uji, Japan 1)Southwestern Institute of Physics, Chengdu, China
2)Graduate School of Engneering., Hiroshima Univ., Higashi-Hiroshima, Japan 3)Graduate School of Energy Science, Kyoto Univ., Gokasho, Uji, Japan
A combination of a small target and a fast video camera is a very powerful tool to visualize the edge plasma behavior and/or the plasma-wall interactions with high spatial and time resolutions, which has been introduced for the edge plasma fluctuation study in Heliotron J [1]. Recently, the similar method is applied to monitor the diverted plasma flux position. In a low shear device like Heliotron J [2], the rotational transform has great importance in the core plasma confinement. In addition, it is closely related with the edge field topology, which is to be used for a "build-in" divertor in helical systems. To use the intrinsic edge field topology for a divertor, it is important to experimentally study the dynamic change of the divertor plasma distribution caused by the plasma discharge and its controllability. To monitor the diverted plasma flux position, a rail-limiter type carbon target (a radial length of 16cm) was inserted to the periphery of Heliotron J plasma form the bottom of the torus and a video camera (250-500fps) was set at the opposite port. Two-dimensional images of visible light emission near the target were taken during discharges. A spontaneous radial shift of the brightest spot position on the target was clearly observed during a discharge indicating the shift of the diverted plasma flux position. The diverted plasma flux coming to the wall was also monitored with poloidal Langmuir-probe arrays [3]. It was also observed that the distribution of the diverted plasma density was shifted during a discharge. These findings are qualitatively consistent with each other. In some NBI or ECH discharges, bright spots were observed at unexpected position of the target from the field calculation. This suggests the possibility of this method as a detecting system for non-thermal particle flux.
References
[1]N.NISHINO, et al., J. Nucl Mater. 337-339 (2005) 1073. [2]T.OBIKI, et al., Nucl. Fusion 41 (2001) 833. [3]T.MIZUUCHI, et al., J. Nucl. Mater. 313-316 (2003) 947

P7-11
Measurement of gas composition ratio of H-He mixture plasmas in Divertor Simulator MAP-II
Y. Kuwahara, S. Kado1), A. Okamoto2), T. Shikama, Y. Iida, K. Kurihara, F. Scotti and S. Tanaka
School of Engineering, The University of Tokyo, 1)High Temperature Plasma Center, The University of Tokyo, 2)School of Engineering, Tohoku University
In a divertor region of the fusion reactor, many neutrals are mixed: desorbed or puffed hydrogen molecule, dissociated hydrogen atom, helium atom produced through the fusion process, and etc. Since these species have different effects on the edge plasmas, a precise measurement of their composition ratio is usuful to optimize divertor operation scenario. We have proposed the method to measure the atomic-molecular ratio of hydrogen plasmas [1]. We extend this to He-H mixture plasmas. In this research we propose the method to measure the gas-composition ratio of He, H and H2 of the He-H mixture plasmas in divertor simulator MAP-II by using passive spectroscopy. Adopting the coronal model to the emissivity of the Fulcher-α band of molecular hydrogen, thetotal transition from X1Σg to d3Πu state can be obtained from the branching ratios of the excitation and radiative decay considering the ro-vibrational distribution of X1Σg. A collisional radiative (CR) model is applied to the emissivity of the Balmer series of the hydrogen atom [2] and helium atom [3]. The emissivity of Balmer series is expressed as the summation of direct and dissociative excitation components, which are proportional to the density of hydrogen atom the density of hydrogen molecule, respectively. The emissivity of He I is also proportional to the density of helium atom in the quasi-steady state approximation where the effect of the meta-stable state is negligible. From the ratio of each emissivities of H-He mixture plasmas measured in the same viewing chord using the same optical system, the composition ratio of H, H2 and He can be obtained. This work was supported in part by a NIFS Collaborative Research Program (NIFS04KOAB009) directed by the second author.
References
[1]S. Kado, S. Kajita, D. Yamasaki, et al., J. Nucl. Mater., 337–339 (2005) 166 [2]T. Fujimoto, K. Sawada and K. Takahara, J. Appl. Phys., 66 (1989) 2315 [3]T. Fujimoto, Quant. Spectrosc. Radial. Transfer., 21 (1979) 439

P7-12
Development of Heat Flow Measurement using Thermal Probe Method in Divertor Simulator MAP-II
K. Kiminori, S. Kado1), H. Matsuura2), K.-S. Chung3), T. Shikama, Y.Iida, F. Scotti, Y. Kuwahara and S. Tanaka;
School of Engineering, The University of Tokyo, Tokyo, Japan 1) High Temperature Plasma Center, The University of Tokyo, Chiba, Japan
2) Graduate School of Engineering, Osaka Prefecture University, Osaka, Japan 3) Department of Electrical Engineering, Hanyang University, Seoul, Korea
The thermal probe method is a new plasma diagnostic for various plasma parameters such as negative ion density[1] and ion temperature[2]. In the thermal probe method the heat flow into a probe tip (Q) is measured as a function of the probe bias (V). Therefore, it is necessary to obtain the Q-V characteristic with high accuracy in order to deduce these plasma parameters reliably. Since the time resolution of the thermal probe is poor in nature because of the long transient time in thermal phenomena, it is essential to improve its time response. The goal of this study is the improvement of the accuracy and time resolution in the Q-V characteristic measurement. The Q-V characteristic can be measured by two methods. One is to sweep the bias continuously and the other is to change it in a stepping manner. Although the former method can obtain a continuous Q-V curve, it requires long acquisition time. On the other hand, while the latter method saves acquisition time, only finite data points can be obtained. The comparison of the two methods was made with the low-pressure helium dc-arc discharges in the divertor simulator MAP-II. The preliminary results showed a small difference in Q-V characteristic obtained by two methods. The optimization of the sweeping method as well as the fitting procedure for analysis is now under investigation. This work was supported in part by a NIFS Collaborative Research Program (NIFS04KOAB009) directed by the second author.
References
[1]E. Stamate et al., Appl. Phys. Lett. 80 (2002) 3066. [2]H. Matsuura and K. Michimoto, Contrib. Plasma Phys. 44 (2004) 677.

P7-13
Development of a neutron measurement system for nd/nt fuel ratio measurement in burning plasma
K. Okada, K. Kondo1), N. Kubota2), K. Ochiai2), S. Sato2), T. Nishitani2), C. Konno2) K. Nomura, A. Okamoto, T. Iwasaki, S. Kitajima, M. Sasao
Tohoku University, Sendai 980-8579, Japan (1) Osaka University, Yamadaoka 2-1, suita, 565-0871, Japan
(2) Japan Atomic Energy Agency, Tokai, Naka, Ibaraki 319-1195, Japan
For burning control experiments in the International Thermonuclear Experimental Reactor (ITER), it is essential to measure the deuteron and triton density ratio in the core plasma. We consider that it can be achieved by measurement of DT/DD reaction ratio. The possibility of measurement of fuel ratio from the DT/DD reaction ratio with a neutron spectrometer to the ITER was studied. Spectrum in the DD neutron energy region is usually contaminated by the scattered/energy-degraded neutron background originating from DT. Here, We assessed scattered/energy-degraded neutrons by Monte Carlo N-Particle code system (MCNP). The result of neutron transport calculation indicated the possibility of DD spectrum separation from the scattered/energy-degraded neutrons derived from DT neutrons by selection of the measurement location and collimator design. And a measurement method was considered. It is required that each neutron is measured separately and simultaneously. In order to realize this technique, an examination of a measuring instrument and a circuit was performed. A double crystal time-of-flight (TOF) spectrometer was chosen because the spectrometer is relatively compact, not affected from a magnetic field and provides real-time information. We propose a method for rapid selection of DD and DT events using multi-discriminator electronics for the first detector. An experiment using DD and DT neutrons from an accelerator was conducted for a proto-type TOF spectrometer at the Japan Atomic Energy Agency (JAEA), Fusion Neutronics Source (FNS) facility. Using a sophisticated circuit with discriminators for the first detector, separation between DD and DT neutron components of spectrum was achieved.

P7-14
Neutron spectral broadening due to the polyethylene collimator of the fast neutron spectrometer
T. Matsumoto, H. Harano, T. Shimoyama, A. Uritani1) and K. Kudo
National Metrology Institute of Japan, National Institute of Advanced Industrial Science and Technology, Tsukuba 305-8568, Japan
1)Nagoya University, Nagoya, Aichi 464-8603, Japan
Neutron spectrometry is an important tool in several fields such as fusion plasma diagnostics and nuclear physics. We developed a fast neutron spectrometer with excellent energy resolution and good detection efficiency [1]. The spectrometer consists of three position-sensitive proportional counters (PSPCs) with methane gas and two Si(Li) surface barrier detectors (Si(Li)-SBDs). Incident neutrons through a collimator made of polyethylene and lead interact hydrogen atoms to generate recoil protons. The energy and recoil angles of the protons are simultaneously measured with the PSPCs and the Si(Li)-SBD. Finally, we can obtain the neutron spectrum with the energy resolution better than 2 % for 5.0 MeV neutrons. However, the neutron spectrum might be broadened by (1) the scattering of neutrons in the polyethylene collimator and (2) the non-parallel incident of neutrons that is amplified with the ratio of a diameter of the collimator to a distance from a neutron source. In the present study, a new simulation code MCNP-ANTX was developed by modifying the MCNP4C code [2] in order to investigate the effect of spectral broadening. The MCNP-ANTX code includes a new tally subroutine with the TRIM-98 and SRIM-98 codes to simulate the transport of accelerated ions, generated neutrons and charged particles produced in neutron detectors. The MCNP-ANTX was applied for the simulation of the behavior of neutrons and recoil protons in the spectrometer. The results of the simulations are compared with those obtained from experiments using monoenergetic fast neutrons in this presentation.
References
[1] T. Matsumoto, H. Harano, A. Uritani and K. Kudo, IEEE Trans. Nucl. Sci. 52(2005)2923.[2] J. F. Briesmeister, MCNP – A General Monte Carlo N Particle Transport Code, Version4C, LA-13709-M, Los Alamos National Laboratory, 2000.
This study was financially supported by the Budget for Nuclear Research of the Ministry of Education, Culture, Sports, Science and Technology, based on the screening and counseling by the Atomic Energy Commission.

P7-15
Characteristic observation of the ion beams in the plasma focus device
H.R.Yousefi,Y.Nakada, H.Ito and K.Masugata
Department of Electric and Electronic System Engineering, University of Toyama
The proton emission from plasma focus device with the H2 filling was analyzed. The ion beam characteristics, particle pinhole image and pinch plasma image were obtained with an aluminum filtered pinhole camera with CR-39 film and x-ray pinhole camera with Be filter respectively. Ring-shaped of ion bunches were observed and also on the pinched plasma column same shape was attributed.
References
[1] Mather J W (1971) Methods of Experiments Physics ed H Griem and R Loverberg. 9B:187 [2] Trubnikov B A. (1986).J.Plasma Phys.12: 490 [3] Deutsch, R., Kies, W. (1988).Plasma Phys.Control Fusion 30:263 [4] M.Zakaullah etal.(1999) Phys.Plasma 6:3188. [5] Marek Sadowski etal. (2000)NUKLEONIKA.45(3):179 [6] M. Sadowski, (1981) Phys. Let.A 83:435. [7] K.Takao, etal. (2003) Plasma Sources Sci.Technol.12 :407 [8] M.Scholz etal. (2004) vacuum 76:361 [9] H. Bhuyan etal. (2001). Indian J. Pure Appl. Phys. 39: 698.

P7-16
Development of a Simple and Tough Alpha-particle Detector Used at High Temperature
T.Iida, F.Sato, Y.Kato, T.Tanaka1)
Osaka University, Yamadaoka, Suita, Osaka 565-0871, Japan 1)National Institute for Fusion Science, Toki, Gifu 509-5292, Japan
The response of some ceramic (Si02, Al2O3, etc.) and compound semiconductor (SiC, CdTe, etc.) materials to energetic ions has been examined for the development of a tough alpha-particle detector used at high temperature. To measure the electrical response of the materials, very thinsilver electrodes were made on both sides of the thin sample materials by evaporation process. Thethin high-resistive layer of each sample material was irradiated with alpha-rays from an 241Am source or pulsed ion beams from an accelerator and the induced electric charge on the sample was measured in the temperature range from room temperature up to 450K. Corresponding chargepulses could be detected for samples with the proper electric field, though the amplitude of the pulses varied widely. This type of the simple detector made of a thin resistive layer can be hardlyused for the energy analysis, but it may be effectively applicable to the measurement of the flux of alpha-particles at high temperature. Detailed measurement results and discussions on the responseof the ceramic and compound semiconductor materials to alpha-particles are to be given in the conference.
This study is supported by Grant-in-Aid for Scientific Research (No.18035006).
P7-17
Effects of ion orbits due to potential formation on transverse ion transport in the thermal barrier region of GAMMA10
H. Saimaru, I. Katanuma, Y. Mizoguchi, K. Yashiro, T. Cho
Plasma Research Center, University of Tsukuba, Tsukuba, Ibaraki 305-8577, Japan
A mechanism of a transverse ion loss in the thermal barrier region of the GAMMA10 tandemmirror is investigated by the use of mapping equations of ion drift orbits, where the effects of a non-axisymmetric electrostatic potential in the thermal barrier are taken into account. Two sorts of the mechanisms of the transverse ion transport in the thermal barrier are studied. Firstof all, the enhanced effects of the transverse diffusion on ion radial step sizes is investigated, since banana-like ion drift orbits appear on the basis of the non-axisymmetric electrostatic potential formation. Secondly, chaotic ion orbits due to unstable ion drift are found, which result in cross-field ion diffusion without Coulomb collisions. For the first mechanism, we use the secular perturbation theory to estimate the half width of the banana orbits, and compare the results with those from the numerical calculations. For the second mechanism, we use the continued-fraction method to find the threshold of the magnitude of electrostatic non-axisymmetricity, where the ion drift orbits become unstable. The resultant transverse transport is analyzed by using the Fokker-Planck theory. The result is compared with that from the mapping equation method. The aforementioned theoretical results as well as the relation between the ion radial transport andelectrostatic anisotropy in the GAMMA10 thermal barrier region are detailed at the Conference.

P7-18
The Neutral Transport Analysis Based on Visible Light Measurement of Recycling and 3-dimensional Simulation in GAMMA 10
Y. Higashizono, Y. Nakashima, M. Shoji1), S. Kobayashi2), N. Nishino3), H. Kawano, Y. Kubota, T. Kobayashi, M. Yoshikawa, Y. Mishima, M. Suzuki, K. Mori and T. Cho
Plasma Research Center, University of Tsukuba, Tsukuba, Ibaraki 305-8577, Japan 1)National Institute for Fusion Science, Toki, Gifu 509-5292, Japan
2)Institute of Advanced Energy, Kyoto University, Gokasho, Uji 611-0011, Japan 3)Graduate school of Engineering, Hiroshima University, Hiroshima 739-8527, Japan
In the GAMMA10 tandem mirror, Hα line detectors are installed on the various places. Hαemission from plasma gives the information on neutral densities. Neutral particle provided by wall recycling and/or gas puffing is an important factor for investigations of particles balances, plasma-wall interactions, plasma fueling and so on [1]. Electron cyclotron heating (ECH) are applied in the central and plug/barrier cells. These are used for producing hot electrons and plasma confining potentials. In the initial period of the experiments, the plasma diamagnetic signals in the central cell remarkably decrease simultaneously with applying ECH in the central cell (CECH). At the same time, Hα line intensity increases particularly near the central mid-plane. After the considerable number of plasma discharges, however, the plasma diamagnetism increase even during CECH, where it is found that almost no appreciable changes in Hα line intensity are observed in the central cell. Recently, from visible light measurements by using high-speed cameras [2], the intense emission from the central limiter is confirmed when plasma diamagnetism decreases during CECH. Therefore, the intense emission is closely related to the degradation of the plasma performance. A Monte-Carlo simulation code (DEGAS) is applied for the purpose of the neutral transport analysis [3, 4]. In the mesh model designed for the present simulation, the inner structures of the vessel wall including the central limiter are precisely implemented. By using this model, neutral transport simulation including the effects of such source hydrogen from a limiter has been carried out for the first time. In this paper, the recycling source term is quantitatively evaluated from the result of DEGAS simulation and the calculation results are compared with the experimental results. The relationship between the limiter and the plasma during CECH and gas puffing will be discussed.
References
[1] Y. Nakashima et al, J.Nucl. Mater. 196-198, 493 (1992). [2] N. Nishino et al., Plasma Fusion. Res. 1, 035 (2006). [3] D. B. Heifetz et al., J. Comp. Phys. 46, 309 (1982). [4] D. P. Stotler et al., Phys. Plasmas. 3, 4084 (1996).
P7-19
Calculation of Fusion Condition of Hydrogen-Boron by I.C.F Method
B. Malekyneia1), M. Ghoranneviss1),A. Anvari2) and M. Rezvani1)
1)Plasma Physics Research Center, Islamic Azad University, Tehran, Iran. 2)Physics Dept. Sharif University, Tehran, Iran.
In order to arrive to clean and energy efficiency, the advantages of using advanced fuels for fusion have been recognized for a number of years, safety and environmental issues are two important problems. In order to avoid the radioactive tritium and undesired radioactivity induced by the generated neutrons (most will be used for breeding tritium in lithium surrounding the reaction and absorbing most of the neutrons), the very clean nuclear fusion reaction are Hydrogen - Boron. In this paper D-T fusion, H-B fusion theoretically are studied and calculated by computer simulation with ICF method, the results are comparable with the experimental data. In this computation the following cases are considered: Primary ionization and heating by laser, secondary heating and compressing by laser, and the reabsorbing of Bremsstrahlung and a-particles (they cause self-heating of the plasma) Calculations have two parts: calculating of optimum gain in input energy and calculating of plasma temperature in the confinement time. In this work it was seen the necessary input energy for H-B fusion is very much (GJ range) the results show that we can used to the output energy provided by D-T fusion for H-B fusion with adding a small D-T core in H-B fuel. Details and results will be discussed in full paper.
P8-01
Sheath Structure around Negatively Biased Probe in Electronegative Plasma
H.Matsuura, Y.Tomita1)
Osaka Prefecture University, Sakai Naka-ku, Osaka 599-8531,Japan 1) National Institute for Fusion Science, Toki, Gifu 509-5292, Japan
Langmuir probe method is widely used to determine plasma parameters such as electron temperature. It is based upon measuring the current onto a probe as a function of the probe voltage. Recently, new type probes, which measure momentum flux ( Combined force-Mach-Langmuir probe[1] ) or heat flux ( thermal probe[2] ), have been proposed. Since these flux are dependent upon sheath potential structure, precise knowledge on the sheath around biased probes is indispensable.
Recently, the effect of negative ions on the sheath potential structure has been studied by using Berkeley code( XOOPIC ). [3] By changing electrons with hydrogen negative ions, the simulation becomes unstable and numbers of hydrogen positive/ negative ion in the calculation geometry oscillates with time much slower than plasma oscillation period.
We confirmed the XOOPIC results of stable electropositive plasma by comparison with steady state solution of 1D collisionless Boltzmann equation. Then, we observed ion distribution function for unstable electronegative plasma. As there exist beam components in distribution function of electronegative plasma, a kind of two stream instability may occur. Detail discussion will be given at the conference.
References
[1] T.Lunt et al., 32th EPS Conference on Plasma Phys., P1-005, Tarragona, Spain. [2] H.Matsuura and T. Jida, Conrtib. Plasma Phys., 46(2006)406. [3] J.P.Verboncoeur et al.,Comp. Phys. Comm. 87 (1995) 199. [4] R.D.Smirnov, Dr.Thesis, The Graduate University for Advanced Studies, Toki, Gifu, 2005.
This work is performed with the support and under the auspices of the NIFS Collaborative Research Program.

P8-02
Development of ITER diagnostic upper port plug
K. Sato, J. Ohmori, K. Ebisawa1), Y. Kusama, Y. Neyatani
Japan Atomic Energy Agency 1)AITEL Corp.
A diagnostic device in ITER is planed to integrate in the “port plug”, which serves both as theneutron shield and enables diagnostics to access to the plasma in the severe radiationcircumstances of ITER. Only basic concept has been given for the port plug so far. In this work,the integration design of port plug including for manufacturing has been performed for the No.11upper port plug, which would be procured by Japan. The upper port plug structure should have enough margin of stiffness since the port plug is cantilevered structure with length of ~6 m and weight of ~22 t. To achieve such large stiffness, theupper port plug is designed to compose of forging material with thickness of 70 mm. To reducethe manufacturing cost, the commercial base material such as rolling material with thickness of 40mm was considered. The second moment of area and strains were calculated to evaluate thecombination of rolling material and the lib structure. As a result, this structure can be achieved asthe same stiffness as the present design. Three diagnostics will be installed in the No.11 upper port plug, i.e., the edge Thomson scattering system, the visible-IR TV divertor viewing system and the neutron activation system. To integratetheses diagnostic systems in the port plug, the labyrinth of optical path, the driving and cooling systems for shutters and mirrors, the maintenance space and the interaction of each other were considered. A space just behind the blanket shield module (BSM) was changed to use as a spacefor maintenance and for layout of associated diagnostic first mirror and shutter, whereas this place was assigned for neutron shielding. The neutron shield module in this space was moved in front offlange instead. The structure and the position of the BSM support, which is main componentinducing the electro-magnetic load, have been arranged to secure the optical path inside BSM. Three-dimensional model of partial vacuum vessel, port and blanket module, located around the port plug, was constructed for the electro-magnetic analysis. The upward fast VDE was selected tocalculate the EM loads because it produces the most severe load for the upper port plug. As aresult, maximum moment at the port flange was about 1 MNm, which is within the design guideline of the port plug.
P8-04
Advanced Probe Measurement System in TU-Heliac
Y. Tanaka, H. Takahashi, H. Utoh, M. Ogawa, J. Shinde, H. Aoyama, K. Iwazaki, H. Umetsu, A. Okamoto, K. Shinto, S. Kitajima, M. Yokoyama1), S. Inagaki1), Y. Suzuki1), K. Nishimura1),
M. Sasao
Tohoku University, Sendai, Miyagi 980-8579, Japan 1)National Institute for Fusion Science, Toki, Gifu 509-5292, Japan
In H-mode of tokamaks, formation of the radial electric field and the poloidal flow, decrease of Hαemission have been observed. The improvement of the confinement accompanied with these observations. Improved modes have been also observed in helical systems such as CHS, LHD, etc. The reduction of the transport in the improved modes is suggested that the radial electric field is formed and the anomalous transport is reduced by ExB flow or flow shear. An electrode biasing is recognized as a very powerful tool to control the radial electric field and a supersonic poloidal flow. Thus in the TU-Heliac, negative biasing experiments using a LaB6hot-cathode have been carried out. During biasing, formation of the radial electric field, increase of the electron line density, decrease of the density outside the last closed flux surface have been observed. Poloidal Mach number exceeded unity and reached 5 (supersonic regime). Density and potential fluctuation measurements are important to estimate the anomalous transport. Langmuir probe method is useful for the fluctuation measurement in low temperature plasmas. Ion saturation current fluctuation, which corresponded to density fluctuation, was measured in biased plasma. The fluctuation was suppressed in the frequency range less than 100 kHz. On the other hand, the fluctuation was increased in the region ~200 kHz. Langmuir probes for the floating potential fluctuation measurement were designed and applied in supersonic flow plasma.

P8-05
Mach Probe Measurements of Detached Plasmas in a Linear Plasma Device
N. Ezumi, T. Tsuchiya, M. Yamazaki
Nagano National College of Technology, Nagano 381-8550, Japan
Detached recombining plasmas have attracted great interest from the point of view of handling ofplasma heat flow in the divertor of magnetic confinement fusion experimental reactors. It makes a strong temperature gradient along the magnetic field. Recently, the importance of plasma flow for the formation of detached plasma has arisen [1, 2]. Plasma flow along magnetic field lines is an essential general issue and of particular importance for the proper functioning of the divertor. In particular, detailed and careful measurement of plasma flow in detached region is needed. However, there are some difficulty for flow measurement in that region because of low temperature and the limited accessibility so on. In this study, we have attempted to measure the plasma flow velocity in detached plasma in ourlinear plasma device by using Mach probes. In reference 3, a strong anomaly of the single Langmuir probe characteristics was reported in detached recombining plasmas, where the conventional analysis of the probe characteristics gives us a considerably high electron temperature compared with the value determined with the spectroscopic methods and proposed choosing suitable reference electrode or double probe for measuring detached plasma. Therefore, we must use probes with attention in detached plasmas. So that reason, in this study, using Mach probe consisted of two set of double probe for avoiding the uncertainty, we investigate the change of the flow pattern of attached to detached plasmas and discuss the influence of plasma flow on the plasma detachment.
References
[1] N. Asakura, S. Sakurai et al., Nucl. Fusion 39 (1999) 1983. [2] Hatayama, H. Segawa et al., Nucl. Fusion 40 (2000) 2009. [3] N. Ezumi, N. Ohno et al., Contrib. to Plasma Physics, Vol. 38 (1998) 31.
This work was partially supported by NIFS Collaborative Research Program (NIFS05KLPP009) and by the Ministry of Education, Culture, Sports, Science and Technology of Japan, Grant-in-Aid (No. 18740356).
P8-06
Measurement of Electron Density and Temperature and Their Fluctuations Using a Triple Langmuir Probe Grounded through Finite Resistance
M. Takeuchi1), K. Toi, R. Ikeda1), C. Suzuki and CHS Group
National Institute for Fusion Science, Toki 509-5292, Japan 1)Department of Energy Engineering and Science, Nagoya University, Nagoya 464-8603, Japan
In the triple Langmuir probe method, the electron temperature (Te) is derived on the assumption that the current is not drawn from plasma through a potential measurement circuit and the electron density (ne) is derived from the ion saturation current (Iis). In the case of aiming at measuring high-frequency fluctuations, however, the smaller the load resistance in a potential measurement circuit is, the better the frequency characteristics are. Then the finite current flows in the circuit of measurement of the floating potential (Vf) and the plus-biased potential (Vp). Recently, we are performing a simulation experiment of plasma transport in high temperature and density plasma using low temperature and density one. In the low temperature and density plasma of the ne < ~5x10¹⁷ m-3 and Te < 30 eV, the current of the circuit of Vf and Vp become comparable to the measured Iis. In this situation, the effect of finite currents in Vf and Vp measurement circuits should be taken into account in order to derive Te using the triple probe data. We have derived amodified expression to derive Te from the probe data here the finite current in the circuits of the Vf and Vp, and confirmed the applicability of the expression experimentally.

P8-07
Calibration of Fast Ion Flux Measured by a Directional Probe
K. Nagaoka, M. Isobe, K. Toi, K. Goto1), M. Osakabe, Y. Takeiri, K.Y. Watanabe, CHS experimental group
National Institute for Fusion Science, Toki, Gifu 509-5292, Japan 1)Nagoya University, Nagoya, Aichi 464-8603, Japan
Fast ion confinement is one of the most important key issues for burning plasmas, such as, ITER. Significant enhancement due to MHD activities, such as, toroidicity-induced Alfven eigenmodes (TAE), energetic particle modes (EPM) were observed in many devices, and strongly studied both experimentally and theoretically. In order to observe fast ion behaviors associated with MHD activities, a directional Langmuir probe method was applied for plasma heated by neutral beam in CHS, and observed fast ion behaviors synchronized with MHD activities. A directional probe can measure local behavior of fast ions with high time resolution. On the other hand, absolute value of fast ion flux is difficult because of secondary electron emission from probe surface. In order to evaluate secondary electron effect, an experimental calibration of the probe method was performed using beam produced by (neutral beam injector) NBI. The neutral beam and a mixture beam of neutrals and residual ions were irradiated to the probe, and the beam currents and secondary electron currents were measured. The secondary electron emission efficiencies were obtained against neutral beam and ion beam. The efficiency for ion beam is sensitive to the beam energy, though that for neutral beam has little energy dependence in the energy region of 20 keV to 35 keV.
References
[1]K. Nagaoka, M. Isobe, K. Shinohara, M. Osakabe, A. Shimizu and S. Okamura, Plasma and Fusion Res. 1 (2006) 005.
This work was supported by NIFS05ULPD609 and by a Grant-in-Aid of Ministry of Education, Culture, Sports, Science and Technology of Japan (15740333)

P8-08
Probing of toroidal electron plasmas confined in CHS magnetic surfaces
Y.Yamamoto, H.Himura, A.Sanpei, S.Masamune M.Isobe1), S.Okamura1)
Kyoto Institute of technology, Department of Electronics, Matsugasaki, Kyoto 606-8585, Japan 1)National Institute for Fusion Science, Toki, Gifu 509-5292, Japan
This paper describes the details on the probing applied to helical electron plasmas having low density ne and large negative space potential φs.
Since 1923, the Langmuir probe has been used for measuring plasma particle flux Γ and φs. Even at present, it is employed for various plasma experiments on such as basic plasma physics and peripheral layer of fusion plasmas. Although various types of the probe have been developed, the typical bias voltage Vp is at most in the range between -100 and +100 V. However, when we apply the probing to toroidal pure electron plasmas, Vp needs to be much higher because of thelarge value of φs. For example, typical values of φs of helical electron plasmas on CHS is down toabout – 1 kV. This result requires that Vp must be swept down to about -1.5 kV or less in orderto obtain current-voltage (I-V) characteristics. Also, since there are ideally no ions, the I-Vcharacteristic is completely different from that of neutral plasmas. In addition, assuming thatelectron temperature Te is ~ 100 eV of helical electron plasmas, the electron Debye length λD is calculated to be ~ 7.5 cm for ne ~ 1012 m-3, which is comparable to the plasma characteristic length (10 cm). In this case, the I-V characteristic is expected to an orbital motion limited regime. Finally, the electron plasmas possess fast E×B flow, so that the obtained I-V characteristic wouldspread more, showing non-Maxwellian distribution as well as those observed in space plasmas.
In this research, with details of the probing system especially for the helical electron plasmasconfined in CHS magnetic surfaces, we discuss the probing for plasmas with large φs and low ne.In the developed electronics, a differential circuit using an instrumentation amplifier (INA111) isemployed. And, in order to accurately set the differential input resistance, a trimmer (500 Ω) isinstalled between the two input terminals. Since ne of the plasmas is relatively low, the measured Ibecomes smaller. Thus, in the feedback resistors of the circuit, the trick of a T-network is appliedto reduce the effect of thermal noise from the resistors. With regard to the measurement of φs, ahigh voltage probe (Tektronix P6015A) with an output impedance of 47Ω is employed. Thereference potential of the circuit is grounded across a low resistor (100 Ω), which can cancel thesignificant ground loop voltage arising around large devices such as CHS. Typical data are alsopresented.

P8-09
Technique of MHD mode analysis using magnetic measurements in heliotron plasmas
S.Sakakibara and LHD Experimental Group
National Institute for Fusion Science, Toki, Gifu 509-5292, Japan
Identification of low-n MHD instability is important to understand characteristics of the mode and its effect on plasma confinement, and its analysis technique by using magnetic sensors such as probes and flux loops has been established through long-term experiments in various magnetic confinement devices. The recent fusion devices have complex shape of plasma cross-section compared with conventional machines and a spatial limitation to an installation of magnetic sensors, whereas the accurate measurements of Fourier components of magnetic perturbations are required as before. In the case of the heliotrons with non-axial configuration, the magnetic field lines have ripples due to the field period of helical coils, which makes an identification of the mode structure difficult as well as toroidal effects even if magnetic sensors are installed at ideal locations. Therefore, in Large Helical Device (LHD), the multi-filaments are put along the specific magnetic field line on the Boozer coordinate, and magnetic field and flux at sensor position are estimated for identifying spatial mode structure. The 3-D MHD equilibrium code VMEC was used for transformation to Boozer coordinate. This technique can be applied to finite-beta plasmas with large Shafranov shift. Since the LHD has several low-order rational surfaces in the periphery with magnetic hill, pressure-driven modes excited there have been well observed in finite beta plasmas [1,2]. In order to verify the validity of the mode identification, the experiment for controlling the peripheral pressure gradient was done by inserting the pump limiter [3]. As the results, MHD modes disappeared one after another with inserting the limiter, and it has been found out that their disappearances are consistent with reduction of pressure gradient on each resonant surface.
References
[1] S.Sakakibara et al., Plasma Phys. Control Fusion 44 (2002) A217. [2] S.Sakakibara et al., Fusion Science and Technology 50 (2006) 117. [3] S.Sakakibara et al.,, accepted to Plasma Fusion Research.
P8-10
Magnetic Diagnostics of Magnetic Island in LHD
Y. Narushima, K.Y. Watanabe, S. Sakakibara, N. Ohyabu, H. Yamada, K.Narihara, I.Yamada, T.Morisaki, S.Inagaki, Y.Nagayama, A.Komori and LHD exp. group
W.A.Cooper1)
National Institute for Fusion Science, Toki, Gifu 509-5292, Japan 1)CRPP Association Euratom / Confederartion Suisse, EPFL, 1015 Lausanne, Switzerland
Characteristics of magnetic islands are investigated measuring by the magnetic diagnostics in theLarge Helical Device (LHD). The magnetic island enlarges or shrinks during a plasma dischargewithout any active controls, which is observed by the change of the local flattening shape of theelectron temperature profile measured with the Thomson scattering. However, that profile can beobtained at only one toroidal position and therefore gives limited knowledge of the structure of theisland. On the other hand, the structure of the magnetic island can be estimated from measuringthe perturbed magnetic field appearing when a magnetic island changes. To measure the toroidalprofile of the perturbed magnetic field δb(φ) originated from the plasma, the toroidal array of 5magnetic flux loops is set at the outer ports in the LHD. The amplitude and the Fourier componentof the toroidal profile of the δb(φ) correspond to the width and the toroidal mode number of themagnetic island. Also, the phase of the toroidal profile of the δb(φ) which corresponds to thetoroidal position of the X-point of the magnetic island can be estimated. When the seed islandproduced by the externally imposed static error field exists, the enlargement of the width of themagnetic island and the increase of the δb(φ) are observed. At the same time, the phase of thetoroidal profile of the δb(φ) and the static error field is almost the same.
This work is supported by NIFS under Contract No.NIFS06ULHH518.
P8-11
Current Profile Dependence of CCS Method to Reproduce Spherical Tokamak Plasma Shape
F. Wang, K. Nakamura1), O. Mitarai2), K. Kurihara3), Y. Kawamata3), M. Sueoka3), K. N. Sato1), H. Zushi1), K. Hanada1), M. Sakamoto1), H. Idei1), M. Hasegawa1), S. Kawasaki1), H.
Nakashima1), A. Higashijima1)
AEES, Kyushu University, 6-1 Kasuga-Koen,Kasuga City, Fukuoka 816-8580, Japan (1) RIAM, Kyushu University, (2) Kyushu Tokai University, (3) Japan Atomic Energy Agency
From the viewpoint of plasma control, plasma shape reproduction in tokamak is very important,especially for the non-circular and triangular plasmas. The Compact PWI experimental Device (CPD) is a new small Spherical Tokamak (ST) in Kyushu University. Compared with the conventional tokamaks, ST has high natural elongation and natural triangularity, and the equilibrium and stability properties are much different because of the much smaller aspect ratio. As for a divertor configuration, the X-point and neutral line control is also important. The Cauchy-Condition Surface (CCS) method is a kind of numerical method to reproduce plasmashape with magnetic measurement [1]. With the magnetic sensors, the flux distribution and plasma shape can be calculated. The CCS method will be adopted in the real-time plasma control and shape displaying of CPD. It can reproduce plasma shape of spherical tokamak in good precision solely with the measurements of flux loops or magnetic sensors [2]. In case of much elongated and triangular plasmas in spherical tokamak, good precision can be achieved by increase in degrees of parametric freedom representing the Cauchy condition. There are various kinds of plasma current profiles in the discharge experiments. In order to controlplasma shape precisely in real-time, the current profile dependence of CCS method to reproduce ST plasma shape will be studied. Firstly, various ideal flux surfaces corresponded to different plasma profiles are made by equilibrium code. Secondly, these plasma shapes are reproduced by using CCS method. Thirdly, the original and reproduced shapes are compared. The current profile dependence will be described in detail.
References
[1] K. Kurihara, Nuclear Fusion, Vol.33, No.3 (1993) 399-412. [2] F. Wang, et al., Proc. 7th Cross Straits Symposium, Kyushu University (2005) 29-30.
P8-12
Two-dimensional edge density measurements in the Large Helical Device
H. Tsuchiya, T. Morisaki1), A. Komori1), Y. Takahashi2), K. Toi1), O. Motojima1) and LHD Experimental Group1)
Graduate University for Advanced Studies, Toki, Gifu 509-5292, Japan 1) National Institute for Fusion Science, Toki 509-5292, Japan
2) Department of Energy Engineering and Science, Nagoya University, Nagoya, Aichi 464-8603,Japan
The edge plasma has been considered to affect the overall energy and particle confinement in fusion test devices such as tokamaks and stellarators, since the formation of the transport barrier, excitation of turbulent fluctuation, edge localized modes, ELMs, blobs, etc. are taken place in this region. Recently it has been known that such phenomena do not always appear symmetrically in toroidal and/or poloidal directions. Thus the one-point or one-dimensional (1D) measurement by using e.g. a conventional Langmuir probe is not sufficient to know the overall picture of the phenomena. For the physical understanding, the two-dimensional (2D) imaging system must be needed, and be helpful. We have developed a sheet-shaped thermal lithium beam probe (LiBP) to measure electron density profiles two-dimensionally with high time and spatial resolutions. With the diagnostics, 2D-emission distributions of Li resonance line (670.8nm) at the poloidal cross section have successfully been observed by using a CCD camera, and 2D-density profiles have also beenacquired with the beam attenuation method. Recently, density fluctuation measurement at several points on the poloidal plane has started, and preliminary results have been obtained with various discharges in the Large Helical Device (LHD). At the conference, the performance of the 2D-beam itself and validity of the reconstruction method for fast phenomena are also discussed.

P8-13
Measurement of 3-D Mode Structure of the Edge Harmonic Oscillations in CHS using Beam Emission Spectroscopy
T. Oishi, S. Kado1), M. Yoshinuma, K. Ida, T. Akiyama, T. Minami, K. Nagaoka, A. Shimizu, S. Okamura, and CHS group
National Institute for Fusion Science, 322-6 Oroshi-cho, Toki, Gifu 509-5292, Japan 1) High Temperature Plasma Center, The University of Tokyo, 5-1-5 Kashiwanoha, Kashiwa,
Chiba 277-8568, Japan
A coherent magnetohydrodinamic (MHD) mode which has characteristics similar to those of theedge harmonic oscillation (EHO) in the quiescent H-mode of tokamaks [1] has been observed inthe compact helical system (CHS) [2], which is a low-aspect-ratio, middle size heliotron (majorradius = 1 m, minor radius = 0.2 m, toroidal period number = 8, poloidal mode number = 2) in thedischarges with the edge transport barrier (ETB) [3]. EHO in CHS has the fundamental frequencyof 3 - 5 kHz and its second and third harmonics. It has a peak amplitude at approximately thenormalized minor radius ρ = 0.95. In the present study, the spatial structure such as correlation, wavenumber, and propagation of EHO in CHS is investigated using the beam emission spectroscopy (BES) and the magnetic probe array. BES has been developed in CHS to simultaneously measure both local density fluctuationsand gradients [4]. It detects emissions from the neutral beam atoms which are excited throughcollisions with bulk plasmas. The hydrogen neutral beam for heating with the acceleration voltageof about 32 keV is used for the probe beam. The avalanche photo-diode detectors combined with a100 kHz low-pass filter are used as photon detectors. Since the observable region is theintersection of the beam line and the sightline, local values and their correlations can be obtained.The viewing chords used in BES consist of an array of 16 optical fibers with an object lens. Onecan select the arrangement of the fibers in radial or poloidal direction to measure radial or poloidal structure of the fluctuations. Magnetic probe array is also used to measure both poloidal andtoroidal structure. NIFS Collaborative Research Program (NIFS02KZPD003).
References
[1] C. M. Greenfield, K. H. Burrell, J. C. DeBoo et al., Phys. Rev. Lett. 86, 4544 (2001). [2] T. Oishi, S. Kado, M. Yoshinuma et al., Nucl. Fusion 46, 317 (2006). [3] S. Okamura, T. Minami, C. Suzuki et al., J. Plas. Fus. Res. 79, 977 (2003). [4] T. Oishi, S. Tanaka, S. Kado et al., Rev. Sci. Instrum. 75, 4118 (2004).
P8-14
Potential measurement with 6 MeV Heavy Ion Beam Probe on LHD
A. Shimizu, T. Ido, M. Nishiura, H. Nakano, S. Kato, M. Yokota, K. Tsukada, H. Ogawa, T. Inoue, A. Nishizawa1), Y. Hamada and LHD group
National Institute for Fusion Science, Toki, Gifu, 509-5292, Japan 1) Tono Geoscience Center, Japan Atomic Energy Agency, Toki, Gifu, 509-5102, Japan
In a helical configuration of toroidal magnetic field confinement system, the electric field plays animportant role on its neoclassical transport. Moreover, it is predicted theoretically that shear of electric field makes correlation length of turbulence in plasma shorter, by which the reduction of the anomalous transport is achieved. A heavy ion beam probe (HIBP) is a diagnostic tool to measure the potential directly in theinterior of high temperature plasma with good spatial/temporal resolution. Therefore, it is a veryuseful tool to study above subjects, namely, the relation between electric field and confinement experimentally. In Large Helical Device, HIBP system, of which probing beam is 6 MeV Au+, was installed and has been developed. In this system, the beam of Au- produced by the plasma-sputter ion source is injected to the tandem accelerator, and in a gas cell at the center of accelerator the charges are stripped so that Au+ beam is produced. Au+ beam is transferred to LHD plasma through several components of beam line, such as 4.8m cylindrical deflector, 7.8 degree deflector, 8 pole sweeper. In the plasma,Au+ beam is stripped electron and transformed to doubly charged beam, Au2+, mainly by electron impact, and this beam is guided to the tandem energy analyzer by another 8 pole sweeper located at the exit port. To detect a very small amount of current of Au2+ beam, we use the high gain current detector, MCP(micro channel plate). The recent improved points of our system are as follows: Electric plates of 7.8 degree deflector aremodified. By this modification, the occurrence of discharge between electric plates on thecondition of high magnetic field (>2.8T) can be suppressed successfully. The new ion source thathas larger size of target plate and plasma volume is made and tested. In the test stand, obtainedAu- current is 5 times larger than that from the previous one. Into the gas cell, a circulating systemusing turbo molecular pump is installed. Compared with the case of w/o circulating system, thefraction of Au+ becomes two times larger. Many monitoring system are installed to check thesmall change in voltage and current of many voltage supplies for steerers, Q-lenses, deflectors.The change in the tandem accelerator voltage is also monitored. These monitoring systems willmake our potential measurements more reliable. We will report the results of beam-orbitcalibration and potential measurements in plasma in detail.

P8-15
Estimate of ionization cross sections for a heavy ion beam probe
M. Nishiura, T. Ido, A. Shimizu, S. Kato, K. Tsukada, M. Yokota, H. Ogawa, T. Inoue, H. Nakano, Y. Hamada, and LHD Experimental Group
National Institute for Fusion Science, National Institutes of Natural Sciences, 322-6 Oroshi, Toki, Gifu, 509-5292 Japan
A heavy ion beam probe (HIBP) system has been installed in the Large Helical Device (LHD) at NIFS to measure the local plasma potential and fluctuation. The accelerated Au- beam undergoes double charge exchange and the resulting Au+ beam (primary beam), which normally reaches up to 6 MeV, is injected into the LHD plasma. The ionized beam (secondary beam : Au 2+) with a trajectory in plasmas is detected by the energy analyzer. The local potential is obtained from thesignals of the energy analyzer. The ratio of primary beam current to secondary beam current is predicted by taking into account the beam attenuation in LHD. [1] They uses the ionization cross sections for Au+ and Au2+ as a substitute for those obtained by the empirical formulae. Using the experimental signals of primaryand secondary beams, which have recently been measured successfully in LHD, the validity of ionization cross sections is discussed. These ionization cross sections are essential to thereconstruction of electron density profiles from the primary and the secondary beam signals.
References
[1] A. Fujisawa, H. Iguchi, A. Taniike, M. Sasao, Y. Hamada, IEEE trans. on Plasma Sci. Vol. 22. No. 4, (1994)395.
This work is supported by NIFS06ULBB505 and JSPS Grant No.18740357.
P8-17
Structure of sample volumes of the heavy ion beam probe in LHD
T. Ido, A. Shimizu, M. Nishiura, S. Kato, A. Nishizawa1), H. Nakano, K. Tsukada, M. Yokota, H. Ogawa, T. Inoue, Y. Hamada, the LHD Experimental Group
National Institute for Fusion Science, Oroshi-cho, Toki-shi, Gifu, 509-5292, Japan 1)Tono Geoscience Center, Japan Atomic Energy Agency, Toki, Gifu, Japan
The heavy ion beam probe (HIBP) is a unique tool to measure the electrostatic potential anddensity fluctuation in high temperature plasmas directly and simultaneously. We have installed an HIBP in the Large Helical Device (LHD)[1], and recently it was verified that the HIBP could measure the potential in the plasmas [2][3]. One of the interesting phenomena in magnetically confined plasmas is the transition of radialelectric field (Er). For example, a drastic change in Er is observed in local area during the formation of the internal transport barrier (ITB) in the LHD. In order to study such local transition phenomena, the appropriate spatial resolution is required. In HIBPs, the detected beam comes from a finite volume which is determined by the width of theinjected beam and the opening of the slit in front of the energy analyzer. It is referred to as the sample volume. The size of the sample volume determines the spatial resolution of the HIBP. Thus, the estimation and the control of the structure of the sample volume are important. The sample volume is estimated by the trajectory calculation. Assuming an initially parallel,circular cross-section beam with 2 mm diameter, which is measured at the injection port to the LHD, the shape of the sample volume becomes an elongated ellipse, and the largest dimension is about 25 mm when the sample volume is located at the center of the plasma. This spatial resolution is sufficient to measure the change in the potential profile during the formation of ITB probably, though it may be inadequate to measure micro-instabilities. In the presentation, the effect of the emittance and the energy spread of the probing beam will beshown, and the optimization of the structure of the sample volume will be discussed.
References
[1] A. Nishizawa, et al., Proc. 10th Int. Conf. and School on Plasma Phys. and Control. Fusion, Alushta(Ukurine),(2004) [2] T.Ido, et al., 16th Topical Conference on High-Temperature Plasma Diagnostics (2006) Williamsburg, Virginia (Published in Rev.Sci.Instrum.) [3] T.Ido, et al., Proc.33rd EPS conf. on plasma physics(Rome, Italy, 2006), P4.119.

P8-18
Observation of the effects of radially sheared electric fields by the use of a gold neutral beam probe
Y. Miyata, T. Cho, M. Yoshikawa, Y. Nakashima, M. Hirata, N. Kaidou, H. Kakiuchi, M. Motegi, S. Goshu, M. Mizuguchi, T. Numakura, J. Kohagura
Plasma Research Center, University of Tsukuba, Ibaraki 305-8577, Japan
In the tandem mirror GAMMA 10, the electrostatic potentials have originally been produced in the plug and barrier regions so as to improve the confinement of central-cell ions and electrons, respectively. Recently, high power gyrotrons (28 GHz, 0.5 MW) significantly enhance the potential heights [1]. The advance in the potential formation gives bases for a finding of the remarkable effects of radially produced shear of electric fields dEr/dr, or non-uniform sheared plasma rotation on the suppression of intermittent vortex-like turbulent fluctuations. Such a shear effect is visually highlighted by X-ray tomography diagnostics. During the application of plug electron-cyclotron heating (ECH), the produced stronger Er shear results in disappearance of such intermittent turbulent vortices with plasma confinement improvement [1,2]. A Gold Neutral Beam Probe (GNBP) in the central cell is employed for measuring (1) profiles of radially formed potential as well as the associated radially sheared Er in the central cell. (2) By the use of a capability of good time and energy resolution of the GNBP system for the present phenomena, potential fluctuations are also investigated from the viewpoint of finding the relation between Er shear and the fluctuation suppression.
References
[1] T. Cho et al., Phys. Rev. Lett. 94, 085002 (2005) [2] T. Cho et al., Phys. Rev. Lett. 97, 055001 (2006)

P8-19
Beam Probe Imaging Method for Edge Plasma Modeling in CHS
H. Iguchi, K. Nakamura, and CHS Group
National Institute for Fusion Science, Toki-shi, 509-5292 Japan
Edge magnetic field line structure outside the last closed flux surface (LCFS) in helical devices isgenerally chaotic and plasmas confined in the area are intrinsically three-dimensional. Field line mapping on a poloidal cross-section, which is often referred as Poincare plots, is a good index of a chaotic structure of the magnetic field outside the LCFS. Plasmas confined in the region cannot bedescribed as a simple flux function as is done for core plasmas confined in closed flux surfaces. Inorder to study plasma structure and behavior in the chaotic region, two-dimensional diagnostic is essential. Direct comparison of two-dimensional plasma distribution with the chaotic field linemapping is a promising approach to understand the full three-dimensional plasma structure in the region, which is necessary for a practical helical divertor design in fusion reactors. We have developed a neutral lithium beam probe (LiBP) with scannable beam injection angle in apoloidal cross section, which gives a two-dimensional plasma distribution in the edge and separatrix region. This is a kind of imaging diagnostic by the use of the beam probe method. Theup-down asymmetry of the plasma structure is observed in the horizontally elongated poloidal cross-section, where the chaotic filed line structure shows up-down symmetry. The plasmaasymmetry reverses when the magnetic filed direction reverses, suggesting that poloidal drift motion of plasma particles associated with field line non-uniformity plays a key for steady state plasma distribution in the region. Such asymmetry will be the source of non-uniform heatdeposition on divertor plates observed several helical devices. Plasma structure and behavior inthe ergodic layer, which is artificially applied for ELM stabilization, is also a growing concern in tokamaks. The beam probe imaging method will be useful for modeling of such plasmas.
References
[1] K. Nakamura, H. Iguchi, et al., Rev. Sci. Instrum. Vol. 76(2005) 013504/1-9
P8-20
Two dimensional Li beam imaging to study the magnetic field configuration effects on plasma confinement in spherical tokamak CPD
R.Bhattacharyay, H.Zushi1), T.Morisaki2), K.Kikukawa, S.Watanabe, Y.Inada, H.Tsuchiya2), K.Hanada1) and CPD Group
Interdisciplinary Graduate School of Engineering Science, Kyushu University, Kasuga, Fukuoka 816-8580, Japan
1)Research Institute of Applied Mechanics, Kyushu University, Kasuga, Fukuoka 816-8580, Japan2)National Institute for Fusion Science, Toki, Gifu 509-5292, Japan
Spherical Tokamak (ST) can suatain a high beta plasma in a compact shape of low aspect ratio and hence is considered to be the most economical fusion reactor concept. The possibilities of rapid current ramp up in ECH plasma with only 1-2 kA initial plasma current has been demonstrated in the small ST device LATE [1] in a weak mirror configuration. Such current rise in the presence of Bz is considered to be responsible for the change of magnetic field topology from a open field equilibrium to a closed field equilibrium. Thus it is important to study the change in plasma confinement mechanism in various types of magnetic field configurations. Recently two dimensional Li beam imaging technique [2] has been used to study the topological effects of various magnetic field configurations on the plasma confinement during RF as well as ohmic phase in the spherical tokamak CPD. CPD is a compact ST device (R0 = 0.3 m, a0 = 0.2 m) with central solenoid, four TF coils and three set of poloidal field coils. A set of 8.2 GHz Klystrons (8 × 25 kW, CW) is used to initiate theRF plasma and for ECH. In order to investigate plasma confinement topology under various magnetic field configurations and to obtain the density contour in the lower half of CPD plasma a2D density imaging system is installed which is composed of a sheet thermal Li beam injector at the bottom of the chamber and a CCD camera equipped with an optical filter (670.8 ± 0.5 nm) atthe lower half of midplane. 2D images of LiI resonance line (300 × 500 mm2) are recorded with a time resolution of 1 ms and spatial resolution of ~1 mm. The performance of the sheet beam is absolutely calibrated by a quartz crystal monitor and the width and uniformity of the sheet beam are also confirmed. Recent experimental results with RF plasma in magnetic null configuration and in the presence of Bz are summarised as follows. While a sharp lower boundary is found to exist for the RF plasma in magnetic null configuration, existence of such boundary in the presence of Bz is found to depend on the decay index of Bzinside the plasma volume. With a small negative decay index of Bz no such boundary is observed, but boundary is found to exist with a positive decay index of Bz. Overdense plasma formation is observed in all these cases. All these experimental results along with the results of plasma confinement in ohmic configuration and possible mechanism for overdense plasma formation will be discussed in this paper.
References
[1] T. Maekawa et al. Nucl. Fusion 45 (2005) 1439. [2] H. Zushi et al., PSI17, P3-58, China, May 22-26, 2006.
P8-21
Numerical Simulation of a High-Brightness Lithium Ion Gun for a Zeeman Polarimetry on JT-60U
A.Kojima, K.Kamiya, H.Iguchi1), T.Fujita, Y.Kamada
Japan Atomic Energy Agency, Naka, Ibaraki 311-0193, Japan 1)National Institute for Fusion Science, Toki, Gifu 509-5292, Japan
Understanding of the structure of the edge pedestal region is one of the important issues for tokamaks. Particularly, the edge current density caused by a strong pressure gradient accompanied by H-mode affects magneto-hydrodynamic (MHD) stability and edge localized mode (ELM) [1]. Then a Zeeman polarimetry by use of a neutral lithium beam has been developed for the measurement of the edge current profile [2]. The Zeeman polarimetry can obtain the pitch angle of the magnetic field from a polarization angle of the Zeeman component of the Li 2S-2P line. Recently, the Li Zeeman polarimetry is planned on JT-60U, and a high-brightness ion gun is developed for the purpose of a good signal-to-noise ratio. For the achievement of high spatial and temporal resolutions, the performance of the ion gun is one of the important components. The ion gun consists of an ion source, acceleration electrodes, an electron suppressing electrode,an einzel lens, XY sweepers, and a neutralizer. A 50 mm thermionic cathode of a porous tungstendisk with β-eucryptite is used for the high brightness ion source. The Li+ beam is accelerated to 30 keV and neutralized by sodium vapor in the neutralizer. The beam current above 10 mA and the beam radius below 15 mm are expected for the good resolutions. However, the beam transport length of the neutral beam from the neutralizer to the plasma is about 5 m. Then, the requirement of a divergence angle is below 0.17 degrees. The initial performance of the prototype ion gun is investigated by the numerical simulation including the space-charge effects. Child-Langmuir current of the ion gun is estimated to be about 30 mA, and the current density is about 15 A/m2. The ion beam hit the anode due to spread caused by the space-charge effects. Therefore, the acceleration electrodes need to be considered to achieve the low beam loss, the high Child-Langmuir current and optimized focal length. The geometry of the einzel lens also needs to be optimized so as to focus and collimate the beam on the neutralizer, because the neutralized position is important parameter in order to obtain the low divergence angle. As a result, the policy of a new design of the high-brightness ion gun is obtained by the numerical simulation.
References
[1] D. M. Thomas, et al., Phys. Plasmas 12, 056123 (2005). [2] D. M. Thomas, Rev. Sci. Instrum. 72, 1023 (2001).

P8-22
Proof of principle experiment of a fast He0 beam production for alpha particle diagnostics
N. Tanaka, H. Sugawara, S. Takeuchi, S. Asakawa, A. Okamoto, K, Shinto, S. Kitajima, M. Sasao, M. Wada1)
Tohoku Univerisity, Sendai, Miyagi 980-8579, Japan (1) Doshisha University, Kyotanabe, Kyoto 610-0321, Japan
Alpha particles produced at 3.5 MeV by D-T reactions are important to sustain self-burning plasmas, and their properties such as spatial distributions and velocity distributions should be measured. In order to make alpha particles to escape from confined plasmas it's proposed that a3He0 beam is injected into plasmas and an alpha particle is neutralized by capturing two electrons from 3He0. We estimated the energy of a 3He0 beam to be about 1.7 MeV. This diagnosticsmethod is one of candidate methods for ITER. [1] We are developing a small sized beam devicefor proof of principle experiment of this method. The energy of a produced neutral helium beamwill be below 150 keV. The process of a fast He0 beam production is following. A He+ of 30 keV beam extracted from multicusp ion source at 15-30 keV enters into an alkali metal charge exchange cell, where we consider to use Lithium at the first run, and is charge exchanged to He+, He0 and He- beams. By bending magnet, a He+ beam is bended to 30 degree and detected by a calorimeter, a He0 beam detected by a pyro electric detector and calorimeter at 0 degree, and a He-
beam is bended to 90 degree. A He- beam is injected into an electrostatic accelerator and it’saccelerated up to 180keV. A He- ion becomes a He0 by auto detachment during free flight in the tube. The beams obtained from this system have several properties to be studied. (1) A He- beam produced at charge exchange cell has energy distributions because of energy losses by collision with Lithium gas in the cell. (2) According to Schlacter and Loyd, the maximum value of thecalculated double charge exchange efficiency of a He+ beam in Lithium is 0.5 %[2]. Because theexperimental efficiency is different from calculated one, we have to measure it by detecting currents of every beams at downstream of the cell and an injected He+ beams. (3) Fast He0
particles obtained in the free flight tube have two electron states. One is 1s2 1S0 ground state by auto detachment and the other is 1s2s 3S1 metastable state He* by collisional detachment, which is undesired for the diagnostics. The ratio of He* (1s2s 3S1) / He0 (1s2 1S0) should be studied by laser induced fluorescence or other methods.
References
[1] M. Sasao, T. Taniike, Rev. Sci. Instrum. 69, (1998)1063 [2] A. S. Schlacter, D. H. Loyd, Phys. Rev. 174, (1968)201
P8-23
Raman and Rayleigh Calibrations of the LHD YAG Thomson Scattering
I.Yamada, K.Narihara, H.Hayashi, and H.Funaba
National Institute for Fusion Science, Toki, Gifu 509-5292, Japan
The LHD YAG Thomson scattering [1][2] has been applied successfully to the measurements of electron temperature profiles of LHD plasmas. For electron density measurements, absolute calibration is required, and some techniques have been proposed, Rayleigh and Raman calibrations. In previous experiments, we have applied Raman calibration to obtain reliable absolute calibration factors [3]. In this experiment, we tried Rayleigh calibration as well as Raman calibration.
Since Rayleigh scattering doesn't shift the wavelength, special wavelength channel for detecting unshifted Rayleigh scattered light must be equipped in polychrometors, and very careful measures to suppress strong stray light are required. These are disadvantages in Rayleigh calibration. Especially the latter will be a serious problem in many cases. We eliminated the difficulty as follows. Generally, Rayleigh scattering signal intensity is proportional to scattering cross section, gas density, and laser intensity, whereas stray signal is proportional to laser intensity only. Therefore, the stray light can be reduced by decreasing laser intensity. In the Rayleigh calibration, we decreased laser intensity by about 10-4-10-5 (1-10 mJ/pulse). Even in such cases, necessary scattering signal intensity can be obtained easily because Rayleigh cross section is very large. It is noted that 20 polychrometors with a Rayleigh wavelength channel have been calibrated by both Rayleigh and Raman calibrations whereas the other 124 polychrometors without a special Rayleigh channel have been calibrated by only Raman calibration.
In the both Raman and Rayleigh calibrations, pure nitrogen gas was introduced into the LHD vacuum chamber up to 50 kPa. As expected, both of them show a clear linear gas density dependence. Absolute calibration factors for electron density measurements are directly determined from the gradients [3]. We have obtained reliable calibration factors from both Raman and Rayleigh calibrations in the LHD YAG Thomson scattering. Detailed results of the Raman and Rayleigh calibrations will be reported at the conference.
References
[1] Narihara, K., et al., Fusion Eng. Design, Vol.34-35, 67-72 (1997). [2] I. Yamada et al., J. Plasma Fusion Res., Vol.76, 863-867 (2000). [3] I. Yamada et al., Rev. Sci. Instrum., Vol.74, No.3, 1675-1678 (2003).

P8-24
Improving the Thomson Scattering Diagnostic installed on the Large Helical Device
K. Narihara, I. Yamada, H. Hayashi and H. Funaba
National Institute for Fusion Science, Toki 509-5292, Japan
A problem that we are now confronting in measuring electron temperature (Te) and density (ne) of high density plasmas with central ne > 1020m-3* using the Thomson scattering diagnostic installedon the Large Helical Device is the low confidence on the data validity. This problem arises fromthe super luminous plasma back/fore-ground radiation, which boosts the DC current on theavalanche photo diodes (APD), exceeding the linear operating regime. To solve this problem to alarge extent, we first must monitor the DC-level of the APD's outputs during plasma discharge.For this, we newly installed a 1024ch-scanning ADC to monitor the APD’s outputs, which aresupposed to change slowly. Instead of the presently-used scheme of adjusting APD's output signalsizes by reducing the aperture size on the light collection window, we are planning to adjust thehigh voltage applied on each APD so that it works in the linear operating region. For this schemeto be valid, we must precisely calibrate the spectrum-responsivity of each polychromator for eachhigh-voltage-combination. This tremendously time-consuming task will be pursued efficiently byilluminating a chopped blackbody radiation with well-known radiation temperature on a whitereflecting plate attached on the light collection window and the diffusely reflected light beinganalysed. This method will also enable inter-shot calibration of polychromators. Furthermore, ashort pulse white light from a super-continuum generator is considered in the future for a real time(inter-laser-shot) calibration, which will raise the confidence on the data-validity even in thenonlinear operation regime of the APD.

P8-25
Development of 2-D Thomson Scattering Measurement Using Multiple Reflection and the Time-of-Flight of Laser Light
T.Sumikawa, K.Yamashita, E.Kawamori1), Y.Ono
Graduate School of Frontier Science, University of Tokyo, Tokyo 113-8656, Japan 1)High Temperature Plasma Center, University of Tokyo, Tokyo 113-8656, Japan
Two-Dimensional Thomson Scattering Measurement (2-D TS) has been developed usingmultiple reflections and the time-flight of laser light. The Thomson scattering measurement hasbeen widely used as the most precise and reliable plasma diagnostics for measuring Te and density ne [1]. The initial single point measurement has been upgraded to multipoint and its spatialresolution has been improved significantly using TV Thomson system, LIDAR Thomson system. A limited extension to 2-D TS measurement has been realized using multiple sets of laser devices and polychromators [2], but the system necessarily suffers from high cost, and wide space. For the TS-4 experiment whose main mission is merging ST plasma and magnetic reconnection, the 2-D profile of Te and ne are keys to understanding the causes and mechanism for (1) the electronheating of the magnetic reconnection and (2) high-βST formation at merging start-up. Our newcost-effective approaches to the upgraded 2-D Thomson scattering system are (1) the multiplereflections of a laser beam to cover the 2-D(r-z) plane of the plasma and (2) utilization of thetime-of-flight of laser light to reduce the number of polychromators and detectors. We are nowplanning to increase the time delay by adjusting the length of the optical fiber between thecollection lenses and polychromators [3]. In our preliminary system, we have already detected the multiple Rayleigh scattering lights fromtwo adjacent measurement points by the APD detectors. In this system, the laser path lengthbetween nearest two points is about 15m, which corresponds the laser flight time of 50ns. Ourpreliminary results demonstrated the basic principle of 2-D (2×4 points) measurement of theRayleigh scattering, leading us to construction of the new 2-D TS system.
References
[1] N. J. Peacock, D. C. Robinson, M.J. Forrest, P. D. Wilcock and V. V. Sannikov: Nature 224 488 (1969). [2] B. Kurzan, H. D. Murmann, and J. Neuhauser; Phys. Rev. Lett. 95 145001 (2005). [3] M. P. Alonso, P. D. Wilcock, and C. A. F. Varandas: Rev. Sci. Instrum. 70 783 (1999).

P8-26
Laser scattering measurement of the electron density fluctuations in CHS
Y. Azuma, S. Tsuji-Iio, T. Akiyama1), K. Kawahata1), S. Okajima2), K. Nakayama2), R. Shimada, H. Tsutsui, K. Higuchi
Tokyo Institute of Technology, Ookayama, Meguro-ku,Tokyo 152-8550,Japan 1)National Institute for Fusion Science, Toki, Gifu 509-5292, Japan
2)Chubu University, Matsumoto-cho, Kasugai-shi, Aichi 487-8501, Japan
Anomalous transport plays a dominant role in plasma confinement in magnetic confinement fusion devices. Since fluctuations cause anomalous transports and degrade plasma confinement, the understanding of physical mechanisms for fluctuations is one of the important issues towards realization of fusion reactors. We examined specifically about the electron density fluctuations in the Compact Helical System (CHS). We adopted an electromagnetic wave scattering method. The frequency and the amplitude of electron density fluctuations are extracted from the spectrum of the beat frequency (1 MHz). The wave number of electron density fluctuations is determined by the Bragg relation. We designed a three channel measurement system. This system enables us to detect scattered lightat three angles simultaneously. The measurement system uses hydrogen cyanide (HCN) laser(wavelength: 337 μm) as the light source and detects scattered light by the heterodyne technique.Heterodyne measurement system has an advantage of capability to discriminate the direction ofpropagation of fluctuations. This system utilizes a super rotating grating (SRG) as a frequencyshifter for the heterodyne detection. The SRG makes it possible to realize high-frequency beatsignal up to 1.45 MHz. This leads to the wide frequency range of fluctuations of the scatteringmeasurement. In this study the location of the scattering volume in CHS is in a plasma edge region at the outer side of torus. In this location sharp fluctuation peaks, which have harmonic components up to the fifth, were observed. The fluctuations propagate only in the outward direction. The amplitude of the second component is always the largest among harmonic components. After injections of two neutral particle beams (NB) for plasma heating, Hα emission signal, whichroughly indicates information on the particle flux into the plasma, decreases spontaneously. Thenthe density gradient in the plasma edge region becomes steeper and an edge transport barrier(ETB), which reduces the loss of particles from the plasma, is formed. Frequencies of fluctuationsincrease after NB injections. However, they are suppressed after the transition. This measurementresult suggests the improvement of particle confinement with the edge transport barrier.

P8-27
Laser Thomson Scattering Measurements in Helium Recombining Plasmas in Divertor/Edge Simulator MAP-II and its Comparison with Spectroscopy
F.Scotti, S.Kado1), A.Okamoto2), T.Shikama, Y.Kuwahara, K.Kurihara, K.-S.Chung3) and S.Tanaka
School of Engineering, the University of Tokyo 1)High Temperature Plasma Center, the University of Tokyo
2)School of Engineering, Tohoku University 3)Department of Electricity and Control Engineering, Hanyang University
Electron temperature and density measurements of Helium recombining plasmas are performed in the divertor/edge plasma simulator MAP-II [1], by means of Laser Thomson Scattering [2] (using a Nd:YAG Laser, a double monochromator and an ICCD detector) and optical emission spectroscopy (using a spectrometer and a CCD detector). The recent upgrades of our LTS system (reduction of the level of stray light and reduction of the pass-band of the notch filter) allowed us to measure temperatures as low as 0.1 eV and to investigate Electron Ion Recombination (EIR) processes in He plasma. Spatial profiles of electron temperature and density along the plasma column have been takenmoving the plasma recombination “front” across the measuring point by controlling the neutralgas pressure from 80 to about 140 mtorr. The electron temperature measured by LTSmonotonically decreased along the plasma column until the lowest measured temperature of 0.15eV [3]. Spectroscopic analysis applying He I CR model [4] is in progress in order to better clarify the physical processes leading to the decrease in temperature and density and to compare the results obtained by the two diagnostics. This work is supported in part by NIFS Collaborative Research Program (NIFS04KOAB009) directed by the second author.
References
[1] S. Kado, Y. Iida, S. Kajita et al., J. Plasma Fusion Res. 81, 810 (2005). [2] A. Okamoto, S. Kado, S. Kajita and S. Tanaka, Rev. Sci. Instrum. 76, 116106 (2005). [3] F. Scotti, S. Kado, A. Okamoto, T. Shikama and S. Tanaka, submitted to J. Plasma Fusion Res. [4] M. Goto, J. Quantitative Spectroscopy and Radiative Transfer 76, 331 (2003).

P8-28
Collective Thomson scattering for alpha-particle diagnostic in burning plasmas
T. Kondoh, T. Hayashi, Y. Kawano, Y. Kusama, T. Sugie
Japan Atomic Energy Agency, Naka, Ibaraki, 311-0193, Japan
A diagnostic of fusion-generated alpha-particles is important to understand burning plasma physics, however, an effective measurement method has not yet been established. A collective Thomson scattering (CTS) diagnostic using carbon dioxide (CO2) laser (wavelength 10.6 μm) isbeing developed to establish a diagnostic method of confined alpha-particles. To realize the CTSdiagnostic, a high-repetition Transversely Excited Atmospheric (TEA) CO2 has been developed[1]. In order to obtain single-mode output, which is needed for the CTS diagnostic, seed laser is injected to the cavity with an unstable resonator. Using this technique, output energy of 17J with the frequency of 15 Hz has been achieved with single-mode output. These results give a prospect for the CTS diagnostic on International Thermonuclear Experimental Reactor (ITER), which requires energy of 20 J with the repetition rate of 40 Hz. To measure the scattered signal with a high-repetition rate during long period (~60 s), waveforms are collected and analyzed by digital oscilloscopes. Proof-of-principle test is being performed with the improved laser system onthe JT-60U tokamak.
References
[1] T. Kondoh, et al., "High-repetition CO2 laser for Collective Thomson scatteringdiagnostic of α-particles in burning plasmas", to be published in Rev. Sci. Instrum.
This work was supported by Grant-in-Aid for Scientific Research on Priority Areas "Advanced Diagnostics for Burning Plasmas" from the Ministry of Education, Culture, Sports, Science and Technology, No. 16082210.
P8-29
Sensitivity study for the optimization of the viewing chord arrangement of the ITER poloidal polarimeter
T. Yamaguchi, Y. Kawano and Y. Kusama
Japan Atomic Energy Agency, Naka, Ibaraki 801-1, Japan
The poloidal polarimeter will be installed in the International Thermonuclear Experimental Reactor (ITER) to measure the profile of the toroidal current (safety factor) in the core region. The far-infrared laser beams pass through the plasma are reflected back along the same path by retroreflectors. The Faraday rotation of the polarization plane of each beam, which is induced by the poloidal field inside the plasma, is detected. The equatorial port and the upper port are used for the beam injections and the detections of the Faraday rotation[1]. The number of viewing chords is restricted to about 15 channels because of the geometric capacity of port plugs. Therefore the design of optimum arrangements of the chords is necessary to achieve sufficiently high accuracy as much as possible. Since the optimum viewing chord arrangements have not been known yet, we have begun to study. There are two steps to optimize the chord arrangement. First step is the sensitivity study of viewing chord signals to the toroidal current profiles, which is described in this presentation. Second step is the evaluation of the accuracy of the toroidal current profiles based on the Magnetohydrodynamic equilibrium reconstruction method. The chord arrangement patterns and the toroidal current profiles, which are evaluated on the second step, should be restricted based on the result of the first step because the evaluations of all cases are actually impossible. It has been reported that the equatorial viewing chords passing near the plasma center are sensitive to the central safety factor in case of the positive shear[2]. In addition to this previous result, we have found two sensitivities which are (1) the upper center chords are sensitive to the change in the toroidal current profile due to the change in the beta value although the equatorial center chords are not sensitive, and (2) the combination of the equatorial central chords and the equatorial middle position chords is sensitive in the case of the negative shear. According to the above new sensitivities, the chord arrangement combinations and the toroidal current profiles which should be evaluated by the reconstruction calculation are obtained.
References
[1] A.J.H. Donné et al., Rev. Sci. Instrum, 75 (2004) 4694 [2] C. Nieswand, in Diagnostics for Experimental Thermonuclear Fusion Reactors 2, edited by P. E. Stott et al. (Plenum, New York, 1998), 213
P8-30
Bench testing of polarimeter with Si photo elastic modulator for short wavelength FIR laser
T. Akiyama, K. Kawahata, S. Okajima1), K. Nakayama1), T.C. Oakberg2)
National Institute for Fusion Science, 322-6 Oroshi-cho, Toki-shi, Gifu 509-5292, Japan 1)Chubu University, 1200 Matsumoto-cho, Kasugai-shi, Aichi 487-8501, Japan
2)Hinds Instruments, Inc., 3175 NW Aloclek Drive Hillsboro, Oregon 97124, USA
A Far infrared (FIR) laser interferometer is indispensable for electron density measurement in magnetically confined fusion experimental devices. A CH3OH laser (a wavelength of 119 μm)interferometer [1] works routinely in the Large Helical Devices (LHD). Fringe jump errors,however, are serious problems in a high density range. In order to improve the reliability, theCH3OD laser (57 and 48 μm) has been developed [2, 3] because a beam bending effect (∝ λ2) ina plasma, which causes fringe jump errors, is small due to the short wavelength. On the otherhand, an ι profile can be evaluated by polarimetry based on the Faraday effect. We are designing apolari-interferometer with the CH3OD laser conceptually. This system can also be adapted to large tokamaks including International Thermonuclear Experimental Reactor (ITER). Some measurement method of the Faraday rotation has been demonstrated up to now. The polarimeter with a pair of photo elastic modulators (PEMs) has achieved high temporal and angle resolutions and long time stability [4, 5]. It also has good compatibility with an interferometer.Since there was no PEM for the FIR range so far, the new PEM for the CH3OD laser is developedby HINDS instruments. It adopts a Si plate with the high resistivity (several kΩcm), which hashigh FIR transmissivity, as the photoelastic material. The measured maximum transmissivitywithout an anti-reflection coating is 60% for both 57 and 48 μm, which is enough for the benchtesting. However, multi-reflection inside the Si plate is found to be significant due to highrefractivity (3.43) of Si. We performed bench testing of the polarimeter with the Si PEM. Since this is the first trial of the PEM for the FIR laser, the optical configuration with only one PEM is utilized. Although a deviation is found in a small rotation angle, the measured polarization angle increased with rotating the polarization of the incident beam. The reason of the deviation is speculated to be caused by additional modulation components due to the multi-reflection. This will be improved by the AR-coating on the Si plate.
References
[1]K. Kawahata et. al., Rev. Sci. Instrum 70 (1999) 707. [2]S. Okajima et. al., Rev. Sci. Instrum 72 (2001) 1094. [3]K. Kawahata et. al., Rev. Sci. Instrum 75 (2004) 3508. [4]Y. Kawano et. al., Rev. Sci. Instrum 72 (2001) 1068. [5]T. Akiyama et. al., IEEE Transactions on Applied Superconductivity 12 (2002) 1647.

P8-31
Development of Short Wavelength Far-Infrared Lasers and Optical Elements for Plasma Diagnostics
K. Nakayama, M. Tomimoto, S. Okajima, K. Kawahata1), K. Tanaka1), T. Tokuzawa1), T. Akiyama1), Y. Ito1)
Chubu University, Kasugai, Aichi 487-8501, Japan 1)National Institute for Fusion Science, Toki, Gifu 509-5292, Japan
In the Large Helical Device (LHD), the electron density profile has been measured by a 13channel 119-μm CH3OH laser interferometer[1]. However, short-wavelength FIR lasers in theregion of 40 - 70 μm are superior to the 119-μm laser and a 10-µm CO2 laser from viewpoints ofthe plasma refraction and mechanical vibration effects and the fringe shift for the high densityoperation of the LHD and future plasma device such as the International ThermonuclearExperimental Reactor (ITER). We have developed a new two-color interferometer using 48- and57-μm CH3OD lasers which can oscillate simultaneously[2]. The present status of the development of the components (the laser and optical element) is present. The intensification of 48- and 57-μm CH3OD lasers pumped by 9R(8) CO2 laser has been doneand a total power of 2.4 W has been achieved[3]. The power level is estimated to be more than 1.6w for the 57-μm laser, with maximum power of 0.8 W for the 48-μm laser. We have measuredbeam profiles of these lasers to obtain the beam intensity distribution and the beam divergenceangle. In a FIR region, water vapor absorption in the atmosphere is large. The absorption for the48- and 57-μm laser lines was not measured. Therefore we have measured the water vaporabsorption. A transmitted laser beam after passing through a cell which filled water vapor hasbeen detected by a pyroelectric detector. The attenuation has been measured. If the humidity is 5% at 22°C(actual vapor density ρ=0.97 g/m3), the absorption coefficients of the 48-μm laser andthe 57-μm laser are about 0.060 m-1 and 0.031 m-1, respectively. In order to design windows of the plasma vessel and beam splitters in the interferometer, optical constants of materials are necessary. We have measured the refractive index and the absorption coefficient of a crystal quartz, a silicon with high resistivity, and a CVD diamond and the transmissivity and the reflectivity of a polyethylene seat, a Mylar film, and a metal mesh. We have compared these materials and have examined use as the windows and the beam splitters.
References
[1]K. Kawahata et. al., Rev. Sci. Instrum 70 (1999) 707 [2]K. Kawahata et. al., Rev. Sci. Instrum 75 (2004) 3508 [3]K. Nakayama et. al., Rev. Sci. Instrum 75 (2004) 329

P8-32
Effect of pressure and magnetic field on parameters of plasma in a DC cylindrical magnetron sputtering device
K.Yasserian 1,2) , M.Ghoranneviss 1), A.Anvari 3) , M. Hosseinpour3)
1)Plasma physics Research Center, Science and Research Campus, Islamic Azad University, P.O.Box: 14665-678, Tehran, Iran
2)Department of physics, Karaj Branch, Islamic.Azad University, Iran
3)Physics Department, Sharif University of Technology, Tehran, Iran
The parameters of plasma in a DC cylindrical magnetron sputtering device have been measured under different conditions. In this study a DC cylindrical magnetron sputtering device was used. This system consists of two coaxial cylinders with 10 cm and 21 cm in radius and 72 cm in length. The cathode was edged. The inner one was cathode. A magnetic coil mounted around the outer cylinder generated a nearly uniform magnetic field up to 550 G. the region between two cylinders was evacuated by means of a mechanical and turbo-molecular pump up to 10 -6 torr. Themagnetic filed and pressure play interparticles collision role and therefore the degree of ionization and plasma temperature changed. The profiles of plasma parameter are obtained in vertical and radial axis in active manner. The influences of variation of pressures and magnetic fields on the mentioned profiles are investigated. Result will be discussed in full paper.
References
[1]. Godyak V A et al 1993 J. Appl. Phys. 73 3657–63 [2]. Sudit I D et al 1993 Rev. Sci. Instrum. 64 2440–8 [3]. I H Hutchinson, Principles of Plasma Diagnostics (Cambridge University Press, Cambridge, 1990) [4]. A A Garamoon1, A Samir1, F F Elakshar1 and E F Kotp , 2003 Plasma Sources Sci.Technol. 12 417–420.
[5]. M. Ghoranneviss et al J. Plasma Fusion Res. SERIES, Vol.7 (2006) 307-309.

P13-01
Development of ITER diagnostic upper port plug
K. Sato, J. Ohmori, K. Ebisawa1), Y. Kusama, Y. Neyatani
Japan Atomic Energy Agency 1)AITEL Corp.
A diagnostic device in ITER is planed to integrate in the “port plug”, which serves both as theneutron shield and enables diagnostics to access to the plasma in the severe radiationcircumstances of ITER. Only basic concept has been given for the port plug so far. In this work,the integration design of port plug including for manufacturing has been performed for the No.11upper port plug, which would be procured by Japan. The upper port plug structure should have enough margin of stiffness since the port plug is cantilevered structure with length of ~6 m and weight of ~22 t. To achieve such large stiffness, theupper port plug is designed to compose of forging material with thickness of 70 mm. To reducethe manufacturing cost, the commercial base material such as rolling material with thickness of 40mm was considered. The second moment of area and strains were calculated to evaluate thecombination of rolling material and the lib structure. As a result, this structure can be achieved asthe same stiffness as the present design. Three diagnostics will be installed in the No.11 upper port plug, i.e., the edge Thomson scattering system, the visible-IR TV divertor viewing system and the neutron activation system. To integratetheses diagnostic systems in the port plug, the labyrinth of optical path, the driving and cooling systems for shutters and mirrors, the maintenance space and the interaction of each other were considered. A space just behind the blanket shield module (BSM) was changed to use as a spacefor maintenance and for layout of associated diagnostic first mirror and shutter, whereas this place was assigned for neutron shielding. The neutron shield module in this space was moved in front offlange instead. The structure and the position of the BSM support, which is main componentinducing the electro-magnetic load, have been arranged to secure the optical path inside BSM. Three-dimensional model of partial vacuum vessel, port and blanket module, located around the port plug, was constructed for the electro-magnetic analysis. The upward fast VDE was selected tocalculate the EM loads because it produces the most severe load for the upper port plug. As aresult, maximum moment at the port flange was about 1 MNm, which is within the design guideline of the port plug.
P13-02
ECR heating and ECE diagnostic in W7-X stellarator: ray tracing simulations of non-thermal effects
N.B. Marushchenko, V. Erckmann, H.J. Hartfuss, M. Hirsch, H.P. Laqua, H. Maassberg, Yu. Turkin
Max-Planck-Institut fuer Plasmaphysik, EURATOM Association, Teilinstitut Greifswald, D-17491 Greifswald, Germany
The new ray tracing code was developed for electron cyclotron (EC) studies in arbitrary 3Dmagnetic configurations, with emphasis on heating, current drive (CD) and diagnostic of the W7-X stellarator (under construction in Greifswald, Germany). The advanced Tokman-Westerhof model of the Hamiltonian is adopted for the ray tracing. Thisaccounts for anomalous dispersion in the vicinity of the EC resonance. In turn, the cold, warm non-relativistic or weakly relativistic dielectric tensor can be used in the Hamiltonian, depending on which model applies. Finally, absorption and emissivity are calculated from the anti-Hermitian part of the fully relativistic dielectric tensor. Wave-particle interaction is modelled separately for passing and trapped electrons, the results are also plotted separately and combined in macroscopic quantities such as the deposition profile. This approach provides a better understanding of trapped particle effects on heating, emission, and CD in stellarators, not only in interpreting the experiments but also in preparing suitable plasma targets and magnetic configurations. The last tool is very useful for stellarator-specific problems,where the different classes of electrons have to be taken into account. The electron distribution used for absorption and emissivity calculations can be Maxwellian, bi-Maxwellian or arbitrary, thus allowing future coupling with a Fokker-Planck solver. At present, the adjoint approach is used for the CD efficiency calculations. The code can be used through a specially designed graphical user interface program, which allowspreparation of input parameters and presenting the results of simulations in convenient form. The code is now routinely exploited in modelling heating and CD at various harmonics of the ordinary and extraordinary mode (O1, O2, X2 and X3) in different magnetic configurations. Similarly, EC emission spectra collected from the low or high field side of the machine in different poloidal sections are easily contrasted and might be used to diagnose fast electrons. The code is also supporting the design of some ECRH components for W7-X.

P13-03
Carbon redeposition under high-flux, low-energy ion irradiation effects on properties of tungsten films
L. Pranevicius, S. Sudo1)
Vytautas Magnus University, LT-3000, Kaunas, Lithuania 1)National Institute for Fusion Science, Toki, Gifu 509-5292, Japan
Carbon redeposition under high-flux, low-energy ion irradiation effects on properties of tungsten films will be reported.

P13-04
An exact linear dispersion relation for CRM instability
K.MINAMI1) and Y.CHOYAL2)
1) Faculty of Engineering, Tokyo Denki University, Chiyoda-Ku, Tokyo 101-8457, Japan 2) School of Physics, Devi Ahilya University, Indore 452 017, India
An exact and self-consistent linear dispersion relation of a large orbit electron beam including two principles of cyclotron emission with oscillation frequencies above and below the relativistic electron cyclotron frequency is derived and analyzed numerically for the first time in the literature. The two principles are, respectively, cyclotron resonance maser (CRM) instability and Cherenkov instability in the azimuthal direction (CIAD). The unphysical modes at infinite values of axial wavenumber in slow wave region observed in conventional dispersion relations of the CRM instability have been remedied to stable modes near the fast cyclotron mode.

P13-05
Mapping of flux quantities in the high beta heliotron plasmas
K.Y.Watanabe, T.Yamaguchi1), Y.Narushima, S.Sakakibara, Y.Suzuki, Y.Nakamura2). H.Funaba, N.Nakajima and LHD experimental group
National Institute for Fusion Science, Toki, 509-5292, Japan 1)Japan Atomic Energy Agency, Naka, Ibaraki 801-1, Japan
2)Graduate School of Energy Science, Kyoto University, Uji 611-0011, Japan
The mapping of the plasma parameters on the magnetic flux is very important for studies of the MHD stabilities, transport properties and so on in the high temperature plasmas of torus systems. However, the identification method of MHD equilibrium with high beta value in heliotron plasmas has not been established because the identification of the plasma boundary shape is very difficult. MHD equilibrium data needed for a transport analysis are not so many, for example, the shape of the magnetic surfaces, rotational transform, effective helical ripple and toroidal ripple of the magnetic field amplitude. The exact identification of the MHD equilibrium is not necessary to obtain the above configuration data. In LHD transport analysis, it is proposed that an equilibrium data is selected so as to fit Te profile the best in an equilibrium database with various beta values, their profiles and without toroidal current. And the configuration data except for the rotational transform are used for the transport analysis. Rotational transform is revised by the toroidal current, which is measured by MSE, or is theoretically estimated. The MHD equilibrium database is constructed by the real coordinates MHD equilibrium solver, HINT [1].
References
[1] Hayashi T. et. al 2001 J. Plasma Fusion Res. 77 594 Kanno R. et al 2005 Nucl. Fusion 45 588

P13-06
Development of the Web Interface for FIT Program
M.Emoto1), H.Funaba 1), S.Murakami 2), Y.Nagayama, and K.Kawahata 1)
1) National Institute for Fusion Science, Toki, Gifu 509-5292, Japan 2) Kyoto University, Yoshida Honmachi, Sakyo-ku, Kyoto, 606-8501, Japan
In order to analyze NBI heat distribution and so on, FIT code was developed by Murakami. This FORTRAN program runs on the supercomputer to do the complicate task speedy. However, using supercomputer might become hurdle for ordinal PC users. Furthermore, this program requires the profile of electron density, electron temperature, and ion temperatures as polynomial expressions. It is difficult task for those who are not familiar with the experiments especially visitors from other institutes. To facilitate the usage, the authors have been developing a user friendly system to run the code. The system consists of multi layers. The front end layer of the system consists of Web interface. Using normal Web browsers, users can choose the necessary parameters interactively. The next layer is server side programs mainly written by Ruby. It is a gateway from the users to the supercomputer, and it compiles the given parameter so that the FIT can use. Using this system, the user can run the FIT code more intuitively.

P13-07a
Physics of Radiative Collapse in the Large Helical Device
Yu. Igitkhanov1), M. Kobayashi, B. J. Peterson, T. Kato, P. Goncharov, J. Miyazawa, S. Sudo, H.Yamada, K.Kawahata, and O. Motojima
1)Max-Planck-Institut fuer Plasmaphysik, IPP-EURATOM Ass., Greifswald, Germany
In stellarator devices the high density discharges are limited by a radiation induced temperature collapse. This density limit (Sudo limit) is usually determined at the density, when the stored energy begins to decrease as if the global power balance is lost (though the drop in the stored energy can be also attributed in part to the reduced confinement of the high density regime). There is a clear edge temperature threshold, below which the thermal instability occurs, leading eventually to the plasma collapse. The measurements of radiation profiles showed the inward propagation of the radiation zone driving the thermal collapse. This was attributed to a loss of the local power balance at the edge and thought to be triggered by the radiative thermal instability of impurities in the low temperature edge. The radiative zone develops poloidally asymmetric and roughly toroidally symmetric, as in a tokamak MARFE, irrespective to the highly 3-D magnetic field and vacuum vessel shape in LHD. This similarity helped to simulate the evolution of radiative front in a simple 1-D geometry. The calculations showed that light impurities would radiate primarily from the edge and could result in less than 100% radiated power fractions at the thermal collapse, whereas heavier impurities would radiated from the core and could result in 100% radiated power fractions at the collapse. The collapse in the former case of light impurities was partly attributed to limitations on the thermal conduction from the core to the edge resulting in the edge localized power imbalance. The role of impurity dynamic during the collapce was investigated by STRAHL code. The coupling of the thermal unstable modes with ballooning modes at the plasma edge is discussed. The scaling of edge threshold electron temperature, below which the radiative collapse can occur, is derived.

P13-07b
Impurity Transport Studies on LHD
Yu. Igitkhanov1), P. Goncharov, S. Sudo, D. Kalinina, H. Funaba, M. Yokoyama, C.D. Beidler1), S. Murakami2), A. Wakasa3), N. Tamura, K. Kawahata, T. Kato, T. Morisaki, N. Ohyabu, B.
Peretson, H. Yamada and O. Motojima
1) Max-Planck-Institut für Plasmaphysik, IPP-EURATOM Ass., Greifswald, Germany 2) Kyoto University, Japan
3) Hokkaido University, Japan
In this paper the impurity transport in large helical device (LHD) plasmas is studied. By means of a tracer-encapsulated solid pellet injection (TESPEL) [1] the metallic impurity have been launched into plasma and the attenuation of the emission lines from the highly ionized states has been measured and then numerically simulated by using a newly developed 1-D strllarator impurity transport code (SIT). The TESPEL method ensures a localized impurity source position and reduces an ambiguity of the total impurity amount, which makes easier the impurity particle transport studies. The SIT code can be considered as an extension of the tokamak STRAHL code [2] to nonaxisymmetric plasmas and incorporates the stellarator specific neoclassical transport coefficients and the ambipolar radial electric field solver. The SIT code has an analysis and predictive capabilities. It solves the radial continuity equations for each ionization stage of the impurity ions for given background plasma profiles and magnetic configuration. The neoclassical coefficients are based on numerical results from the DKES (Drift Kinetic Equation Solver) code and the monoenergetic Monte-Carlo calculations. The transition between the different charge states due to the ionization and recombination in balance equation is described by using the ADAS (Atomic Data and Analysis Structure) database. The impurity behavior in some typical LHD discharges with moderate and improved energy confinement and different line average density level has been considered. It is shown that the spatial distribution of impurity ions results from the competition between the radial electric field and the thermal force (which together produce a convective flux), and the diffusive term, which flattens the radial impurity distribution. The impurity ions are localized at the radial position where the convective flux goes through zero. It is also confirmed that for typical LHD discharges there are no temperature screening effect like in tokamak plasmas. Analysis of the TESPEL signal indicates that under some plasma conditions anomalous transport of impurity ions must be taken into account; however the neoclassical contribution remains essential. Finally, the effect of externally induced magnetic island on impurity screening effect and radial localization is analyzed.
References
[1] Sudo S 1993 J. Plasma Fusion Res. 69 1349 [2] Dux R et al 1999 Nucl. Fusion 39 1509
P13-07c
Stellarator Impurity STRAHL Code Development in NIFS
Yu. Igitkhanov1), P. Goncharov, R. Dux1),S. Sudo, D. Kalinina, H. Funaba, M. Yokoyama, C.D.Beidler1), S. Murakami2), A. Wakasa3), K. Kawahata, T. Morisaki, N. H. Yamada and O.
Motojima
1) Max-Planck-Institut für Plasmaphysik, IPP-EURATOM Ass., Greifswald, Germany 2) Kyoto University, Japan
3) Hokkaido University, Japan
The Stellarator STRAHL Impurity Transport code (SIT) has been developed in NIFS as ananalysis and predictive tool for impurity ions simulation in heliotron plasmas. The SIT code is anupgrade and updated version of STRAHL code [1], which can be used for nonaxisymmertic configurations and has an extended analysis and predictive capabilities. It can be widely used for diagnostic purposes, particularly as an analysis tool in TESPEL experiments in LHD. In this paper a comprehensive description of the code is presented. The code solves the system of continuity equations (averaged over the magnetic flux surfaces) for impurity ions in each charge stage, coupled due to the ionization and recombination. It calculates the evolution of density and emission in time and space of impurity ions coming from the wall or originated within the plasma due to the pellet ablation. The new code evaluates impurity behavior in the frame of the stellarator-specific neoclassical transport, which unlike the tokamak configuration is strongly dependent on magnetic topology and the radial electric field. Under this condition the transport equations become stiff, which has required a considerable change the numerical scheme. The radial electric field is evaluated from the ambipolarity condition and depends on neoclassical transport coefficients. An analytical description of the neoclassical transport coefficient for the background plasmas (based on numerical results from the DKES code and monoenergetic Monte Carlo simulations) was generalized to impurity ions of arbitrary mass and charge state and used in the code as a neoclassical transport model for impurities. The reduction of Pfirsch-Schluter convection due to the radial electric field and its impact on impurity dynamics has been included. Calculations of the electric field and transport coefficients were included within the time dependent iterative loop. Various models of anomalous drift velocities and diffusion coefficient were also included. Currently the calculations are performed for the given plasma density and temperature profiles. In the future this calculation will be done in self consistent manner. Because of a modular structure, the SIT code will be easily incorporated into the 1-D plasma transport codes like ASTRA or PROCTOR.
[1] K. Berhinger, JET Report No. JET-R (87) 08,


Poster Session 2(imaging)Categories 1-4, 6, 9-12


P1-01
Somato-motor inhibitory processing in humans: a study with MEG and ERP
H.Nakata, R.Kakigi
National Institute for Physiological Sciences, Okazaki 444-8585, Japan
The go/nogo task is a useful paradigm for recording event-related potentials (ERPs) to investigatethe neural mechanisms of response inhibition. In nogo trials, a negative deflection at around140-300 ms (N2), which has been called the ‘nogo potential’, is elicited at the frontocentralelectrodes, compared with ERPs recorded in go trials. In the present study, we investigated thegenerators for nogo potentials by recording ERPs and magnetoencephalography (MEG)simultaneously during somatosensory Go/No-go tasks. Eight normal right-handed subjects participated in this study. The subjects performed a warningstimulus (S1) – imperative stimulus (S2) paradigm with Go/No-go tasks. S1 was an auditory puretone. For the S2, we stimulated the second or fifth digit of the left hand with ring electrodes. Therecordings were conducted in three conditions. Condition 1 was the resting control. In condition 2,the go stimulus was delivered to the second digit of the left hand, and the nogo stimulus to thefifth digit of the left hand. The subjects had to respond to it by pushing a button with their rightthumb as quickly as possible only after the presentation of a go stimulus. In condition 3, the goand nogo stimuli were reversed in the left hand. EEGs were recorded at Fz, Cz, Pz, C3, C4, F3 andF4. MEG signals were recorded with a helmet-shaped 306-channel detector array (Vectorview;ELEKTA Neuromag Oy, Helsinki, Finland). The signals were recorded with a bandpass of0.1-100Hz and digitized at 900 Hz. ERP data revealed that the amplitude of nogo-N140 component, which peaked at about 155 ms from frontocentral electrodes, was significantly more negative than that of go-N140. MEG datarevealed that a long-latency response peaking at approximately 170 ms, termed nogo-M170 and corresponding to nogo-N140, recorded in only nogo trials. The equivalent current dipole (ECD) ofnogo-M170 was estimated to lie around the posterior part of the inferior frontal sulci in the prefrontal cortex. These results revealed that both nogo-N140 and nogo-M170 evoked bysomatosensory Go/No-go tasks were related to the neural activity generated from the prefrontal cortex. Our findings combining MEG and ERPs clarified the spatial and temporal processing related to somato-motor inhibition caused in the posterior part of the inferior frontal sulci in the prefrontal cortex in humans.

P1-02
Somatosensory mismatch responses using oddball paradigm; an MEG study
K.Akatsuka, H.Nakata, T.Kida, R.Kakigi
National Institute for Physiological Sciences, Okazaki, Aichi 444-0858, Japan
Two-point discrimination (TPD) is one of the important and frequently used clinical test toinvestigate the human somatosensory perception. TPD involves several factors, such as peripheralmechanoreceptors, spinal cord and the cerebral cortex relating to cognitive functions. However, itsunderlying mechanisms are still not clarified due to many technical problems, that is, it is verysubjective test, being dependent on the examiners’ skills and subjects’ reactions. The objective ofthis study was to record somatosensory evoked magnetic fields using a somatosensory mismatchtask in order to establish an objective method for TPD. First, we determined the spatial discrimination threshold (DT) of two-point in each subject, andapplied electrical stimuli to the two points of the hand with a distance of (1) DT minus (DT×10%), (2) DT minus (DT×20 %), (3) DT plus (DT×10 %), and (4) DT plus (DT×100 %). We appliedDT minus (DT×10 %) as standard stimuli, and DT minus (DT×20 %), DT plus (DT×10 %) andDT plus (DT×100 %) as deviant, respectively in different sessions. The components peaking around 30-70 ms and 100-200ms were significantly enhanced by DTplus (DT×100 %) deviant stimuli, which were considered somatosensory mismatch components.The distance between two points became longer, the amplitude of components became larger.Therefore, we confirmed that our new method could be used for the objective examination fortwo-point discrimination.

P1-03
Imaging mass spectrometry revealed abnormal distribution of phospholipids in colon cancer liver metastasis
T. Hayasaka1), S. Shimma1,2), Y. Sugiura1,3,4), Y. Hoshikawa5), T. Noda5), M. Setou1,2,3,4)
1)Okazaki Institute for Integrative Biosciece, Okazaki, Aichi 444-8787, Japan 2)The Graduate University for Advanced Studies, Okaaki, Aichi 444-8585, Japan
3)Mitsubishi Kagaku Institute of Life Sciences (MITILS), Machida, Tokyo 194-8511, Japan 4)Tokyo Institute of Technology, Yokohama, Kanagawa 226-8501, Japan
5)The Genome Center of Japanese Foundation for Cancer Research, Koutou-ku, Tokyo 135-8550, Japan
We present the results of matrix-assisted laser desorption/ionization (MALDI) imaging anddirect molecular identification using tandem mass spectrometry (MS/MS) in colon cancer livermetastasis. Cancer tissue was removed from a Japanese patient and frozen immediately withoutany fixations. The sections were sliced to a thickness of 3μm. The matrix for lipid ionization was2, 6-dihydroxy acetophenone (DHA). The matrix solution was applied with an airbrush into a thinuniform matrix layer on the tissue surface. After two-dimensional laser scanning, the images werereconstructed as a function of m/z from a few hundred obtained spectra. In the obtained images, the existence of molecules was represented by a pseudo-color corresponding to the signal intensity. In a feasibility study, we picked up two localized signals, m/z 616 in a normal area and m/z 725 in a cancerous area. The MS/MS results suggested that m/z 616 was [lysophosphatidylcholine (LPC) 24:0 + Na]+ or [LPC 22:1 + K]+ and that m/z 725 was [sphingomyelin 18:3]+. Thus, we successfully show the feasibility of MALDI imaging as a tool for the analysis of pathological specimens to identify molecular markers.
P2-01
CONSTRAINED ELECTRON BEAM TOMOGRAPHY FOR IDENTIFYING 3-DIMENSIONAL MOVEMENTS AND TWISTING MECHANISM OF SPERM
FLAGELLA OF THE STAG BEETLE (PROSOPOCOILUS INCLINATES)
M. Irie, M. Kubo-Irie1), H. Mohri2)
Waseda University, Shinjyuku-ku, Tokyo, 169-8555, Japan 1) University of Air, Mihama-ku, Chiba, 261-8586, Japan
2) (Emeritus) National Institute for Basic Biology, Okazaki, Aichi, 444-8585, Japan &(Emeritus) Tokyo University, komaba, Meguro-ku, Tokyo, 153-8902, Japan
The cross section of sperm flagella of a stag beetle,(Prosopocoilus inclinates), consists of complicated components: mitochondrial derivatives and centriole adjuncts as well as 9+9+2 microtubles (Kubo-Irie et al., 2000). We observed a clear three dimensional helical flagellar motion with an optical microscope. By negative staining method under transmission electron microscope, we also found its helical axoneme twist. In order to elucidate these mechanism, the tomography is highlighted. However the beam tilting angle in conventional electron microscope is limited to be under +/- 15° which is far smaller than those required in conventional tomography.To meet this, the soft X-ray tomography technique developed by us in nuclear fusion research (Umemoto et al., 1996) was modified into CEBT (the Constrained Electron Beam Tomography) and applied. This allows image reconstruction from smaller peripheral scanning data by setting basic assumptions as constraints. The fundamental constituents of the axoneme were detected from the local cross sectional view. The local biological deformation from this is assumed to be a superposition of the Fourier components. In this way, the three dimensional helical deformation of the flagella was described quantitatively.
References
M. KUBO-IRIE, I. MIURA, T. NAKAZAWA, H. MOHRI and M. IRIE : InvertibrateReproduction and Development 2000 Vol.37 (3) pp.:223-231 T. UMEMOTO,K. HATTORI,Y. SATO,K. HAYASE and M. IRIE: Journal Plasma andFusion Research 1996,Vol.72,(10) pp.1082-1086
P2-02
Developments of split reporter proteins for biomolecular imaging
Masaki Takeuchi and Takeaki Ozawa
Institute for Molecular Science, Okazaki, Aichi 444-8585, Japan
A current focus of biological research is to quantify and image cellular processes in living cells and animals. To detect such cellular processes, genetically-encoded reporters have beenextensively used. The most common reporters include firefly luciferase, renilla luciferase, greenfluorescent protein (GFP) and its variants with various spectral properties. Herein, novel design ofsplit luciferase reporters is described; the principle is based on complementation or reconstitution of the split fragments of reporter proteins. To demonstrate the usefulness of the split-reporterproteins, a genetically-encoded bioluminescent indicator for detecting cGMP will be presented.The basic concept is based on complementation of split fragments of Firefly luciferase (Fluc).When concentration of cGMP increases in cytosol, the amino-terminal Fluc is close enough to meet the carboxy-terminal one, and full-length Fluc is reconstituted. We showed quantitativecell-based sensing of ligand-induced elevation of cGMP. The indicator will enable noninvasiveimaging of cGMP in living plants and animals. In addition, methods for detecting protein-proteininteractions, which are based on split-Fluc complementation strategies, will be described

P2-03
Direct Observation of Intracellular Materials Using a Phase Contrast Transmission Electron Microscope (TEM).
Koji Nitta1), Hideki Shigematsu1), Yoshiyuki Fukuda2), Kuniaki Nagayama1),2)
1)Laboratory of Section of Nano-Structure Physiology, Okazaki Institute for Integrative Biosciences,
2)School of Life Science, The Graduate University for Advanced Studies
Intracellular materials can be visible with microscope once are labeled by specific markers. To observe biological specimens using the TEM, also it is requested to prepare samples with steps of fixation, dehydration, resin embedding, sectioning and staining and staining by specific markers. Their markers have many varieties include, heavy metal agents and immune or enzyme reactions. In most of these methods, chemical fixatives are necessary because of the difficulty for agents to penetrate into the cell. This procedure has, however, been introducing serious artifacts. The phase contrast TEM has been developed to solve this problem in our laboratory (1). It has been possible to observe biological objects without staining in the ice embedded state of whole cells (2). Phase contrast TEM suited with unstained and thick samples. We expect that the intracellular materials can directly observe intracellular materials with high resolution with phase contrast TEM without special treatment. As the first step, we have tried to observe inorganic heavy particles in or on biological specimens, which will be extended in future for the specific protein labeling together with the immunostaining method.
References
(1)Danev and Nagayama (2002) J. Biol. Phys. 28: 627-635 (2) Kaneko et al. (2005) J. Electron Microsc. 54: 79-84

P2-04
Structural Analysis of Non-Selective Cation Channel TRPV4 using a Phase-Contrast Transmission Electron Microscope
H. Shigemtsu1), T. Sokabe1), M. Tominaga1), 2), K. Nagayama1), 2)
1)National Institutes of Natural Sciences, Okazaki, Aichi 444-8787, Japan 2)The Graduate University for Advanced Studies, Okazaki, Aichi 444-8787, Japan
Transient receptor potential (TRP) family is widely expanding superfamily of non-selective cation channels; most of them are permeable for Ca2+. TRP superfamily is classified into seven subfamilies according to the sequence homology: the TRPC (Canonical) family, the TRPV (Vanilloid) family, the TRPM (Melastatin) family, the TRPP (Polycystin) family, the TRPML (Mucolipin) family, the TRPA (Ankyrin) family, and the TRPN (NOMPC) family. Some of TRPV and TRPM are known to as a temperature-sensitive channel, although each has a different range of temperature sensitivity. TRPV4 is activated by hypotonic stimuli and also by warm temperature; ~27-35oC resulting in an increase in intracellular Ca2+ concentration. All TRP channels have putative six-transmembrane (6TM) domains, which are thought to assemble as tetramer to form cation-permeable pores. To dissolve the tertiary structure of such macromolecules, transmission electron microscopy (TEM) is known as one of powerful methods. Recombinant TRPV4 was expressed using baculo virus-infected Sf-9 cells and purified using genetically attached hexa histidine-tag. The membrane fraction was solubilized by detergent and purified by affinity chromatography and following size-exclusion chromatography. The detergent solubilized TRPV4 was analyzed using a phase-contrast cryo-TEM in its size distribution and purity. The single-particle analysis of its tertiary structure has been underway and the preliminary structure has been determined.
P4-01
Imaging of tungsten impurity ejected from damaged material due to transient heat load
S.Kajita, N.Ohno1), S.Takamura
Graduate School of Engineering, Nagoya University, Nagoya 464-8603, Japan 1)EcoTopia Science Institute, Nagoya University, Nagoya 464-8603, Japan
Tungsten (W) has been widely used as a plasma facing component where high heat flux isconcentrated because the melting temperature is highest in all the metals. However, recentexperimental observations revealed that bubbles and holes were formed on the tungsten surfacethat was exposed to helium plasmas [1]. Furthermore, it was estimated that the formation of holesdecreases the melting threshold of tungsten for the transient heat load [2,3]. In the present paper,W impurity emission from the damaged target with helium bubbles and holes due to transient heatload are investigated by 2-D imaging using ICCD (Intensified Charge Coupled Device) camera.These studies are important for investigating the effect of the pulsed heat load to materials both ininertial fusion process and in tokamaks such as disruptions and Edge Localized Modes (ELMs) onthe damaged materials. The experiments were performed in divertor simulator NAGDIS-II. The Nd:YAG laser with aQ-switch was used for the transient heat source. The emission from the neutral tungsten wasdetected using a ICCD combined with the narrow band optical filter of which central wavelengthand full width at half maximum of the transmittance are λ=401.0 nm, and ∼0.95 nm, respectively.The gate time width of the ICCD was ∼100 ns. The emission from the W plume was detected aschanging the time delay between the laser pulse and the trigger for the ICCD. W plume wasobserved in response to the laser pulses. The plume expands in time and the emission continuedduring several μs. The dependences of the biasing voltage of the target, surface temperature andthe extent of the damage on the target will be presented in detail in the paper.
References
[1] D. Nishijima and M.Y. Ye and N. Ohno and S. Takamura, J. Nucl. Mater, 329-333 (2004) 1029 [2] S. Kajita, D. Nishijima, N. Ohno and S. Takamura, J. Plasma Fusion Res. 81 (2005) 745 [3] S. Kajita, D. Nishijima, N. Ohno and S. Takamura, submitted to J. Appl. Phys.

P4-02
Near-field optical imaging of electric field and wavefunctions in metal nanoparticles
K. Imura, H. Okamoto
Institute for Molecular Science and The Graduate University for Advanced Studies, Myodaiji, Okazaki, Aichi 444-8585, Japan
Scanning near-field optical microscopes enable optical measurements and observations with a spatial resolution far beyond the diffraction limit of light. This allows us to investigatespectroscopic characteristics and at the same time to spatially resolve the positions point by point in nanoparticles. In this contribution, we report on near-field microscopic studies on surfaceplasmons in gold nanoparticles and aggregates (nanorods, triangular nanoplates, and aggregated nanospheres). We have utilized linear transmission/scattering, as well as nonlinear two-photonexcitation measurements in the near-field, to observe the local electric field or electromagnetic local density of states. We show that the wavefunction of the plasmon excitation in thenanoparticle, resonant with the incident radiation field, is visualized by the near-field methods. Inthe aggregated nanoparticles, strong electric-field enhancement localized in the interstitial sites, which was theoretically predicted previously, is clearly imaged, and its major contribution to surface enhanced Raman scattering with the single-molecule level sensitivity is also shown by the near-field images.
References
[1] K. Imura, T. Nagahara, H. Okamoto, J. Phys. Chem. B, 108 (2004) 16344. [2] K. Imura, H. Okamoto, Opt. Lett., 31 (2006) 1474. [3] K. Imura, T. Nagahara, H. Okamoto, J. Phys. Chem. B, 109 (2005) 13214. [4] K. Imura, H. Okamoto, M. K. Hossain, M. Kitajima, Chem. Lett., 35 (2006) 78.

P4-03
Supported phospholipid bilayer membranes on SiO2 and TiO2 surfaces
R.Tero, T.Ujihara1), H.Watanabe2), T.Urisu
Institute for Molecular Science, Myodaiji, Okazaki, 444-8585, Japan 1) Nagoya University, Nagoya, Aichi, 464-8603, Japan
2) RIKEN, Wako, Saitama, 351-0198, Japan
Lipid bilayer membranes deposited on solid surfaces are called "supported planar bilayers" (SPBs), and expected to be an effective cell-membrane-mimicking model system in vitro. We investigated the influence of surface properties on the SPB formation and characteristic. We prepared SiO2 surfaces with different surface hydroxyl groups (-OHs) density by annealing the SiO2 layer on Si(100). Irreversible thermal desorption of -OHs reduced the surface hydrophilicity. The formation rate of dimyristoylphosphatidylcholine (DMPC)-SPB from 100-nm-filtered vesicles was faster on less hydrophilic surfaces. We proposed that a stable hydrogen-bonded water layer on the SiO2 surface worked as a barrier to prevent vesicle adhesion on the surface. The water layer stability and its dependence are discussed from theoretical calculation results using Si-O cluster models. The surface -OH density little affected the fluidity of once formed SPBs, which was measured by the FRAP method. Application to the area-selective SPB deposition using surface patterning by the focused ion beam will also be described. We also investigated the effects of surface atomic structures and photo-induced hydrophilicity on single-stepped rutile-TiO2 low index surfaces. Single-stepped TiO2(100) surface was prepared by HF aq. treatment and annealing at 700°C at O2 flow. The DMPC 50-nm-filtered vesicles transformed to planar bilayer on the O2-annealed TiO2(100), but adsorbed as vesicles on the UV-irradiated TiO2(100). Trace of single steps was recognized on the SPB on the TiO2(100).
This work was supported by NINS (National Institutes of Natural Sciences) Cooperative Project Bio-molecular Sensor, and Nanotechnology Supporting Project and Grant-in-Aids for Scientific Research on Priority Area and for Young Scientists (B) promoted by the Ministry of Education, Culture, Sports, Science and Technology, Japan. We also gratefully appreciate for the finacial support from the Cosmetology Research Foundation and the Kao Foundation for Arts and Sciences.
P6-01
Charge transfer in collisions of proton with CH3 molecules
Ken-nosuke Hida, Mineo kimura1), Lukas Pichl2), Heinz-Peter Liebermann3) and Robert J.Buenker3)
Foundation for Promotion of Material Science and Technology of Japan, Tokyo 157-8790, Japan 1)Kyushu University, Fukuoka 812-8581, Japan
2)International Christian University, Tokyo 181-8585, Japan 3)Bergishe Universitat Wuppertal, D-42119 Wuppertal, Germany
Various types of molecular impurities such as hydrocarbons have been detected near edge plasma region like divertor. These impurity gases are considered to play a crucial role for determination of plasma temperature and density. In addition, these impurities gases may be utilized as a mean ofplasma diagnostics. Among these hydrocarbons, CH, CH2 and CH3 radicals are known to presentand emitted photon from these molecules are now widely used as a plasma spectroscopy for diagnostics. Therefore, we undertook the project to investigate charge transfer in collision ofprotons and He2+ ions with CH3 molecules in the collision energy from a few tens of eV up to 10 keV. Most of molecular ions produced through ionization are known to be unstable and undergofragmentation. Hence, identification of fragmented species and their production mechanism are important for spectroscopic analysis. The adiabatic potential- energy curves and correspondingwave functions are caluculated by Buenker group using the multireference single- and double-excitation configuration interaction (MRD-CI) method, with configuration selection and evergy extrapolation. And the scattering dynamics is studied on semiclassical impact parametermolecular-orbital close-coupling (MOCC) method.
The present work was supported in part by the Ministry of Education, Science, Sport, Culture and Technologies, Japan, Japan Society for Promotion of Science (JSPS) Japan-Germany Collaborative Resrach Program, the Collaborative program of National Institute for Fusion Science, and the grant of MST.
P6-02
Fulcher-α spectra in the mixed hydrogen isotope plasma
T. Shikama, S. Kado1), F. Scotti, K. Kuwahara, K. Kurihara, Y. Iida, and S. Tanaka
School of Engineering, The University of Tokyo, 7-3-1 Hongo, Bunkyo, Tokyo 113-8656, Japan 1) High Temperature Plasma Center, The University of Tokyo, 5-1-5 Kashiwanoha, Kashiwa,
Chiba 277-8656, Japan
In the edge region of fusion relevant devices, the behavior of hydrogen molecules is related to theglobal particle balance including external fueling/pumping and wall recycling. Moreover, thehydrogen atoms produced by the dissociation of vibrationally excited molecules play significantrole in the determination of the neutral penetration depth across the separatrix. It is capable ofgiving helpful clues to the understanding of detailed molecular and atomic processes related tosuch phenomena by diagnosing the rovibrational temperature of the electronic ground state ofhydrogen molecules. In the analysis of rovibrational population, the Fulcher-α band Q-branchspectra (d3Π-
u → a3Σ+g) have been used since the transition wavelength is in visible region and
there are relatively few perturbations. The development of the techniques for analyzing theFulcher-α band has been undertaken mainly in the plasmas containing single molecular speciessuch as H2 or D2 so far. From the practical point of view, however, it is necessary to investigatethe mixed hydrogen isotopes [1,2], in particular, on the overlap of transition lines and on the possible difference in the rovibrational temperatures. In the present study, we have measured the Fulcher-α band spectra in the mixture plasma ofhydrogen isotope molecules. Experiments were performed using a dc-arc discharge in a divertorplasma simulator MAP-II [3]. In order to analyze the observed Fulcher-α band spectra, the coronalmodel was combined with the calculation of the spectral line shape based on the diagonalization ofthe Hamiltonian matrix elements for diatomic molecules [4]. This work was supported in part by the Ministry of Education, Science, Sports and Culture,Grant-in-Aid for JSPS Fellows, and in part by NIFS Collaborative Research Program (NIFS04KOAB009) directed by the second author.
References
[1]G. H. Dieke, J. Mol. Spec. 2 (1958) 494. [2]A. Pospieszczyk, S. Brezinsek, A. Meigs, Ph. Mertens, G. Sergienko, M. Stamp, 17th PSI conference poster (P1-83) (2006). [3]S. Kado, et al. J. Plasma Fusion Res. SERIES 7 (2006) 123. [4]T. Shikama, S. Kado, H. Zushi, and S. Tanaka, in preparation.
P6-03
Analyses of visible images of the plasma periphery observed with tangentially viewing CCD cameras in the Large Helical Device
M.Shoji, T.Watanabe, S.Masuzaki, H.Yamada, A.Komori and LHD Experimental Groups
National Institute for Fusion Science, Toki, Gifu 509-5292, Japan
Large Helical Device (LHD) is the largest super-conducting helical machine. Thesuper-conducting coils consist of three pairs of poloidal coils and two twisted helical coils whichhave three independent conductive layers for changing the coil pitch parameter (γ). The magneticfield produced by the poloidal coils can control the plasma shape by changing quadruple magneticcomponents (BQ). Magnetic field configuration produced by the two super-conducting coils form a complicated structure of the magnetic field lines (ergodic layer and divetor legs) around magnetic surfaces (plasma confinement region). The control of electric currents of these coils provides flexible change of magnetic configurations for plasma confinement. It can change the radial position of the magnetic axis (Rax), the shape/size of magnetic surfaces, the thickness of the ergodic layer, and the location of the strike points, etc. Tangentially viewing CCD cameras have routinely monitored the images of visible light in the plasma periphery and the divertor legs in various magnetic configurations. Complicated structure of the visible light depending on the magnetic configurations has been observed, which provides some significant experimental and physical information about the location of the strike points, the structure of the ergodic layer and the divertor legs, atomic and molecular processes in the plasma periphery, and plasma wall interactions on divertor plates, etc. Three-dimensional magnetic field line trace in the plasma periphery is a powerful technique for analyzing and interpreting the observed images of the visible light. The images of the calculated magnetic field lines from the position of the CCD cameras quite agree with the observations in various magnetic configurations, which can show the correspondence between the complicated structure of the visible light and the three-dimensional structure of the peripheral plasma forming along the magnetic field lines. In this paper, the observed images of the visible light emitted from the peripheral plasma and divertor legs are investigated from the viewpoint of the three-dimensional structure of magnetic field lines in the plasma periphery. The calculated distributions of the strike points in various magnetic configurations will be shown for determining the operational range of the magnetic configurations (various Rax, γ and BQ) which can satisfy the experimental condition that most of the strike points locate on the divertor plates for safe operation in LHD.

P6-04
A new Doppler shift spectroscopy for the measurement of neutral beam profile
Y.Shi,B.Wan,G.Wang,C.Hu,Z.Wu
Institute of Plasma Physics,Chinese Academy of Sciences
A new diagnostic base on Doppler shift is designed which measures the profile of hydrogen or deuterium neutral beam on the magnetic confined fusion machines. The interference filters and multi-channel PIN detectors are the main components of this diagnostic. The multi-channel PIN detectors measure the line integer Doppler Ha signal emitted by the neutral beam at one section in two directions. The local intensity of neutral beam can be obtained with the tomography technololy. Compare to the conventional calorimeter diagnostics, this diagnostic can provide the beam profile without blocking the injection of neutral beam.
P6-05
Observation of Hydrogen and Cesium Spectra in a Negative Ion Source for a Neutral Beam Injector using a Multi-channel Spectrometer
K. Ikeda, U. Fantz;1), K. Nagaoka, Y. Takeiri, M. Osakabe, K. Tsumori, O. Kaneko, Y. Oka
National Institute for Fusion Science, Toki, Gifu 509-5292, Japan 1)Max-Planck-Institut für Plasmaphysik, Teilinstitut Greifswald IPP-EURA TOM Association,
D-17489, Greifswald, Germany
Production of a negative hydrogen ion is one of the key issues for a high-energy neutral beam injector (NBI). Two large size negative-ion sources are installed in each negative-ion based NBI system to heat plasma in the Large Helical Device (LHD). Cesium vapor is seeded to enhance the production of negative hydrogen ions into our ion sources, but the behavior of cesium ions and the neutral particles has not been observed continuously at NBI operation. We adopted the multi-channel visible spectrometers in order to observe the behavior of hydrogen spectra and cesium spectra. Plasma emissions, which are path-through a quartz window, are focused on the two quartz optical fibers in an optical connector by lens. One optical fiber is connected to a wide range survey spectrometer (PLASUS EmiCon 4ch), and the other optical fiber is connected a high-resolution spectrometer (ANDOR shamrock) with a multi-channel configuration. In order to obtain spatially resolved data, we used five observation view ports and five bundled optical fibers to observed the behavior of the hydrogen arc discharge and the cesium dynamics. We have calibrated these spectrometers by using an Ulbricht sphere (SphereOptics LR-12-M). We have clearly observed the Balmer emission spectra, molecule hydrogen Fulcher lines, oxygen neutral spectra, cesium neutral spectra, and cesium ion spectra. Intensity of hydrogenous spectra increases as a function of input arc power at each observing position. Cesium signal increases by increasing the total evaporation time, and the signal jumps up for beam extracting duration. We have also observed a difference of the intensity of the cesium neutral spectrum between the observation from the back plate and from the upper side view port, which indicates on higher degree of ionization of cesium in the bulk plasma.

P6-06
A Multi-reflection Type Visible-laser Interferometer for High Density Plasma Measurements
K.Hattori, Y.Noguchi, A.Ando, M.Inutake
Department of Electrical Engineering, Graduate School of Engineering, Tohoku University Aoba-yama 6-6-05, Sendai 980-8579, Japan
A magneto-plasma-dynamic arcjet (MPDA) is utilized as a high-enthalpy plasma source not only for a plasma injection source for open magnetic confinement experiments but for an electric propulsion and several industrial applications. Detailed measurement of plasma density in the vicinity of an MPDA is important to evaluate its performance. The interferometry method [1] using electromagnetic waves is useful and convenient to obtain a line-integrated plasma density. As a plasma density in the vicinity of an MPDA is more than 1014cm-3, it is difficult to measure a plasma density by an electrostatic probe. The purpose of this research is to develop a laser interferometer for measurement of a high density plasma in the vicinity of an MPDA . The feature of this interferometer is to use a He-Ne laser (λ= 632.8 nm) and a multi-reflectionoptical system. A He-Ne laser is easily obtained and easy to handle as visible light. Although itdoesn’t have enough phase shift when the light passes through the MPDA plasma once, we adopta multi-reflection optical system in this interferometer to improve the phase sensitivity. A phase isdetected using the Michelson-type interferometer, where a He-Ne laser (10mW) was used as alight source. The probe beam passes through the MPDA plasma[2] and reflected between a cornercube mirror and a flat mirror many times. The phase shift of 21 degrees is expected when the lightpasses 10 times through the plasma with line-integrated density of 3×1015cm-2. The interferometer was attached to the HITOP device[3] and an MPDA is operated with 1ms duration quasi-steadily. We measured a plasma density by the interferometer and estimated the maximum value of line-integrated density of 3×1015cm-2. These experimental results are consistent with thatof the electrostatic probe measurement in the downstream region.
References
[1] I.H.Hutchinson, "Principles of Plasma Diagnostics", Cambridge Univ.Press.(2002). [2] D.Lee et al., Rev. Sci. Instrum., 71(2000)1981. [3] M. Inutake, A. Ando, et al., J. Plasma Fusion Res., 78(2002)1352.
P6-07
Development of real-time measurement system of charge exchange recombination spectroscopy and its application to
feedback control of ion temperature gradient in JT-60U
S. Kobayashi, M. Yoshida1), H. Takenaga1), S. Sakata1), Y. Kamada1), Y. Sakamoto1), Y. Koide1), and the JT-60 Team
Institute of Advanced Energy, Kyoto University, Gokasho, Uji 611-0011, Japan (1)Japan Atomic Energy Agency, Naka, Ibaraki-ken, 311-0193, Japan
In magnetically confined plasmas, the control of the pressure profile is important subject for sustaining high performance plasmas and/or avoiding MHD instabilities. Real-time measurement system of ion temperature has been developed for the feedback (FB) control of the ion temperature profile including temperature gradient with the filter charge exchange recombination spectroscopy (CXRS) system in JT-60U [1,2]. In the filter CXRS system, the ion temperature can be evaluated by the simplified fitting functions using the intensity ratios of three sets of interference filter assemblies assuming a Maxwellian shape of the spectral profile of the CXR emission. This rapid analytical scheme without non-linear least square fitting enables us to calculate the ion temperature with four spatial points every 10 ms using a real-time processor (RTP) system [3]. The real-time control experiment of the ion temperature has been demonstrated in the ELMy H-mode plasmas. The central ion temperature has been controlled in the range from 2 to 7 keV using 9 units of neutral beam injector (maximum 18 MW) as actuator. By optimizing the proportional and differential gains in FB systems, the central ion temperature almost agreed with the reference one. The measurement system has been modified to obtain the suitable signal-to-noise ratio and space- and time- resolutions for the real-time FB control of the ion temperature gradient. The experiment of the FB control of the temperature gradient is started aiming at sustaining the high normalized beta plasma with suppressing MHD instabilities such as neoclassical tearing modes.
References
[1] S. Kobayashi, et al., J. Plasma Fusion Res. 79 (2003) 1043. [2] M. Yoshida, et al., Trans. Fusion Sci. Tech. (submitted). [3] S. Sakata, et al., Fusion Eng. Des. 48, (2000) 225.

P6-08
Temperature Diagnostics for Field-Reversed Configuration Plasmas on the Pulsed High Density (PHD) Experiment
Hiroshi Gota, Samuel Andreason, Chris Pihl, and John Slough
Plasma Dynamics Laboratory, University of Washington, Seattle, WA 98115, USA
The High Flux Source (HFS) for the Pulsed High Density Experiment (PHDX) has beenconstructed, and experimental studies to produce field-reversed configuration (FRC) plasmas are under way. The PHDX will expand the conventional regime of the FRC to the very compact, high energy density regime to approach fusion. In this approach, the energy needed to compress the FRC to fusion conditions is transferred to the FRC via simple, relatively low field acceleration/compression coils. The experiment is essentially the first step, and continuing progress towards breakeven can be made in incremental steps with additional stages of acceleration and compression. Initial studies explore pre-ionization and formation methods used to create high flux FRCs on the PHDX. To obtain the electron density and temperature of the FRC plasma a λ=632.8 nm He-Ne laserinterferometer system is set up near the midplane of the HFS, and to estimate the ion density andtemperature a 16 channel spectrometer has been installed for end-on viewing. Other diagnosticsystems include an axial array of magnetic probes and flux loops, 64 channel array of opticalmeasurement system for visible bremsstrahlung tomography, 14 channel array of line-integratedvisible light measurement, a gated single spectrometer, a bolometer, and an end-on framingcamera. For more detailed density and temperature analyses a soft x-ray measurement system isbeing developed on the end flange of the HFS; this system consists of 5 AXUV100 photodiodeswith directly deposited filters which have approximately 0.1−0.3 μm thick films (Al, Zr/C, Sn/Ge,Cr/Al, and Ti/Pd) on each diode. Both parameters of electron temperature Te and electron density ne are approximately determined by comparing the response of the several filtered detectors to their computed response using the emissivity from an atomic model of the plasma with Teconvolved with the spectral responsivity of each detector. To estimate the sample spectrum on the PHDX, the spectral analysis code (from the Prism Computational Science, Inc.) is used. Once we have an emissivity for some nominal choice of impurities, we can use simple scaling with impurity density to assemble an emissivity spectrum for a combination of impurities. We will present both computational and experimental results from the soft x-ray measurement system and the comparison of all density and temperature diagnostics for FRC plasmas on the PHDX.
Research funded by the United States Department of Energy.

P6-09
A simultaneous spectroscopic measurement for the global and edge fine structures of the ion temperature and plasma rotation profiles in the Compact Helical System
S.Nishimura, K.Nagaoka, Y.Yoshimura, K.Nakamura, H.Iguchi, T.Ohishi, T.Minami, T.Akiyama, K.Ida, K.Toi, M.Isobe, C.Suzuki, S.Okamura, K.Matsuoka, and CHS Group
National Institute for Fusion Science, 322-6 Oroshi-cho, Toki 509-5292, Japan
In charge exchange spectroscopic (CXS) measurements[1] to investigate radial distributions of ion temperatures Ti(r), poloidal rotation velocities Vp(r), and impurity densities nI(r) in magneticallyconfined toroidal plasmas, a simultaneous observation in different plasma toroidal cross sectionsand/or viewing ports is required. One reason is a need to monitor the background radiationobscuring the spatial resolution. Another requirement is to detect the Doppler shifts correctly withvisible spectrometers in which mechanical wavelength offsets of ~0.5Å cannot be eliminated. Thebest approach to detect the correct Doppler shifts is simultaneous viewing from oppositedirections. In addition to these problems, the toroidal asymmetry of the plasma geometrical shapesbrought another requirement especially in recent studies of edge transport barriers (ETB) in helicalplasmas. From several edge plasma measurements in the Compact Helical System (CHS), it hasbeen suggested that the edge pedestal region, where the ion pressure gradients and correspondingion rotation are expected, is very narrow (for e.g., Δr/a<0.1, where r and a are minor radii ofmeasured flux surfaces and the outermost flux surface) if it exists. Detections of the rotations andthe ion temperature profile in the narrow region are impossible with previous CXS system at avertically elongated section in CHS with the chord spacing ΔR=7.5mm corresponding to a spatialresolution of Δr/a=0.06. To improve this spatial resolution, we carried out a CXS measurement ata horizontally elongated cross section. The chord spacing ΔR=6.3mm at the equatorial plane Z=0corresponds to a spatial resolution of Δr/a=0.02. We measured radial profiles simultaneously at both of the vertically elongated sections to obtain global structure in 0<r/a<1 with 24 chords × 2directions, and the horizontally elongated section for the local fine structures at the edge pedestal region at r/a≈1 with 9 chords. The total 90 fibers including chords for the background radiationare connected to one spectrometer. A 256×243pixels sampling CCD with an image intensifier isused to detect the diffraction image. As a result of the analysis including the corrections andcalibrations for various apparent wavelength shifts such as those by the spectral fine structure[1]and the aberration, it is found that there is a localized edge ion temperature pedestal structure ofΔTi≈100eV and Δr/a≈0.1, and the negative radial electric field of -10kV/m is increased there inthe high confinement phase.
References
[1] R.J.Fonck, D.S.Darrow, and K.P.Jaehnig, Phys.Rev. A 29 (1984) 3288
P6-10
Simultaneous Measurement of Proton Ratio and Beam Divergence of Positive-ion-based Neutral Beam in the Large Helical Device
K. Nagaoka, M. Osakabe, K. Ikeda, Y. Takeiri, Y. Oka, K. Tsumori, O. Kaneko, and LHD experimental group
National Institute for Fusion Science, Toki, Gifu 509-5292, Japan
Positive-ion-based neutral beam injector (P-NBI) was installed in the Large Helical Device (LHD) at 9th experimental campaign (2005-2006). The neutral hydrogen beam with energy of 40keV was injected into LHD plasmas, and was utilized as a diagnostic neutral beam (DNB) for a charge-exchange spectroscopy measurement. The low energy beam has a higher efficiency of ion heating than that of high energy beam (180keV) produced by negative-ion-based neutral beam injectors (N-NBIs) installed in LHD, so ion heating experiments were also performed using the P-NBI. In order to evaluate heating efficiency, it is necessary to know proton ratio of the beam because half and one-third energy components are included in the beam produced by P-NBI, and they affect beam deposition and heating efficiency. On the other hand, monitoring of the beam divergence is important for stable beam operation and accurate estimation of port-through power of the beam. Thus, we developed a simultaneous measuring system of the proton ratio and the beam divergence. In order to measure both proton ratio and beam divergence, the beam emission spectroscopy in the P-NBI was designed and performed in 9th LHD campaign. The line of sight crosses the beam diagonally to obtain both parallel and perpendicular components to the beam direction. The Hαemission from neutral hydrogen beam shows three lines near the H-alpha emission from background hydrogen gas due to Doppler-shift of the beam, and they correspond to full, half, and one third energy components. The intensity of each line is sensitive to the arc power (perveance), and the proton ratio decreases and one-third component increases in low arc (perveance) operation. The Doppler broadenings of each line reflect the beam divergence. The beam let focus effects and other geometrical effects are also included the broadening of these lines, but they are almost constant in the beam operation. The width of full energy spectrum in wave length space was compared with beam width measured on the calorimeter, and the linear relation between them was clearly seen. These results show that this system is useful for monitor of proton ratio and beam divergence. We also discuss the reliable estimation of port-through power of the beam using combination of optical measurement of beam divergence and calorimetrical measurement on an armor tile.
This work was sopported by NIFS05ULBB501.
P6-11
Infrared Imaging Video Bolometer with a Double Layer Absorbing Foil
I. V. Miroshnikov, B. J. Peterson1) and A. Yu. Kostryukov
St.Petersburg State Polytechnical University, 29 Politechnicheskaya St., St.Petersburg, 195251, Russia.
1 National Institute for Fusion Science, 322-6 Oroshi-cho, Toki, 509-5292, Japan
The idea of infrared imaging bolometry is to absorb the incident plasma radiation in an ultra thin(1μm- 2.5μm) metal foil, to measure the temperature rise of the foil remotely by means of infraredvideo camera and finally to calculate the incident radiation power flux as a function of measuredtemperature rise. Initially [1] metal foil pixels were thermally isolated by two segmentedsupporting plates. The central part of the plates was later eliminated [2] and a large (10 cm × 10cm) foil was supported by a copper frame. The thermal fluxes between the neighboring pixelswere calculated and taken into account during a special reconstruction procedure. To achieve the most effective transformation of the incident radiation power flux into infrared radiation measured by an infrared camera one should provide good thermal isolation of each bolometer pixel from the other pixels and from the supporting frame. The object of the presentpaper is an infrared video bolometer with a bolometer foil consisting of two layers: the first layer is constructed of radiation absorbing blocks and the second layer is a thermal isolating base. The absorbing blocks made of a material with a high photon attenuation coefficient (gold) were spatially separated from each other while the base should be made of a material having high tensile strength and low thermal conductance (stainless steel). Such a foil is being manufactured in St.Petersburg and will be calibrated in NIFS using a vacuum test chamber and a laser beam as an incident power source. A finite element method (FEM) code was applied to simulate the thermal response of the foil. The FEM predicts a higher temperature by a factor of two with the double layer foil than the single foil IRVB using the same absorber material and thickness and shows negligible crosstalk between the pixels. The calibration data will be compared to the results of the computer simulation.
References
[1] G.A. Wurden, B.J. Peterson and S. Sudo, Rev. Sci. Instrum. 68, 766 (1997). [2] B. J Peterson, A. Yu. Kostryukov, et al., Rev. Sci. Instrum. 74, 2040 (2003).
This research is supported by MEXT Grant-in-Aid # 16082207.

P6-12
Two-dimensional measurement of inward neutral flux in LHD
M.Goto and S.Morita
National Institute for Fusion Science, Toki 509-5292, Japan
Three emission lines of neutral helium, i.e., the λ 667.8 nm (21P - 31D), λ 728.1 nm (21P - 31S),and λ 706.5 nm (23P - 33S) lines, are observed with a set of parallel lines of sight which covers an entire poloidal cross section of the plasma in the Large Helical Device (LHD). Their emission locations and intensities are individually determined with the help of observed Zeeman profiles, and the electron temperature and density are evaluated at each emission location by means of the intensity ratios among the observed three emission lines. From these results and collisional-radiative model calculations, the poloidal distribution of ionization flux or its equivalent quantity, inward neutral flux, is determined with high accuracy. The result shows strong inhomogeneity in the two dimensional neutral flux distribution: the flux is relatively strong in the vicinity of the inboard side X-point. This implies high particle recycling in the inboard side divertor region which has been also suggested by the Langmuir probe measurement of the ion flux onto the divertor plates and the neutral transport simulation.

P6-13
Design of Impurity Influx Monitor (Divertor) for ITER
H. Ogawa, T. Sugie1), S. Kasai, A. Katsunuma2), H. Hara3) and Y. Kusama
Japan Atomic Energy Agency, Naka, Ibaraki 310-0193, Japan 1) ITER-IT, Naka, Ibaraki 310-0193, Japan
2) Nikon Co., Shinagawa, Tokyo 140-0015, Japan 3) Toyama Co., Ltd., Zama, Kanagawa 228-0003, Japan
The main function of the Impurity Influx Monitor (Divertor) for ITER is to measure the parameters of impurities and isotopes of hydrogen in the divertor plasmas by using spectroscopic techniques with the wavelength range of 200 - 1000 nm. The measurements are required for the full duration of the ITER pulse and special provisions are necessary to provide the measurements in the harsh environment such as high radiation field and/or high temperature for diagnostic components. In order to perform the two-dimensional measurement in the poloidal plane, this monitor observes divertor region using four optical systems; from the divertor cassette, through the gap between the divertor cassettes, from the equatorial and the upper port. In the optical design of each optical system, simple Cassegrain telescope is used as a collectionoptics. In addition the micro lens array will be inserted just in front of fiber bundle to extend theobserved area to toroidal direction. The effective size of a vacuum window is 120 mm φ in thisdesign. The spatial resolution estimated from the irradiance distribution will meet the ITERrequirement for the spatial resolution of 50 mm. The mechanical design of mirror folders for the front-end optics of the upper, the equatorial, and the divertor port is performed. In the upper port, the front-end optics consists of three mirrors. They are mounting on the mirror mounting module of 300 mm diameter which will be installed inside the pipe with inner diameter of 300 mm replaced with that for the remote-handling of the port plug. It has many cooling channel to remove the nuclear heating. The effect of the thermal strain to the optical property is estimated by the simple steady state heat analysis and the optical design code assuming the constant nuclear heating of 0.2 MW/m3. The result indicates that the temperature rise of the mirror and mirror mounting module is < 60°C and the difference of thethermal strain on the mirror surface is less than 0.08 mm. Optical design code suggests that this difference causes only small movement of the optical path.

P6-14
2-d image diagnostic technique for edge turbulence using fast cameras
N. Nishino, T. Mizuuchi1), Z.Feng2), S. Kobayashi1), K. Nagasaki1), H. Okada1), F. Sano1)
K. Kondo3), Y. Nakashima4), Y. Higashizono4), H. Kawano4), T. Cho4)
M. Shoji5), K.Sasaki6), K.Hanada7), H.Zushi7)
Graduate school of Engineering, Hiroshima University, Hiroshima 739-8527, Japan 1) Institute of Advanced Energy Kyoto University, Kyoto 611-0011, Japan
2) Southwestern Institute of Physics, Chengdu, China 3) Graduate School of Energy Science, Kyoto University, Kyoto 611-0011, Japan
4) Plasma Research Center, University of Tsukuba, Ibaraki, 305-8577, Japan 5) National Institute for Fusion Science, Gifu, 509-5292,Japan
6) Graduate School of Engineering Sciences, Kyushu Univ., Kasuga 816-8580, Japan 7) Research Institute for Applied Mechanics, Kyushu Univ., Kasuga 816-8580, Japan
Two-dimensional imaging technology is widely used in plasma physics recently. In pariticular, high-speed camera has been using for this above aim since twenty years ago. Progress of these cameras are very splendid and typical shutter speed of the latest models are faster than 100,000 frames per second. Using a fast camera the edge turbulence measurement was demonstrated mainly in GAMMA 10 and Heliotron J by Bi-directional collaborative activities. In this paper, the results obtained in both device are presented.
This study is supported by Bi-directional Collaborative Activities and NIFS.
P6-15
Two-dimensional measurement of plasma dynamics with an ICCD fast camera based on HeI line intensity ratio method
N. Yamamoto, K. Miyamoto1), K. Kitagawa, S. Kajita1), M. Okamoto1), N. Ohno
EcoTopia Science Institute, Nagoya University, Nagoya, Aichi 464-8603, Japan 1)Department of Energy Engineering and Science, Graduate School of Engineering, Nagoya,
Aichi 464-8603, Japan
The investigation of dynamic behavior of edge plasmas in fusion devices has receivedconsiderable attention associated with edge localized mode (ELM) and disruption. In the International Thermonuclear Experimental Reactor (ITER), it is considered that the intermittent plasma heat load due to the ELMs and disruption determine the lifetime of the plasma-facing components. In order to understand the dynamics of ELMs and disruption in the edge plasma regions, the spatial- and time-resolved measurement of electron temperature and density is necessary. Improvement of collisional radiative (CR) model of He can make it possible to measure electrondensity as well as temperature with better accuracy by using HeI lines (667.8 nm, 706.5 nm and 728.1 nm) [1]. Recently, dynamic behaviors of ELMs and disruption were measured by thespectroscope equipped with three optical filters and photomultiplier tubes, which can detect the HeI lines, simultaneously. In order to measure two-dimensional plasma dynamics in ELMs and disruption, we are developingan ICCD fast camera with the HeI optical filters, which can give 3 images for the HeI lines, simultaneously. In this presentation, we will report the detail of the ICCD fast camera, including the calibration method. We will also present the preliminary experimental results of the dynamic 2D measurement in the small tokamak.
References
[1] M. Goto, J. Quant. Spectrosc. Radiat. Transf. 76 (2003) 331.

P6-16
High-speed visible imaging of central-cell plasmas in the GAMMA 10 tandem mirror
Y. Nakashima, N. Nishino1), Y. Higashizono, H. Kawano, S. Kobayashi2), M. Shoji3), Y. Kubota, T. Kobayashi, M. Yoshikawa, H. Higaki, M. K. Islam, Y. Mishima and T. Cho
Plasma Research Center, University of Tsukuba, Tsukuba, Ibaraki 305-8577, Japan 1) Graduate school of Engineering, Hiroshima University, Hiroshima, 739-8527, Japan 2) National Institute for Fusion Science, 322-6 Oroshi-cho, Toki, Gifu 509-5292, Japan
3) Institute of Advanced Energy, Kyoto University, Gokasho, Uji 611-0011, Japan
Behavior of edge plasmas and neutral particles plays an important role on plasma transport and recycling phenomena in magnetically confined plasmas. The gas puff imaging (GPI) diagnostic with high-speed camera provides useful information on the behavior of edge plasmas as two-dimensional (2-d) images of visible light emission [1,2]. Recently, in the GAMMA 10 tandem mirror, observation of the plasma motion using high-speed camera was started in the central-cell [3]. Neutral hydrogen density in the central-cell also has been evaluated by measuring Hαline-emission together with neutral transport simulation using the DEGAS Monte-Carlo code [4] in order to investigate the neutral particle behavior in the tandem mirror plasmas [5-6]. GAMMA 10 consists of an axisymmetric central-mirror cell, anchor-cells with quadrupole magnetic configuration, and plug/barrier regions with axisymmetric mirrors in which plasma confining and thermal barrier potentials are produced. In GAMMA 10, 2-d visible measurement by using two high-speed cameras (Ultima-SE, Photron Inc. and K4, NAC Inc.) was performed recently based on bi-directional collaboration between Hiroshima and Tsukuba Universities. In standard hot-ion-mode plasmas, hydrogen puffing with a short pulse (3 ms) near the central-cell midplane was carried out and the time evolution of visible light emission from the gas cloud was precisely investigated. In the latest collaboration experiment, 2-d images of the ablation light induced by hydrogen ice-pellet injection are also successfully captured for the first time at the GAMMA 10 central-cell. In this paper, the results of 2-d imaging obtained with the high-speed cameras are precisely presented and the detailed behavior of periphery plasmas and neutrals is analyzed in terms of edge plasma turbulence and neutral transport simulation analyses.
References
[1] S. J. Zweben et al., Phys. Plasmas 9 (2002) 1981. [2] R. J. Maqueda et al., Rev. Sci. Instrum. 74 (2003) 2020. [3] N. Nishino, et al., Plasma Fusion Res. 1 (2006) 035. [4] D. H. Heifetz, et al., J. Comput. Phys. 46 (1982) 309. [5] Y. Nakashima, et al., J. Nucl. Mater. 196-198 (1992) 493. [6] Y. Nakashima, et al., J. Plasma Fusion Res. SERIES 6 (2004) 546.
P6-17
Behavior of Hydrogen Fueled by Pellet Injection in the GAMMA 10 Tandem Mirror
Y.Kubota, M.Yoshikawa, Y.Nakashima, T.Kobayashi, Y.Higashizono, K.Matama, M.Noto, and T.Cho
Plasma Research Center, University of Tsukuba, Tsukuba, Ibaraki 305-8577, Japan
Sustainment of the steady state plasmas with higher densities and temperatures is one of the most important subjects to realize the fusion reactor. The development and optimization of the fueling method enable us to increase and sustain plasma density. In the present plasma experiments, there are three major fueling methods; namely, gas puff, neutral beam injection and pellet injection. Pellet injection is used as a particle source in the core region of the plasma. The importance of pellet injection is highlighted under the condition at high density and high temperature plasmas. To study the effects of the pellet injection on the target plasma, it is important to evaluate the neutral hydrogen behavior as well as plasma densities and temperatures. In the GAMMA 10 tandem mirror, the study of particle fueling has been carried out for the purpose of producing high performance plasma discharges [1, 2]. In the central cell of GAMMA 10, the pellet injection system is installed near the mid-plane to improve plasma parameters and to study the pellet-plasma interactions in an open system [3, 4]. Hα and Hβ line emission detector arrays [5] are used to estimate the behavior of fueled particles. In recent experiments, hydrogen pellets are injected with electron cyclotron resonance heating atthe plug/barrier and central cells. Consequently, increases in electron densities and Hα lineemission with several peaks are observed. The spatial profile of Hα line emission has a peak in the peripheral region of the injection side. These results show that the pellet cracks into some small pieces somewhere of the injection path. In this paper, we discuss the behavior of pellet and plasma parameters, in particular the radial and axial profiles of Hα line emission, caused by the pellet injection.
References
[1] Y. Nakashima et al., Trans. Fusion Sci. Technol. 43, No.1, T, 135 (2003) [2] Y. Nakashima et al., J. Nucl. Mater. 313-316, 553 (2003) [3] E. Kawamori et al., J. Plasma & Fusion Res. SERIES 3, 473 (2000) [4] Y. Kubota et al., Rev. Sci. Instrum. 75, 4228 (2004) [5] M. Yoshikawa et al., Trans. Fusion Technol. 35, 273 (1999)

P6-18
Measurements of Oxygen Ion Spectra for Estimation of Electric Field Profiles in Cylindrical Plasmas
T. Kobayashi, M. Yoshikawa, Y. Kubota, K. Matama, M. Noto, J. Yokoshima, and T. Cho
Plasma Research Center, University of Tsukuba, Tsukuba, Ibraki 305-8577, Japan
In fusion plasmas, electric field profiles play an important role in improvement of plasma confinement. In torus plasmas, such as tokamak and helical systems, an H-mode and an internal transport barrier are associated with the electric field profiles. In tandem mirror systems, the electric field profiles play similar role [1, 2]. Mirror devices, having open-ended regions, provide intrinsic important advantages in terms of the control of radial-potential or sheared E×B rotation profiles on the basis of axial particle-loss control. In order to study physical basis of the improvement of plasma confinement, measurements of the electric field profiles in various plasmas are of essential importance. We have developed a measurement technique of the electric field profiles by using a ultra-violet/visible (UV/V) spectroscopy and a collisional-radiative model (CR-model) in cylindrical plasmas [3]. The CR-model was used for estimation of a diamagnetic drift via evaluation of a impurity density profile. In that study, the CII spectrum (426.726 nm: 2s23d(2D) – 2s24f(2F)) was observed, since the CR-model calculation code for carbon ions has been developed already [4]. However, the CII emission had very low intensity even if the spectroscopic system had the maximum sensitivity in a wavelength region around 430 nm in the GAMMA 10 tandem mirror. The spectra from oxygen ions (OII, OIII OIV and OV) have high intensity in UV/V region in the GAMMA 10 central cell and anchor cells. While there was no CR-model calculation code for lower charge states of oxygen ions. Recently, we started to construct the CR-model for oxygen ions for GAMMA 10 plasma measurements. We evaluated the density profile of oxygen ions by using our new code [5, 6]. Moreover, CCD camera system was revised to achieve the higher wavelength resolution than that of the previous system. In this paper, we show observed results of electric field profiles by using the new spectroscopic system and the newly constructed CR-model for oxygen ions.
References
[1] T. Cho et al., Phys. Rev. Lett. 94, 085002 (2005). [2] T. Cho et al., Phys. Rev. Lett. 97, 055001 (2006). [3] T. Kobayashi et al., Rev. Sci. Instrum. 75, 4121 (2004). [4] T. Kato et al., Fusion Eng. Des., 34-35, 789 (1997). [5] T. Kobayashi et al., Proc. of 33rd EPS, Conference on Plasma Physics (2006). [6] T. Kobayashi, et al., Proc of 6th OS2006 (2006).
P6-19
Study of Edge Plasma Characteristics at H-mode Transition in Heliotron J
S.Watanabe,K.Nagasaki1),T.Mizuuchi1),K.Kondo,S.Kobayashi1),H.Okada1),S.Yamamoto2),Y.Torii3), M.Kaneko4),G.Motojima,H.Arimoto,Z.Feng5),M.Nosaku,T.Tomokiyo,S.Matsuoka,F.Sano1)
Graduate School of Energy Science, Kyoto University, Gokasho, Uji, Kyoto 611-0011, Japan 1)Inst. of Advanced Energy, Kyoto Univ., 2)Grad. School of Engineering, Osaka Univ., 3)Grad. School of Frontier Sciences, Univ. Tokyo, 4)NIFS, Toki, Japan, 5)SWIP, China
Spontaneous transition to a high confinement mode (H-mode) was observed in a helical-axisheliotron device, Heliotron J [1]. Typical transition phenomena were characterized by a drop in Hαsignal and an increase in stored energy and electron density. The transition frequently occurs in low (B04/B00 = 0.01) and medium (B04/B00 = 0.06) bumpiness configurations compared to high one (B04/B00 = 0.15) under the condition of the same electron density and the ECH. These results suggest that the field configuration has an important role on triggering the transition. We have measured radiation profiles using multi-channel photodiode and AXUV detectors whichcover a wide wave-length range from visible to soft X-ray. The plasma radiation drops in the scrapeoff layer (SOL) just after the H-mode transition for all three configurations, suggesting the formationof the edge transport barrier. We have also observed a characteristic time-evolution of the radiationprofile near the transition phase, which depends on the configuration. In low- and medium-bumpinessconfigurations, an in-out asymmetric change of radiation profile is observed before the transition, andthe radiation increases inside the last closed flux surface after the transition. On the other hand, theradiation increases with keeping the profile shape a parabolic one except the SOL before and after thetransition at high bumpiness configuration. These differences of the edge asymmetric changes may berelated to the formation of the edge transport barrier. In order to investigate the edge structure, the characteristics of edge plasma fluctuation before andafter the H-mode transition are investigated by analyzing the probability density functions (PDFs) ofthe ion-saturation current fluctuation measured with a Langmuir probe set [2]. In the L-mode phase,the skewness and the kurtosis are larger than the Gaussian PDF for all three configurations. Asapproaching the transition timing, they start to decrease, and the PDF becomes nearly Gaussian one. Itis this phase when the asymmetric evolution of the edge radiation is observed in the mediumbumpiness configuration and the stored energy and the electron density increased modestly. Thecharacteristics of L- and H-modes will be discussed with regards to the non-Gaussian plasma edgeturbulence.
References
[1] F. Sano,et al.,Nucl. Fusion 45 (2005) 1557-1570 [2] T. Mizuuchi,et al.,J. Plasma Fusion Res. Vol.81,No.11 (2005) 949-959

P6-20
Spectroscopic measurements of emission spectra by using multi-channel UV/visible impurity monitor
K.Matama, M.Yoshikawa, T.Kobayashi, Y.Kubota, M.Noto, J.Yokoshima and T.Cho
Plasma Research Center, University of Tsukuba, Tsukuba, Ibaraki, 305-8577, Japan
Measurements of impurity emission spectra from fusion plasmas are very important to investigate impurity behavior, wall condition and radiation loss. In GAMMA 10, the spectroscopic measurements have been performed at wavelength range of ultraviolet and visible (UV/visible), vacuum ultraviolet and soft X-ray[1-5]. We constructed new UV/visible spectroscopic system for impurity monitor using two multi-channel spectrometers. One of the spectrometers can measure the absolute intensity of the spectra in the wavelength range of 200-500 nm; the other, 400-700 nm. This system provides the advantage of measuring the entire wavelength range of the UV/visible radiation spectra in a single plasma shot. The spectroscopic measurements of impurity spectra by the impurity monitor system have been carried out in GAMMA 10 central cell. The time-varying emission intensities of radiation spectra were successfully measured in a single plasma shot. The line identification was performed for measured data. Then, the shot trends of several line spectral intensities were obtained. Using these spectral intensity data measured in this experimental series, the plasma parameter dependence of radiation loss and emission intensities in the UV/visible range are evaluated. Moreover, we estimated the electron density and temperature after applying the measured hydrogen spectral intensity data to a collisional-radiative model in each plasma shot.
References
[1] K. Ikeda et al., Phys. Rev. Lett., 78, 3872 (1997) [2] T. Kobayashi et al., J. Plasma Fusion Res., SERIES, 7, 45 (2006) [3] M. Yoshikawa et al., Trans. Fusion. Technol., 35, 273 (1999) [4] M. Yoshikawa et al., J. Plasma Fusion Res., SERIES, 3, 402 (2000) [5] M. Yoshikawa et al., Trans. Fusion. Technol., 39, 289 (2001)

P6-21
Line analysis of EUV spectra from molybdenum and tungsten injected in LHD
Malay Bikas Chowdhuri, Shigeru Morita1) and Motoshi Goto1)
Graduate University for Advanced studies, Toki 509-5292, Japan 1) National Institute for Fusion Science, Toki 509-5292, Japan
Spectroscopic data on high-Z materials for impurity diagnostics are important due to its possible use as a plasma facing component in the next generation fusion device. For this purposemolybdenum and tungsten are injected by an impurity pellet injector into the LHD plasmas.Emissions from such highly ionized elements mostly fall in the Extreme Ultra Violet (EUV) and soft X-ray ranges. The EUV spectra in a range of 50-500Å are recorded using a flat-field EUVspectrometer. The observed emissions are identified with the help of its temporal evolution anddetailed analysis is done with electron temperature profiles. At high central electron temperature(~2keV) molybdenum appears as an Al-, Mg- and Na-like ionization stages. Typical examples ofidentified transitions are MoXXXI 190.46Å (3s2 1S – 3s3p 3P) and MoXXXII 176.63Å (3s 2S –3p 2P). For tungsten, on the other hand, individual lines appear along with a strong quasicontinuum structure around 50-70Å. These transitions have been identified and compared withprevious studies and also with calculated values.

P6-22
Fast XUV 16×16 array hybrid module for plasma imaging applications
A.G. Alekseyev, A.M. Belov, V.V. Zabrodsky1), V.L. Sukhanov1) and B.J. Peterson2)
TRINITI Troitsk, Moscow reg. 142190 Russia 1)Ioffe Physico-Technical Institute, 26 Polytekhnicheskaya, St.Petersburg, 194021 Russia
2)National Institute for Fusion Science, Toki, 509-5292, Japan
AXUV detectors manufactured by IRD Inc. (USA) are quite popular in plasma research owing tohigh sensitivity, fast response and almost flat spectral curve in 30…5000 eV photon energy range[1]. Unfortunately, the company does not produce matrix arrays required for imaging applications.The main goal of the present work is the development of a multiple-scaling matrix approach withthe use of similar XUV Si photodiodes (SPD diodes). Basic 16×16 hybrid module is comprised of eight stacked sub-modules of 2×16 linear SPD diodearrays combined with a circuit board with a 32-channel preamplifier and four 8-channel fast multiplexers. The array front size is 31×31 mm with a filling factor of 25% (single element size is1.22×0.88 mm). The module length is 65 mm. The module has a “zero-edge” design providing an option of stacking into the larger arrays, ifnecessary. For preliminary testing it is packed into a pinhole camera of 38×38×155 mm size withvariable field-of-view and 50-pin output connector. The data acquisition system (DAS) is comprised of eight 4-channel synchronous 12-bit ADCmodules with 40 MS/s upper sampling rate, thus providing less than 1 μs total frame time of thearray module. Each channel has a 64 MB on-board memory limiting the duration of the acquiredperiod to 0.8 s at the maximum sampling rate. Common Ethernet 10/100 Base TCP/IP protocol isused for data transmission into the main PC operating as a DAS control console, data preview andstorage computer. Preliminary testing results and application to plasma diagnostics are discussed.
References
[1] A.Alekseyev, G.Perov, A.Kurnosov, et al. Plasma Devices and Operations, 7 (1999), 139.

P6-23
Comparison of Three Types of Impurity Diagnostics on Reheat Mode Discharges in the Compact Helical System
C. Suzuki, T. Akiyama, A. Fujisawa, K. Ida, M. Isobe, K. Matsuoka, T. Minami, K. Nagaoka, S. Nishimura, S. Okamura, B. J. Peterson, A. Shimizu, C. Takahashi, K. Toi, Y. Yoshimura
National Institute for Fusion Science, Toki, Gifu 509-5292, Japan
Three different types of impurity diagnostics have been equipped in the Compact Helical System (CHS), a medium-size helical device. A single channel pyroelectric detector is used for routine monitoring of total radiation power from the plasma as a conventional bolometer. In addition, we have employed unfiltered absolute extreme ultraviolet (AXUV) photodiode arrays as a simple and low-cost diagnostic to measure spatial and temporal variations of radiation emissivity within a horizontally elongated cross section [1]. On the other hand, we have utilized a flat field grazing incidence spectrometer for the survey of vacuum ultraviolet (VUV) spectra in the wavelength range of 10-110 nm at a spectral resolution of 0.3 nm [2]. The viewline of the spectrometer is fixed at a line passing through the plasma center. An improvement of the stored energy has been observed temporally after the termination of the intense gas puffing in high density CHS plasmas, which is called reheat mode [3,4]. Characteristic features of the impurity diagnostic signals are observed in the reheat mode discharges. After entering the reheat mode, total radiation power measured by the pyroelectric detector significantly reduces, whereas the AXUV photodiode signals increase especially for the center viewing chord. One possible reason for this opposite behavior is the reduction of the sensitivity of the AXUV photodiode in the VUV region, especially for longer wavelength side. In order to assess this assumption, temporal evolutions of the VUV spectra were measured in a reheat mode discharge at 10 ms intervals. As a result, the emissions from highly charged metallic ions in the shorter wavelength region largely increase in the reheat mode, while the emissions from relatively low charged oxygen ions in the longer wavelength region decrease conversely. These observations implies that the metallic impurities accumulate in the plasma core, and that the opposite behavior between the two bolometric detectors could be attributed to the difference in the spectral sensitivity in the VUV region.
References
[1]C. Suzuki, B. J. Peterson, and K. Ida, Rev. Sci. Instrm., 75 (2004) 4124 [2]C. Suzuki et al., J. Plasma Fusion Res. SERIES, 7 (2006) 73 [3]S. Morita et al., Proc. 14th Int. Conf. Plasma Physics and Controlled Nuclear Fusion Research 1992, Würzburg, Vol. 2, p. 515, IAEA (1993) [4]M. Isobe et al., Fusion Sci. Technol., 50 (2006) 229

P6-24
Improvement of AXUV bolometric measurement system at a semi-tangential cross-section in LHD
N. Tamura, Y. Liu, B. J. Peterson, C. Suzuki, S. Sudo and LHD Experimental Group
National Institute for Fusion Science, Toki, Gifu 509-5292, Japan
The space- and time-resolved study of the dynamic behavior of plasma radiation in magnetically confined plasmas is still important to acquire a better understanding heat and particle transport in those plasmas. In the Large Helical Device (LHD), two Absolute eXtreme UltraViolet photoDiode (AXUVD) arrays (20 channels + 20 channels) have been installed at a semi-tangential cross-section in LHD [1] to obtain a two-dimensional image of the plasma radiation with the aid of some tomographic algorithms, such as Tikhonov-Phillips regularization. The reconstruction of the 2D tomographic image from the data of two-AXUVD arrays successfully shows a highly localized radiation pattern in the semi-tangential cross-section when a strong gas puffing or a pellet injection has been implemented [2]. In order to improve the accuracy of the reconstructed 2D tomographic image, the applying algorithms are being improved continuously, which brings better results [3]. To ensure the improvement of the 2D tomographic image, from the 10th experimental campaign of LHD, the new AXUVD array will be available at the same semi-tangential cross-section. The signal conditioning system and the data acquisition system for this AXUVD array are also upgraded. In the conference, the detail of the newly installed AXUVD array at the semi-tangential cross-section and the initial data obtained by the three-AXUVD arrays will be presented.
References
[1] B. J. Peterson et al., Plasma Phys. Controlled Fusion 45 (2003) 1167. [2] Y. Liu et al., Rev. Sci. Instrum. 74 (2003) 2312 [3] Y. Liu et al., Rev. Sci. Instrum. (to be published)
This work is supported by a budgetary Grant-in-Aid No.NIFS05ULHH524 of the National Institute for Fusion Science.

P6-25
Spectroscopic Study of Plasma Flow Generated by Magnetoplasma Compessor with Transparent Electrodes
J.Puric, I.P. Dojcinovic, M.M. Kuraica
Faculty of Physics University of Belgrade, POB 368, 11000 Belgrade, Serbia Center for Science and Technology Development, Obilicev venac 26, 11000 Belgrade, Serbia
A magnetoplasma compressor (MPC) with a semi-transparent electrode system operating in the ion current transfer regime has been constructed and studied. The electric and thermodynamic parameters of the discharge and plasma flow created in different gases have been measured in order to optimize the working conditions within a large pressure range (from 200 to 3000 Pa) and the energy input up to 20 kJ. A special construction of an accelerator electrode system shielded by the self-magnetic field results in protection from erosion which is the main cause of the high current cut-off in conventional plasma accelerators [1]. The electron temperatures and densities were measured by using time and space resolved spectroscopy methods. The plasma flow velocity was measured by using the high speed camera. The compression plasma flow (CPF) parameters predominantly depend on the energy conversion rate from the energy supply to the plasma since the current cut-off is avoided. The maximum energy conversion rate in MPC was while operating in hydrogen (up to 70%) [2]. The experiment with MPC described in this paper is a part of our research program of construction of a two stage quasi-stationary high current plasma accelerator (QHPA) with energy input up to 1 MJ. A combination of five MPC units (input energy up to 16 kJ each) has to be used to produce fully ionized plasma at the entrance of the acceleration channel of QHPA. It was found that when QHPA is operating with the energy input of 200 kJ, the electron temperature, density and plasma flow velocity were 15 eV, 1018 cm-3 and 300 km/s, respectively, within the zone of maximal compression within the plasma flow [3]. Of special interest are applications in the plasma fusion. A specially designed plasma accelerator system was proposed as a possible plasma injector in fusion devices [2 and references there in] and magnetic traps. Another application of MPC and QHPA is in treatments of solid targets by powerful plasma flows used in simulation studies of processes which may occur at the first wall and divertor plates of plasma fusion devices.
References
[1] A.I. Morozov, Sov. J. Plasma Phys., 16 (1990) 69 (Engl. Transl.) [2] J. Puric, I.P. Dojcinovic, V.M. Astashynski, M.M. Kuraica and B.M. Obradovic, Plasma Sources Sci. Technol., 13 (2004) 74 [3] S.I. Ananin, V.M. Astashinskii, G.I. Bakanovich et al., Sov. J. Plasma Phys., 16 (1990) 102
P6-26
Application of a soft-X ray imaging system to the STE-2 RFP
T.Onchi, A.Sanpei, R.Ikezoe, H.Himura, S.Masamune
Kyoto Institute of Technology, Matsugasaki, Kyoto 606-8585, Japan
A soft-X ray (SXR) imaging system, under development in our laboratory, has been installed inthe STE-2 RFP[1,2] to obtain high-resolution two-dimensional (2-D) SXR images under various RFP discharge conditions. The purpose of the present experiment is to see if 3-D magnetic structures can be deduced from the 2-D SXR image. The imaging system consists of a slit with a pinhole of 1 mm diameter, a microchannel plate(MCP) and a phosphor plate, both of them 20 mm in diameter, and an image intensifier CCD camera with 512x512 pixels. The plasma was viewed through a horizontal port from outer side in the major radial direction with viewing area of 10 cm diameter at the plasma center. The STE-2 is a small RFP with aspect ratio of 4 (R/a=0.4m/0.1m). In typical RFP configuration,the safety factor is about 0.15 on axis, decreasing towards the edge to about -0.05. Thus the dominant toroidal mode numbers n of the m=1 magnetic fluctuation are in the range from 7-10. The SXR images were obtained in these standard RFP plasmas. In STE-2 RFP, internally resonant rotating helical field (RHF) was applied to study effective means for the control of MHD dynamics. The SXR imaging diagnostics were performed also in the RHF experiments together with magnetic diagnostics for MHD dynamics studies. We have identified characteristic structures in the 2-D SXR images obtained with the presentsystem. The observed structure appeared to show dependence on the RFP discharge conditions. Optimization of the image data processing such as noise filtering from the data or tone correction of brightness distribution is in progress to realize effective visualization of the deduced 3-D magnetic structure. Detailed analysis of the structures in the SXR images has also been carried out together with analysis of magnetic fluctuation data.
References
[1] S. Masamune et al., Proc. 18th IAEA Fusion Energy Conf., IAEA/F1-CN-77/EXP3/11 (2001). [2] S. Masamune and M. Iida, J. Plasma and Fusion Research Ser., Vol.5, 509 (2003).

P6-27
Development of a soft-X ray imaging system for MHD studies in an RFP plasma
A.Sanpei, T.Onchi, R.Ikezoe, S.Masamune, H.Himura
Kyoto Institute of Technology, Kyoto 606-8585, Japan
The measurement of Bremsstrahlung soft-x ray (SXR) radiation is a very useful means for diagnosing high-temperature plasmas without material insertion. Since the contours of SXR emissivity usually correspond to magnetic surfaces in a toroidal plasma for fusion research, SXR computer tomography (SXR-CT) technique has been used widely with great success in the studies of magnetic structures inside the plasma. However, one of the drawbacks of this technique is that it requires multiple CT systems in obtaining three-dimensional (3D) structures. In the reversed field pinch (RFP), studies on the behavior of magnetic islands due to the tearing modes are quite important in understanding confinement. Since the safety factor q <<1 in the RFP, toroidal pitch of the equilibrium field is relatively short, and therefore, the SXR diagnostic system which can provide 3D magnetic structures with relatively simple components is desirable. We are developing a SXR imaging system in which a pinhole camera provides a high-resolution two-dimensional (2D) luminosity distribution on a phosphor plate through a microchannel plate (MCP). The 2D image on the phosphor plate is measured with a high-speed image intensifier charged coupled device (ICCD) camera. We have modeled SXR emission profiles and magnetic island structures for the optical system simulation in order to specify the necessary parameters for the observation of the magnetic island structures on the SXR image. In particular, the sensitivity of the SXR images to the change in aspect ratio from 4 to 2 is of our major interest with a view to installing the system in our low-aspect ratio RFP experiment. Since the location of magnetic island is an indication of the rational surface of the corresponding mode, the results may also be used as one of the constraints for the equilibrium reconstruction.
References
[1] S. Masamune and M. Iida, J. Plasma and Fusion Research Ser., Vol.5, 509 (2003).
P6-28
Soft X-ray measurement in IRE on the TST-2 tokamak
K.Sasaki, K.Hanada1), K.N.Sato1), H.Zushi1), K.Nakamura1), M.Sakamoto1), H.Idei1), M.Hasegawa1), S.Kawasaki1), T.Nakashima1), A.Higashijima1), Y.Takase2),
A.Ejiri2), S.Shiraiwa2), H. Kasahara2), T.Yamada3) and N.Nishino4)
Graduate School of Engineering Sciences, Kyushu Univ., Kasuga 816-8580, Japan 1) Research Institute for Applied Mechanics, Kyushu Univ., Kasuga 816-8580, Japan
2) Graduate School of Frontier Sciences, Univ. Tokyo, Kashiwa 277-8561, Japan 3) Graduate School of Science, Univ. Tokyo, Tokyo 113-0033, Japan
4) Graduate School of Engineering, Hiroshima Univ., Higashi-Hiroshima, 739-8527, Japan
Spherical tokamak (ST) having aspect ratio A≤1.5 have been investigated as cost effectivealternative to the tokamak fusion concept [1]. ST plasmas have some characteristic features, theavoidance of a characteristic relaxation phenomenon in ST, that is Internal Reconnection Event(IRE) [2], is one of the crucial issues to execute the stable operation. When IRE takes places, thelarge amount of magnetic energy stored in plasmas is converted to the kinetic energy of plasmasby magnetic reconnection process and then the stored thermal energy and particles in the coreregion is lost abruptly. To investigate the deformation of the plasma shape during IRE, four PINdiode arrays of 20 channels (detected region 200eV~30keV) were installed on the TST-2@K(TST-2 at Kyushu University: major radius R=0.4m, minor radius a=0.25m, aspect ratio A~1.6,toroidal field Bt=0.2T and plasma parameters are plasma current Ip~130kA, electron density ne~1019m-3 and elongation κ~1.8 [3]). In this experiment, there is feature that n and m can bedetermined by measurement only Soft X-ray (SXR). Precursor of IRE was observed for severalmilli-seconds. The fluctuation was composed of two dominant components in frequency of 10kHzand 4kHz. The mode structure of 10kHz component is n/m=1/1 structure (n/m=1/1 and n/m=2/2,where n, m represent toroidal and poloidal mode number, respectively) and 4kHz is n/m= 3/4.There is no change of frequency until precursor begins to take place and it results in IRE, butamplitude increases. The overlap of modes (10kHz and 4kHz) was considered to be cause of IREin TST-2 from the position and the growth of the modes.
References
[1] Peng Y.-K.M., Strickler, D.J., Nucl Fusion 26 (1986) 769. [2] Sykes A. et al Nucl. Fusion 32 (1992) 694 [3] Takase Y., Ejiri A. et al Nucl. Fusion 41 (2001) 1543

P6-29
Soft X-ray emission profile and mode structure during MHD events in the TST-2 spherical tokamak
H.Tojo, A.Ejiri, Y.Takase, Y.Torii, Y.Adachi, T.Osako, M.Sasaki1), T.Masuda, Y.Shimada N.Sumitomo1), J.Tsujimura, H.Nuga1), S.Kainaga1), J.Sugiyama
Graduate School of Frontier Sciences, The University of Tokyo, Kashiwa 277-8561, Japan 1)Graduate School of Science, The University of Tokyo, Tokyo, 113-0033, Japan
In spherical tokamaks (ST), reconnection events (RE) are known to cause energy and particlelosses. [1] Such events are studied on TST-2. A 20-channel PIN-diode array is used to measure thesoft X-ray radiation profile during RE. With a 7μm beryllium (Be) filter, photons with lowerenergies (< 1 keV) are rejected. The diode array forms a pin-hole camera, and a cylindricallycurved Be foil is placed just in front of the pin-hole. This arrangement ensures that incomingphotons pass through the same thickness for every channel. The sightlines are tangential (toroidal)and cover the whole range of radius occupied by the plasma on the equatorial plane. Prior to RE,fluctuations around a frequency of 10 kHz were observed, especially without the Be filter. Inmany cases the emission intensities increased, and the fluctuations grew with a time constant ofabout 0.4ms. At the end of fluctuation growth, the energy loss from the central region towards theperiphery of the plasma started around r/a∼0.2. This is believed to be where reconnection started.In order to understand the origin of this instability the spatial gradient of the SX brightness profileis compared with non-RE discharges. When dI/dr>0.03, where I and r are SX brightness and tangency radius of the sightline, respectively, RE tends to occur against various plasma current (Ip). It was also found that dI/dr was positively correlated with ΔIp/Ip, where ΔIp is the change ofIp at an RE. With the Be filter the SX emission increased before magnetic fluctuations started togrow. However, so far, fluctuations have not been observed in the SX emission, presumablybecause of the low electron temperature and the resultant low emission intensity. The iontemperature (CⅢ), however, increased by up to ΔTi/Ti∼1.3, where ΔTi is the change of the ion temperatures at an RE. This is consistent with other experiments on magnetic reconnection. [2] To survey the behavior of the spatial and temporal structures (i.e., mode structure), analysis using the singular value decomposition method is being carried out. During the growth phase of fluctuations, both symmetric (even) and antisymmetric (odd) modes were identified.
References
[1] N. Mizuguchi et al., Physics of Plasmas 7 (2000) 940 [2] A. Ejiri et al., Nuclear Fusion 43 (2003) 547
P6-30
Soft and Ultra-Soft X-ray Detector Array Systems for Measurement of Edge MHD Modes in the Large Helical Device
F. Watanabe1), K. Toi, S. Ohdachi, C. Suzuki, S. Sakakibara, K.Y. Watanabe, S. Morita, K. Narihara, K. Tanaka and LHD Experimental Group
National Institute for Fusion Science, Toki 509-5292, Japan 1)Department of Energy Engineering and Science, Nagoya University, Nagoya 464-8603, Japan
Soft X-ray (SX) detector array is widely used in various toroidal plasmas to measure MHD fluctuations. In the Large Helical Device (LHD), several 20-channel SX-detector arrays are used to observe SX fluctuations related to MHD instabilities. Control of edge MHD modes driven by pressure gradient is crucial for generating high performance plasma in LHD. For this purpose, it is important to clarify an internal structure of edge MHD mode in high beta plasmas which are produced at low toroidal field. However, usual SX detector is not necessarily suitable for monitoring plasma edge, because edge plasma is in relatively low temperature and low density and SX emission is fairly weak. Recently, three sets of 20-channel absolute extreme ultraviolet(AXUV) detector arrays have been installed inside the vacuum vessel in the vertically elongated section of the LHD to monitor fluctuations of AXUV emissions emitted from edge plasma region. The AXUV detector array has almost constant and high sensitivity in the energy range (>25eV) from VUV to SX. Moreover, the sensitivity is rapidly decreased in longer wavelength range from VUV range (< 25eV). However, it should be noted that the detector also has high sensitivity in visible light range (1.6-3.1eV). In high beta plasmas of LHD, the AXUV detector arrays were successfully applied to detect the fluctuations related to edge MHD modes, supplementing the role of SX detector array. The low frequency fluctuations detected by these detectors have high coherence with the magnetic fluctuations of the edge MHD mode. In particular, the AXUV detector array often detects the fluctuations of edge MHD modes even in the case that the SX detector array does not detect them.
P6-31
Runaway Electrons as a Diagnostic of Plasma Internal Magnetic Fluctuations
Y.ZHENG, X.DING, W.LEE
Southwestern Institute of Physics, Chengdu 610041 China
The edge turbulence is well characterized; it can explain the fluctuation driven particle flux, butcannot well accounts for the energy fluxes.In the plasma interior, measurements of densityfluctuations suggest that electrostatic fluctuation driven transport cannot account for the observedfluxes,which makes the measurement of magnetic fluctuation important for a description ofplasma confinement.There is still insufficient experimental data available to assess the importanceof magnetic fluctuation for internal transport. In plasmas the measured magnetic fluctuation is toosmall to contribute to the thermal losses, but can explain the runaway electron transport.Thedifficulties in extending magnetic probe measurements into plasma precludes a study of themagnetic fluctuation levels in the plasma interior.In this study, we demonstrate the use of steadystate approach and perturbation techniques to measure the diffusion of runaway electrons as aprobe of internal magnetic fluctuation in plasma. Comparatively the transport of runawayelectrons in plasma can be easily measured using a steady state approach for the runawayconfinement time τr that is deduced from hard x-ray (HXR) bremsstrahlung spectra, and using theperturbation techniques for τr that can be deduced from simultaneously recorded sawtoothoscillations of HXR flux, soft x ray(SXR)intensity and λ=3cm microwave radiation intensity(WUW), which provide local runaway electron diffusion coefficient Dr.Assuming that magnetic turbulence is responsible for the runaway electron transport, the diffusion coefficient can be interpreted in terms of a magnetic fluctuation level.We find that the runway electron diffusion coefficient is determined by internal magnetic fluctuations rather than electrostatic fluctuations because of the high energy involved. Runaway electron behavior can be used as a probe for internal magnetic fluctuations. The value of internal magnetic fluctuationsis dependent on toroidal magnetic field. A profile of the magnetic fluctuation level in HL-2A plasma can be estimated from Dr.We can confirm that magnetic fluctuations increase from the centre to the edge.The results presented here demonstrate the effectiveness of using runaway transport techniques and steady state approach for determining internal magnetic fluctuations.
References
[1] Mara J.R. and Catto P.J. 1992 Phys. Fluids B 4 176 [2] Connor J. W. and Hastie R.J., 1975 Nucl. Fusion 15 415
P6-32
The Investigation of Major Disruption Based on Plasma Current Beat-wave Excitation in IR-T1 Tokamak
M. Rezvani Jalal, M. Ghoranneviss, F. M. Aghamir & B. Malekyneia
Plasma Physics Research Center, Islamic Azad University, Tehran, Iran
The major disruption phenomenon can be seen in small Tokamak (IR-T1) shots and can cause unwanted shutdown of plasma and it can clearly be seen in the abrupt vanishing of plasma current.By means of a magnetic and a soft x-ray diagnostics it was seen that in the very short interval of disruption the temporal current beat-wave in plasma current was excited. This beat-wave can be related to the standing TE resonant modes of Tokamak cavity (Torus). In the present paper it is shown that the excited current beat-wave is really originated from superposition of torus resonant modes and when this current beat-wave is modulated on plasma main current it can produce stimulated radiation and finally cool the plasma and shot it down. The stimulated radiation is also investigated and it was shown that the main part of this radiation is in microwave region. Details and results will be discussed in full paper.
P6-33
Development of a High Resolution X-Ray Imaging Crystal Spectrometer for Measurement of Ion-Temperature and Rotation-Velocity Profiles in Fusion Energy Research Plasmas*
K.W. Hill, M.L. Bitter, S.D. Scott1),A. Ince-Cushman, J.E. Rice2),S.G. Lee3),C. Broennimann, E.F. Eikenberry4)
1)Princeton University Plasma Physics Laboratory, Princeton, NJ USA; 2)Plasma Science & Fusion Center, MIT, Cambridge, MA USA; 3)NFRC, Korea Basic Science Institute, Daejeon,
Korea; 4)SLS Paul Scherrer Institut, Villigen, Switzerland
A new high resolution imaging x-ray crystal spectrometer (XICS) has been developed for Doppler measurement of radial profiles of ion temperature, Ti, and toroidal rotation velocity, vφ, inplasmas. The XICS consists of a single spherically bent crystal and a two-dimensional positionsensitive x-ray detector, and provides x-ray spectra from highly charged ions from multiplesightlines through the plasma. The proof of principle of the XICS was demonstrated bymeasurement of Ar XVII Kα spectral images from ± 8 cm of the plasma height in the AlcatorC-Mod tokamak at MIT in 2003 [1] and ± 40 cm in NSTX at Princeton. However, the timeresolution was limited to values >100 ms by the ~ 400 kHz count-rate limit of the available 2Ddetector. A new silicon pixel array detector, the PILATUS II, [2] with a count-rate capability of 1MHz PER PIXEL and readout time of 2.54 ms, has been tested on C-Mod by recording spectra ofAr XVII at 3.1 keV. Based on these favorable results, an XICS is now being designed to measurefull radial profiles of Ti and vφ on C-Mod. The PILATUS II detector should enable Ti and vφprofile measurements with the required spatial and temporal resolutions of 10 mm and 10 ms, respectively, and measurement of vφ values as small as 1 km/s. The XICS concept has also been adopted for the International Tokamak, ITER, [3] and may be crucial for ITER, due to problems with other techniques. [4] An overview of important atomic data from tokamak x-ray crystalspectrometry, results of the PILATUS II tests, and progress on designs of the XICS systems for C-Mod and ITER will be presented.
References
[1] M. Bitter et al. Rev. Sci. Instrum. 75, 3660 (2004); [2] Ch. Broennimann et al., J. Synchrotron Radiation, 13, 120 (2006). [3] R. Barnsley et al., Rev. Sci. Instrum. 75, 3743 (2004); [4] M. Bitter et al., Phys. Rev. Lett. 91, 265001-1 (2003)
*Research supported by U.S. DOE contract DE-AC02-76-CH03073 and Grant No. 1083

P6-34
Measurements of iron Kα lines using a wide band and compact X-ray crystal spectrometerin LHD
I. Sakurai, Y. Tawara, C. Matsumoto, A. Furuzawa1), S. Morita & M. Goto2)
1) EcoTopia Science Institute, Nagoya University, Nagoya 464-8603, Aichi, Japan 2) National Institute for Fusion Science, Toki 509-5292, Gifu, Japan
X-ray spectra of Fe Kα transition array in high temperature plasmas have been obtained on theLarge Helical Device (LHD) using a wide band and compact X-ray spectrometer. Thespectrometer consists of a Johan-type LiF(220) (Lithium Fluoride: 2d=2.848Å) crystal with acurvature of 430mm and a back-illuminated CCD detector (Andor model DO420-BN) with a sizeof 26.6x6.7mm2. A wide energy range of 6.4-7.0keV can be observed with high brightness andhigh temporal resolution, which enable us the measurement of Kα transitions from all chargestates of Fe ions. An energy resolution of the spectrometer has been evaluated using the He-like FeKα resonance line from LHD plasmas and estimated to be 10eV at 6.4keV as a value of FWHM. Time-developed Kα spectra have been measured with a time interval of 10ms in the full binningmode of CCD in order to analyze the impurity transport at the central column of LHD plasmas. Itis seen that the dominant charge state of Fe irons at the plasma center distributes between FeXXIII(Be-like) and FeXXV (He-like) mainly according to the central electron temperature. The impuritycharge distribution is, however, significantly affected by the radial transport of Fe ions. A carbonpellet (0.9mmΦ×0.9mmL) coated by iron with a thickness of 13μm is injected using an impuritypellet injector to confirm the brightness of Fe Kα lines and to test the signal response. The pelletwith a speed of 200m/s is ablated at least within a half radius of the LHD plasma. We could see asmall time delay between the rapid rise of the x-ray signals and the pellet injection. This delaymeans the ionization time needed for developing charge states of the injected iron in addition tothe ablation time of the pellet. We report the results on Fe Kα x-ray line measurement in LHDusing the wide band and compact X-ray crystal spectrometer.
P6-35
Transport study of medium-Z impurities by means of X-ray Pulse-Height Analyzer in LHD
S.Muto, S.Morita and LHD Experimental Group
National Institute for Fusion Science, Toki, Gifu, 509-5292, Japan
Associated with the spectroscopic studies of high temperature plasmas, spatial resolution is ofgreat importance with time resolution. A spatial- and time-resolved spectrum in x-ray region is required to obtain significant information from the core plasma concerning the profile of electron temperature and the emission profile of impurities. An assembly of X-Ray Pulse Height Analyzer (PHA) has been designed and constructed toinvestigate the profiles of x-ray continuum and x-ray line spectra in Large Helical Device (LHD). The assembly is equipped with a scanning system which makes it possible to estimate the radial profile of the x-ray spectrum. With the system the sight line of the PHA is scanned along the radial direction of LHD plasma. Then, the line integrated spectrum can be inverted to a radial profile using Abel inversion technique. The radial profile of the x-ray spectrum has been successfully obtained with a spatial resolution ofa few centimeters using the assembly. The radial profiles of Kα lines emitted from Ar, Ti, Cr and Fe have been also obtained. Especially, Ar Kα profiles have been measured in detail with a time resolution better than 20 ms during several identical discharges by scanning The spatial profile of x-ray line spectrum mainly reflects the core transport of impurity. Thephase-shift profile of Ar has been successfully obtained in the present study. As the quantitative study of particle transport, the radial profiles of a diffusion coefficient and a convective velocity are individually analyzed from the time-dependent phase-shift profile. In this paper the radial profiles of diffusion coefficient and convective velocity of the medium-Z impurities are reported with the experimental results obtained with the assembly in LHD.
P6-36
Development of advanced X-ray Imaging Crystal Spectrometer utilizing a large-area proportional count for KSTAR
S. G. Lee, J. G. Bak1), U. W. Nam2), M. K. Moon, J. K. Chen3)
1) National Fusion Research Center, Yusung, Taejeon 305-333, Korea 2) Korea Astronomy & Space Science Institute, Yusung, Taejeon 305-333, Korea
3) Korea Atomic Energy Research Institute, Yusung, Taejeon 305-333, Korea
An advanced X-ray imaging crystal spectrometer for the KSTAR tokamak has been developed by using a proportional count. The spectrometer consists of a single spherically bent crystal and a 10 cm x 30 cm two dimensional (2D) segmented position-sensitive multi-wire proportional counter. The X-ray imaging crystal spectrometer provides spatially and temporally resolved spectra of the resonance line of helium-like argon (Ar XVII) and the associated satellites from multiple lines of sight parallel and perpendicular to the horizontal mid-plane for measurements of the profiles of the ion and electron temperatures, toroidal rotation velocity, impurity charge-state distributions, and ionization equilibrium. The segmented 2D detector with delay-line readout and supporting electronics has been utilized to improve the count-rate capability. The current fabrication status of the X-ray imaging crystal spectrometers and the initial performance test results of the segmented 2D detector will be presented.
This work is supported by the Korea ministry of science and technology.

P6-37
Investigation of a novel X-ray tube for the calibration of the X-ray crystal spectrometer in the KSTAR machine
J. G. Bak, S. G. Lee
National Fusion Research Center, Yuseong-gu, Daejeon 305-333, Korea
A novel X-ray tube with a line filament has been developed for the in-situ calibration of the X-ray crystal spectrometer (XCS) in the KSTAR machine. The characteristics of the X-ray tube are investigated from the X-ray images of the anode obtained using a pinhole and a CCD detector. It is found that the X-ray emitting area on the anode is a slightly curved line perpendicular to the filament. The orientation and the width of the anode image are changed with the polarity of the filament current and the different anode geometry, respectively. This work may lead to the development of a novel X-ray tube with a line focus, which is required for the calibration of the XCS. Experimental results from the investigation of the X-ray tube will be presented and the technical issues on a design of the in-situ calibration system using the X-ray tube for the KSTAR XCS will be discussed.
This work is supported by the Korean ministry of science and technology under KSTAR project contract.

P6-38
A hard x-ray tomography system for the MST Reversed Field Pinch
R. O'Connell, A. Almagri, D. Clayton.
University of Wisconsin -- Madison
A CdZnTe 16 channel hard x-ray camera, with excellent sensitivity to photons in the energy range 10-200 keV, has been tested on MST. The camera extends work using individual detectors which have been used to determine the energy dependence of the fast-electron radial diffusion[1]. These detectors are immune from vibration noise and are unaffected by electromagnetic noise from rf sources. Photon counting is performed in software after each plasma discharge which allows for dynamic energy binning and excellent noise/pile-up detection. Absolute calibration of these detectors is made using the 59 keV line from Am241 source. Hard x-ray flux generated during 60 kW of launched LH wave into MST plasma is measured and shows an increase in the hard x-ray intensity in the range of 10-50 kev. Three of these detectors will be configured to form a hard x-ray tomography system. Such a system will be capable of resolving x-ray intensity in space, time and energy. The measured hard x-ray energy spectrum is used as an input to the Fokker-Planck CQL3D code to calculate the energetic particle diffusion as a function of plasma radius. This tomographic system will be placed near the LH and EBW antennas to look for signatures of energetic electrons generation and their radial diffusion. Hard x-ray contours at multiple energy ranges, and comparison with soft x-ray as well as magnetic surfaces will be presented.
References
[1] Observation of Velocity-Independent Electron Transport in the Reversed Field Pinch, O'Connell et al., PRL 91, 4, 045002-1 (2003).
This work is funded by the US DOE.

P6-39
Current profile estimation in full LHCD plasmas using Hard X-ray measurement along the top and bottom identical line of sight on TRIAM-1M
K. Hanada1), K. Sasaki2), M.Hasegawa1), H. Idei1), H.Zushi1), K. Nakamura1), M. Sakamoto1), K.N. Sato1), S.Kawasaki1), H.Nakashima1), A.Higashijima1) and TRIAM group
1)RIAM, Kyushu University, Kasuga Fukuoka, 816-8580, Japan. 2)Interdisciplinary Graduate School of Engineering Science Kyushu Univ.,Fukuoka, Japan.
Current profile control is a key to obtain high performance plasmas including internal transport barrier (ITB) in tokamaks. It is quite important to measure current profile in real time in order to control it. The most popular way to measure current profile has been developed by using MSE (Motional Stark Effect). High power NBI (Neutral Beam Injection) and sophisticate detection of polarized light emitted from the atomic process are required to execute the way. Especially the high power NBI is crucial for the measurement. Recently an ITB is observed in full non-inductive lower hybrid current drive (LHCD) on TRIAM-1M. As the current profile measurement is required to understand the physical mechanism of ITB, the current profile measurement in LHCD plasma is strongly required. The current profile estimation by using HXR measurement along the top and bottom identical line of sight is proposed. As the plasma current in full LHCD plasmas is driven by the asymmetry of energetic electron distribution function, the HXR radiation along the line of sight from top is distinct from that from the bottom by the difference of the magnetic pitch angle induced by plasma current. Thus we can be estimated the magnetic pitch angle by using the HXR measurement. The observations are executed in LHCD plasma at R-R0= 12.5cm on TRIAM-1M, where R0 shows the position of centre of the plasma. Two NaI scintillators are used for the measurement along the top and bottom identical line of sight. Each one was fixed on the radially movable support. During full LHCD discharge, the clear difference of the HXR radiation spectrum was not obtained. In the case of LHCD during ohmic heating, the difference can be observed. This suggests that the current profile around the plasma centre in the full LHCD plasma is broader than that in the OH+LHCD plasma. The difference was compared with the calculation using assumed distribution function and the current density around the plasma center in the OH+LHCD plasma was estimated.
P9-01
Measurement on spatial distribution of visible line spectra in LHD
H.Yamazaki, S.Morita1), M.Goto1) and LHD experimental group
Department of Fusion Science, Graduate University for Advanced Studies, Toki 509-5292, Japan 1)National Institute for Fusion Science, Toki 509-5292, Japan
Spatial distributions of visible line spectra have been measured in LHD using a 50cm visible spectrometer with 26 vertical sightlines, which include emissions from inboard and outboard x-points and ergodic layer. The emissions mainly consist of hydrogen, helium and carbon. Thevertical profile of visible line spectra changes with a variation of magnetic configuration, electron density and direction of NBI. In most of the cases, however, the profile has a strong peak at asightline viewing the vicinity of the inboard side x-point. A variety of the vertical profile isreported with the diagnostic instrument on the visible line spatial distribution.
References
[1]S.Morita, M.Goto, S.Muto, H.Nozato, Proceedings of 13th International Stellarator workshop, Canberra, Australia,(2002)PIIA/13

P9-02
Spatial variation of the foil parameters from in situ calibration of the JT-60U imaging bolometer foil
H. Parchamy1), B. J. Peterson1), S. Konoshima2), N. Ashikawa1), H. Hayashi1), D. C. Seo3), and the JT-60U team2)
1)National Institute for Fusion Science, Toki-shi, Gifu-Ken, 509-5292, Japan 2)Japan Atomic Energy Agency, Naka-shi, Ibaraki-Ken, 311-0193, Japan 3)National Fusion Research Center, Yuseong, Daejeon 305-806, Korea
We obtain the local foil properties of the JT-60U imaging bolometer foil [1,2] (a single graphite-coated gold foil with an effective area of 9 × 7 cm2 and a nominal thickness of 2.5 µm) such as the thermal diffusivity, к, and the product of the thermal conductivity, k, and the thickness, tf, of the foil by the foil calibration [3]. Calibration of the foil was made in situ using a He-Ne laser (~27 mW) as a known radiation source to heat the foil. The thermal images of the foil are provided by an IR camera (microblometer type). The parameters are determined by finite element modeling of the foil temperature and comparing the solution to the experimental results. In this work we apply this calibration technique to investigate the spatial variation of the foil parameters. Significant variation in the local temperature rise of the foil due to local heating by the laser beam indicates a spatial variation of the foil parameters k and tf . This variation is possibly due to nonuniformity in the carbon coating and/or the thickness of the foil. In a separate work, the spatial calibration data will be used to produce the bolometer intensity data to be utilized in the tomographic analyses.
References
[1] B.J.Peterson, et al., to be published in J. Nucl. Mater (2006). [2] S. Konoshima, et al., 32nd EPS CPPCF, ECA Vol. 29C, P-4.092 (2005). [3] H. Parchamy, B. J. Peterson, et al., Accepted for publication in Rev. Sci. Instrum. (Vol. 77, No. 10, 2006).
P9-03
Tracking and Visualization of Sharp Interfaces in a Three-dimensional Plasma Simulations
C. O. Harahap and H. Miura1)
The Graduate University for Advanced Studies, Toki, Gifu 509-5292, Japan 1)National Institute for Fusion Science, Toki, Gifu 509-5292, Japan
In recent three-dimensional numerical simulations of fluid phenomena, it is often required to track surfaces sharply. For example, tracking an interface between two fluids is essential in studies of two-phase flows, which appear in many physical, biophysical and engineering subjects. An important example of the surface tracking in plasma physics is the plasma-vacuum interface in a magnetic confinement fusion device. A prototype is seen in Ref.[1], in which the rational surfaces are tracked in the nonlinear MHD simulations of LHD. A difficulty in such techniques is to cover the surfaces sharply, acquiring the field information with sufficient numerical resolutions. A naive technique can bring about inappropriate motions of surfaces and intersections of surfaces which should be exclusive to each other. Aiming to apply for a numerical simulation code with sharp surface tracking, we develop a technique based on the adaptive mesh refinement approach in the combination with a molecular dynamics (MD)-like alignments of mesh elements. The MD-like mesh alignments on a surface enables us to keep the numerical resolutions of on a surface to a finite level and makes the data acquisition from the field much easier through various interpolation schemes. When the resolution on a surface is becoming poor, new meshes are generated by the technique of the adaptive mesh refinement. Since behaviors of such surface elements can be highly complicated, the development of the technique is assisted by the use of various three-dimensional visualization. Some techniques to visualize the mesh hierarchies are also developed. In the presentation, we would like to demonstrate surface simulations for mushroom-like structures formed by mutual advection of anti-parallel vortices by the techniques.
References
[1] Miura et al., to appear in Comp. Phys. Comm.

P9-04
Nonstop Lose-less Data Acquisition and Storing Method for Plasma Motion Images
H.Nakanishi, M.Ohsuna, M.Kojima, S.Imazu1), M.Nonomura, H.Okumura2), Y.Nagayama, K.Kawahata
National Institute for Fusion Science, Toki, Gifu 509-5292, Japan 1)Pretech Corp., 1-19-13 Kanayama-cho, Atsuta-ku, Nagoya 456-0002, Japan
2)Mie Univ., 1577 Kurimamachiya-cho, Tsu, Mie 514-8507, Japan
Plasma diagnostic data analysis often requires the original raw data as they are, in other words, atthe same frame rate and resolution of the CCD camera sensor. As a non-interlace VGA cameratypically generates over 70 MB/s video stream, usual frame grabber cards apply the lossycompression encoder, such as mpeg-2 or mpeg-4, to drastically lessen the bit rate. In this study, anew approach, which makes it possible to acquire and store such the wideband video streamwithout any quality reduction, has been successfully achieved. Simultaneously, the real-time videostreaming is even possible at the original frame rate. For minimizing the exclusive access time inevery data storing, it has adopted the directory structure to hold every frame files separately,instead of one long consecutive file. The popular ‘zip’ archive method improves the portability ofdata files, however, the JPEG-LS image compression is applied inside by replacing its intrinsicdeflate/inflate algorithm that has less performances for image data.
References
[1]M. Ohsuna, H. Nakanishi, et al., Fusion Eng. Des., Vol.81, 15-17 (2006) 1753-1757
This study is supported by NIFS under NIFS06ULHH503 and NIFS05KCHH004.

P9-05
Acquisition of Data for Plasma Simulation by Automated Extraction of Terminology from Article Abstracts
L. Pichl, M. Suzuki 1), M. Murata 2), A. Sasaki 3), D. Kato 4) and I. Murakami 4)
International Christian University, Osawa 3-10-2, Mitaka, Tokyo 181-8585, Japan 1) Arkansas Tech University, Russellville, Arkansas 72801, USA
2) National Institute of Information and Communications Technology, 3-5 Hikaridai, Seika-cho, Kyoto 619-0289, Japan
3) Japan Atomic Energy Agency, 8-1 Umemidai, Kizu-cho, Kyoto 619-0215, Japan 4) National Institute for Fusion Science, Oroshi-cho, Toki, Gifu 509-5292, Japan
An accurate description of atomic and molecular processes in fusion edge plasma, hadron therapy of brain tumors, positron emission tomography and in other imaging fields belongs among the key factors determining the ultimate imaging resolution. Here we present a method for automated retrieval of such data from online publisher databases such as the INSPEC collection of article abstracts. In particular, a rule-based algorithm for syntactic and semantic recognition of terminology in atomic and molecular physics [1] is applied to the search of articles relevant to plasma simulation, expanding our previous work on joint search of scientific articles and self-updating databases of cross section data [2,3].
References
[1] M. Murata, T. Kanamaru, H. Isahara, Proceedings of CICLing (2005) 293 [2] M. Suzuki, L. Pichl, I. Murakami, T. Kato, A. Sasaki, Journal of Plasma and Fusion Research SER 7 (2006) 343-347 [3] L. Pichl, M. Suzuki, K. Joe and A. Sasaki, Lecture Notes in Computer Science 3433, 2005, 159-170

P10-01
2D tomographic imaging of the edge turbulence in RFX-mod
G.Serianni1), R.Cavazzana1), M.Agostini1,2), P.Scarin1)
1)Consorzio RFX, Associazione EURATOM-ENEA sulla fusione, corso Stati Uniti 4 35127, Padova
2)Dipartimento di Fisica, Università di Padova, Padova, Italy
In the reversed Field Pinch Experiment RFX-mod a Gas Puffing Imaging Diagnostic (GPID) is used to investigate the turbulence of the edge plasma. The system consists of a gas puffing nozzle and 32 optical channels to measure the HeI (668 nm) line emission. The lines of sight are arranged into three fans intersecting each other in an area normal to the main magnetic field. The diagnostic system provides an analogue bandwidth of 2 MHz and all channels are simultaneously sampled at 10 MSamples/s for the whole discharge duration (350 ms). Different inversion techniques have been applied to the data in order to obtain a 2D tomographic reconstruction of the light emission pattern from the line integrals. Comparison shows that the most suitable method is based on 2D spatial Fourier expansion, applying the Singular Value Decomposition technique with regularisation. The high time resolution allows to obtain a 2D image every 0.1 ms. Emission structures (“blobs”) that move along the ExB flow emerge from the backgroundturbulence and they are characterised by computing energy and phase of the Fourier modes. Acomparison is carried out between the structures identified by this 2D reconstruction and theintermittent events detected in the line-of-sight signals with a method based on the continuouswavelet transform.

P10-02
Tomographic reconstruction of emissivity profile from tangentially viewed images using pixel method
Santanu Banerjee1), Asim Kumar Chattopadhyay1), P. Vasu1)
1)Institute for Plasma Research, Bhat, Near Indira Bridge, Gandhinagar 382428, India
Fast camera systems for imaging tokamak plasmas are being increasingly popular. Edge fluctuations and plasma instabilities can be imaged in the visible and X-ray wavelengths using present technologies.
While viewing the plasma tangentially, the lines of sight (LOS) pass through the plasma tangentially in 3D. Thus each LOS integrates the light through a number of flux surfaces. The present study is to build a reconstruction code for tomographic unfolding in 2D poloidal cross section of these 3D images. Here, pixel method is preferred to the analytical method to reconstruct the 2D image 1. Poloidal cross-sectional area, where the images are to be reconstructed, has been subdivided into pixels. This pixel-grid is essentially the footprints (on a poloidal cross-section) of the micro-tori that run along the torus. Certain assumptions like toroidal symmetry of the plasma, and constant emissivity within one pixel, are taken. Say, the camera is equipped with a n x m pixel (henceforth will be called as detectors) resolution CMOS chip. Each detector sees a number of pixels along its line of sight 2. Thus brightness (f), is given by: Σi,jIijgj=fi or,I×g=f Where, Iij is the fraction of the emission incident on detector i from pixel j and gj is the emissivity of pixel j. Iij is assumed to be proportional to the chord length of the detector i, passing through the pixel j. The I matrix will be populated by using ray tracing techniques which involves an attempt to find the intersection of the LOS of each detector with the micro-tori. Then using predefined emissivity profiles the brightness will be calculated. Direct inversion of I is not possible for I being badly conditioned 3. Merits of different approaches (viz. linear regularization, minimum Fisher information etc.) will be examined (even in presence of added noise) for the estimation of local emissivity at each pixel. A suitable algorithm to develop a MATLAB based code will be reported.
References
[1]M. Anton and H. Weison et al., Plasma Phys. Controlled Fusion 38, 1849 (1996). [2]R. S. Granetz and P. Smoulders, Nucl. Fusion 28, 457 (1988). [3]Asim Kumar Chattopadhyay et al., Rev. Sci. Instrum. 76, 063502 (2005)

P10-03
Two-dimensional Spectroscopic Measurement of Deuterium Emission in JT-60U Detached Divertor Plasmas
K.Fujimoto, T.Nakano, H.Kubo, K.Sawada1), T.Takizuka, K.Shimizu, H.Kawashima, and N.Asakura
Japan Atomic Energy Agency, Naka, Ibaraki, 311-0193, Japan (1)Shinsyu University, Nagano, Nagano, 380-8553, Japan
In tokamak fusion reactors, heat and particle control is one of the issues mitigating damages ofplasma-facing materials. One of the most promising methods for the heat and particle control is a poloidal divertor. The volume recombination in divertor plasmas reduces the ion flux to the divertor plates. Understanding deuterium particle behavior in the divertor plasma is necessary to study the ionizing and recombining plasmas. Two-dimensional spectroscopic measurement of deuterium emission is useful to understand deuterium particle behavior in divertor plasmas, where an ionization and recombination regions exist close to each other. The information of the ionization and recombination can be obtained by measurement of deuterium Balmer-series lines. A wide-spectral-band spectrometer with a CCD detector was used to observe deuteriumBalmer-series lines with two-dimensional spatial distribution in the JT-60U divertor region. The spectrometer has 92 viewing chords (vertically 60, horizontally 32) with a spatial resolution of ~1 cm. It covers a spectral range of 350-800 nm, and can simultaneously observe Balmer-series lines.From the measurement, we can obtain a two-dimensional distribution using a computertomography technique. Dβ (n=2-4, 486.1 nm) and Dγ (n=2-5, 434.0 nm) emission intensities were reconstructed with the algebraic reconstruction technique and the maximum entropy method for comparison. The Dβ emission was strong above the strike point in the inner divertor and around the strike point in the outer divertor. The Dγ emission was strong above the strike point in the inner divertor. The experimental measured emission intensity ratio, I(Dγ) / I(Dβ) was compared with the theoretical one calculated by the collisional-radiative model. The experimental intensity ratio around the outer strike point was less than 0.2. Since this value corresponds to the theoretical intensity ratio of the ionizing component, the Dβ and Dγ emission around the strike point in the outer divertor is considered to be radiated from the ionizing plasma. The experimental intensity ratio above the strike point in the inner divertor was in the range between 0.3 and 0.5. This intensity ratio can be explained by the recombining component by assuming the electron temperature is lower than 1 eV. By assuming the electron temperature is higher than 1 eV, the ratio is considered the mixture of the ionizing and recombining component.
P10-04
Soft x-ray tomography in fusion plasmas: the Reversed Field Pinch case
F.Bonomo, P.Franz, L.Marrelli, P.Martin, P.Piovesan, G.Spizzo
Consorzio RFX, Associazione Euratom-ENEA sulla fusione, Padova, Italy
One of the major tools for laboratory plasma imaging is soft x-ray (SXR) tomography: its non-invasive nature and low-cost of its basic components, and the strong link between its output, the SXR emissivity, and important plasma quantities like pressure profiles and the shape of magnetic flux surfaces have made this technique very useful to diagnose thermonuclear laboratory plasmas. Basically the radiative emission tomography consists in measuring the emitted radiation from aplasma region along a large number of collimated lines of sight, defined by groups of detectorsand pinholes, and in obtaining the reconstruction of the emissivity from the line integratedmeasurements through the solution of an inverse problem. Different techniques have beendeveloped to process the data and to perform the inversion. Tomography in fusion plasmas is achallenging diagnostics, since high time resolutions (down to tens of microseconds and to sub-cmscales in present devices, which have a typical cross section with radius of order of 1 m) must beachieved in rather difficult experimental environments (in terms of ultra high vacuum conditions,heat loads, space constraints, electromagnetic noise). This paper, after a survey on SXRtomography in magnetically confined fusion plasmas, will focus on tomographic diagnostics in thereversed field pinches (RFP) magnetic configuration [1]. SXR tomography is a particularlyimportant tool for the RFP, since it allows to obtain information on the plasma magneticself-organization processes, which underlay the dynamics of the configuration. In addition, thehigh resolutions required for RFP tomography in time and space, make the RFP an excellent testbench for the most advanced hardware and software tomography techniques. We will describe twoimportant diagnostics, that have been developed and brought to operation in the RFX-mod andMST reversed field pinches devices. The instruments will be described, and the hardwaresolutions utilized to maximize the spatial and temporal resolution of the measurements will bereported. The various mathematical methods used to invert the data will be presented and applied:the images obtained show that, in both the devices, the plasma can be in two different regimes,characterized by a different degree of magnetic chaos, with evidence of coherent helical structuresemerging from the chaotic plasma core. In addition, the reconstructed data can be furtherprocessed to obtain important plasma parameters, such as, for example, the electron temperatureprofile (“double-foil” tomography).
References
[1] P.Franz, et al., Nuclear Fusion 41, 695 (2001).
P10-05
Tomographic reconstruction of internal instability in a field-reversed configuration
T, Kiguchi, T. Asai, N. Yamamoto, S. Hiromori, T. Okano, T. Takahashi, T. Takahashi1), Y. Nogi
College of Science and Technology, Nihon University, Chiyoda-ku, Tokyo 101-8308, Japan 1)Faculty of Engineering, Gunma University, Kiryu, Gunma 376-8515, Japan
A field-reversed configuration (FRC) is a compact torus consisting of a purely poloidal magneticfield. As a destructive instability which limits the configuration’s lifetime, rotational instabilitywith toroidal mode number n = 2 is only found in experimentally generated FRCs. The growth ofn = 2 rotational instability can be suppressed by application of a weak multi-pole field and rotatingmagnetic field. However, deterioration of confinement properties as a result of the application of amulti-pole field and growth of higher-mode deformation has been observed experimentally. In recent experiments using tomographic technique, the spatial distribution of plasma radiation (bremsstrahlung) was measured using a newly developed multi-purpose optical diagnostic system. [1] Global deformation of the cross-sectional structure of an FRC and its time evolution were investigated by a computed tomography (CT) reconstruction technique (ART method). Assuming a constant electron temperature profile, the obtained radiation profile denotes the pressure profile. These results indicated that the FRC plasma has an internal deformation of pressure profile, which has different phase from the deformation of separatrix surface. This staggered toroidal structure are difficult to be observed by spatially integrated methods, for example, magnetic probes, end-on camera and so on. In this work, detailed features of this behavior have been investigated by a newly improved tomographic reconstruction technique. The above mentioned straggled deformation will be potentially one of the cause of deteriorated confinement in the stabilized FRC plasma by application of a multi-pole field.
References
[1]T.Asai et al., Physics of plasmas 13, 072508 1-6 (2006)

P10-06
Quantitative evaluation of tomographic resolution by coded penumbral imaging
Shinya Nozaki, Kentato Noguchi, Yen-Wei Chen1)
Okinawa National College of Technology, Nago, Okinawa 905-2192 Japan. 1)Ritsumeikan University, Kusatsu, Shiga 525-8577, Japan.
Penumbral imaging is a powerful imaging technique for radiations with long mean-free path. Since the reconstruction is based on deconvolution, the technique is sensitive to noise contained in penumbral images. Uniformly redundant penumbral array (URPA) technique can improve the SN ratio of penumbral images[1]. In URPA, the penumbral apertures are arranged in m-sequence and the SN ratio of the penumbral image can be improved. In the reconstruction process from the coded data, penumbral image is obtained by correlation to deconding operator. The reconstructed image can be obtained by use of the Wiener filter.
In addition, since the URPA camera can view the object with a large solid angle, it can also provide some tomographic resolution for three-dimensional object[2].
In this paper, we evaluated tomographic resolution of URPA. The tomographic resolution of the URPA has been evaluated by computer simulations. From the simulation, it founds that half value of width of depth point spread function(DPSF) ΔZof the URPA is ΔZ=0.18Z0, where Z0 is the distance between aperture and source point.
References
[1] Y.-W. Chen, H. Yamamoto, and S. Nozaki, “Coded penumbral imaging for improvementsof signal-to-noise ratio”, Rev. Sci. Instrum., vol. 75, no. 10, pp.4017-4019, October 2004. [2] E.E.Fenimore and T.M.Cannon, “Tomographical imaging using uniformly redundantarrays”, Appl. Opt., vol.18 no.7, pp.1052-1057, April 1979.

P10-07
Application of Tomographic imaging to multi-pixel bolometric measurements
Y. Liu1), N. Tamura1), B. J. Peterson1), N. Iwama2),S.Konoshima3), LHD Experimental Group1)
and the JT-60 team3)
1)National Institute for Fusion Science, Toki, Gifu 509-5292, Japan 2)Daido Institute of Technology, Nagoya 457-8530, Japan
3)Japan Atomic Energy Agency, Naka Fusion Institute, Naka, 311-0193, Japan
The measurement of plasma radiation using one-dimensional arrays with perpendicular views of plasma in a poloidal cross-section or a two-dimensional multi-pixel camera with a tangential view of plasma is a common diagnostic tool on almost all fusion devices. While the measurements from such diagnostics are line integrated, the local emission can be recovered by inverting the data using varying assumptions including poloidal or toroidal symmetry, flux surface iso-emissivity, and 1-D chordal lines of sight. However such assumptions can have an important impact on the results and it is important to make a careful and unbiased assessment of the feasibility of each assumption. Two improved tomographic algorithms in the schemes of a linear (Tikhonov-Phillips) and a nonlinear (maximum entropy) regularisation method [1], have been employed for multi-pixel bolometric measurements in order to get as much information as possible while keeping the assumptions to a minimum. The most important features of these improved methods are the capability of reconstructing radiation distributions without any symmetry assumptions, built-in smoothing, and useful reconstructions with relatively few detectors. Furthermore, the effects of finite detector size have been taken into account with a full three dimensional treatment of the detector geometry. This is necessary when the emission of the plasma has a significant variation within the field of view, especially for a tangential viewing camera system. Tests and cross-checks of the algorithms were performed using numerical phantom data sets. The application of tomographic imaging was implemented to a two-array AXUVD (Absolute X-ray UltraViolet photodiode) camera on the Large Helical Device (LHD) [2] and a two-dimensional infrared imaging bolometric (IRVB) pinhole camera on JT-60U [3, 4]. Pertinent examples of the results are presented both to illustrate the analysis techniques and to demonstrate the wealth of physics which can be studied.
References
[1] N. Iwama, "Phenomena in Ionized Gases (XXII ICPIG)", edited by K.H. Becker et al., AIP Press (1996) , pp.289-298 [2] B.J.Peterson et al.,PlasmaPhys.Control.Fusion45(2003)1167. [3] B.J.Peterson et al., to be published in J. Nucl. Mater. [4] S. Konoshima et al., 32nd EPS Conf. on Plasma Phys. and Control. Fusion, ECA Vol. 29C, P-4.092 (2005) (CD-ROM http://eps2005.ciemat.es/papers/pdf/P4_092.pdf)
This work has been carried out with financial support from Grant-in-Aid for JSPS Postdoctoral Fellows, Grant-in-Aid for Scientific Research on Priority Areas, No. 16082207, MEXT and budgetary Grant-in-Aid No.NIFS06ULHH524 of the National Institute for Fusion Science.

P10-08
Spherical Harmonics Decomposition in 3-D Vector Tomography
A.L.Balandin
Institute of System Dynamics and Control Theory of Russian Academy of Sciences (Siberian Branch)
Vector Spherical Harmonics (VSH) (as well as tensor spherical harmonics) occur in many areas of theoretical physics and engineering. The paper is an attempt to extend the use of VSH to real computations in vector tomography diagnostics of spherical tokamak plasmas. The problem of 3-D vector tomography is to reconstruct the vector field g(x) in some domain Ω by the set of projection data (Χ-- ray transform). A method of series expansion with the aid of vector spherical harmonics intended for inverting line integrated data is proposed to investigate 3-D vector fields in the spherical plasmas. A set of numerical computations demonstrating the 3-D reconstruction of the model vector fields has been performed to assess the inversion method proposed.
P10-09
Single Particle Analysis of Image Data Acquired by Zernike Phase Contrast Transmission Electron Microscope
Radostin Danev, Kuniaki Nagayama
Okazak Institute for Integrative Bioscience, National Institutes of Natural Sciences (NINS), Okazaki , 444-8787, JAPAN
We discuss the application of Zernike Phase Contrast Transmission Electron Microscope (ZPC-TEM) to acquisition of image data for single particle analysis of biological samples. The ZPC-TEM utilizes a Zernike phase plate [1-4] which consists of a thin film with a small holein the center. It is positioned at the back-focal plane of the objective lens. This phase plateintroduces half pi phase shift to the scattered electrons leaving the central beam of unscatteredelectrons intact. The resulting images exhibit much higher overall contrast due to the presence oflow spatial frequencies which are strongly attenuated in images acquired using a conventionalTEM. The ZPC-TEM has overall “flat” frequency response compared to the “band-pass” filtercharacteristics of the conventional defocus phase contrast TEM. Data and results of single particle analysis using ZPC-TEM images are presented. They are compared to single particle analysis done by a conventional TEM. Theoretical and practical aspects in the application of ZPC-TEM are discussed.
References
[1] K. Nagayama, J. Phys. Soc. Jpn., 68 (1999) 811. [2] R. Danev, K. Nagayama, Ultramicroscopy, 88 (2001) 243. [3] R. Danev, K. Nagayama, J. Phys. Soc. Jpn., 70 (2001) 696. [4] R. Danev, K. Nagayama, Biophysics, 2 (2006) 35-43.

P11-01
Neutron Radiographic Imaging of Irradiated Fission-, Spallation- and Fusion-Materials
Masayoshi TAMAKI and Eberhard LEHMANN1)
Nagoya University, Nagoya, Aichi 464-8603, Japan 1)Paul Scherrer Institute, Villigen PSI CH-5232, Switzerland
1. Neutron radiographic imaging : Neutrons show an energy-dependence on neutron-materialinteractions. Photo-stimulated luminescence (PSL) material (BaFBr:Eu) is a radiation-photon converter material for the imaging plate(IP). The new Dy-IP (Dy2O3+BaFBr:Eu) has been testedby the neutron radiographic experiment for the evaluation of sensitivity, spatial resolution andquantitative characteristics as well as its realistic application for neutron radiographicpost-irradiation examination of fission-, spallation- and fusion-materials. The neutron image byDy-IP is very clear and high contrast without gamma-ray fogging. Spatial resolution is100-300μm, which depends on its PSL layer thickness. The size and enrichment of thepost-irradiated nuclear fuel rod of uranium oxide as well as the profiles of the hydrogen and/orspallation-induced product in the spallation Pb target have been visualized and numericallyevaluated. By the thermal neutron radiographic techniques, however, some fusion reactor wallmaterials are too transparent neutron-optically to evaluate the post-irradiation effect. We mustdevelop monochromatic cold neutron imaging technique utilizing the coherent neutron-materialinteraction. If monochromatic neutron imaging with variable wavelength was completed, theapplications for material science and engineering may be accelerated. 2. Coherent neutron imaging of Bragg-cut-off material : Monochromatic cold neutron beamtailored by using the velocity selector has been applied to realize the coherent monochromatic cold neutron imaging. By comparing between the coherent neutron images with the longer and the shorter wavelength than the Bragg-cut-off of the iron(0.4nm), the strained part of the steel induced by welding has been visualized. This new technique may be applied for the post-irradiation examination of the fission-, spallation-, and fusion-materials. However, the tailored neutron beam by the velocity selector has a rather wide spectrum, we must prepare a monochromatic neutron beam having a much narrower spectrum. 3. Proposal and verification of monochromatic neutron imaging : We have proposed a conceptualtechnique of monochromatic neutron imaging. Neutron filters to obtain much narrower monochromatic neutron may be a combination of velocity selector, mosaic single crystal monochromator, Bragg-cut-off polycrystalline and critical angle-based super-mirror. Experimental tests are conducting by using the neutron beams of the TNRF and CNRF (JRR-3M, JAEA) and the NEUTRA and ICON facilities (SINQ, PSI). Results are to be presented at the conference.
P11-02
Application of the Liquid-crystal-based tunable Lyot filter to the Optical Emission Imaging Plasma Spectrometry
S. Kado, H. Suzuki1), Y. Kuwahara1), K. Kurihara1), T. Shikama1), F. Scotti1), Y. Iida1) and S. Tanaka1)
High Temperature Plasma Center, The University of Tokyo, Kashiwa, Chiba 277-8656, Japan 1)School of Engineering, The University of Tokyo, Bunkyo, Tokyo 113-8656, Japan
The Lyot filter [1] is a kind of birefringent filter that has recently been widely employed in thespectrometry for the biochemistry, surface analysis, laser microscopy etc... The technology of this filter is based on the polarization interference whose transmittance depends on the wavelength. By cascading the Lyot filters with varying the retardation, the transmission wavelength, which is tunable by varying the retardation of the ferroelectric liquid crystal (FLC), can be selected. We are applying this filter (Varispec: VIS-7-20) to the imaging spectrometry for the plasmaoptical emission. Images of the plasma for different wavelength 7 nm in each passband can be recorded via a charge-coupled-device(CCD) detector (Roper: EEV 1024x256). After the relative intensity calibration, the intensity ratio between the images at differentwavelength can be obtained for each pixel of the CCD, which enables the application of the collisional-radiative (CR) model [2] to determine electron density or temperature distribution in all the observation area. Plasma is produced in the steady-state linear divertor/edge plasma simulator MAP(material andplasma)-II in the University of Tokyo [3]. In this paper, we evaluate the applicability of this filter to our experimental condition, selectingproper line emissions for the application of the CR-model for He I considering the radiation trapping[4], and present the preliminary results of the imaging spectrometry.
References
[1] B. Lyot, Ann. Astrophysics, 7, 31(1944). [2] M. Goto, J. Quant. Spectrosc. Radiat. Transfer 76, 331 (2003). [3] S. Kado, Y. Iida, S. Kajita et. al., J. Plasma Fusion Res. 81, 810 (2005) . [4]Y. Iida, S. Kado, A. Okamoto et. al., J. Plasma Fusion Res. SERIES, 7, 123(2006).
This work was supported in part by NIFS Collaborative Research Program (NIFS04KOAB009).

P11-03
Development of the monitoring system of plasma behavior using a CCD camera in the GAMMA 10 tandem mirror
H. Kawano, Y. Nakashima, Y. Higashizono, N. Nishino1) , T. Kobayashi, Y. Mishima, M. Suzuki, K. Mori, Y. Kubota, M. Yoshikawa, T. Cho
Plasma Research Center, University of Tsukuba, Tsukuba, Ibaraki 305-8577, Japan 1)Graduate school of Engineering, Hiroshima University, Hiroshima 739-8527, Japan
High-speed CCD camera is one of very useful tools to observe precise plasma behavior and cancapture the instantaneous two-dimensional (2-D) structure of its visible emission. 2-D image measurements have been successfully demonstrated in many fusion devices [1-4]. 2-D image of plasma behavior also gives us a lot of information for controlling the plasma position and understanding the plasma response on plasma heating systems. In the central cell of the GAMMA 10 tandem mirror, a medium-speed camera (CCD camera) has been installed for the observation of plasma behavior. The framing speed of the camera is 400 frames/s. Through a horizontal port at the central-cell mid-plane, an area of approximately 40cm×120 cm on the machine axis is imaged onto the 216×640 pixel. This camera system isdesigned for monitoring the plasma in the whole discharge duration. The captured 2-D images are automatically displayed just after the plasma discharges and stored sequentially shot by shot. The monitoring system is operated according to the following sequence: First, the camera, directly connected to a PC, starts to record the visible image of plasma receiving the trigger pulse. After capturing the picture images by the given frame number, the image data are transferred to a hard disc in the PC and are labeled with the corresponding shot number and then it returns to the trigger-waiting mode. The above procedure is executed by an automatic mouse control software and the data are displayed in a movie format during shot-to-shot intervals by the help of the Visual Basic software. By using the above system, we measured the plasma behavior in several experimental conditions.In this paper, the detail of the monitoring system is described and the observed results will be discussed from the viewpoints of the difference in the wall conditioning and the dependence of a movable limiter.
References
[1] R. J. Maqueda and G. A. Wurden et al., Rev. Sci. Instrum. 74 (2003) 2020. [2] S. J. Zweben et al., Phys. Plasmas 9 (2002) 1981. [3] N. Nishino et al., J. Nucl. Mater. 337-339 (2005) 1073. [4] N. Nishino et al., J. Plasma Fusion Res. 1 (2006) 035.

P11-04
Development of phosphor screen having "gridded energy analyzer" for two- fluid nonneutral plasma experiments
K. Morita, H. Himura, A. Sanpei, S. Masamune
Kyoto Institute of Technology, Department of Electronics, Matsugasaki, Kyoto 606-8585
Recently, as a passive measurement method using a CCD camera, it becomes extremely popular to estimate space distribution of plasma particle flux and temperature by photographing an emission of light from a phosphor screen on which particles or X-rays are incident. However, such a conventional method cannot distinguish ions from electrons. Also, it usually equips no function of analyzing particle energy.
In this paper, we propose a new type of phosphor screen which can analyze particle energy. This new method clearly has an advantage of clarifying both space distribution of number density n and particle energy E simultaneously. Thus, this may answer how both n and E are evolved in two-fluid nonneutral plasma experiments.
The proposed device is as follows; It has three potential grids in front of a phosphor screen. Thefirst grid facing a plasma is made of a metal-mesh that is grounded. The second grid is also madeof a metal-mesh to which variable potential is applied, for analyzing particle species and energy.Thus, particles having higher energy than the potential applied to the second grid can reach thethird grid. The third metal-mesh can be energized at either positive or negative high voltage (up to10 kV) in order to accelerate either ions or electrons which have passed through the second grid,respectively. Then, the accelerated particles hit the last fourth grid that is composed of thehandmade phosphor screen. Regarding to the screen, its diameter is 10 cm, and on the surface(made of a quartz plate) we apply fluorescent (Zn; ZnO) emitting green light (the wavelength is505 nm). This alleviates the difficulty in distinguishing the signal line from the shiningbackground emission of the tungsten filament. On the surface of the fluorescent is covered with anIndium Tin Oxide (ITO) film with about 0.1μm thick. Thus, its potential can be always set severalten volts higher than the third grid potential for secondary electron suppression. Finally, to detectthe emitted light from the phosphor screen, an ICCD camera (DH520-18F-01-I) made by Andor isinstalled.
In this conference, the detail of the new proposed instrument and an initial data will be presented.

P12-01
Imaging challenges in long pulse nuclear fusion experiments
R. König1), T. Bluhm1), D. Hildebrandt1), T. Hübner1), F. Klinkhamer2), K. Moddemeijer2, M. Otte1) and W. Vliegenthart2)
1)Max-Planck-Institut für Plasma Physik, EURATOM Ass., 17491 Greifswald, Germany 2)TNO Science & Industry, Stieltjesweg 1, P.O. Box 155, 2600 AD Delft, The Netherlands
The strong move of high power nuclear fusion experiments towards quasi-continuous operation, creates new challenges regarding the design of imaging diagnostics as well as image data storage, retrieval and analysis. In the examples presented the focus will be on developments for non-burning plasma devices in which, on the diagnostic design side, one needs to cope with high heat loads, contamination of the first optical element and strong ECRH stray radiation. To demonstrate one way of how to cope with the design problems, the optical design strategy for an IR/visible imaging endoscope for continuous divertor control and divertor plasma physics investigations at the W7-X stellarator, will be elaborated on, but also the strategies followed on other devices will be discussed. On W7-X the IR divertor monitoring systems are combined with an even larger number (~15) of high spatial resolution CCD cameras equipped with interference filters for divertor plasma symmetry and physics investigations and a further 10 digital cameras with toroidal views into the plasma vessel to monitor any interactions of the plasma with the water cooled wall panels and any other special in-vessel components. A further, very stellarator specific imaging diagnostic, is the flux surface measurement where a beam of electrons is injected either into vacuum to produce bright spots on a fluorescent rod moved across the vacuum vessel, or by injecting them into a gas filled torus to visualise the beam path around the torus. Comparison of these measurements with vacuum magnetic field calculations, gives detailed information on the actual magnetic field structure. Identifying the washed out electron beam path in a gas with high accuracy via image processing resembles very much the tracking of veins or arteries in medical images. The high data rates, as well as the total storage requirements of ~15 GByte per 30 minute discharge, of which on W7-X it will be possible to run two per day, are expected to be manageable by 2012 when the device will start operation. A major challenge till then will be the development of fully automatic pattern recognition and classification software to build a hierarchical system of increasing level of abstraction with respect to patterns in individual images as well as image sequences. Due to the fuzziness of the images the methods that need to be developed will tend to be different from those presently developed in other non plasma physics communities. Since the retrieval of the image data of complete pulses will no longer be meaningful nor desirable, sensible fully automatic film sequencing as well as variable resolution retrieval, matched to the respective needs, will be of high importance.

P12-02
Observation of toroidal asymmetric radiation in the Large Helical Device
N. Ashikawa, B.J. Peterson, S. Masuzaki, and the LHD Experiment Group
National Institute for Fusion Science, Toki, Gifu 509-5292, Japan
In helical devices, a magnetic configuration does not have toroidal symmetry and thus plasma radiations are localized poloidaly and also toroidaly. An influence of asymmetric radiations is important issue for a precise estimation of the total radiated power loss on the power balance equation in the current devices. For a design of future helical devices, such as the force free helical reactor (FFHR), it is also important due to an avoidance of damage on the first wall by a localized high heat flux. For the diagnosis of the total plasma radiation, several bolometry systems are used in the Large Helical Device (LHD)[1]. Resistive bolometers are the main diagnostics for measuring the plasma radiation. The total radiation is measured method on the local area for toroidal direction and is estimated using a volume of this field of view (FOV). An infrared (IR) imaging bolometer is a two-dimensional diagnostic system for measuring the plasma radiation [2-3]. At typical discharges, a local radiated power is kept a toroidal symmetry, and then the total radiation and a local radiated power show a similar phenomenon. But the localized high radiation region by injected impurity pellet was also measured and in this case IR imaging bolometer observed a toroidal asymmetric radiation. In this paper, we discuss a comparison of a local radiated power and the total radiation using different borometry systems and investigate an influence of a local radiated power in LHD.
References
[1]B.J. Peterson, et al., Plasma Phys. Control. Fusion 5 (2003) 1167-1182. [2]N. Ashikawa et al., J. Nucl. Mater. 313-316C (2003) 1103. [3]N. Ashikawa et al., 30th EPS conference 2003, ECA 27A P2-160.
This work was supported by NIFS budget NIFS05ULPP515
P12-03
Effects of face contour and features on occipitotemporal activity when viewing eye movement
K. Miki1,2), S. Watanabe1), Y. Honda1,3), M. Nakamura4), R. Kakigi1,2,3,5)
1)Department of Integrative Physiology, National Institute for Physiological Sciences, Okazaki, Aichi 444-8585, Japan
2) RISTEX, Japan Science and Technology Agency, Otemachi, Chiyoda-Ku, Tokyo 100-0004, Japan
3) Department of Physiological Sciences, School of Life Sciences, The Graduate University for Advanced Studies, Shonan Village, Hayama, Kanagawa 240-0193, Japan
4) Department of Neurology, Jikei University School of Medicine, Nishi-Shimbashi, Minato-ku,Tokyo 105-8461, Japan
5) Japan Space Forum, Ohtemachi, Chiyoda-ku, Tokyo 100-0004, Japan
Introduction: In our daily life, it is important to recognize the facial movement. We have reported that the occipitotemporal area, corresponding to human MT/V5 region, is activated by viewing facial movement. However, the question still remains whether the MT/V5 activity is influenced by face configuration and features. We investigated the differences between eyes and dots movements in MT/V5, using magnetoencephalography (MEG). Methods: We studied thirteen right-handed subjects. We used apparent motion and compared two stimulus conditions as follows; (1) CDL; a schematic simple face made by a configuration (Circle), eyes (two Dots) and mouth (horizontal Line) was presented and two dots averted in an instantaneous transition. (2) D; A configuration and mouth were removed from CDL. Subjects described a simple movement of dots for D, but eye movement for CDL, though movement modalities were the same through both conditions. We estimated the single source for the evoked magnetic field in the occipitotemporal area by using the single dipole model method. Results: A clear component peaking at around 180 ms, 1M, was identified around the right and left occipitotemporal region following both CDL and D movement, respectively. Dipoles in both conditions were estimated in the occipitotemporal region, MT/V5, and there was no significant difference of their location between both conditions. There were no significant differences of peak latency between two conditions, but the maximum dipole moment in CDL was significantly larger than that in D (p<0.01). There were no inter-hemispheric differences in either peak latency or maximum moment. Discussion: These results indicated that there is the specific process of facial movement information in MT/V5 and this activity is influenced by face configuration and features. We consider that the presences of face configuration and features play an important role for human in perception of face movement.
This study was supported by Research Institute for Science and Technology for Society (RISTEX), Japan Science and Technology Agency (JST) and Japan Space Forum (JSF).

P12-04
Neural mechanism for processing of biological motion perception: An event-related potential study
Masahiro Hirai 1), Kazuo Hiraki 2)
1)National Institute for Physiological Sciences, 38 Nishigo-Naka, Myodaiji, Okazaki, Aichi 444-8585, JAPAN.
2)The University of Tokyo, 3-8-1 Komaba,Meguro-ku,Tokyo 153-8902,Japan.
Biological motion (BM) is well known and interesting phenomenon that we can get vividimpression of human figure just from only moving point-lights. Recently, it is discussed in the context of social perception (e.g. [1]). As supporting this notion, neuroimaging studies have revealed that the same region responsible for the BM perception activates as other social perception (e.g. gaze direction). However, the neural dynamics for the processing of the BM perception is unclear. To clarify the neural dynamics involved in the perception of BM, we recorded event-relatedpotentials from twelve healthy adult subjects. The subjects were shown BM or scrambled motion (SM) as a control stimulus. In the SM, each point had the same velocity vector as in the BM, but the initial starting positions were randomized. The perception of both BM and SM elicited negative peaks at around 200 (N200) and 240 ms (N240). Furthermore, both negative peaks were significantly larger in the BM condition than in the SM condition over the right occipitotemporal region. In light of previous human neuroimaging studies, we speculate that component N200 is generated near the extrastriate cortex area and N240 is generated from the superior temporal sulcus region.
References
[1] Blake, R., Turner, L.M., Smoski, M. J., Pozdol, S.L. & Stone, W.L., Psychol. Sci. 14 (2003) 151.
P12-05
Centrifugal regulation of human cortical responses to a task-relevant somatosensory signal triggering voluntary movement: An MEG study.
T Kida, T Wasaka, K Inui, K Akatsuka, H Nakata, R Kakigi
Department of Integrative Physiology, National Institute for Physiological Sciences
Many studies have reported a movement-related modulation of response in the primary and secondary somatosensory cortices (SI and SII) to a task-irrelevant stimulation in primates. In thepresent study, magnetoencephalography (MEG) was used to examine the top-down centrifugal regulation of neural responses in the human SI and SII to a task-relevant somatosensory signal triggering a voluntary movement. Nine healthy adults participated in the study. A visual warning signal was followed 2 s later by asomatosensory imperative signal delivered to the right median nerve at the wrist. Three kinds ofwarning signal informed the participants of the reaction which should be executed on presentation of the imperative signal (rest or extension of the right index finger, extension of the left index finger). The somatosensory stimulation was used to both generate neural responses and triggervoluntary movement, and therefore was regarded as a task-relevant signal. The responses wererecorded using a whole-head MEG system. The P35m response around the SI was reduced in magnitude without alteration of the primary SI response, N20m, when the signal triggered a voluntary movement compared to the control condition, whereas bilateral SII responses peaking at 70-100 ms were enhanced and the peak latency was shortened. The peak latency of the responses in the SI and SII preceded the onset ofthe earliest voluntary muscle activation in each subject. Later bilateral perisylvian responses werealso enhanced with movement. In conclusion, neural activities in the SI and SII evoked by task-relevant somatosensory signals are regulated differently by motor-related neural activities before the afferent inputs. The presentfindings indicate a difference in function between the SI and SII in somatosensory-motor regulation.
References
Kida T et al. Centrifugal regulation of human cortical responses to a task-relevant somatosensory signal triggering voluntary movement. Neuroimage 32, 2006, 1355-1364

P12-06
The magnetoencephalographic neural activity related to the perception of apparent motion defined by various cues
E.Tanaka1), Y.Noguchi2), R.Kakigi1,3), Y.Kaneoke1)
1)National Institute for Physiological Science,Okazaki,Aichi,444-8585,Japan 2)Nagoya University, Nagoya,Aichi,461-8673,Japan 3)RISTEX,Chiyoda,Tokyo,100-0004,Japan
Although several theoretical and psychophysical studies have suggested the distinct neural process for the perception of 2nd-order motion different from that for the 1st-order motion, few physiological studies have supported this idea. We investigated whether magnetoencephalographic(MEG) neural responses to the apparent motions (AM) defined by various 2nd-order (luminance-independent) cues (2ndAM) are different from that defined by 1st-order cue (1stAM).MEG responses to the 1stAM and the three 2ndAMs(contrast, texture, and flicker) were measured from 6 subjects using 306-channel detectors array (Vectorview; ELEKTA Neuromag, Finland).The response properties (peak latency and amplitude of the first response component) for the 1stAM were significantly different from those for the 2ndAM except for contrast-defined AM. The response to each 2ndAM had different properties among each other. When the 1st-order cuewas added to the 2ndAM, the response properties changed markedly. The response sources for allthe stimuli were estimated to be around MT/V5+ of each subject. The results correspond to thenotion that the neural process for the 2ndAM is different from that for the 1stAM. Furthermore,there may be no unique mechanism for the perception of all 2ndAMs, although processing of each AM perception may use a common neural circuit to some extent.
References
[1]A.Sofue, Y.Kaneoke, R.Kakigi, Hum Brain Mapp, 158-167 (2003) 20, [2]Y.Noguchi, Y.Kaneoke, R.Kakigi, HC.Tanabe, N.Sadato, Cereb Cortex 1592-1601 (2005) 15
This study was carried out as a part of the "Ground-based Research Announcement for Space Utilization" promoted by the Japan Space Forum, and supported by grants from the Japan Society for the Promotion of Science (No. 15500221 to YK).