ac loss in pancake coil made from 12 mm wide rebco...
TRANSCRIPT
AC loss in pancake coil made from 12 mm wide REBCO tape
Fedor Gömöry, Ján Šouc, Enric Pardo, Eugen Seiler, Mykola Soloviov, Lubomír Frolek, Michal Skarba,
Pavol Konopka, Marcela Pekarčíková, Jozef Janovec
Abstract— The design of a superconducting coil from high performance REBCO coated conductors is often complicated because of the complex anisotropy of the critical current density, Jc. It is important to understand how much in detail this feature must be taken into consideration in the prediction of maximum achievable current and the expected AC loss. We present the results of investigation performed with a small (10 turns, 60 mm inner diameter) coil made from SuperPower tape of 12 mm width. The knowledge of Jc(B,) determined on short sample allowed to predict the maximum achievable current of the coil and the AC loss behavior with surprising accuracy. We have also investigated the effect of a tape non-uniformity. Our results confirm that the lateral non-uniformity when Jc at tape edges is lower than in its centre leads to significant increase of AC loss. A longitudinal non-uniformity, in particular the reduction of critical current in some portion along the tape length is hardly observable in AC loss result. Regarding the achievable coil current only the innermost turn is critical, thus using a piece of tape with lower Jc there would significantly reduce the maximum current. We present also calculations showing the change in current-voltage curve and redistribution of AC dissipation in the case of non-uniform tape quality.
Index Terms—superconducting magnets, high-temperature superconductors, AC losses, numerical computations
I. INTRODUCTION
OATED conductor (CC) tapes from high temperature superconductors (HTS) are more and more available in
lengths and amperages that allow considering a replacement of copper electromagnets in different kinds of electric power devices (transformers, motors) by coils from HTS CC. There are several significant differences between these two materials (working temperature, shape and sensitivity to mechanical strain, …). From the electromagnetic point of view the HTS material is completely dissimilar to a normal metal that is well characterized by its electrical resistivity. The conductivity of HTS depends in highly non-linear way on the electric and magnetic field and thence the distribution of current is
Manuscript received October 9, 2012. This work was supported in part by
the VEGA grant agency under contract N. 1/0162/11 and by the European Commission EURATOM project FU07-CT-2007-00051.
F. Gömöry, J. Šouc, E. Pardo, E.Seiler, M. Soloviov, L. Frolek are with the Institute of Electrical Engineering, Slovak Academy of Sciences, Dubravska cesta 9, 84104 Bratislava, Slovakia (corresponding author phone: +4212 5922 2033; fax: +4212 5477 5816; e-mail: [email protected]). M. Skarba, P. Konopka, M. Pekarčíková, J. Janovec are with Faculty of Materials Science and Technology in Trnava, Slovak Technical University, Paulínska 16, 917 24 Trnava, Slovakia.
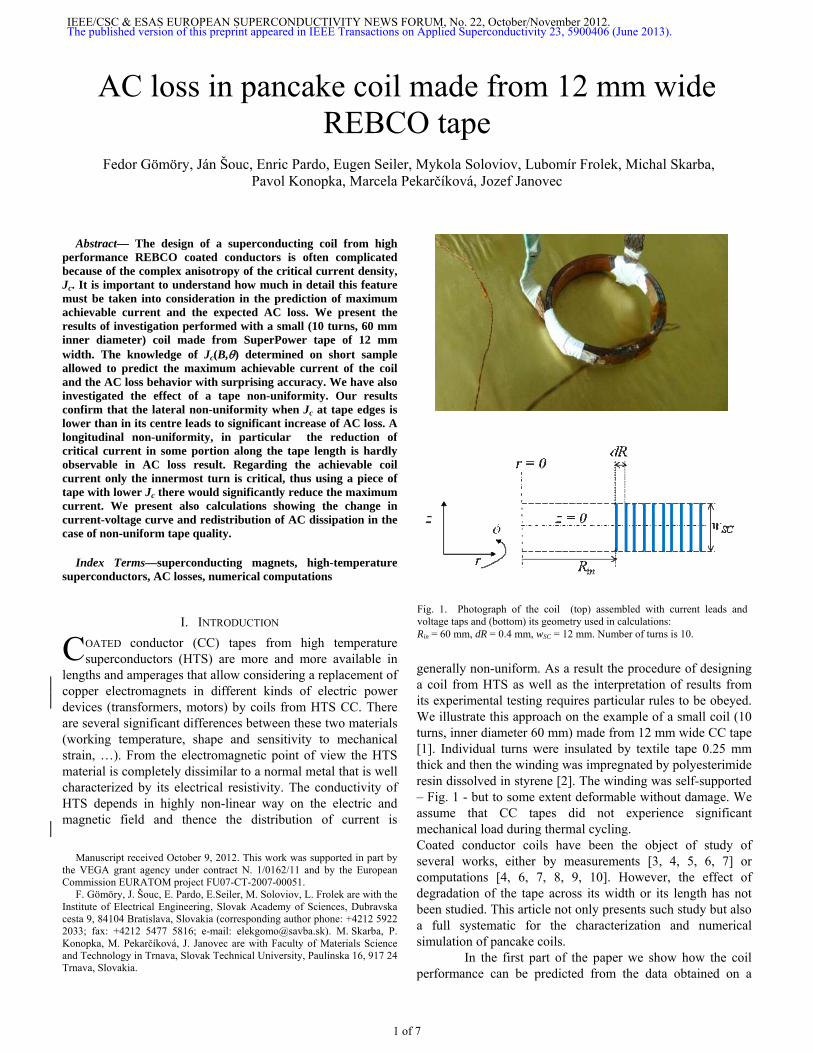
generally non-uniform. As a result the procedure of designing a coil from HTS as well as the interpretation of results from its experimental testing requires particular rules to be obeyed. We illustrate this approach on the example of a small coil (10 turns, inner diameter 60 mm) made from 12 mm wide CC tape [1]. Individual turns were insulated by textile tape 0.25 mm thick and then the winding was impregnated by polyesterimide resin dissolved in styrene [2]. The winding was self-supported – Fig. 1 - but to some extent deformable without damage. We assume that CC tapes did not experience significant mechanical load during thermal cycling. Coated conductor coils have been the object of study of several works, either by measurements [3, 4, 5, 6, 7] or computations [4, 6, 7, 8, 9, 10]. However, the effect of degradation of the tape across its width or its length has not been studied. This article not only presents such study but also a full systematic for the characterization and numerical simulation of pancake coils.
In the first part of the paper we show how the coil performance can be predicted from the data obtained on a
C
Fig. 1. Photograph of the coil (top) assembled with current leads and voltage taps and (bottom) its geometry used in calculations: Rin = 60 mm, dR = 0.4 mm, wSC = 12 mm. Number of turns is 10.
IEEE/CSC & ESAS EUROPEAN SUPERCONDUCTIVITY NEWS FORUM, No. 22, October/November 2012.
1 of 7
The published version of this preprint appeared in IEEE Transactions on Applied Superconductivity 23, 5900406 (June 2013).
short sample. Because of highly non-linear properties of HTS tape it is necessary to employ numerical computation technique in the design of the coil. It is also useful in analysis of the observed behavior and allows to calculate the quantities that are not easily accessible in experimental way like the distribution of heat generated by AC current in the coil.
II. TAPE PROPERTIES
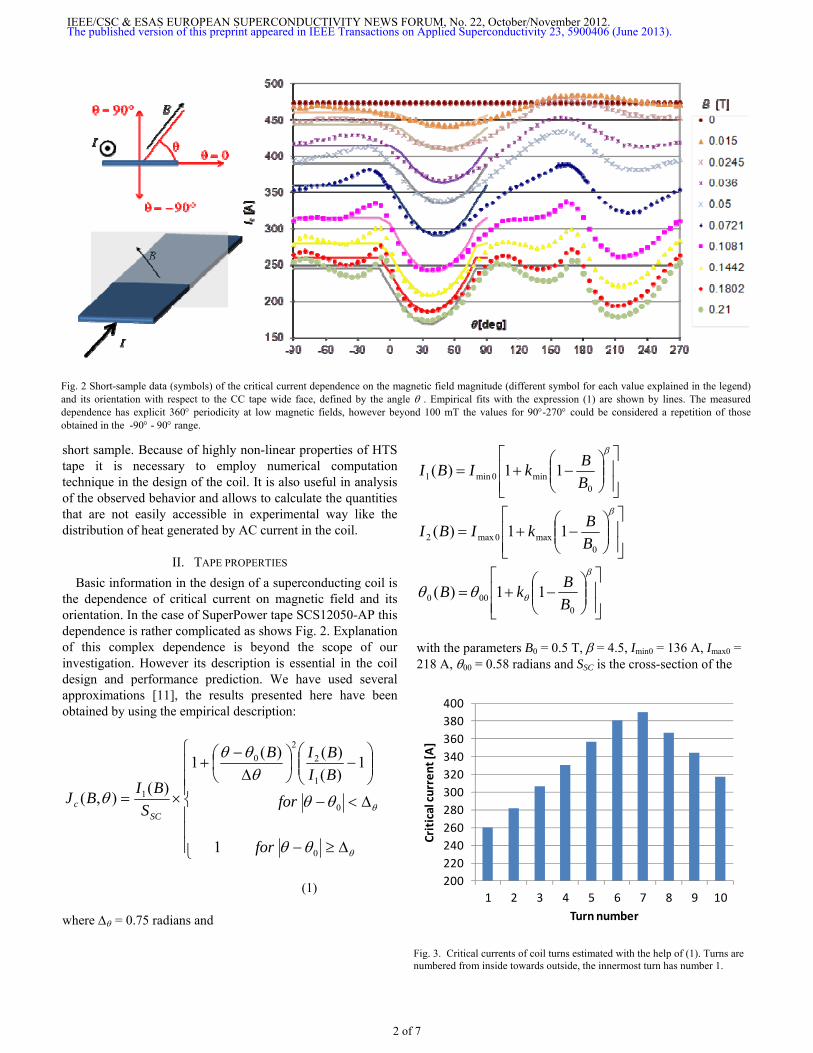
Basic information in the design of a superconducting coil is the dependence of critical current on magnetic field and its orientation. In the case of SuperPower tape SCS12050-AP this dependence is rather complicated as shows Fig. 2. Explanation of this complex dependence is beyond the scope of our investigation. However its description is essential in the coil design and performance prediction. We have used several approximations [11], the results presented here have been obtained by using the empirical description:
0
0
1
2
2
0
1
1
1)(
)()(1
)(),(
for
for
BI
BIB
S
BIBJ
SCc
(1)
where = 0.75 radians and
0
000
0max0max2
0min0min1
11)(
11)(
11)(
B
BkB
B
BkIBI
B
BkIBI
with the parameters B0 = 0.5 T, = 4.5, Imin0 = 136 A, Imax0 = 218 A, 00 = 0.58 radians and SSC is the cross-section of the
Fig. 2 Short-sample data (symbols) of the critical current dependence on the magnetic field magnitude (different symbol for each value explained in the legend) and its orientation with respect to the CC tape wide face, defined by the angle . Empirical fits with the expression (1) are shown by lines. The measureddependence has explicit 360 periodicity at low magnetic fields, however beyond 100 mT the values for 90-270 could be considered a repetition of those obtained in the -90 - 90 range.
200
220
240
260
280
300
320
340
360
380
400
1 2 3 4 5 6 7 8 9 10
Critical current [A]
Turn number
Fig. 3. Critical currents of coil turns estimated with the help of (1). Turns are numbered from inside towards outside, the innermost turn has number 1.
IEEE/CSC & ESAS EUROPEAN SUPERCONDUCTIVITY NEWS FORUM, No. 22, October/November 2012.
2 of 7
The published version of this preprint appeared in IEEE Transactions on Applied Superconductivity 23, 5900406 (June 2013).

superconducting layer that in our calculations was represented by the rectangle of width wSC = 12 mm and thickness hSC = 1 m. The expression (1) with these parameters fits the data for angles from -90 to 90and magnetic fields higher than 0.1 T, the critical currents for lower fields are slightly higher in the range of angles between 90 and 270.
III. MAXIMUM DC CURRENT OF THE COIL
Knowledge of the tape critical current described by the expression (1) allows to predict the maximal DC current the coil could carry. For this purpose we created the finite-element model based on the geometry shown in Fig. 1. Rotational symmetry is used i.e. the real spiral turns have been replaced by circular ones. The approximation of uniform current density in the winding was used to calculate the magnetic field distribution in the coil. Then in an iterative procedure the level of coil current that would generate the electrical field Ec = 1 μV/cm in various turns has been identified. The result – that could be with certain simplification called the critical currents of individual turns – is shown in Fig. 3. As expected, the innermost turn (assigned No. 1) limits the maximum DC current the coil could carry. Then it does not make much sense to calculate the current that would create 1 μV/cm electrical field in the whole coil. Instead we estimated the current-voltage curve of the whole coil. A rigorous calculation would require in the finite element calculation a dense mesh of current-voltage dependences taken on short sample at different field values and orientations. We used a simplified procedure instead: First, the measured short sample curves were approximated by the power-law function n
cc IIEIE )(
(from which the values of Ic found at Ec = 1 μV/cm were used in Fig. 2) where the exponent n was found to vary between 17 and 25 in the range of magnetic fields 0.08-0.14 T that would
appear in the coil winding at carrying maximum current. Then we took the “critical currents” of individual turns, Ici, and the power-law exponent in the mid of its range, n = 21 to estimate the current-voltage curve of the coil:
N
ii
n
ci
coilc
N
ii
coilcoil
r
I
IEr
IE
1
1
2
2
)(
(2)
In this expression N = 10 is the number of turns, each of them at the radius ri. The result was confronted with experimental data as shown in Fig. 4. Calculated prediction is slightly higher than the experimental finding. Key role of the innermost turn is illustrated by E(I) curve calculated considering the degradation of critical current by e.g. 7%: The shift towards lower currents obtained for a uniform reduction of Ici in all the turns is close to the result obtained assuming such degradation in the innermost turn alone.
IV. AC LOSS BEHAVIOR
In the case of a coil considered for power application the dissipation at AC transport (AC loss) is an important parameter. We performed numerical calculations based on the A--j formulation of critical state utilizing the finite-element code Comsol Multiphysics [12]. The original stepwise current-voltage curve proposed for hard superconductor [13] is replaced by its smooth approximation
ccs E
zrEJzrJ
),(tanh),(,
. (3)
where the critical current density Jc is now the upper limit for the current density in superconductor, Js, and the cylindrical geometry shown in Fig.1 was introduced. Because the electrical field is generated by the electrostatic gradient
as well as the time variation of the magnetic vector potential,
A
, the expression (3) can be rewritten [6] as
c
cs Et
zrAzr
BJzrJ
),(),(
tanh),(),(,
(4)
. where we also indicated that Jc depends on the local value of magnetic field and its orientation with respect to the tape. In the finite element calculation the distribution of A and is found that obeys the Maxwell equations with the additional constraint that the total current in each turn is equal to the current delivered by the power supply
0.00001
0.0001
0.001
200 300
Ecoil[V/m]
Icoil [A]
Experiment
Simulation
Simulation - 2% degradation all turns
Simulation - 7% degradation turn 1
Simulation - 7% degradation all turns
Fig. 4. Current-voltage dependence calculated for the coil (full line) compared with the experimental data (circles). Better agreement is reachedassuming the critical current data lowered by 2% (dotted). Simulations for a7% degradation of the innermost turn (long dashes) and of all the coil turns(short dashes) were carried out to see how much such damage could bedetected in the E(I) tests.
IEEE/CSC & ESAS EUROPEAN SUPERCONDUCTIVITY NEWS FORUM, No. 22, October/November 2012.
3 of 7
The published version of this preprint appeared in IEEE Transactions on Applied Superconductivity 23, 5900406 (June 2013).
coil
NiSs IzrJ
i
..1
, ),( (5)
Series of distributions are calculated for
)sin()sin( maxmax, jjjcoil ItII (6)
where is the angle frequency and j = 0, .tj, 2.tj,,… 2 are the angles corresponding to the time instants tj when the distributions are resolved. We have found that calculation of M = 40 distributions in one AC period is sufficient to obtain the representative result within reasonable computation time. The power dissipated in the coil at the time instant tj is the sum of contributions from individual turns
N
i Sjisj
i
dSzrEzrJP1
, ),(),( (7)
where Js is calculated using (4) and the electrical field in the i-th turn at the instant defined by j is
1
1,,
),(),(),(
jj
jjjiji
zrAzrAzrE
(8)
In the last expression we took into account that is constant in the cross-section of one turn and it thus attains discrete valuesi for different turns [14, 15]. The power dissipated in all the turns is integrated over one cycle to obtain the total loss in the winding. In order to allow comparison with results obtained on different coils we prefer to present the dissipation
divided by the total length of the tape in Joule/meter units:
N
ii
M
jj
coil
M
jj
r
PM
L
tP
Q
1
11
2
2
(9)
The prediction obtained by such calculation incorporating
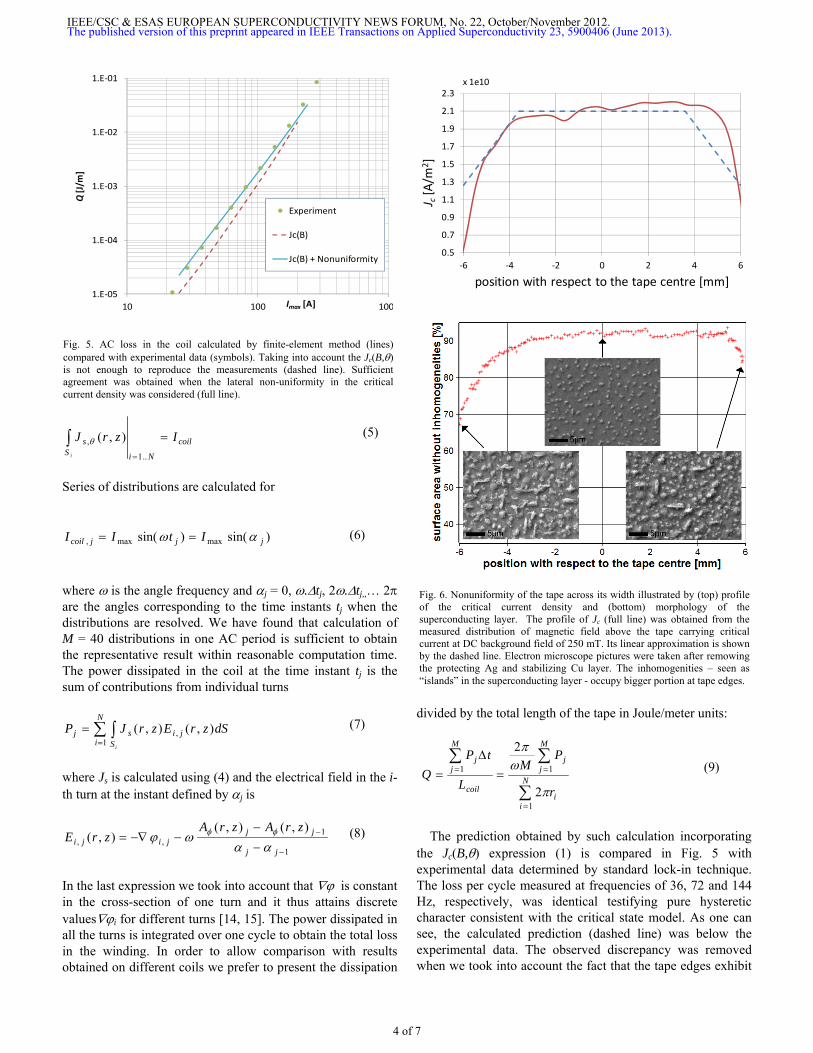
the Jc(B,) expression (1) is compared in Fig. 5 with experimental data determined by standard lock-in technique. The loss per cycle measured at frequencies of 36, 72 and 144 Hz, respectively, was identical testifying pure hysteretic character consistent with the critical state model. As one can see, the calculated prediction (dashed line) was below the experimental data. The observed discrepancy was removed when we took into account the fact that the tape edges exhibit
1.E‐05
1.E‐04
1.E‐03
1.E‐02
1.E‐01
10 100 100
Q[J/m
]
Imax [A]
Experiment
Jc(B)
Jc(B) + Nonuniformity
Fig. 5. AC loss in the coil calculated by finite-element method (lines)compared with experimental data (symbols). Taking into account the Jc(B,)is not enough to reproduce the measurements (dashed line). Sufficientagreement was obtained when the lateral non-uniformity in the criticalcurrent density was considered (full line).
0.5
0.7
0.9
1.1
1.3
1.5
1.7
1.9
2.1
2.3
‐6 ‐4 ‐2 0 2 4 6
J c[A/m
2]
x 1e10
position with respect to the tape centre [mm]
Fig. 6. Nonuniformity of the tape across its width illustrated by (top) profileof the critical current density and (bottom) morphology of thesuperconducting layer. The profile of Jc (full line) was obtained from themeasured distribution of magnetic field above the tape carrying criticalcurrent at DC background field of 250 mT. Its linear approximation is shownby the dashed line. Electron microscope pictures were taken after remowingthe protecting Ag and stabilizing Cu layer. The inhomogenities – seen as“islands” in the superconducting layer - occupy bigger portion at tape edges.
IEEE/CSC & ESAS EUROPEAN SUPERCONDUCTIVITY NEWS FORUM, No. 22, October/November 2012.
4 of 7
The published version of this preprint appeared in IEEE Transactions on Applied Superconductivity 23, 5900406 (June 2013).

reduced current transport capability compared to the central part. Such reduction was observed in separate experiment mapping the magnetic field distribution above the tape transporting DC current. The variation of Jc across the tape width shown in Fig. 6 has been derived by an inversion calculation [16]. Also the structural investigations we performed by scanning electron microscopy revealed that there is significant difference in the superconducting layer morphology across the tape width. The structural analysis suggests that the volume ratio of inhomogeneities in the superconducting layer is increased towards both edges of the tape. Such non-uniformity can never be deduced from the Ic(B,) data. On the other hand at AC transport the dissipation depends on details of the flux front movement resulting in significant difference between two calculated curves in Fig. 5. However, the coincidence of the measured AC loss data with the calculation is not always the proof of a valid description of superconductor properties. We performed a series of AC loss calculations neglecting the magnetic-field dependence of the critical current density. Main motivation for such exercise was to check how much the improvement (or degradation) of the critical current would affect the AC loss. Here we show the results for three values of Jc that for the considered cross-section of superconducting layer (12 mm wide and 1 µm thick) correspond to the critical currents equal to 260, 334 and 390 A, respectively. The lowest and highest of these values are the extreme levels of critical currents that were calculated for individual turns in the coil taking the complex Ic(B,) of the tape into account. The middle value is obtained from an average of these values shown in Fig. 2.
The main conclusion is that the coil loss calculated assuming a field-independent critical current density Jc = const. – see Fig. 7 - is inversely proportional to Jc. Such behavior is typical for the self-field (transport) regime [17]. Maybe in a coil with significantly larger number of turns this
conclusion could not apply. Rather surprising however is that the result calculated in such simplified manner - assuming that the critical current density in all the winding is equal to that of the innermost turn - does very well match the experimental data. We believe this is a mere coincidence: As shown by the dashed line in Fig. 5 the slope of the loss curve obtained assuming Jc(B) dependence - without lateral non-uniformity - would be higher than that one resulting from a Jc = const. assumption. As we have found, the lateral non-uniformity of Jc with respect to the tape width has significant influence on the coil loss. This effect has already been found in the case of power transmission cable [18] or fault current limiter [19]. In the following we present the results of our analysis about the possible consequence of Jc variation along the tape length. In particular we calculated the AC loss and its distribution in the winding in the case when Jc in one of the turns is lower than in the rest.
V. INFLUENCE OF LOCAL IC DEGRADATION
In this section we show the results of AC loss calculation performed following the procedure described by the formulas (4) to (9) i.e. taking into account the complex Jc(B,) established on the short sample assuming however that the superconductor in some turns has Jc that is proportionally lowered at all the field magnitudes and orientations. First notable feature is that the AC loss is far less sensitive to a single turn degradation than the current-voltage curve. This is obvious when comparing the effect of reducing the critical current of the innermost turn to 93% of original value on the current-voltage curve in Fig. 4 with the AC loss result shown in Fig. 8. Even a drop to 75% of the original value does not produce an increase of AC loss in the coil that would be distinctively beyond the experimental noise.
1.E‐05
1.E‐04
10
Q[J/m
]
Imax [A]
No degradation
7% degradation of turn 1
25% degradation of turn 1
50
Fig. 8. Calculated effect of a reduced critical current in the innermost turn onAC loss: loss in the coil (full line from Fig. 5) compared with the resultobtained assuming critical current of the turn N.1 reduced to 93% and 75%,respectively. As one can see, such degradation produces an effect that ishardly visible.
1.E‐05
1.E‐04
1.E‐03
1.E‐02
1.E‐01
10 100 1000
Q[J/m
]
Imax [A]
Experiment
Calculation, Ic = 260 A
Calculation, Ic = 334 A
Calculation, Ic = 390 A
Fig. 7. AC loss in the coil calculated in simplified manner assuming aconstant critical current density, Jc, (lines) compared with experimental data(symbols). The results are shown for three values of Jc corresponding to thetape critical currents shown in the legend.
IEEE/CSC & ESAS EUROPEAN SUPERCONDUCTIVITY NEWS FORUM, No. 22, October/November 2012.
5 of 7
The published version of this preprint appeared in IEEE Transactions on Applied Superconductivity 23, 5900406 (June 2013).
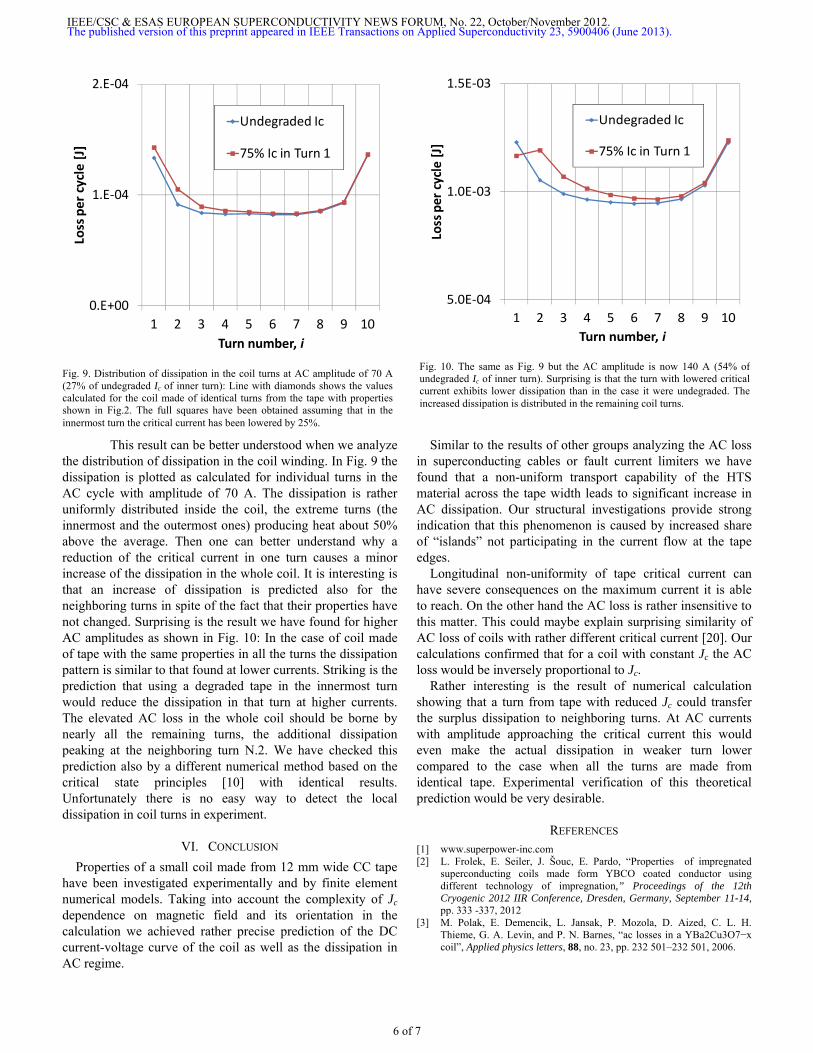
This result can be better understood when we analyze the distribution of dissipation in the coil winding. In Fig. 9 the dissipation is plotted as calculated for individual turns in the AC cycle with amplitude of 70 A. The dissipation is rather uniformly distributed inside the coil, the extreme turns (the innermost and the outermost ones) producing heat about 50% above the average. Then one can better understand why a reduction of the critical current in one turn causes a minor increase of the dissipation in the whole coil. It is interesting is that an increase of dissipation is predicted also for the neighboring turns in spite of the fact that their properties have not changed. Surprising is the result we have found for higher AC amplitudes as shown in Fig. 10: In the case of coil made of tape with the same properties in all the turns the dissipation pattern is similar to that found at lower currents. Striking is the prediction that using a degraded tape in the innermost turn would reduce the dissipation in that turn at higher currents. The elevated AC loss in the whole coil should be borne by nearly all the remaining turns, the additional dissipation peaking at the neighboring turn N.2. We have checked this prediction also by a different numerical method based on the critical state principles [10] with identical results. Unfortunately there is no easy way to detect the local dissipation in coil turns in experiment.
VI. CONCLUSION
Properties of a small coil made from 12 mm wide CC tape have been investigated experimentally and by finite element numerical models. Taking into account the complexity of Jc dependence on magnetic field and its orientation in the calculation we achieved rather precise prediction of the DC current-voltage curve of the coil as well as the dissipation in AC regime.
Similar to the results of other groups analyzing the AC loss in superconducting cables or fault current limiters we have found that a non-uniform transport capability of the HTS material across the tape width leads to significant increase in AC dissipation. Our structural investigations provide strong indication that this phenomenon is caused by increased share of “islands” not participating in the current flow at the tape edges.
Longitudinal non-uniformity of tape critical current can have severe consequences on the maximum current it is able to reach. On the other hand the AC loss is rather insensitive to this matter. This could maybe explain surprising similarity of AC loss of coils with rather different critical current [20]. Our calculations confirmed that for a coil with constant Jc the AC loss would be inversely proportional to Jc.
Rather interesting is the result of numerical calculation showing that a turn from tape with reduced Jc could transfer the surplus dissipation to neighboring turns. At AC currents with amplitude approaching the critical current this would even make the actual dissipation in weaker turn lower compared to the case when all the turns are made from identical tape. Experimental verification of this theoretical prediction would be very desirable.
REFERENCES [1] www.superpower-inc.com [2] L. Frolek, E. Seiler, J. Šouc, E. Pardo, “Properties of impregnated
superconducting coils made form YBCO coated conductor using different technology of impregnation,” Proceedings of the 12th Cryogenic 2012 IIR Conference, Dresden, Germany, September 11-14, pp. 333 -337, 2012
[3] M. Polak, E. Demencik, L. Jansak, P. Mozola, D. Aized, C. L. H. Thieme, G. A. Levin, and P. N. Barnes, “ac losses in a YBa2Cu3O7−x coil”, Applied physics letters, 88, no. 23, pp. 232 501–232 501, 2006.
0.E+00
1.E‐04
2.E‐04
1 2 3 4 5 6 7 8 9 10
Loss per cycle [J]
Turn number, i
Undegraded Ic
75% Ic in Turn 1
Fig. 9. Distribution of dissipation in the coil turns at AC amplitude of 70 A(27% of undegraded Ic of inner turn): Line with diamonds shows the valuescalculated for the coil made of identical turns from the tape with propertiesshown in Fig.2. The full squares have been obtained assuming that in theinnermost turn the critical current has been lowered by 25%.
5.0E‐04
1.0E‐03
1.5E‐03
1 2 3 4 5 6 7 8 9 10
Loss per cycle [J]
Turn number, i
Undegraded Ic
75% Ic in Turn 1
Fig. 10. The same as Fig. 9 but the AC amplitude is now 140 A (54% of undegraded Ic of inner turn). Surprising is that the turn with lowered critical current exhibits lower dissipation than in the case it were undegraded. The increased dissipation is distributed in the remaining coil turns.
IEEE/CSC & ESAS EUROPEAN SUPERCONDUCTIVITY NEWS FORUM, No. 22, October/November 2012.
6 of 7
The published version of this preprint appeared in IEEE Transactions on Applied Superconductivity 23, 5900406 (June 2013).
[4] F. Grilli and S. P. Ashworth, “Measuring transport ac losses in YBCO-coated conductor coils”, Superconductor Science and Technology 20, p. 794, 2007.
[5] E. Pardo, J. Šouc, M. Vojenčiak, and F. Gömöry, “AC loss and voltage signal in a pancake coil made of coated conductor with ferromagnetic substrate,” IEEE Transactions on Applied Superconductivity 19, no. 3, p. 2223, 2009.
[6] E. Pardo, J. Šouc, and J. Kováč, “AC loss in ReBCO pancake coils and stacks of them: modelling and measurement”, Superconductor Science and Technology 25, p. 035003, 2012.
[7] W. Yuan, T. Coombs, J. Kim, C. Han Kim, J. Kvitkovic, and S. Pamidi, “Measurements and calculations of transport ac loss in second genera- tion high temperature superconducting pancake coils”, Journal of Applied Physics 110, no. 11, pp. 113 906–113 906, 2011.
[8] J. Clem, J. Claassen, and Y. Mawatari, “AC losses in a finite Z stack using an anisotropic homogeneous-medium approximation”, Superconductor Science and Technology, 20, p. 1130, 2007.
[9] M. Ainslie, V. Rodriguez-Zermeno, Z. Hong, W. Yuan, T. Flack, and T. Coombs, “An improved FEM model for computing transport AC loss in coils made of RABiTS YBCO coated conductors for electric machines”, Superconductor Science and Technology 24, p. 045005, 2011.
[10] E. Pardo, “Modeling of coated conductor pancake coils with a large number of turns,” Supercond. Sci Technol. 21, art. nr.065014, 2008.
[11] E. Pardo, M. Vojenčiak, F. Gömöry, J. Šouc, “Low-magnetic-field dependence and anisotropy of the critical current density in coated conductors, “ Supercond. Sci Technol. 24, art. nr. 065007(2011)
[12] F. Gömöry, M. Vojenčiak, E. Pardo, M. Solovyov, J. Šouc, “ AC losses in coated conductors,” Supercond. Sci Technol. 23, art.nr. 034012, March 2010
[13] C. P. Bean, “Magnetization of hard superconductors,” Phys. Rev. Letters 8, pp. 250-253, March 1962.
[14] E. Pardo, F. Gömöry, J. Šouc, J. M. Ceballos, “Current distribution and ac loss for a superconducting rectangular strip with in-phase alternating current and applied field,” Supercond. Sci Technol. 20, no. 4, pp. 351–364, 2007.
[15] W. J. Carr Jr. “On the theory of the electric field and current density in a superconductor carrying transport current,” Physica C 425 pp155-165, September 2005
[16] M. Solovyov, J. Šouc, F. Gömöry, “ Investigation of superconductor uniformity in CC tapes by magnetic field mapping,” Physics Procedia 36, pp. 617-622, 2012
[17] W. T. Norris, “Calculation of hysteresis losses in hard superconductors carrying ac: isolated conductors and edges of thin sheets,” J. Phys. D 3, pp. 489-507, April 1970.
[18] N. Amemiya, Z. Jiang, Z. Li, M. Nakahata, T. Kato, M. Ueyama, N. Kashima, S. Nagaya, S. Shiohara, “Transport losses in single and assembled coated conductors with textured-metal substrate with reduced magnetism”, Physica C 468, pp.1718–1722, June 2008
[19] D. N. Nguyen, F. Grilli, S. P. Ashworth and J. O Willis, “AC loss study of antiparallel connected YBCO coated conductors,” Supercond. Sci Technol. 22, art.nr. 055014, April 2009
[20] Sastry Pamidi “Total AC Loss Measurement on 2G Superconducting Coils”, Paper S-I-1042 presented at 3rd International Conference on Superconductivity and Magnetism, 29 April-4 May 2012, Istanbul, Turkey
IEEE/CSC & ESAS EUROPEAN SUPERCONDUCTIVITY NEWS FORUM, No. 22, October/November 2012.
7 of 7
The published version of this preprint appeared in IEEE Transactions on Applied Superconductivity 23, 5900406 (June 2013).