academic achievements of children in immigrant families · 2016-06-29 · academic achievements of...
TRANSCRIPT

Educational Research and Review Vol. 1 (8), pp. 286-318, November 2006 Available online at http://www.academicjournals.org/ERR © 2006 Academic Journals Full Length Research Paper
Academic Achievements of Children in Immigrant Families
Wen-Jui Han
Columbia University School of Social Work, 1255 Amsterdam Avenue, New York, NY 10027. Email:
Accepted 27 October, 2006
Utilizing data on approximately 16,000 children from the Early Childhood Longitudinal Survey-Kindergarten Cohort and a rich set of mediating factors on 16 immigrant groups, this paper examined the associations between children’s immigrant generation status and their academic performance. The changes in academic achievements during kindergarten and first-grade were also examined to explore the varying learning paces exhibited by children from different countries of origin. Results indicate that, compared to third and later generation non-Hispanic white children, children of Latin American regions tended to have lower reading and math scores, while children of Asian regions tended to have higher reading and math scores. In addition, although children of immigrants may have either higher (e.g., children from East Asia) or lower scores (e.g., children from Mexico) by first-grade compared to third and later generation non-Hispanic white children, the former generally learned skills at faster paces, thus widening (e.g., for children from East Asia) or narrowing (e.g., for children from Mexico) academic achievement gaps. Child and family characteristics accounted for a large share of the differences in children’s academic achievements. Home, school, and neighborhood environments may also matter but to a lesser extent. Research implications are discussed. Keywords: academic achievements; immigrants; immigrant generation status; neighborhood characteristics; school environments.
INTRODUCTION Academic Achievements of Children in Immigrant Families The United States is a nation shaped by immigration. In the 1930s, the 14.2 million foreign-born individuals had migrated mainly from Northern or Western Europe and made up 12 percent of the total population, while in 2003 the 33.5 million foreign-born individuals had migrated mainly from Latin America or Asia and represented 11.7% of the total population. Now nearly 17 percent of children under age 18, or 11.5 million children, are living with a foreign-born householder, and the percentage is almost double for children under 6 years old (U.S. Census Bureau, 2004). The unique cultural traditions of the new immigrant groups present challenges to understanding their children's developmental trajectories. Despite a large body of research demonstrating the
importance of early childhood experiences to later cognitive and social development (for review see Shonkoff and Phillips, 2000), there is a noticeable void in research on preschool and school-aged children of immigrants (Board on Children and Families, 1995; Booth, Crouter, and Landale, 1997; Nord and Griffin, 1999), as well as a lack of longitudinal research to help us understand a variety of time-dependent aspects of their development.
This paper examines the developmental experiences of young children of immigrants in the context of several individual, family, home environment, and school and neighborhood characteristics that theories and empirical studies have suggested are important to children’s development. Specifically, using a longitudinal dataset with a large, contemporary sample of children from the Early Childhood Longitudinal Survey-Kindergarten Cohort

(ECLS-K), the academic achievements of native-born (i.e., third and later generations) and foreign-born (i.e., first- or second-generation) children entering kindergarten in the fall of 1998 are examined.
This approach allows us to explore the likely mechanisms by which immigrant generation status (hereafter, generation status) may be associated with child development. Child Development Theoretical Framework Ecological models developed by Bronfenbrenner (1979, 1986) have substantially benefited the child development field over the past 30 years. Specifically, this model emphasizes that the family's interaction with other groups and institutions will influence how children adapt to non-familial environments (e.g. school), and has identified a variety of risk and protective factors for children’s optimum development, such as child, parent, family, and environmental characteristics (for reviews, Belsky, 2001; Bornstein et al., 2001; Lamb, 1998; Johnson, et al., 2003; Shonkoff and Phillips, 2000; Weinraub and Jaeger, 1990). Protective and/or risk factors attributable to the children themselves may involve age, gender, health, or temperament; factors attributable to parents may involve demographic characteristics (e.g., age, education, marital status, employment) and the quality of the parent-child relationship (e.g., maternal depression, home environment); and factors attributable to the family and the external environment may involve resources available inside or outside the home (e.g., family income, the presence of two parents, and the type and quality of early child care).
While Bronfenbrenner’s theory is generally valuable in understanding child development, issues important to children’s development in immigrant families such as culture (Ogbu, 1978, 1981, 1988), discrimination, racism, and segregation are more fully addressed by the integrative model developed by García Coll and her colleagues (1996, 2004). Drawing upon social stratification and ecological theory, this model assumes that, in addition to children’s (e.g., age, temperament, biological factors) and families’ (e.g., structure and roles, values and goals) characteristics, children’s daily experiences and surrounding environments contribute to their behavioral, emotional, and cognitive development and are closely tied to a social position significantly influenced by discriminatory and oppressive forces. The model further assumes that neighborhood and school environments are in turn affected to either promote or inhibit the development of minority children and families. Social position (e.g., race/ethnicity, social class, and gender), racism (e.g., prejudice, discrimination, institutionalized or symbolic oppression), and segregation
Wei-Jui Han 287
(e.g., residential, economic, and social and psychological segregation) are considered important components of school and neighborhood's impact on learning environments. Borrowing from all of this research, child development in immigrant families is hypothesized to be related to (at least) 1) family background, 2) parental expectations, aspirations, and educational practices, and 3) school and neighborhood resources (Chao, 2001; Conchas, 2001; García Coll, et al., 1996; Fuligni, 1997; Fuligni, Tseng and Lam, 1999; Kao and Tienda, 1995; Louie, 2001; Rumbaut, 1994, 1995; Suárez-Orozco and Suárez-Orozco, 2001).
In regard to the first hypothesis, theory and previous empirical evidence suggest that family socioeconomic background may partially explain the academic success of many European and Asian immigrants and the academic struggles experienced by many Latin American immigrants. This is most likely linked to the fact that, compared to the native-born population, European and Asian immigrants have similar or even higher parental educational achievement and household incomes, while Latin American immigrants tend to have lower levels of both (U.S. Census Bureau, 2004).1 However, even when studies have controlled for family socioeconomic status, a significant association between generation status and academic achievement persists (Fuligni, 1997; Kao and Tienda, 1995; Rumbaut, 1997). This suggests that family socioeconomic status alone would not be sufficient to explain the variations in academic achievements between foreign-born and native-born children.
Ethnographic and qualitative studies help explain such variations. There is some evidence to show that children from Central America, Vietnam, India, and East Asia may be raised in family environments that strongly support academic achievement (Caplan et al., 1991; Chao, 1994, 2001; Gibson, 1991; Gibson and Bhachu, 1991; Fuligni, 1997; Louie, 2001). For example, personal accounts from a recent study describe a Latin American father who sat with his children while they were doing homework despite not understanding the material, which conveyed his dedication to education to his children and helped shape their commitment to academic performance (Pérez Carre�n, Drake and Barton, 2005). Serious attitudes such as this are a manifestation of high academic expectations and aspirations for their children, and significantly influence adolescents’ own attitudes and behavior. Consistent with this, previous studies have shown the great effort and time devoted by adolescent children of immigrants to doing homework with the desire to achieve
1 For example, in 2004, for the population aged 25 and over, the percentages of foreign-born immigrants from Europe and Asia that held a bachelor’s degree or above were 36% and 50%, respectively, compared to 26% of the native-born population. Only about 11% of the foreign-born population from Latin America had achieved the same education (with only 4% of immigrants from Mexico having achieved such education) (U.S. Census Bureau, 2004).

288 Educ. Res. Rev. academic success (Caplan et al., 1991; Gibson, 1991; Gibson and Bhachu, 1991; Fuligni, 1997; Louie, 2001; Rosenthal and Feldman, 1991). Thus, the second hypothesis incorporates the family’s values, beliefs, and goals to account for their intergenerational transfers to their children. Although previous studies have found many factors related to home environment and parental educational practices, 9 variables seem to be the most important (Smolensky and Gootman, 2003): maternal depression, family routines, and the parents’ educational expectations, the importance they place on having skills before attending kindergarten, their participation in school events, the difficulty they face in attending school events, the learning materials they provide at home, provision of extracurricular activities that may promote academic performance and/or physical/artistic skills, and use of physical discipline. For example, previous studies indicate that children benefit more cognitively if they have less depressed mothers (NICHD early Child Care Research Network [NICHD ECCRN], 1999; Peterson and Albers, 2001), a high quality home environment (enriched by the availability of and frequent interaction with books) (Bradley, 1995; Bradley et al., 1989), or attend center-based care (NICHD ECCRN, 1999, 2000, 2002a). Children benefit more socioemotionally if they participate in well-organized, positive extracurricular activities (such as sports, lessons, and clubs) (Mahoney, 2000; McNeal, 1995; Moore and Halle, 1997).
A third hypothesis concerns the impact of school and neighborhood resources. Previous studies have shown that schools serving primarily children of color or living in poverty, for example, are likely to have fewer resources, weaker academic focus, lower teacher expectations, and constricted curriculum (Griffith, 2000; Matute-Bianchi, 1986; Ogbu, 1991; Ogbu and Simons, 1998; Valencia, 2000; Valenzuela, 1999), which may adversely affect children’s learning experiences and academic performance (Masten, 1994) and is essentially a form of segregation affecting children’s learning (García Coll, et al., 1996, 2004). Previous studies have also shown that differential treatment of students by race or ethnicity – such as viewing Mexican children as less industrious than Asian American children – has hindered the achievement of some groups of children (Conchas, 2001; Moody, 2001; Suárez-Orozco and Suárez-Orozco, 1995, 2001). A large body of educational literature has identified factors important to the promotion of children’s learning (Bernard, 1991; Borman and Overman, 2004; Crosnoe, 2005; Griffith, 2000, 2003; Herdenson and Milstein, 1996; Huff and Trump, 1996; Lee and Burkham, 2002; McNeal, 1997; Moody, 2001). Among them, 7 factors that may tap contextual (dis)advantages are teachers’ and school administrators’ qualifications, school student composition (e.g., minority representation), students’ academic performance, school’s efforts in providing an optimal learning experience (e.g., school’s
communication to parents about children’s learning process and curriculum, teacher’s efforts in helping students’ learning process), parental involvement, and school safety. These attributes have been identified largely through their associations with student achievement test scores. In addition, studies have shown that a safe and orderly school environment is linked to the affirmation of healthy social behavior that is characteristic of resilient children (Lee, Winfield and Wilson, 1991; Masten, 1994).
Regarding the influence of neighborhoods, it is known that the majority of new immigrants to the U.S. settle and live in inner-city areas, where the urban problems of poverty, unemployment, crime, and social disorganization have historically been most intense (Sampson and Groves, 1989; Wilson, 1987) and which exacerbate the negative effects of the low socioeconomic status observed in some immigrant families (e.g, Latin American) (Pessar, 1995; Portes and MacLeod, 1999). Research has consistently found associations between stressful environmental conditions, such as poverty or unemployment, and negative parental psychological functioning and parenting behavior, all of which adversely affect child cognitive and socio-emotional development (Conger et al., 1992; Elder et al., 1992; McLoyd, 1990; McLoyd and Wilson, 1991).
Taken together, developmental theories and the integrative model put forward by García Coll and her colleagues (1996, 2004) identify a rich set of factors related to children's learning experiences and possible links between generation status and child development. All of these theoretical perspectives emphasize the importance of examining child development in an ecological context, given that children’s learning is heavily influenced by culturally guided family practices and interactions. At the same time, children’s surrounding environments (e.g., relatives, neighborhood, and ethnic community) shape their daily learning experiences. However, given that previous research on child development has mainly focused on middle-class white children and research on immigrants has mainly focused on adolescents, we do not know whether the conclusions from previous studies apply to young children from different cultural backgrounds (Hernandez, 1999; Siantz, 1997).
Taking advantage of the large-scale, longitudinally-designed ECLS-K data set, this study carefully categorizes immigrant groups based on their country of origin, reasons for migrating to the US, and cultural background to examine whether generation status is associated with children’s academic achievements. Additionally, child/parent/family characteristics, home environment and parental educational practices (e.g., learning activities at home, participation in extracurricular activities and school events), and school (e.g., student composition and average academic performance, parent-

tal involvement, school safety) and neighborhood (e.g., residential neighborhood quality) environments are considered possible mediating factors for any such associations. Three hypotheses are derived from the above research and models. First, if the child and family characteristics are important to the links between generation status and children’s academic achievements, then we should see a reduction in the magnitude of the estimate of generation status after controlling for child and family characteristics (i.e., child and family characteristics may mediate the association between generation status and children’s academic achievements). Second, if home environment is crucial to the links between generation status and children’s academic achievements, then we should see a reduction in the generation status magnitude after controlling for home environment. Finally, if school and neighborhood environments are critical to the links between generation status and children’s academic achievements, then we should see a reduction in the generation status magnitude after controlling for the school and neighborhood backgrounds. DATA The ECLS-K, collected by the U.S. Department of Education's National Center for Educational Statistics, consists of a nationally representative cohort of 21,260 children who entered kindergarten in the fall of 1998 and who will be followed longitudinally until twelfth grade. These children were drawn randomly from a nationally representative sample of about 1,000 U.S. public and private schools that offer kindergarten. In addition, the ECLS-K includes an over-sampling of Asian/Pacific Islander children, which allows for more detailed analyses than other national data sets that lack sufficient numbers of children of Asian origin. Given that slightly more than 1% of children in the ECLS-K did not complete a direct assessment of academic measures due to limited English proficiency, the study sample may not truly be nationally representative and may particularly affect the representation of children of Hispanic or Asian origin as detailed below.
The present study utilizes the data available as of this writing, including the fall and spring of kindergarten and the spring of first grade in which the full sample of children were interviewed (a random sample of approximately 27% of the children were also interviewed in the fall of first grade, mainly about their experiences during the summer between kindergarten and first grade). Direct assessments of children’s academic achievements (i.e., reading and math skills) are examined, as well as information gathered from parents on family characteristics and parental involvement in home learning and school activities; from teachers and school adminis-
Wei-Jui Han 289 trators on parental involvement and classroom and school characteristics; and from observational ratings of school environments by study supervisors. More information on the ECLS-K can be found in the NCES (2002) codebooks, in research reports published by Denton and West (2002) and Lee and Burkham (2002), and in a research article by Magnuson et al (2004).
The study sample consists of approximately 16,000 children for whom information was available on country of origin, immigrant status, and at least one outcome variable at the spring of first-grade. Over 90% of the 4,000 excluded cases were not used because of missing generation status or country of origin data. The raw data suggest that the children with missing information tended to be shorter and lighter, have mothers who are younger, less educated, and less likely to be married at child’s birth, and to have lower family socioeconomic status and move more frequently. The regression estimates may be thus biased downward due to these attributes. MEASURES Immigrant Generation Status and Country of Origin The parent respondent was asked in the spring of first grade to report whether s/he was born in the U.S., and in the spring of kindergarten whether the child was born in the U.S.2 These two questions were used to identify a family’s immigrant status and whether or not the child was a first- (child not born in U.S.) or second-generation (child born in U.S. with at least one parent born outside of U.S.) immigrant. If the parent reported s/he or the child was not born in the U.S., the parent was also asked to report the country from which s/he came. A total of 16 regions were identified in this study based on country of origin, cultural background, and reasons for migrating to the U.S. (e.g., Vietnam, Thailand, Cambodia, and Laos were categorized together primarily because they are countries of refugee origin resulting from the Vietnam War): North America (e.g., Canada), Europe (e.g., Denmark, Greece, France, Hungary, including Russia), Puerto Rico (U.S. commonwealths such as Virgin Islands [n=20], Guam [n=3], and American Samoa [n=3] were not included due to small sample sizes and their different cultural backgrounds from Puerto Rico)3, the Caribbean (e.g., Bahamas, Jamaica, Haiti; including mainly English-speaking or French-speaking countries), Central America (e.g., Belize, Costa Rica, El Salvador), South America (e.g., Argentina, Brazil, Colombia, Peru), Dominican Republic, Mexico, Cuba, East Asia (e.g., China, Japan, Korea),
2 Because the interview only asked the nativity of one parent, it is likely that not all children of immigrants would be identified in the ECLS-K (e.g., if we only had information on the mother for a native-born child with a native-born mother and a foreign-born father). Thus, estimates presented here may be biased downward. 3 It is important to note that although children from Puerto Rico were also identified as first- or second-generation if they themselves or their parent(s) were not born in the U.S. mainland, these children are U.S. citizens. However, this paper acknowledges the importance of the geographical and cultural differences between children from Puerto Rico and those born in the U.S. and thus separates them in the analyses.

290 Educ. Res. Rev. Table 1. Percentage Distribution of Country Origin by Immigrant Generational Status.
First Generation
Second Generation
North America (e.g., Canada) (n=46) 3.13 1.30 Europe (including Russia) (n=282) 13.78 9.34 Caribbean (e.g., Bahamas, Jamaica; including mainly English-speaking or French-speaking countries) (n=91)
0.84 2.72
Puerto Rico (n=74) 3.13 2.55 Central America (e.g., Belize, Costa Rica, El Salvador) (n=165) 2.30 6.66 South America (e.g., Argentina, Brazil, Colombia, Peru) (n=168) 5.01 6.22 Dominican Republic (n=60) 1.46 3.33 Mexico (n=897) 25.68 33.46 Cuba (n=46) 1.25 1.73 East Asia (e.g., China, Japan, Korea) (n=212) 10.65 6.96 Vietnam/Thailand/Cambodia/Laos (n=147) 1.46 6.05 Other South East Asia (e.g., Indonesia, Malaysia, Philippines) (n=262) 7.31 9.81 India (n=109) 4.38 3.80 South-Central/West Asia (e.g., Armenia, Iraq) (n=78) 0.63 3.24 Africa (e.g., Ethiopia, Chad, Sudan, South Africa, Ghana) (n=46) 1.25 1.73 Oceania (Solomon Islands, Marshall Islands; excluding Australia) (n=110) 17.74 1.08 N 479
(2.78%) 2313
(13.44%) Vietnam/Thailand/Cambodia/Laos, other Southeast Asia (e.g., Indonesia, Malaysia, Philippines), India, South-Central/Western Asia (e.g., Armenia, Iraq), Africa (e.g., Ethiopia, Chad, Sudan, South Africa, Ghana)4, and Oceania (e.g., Solomon Islands, Marshall Islands; Australia was excluded due to its significant cultural difference from other Oceania countries and because there was only 1 case from Australia available in the sample). Because previous studies have found that second-generation immigrant adolescents generally perform better academically than their first-generation counterparts (e.g., Kao and Tienda, 1995), immigrant generation status (2 generations) and country of origin (16 regions) were combined to create 32 dummy variables. Details on the distribution of generation status by country of origin are provided in Table 1. Approximately 16% of the ECLS-K sample is identified as either a first- (3%) or second-generation (13%) child of immigrants. About 40% of first-generation children originated from Latin American regions (with more than half of those from Mexico), another quarter from Asian regions, and then followed by Oceania. Approximately 50% of second-generation children had parents who came originally from Latin American regions (again more than half from Mexico), followed by another third originating from Asian regions.
For children of third and later generations (both child and parent born in the U.S.), race/ethnicity was identified with five groups: non-Hispanic white, non-Hispanic black, Hispanic, Asian, and other (including multiracial). Table 2 provides the distribution of these groups, with non-Hispanic white occupying more than half of the total sample. It is important to note that a sample as young as this is more likely to have second-generation children compared to samples used in previous studies of adolescent immigrants (who
4 It may be preferable to separate white and black immigrants from Africa due to differences in culture and societal treatment in their home countries and the U.S. However, given that only 1 out of 6 first-generation African children was white (13 out of 40 for the second generation), it would not be statistically possible to make such distinctions. Nonetheless, the impacts of not making this separation are discussed below whenever possible.
were more likely to be first-generation). Academic Achievements
Direct assessments of children’s competence in reading (language and literacy) and mathematics were collected during the fall and spring of kindergarten and the spring of first grade via one-on-one testing sessions. These assessments were created especially for the ECLS-K study with some items adapted from existing instruments such as the Peabody Individual Achievement Test-Revised and the Woodcock-Johnson Psycho-Educational Battery-Revised. A brief language screening was administered to 15% of children who were identified by teachers or school records as having a non-English language background. Approximately 51% of these children (7% of the overall sample) scored below the cut-off point and received a reduced version of the assessments in order to be included in the analyses.5 Among low-scorers who did not complete the assessment and thus were not included in the analyses (n=317 in this sample), 75% were originally from Mexico, followed by another 5% who were third and later generation Hispanic. All in all, approximately 90% of the cases were of Hispanic and 9% of Asian origin, and the raw data suggest that these children had different attributes from their counterparts (e.g., more children under 18 and more adults over 18 at home, poorer and lower socioeconomic status, younger and less-educated mothers, parents less likely to work full-time, child less likely to attend center-based care before kindergarten). Given these different family backgrounds, it is possible the coefficients in the regression analyses might be underestimated for children of Hispanic origin, and to some extent for children of Asian origin. However, it is not clear whether the coefficients would be underestimated after controlling for the three sets of mediators as described above given children may respond differently (or have
5 It should be noted that by taking reduced versions of the tests, the test scores might not reflect the “true” ability of the child.

Wei-Jui Han 291
Table 2. Selected Sample Characteristics and Mean Academic Skills by Immigrant Generational Status and Race/Ethnicity of Children in Third+ Generation
First Generation
Second Generation
Third+ Generation (n=14411)
Full sample
(n=479) (n=2313) Non-Hispanic White
(n=9369)
Non-Hispanic Black
(n=2308)
Hispanic (n=1590)
Asian (n=489)
Other (n=655)
Reading skills Fall kindergarten 52.26 (10.49) 50.95 (11.43) 52.23 (9.54) 47.39 (9.12) 47.80 (9.91) 50.89 (9.61) 46.61 (10.15) 50.74 (9.99) Spring kindergarten 50.98 (10.21) 51.19 (10.67) 52.16 (9.19) 47.14 (9.96) 49.01 (9.82) 50.76 (9.84) 47.98 (10.13) 50.84 (9.79) Spring first grade 51.01 (9.24) 50.52 (9.68) 52.30 (8.85) 46.79 (10.39) 48.90 (9.45) 50.08 (9.61) 47.55 (10.67) 50.74 (9.56) Math skills Fall kindergarten 48.88 (10.21) 48.08 (10.82) 53.31 (9.34) 46.66 (8.72) 47.36 (9.56) 51.37 (9.61) 47.55 (10.01) 50.77 (9.97) Spring kindergarten 49.25 (10.12) 48.71 (10.78) 53.23 (9.03) 46.12 (9.37) 48.01 (9.54) 50.64 (9.20) 48.35 (9.62) 50.84 (9.83) Spring first grade 49.47 (9.63) 49.17 (9.80) 52.87 (8.79) 45.68 (9.93) 48.52 (9.04) 49.49 (9.04) 47.83 (9.62) 50.64 (9.55) Child Characteristics Boy (%) 48.85 50.97 51.41 50.30 51.32 52.35 51.15 51.14 Child age in months, fall kindergarten
68.65 (4.74) 67.46 (4.23) 68.91 (4.41) 68.25 (4.44) 68.16 (4.38) 67.52 (4.49) 69.02 (4.90) 68.51 (4.45)
Low birth weight (<2500 g) (%) 18.37 10.64 8.70 15.34 11.07 8.38 9.47 10.36 Premature (>=2 weeks early) (%) 15.74 15.39 16.54 18.74 17.34 10.64 15.32 16.54 Height, fall kindergarten 44.46 (2.35) 44.35 (2.13) 44.76 (2.15) 45.09 (2.24) 44.27 (2.10) 43.81 (2.18) 44.83 (2.15) 44.67 (2.18) Weight, fall kindergarten 45.30 (8.22) 46.43 (9.63) 46.25 (8.15) 47.77 (9.78) 46.51 (9.38) 43.55 (9.28) 47.16 (9.11) 46.43 (8.78) Number of moves since birth 2.54 (1.21) 1.94 (1.08) 2.07 (1.34) 2.14 (1.28) 2.23 (1.34) 1.93 (1.06) 2.31 (1.45) 2.10 (1.30) Center-based care before entering kindergarten (%)
39.76 37.17 49.91 34.50 34.22 29.66 31.08 43.37
Parent Characteristics Mother’s age 32.82 (6.40) 33.88 (6.07) 34.01 (5.87) 32.18 (8.53) 31.67 (6.77) 34.44 (7.52) 32.61 (7.51) 33.47 (6.56) Parent’s education (whichever is higher) (%)
Below high school (<12) 18.86 23.75 3.43 14.86 16.50 11.17 8.45 9.66 High school degree (=12) 18.86 23.30 22.55 37.64 31.39 26.75 27.54 25.62 Some college (>=13 and <15) 20.76 21.51 33.74 34.57 36.08 30.91 42.10 32.30 College and plus (>=15) 41.53 31.44 40.28 12.93 16.03 31.17 21.91 32.42 Mother married at birth (%) 84.38 75.72 83.94 29.70 60.10 76.08 48.12 72.56 Mother currently works full-time (%)
33.58 41.35 43.72 59.12 47.46 47.65 44.04 45.54
Family Characteristics

292
E
duc.
Res
. Rev
.
T
able
2. C
ontin
ued
N
umbe
r of p
erso
ns a
ge <
18 in
th
e ho
useh
old
2.40
(1.2
1)
2.54
(1.1
4)
2.38
(1.0
0)
2.66
(1.4
2)
2.50
(1.2
1)
2.75
(1.6
6)
2.77
(1.4
9)
2.47
(1.1
5)
Soc
ial e
cono
mic
sta
tus
(SE
S)
pres
tigio
us s
core
0.
00 (0
.92)
-0
.15
(0.8
8)
0.22
(0.7
3)
-0.3
8 (0
.75)
-0
.24
(0.7
0)
-0.0
5 (0
.75)
-0
.16
(0.8
4)
0.02
(0.8
0)
Hom
e la
ngua
ge is
not
Eng
lish
(%)
60.4
6 60
.49
0.71
0.
75
27.6
9 44
.14
2.29
14
.27
Reg
ion
of r
esid
ence
N
orth
east
17
.95
19.3
7 21
.12
13.2
6 13
.90
7.98
9.
92
18.2
8 M
id-W
est
15.8
7 10
.38
32.3
2 17
.59
15.5
3 13
.29
46.1
1 25
.37
Sou
th
35.0
7 25
.34
32.3
3 61
.05
26.7
3 16
.77
17.8
6 33
.81
Wes
t 31
.11
44.9
2 14
.23
8.10
43
.84
61.9
6 26
.11
22.5
5 Lo
catio
n of
res
iden
ce
Rur
al
4.59
2.
46
17.3
4 9.
27
5.60
3.
07
29.7
7 12
.89
Sm
all t
own
7.10
4.
24
11.1
2 3.
51
4.53
21
.47
13.7
4 8.
85
Larg
e to
wn
1.46
0.
61
4.15
4.
68
1.45
0.
20
1.83
3.
22
Mid
-siz
e su
burb
an
5.85
4.
06
9.00
5.
55
4.21
4.
70
5.80
7.
10
Larg
e-si
ze s
ubur
ban
30.2
7 32
.43
29.4
1 23
.09
28.9
3 27
.40
16.9
5 28
.41
Mid
-siz
e ci
ty
23.8
0 18
.07
20.1
5 25
.78
20.7
5 16
.97
19.2
4 20
.66
Larg
e-si
ze c
ity
26.9
3 38
.13
8.83
28
.12
34.5
3 26
.18
16.2
7 18
.87
Per
cent
of s
ampl
e (%
) 2.
78
13.4
4 54
.46
13.4
2 9.
24
2.84
3.
81
100
Not
e. S
kills
in R
eadi
ng, M
ath,
and
Gen
eral
Kno
wle
dge
are
stan
dard
ized
sco
res
with
mea
n of
50
and
stan
dard
dev
iatio
n of
10.
Sta
ndar
d de
viat
ions
are
in p
aren
thes
es.
See
App
endi
x Ta
ble
for
deta
iled
defin
ition
s of
sam
ple
char
acte
ristic
s.

Wei-Jui Han 293
Table 3. Mean Academic Skills by Country of Origin/Immigrant Generational Status and Race/Ethnicity of Children in Third and Later Generation.
Reading Skills Math Skills Fall
kindergarten Spring
kindergarten Fall First-
grade Fall
kindergarten Spring
kindergarten Fall First-
grade First generation
North America 54.24 (11.46)
55.61 (9.04)
53.59 (7.84)
52.37 (8.31)
52.73 (9.62)
53.22 (7.45)
Europe (including Russia) 52.30 (10.34)
51.58 (10.10)
54.05 (7.79)
51.49 (8.60)
50.87 (8.57)
52.98 (7.41)
Caribbean 42.90 (3.05)
44.28 (6.07)
48.15 (6.43)
41.38 (7.22)
43.87 (11.28)
47.72 (4.07)
Puerto Rico 46.72 (15.36)
42.23 (14.75)
44.09 (15.39)
44.74 (12.97)
43.10 (9.74)
41.57 (12.88)
Central America 51.85 (4.82)
53.92 (6.82)
51.42 (8.21)
48.52 (8.48)
49.54 (7.12)
49.87 (7.50)
South America 45.32 (9.86)
46.78 (8.40)
47.97 (9.41)
47.01 (10.73)
47.24 (7.38)
45.32 (11.36)
Dominican Republic 45.68 (5.14)
48.18 (7.84)
44.95 (5.92)
42.85 (6.80)
42.74 (7.29)
44.22 (6.79)
Mexico 47.95 (12.95)
45.34 (9.72)
45.17 (8.46)
42.95 (9.12)
43.75 (10.25)
46.29 (8.98)
Cuba 42.67 (7.72)
46.37 (6.65)
46.07 (3.75)
45.21 (5.93)
49.12 (3.44)
48.25 (7.91)
East Asia 55.09 (9.40)
55.67 (7.83)
56.42 (8.14)
55.48 (9.08)
56.11 (7.88)
54.68 (10.62)
Vietnam/Thailand/Cambodia/Laos 56.02 (5.47)
53.15 (10.65)
54.99 (7.44)
59.39 (9.71)
59.34 (12.17)
54.21 (9.15)
Other Southeast Asia 52.25 (10.55)
53.83 (10.40)
55.20 (7.98)
52.50 (9.86)
51.43 (9.24)
49.28 (8.37)
India 59.22 (9.24)
55.92 (10.48)
55.69 (8.49)
55.02 (9.23)
54.79 (9.16)
52.14 (8.69)
South-Central/Western Asia 50.60 (0.00)
52.15 (0.50)
37.91 (0.64)
40.84 (13.88)
43.50 (5.48)
41.11 (7.26)
Africa 55.59 (4.54)
55.79 (7.97)
57.81 (6.96)
59.49 (2.70)
57.86 (8.70)
53.62 (7.27)
Oceania (excluding Australia) 52.26 (9.26)
50.92 (9.24)
50.88 (7.17)
50.78 (8.69)
50.78 (9.39)
49.85 (9.40)
Second generation
North America 52.00 (9.16)
52.84 (10.59)
52.02 (10.35)
54.03 (7.07)
52.17 (9.80)
50.88 (10.49)
Europe (including Russia) 52.74 (10.01)
52.31 (9.90)
52.69 (9.69)
53.28 (10.03)
53.75 (10.14)
53.09 (9.18)
Caribbean 51.40 (9.13)
51.56 (9.65)
50.31 (9.53)
47.89 (8.10)
47.66 (9.60)
46.33 (9.36)
Puerto Rico 47.81 (9.26)
47.54 (10.91)
47.38 (9.58)
44.74 (9.08)
44.74 (12.16)
45.48 (11.67)
Central America 48.01 (9.62)
49.67 (9.79)
48.63 (9.11)
44.60 (9.43)
47.02 (9.42)
46.69 (9.27)
South America 51.54 (10.43)
52.22 (9.22)
51.80 (8.74)
51.17 (9.33)
51.44 (9.09)
50.76 (9.42)
Dominican Republic 47.29 (8.63)
45.18 (10.23)
46.28 (10.69)
43.18 (9.10)
42.40 (10.44)
43.52 (9.91)
Mexico 43.84 (9.23)
45.72 (9.57)
45.88 (8.73)
42.39 (8.97)
43.47 (9.66)
46.26 (9.50)
Cuba 51.53 (10.45)
55.08 (8.25)
52.17 (8.68)
50.15 (9.62)
53.77 (8.53)
52.60 (9.03)

294 Educ. Res. Rev. Table 3. Cont’d.
East Asia 59.23 (11.58)
58.84 (10.01)
56.81 (7.64)
58.80 (9.86)
57.82 (8.26)
54.93 7.78)
Vietnam/Thailand/Cambodia/Laos 48.12 (10.64)
50.14 (9.50)
50.69 (9.61)
50.92 (9.97)
51.51 (9.62)
50.45 (9.07)
Other Southeast Asia 53.18 (11.73)
54.57 (10.12)
54.26 (8.57)
53.00 (9.67)
52.62 (9.08)
51.04 (8.75)
India 60.34 (11.34)
57.87 (10.13)
56.46 (8.46)
56.63 (8.97)
54.81 (10.58)
54.10 (8.31)
South-Central/Western Asia 53.35 (13.59)
52.93 (11.68)
54.14 (10.00)
51.69 (12.00)
50.89 (10.72)
51.98 (10.02)
Africa 53.03 (9.64)
54.04 (7.07)
53.13 (5.93)
51.25 (8.51)
51.74 (8.12)
51.44 (7.75)
Oceania (excluding Australia) 49.57 (13.19)
48.66 (11.64)
49.90 (10.52)
50.75 (9.69)
48.04 (10.44)
46.44 (9.21)
Third and later generation
Non-Hispanic white 52.23 (9.54)
52.16 (9.19)
52.30 (8.85)
53.31 (9.34)
53.23 (9.03)
52.87 (8.79)
Non-Hispanic black 47.39 (9.12)
47.14 (9.96)
46.79 (10.39)
46.66 (8.72)
46.12 (9.37)
45.68 (9.93)
Hispanic 47.80 (9.91)
49.01 (9.82)
48.90 (9.45)
47.36 (9.56)
48.01 (9.54)
48.52 (9.04)
Asian 50.89 (9.61)
50.76 (9.84)
50.08 (9.61)
51.37 (9.61)
50.64 (9.20)
49.49 (9.04)
Other 46.61 (10.15)
47.98 (10.13)
47.55 (10.67)
47.55 (10.01)
48.35 (9.62)
47.83 (9.62)
Note. Outcome measures of Reading and Math are standardized scores with mean of 50 and standard deviation of 10. Standard deviations are in parentheses. See Appendix Table 1 for detailed definitions of sample characteristics.
different resilience) to various environments. Regression results of teacher reported data are not presented
but were similar to those presented here. It is worth noting that because children who did not complete the assessment and thus were excluded may have valid teacher-reported data, it may then be possible to use teacher’s assessments to evaluate the possibility of “biased” coefficients estimated from direct assessments. The raw data suggest that children who were not included in the direct assessment analyses had significantly lower scores on teacher-reported reading and math outcomes compared to their counterparts. However, similar estimates were obtained for children of Hispanic and Asian origin, indicating that the direct assessment results may not be seriously biased or underestimated due to the exclusion of children with limited English proficiency.
The standardized T-scores (with a full sample mean of 50 and standard deviation of 10) developed by the ECLS-K were used in this analysis. Thus, the scores represent children’s abilities relative to their peers, and the change in mean T-scores over time would reflect a change in the child’s abilities relative to their peers. Test reliabilities were high -- between .92 and .95 for all assessment points for reading and math. Average reading and math outcomes at each assessment point are reported in Table 2 by children’s immigrant generation status and additionally by detailed country of origin in Table 3. The language and literacy (reading) assessment contained 72 questions designed to measure basic skills (letter and word recognition), receptive vocabulary, and comprehension (listening and words in context). It covered five proficiency levels: (1) identifying upper and lower case letters by name, (2) associating letters with sounds at the beginning of words, (3) associating letters
with sounds at the end of words, (4) recognizing common words by sight, and (5) reading words in context.
The mathematics test consisted of 64 items measuring skills in conceptual and procedural knowledge and problem solving and were grouped into five proficiency levels: (1) identifying some one-digit numbers, recognizing geometric shapes, and counting up to ten objects by ones; (2) reading all one-digit numerals, counting beyond ten, recognizing a sequence of patterns, and using nonstandard units of length to compare objects; (3) reading two-digit numerals, recognizing the next number in a sequence, identifying the ordinal position of an object, and solving a simple word problem; (4) solving simple addition and subtraction problems; and (5) solving simple multiplication and division problems and recognizing more complex number patterns. Mediating Factors To test the three hypotheses described above, information collected from parents, teachers, and school administrators as well as a facility checklist completed by the study’s field supervisors were included in the analyses (variables described and detailed in Appendix Table 1). Selected characteristics are provided in Table 2 for the full sample as well as separately by children’s generation status and racial/ethnic groups (for children of third and later generations). To allow children with missing values to be included in the analyses, a set of dummy variables was constructed for covariates with missing variables (1=missing; 0=not missing), and
the missing values were replaced with a value of zero.6 Rates of missing data were less than 1% for the demographic, family, and home environment characteristics measured in the fall and 3% for the spring of kindergarten. Rates of missing data were higher for school characteristics, but generally below 20%. METHODS Ordinary Least Square (OLS) regression was used to estimate the associations between generation status and children’s academic achievements while controlling for an extensive set of child, parent, family, and school and neighborhood characteristics. Because schools were the primary sampling unit in the survey, the Huber-White method was used to correct for standard errors in all analyses. To test each set of hypotheses, the characteristics of the child and family, home environment (including maternal depression, parent-child relationships, and parental educational practices and expectations), and school and neighborhood environments were added increasingly to the regression models. Additionally, these factors may help to avoid some potential bias and more fully explain the relationships under study.
The first model includes only generation status by country of origin and race/ethnicity (for third and later generations) variables, without any other covariates. Thus, the coefficients represent the mean differences between children who were third and later generation non-Hispanic white and those who were not. The second model adds controls for child, parental, and family characteristics including: child’s gender, age in months, birth weight, premature status, height and weight, number of moves since birth, and attending center-based care before kindergarten; mother’s age, marital status at child’s birth, current employment status, and parental education; and number of persons under 18 in the household, family socioeconomic status (SES), home language (a dummy variable of English or not), and location and region of residence.
The third model is the same as Model 2, but adds controls for the home environment information that was collected from parental surveys in the fall or spring of kindergarten. The home environment is proxied by considering parental emotional well-being (i.e., depression) and educational practices (i.e., educational expectations, importance of having skills before entering kindergarten, participating in and difficulty attending school events), and the general home environment (i.e., the home learning materials and activities, attending extracurricular activities, frequency of spanking, and family routines) (see Appendix Table 1). The fourth model is the same as Model 3, but adds controls for the quality of school and neighborhood environments. Neighborhood quality is a composite score derived from parental reports on the prevalence of drugs, crimes, and abandoned buildings in the family’s residential neighborhood. School environment was measured by surveying teachers in the fall and spring of kindergarten and school administrators in the spring of kindergarten. Covariates were included for teacher surveys to account for the efforts devoted by parents (parental involvement in school activities) and teachers (i.e., communicating to the parent about the child; efforts to ease transition into kindergarten for
6 There are several options as to how to handle missing values, including dropping cases with missing values, keeping those cases but indicating that the information is missing by use of a dummy variable, and imputing the missing values. The second option was chosen because it is both the most conservative and widely agreed upon. In future work, it would be of interest to explore imputing missing values on all of the key variables used in the analysis; however, this is beyond the scope of the current paper.
Wei-Jui Han 295 children) to children’s learning experiences. Controls for school characteristics were proxied by the school’s student minority composition and average student performance compared to the national mean. Information collected from school administrators included the number of years served as principal, school neighborhood quality, and school safety rated by the field supervisor. School neighborhood quality is a composite variable pertaining to safety, drugs, gangs, and tension stemming from racial/ethnic/religious differences. These variables are detailed in Appendix Table 1.
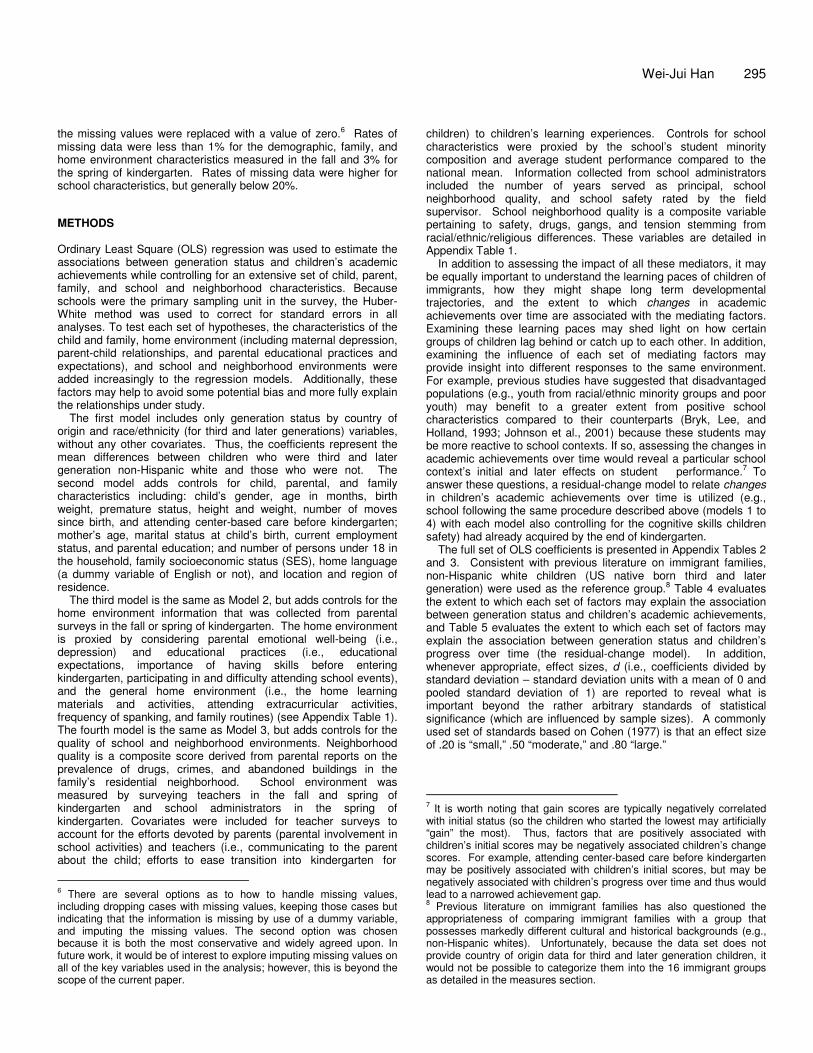
In addition to assessing the impact of all these mediators, it may be equally important to understand the learning paces of children of immigrants, how they might shape long term developmental trajectories, and the extent to which changes in academic achievements over time are associated with the mediating factors. Examining these learning paces may shed light on how certain groups of children lag behind or catch up to each other. In addition, examining the influence of each set of mediating factors may provide insight into different responses to the same environment. For example, previous studies have suggested that disadvantaged populations (e.g., youth from racial/ethnic minority groups and poor youth) may benefit to a greater extent from positive school characteristics compared to their counterparts (Bryk, Lee, and Holland, 1993; Johnson et al., 2001) because these students may be more reactive to school contexts. If so, assessing the changes in academic achievements over time would reveal a particular school context’s initial and later effects on student performance.7 To answer these questions, a residual-change model to relate changes in children’s academic achievements over time is utilized (e.g., school following the same procedure described above (models 1 to 4) with each model also controlling for the cognitive skills children safety) had already acquired by the end of kindergarten.
The full set of OLS coefficients is presented in Appendix Tables 2 and 3. Consistent with previous literature on immigrant families, non-Hispanic white children (US native born third and later generation) were used as the reference group.8 Table 4 evaluates the extent to which each set of factors may explain the association between generation status and children’s academic achievements, and Table 5 evaluates the extent to which each set of factors may explain the association between generation status and children’s progress over time (the residual-change model). In addition, whenever appropriate, effect sizes, d (i.e., coefficients divided by standard deviation – standard deviation units with a mean of 0 and pooled standard deviation of 1) are reported to reveal what is important beyond the rather arbitrary standards of statistical significance (which are influenced by sample sizes). A commonly used set of standards based on Cohen (1977) is that an effect size of .20 is “small,” .50 “moderate,” and .80 “large.” 7 It is worth noting that gain scores are typically negatively correlated with initial status (so the children who started the lowest may artificially “gain” the most). Thus, factors that are positively associated with children’s initial scores may be negatively associated children’s change scores. For example, attending center-based care before kindergarten may be positively associated with children’s initial scores, but may be negatively associated with children’s progress over time and thus would lead to a narrowed achievement gap. 8 Previous literature on immigrant families has also questioned the appropriateness of comparing immigrant families with a group that possesses markedly different cultural and historical backgrounds (e.g., non-Hispanic whites). Unfortunately, because the data set does not provide country of origin data for third and later generation children, it would not be possible to categorize them into the 16 immigrant groups as detailed in the measures section.

296 Educ. Res. Rev. RESULTS Table 3 presents the descriptive statistics for the average kindergarten and first grade academic achievements by generation status by country of origin. Two general trends are revealed. The first is that although we tend to see lower scores in academic achievements for the first- and second-generation children in Table 2, there are tremendous differences within these groups by country of origin. Compared to third and later generation non-Hispanic white children (hereafter, non-Hispanic white children), first-generation children from East Asia, Vietnam/Thailand/Cambodia/Laos, India, and Africa, as well as second-generation children from East Asia, other Southeast Asia, and India tended to have higher scores on reading and math at all assessment points, while both first- and second-generation children from Latin American regions tended to have relatively lower scores in reading and math at all assessment points. Second, generally speaking, second-generation children whose parents originally came from Latin-American regions (except Central America) as well as Asian regions (except Vietnam/Thailand/Cambodia/Laos) tended to be doing better academically compared to their first-generation counterparts. In addition, while the first- and second-generation children from Latin American regions tended to have relatively lower scores in reading and math compared to third and later generation Hispanic children (hereafter, Hispanic children), the first- and second-generation children from Asian regions tended to have relatively higher scores in reading and math compared to third and later generation Asian children (hereafter, Asian children). Academic Achievements in the Spring of First-Grade Table 4 presents the differences in regression estimates (from Appendix Table 2) of generation status by country of origin on reading and math outcomes in the spring of first-grade (panel A for Latin American regions, panel B for Asian regions, and panel C for North America, Europe, the Caribbean, and Africa) using Models 1 to 4, which allows us to determine the influence of each set of mediating factors on the estimates of generation status by country of origin on children’s academic achievements by the end of first grade. For example, the first number (-3.29) in the first column, first row represents the difference in reading scores between first- and second-generation children from Puerto Rico: a positive number indicates that first-generation children performed better than the second-generation children and a negative number indicates otherwise. T-tests were used to determine the significance level of the differences in academic achievements between the two comparison groups. No significant results were found for children
from South-Central/Western Asia and Oceania and thus were not presented here. Latin American children: Looking at the figures from Models 1 to 4 in Panel A of Table 4, results consistently show that Latin American children had significantly lower reading and math scores compared to non-Hispanic white children. In addition, first-generation children tended to have lower reading and math scores compared to their second-generation counterparts (except for first-generation children from Central America on math scores). Specifically, compared to non-Hispanic white children, the effect sizes for reading scores ranged from 0.4 (for first-generation children from South America and second-generation from Central America) to 0.8 (for first-generation from Puerto Rico and from the Dominican Republic); and the effect sizes for math scores ranged from 0.2 (for second-generation from South America) to 0.9 (for first-generation from Puerto Rico and first- and second-generation from the Dominican Republic). These significant and large differences were accounted for either wholly (such as with the reading scores of second-generation children from Puerto Rico and Central America, and with the math scores of first-generation children from Mexico) or in large part (about 75%, such as with the reading scores of first-generation children from the Dominican Republic and Mexico, and with the math scores of second-generation children from Central America) by child and family characteristics. In addition, first-generation children from Cuba (d = 0.6 on reading) and South America (d = 0.6 on math) performed significantly worse than their second-generation counterparts. These significant differences persisted even after considering the three sets of mediating factors (although each set of mediating factors did partially reduce the magnitudes of the differences).
In addition to child and family characteristics, home environment was also important for some groups of children. Specifically, after controlling for home environment, the significantly lower reading scores for (1) first-generation children from Puerto Rico compared to non-Hispanic white children became non-significant, and (2) first-generation children from Cuba compared to their second-generation counterparts changed from 1% to 5% (the magnitude of the reduction in coefficients was 26%), and compared to non-Hispanic white children changed from 0.1% to 1%.
Controlling for school and neighborhood environments also partially explained the significantly lower reading scores, compared to non-Hispanic white children, for second-generation children from Mexico (the magnitude of the reduction in coefficients was about 46%) and for first-generation children from Cuba (the magnitude of the reduction in coefficients was about 14%). Similarly, these factors to some extent explained the significantly lower math scores, compared to non-Hispanic white children,

Wei-Jui Han 297
Table 4. Differences in Academic Achievements in the Spring of First-Grade by Country of Origin and Generation Status Compared to Third and Later Generation non-Hispanic White Children.
A. Latin America Model 1 Model 2 Model 3 Model 4 Reading Puerto Rico 1st vs. 2nd generation -3.29 -4.89 -4.17 -3.93 1st vs. 3rd+ generation -8.20 * -6.29 * -5.61 -4.69 2nd vs. 3rd+ generation -4.91 *** -1.40 -1.44 -0.76 Central America 1st vs. 2nd generation 3.61 0.31 0.45 -0.10 1st vs. 3rd+ generation -0.05 0.98 0.34 0.33 2nd vs. 3rd+ generation -3.66 *** 0.28 -0.11 0.43 South America 1st vs. 2nd generation -3.27 -2.16 -1.54 -1.32 1st vs. 3rd+ generation -3.76 * -2.31 -2.14 -1.63 2nd vs. 3rd+ generation -0.49 -0.15 -0.60 -0.31 Dominican Republic 1st vs. 2nd generation -1.22 -1.11 -1.57 -1.71 1st vs. 3rd+ generation -7.24 *** -2.65 -2.93 -2.52 2nd vs. 3rd+ generation -6.02 *** -1.54 -1.36 -0.81 Mexico 1st vs. 2nd generation -0.70 -0.47 -0.19 -0.09 1st vs. 3rd+ generation -7.12 *** -1.76 -1.64 -0.88 2nd vs. 3rd+ generation -6.42 *** -1.29 ** -1.45 *** -0.79 Cuba 1st vs. 2nd generation -5.67 ** -6.94 ** -5.13 * -4.71 * 1st vs. 3rd+ generation -5.79 *** -6.96 *** -5.95 ** -5.14 * 2nd vs. 3rd+ generation -0.12 -0.02 -0.82 -0.43 Math Puerto Rico 1st vs. 2nd generation -3.90 -5.89 * -5.16 * -4.86 1st vs. 3rd+ generation -11.29 *** -9.83 *** -8.97 *** -8.33 *** 2nd vs. 3rd+ generation -7.39 *** -3.94 ** -3.81 ** -3.47 * Central America 1st vs. 2nd generation 5.22 * 2.88 2.69 2.09 1st vs. 3rd+ generation -0.96 0.90 0.47 0.35 2nd vs. 3rd+ generation -6.18 *** -1.98 ** -2.22 ** -1.74 * South America 1st vs. 2nd generation -5.05 * -4.87 * -4.25 * -4.10 * 1st vs. 3rd+ generation -7.15 *** -5.77 ** -5.35 ** -5.04 ** 2nd vs. 3rd+ generation -2.10 ** -0.90 -1.10 -0.94 Dominican Republic 1st vs. 2nd generation -0.32 -0.55 -1.09 -1.35 1st vs. 3rd+ generation -9.66 *** -4.88 -5.13 -5.10 2nd vs. 3rd+ generation -9.34 *** -4.33 *** -4.04 *** -3.75 *** Mexico 1st vs. 2nd generation 0.03 0.30 0.64 0.66 1st vs. 3rd+ generation -6.58 *** -0.76 -0.40 0.10 2nd vs. 3rd+ generation -6.61 *** -1.06 * -1.04 * -0.56 Cuba 1st vs. 2nd generation -3.56 -4.28 -2.31 -2.15 1st vs. 3rd+ generation -3.83 -3.91 -2.54 -2.12 2nd vs. 3rd+ generation -0.27 0.37 -0.23 0.03

298 Educ. Res. Rev. Table 4. Continued.
B. Asia Model 1 Model 2 Model 3 Model 4 Reading East Asia 1st vs. 2nd generation -0.42 -0.48 -0.82 -0.95 1st vs. 3rd+ generation 4.10 *** 3.48 ** 3.55 ** 3.49 ** 2nd vs. 3rd+ generation 4.52 *** 3.96 *** 4.37 *** 4.44 *** Vietnam/Thailand/Cambodia/Laos 1st vs. 2nd generation 4.49 1.85 2.29 2.55 1st vs. 3rd+ generation 2.89 3.85 4.79 * 5.25 * 2nd vs. 3rd+ generation -1.60 2.00 * 2.50 *** 2.70 *** Other South East Asia 1st vs. 2nd generation 1.12 1.63 2.25 2.79 * 1st vs. 3rd+ generation 3.09 * 4.14 *** 4.83 *** 5.62 *** 2nd vs. 3rd+ generation 1.97 *** 2.51 *** 2.58 *** 2.83 *** India 1st vs. 2nd generation -0.77 -1.44 -0.69 -0.42 1st vs. 3rd+ generation 3.40 0.94 1.89 2.36 2nd vs. 3rd+ generation 4.17 *** 2.38 *** 2.58 ** 2.78 *** Math East Asia 1st vs. 2nd generation -0.19 -0.36 -0.72 -0.83 1st vs. 3rd+ generation 1.87 1.94 2.02 1.94 2nd vs. 3rd+ generation 2.06 *** 2.30 *** 2.74 *** 2.77 *** Vietnam/Thailand/Cambodia/Laos 1st vs. 2nd generation 1.45 -2.08 -1.65 -1.51 1st vs. 3rd+ generation -0.96 -0.73 0.20 0.48 2nd vs. 3rd+ generation -2.41 ** 1.35 1.85 * 1.99 ** Other South East Asia 1st vs. 2nd generation -1.41 -0.83 -0.26 0.12 1st vs. 3rd+ generation -3.24 * -1.48 -0.58 -0.02 2nd vs. 3rd+ generation -1.83 ** -0.65 -0.32 -0.14 India 1st vs. 2nd generation -1.97 -2.02 -1.27 -1.11 1st vs. 3rd+ generation -0.73 -2.09 -0.97 -0.65 2nd vs. 3rd+ generation 1.24 -0.07 0.30 0.46
for second-generation children from Puerto Rico, Central America, and Mexico (the magnitudes of the reductions in coefficients were about 10%, 22%, and 46%, respectively). Asian children: Panel B of Table 4 presents the reading and math results for children of Asian origin. Generally speaking, first- and second-generation children performed significantly better than non-Hispanic white children on reading skills, the effect sizes ranged from 0.2 (for first- and second-generation children from South-Central/Western Asia) to 0.5 (for second-generation children from East Asia). In contrast, all groups of children tended to have significantly lower math scores compared to non-Hispanic white children (except for second-generation children from East Asia who performed significantly better). No significant differences were found between first- and second-generation children on reading and math.
Child and family characteristics seemed to make little difference in accounting for the significantly better reading scores for children of Asian origin; in some cases, the differences became even larger after controlling for these factors (e.g., for the reading skills of second-generation children from Vietnam/Thailand/Cambodia/Laos, and first- and second-generation children from other Southeast Asia). The significant differences in math scores between second-generation children from East Asia and non-Hispanic white children also increased with each set of mediators. Child and family background, however, were able to account wholly for the significantly lower math scores of the first- and second-generation children from other Southeast Asia and of second-generation children from Vietnam/Thailand/Cambodia/Laos as compared to non-Hispanic white children.
After controlling for home environment, the differences in reading scores between first- and second-generation

Wei-Jui Han 299 Table 4. continued.
C. North America, Europe, Caribbean, and Africa Model 1 Model 2 Model 3 Model 4 Reading North America 1st vs. 2nd generation 1.11 2.11 1.74 1.50 1st vs. 3rd+ generation 0.84 -1.01 -1.23 -1.67 2nd vs. 3rd+ generation -0.27 -3.12 -2.97 -3.17 Europe (including Russia) 1st vs. 2nd generation 1.36 1.02 1.33 1.45 1st vs. 3rd+ generation 1.76 1.14 1.55 1.65 2nd vs. 3rd+ generation 0.40 0.12 0.22 0.20 Caribbean 1st vs. 2nd generation -2.16 0.56 0.15 1.27 1st vs. 3rd+ generation -4.14 0.09 -0.44 1.09 2nd vs. 3rd+ generation -1.98 -0.47 -0.59 -0.18 Africa 1st vs. 2nd generation 4.69 5.33 * 6.28 * 7.52 ** 1st vs. 3rd+ generation 5.52 * 5.56 * 6.42 * 7.85 ** 2nd vs. 3rd+ generation 0.83 0.23 0.14 0.33 Math North America 1st vs. 2nd generation 2.69 3.36 3.34 3.20 1st vs. 3rd+ generation 0.70 -0.96 -0.88 -1.30 2nd vs. 3rd+ generation -1.99 -4.32 * -4.22 * -4.50 ** Europe (including Russia) 1st vs. 2nd generation -0.11 -0.22 0.10 0.20 1st vs. 3rd+ generation 0.11 -0.07 0.38 0.41 2nd vs. 3rd+ generation 0.22 0.15 0.28 0.21 Caribbean 1st vs. 2nd generation 1.39 3.51 2.99 4.01 * 1st vs. 3rd+ generation -5.14 ** -1.00 -1.49 -0.34 2nd vs. 3rd+ generation -6.53 *** -4.51 *** -4.48 *** -4.35 *** Africa 1st vs. 2nd generation 2.19 2.59 3.82 4.76 1st vs. 3rd+ generation 0.76 0.89 2.13 3.15 2nd vs. 3rd+ generation -1.43 -1.70 -1.69 -1.61
Note. Model 1 controls only for immigrant generation status by country of origin and race/ethnicity (for the 3rd and later generation) variables without any other covariates. Model 2 adds controls for child’s gender, age, being low birth weight, being at least 2 weeks premature, current weight and height in the fall of kindergarten, number of moves since birth, attending center-based care before kindergarten, mother’s age in the fall of kindergarten, parental education (either mother or father, whichever is higher), mother married at child’s birth, number of people age < 18 in household, mother working full-time, family’s SES prestigious score, home language is not English, region of residence, location of residence, and a set of dummy variables indicating missing values for controlled covariates. Model 3 adds controls for the home environment. Model 4 adds controls for the quality of neighborhood and school environment. Additional details about covariates are presented in Appendix Table 1. T-tests were used to determine the significance level of the differences in estimated coefficients between generations (based on the regression results shown in Appendix Table 2). * p < .05. ** p < .01. *** p < .001.
children from Vietnam/Thailand/Cambodia/Laos and non-Hispanic white children, and the difference in math scores between second-generation children from Vietnam/Thailand/Cambodia/Laos and non-Hispanic white children, became larger and significant. Similarly, after controlling for the school and neighborhood environments, the differences became larger in the reading scores between first- and second-generation children from Vietnam/Thailand/Cambodia/Laos and non-Hispanic white children and between first-generation children from other Southeast Asia and non-Hispanic
white children, and in the math scores between second-generation children from Vietnam/Thailand/Cambodia/Laos and non-Hispanic white children.
North American, European, Caribbean, and African children: Panel C of Table 4 presents the reading and math results for four groups of children. Regarding the reading results as shown in the top panel of Panel C, first-generation children from Africa performed significantly better than both non-Hispanic white children
300 Educ. Res. Rev.
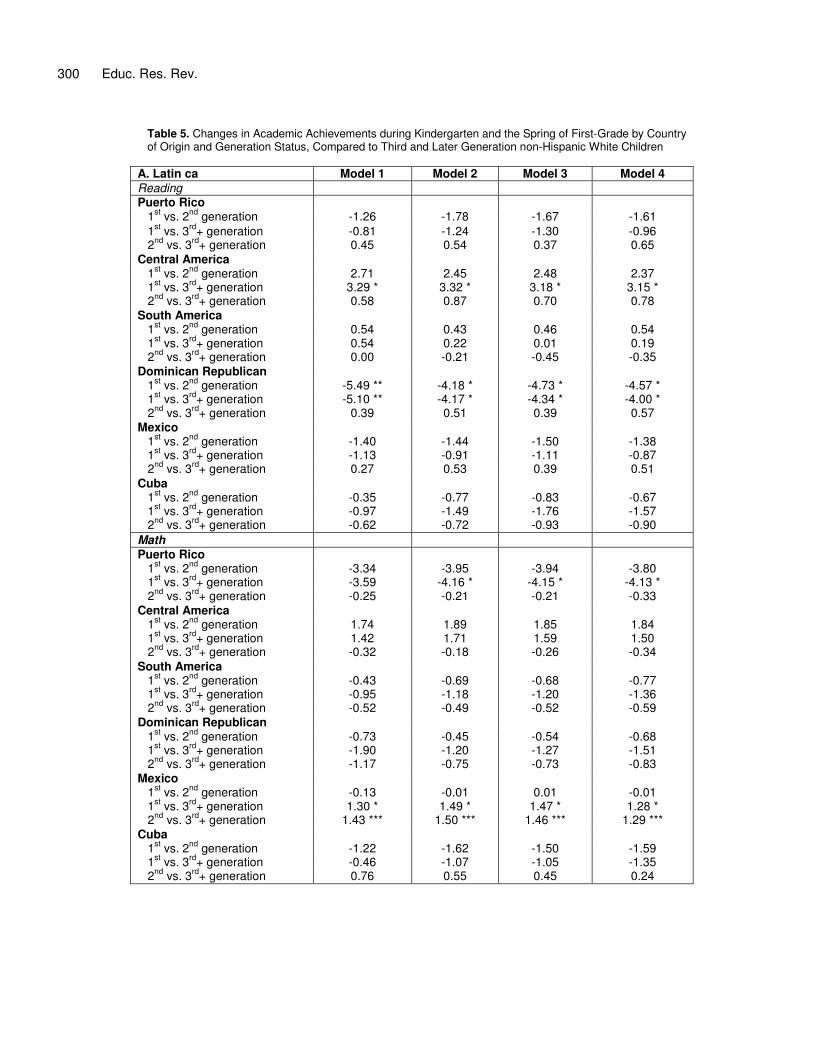
Table 5. Changes in Academic Achievements during Kindergarten and the Spring of First-Grade by Country of Origin and Generation Status, Compared to Third and Later Generation non-Hispanic White Children
A. Latin ca Model 1 Model 2 Model 3 Model 4 Reading Puerto Rico 1st vs. 2nd generation -1.26 -1.78 -1.67 -1.61 1st vs. 3rd+ generation -0.81 -1.24 -1.30 -0.96 2nd vs. 3rd+ generation 0.45 0.54 0.37 0.65 Central America 1st vs. 2nd generation 2.71 2.45 2.48 2.37 1st vs. 3rd+ generation 3.29 * 3.32 * 3.18 * 3.15 * 2nd vs. 3rd+ generation 0.58 0.87 0.70 0.78 South America 1st vs. 2nd generation 0.54 0.43 0.46 0.54 1st vs. 3rd+ generation 0.54 0.22 0.01 0.19 2nd vs. 3rd+ generation 0.00 -0.21 -0.45 -0.35 Dominican Republican 1st vs. 2nd generation -5.49 ** -4.18 * -4.73 * -4.57 * 1st vs. 3rd+ generation -5.10 ** -4.17 * -4.34 * -4.00 * 2nd vs. 3rd+ generation 0.39 0.51 0.39 0.57 Mexico 1st vs. 2nd generation -1.40 -1.44 -1.50 -1.38 1st vs. 3rd+ generation -1.13 -0.91 -1.11 -0.87 2nd vs. 3rd+ generation 0.27 0.53 0.39 0.51 Cuba 1st vs. 2nd generation -0.35 -0.77 -0.83 -0.67 1st vs. 3rd+ generation -0.97 -1.49 -1.76 -1.57 2nd vs. 3rd+ generation -0.62 -0.72 -0.93 -0.90 Math Puerto Rico 1st vs. 2nd generation -3.34 -3.95 -3.94 -3.80 1st vs. 3rd+ generation -3.59 -4.16 * -4.15 * -4.13 * 2nd vs. 3rd+ generation -0.25 -0.21 -0.21 -0.33 Central America 1st vs. 2nd generation 1.74 1.89 1.85 1.84 1st vs. 3rd+ generation 1.42 1.71 1.59 1.50 2nd vs. 3rd+ generation -0.32 -0.18 -0.26 -0.34 South America 1st vs. 2nd generation -0.43 -0.69 -0.68 -0.77 1st vs. 3rd+ generation -0.95 -1.18 -1.20 -1.36 2nd vs. 3rd+ generation -0.52 -0.49 -0.52 -0.59 Dominican Republican 1st vs. 2nd generation -0.73 -0.45 -0.54 -0.68 1st vs. 3rd+ generation -1.90 -1.20 -1.27 -1.51 2nd vs. 3rd+ generation -1.17 -0.75 -0.73 -0.83 Mexico 1st vs. 2nd generation -0.13 -0.01 0.01 -0.01 1st vs. 3rd+ generation 1.30 * 1.49 * 1.47 * 1.28 * 2nd vs. 3rd+ generation 1.43 *** 1.50 *** 1.46 *** 1.29 *** Cuba 1st vs. 2nd generation -1.22 -1.62 -1.50 -1.59 1st vs. 3rd+ generation -0.46 -1.07 -1.05 -1.35 2nd vs. 3rd+ generation 0.76 0.55 0.45 0.24

Wei-Jui Han 301 Table 5. continued.
C. North America, Europe, Caribbean, and Africa Model 1 Model 2 Model 3 Model 4 Reading North America 1st vs. 2nd generation 0.50 0.59 0.46 0.38 1st vs. 3rd+ generation -0.25 -0.51 -0.72 -0.83 2nd vs. 3rd+ generation -0.75 -1.10 -1.18 -1.21 Europe (including Russia) 1st vs. 2nd generation 1.35 1.27 1.28 1.33 1st vs. 3rd+ generation 1.71 * 1.52 * 1.45 * 1.52 * 2nd vs. 3rd+ generation 0.36 0.25 0.17 0.19 Caribbean 1st vs. 2nd generation 3.65 3.77 * 3.74 * 4.15 ** 1st vs. 3rd+ generation 2.50 2.91 2.75 3.38 * 2nd vs. 3rd+ generation -1.15 -0.86 -0.99 -0.77 Africa 1st vs. 2nd generation 3.00 * 2.79 * 2.64 * 3.05 * 1st vs. 3rd+ generation 2.75 * 2.45 * 2.22 2.69 * 2nd vs. 3rd+ generation -0.25 -0.34 -0.42 -0.36 Math North America 1st vs. 2nd generation 3.72 * 3.20 * 3.26 * 3.32 * 1st vs. 3rd+ generation 2.13 1.79 1.80 1.75 2nd vs. 3rd+ generation -1.59 -1.41 -1.46 -1.57 Europe (including Russia) 1st vs. 2nd generation 1.54 * 1.47 * 1.51 * 1.54 * 1st vs. 3rd+ generation 1.58 * 1,42 * 1.43 * 1.42 * 2nd vs. 3rd+ generation 0.04 -0.05 -0.08 -0.12 Caribbean 1st vs. 2nd generation 5.34 5.57 5.53 5.70 1st vs. 3rd+ generation 3.29 3.97 3.91 3.98 2nd vs. 3rd+ generation -2.05 ** -1.60 * -1.62 * -1.72 * Africa 1st vs. 2nd generation -3.38 * -4.07 * -3.99 * -3.75 * 1st vs. 3rd+ generation -3.53 * -4.24 ** -4.17 ** -4.00 ** 2nd vs. 3rd+ generation -0.15 -0.17 -0.18 -0.25
Note. Model 1 controls only for immigrant generation status by country of origin and race/ethnicity (for the 3rd and plus generation) variables and earlier measure of corresponding outcome without any other covariates. Model 2 adds controls for child’s gender, age, being low birth weight, being at least 2 weeks premature, current weight and height in the fall kindergarten, number of moves since birth, attending center-based care before kindergarten, mother’s age in fall kindergarten, parental education (either mother or father, whichever is higher), mother married at child’s birth, number of people age < 18 in household, mother working full-time, family’s SES prestigious score, home language is not English, region of residence, location of residence, and a set of dummy variables indicating missing values for controlled covariates. Model 3 adds controls for the home environment. Model 4 adds controls for the quality of neighborhood and school environment. Additional details about covariates are presented in Appendix Table 1. T-tests were used to determine the significant level of the differences in estimated coefficients between generations (based on the regression results shown in Appendix Table 3). * p < .05. ** p < .01. *** p < .001. and their second-generation counterparts after considering child and family backgrounds. These significant performance gaps became larger with each set of mediating factors (the effect sizes increased from 0.6 to 0.8). There is some indication from the data that the one African child who is white may be driving the significantly better performance by first-generation children from Africa. Still, even if the analyses are limited to only black children from Africa, the significant results hold for the reading comparisons between first- and second-generations. Two patterns are evident from the math results (second panel of Panel C). First, second-generation children from
North America performed significantly worse than non-Hispanic white children after considering child and family characteristics, and the significance persisted after considering the other two sets of mediating factors (d = 0.5). Second, first-generation children from the Caribbean performed significantly better than their second-generation counterparts after considering the three sets of mediating factors (d = 0.4), while both generations performed significantly worse than non-Hispanic white children (d = 0.5 and d = 0.7, respectively). Child andfamily characteristics were able to account wholly for the first-generation’s lower math scores, while all three sets of mediators were only able to partially account for

302 Educ. Res. Rev. Appendix Table 1. Definitions of Covariates Used in Analyses.
Constructs and variables Definitions Child characteristics, fall kindergarten
Race and ethnicity 5 dummy variables (1=yes; 0=no) for Non-Hispanic white (as reference group), Non-Hispanic black, Hispanic, Asia, or Other (including Native American, Pacific Islander, Native Hawaiian, ore more than one race).
Gender Dummy variable (1=boy; 0=girl). Age Continuous variable, age in months, ranges from 45.77 to 96.50. Low birth weight Dummy variable for birth weight <2500 grams (1=yes; 0=no). Premature Dummy variable for 2 weeks or more early (1=yes; 0=no). Height, fall kindergarten Average of two interviewer-assessed measurements in inches, ranges
from 35 to 60. Weight, fall kindergarten Average of two interviewer-assessed measurements in lbs, ranges
from 22.5 to 100. Number of moves since child’s birth, fall kindergarten Continuous variable. Ranges from 1 to 20. Attending center care the year before entering kindergarten
Dummy variable (1=yes; 0=no) if the child ever attended center-based care.
Parental characteristics reported by parents Mother’s age, fall kindergarten Continuous variable, ranges from 18 to 83. Parental education, fall kindergarten 4 dummy variables (1=yes; 0=no) for less than high school (<12), high
school degree (=12), some college (>=13 and <15), and college and plus (>=15) with less than high school as the reference group. Derived from either mother or father, whichever is higher.
Mother married at child’s birth Dummy variable (1=yes; 0=no). Mother’s employment status, fall kindergarten 3 dummy variables (1=yes; 0=no) for full-time (35 or more hours per
week), part-time (less than 35 hours per week), and not working (as the reference group).
Family characteristics reported by parents Number of persons age <18 in the household, fall kindergarten
Ordinal variable. Ranges from 1 to 11.
Family SES scores Continuous variable. Socioeconomic status was computed at the household level using the following components that were collected mainly in the fall of kindergarten, except that the income was collected from the spring of kindergarten: father/male guardian’s education, other/female guardian’s education, father/male guardian’s occupation, mother/female guardian’s occupation, and household income.
Home language is not English Dummy variable for whether the home primary language of the child is not English (1=yes; 0=no).
Region of residency 4 dummy variables (1=yes; 0=no) for northeast (reference group), midwest, south, and west.
Location of residency 7 dummy variables (1=yes; 0=no) for: large city (reference group)--a central city of consolidated Metropolitan Statistical Areas (CMSA) with a population greater than or equal to 250,000, mid-size city--a central city of CMSA or Metropolitan Statistical Areas (MSA) with a population less than 250,000, urban fringe of large city--any incorporated place, Census Designated Place, or nonplace territory within CMSA or MSA of a large city and defined as urban by the Census Bureau, urban fringe of mid-size city-- any incorporated place, Census Designated Place, or nonplace territory within CMSA or MSA of a mid-size, large town--an incorporated place or Census Designated Place with a population greater than or equal to 250,000 and located outside a CMSA or MSA. small town--an incorporated place or Census Designated Place with a population less than 250,000 and greater than 2,500, and located outside a CMSA or MSA. rural-- any incorporated place, Census Designated Place, or nonplace territory and defined as rural by the Census Bureau
Wei-Jui Han 303 Appendix Table 1. Continued.
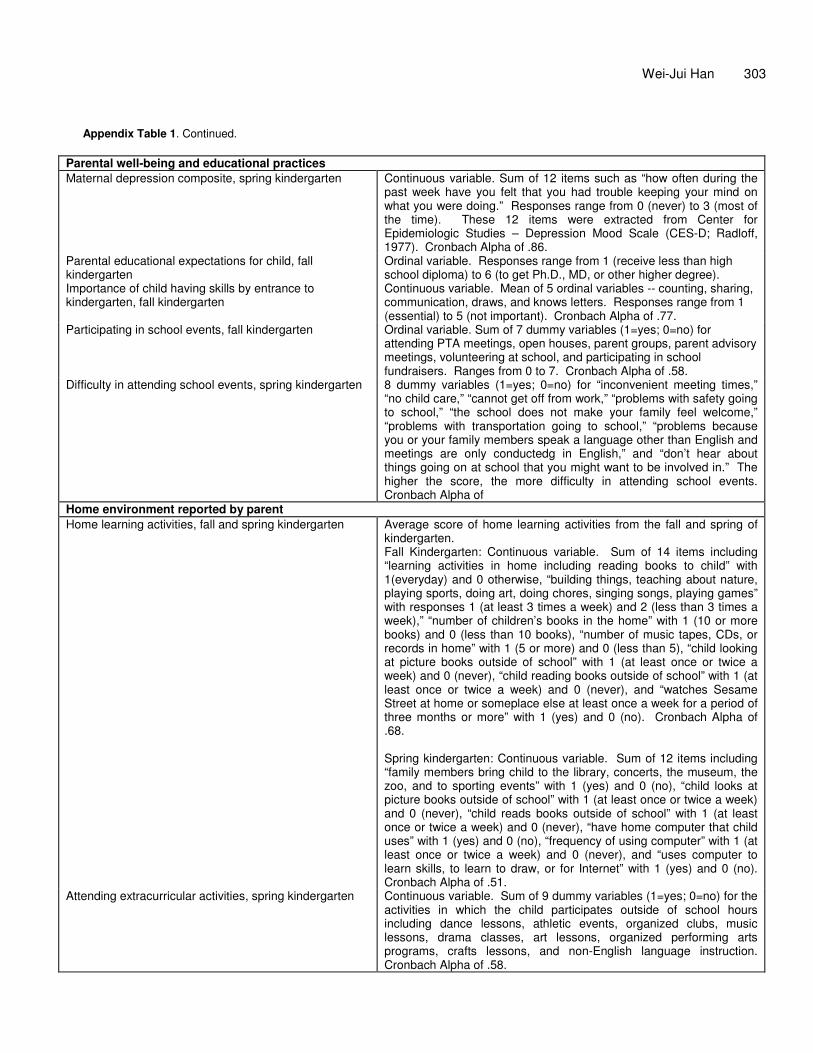
Parental well-being and educational practices Maternal depression composite, spring kindergarten Continuous variable. Sum of 12 items such as “how often during the
past week have you felt that you had trouble keeping your mind on what you were doing.” Responses range from 0 (never) to 3 (most of the time). These 12 items were extracted from Center for Epidemiologic Studies – Depression Mood Scale (CES-D; Radloff, 1977). Cronbach Alpha of .86.
Parental educational expectations for child, fall kindergarten
Ordinal variable. Responses range from 1 (receive less than high school diploma) to 6 (to get Ph.D., MD, or other higher degree).
Importance of child having skills by entrance to kindergarten, fall kindergarten
Continuous variable. Mean of 5 ordinal variables -- counting, sharing, communication, draws, and knows letters. Responses range from 1 (essential) to 5 (not important). Cronbach Alpha of .77.
Participating in school events, fall kindergarten Ordinal variable. Sum of 7 dummy variables (1=yes; 0=no) for attending PTA meetings, open houses, parent groups, parent advisory meetings, volunteering at school, and participating in school fundraisers. Ranges from 0 to 7. Cronbach Alpha of .58.
Difficulty in attending school events, spring kindergarten 8 dummy variables (1=yes; 0=no) for “inconvenient meeting times,” “no child care,” “cannot get off from work,” “problems with safety going to school,” “the school does not make your family feel welcome,” “problems with transportation going to school,” “problems because you or your family members speak a language other than English and meetings are only conductedg in English,” and “don’t hear about things going on at school that you might want to be involved in.” The higher the score, the more difficulty in attending school events. Cronbach Alpha of
Home environment reported by parent Home learning activities, fall and spring kindergarten Average score of home learning activities from the fall and spring of
kindergarten. Fall Kindergarten: Continuous variable. Sum of 14 items including “learning activities in home including reading books to child” with 1(everyday) and 0 otherwise, “building things, teaching about nature, playing sports, doing art, doing chores, singing songs, playing games” with responses 1 (at least 3 times a week) and 2 (less than 3 times a week),” “number of children’s books in the home” with 1 (10 or more books) and 0 (less than 10 books), “number of music tapes, CDs, or records in home” with 1 (5 or more) and 0 (less than 5), “child looking at picture books outside of school” with 1 (at least once or twice a week) and 0 (never), “child reading books outside of school” with 1 (at least once or twice a week) and 0 (never), and “watches Sesame Street at home or someplace else at least once a week for a period of three months or more” with 1 (yes) and 0 (no). Cronbach Alpha of .68. Spring kindergarten: Continuous variable. Sum of 12 items including “family members bring child to the library, concerts, the museum, the zoo, and to sporting events” with 1 (yes) and 0 (no), “child looks at picture books outside of school” with 1 (at least once or twice a week) and 0 (never), “child reads books outside of school” with 1 (at least once or twice a week) and 0 (never), “have home computer that child uses” with 1 (yes) and 0 (no), “frequency of using computer” with 1 (at least once or twice a week) and 0 (never), and “uses computer to learn skills, to learn to draw, or for Internet” with 1 (yes) and 0 (no). Cronbach Alpha of .51.
Attending extracurricular activities, spring kindergarten Continuous variable. Sum of 9 dummy variables (1=yes; 0=no) for the activities in which the child participates outside of school hours including dance lessons, athletic events, organized clubs, music lessons, drama classes, art lessons, organized performing arts programs, crafts lessons, and non-English language instruction. Cronbach Alpha of .58.

304 Educ. Res. Rev. Appendix Table 1. Continued. Frequency of spanking child in past week, spring kindergarten
Ordinal variable. Ranges from 0 to 30.
Family routines, spring kindergarten Continuous variable. Standardized score of 8 items including “number of days eats breakfast together” with responses ranging from 0 to 7, “number of days child eats breakfast at regular time” with responses ranging from 0 to 7, “number of days eats dinner together” with responses ranging from 0 to 7, “number of days child eats dinner at regular time” with responses ranging from 0 to 7, “goes to bed same time each night” with 1 (yes) and 0 (no), “how often family talks about ethnic or racial heritage” with 1 (at least several times a year) and 0 (never or almost never), “how often family discusses family’s religious beliefs or traditions” with 1 (at least several times a year) and 0 (never or almost never), and “how often someone in the family participates in special cultural events or traditions connected” with racial or ethnic background with 1 (at least several times a year) and 0 (never or almost never). The higher the score, the more family routine activities. Cronbach Alpha of .52.
School and neighborhood characteristics Student minority composition, spring kindergarten Continuous variable. Standardized score of 9 items including “percent
of Hispanic students in class,” “percent of minorities in class,” “having students who speak non-English languages,” “having students with limited English proficiency,” “teachers speak only English,” “providing in-class ESL,” “percent of white students at school,” “percent of LEP students at school,” and “percent receiving both ESL and bilingual services.” The higher the score, the more diversity the student composition. Cronbach Alpha of .88.
Average student performance, spring kindergarten Continuous variable. Standardized score of 4 items including “percent of school students having reading and verbal skills at or below grade level nationally,” “percent of school students having math or quantitative skills at or below grade level nationally,” “percent of students having reading skills below grade level in the class,” and “percent of students having math skills below grade level in the class.” Cronbach Alpha of .71.
Number of years served as principal, spring kindergarten Ordinal variable. Ranges from 0 to 30. School communication about the child to the parent, spring kindergarten
Continuous variable. Standardized score (with mean of 0 and standard deviation of 1) of 6 items such as “the school lets you know between report cards how your child is doing in school,” “the school helps you understand what children at your child’s age are like,” “the school makes you aware of chances to volunteer at the school,” “the school provides workshops, materials, or advice about how to help you child learn at home,” “the school provides information on community services to help your child or your family,” “the child’s teacher has sent home ideas for things to do with your child at home (reverse coded)” with 1 (does this very well) to 3 (does not do this at all). Cronbach Alpha of .68.
Efforts to ease the transition into kindergarten for children, fall and spring kindergarten
4 dummy variables (2 each for fall and spring kindergarten; 1=yes; 0=no) including “school days are shortened in the beginning of the school year,” and “teacher visited the home of the child at the beginning of the school year.” Cronbach Alpha of .66.

Wei-Jui Han 305 Appendix Table 1. Continued.
Teacher-reported parental involvement in school activities, spring kindergarten
Continuous variable. Mean of 4 ordinal variables (0=none; 1=1-25 percent; 2=26-50 percent; 3=51 to 75 percent; 4=76 or more percent) asking about the percentage of children in the class whose parents participate in the following activities: teacher-parent conferences, volunteers regularly, attends open house, and attends art/music events. Cronbach Alpha of .78.
School neighborhood quality composite, spring kindergarten
Continuous variable. Mean of 8 ordinal variables (1=big problem; 2=somewhat of a problem; 3=no problem) asking about how much of a problem the following are in the neighborhood where this school is located: tension based on racial, ethnic, or religious differences, garbage/litter/broken glasses in the road or street or on the sidewalk or in the yards, selling or using drugs or excessive drinking in public, gangs, heavy traffic, violent crimes such as drive-by shootings, vacant houses and buildings, and crimes in the neighborhood, as well as 7 dummy variables (1=yes; 0=no) including “visitors must sign in,” “limited restroom use,” “teachers patrol hallways,” “hall pass required,” “students bringing weapons to school,” “children or teachers being physically attacked or involved in fights,” “children or teachers having things taken by force or threat of force on the way to or from school.” The higher the score, the worse the school environment and neighborhood. Cronbach Alpha of .81.
Observers’ overall rating of school safety Ordinal variable. Ranges from 1 (very unsafe) to 4 (very safe). Parental reports of neighborhood quality composite, spring kindergarten
Continuous variable. Standardized score of 6 items asking about problems in the area around the house or apartment – garbage/litter/broken glasses, selling/using drugs, burglary/rubbery in the area, violent crimes like drive-by shootings, and vacant houses with responses ranging from 1 (big problem) to 3 (no problem), and the overall rating of safety with 1 (not at all safe) to 3 (very safe). Cronbach Alpha of .77.
Note. Details about missing data and missing data dummy variables are available from the author upon request.
Appendix Table 2. OLS Regression Estimates of Country of Origin by Generation on Academic Achievements in the Spring of First-Grade. A. Reading Model 1 Model 2 Model 3 Model 4 First generation North America 0.84 (1.73) -1.01 (1.43) -1.23 (1.42) -1.67 (1.48) Europe (including Russia) 1.76 (1.00) 1.14 (0.98) 1.55 (1.02) 1.65 (1.04) Caribbean -4.14 (2.79) 0.09 (2.85) -0.44 (2.29) 1.09 (2.40) Puerto Rico -8.20 (3.97)* -6.29 (3.06)* -5.61 (2.90) -4.69 (2.83) Central America -0.05 (2.01) 0.98 (1.98) 0.34 (2.03) 0.33 (1.83) South America -3.76 (1.87)* -2.31 (1.90) -2.14 (1.76) -1.63 (1.80) Dominican Republic -7.24 (1.76)*** -2.65 (2.42) -2.93 (2.56) -2.52 (2.56) Mexico -7.12 (0.92)*** -1.76 (0.94) -1.64 (0.92) -0.88 (0.94) Cuba -5.79 (1.33)*** -6.96 (1.92)*** -5.95 (1.87)** -5.14 (2.02)* East Asia 4.10 (1.16)*** 3.48 (1.24)** 3.55 (1.21)** 3.49 (1.18)** Vietnam/Thailand/Cambodia/Laos 2.89 (2.40) 3.85 (2.12) 4.79 (2.16)* 5.25 (2.16)* Other South East Asia 3.09 (1.40)* 4.14 (1.23)*** 4.83 (1.20)*** 5.62 (1.20)*** India 3.40 (1.90) 0.94 (1.66) 1.89 (1.71) 2.36 (1.71) South-Central/West Asia -1.70 (2.38) -0.42 (2.14) 0.00 (2.08) -0.45 (2.14) Africa 5.52 (2.60)* 5.56 (2.32)* 6.42 (2.51)* 7.85 (2.49)** Oceania (excluding Australia) -0.90 (0.93) -0.22 (0.89) -0.12 (0.88) 0.03 (0.87) Second generation North America -0.27 (1.86) -3.12 (1.80) -2.97 (1.68) -3.17 (1.67) Europe (including Russia) 0.40 (0.65) 0.12 (0.57) 0.22 (0.56) 0.20 (0.56) Caribbean -1.98 (1.22) -0.47 (1.15) -0.59 (1.13) -0.18 (1.13) Puerto Rico -4.91 (1.30)*** -1.40 (1.14) -1.44 (1.12) -0.76 (1.15) Central America -3.66 (0.78)*** 0.28 (0.77) -0.11 (0.76) 0.43 (0.74) South America -0.49 (0.75) -0.15 (0.67) -0.60 (0.66) -0.31 (0.66)

306 Educ. Res. Rev. Appendix Table 2. Continued.
Dominican Republic -6.02 (1.25)*** -1.54 (1.13) -1.36 (1.11) -0.81 (1.10) Mexico -6.42 (0.38)*** -1.29 (0.44)** -1.45 (0.44)*** -0.79 (0.46) Cuba -0.12 (1.36) -0.02 (1.15) -0.82 (1.10) -0.43 (1.09) East Asia 4.52 (0.62)*** 3.96 (0.60)*** 4.37 (0.60)*** 4.44 (0.61)*** Vietnam/Thailand/Cambodia/Laos -1.60 (0.84) 2.00 (0.81)* 2.50 (0.78)*** 2.70 (0.77)*** Other South East Asia 1.97 (0.59)*** 2.51 (0.54)*** 2.58 (0.55)*** 2.83 (0.55)*** India 4.17 (0.91)*** 2.38 (0.82)*** 2.58 (0.81)** 2.78 (0.84)*** South-Central/West Asia 1.84 (1.22) 1.63 (1.09) 1.87 (1.09) 2.06 (1.08) Africa 0.83 (0.93) 0.23 (1.10) 0.14 (1.04) 0.33 (1.03) Oceania (excluding Australia) -2.39 (2.11) 0.66 (1.90) 0.36 (1.83) 1.31 (1.87) Third+ generation Black -5.51 (0.24)*** -2.46 (0.26)*** -2.40 (0.26)*** -1.76 (0.27)*** Hispanic -3.40 (0.27)*** -0.92 (0.27)*** -1.02 (0.26)*** -0.73 (0.27)** Asian -2.21 (0.46)*** 0.43 (0.45) 0.79 (0.44) 1.22 (0.44)** Other (including mixed race) -4.74 (0.44)*** -2.27 (0.40)*** -2.21 (0.39)*** -1.50 (0.39)*** Child Characteristics Boy -2.02 (0.14)*** -1.76 (0.14)*** -1.75 (0.14)*** Child age in months 0.16 (0.02)*** 0.16 (0.02)*** 0.16 (0.02)*** Low birth weight (<2500 g) -0.93 (0.26)*** -0.93 (0.26)*** -0.91 (0.26)*** Premature (>=2 weeks early) -0.31 (0.20) -0.39 (0.20)* -0.36 (0.20) Height 0.32 (0.05)*** 0.30 (0.05)*** 0.29 (0.05)*** Weight -0.03 (0.01)* -0.03 (0.01)* -0.03 (0.01)* Number of moves since birth 0.00 (0.06) 0.07 (0.06) 0.08 (0.06) Center-based care before entering kindergarten
0.87 (0.15)*** 0.65 (0.15)*** 0.56 (0.15)***
Parent Characteristics Mother’s age 0.01 (0.01) 0.02 (0.01) 0.01 (0.01) Highest parental education High school degree 2.01 (0.33)*** 1.69 (0.33)*** 1.62 (0.32)*** Some college 3.10 (0.35)*** 2.38 (0.34)*** 2.24 (0.34)*** College and plus 4.06 (0.41)*** 3.14 (0.41)*** 2.88 (0.40)*** Mother married at birth 1.55 (0.20)*** 1.18 (0.20)*** 1.02 (0.20)*** Mother currently works full-time -0.61 (0.15)*** -0.50 (0.15)*** -0.47 (0.15)*** Family Characteristics Number of persons age <18 in the household
-0.82 (0.07)*** -0.70 (0.07)*** -0.65 (0.07)***
Social economic status (SES) 2.11 (0.15)*** 1.59 (0.15)*** 1.37 (0.14)*** Home language is not English -1.46 (0.28)*** -1.16 (0.28)*** -0.84 (0.28)** Region of residence Mid-West 0.10 (0.21) 0.01 (0.21) -0.05 (0.21) South 0.92 (0.20)*** 0.82 (0.20)*** 0.98 (0.21)*** West 0.66 (0.23)** 0.51 (0.23)* 0.56 (0.24)* Location of residency Rural -1.90 (0.28)*** -1.59 (0.28)*** -1.94 (0.29)*** Small town -1.03 (0.29)*** -0.68 (0.29)* -0.82 (0.30)** Large town -0.17 (0.45) 0.07 (0.44) -0.22 (0.45) Mid-size suburban -1.07 (0.31)*** -0.94 (0.30)** -1.24 (0.31)*** Large-size suburban 0.03 (0.21) -0.00 (0.21) -0.39 (0.21) Mid-size city -0.53 (0.23)* -0.46 (0.22)* -0.69 (0.23)*** Parental well-being and educational practice Maternal depression -0.05 (0.01)*** -0.05 (0.01)*** Parental educational expectations for child 0.48 (0.07)*** 0.48 (0.07)*** Importance of child having skills by entrance to kindergarten
1.41 (0.14)*** 1.46 (0.14)***
Participating in school events 0.14 (0.05)** 0.09 (0.05) Difficulty in attending school events -0.20 (0.06)** -0.18 (0.06)** Home Environment Home learning activities 0.39 (0.04)*** 0.37 (0.04)*** Attending extracurricular activities 0.15 (0.06)*** 0.13 (0.06)* Frequency of spanking child in past week -0.16 (0.07)* -0.16 (0.07)*

Wei-Jui Han 307 Appendix Table 2. Continued.
Family routines 0.32 (0.16)* 0.33 (0.16)* School and neighborhood characteristics Student minority composition in class -0.42 (0.14)** Average student performance 0.82 (0.12)*** Number of years served as principal 0.02 (0.01)* School communication about the child -0.30 (0.12)** Teachers’ efforts to ease the transition into kindergarten for children
-0.26 (0.10)**
Teacher-reported parental involvement in school activities
0.53 (0.10)***
School neighborhood quality 0.64 (0.17)*** Observers’ overall rating of school safety 0.11 (0.11) Residential neighborhood quality 0.11 (0.11) Observations 16102 16102 16102 16102 Adjusted R-squared 0.07 0.21 0.24 0.24
those of the second-generation (the magnitude of the reduction in coefficients was 34% with controls for child and family backgrounds). Change Model Table 5 presents the estimates of generation status by country of origin (obtained from Appendix Table 3) for academic achievements in the spring of first grade for children with non-missing academic achievement data during the kindergarten year. Models 1 to 4 were analyzed with controls for earlier measures from the kindergarten year to evaluate the additional effects that extend beyond their individual initial effects on the changes in academic achievements over time. The regions in Table 5 were grouped the same as in Table 4. Generally, adding each set of mediating factors to the analyses did not change the results substantially for all groups, with a few exceptions. Child and family characteristics (i.e., child’s health status, number of moves since birth, mother’s education, marital status at child’s birth, work hours, and family SES), parental educational practices and home environments (i.e., parental educational expectations, home learning activities, frequency of spanking, and family routines), and school and neighborhood environments (i.e., student minority composition, average student performance, number of years served as principal, teachers’ efforts to ease the transition into kindergarten for children, teacher-reported parental involvement, school neighborhood safety, and observer ratings of overall school safety measures) all have the same directions of the effects as in Appendix Table 2 when the academic achievements by first-grade were examined. Thus, for example, school diversity may adversely affect not only the first-grade
academic performance but also the progress in academic achievements of children of immigrants. The exceptions were children who attended center-based care before kindergarten, had a non-English home language, and attended extracurricular activities. Specifically, children who attended center-based care before kindergarten or attended more extracurricular activities had slower learning paces compared to those who did not, although the former groups had significantly higher initial and first-grade scores compared to the latter. In other words, the difference in academic achievements between these groups may become narrower over time. In contrast, although children with non-English home language had significantly lower initial scores than their counterparts, the former had a faster learning pace, thus narrowing the gap between them over time.
Regarding results for children of Latin American origin, first-generation children from Central America had a significantly faster learning pace for reading compared to non-Hispanic white children (and thus may have better scores over time), while first-generation children from the Dominican Republic had a significantly slower learning pace for reading compared to their second-generation counterparts and to non-Hispanic white children (suggesting they may lag behind over time). Also, compared to non-Hispanic white children, first-generation children from Puerto Rico not only had significantly lower initial math scores, but also a significantly slower learning pace for math, suggesting this score gap may widen over time. In contrast, first- and second-generation children from Mexico had lower initial scores but significantly faster learning paces than non-Hispanic white children, suggesting their score gaps may narrow over time.
Of the results for children of Asian origin, the significantly higher reading scores by first-generation children from East Asia compared to non-Hispanic white
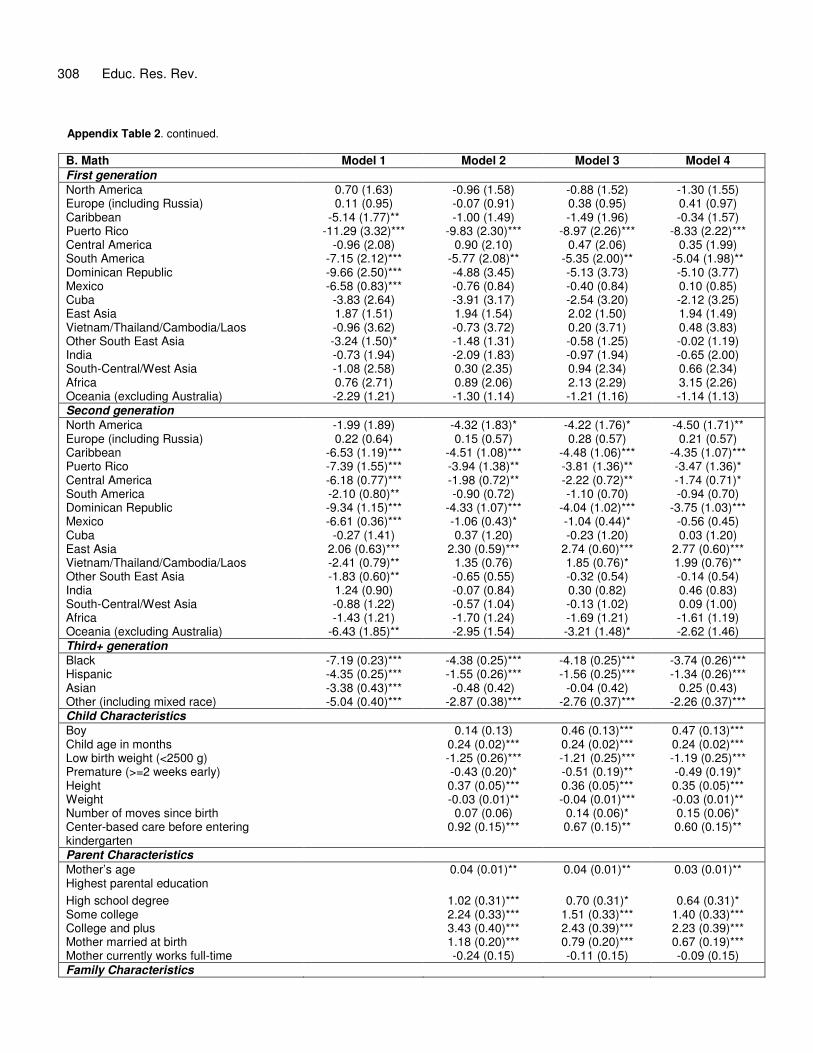
308 Educ. Res. Rev. Appendix Table 2. continued.
B. Math Model 1 Model 2 Model 3 Model 4 First generation North America 0.70 (1.63) -0.96 (1.58) -0.88 (1.52) -1.30 (1.55) Europe (including Russia) 0.11 (0.95) -0.07 (0.91) 0.38 (0.95) 0.41 (0.97) Caribbean -5.14 (1.77)** -1.00 (1.49) -1.49 (1.96) -0.34 (1.57) Puerto Rico -11.29 (3.32)*** -9.83 (2.30)*** -8.97 (2.26)*** -8.33 (2.22)*** Central America -0.96 (2.08) 0.90 (2.10) 0.47 (2.06) 0.35 (1.99) South America -7.15 (2.12)*** -5.77 (2.08)** -5.35 (2.00)** -5.04 (1.98)** Dominican Republic -9.66 (2.50)*** -4.88 (3.45) -5.13 (3.73) -5.10 (3.77) Mexico -6.58 (0.83)*** -0.76 (0.84) -0.40 (0.84) 0.10 (0.85) Cuba -3.83 (2.64) -3.91 (3.17) -2.54 (3.20) -2.12 (3.25) East Asia 1.87 (1.51) 1.94 (1.54) 2.02 (1.50) 1.94 (1.49) Vietnam/Thailand/Cambodia/Laos -0.96 (3.62) -0.73 (3.72) 0.20 (3.71) 0.48 (3.83) Other South East Asia -3.24 (1.50)* -1.48 (1.31) -0.58 (1.25) -0.02 (1.19) India -0.73 (1.94) -2.09 (1.83) -0.97 (1.94) -0.65 (2.00) South-Central/West Asia -1.08 (2.58) 0.30 (2.35) 0.94 (2.34) 0.66 (2.34) Africa 0.76 (2.71) 0.89 (2.06) 2.13 (2.29) 3.15 (2.26) Oceania (excluding Australia) -2.29 (1.21) -1.30 (1.14) -1.21 (1.16) -1.14 (1.13) Second generation North America -1.99 (1.89) -4.32 (1.83)* -4.22 (1.76)* -4.50 (1.71)** Europe (including Russia) 0.22 (0.64) 0.15 (0.57) 0.28 (0.57) 0.21 (0.57) Caribbean -6.53 (1.19)*** -4.51 (1.08)*** -4.48 (1.06)*** -4.35 (1.07)*** Puerto Rico -7.39 (1.55)*** -3.94 (1.38)** -3.81 (1.36)** -3.47 (1.36)* Central America -6.18 (0.77)*** -1.98 (0.72)** -2.22 (0.72)** -1.74 (0.71)* South America -2.10 (0.80)** -0.90 (0.72) -1.10 (0.70) -0.94 (0.70) Dominican Republic -9.34 (1.15)*** -4.33 (1.07)*** -4.04 (1.02)*** -3.75 (1.03)*** Mexico -6.61 (0.36)*** -1.06 (0.43)* -1.04 (0.44)* -0.56 (0.45) Cuba -0.27 (1.41) 0.37 (1.20) -0.23 (1.20) 0.03 (1.20) East Asia 2.06 (0.63)*** 2.30 (0.59)*** 2.74 (0.60)*** 2.77 (0.60)*** Vietnam/Thailand/Cambodia/Laos -2.41 (0.79)** 1.35 (0.76) 1.85 (0.76)* 1.99 (0.76)** Other South East Asia -1.83 (0.60)** -0.65 (0.55) -0.32 (0.54) -0.14 (0.54) India 1.24 (0.90) -0.07 (0.84) 0.30 (0.82) 0.46 (0.83) South-Central/West Asia -0.88 (1.22) -0.57 (1.04) -0.13 (1.02) 0.09 (1.00) Africa -1.43 (1.21) -1.70 (1.24) -1.69 (1.21) -1.61 (1.19) Oceania (excluding Australia) -6.43 (1.85)** -2.95 (1.54) -3.21 (1.48)* -2.62 (1.46) Third+ generation Black -7.19 (0.23)*** -4.38 (0.25)*** -4.18 (0.25)*** -3.74 (0.26)*** Hispanic -4.35 (0.25)*** -1.55 (0.26)*** -1.56 (0.25)*** -1.34 (0.26)*** Asian -3.38 (0.43)*** -0.48 (0.42) -0.04 (0.42) 0.25 (0.43) Other (including mixed race) -5.04 (0.40)*** -2.87 (0.38)*** -2.76 (0.37)*** -2.26 (0.37)*** Child Characteristics Boy 0.14 (0.13) 0.46 (0.13)*** 0.47 (0.13)*** Child age in months 0.24 (0.02)*** 0.24 (0.02)*** 0.24 (0.02)*** Low birth weight (<2500 g) -1.25 (0.26)*** -1.21 (0.25)*** -1.19 (0.25)*** Premature (>=2 weeks early) -0.43 (0.20)* -0.51 (0.19)** -0.49 (0.19)* Height 0.37 (0.05)*** 0.36 (0.05)*** 0.35 (0.05)*** Weight -0.03 (0.01)** -0.04 (0.01)*** -0.03 (0.01)** Number of moves since birth 0.07 (0.06) 0.14 (0.06)* 0.15 (0.06)* Center-based care before entering kindergarten
0.92 (0.15)*** 0.67 (0.15)** 0.60 (0.15)**
Parent Characteristics Mother’s age 0.04 (0.01)** 0.04 (0.01)** 0.03 (0.01)** Highest parental education High school degree 1.02 (0.31)*** 0.70 (0.31)* 0.64 (0.31)* Some college 2.24 (0.33)*** 1.51 (0.33)*** 1.40 (0.33)*** College and plus 3.43 (0.40)*** 2.43 (0.39)*** 2.23 (0.39)*** Mother married at birth 1.18 (0.20)*** 0.79 (0.20)*** 0.67 (0.19)*** Mother currently works full-time -0.24 (0.15) -0.11 (0.15) -0.09 (0.15) Family Characteristics

Wei-Jui Han 309
Appendix Table 2. continued.
Number of persons age <18 in the household -0.45 (0.07)*** -0.31 (0.07)*** -0.27 (0.07)*** Social economic status (SES) 1.92 (0.15)*** 1.34 (0.15)*** 1.17 (0.15)*** Home language is not English -1.68 (0.27)*** -1.34 (0.27)*** -1.09 (0.28)*** Region of residence Mid-West 1.07 (0.21)*** 1.02 (0.21)*** 1.00 (0.21)*** South 1.56 (0.20)*** 1.51 (0.20)*** 1.51 (0.21)*** West 0.78 (0.22)*** 0.62 (0.22)** 0.60 (0.23)** Location of residency Rural -1.27 (0.27)*** -0.97 (0.27)*** -1.13 (0.28)*** Small town -1.20 (0.29)*** -0.84 (0.29)** -0.89 (0.30)** Large town -0.71 (0.44) -0.51 (0.44) -0.80 (0.44) Mid-size suburban -0.17 (0.29) -0.02 (0.28) -0.14 (0.29) Large-size suburban 0.34 (0.20) 0.30 (0.20) 0.03 (0.21) Mid-size city -0.12 (0.22) -0.07 (0.22) -0.23 (0.22) Parental well-being and educational practice Maternal depression -0.05 (0.01)*** -0.05 (0.01)*** Parental educational expectations for child 0.45 (0.07)*** 0.44 (0.07)*** Importance of child having skills by entrance to kindergarten
1.09 (0.14)*** 1.14 (0.14)***
Participating in school events 0.24 (0.05)*** 0.19 (0.05)*** Difficulty in attending school events -0.20 (0.06)*** -0.19 (0.06)** Home Environment Home learning activities 0.37 (0.04)*** 0.35 (0.04)*** Attending extracurricular activities 0.32 (0.05)*** 0.30 (0.05)*** Frequency of spanking child in past week -0.28 (0.07)*** -0.28 (0.07)*** Family routines -0.06 (0.16) -0.07 (0.16) School and neighborhood characteristics Student minority composition in class -0.28 (0.14)* Average student performance 0.88 (0.12)*** Number of years served as principal 0.01 (0.01) School communication about the child -0.04 (0.12) Teachers’ efforts to ease the transition into kindergarten for children
-0.03 (0.09)
Teacher-reported parental involvement in school activities
0.33 (0.10)***
School neighborhood quality 0.20 (0.17) Observers’ overall rating of school safety 0.27 (0.11)* Residential neighborhood quality 0.07 (0.11) Observations 16382 16382 16382 16382 Adjusted R-squared 0.10 0.22 0.25 0.25
Note. Reference group is Non-Hispanic whites. Standard errors shown in parentheses are corrected for school clustering using Huber-White methods. Details about covariates are presented in Appendix Table 1. * p < .05. ** p < .01. *** p < .001. children (from the top panel of Panel B of Table 4) became wider over time judging by the significant positive difference in the top panel of Panel B of Table 5. Although there were no significant differences in first-grade reading scores between first- and second-generation children from East Asia as shown in the top panel of Panel B of Table 4, the former appeared to have a significantly faster learning pace than the latter as shown by the significant positive difference in the top panel of Panel B of Table 5. Likewise, first- and second-generation children from other Southeast Asia not only had significantly higher reading scores by first grade
compared to non-Hispanic white children (as shown in the top panel of Panel B of Table 4), but also had a significantly faster learning pace for reading compared to non-Hispanic white children as shown by the significant positive difference in the top panel of Panel B of Table 5. Although first- and second-generation children from other Southeast Asia had a slower learning pace for math compared to non-Hispanic white children, this was accounted for entirely by child and family backgrounds. Panel C of Table 5 presents results for children from North America, Europe, the Caribbean, and Africa. First, with respect to the reading results, first-generation

310 Educ. Res. Rev.
Appendix Table 3. OLS Regression Estimates of Changes in Academic Achievements during Kindergarten and First-Grade by Country of Origin and Generational Status.
A. Reading Model 1 Model 2 Model 3 Model 4 First generation North America -0.25 (0.85) -0.51 (0.86) -0.72 (0.87) -0.83 (0.91) Europe (including Russia) 1.71 (0.69)* 1.52 (0.69)* 1.45 (0.71)* 1.52 (0.71)* Caribbean 2.50 (1.78) 2.91 (1.59) 2.75 (1.44) 3.38 (1.42)* Puerto Rico -0.81 (2.34) -1.24 (2.30) -1.30 (2.27) -0.96 (2.22) Central America 3.29 (1.43)* 3.32 (1.33)* 3.18 (1.29)* 3.15 (1.28)* South America 0.54 (1.24) 0.22 (1.18) 0.01 (1.16) 0.19 (1.15) Dominican Republic -5.10 (1.62)** -4.17 (1.72)* -4.34 (1.79)* -4.00 (1.82)* Mexico -1.13 (0.79) -0.91 (0.81) -1.11 (0.80) -0.87 (0.82) Cuba -0.97 (1.09) -1.49 (1.15) -1.76 (1.21) -1.57 (1.17) East Asia 2.66 (0.67)*** 2.57 (0.68)*** 2.52 (0.68)*** 2.47 (0.67)*** Vietnam/Thailand/Cambodia/Laos 2.04 (2.11) 2.20 (2.20) 2.33 (2.05) 2.66 (2.08) Other South East Asia 2.38 (0.72)*** 2.21 (0.76)** 2.22 (0.78)** 2.49 (0.77)*** India 0.34 (1.30) -0.28 (1.26) -0.29 (1.22) 0.00 (1.18) South-Central/West Asia -1.22 (1.77) -1.86 (1.72) -1.99 (1.72) -2.16 (1.75) Africa 2.75 (1.18)* 2.45 (1.13)* 2.22 (1.15) 2.69 (1.15)* Oceania (excluding Australia) -0.07 (0.69) 0.00 (0.66) -0.03 (0.66) 0.05 (0.66) Second generation North America -0.75 (1.19) -1.10 (1.16) -1.18 (1.15) -1.21 (1.17) Europe (including Russia) 0.36 (0.41) 0.25 (0.40) 0.17 (0.40) 0.19 (0.40) Caribbean -1.15 (0.78) -0.86 (0.77) -0.99 (0.77) -0.77 (0.77) Puerto Rico 0.45 (0.86) 0.54 (0.88) 0.37 (0.89) 0.65 (0.89) Central America 0.58 (0.59) 0.87 (0.60) 0.70 (0.60) 0.78 (0.60) South America 0.00 (0.45) -0.21 (0.47) -0.45 (0.47) -0.35 (0.47) Dominican Republic 0.39 (0.80) 0.51 (0.83) 0.39 (0.84) 0.57 (0.85) Mexico 0.27 (0.33) 0.53 (0.37) 0.39 (0.38) 0.51 (0.38) Cuba -0.62 (0.85) -0.72 (0.84) -0.93 (0.82) -0.90 (0.82) East Asia -0.05 (0.40) -0.22 (0.41) -0.28 (0.41) -0.24 (0.41) Vietnam/Thailand/Cambodia/Laos 0.76 (0.58) 1.15 (0.59) 1.16 (0.60) 1.26 (0.60)* Other South East Asia 1.14 (0.36)** 1.04 (0.38)** 0.96 (0.38)* 1.03 (0.38)** India -0.33 (0.62) -0.85 (0.63) -0.97 (0.63) -0.81 (0.63) South-Central/West Asia 1.06 (0.80) 0.61 (0.82) 0.50 (0.82) 0.53 (0.82) Africa -0.25 (0.71) -0.34 (0.74) -0.42 (0.74) -0.36 (0.73) Oceania (excluding Australia) 0.86 (1.23) 0.46 (1.26) 0.43 (1.26) 0.77 (1.27) Third+ generation Black -1.63 (0.16)*** -1.16 (0.18)*** -1.20 (0.18)*** -0.98 (0.19)*** Hispanic -0.13 (0.18) 0.10 (0.19) 0.02 (0.19) 0.09 (0.20) Asian 0.41 (0.28) 0.59 (0.30) 0.57 (0.31) 0.74 (0.31)* Other (including mixed race) -1.20 (0.28)*** -0.91 (0.28)*** -0.94 (0.29)*** -0.75 (0.29)** Child Characteristics Boy -0.38 (0.10)*** -0.40 (0.10)*** -0.41 (0.10)*** Child age in months -0.09 (0.01)*** -0.08 (0.01)*** -0.08 (0.01)*** Low birth weight (<2500 g) -0.25 (0.19) -0.27 (0.18) -0.27 (0.18) Premature (>=2 weeks early) 0.06 (0.14) 0.05 (0.14) 0.06 (0.14) Height 0.05 (0.03) 0.05 (0.03) 0.05 (0.03) Weight 0.00 (0.01) 0.00 (0.01) 0.00 (0.01) Number of moves since birth 0.01 (0.04) 0.02 (0.04) 0.02 (0.04) Center-based care before entering kindergarten -0.26 (0.11)** -0.26 (0.11)* -0.27 (0.11)** Parent Characteristics Mother’s age -0.03 (0.01)** -0.03 (0.01)** -0.03 (0.01)*** Highest parental education High school degree 1.25 (0.26)*** 1.20 (0.26)*** 1.16 (0.25)*** Some college 1.56 (0.27)*** 1.48 (0.27)*** 1.41 (0.27)*** College and plus 1.59 (0.31)*** 1.49 (0.31)*** 1.41 (0.31)*** Mother married at birth 0.58 (0.14)*** 0.54 (0.14)*** 0.49 (0.14)*** Mother currently works full-time -0.22 (0.11)* -0.21 (0.11)* -0.21 (0.11) Family Characteristics Number of persons age <18 in the household 0.05 (0.05) 0.05 (0.05) 0.06 (0.05)

Wei-Jui Han 311 Appendix Table 3. Continued.
Social economic status (SES) 0.24 (0.10)* 0.18 (0.10) 0.13 (0.10) Home language is not English 0.41 (0.20)* 0.38 (0.21) 0.45 (0.21)* Region of residence Mid-West 0.14 (0.15) 0.15 (0.15) 0.11 (0.15) South 0.16 (0.14) 0.19 (0.15) 0.28 (0.15) West 0.05 (0.16) 0.05 (0.17) 0.05 (0.17) Location of residency Rural -0.27 (0.20) -0.24 (0.20) -0.43 (0.21)* Small town 0.20 (0.21) 0.22 (0.21) 0.16 (0.22) Large town 0.71 (0.31)* 0.76 (0.31)* 0.66 (0.31)* Mid-size suburban 0.32 (0.23) 0.32 (0.23) 0.17 (0.23) Large-size suburban 0.07 (0.15) 0.08 (0.15) -0.07 (0.16) Mid-size city 0.31 (0.16) 0.33 (0.16)* 0.21 (0.17) Parental well-being and educational practice Maternal depression -0.01 (0.01) -0.01 (0.01) Parental educational expectations for child 0.15 (0.05)** 0.15 (0.05)** Importance of child having skills by entrance to kindergarten
-0.07 (0.10) -0.05 (0.10)
Participating in school events -0.02 (0.04) -0.04 (0.04) Difficulty in attending school events -0.01 (0.05) -0.00 (0.05) Home Environment Home learning activities 0.07 (0.03)* 0.06 (0.03) Attending extracurricular activities -0.10 (0.04)** -0.11 (0.04)** Frequency of spanking child in past week -0.10 (0.05)* -0.10 (0.05)* Family routines 0.28 (0.11)* 0.28 (0.11)* School and neighborhood characteristics Student minority composition -0.11 (0.11) Average student performance 0.17 (0.08)* Number of years served as principal 0.02 (0.01)* School communication about the child -0.12 (0.08) Teachers’ efforts to ease the transition into kindergarten for children
-0.18 (0.07)**
Teacher-reported parental involvement in school activities
0.25 (0.07)***
School neighborhood quality 0.21 (0.13) Observers’ overall rating of school safety -0.02 (0.08) Residential neighborhood quality 0.09 (0.09) Earlier measure Average reading score of fall and spring kindergarten
0.76 (0.01)*** 0.75 (0.01)*** 0.74 (0.01)*** 0.74 (0.01)***
Observations 15564 15564 15564 15564 Adjusted R-squared 0.60 0.60 0.61 0.61
Note. Reference group is Non-Hispanic whites. Standard errors shown in parentheses are corrected for school clustering using Huber-White methods. Details about covariates are presented in Appendix Table 1. * p < .05. ** p < .01. *** p < .001.
children from Europe had a significantly faster learning pace compared to non-Hispanic white children, even though the former’s first-grade scores were not significantly different from the latter. Second, first-generation children from the Caribbean had a significantly faster learning pace compared to their second-generation counterparts after controlling for child and family backgrounds and compared to non-Hispanic white children after controlling for all three sets of mediators. Third, first-generation children from Africa had
a significantly faster learning pace compared to their second-generation counterparts and non-Hispanic white children. Results from first-generation children from Africa suggests that they not only had significantly higher reading scores by first-grade (as shown on the top panel of Panel C of Table 4), but also that these differences may become wider over time. Regarding math results, first-generation children from North America had a significantly faster learning pace compared to their second-generation counterparts. First-generation children
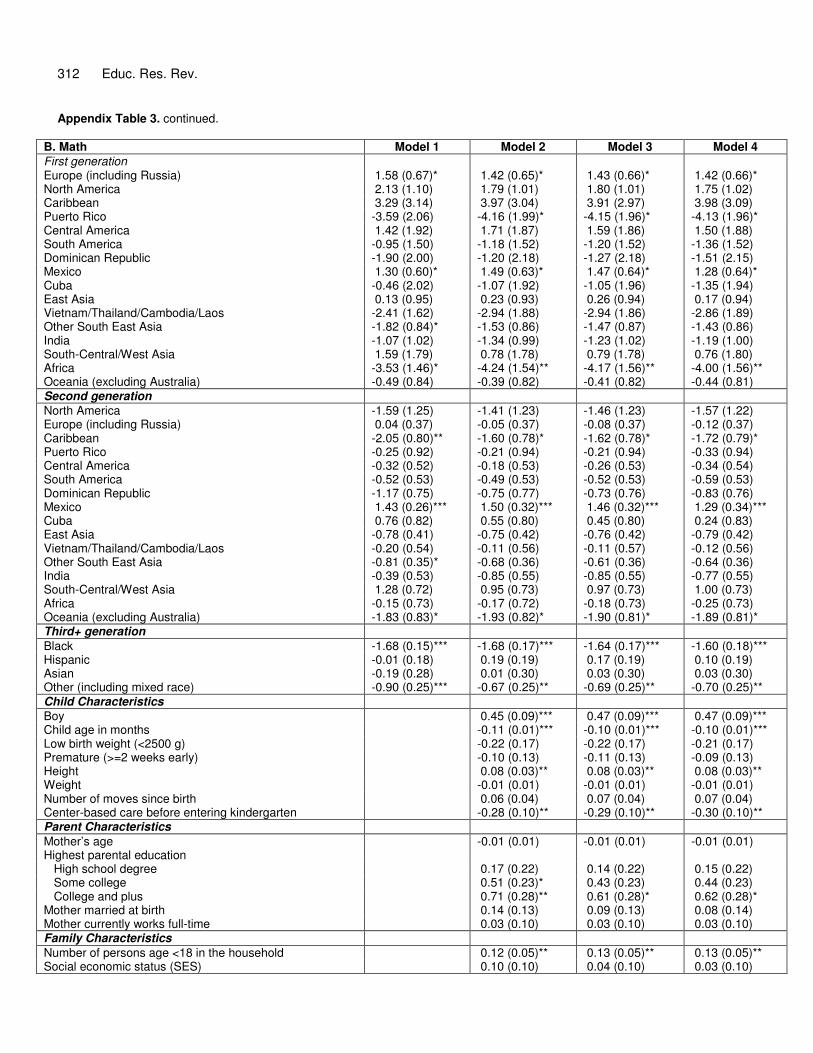
312 Educ. Res. Rev. Appendix Table 3. continued.
B. Math Model 1 Model 2 Model 3 Model 4 First generation Europe (including Russia) 1.58 (0.67)* 1.42 (0.65)* 1.43 (0.66)* 1.42 (0.66)* North America 2.13 (1.10) 1.79 (1.01) 1.80 (1.01) 1.75 (1.02) Caribbean 3.29 (3.14) 3.97 (3.04) 3.91 (2.97) 3.98 (3.09) Puerto Rico -3.59 (2.06) -4.16 (1.99)* -4.15 (1.96)* -4.13 (1.96)* Central America 1.42 (1.92) 1.71 (1.87) 1.59 (1.86) 1.50 (1.88) South America -0.95 (1.50) -1.18 (1.52) -1.20 (1.52) -1.36 (1.52) Dominican Republic -1.90 (2.00) -1.20 (2.18) -1.27 (2.18) -1.51 (2.15) Mexico 1.30 (0.60)* 1.49 (0.63)* 1.47 (0.64)* 1.28 (0.64)* Cuba -0.46 (2.02) -1.07 (1.92) -1.05 (1.96) -1.35 (1.94) East Asia 0.13 (0.95) 0.23 (0.93) 0.26 (0.94) 0.17 (0.94) Vietnam/Thailand/Cambodia/Laos -2.41 (1.62) -2.94 (1.88) -2.94 (1.86) -2.86 (1.89) Other South East Asia -1.82 (0.84)* -1.53 (0.86) -1.47 (0.87) -1.43 (0.86) India -1.07 (1.02) -1.34 (0.99) -1.23 (1.02) -1.19 (1.00) South-Central/West Asia 1.59 (1.79) 0.78 (1.78) 0.79 (1.78) 0.76 (1.80) Africa -3.53 (1.46)* -4.24 (1.54)** -4.17 (1.56)** -4.00 (1.56)** Oceania (excluding Australia) -0.49 (0.84) -0.39 (0.82) -0.41 (0.82) -0.44 (0.81) Second generation North America -1.59 (1.25) -1.41 (1.23) -1.46 (1.23) -1.57 (1.22) Europe (including Russia) 0.04 (0.37) -0.05 (0.37) -0.08 (0.37) -0.12 (0.37) Caribbean -2.05 (0.80)** -1.60 (0.78)* -1.62 (0.78)* -1.72 (0.79)* Puerto Rico -0.25 (0.92) -0.21 (0.94) -0.21 (0.94) -0.33 (0.94) Central America -0.32 (0.52) -0.18 (0.53) -0.26 (0.53) -0.34 (0.54) South America -0.52 (0.53) -0.49 (0.53) -0.52 (0.53) -0.59 (0.53) Dominican Republic -1.17 (0.75) -0.75 (0.77) -0.73 (0.76) -0.83 (0.76) Mexico 1.43 (0.26)*** 1.50 (0.32)*** 1.46 (0.32)*** 1.29 (0.34)*** Cuba 0.76 (0.82) 0.55 (0.80) 0.45 (0.80) 0.24 (0.83) East Asia -0.78 (0.41) -0.75 (0.42) -0.76 (0.42) -0.79 (0.42) Vietnam/Thailand/Cambodia/Laos -0.20 (0.54) -0.11 (0.56) -0.11 (0.57) -0.12 (0.56) Other South East Asia -0.81 (0.35)* -0.68 (0.36) -0.61 (0.36) -0.64 (0.36) India -0.39 (0.53) -0.85 (0.55) -0.85 (0.55) -0.77 (0.55) South-Central/West Asia 1.28 (0.72) 0.95 (0.73) 0.97 (0.73) 1.00 (0.73) Africa -0.15 (0.73) -0.17 (0.72) -0.18 (0.73) -0.25 (0.73) Oceania (excluding Australia) -1.83 (0.83)* -1.93 (0.82)* -1.90 (0.81)* -1.89 (0.81)* Third+ generation Black -1.68 (0.15)*** -1.68 (0.17)*** -1.64 (0.17)*** -1.60 (0.18)*** Hispanic -0.01 (0.18) 0.19 (0.19) 0.17 (0.19) 0.10 (0.19) Asian -0.19 (0.28) 0.01 (0.30) 0.03 (0.30) 0.03 (0.30) Other (including mixed race) -0.90 (0.25)*** -0.67 (0.25)** -0.69 (0.25)** -0.70 (0.25)** Child Characteristics Boy 0.45 (0.09)*** 0.47 (0.09)*** 0.47 (0.09)*** Child age in months -0.11 (0.01)*** -0.10 (0.01)*** -0.10 (0.01)*** Low birth weight (<2500 g) -0.22 (0.17) -0.22 (0.17) -0.21 (0.17) Premature (>=2 weeks early) -0.10 (0.13) -0.11 (0.13) -0.09 (0.13) Height 0.08 (0.03)** 0.08 (0.03)** 0.08 (0.03)** Weight -0.01 (0.01) -0.01 (0.01) -0.01 (0.01) Number of moves since birth 0.06 (0.04) 0.07 (0.04) 0.07 (0.04) Center-based care before entering kindergarten -0.28 (0.10)** -0.29 (0.10)** -0.30 (0.10)** Parent Characteristics Mother’s age -0.01 (0.01) -0.01 (0.01) -0.01 (0.01) Highest parental education High school degree 0.17 (0.22) 0.14 (0.22) 0.15 (0.22) Some college 0.51 (0.23)* 0.43 (0.23) 0.44 (0.23) College and plus 0.71 (0.28)** 0.61 (0.28)* 0.62 (0.28)* Mother married at birth 0.14 (0.13) 0.09 (0.13) 0.08 (0.14) Mother currently works full-time 0.03 (0.10) 0.03 (0.10) 0.03 (0.10) Family Characteristics Number of persons age <18 in the household 0.12 (0.05)** 0.13 (0.05)** 0.13 (0.05)** Social economic status (SES) 0.10 (0.10) 0.04 (0.10) 0.03 (0.10)

Wei-Jui Han 313 Appendix Table 3. continued.
Home language is not English 0.30 (0.20) 0.31 (0.20) 0.23 (0.21) Region of residence Mid-West 0.66 (0.14)*** 0.68 (0.15)*** 0.66 (0.15)*** South 1.16 (0.14)*** 1.20 (0.14)*** 1.14 (0.15)*** West 0.34 (0.16)* 0.35 (0.16)* 0.21 (0.17) Location of residency Rural 0.32 (0.19) 0.34 (0.19) 0.38 (0.19)* Small town -0.28 (0.20) -0.26 (0.20) -0.16 (0.21) Large town 0.57 (0.28)* 0.60 (0.28)* 0.55 (0.29) Mid-size suburban 0.66 (0.20)*** 0.67 (0.20)*** 0.76 (0.20)*** Large-size suburban 0.46 (0.14)*** 0.46 (0.14)*** 0.46 (0.15)*** Mid-size city 0.64 (0.15)*** 0.64 (0.15)*** 0.67 (0.16)*** Parental well-being and educational practice Maternal depression -0.01 (0.01) -0.01 (0.01) Parental educational expectations for child 0.06 (0.05) 0.06 (0.05) Importance of child having skills by entrance to kindergarten
-0.08 (0.10) -0.06 (0.10)
Participating in school events 0.06 (0.04) 0.04 (0.04) Difficulty in attending school events 0.03 (0.04) 0.03 (0.04) Home Environment Home learning activities 0.02 (0.03) 0.02 (0.03) Attending extracurricular activities -0.00 (0.04) -0.00 (0.04) Frequency of spanking child in past week -0.16 (0.05)*** -0.16 (0.05)*** Family routines 0.01 (0.11) -0.00 (0.11) School and neighborhood characteristics Student minority composition 0.19 (0.10) Average student performance 0.30 (0.08)*** Number of years served as principal -0.00 (0.01) School communication about the child 0.09 (0.08) Teachers’ efforts to ease the transition into kindergarten for children
-0.01 (0.07)
Teacher-reported parental involvement in school activities 0.09 (0.07) School neighborhood quality -0.06 (0.12) Observers’ overall rating of school safety 0.18 (0.08)* Residential neighborhood quality 0.02 (0.08) Earlier measure Average math score of fall and spring kindergarten 0.78 (0.01)*** 0.78 (0.01)*** 0.78 (0.01)*** 0.78 (0.01)*** Observations 16161 16161 16161 16161 Adjusted R-squared 0.63 0.63 0.64 0.64
Note. Reference group is Non-Hispanic whites. Standard errors shown in parentheses are corrected for school clustering using Huber-White methods. Details about covariates are presented in Appendix Table 1. * p < .05. ** p < .01. *** p < .001. from Europe had a significantly faster learning pace compared to their second-generation counterparts and to non-Hispanic white children. And second-generation children from the Caribbean had a significantly slower learning pace compared to non-Hispanic white children, while first-generation children from Africa had a significantly slower learning pace compared to their second-generation counterparts and to non-Hispanic white children. DISCUSSION AND CONCLUSIONS Taking advantage of a large-scale longitudinal data set
(ECLS-K), this paper examined the developmental experiences of young children in immigrant families with a rich set of factors that have been theoretically and empirically related to individual, parental, family, home environment, and school and neighborhood characteristics. In addition, a change model was examined to see whether the academic learning paces during kindergarten and first grade differed by generation status by country of origin.
Consistent with prior research (e.g., Duncan and Brooks-Gunn, 1997; Shonkoff and Phillips, 2000; Smolensky and Gootman, 2003), the analyses suggest that child and family characteristics were the most important factors to these young children’s academic

314 Educ. Res. Rev. achievements (effect from moderate to large before and small to moderate after controls), which is understandable given children are heavily influenced by their own characteristics and their family in the early years of life. To a lesser degree, the analyses also suggest that home, school, and neighborhood environments exerted some influences on these children’s learning experiences. Analyses that were conducted separately by racial/ethnic origin suggest that (results not shown), in addition to the uniform influence of child and family characteristics on both children of Latin American and Asian origin, home and school environments seemed to matter more to the academic achievement of children of Latin American (i.e., particularly effects of maternal depression, parental educational expectations, participation in and difficulty attending school events, home learning activities, frequency of spanking, student body composition, average student performance, teachers’ efforts to ease the kindergarten transition, teacher-reported parental involvement, and school safety were significant at at least p < .05) than of Asian children (i.e., effects of parental educational expectations, importance of obtaining skills before kindergarten, number of years served as principal, teachers’ efforts to ease the transition, and teacher-reported parental involvement were significant at at least p < .05). The discussion below expands upon these results and the mediating factors that were significant in the regression models by country of origin.
Child and family characteristics were important to the academic differences between all first- and second-generation children and non-Hispanic white children. Latin American children in particular seemed to improve through later generations, which may be largely due to earlier generations' relatively disadvantageous family socioeconomic status and to a lesser extent to home, school, and neighborhood environments. Specifically, the mediating factors suggest that this difference was due in part to lower maternal education, lower family SES, and having a non-English language spoken in the home (and lower attendance in center-based care before kindergarten for first-generation children from the Dominican Republic and Cuba). Although previous studies have shown that families who moved more frequently may be less likely to establish and accumulate social capital to benefit children’s cognitive and social development (Coleman, 1988; Hagan, MacMillan, and Wheaton, 1996), the present math-score estimates for first- and second-generation children of frequent movers were positive, which may reflect parent(s)’ investment in their children by continually moving to better areas. First-generation children from Mexico and Cuba also had significantly higher percentages of low birth weight compared to non-Hispanic white children. On the whole, children from Mexico tended to have the most challenging family backgrounds, which put them in a
disadvantaged position from the start.
Moreover, home environments accounted partially for the lower reading scores for first-generation children from Puerto Rico and Cuba compared to non-Hispanic white children. Specifically, although the former group lived with higher parental educational expectations than non-Hispanic white children, they tended to have parents who participated significantly less in school events, had their children attend fewer extracurricular activities, had more difficulty in attending school events, had less communication with teachers, and provided fewer home learning activities. First-generation children from Puerto Rico also had mothers with higher levels of depression, while first-generation children from Cuba also had mothers who spanked them more. It is worth noting that all first- and second-generation children tended to live with higher parental educational expectations than non-Hispanic white children, but these expectations can only partially account for the differences in children’s academic achievements, other child, family, and home characteristics (e.g. SES and home language) matter, too.
School and neighborhood environments were also important to some groups of Latin American children. Compared to non-Hispanic white children, second-generation children from Mexico and first-generation children from Cuba had significantly lower reading scores, and second-generation children from Puerto Rico and Central America and second-generation children from Mexico had significantly lower math scores. These significant differences either disappeared (for second-generation children from Mexico in reading and math) or became less significant (for first-generation children from Cuba on reading from 1% to 5%, and for second-generation children from Puerto Rico and Central America in math from 1% to 5%). Compared to non-Hispanic white children, these children tended to live in less safe neighborhoods (except for children from Central America) and attend schools with high student minority compositions, generally poor student academic performance (except for first-generation children from Cuba), and poor school safety. It is worth noting that almost all first- and second-generation children from Latin American regions tended to live in these school and neighborhood conditions.
Comparatively, children of Asian origin performed significantly better than non-Hispanic white children on both reading and math skills (except for children from other Southeast Asia who had significantly lower math scores). Even after controlling for all three sets of mediators, children of Asian origin still had significantly higher scores (although the differences became smaller). In some cases (particularly for children from Vietnam/Thailand/Cambodia/Laos), the differences became larger with each set of mediators. On one hand, compared to non-Hispanic white children, children of

Asian origin tended to move more frequently, to have mothers with higher education and more likely to be married at the child’s birth (except for children from Vietnam/Thailand/Cambodia/Laos and other Southeast Asia), to have families with higher SES (except for children from Vietnam/Thailand/Cambodia/Laos and other Southeast Asia), to have parents with higher educational expectations and who valued obtaining skills before entering kindergarten, to have higher family routines, and to attend schools with higher average student academic performance (for children from East Asia and India). On the other hand, they tended to be less likely to speak English at home, to be spanked more (for children from East Asia, other Southeast Asia, and India), to have parents who had more difficulty attending school events and communicated less with teachers, and to attend schools with a higher student minority composition. Children from Vietnam/Thailand/Cambodia/Laos and other Southeast Asia areas in particular had less advantageous characteristics. For example, compared to non-Hispanic white children, they were less likely to attend center-based care before kindergarten, more likely to have parents who provided fewer home learning activities, and to have poor school and and neighborhood safety.
Children from North America, Europe, and Africa tended to have more advantageous child and family characteristics (higher maternal educational attainment, more pre-kindergarten center-based care, and higher family SES). The change from non-significant differences to significant and negative ones for children from North America compared to non-Hispanic white children may further be explained by the advantaged home and school and neighborhood environments experienced by the former, who tended to have parents with higher expectations and family routine, provided more home learning activities, had their children attend more extracurricular activities (except for first-generation children), have schools with higher average student academic performance and parental involvement, and safer residential neighborhoods (except for second-generation children). Children from Africa tended to have similar advantageous school and neighborhood environments, which most likely aided them in outperforming non-Hispanic white children.
It is also important to note that although children of immigrants tended to have either higher or lower scores by first-grade, they usually learned skills at faster paces, which widened (for children of Asian origin) or narrowed (for children of Latin America) the initial gaps in academic achievements. For example, although children from Mexico had significantly lower math scores than non-Hispanic white children by first grade, the former narrowed the gap over time. Children from East Asia and other Southeast Asian countries not only had significantly higher reading scores than non-Hispanic white children
Wei-Jui Han 315 by first-grade, but also learned the skills faster during kindergarten and first grade, thus widening the initial performance gap. Similarly, children from Europe, North America, and Africa learned reading and math skills at faster paces, which may widen the gaps in academic achievements over time.
All in all, the results in this paper indicate that the weaker academic achievements by Latin American children could largely be attributed to their less advantageous family socio-demographic backgrounds, and to a lesser extent their less stimulating home environments and worse school and neighborhood environments. In other words, if all children of Latin American origins had family backgrounds and quality of schools similar to non-Hispanic white children, the former would have had similar, and sometimes even better, academic achievements than the latter. In contrast children of Asian origin tended to have advantageous family backgrounds that contributed to their better academic performance compared to non-Hispanic white children. The former also had more stimulating home environments and attended higher quality schools compared to the latter, and even after controlling for these advantages, they still performed better academically. The higher parental educational expectations coupled with more stimulating home learning activities, attending more extracurricular activities, higher family routines (despite participating less in school events, having more difficulty in attending them, and communicating less with teachers), and advantageous school environments have demonstrated the strong emphasis parents of Asian origin have on children’s academic achievements (Zhou and Bankston, 1994, 1998). These results suggest that the degree of influence of each mediator is different for children of different cultures. For example, while parents in Latin American or Asian societies tend to use more physical discipline than western parents (Baldwin, Baldwin, and Cole, 1990; Portes, Dunham, and Williams, 1986), children in these families do not tend to have more behavioral problems later on (McLoyd and Smith, 2002). Likewise, parents' participation in school activities is positively associated with academic achievements, but only for native-born non-Hispanic white children; children in immigrant families (such as the children of Asian origin in this study) might achieve similarly even without the same level of parent involvement, perhaps partially because of the higher parental educational expectations that have been noted in prior ethnographic studies.
Although a rich set of factors related to child, parental, family, home environment, and school and neighborhood characteristics were considered in this study, several limitations should be considered when interpreting the results. First, although this analysis has distinguished among generations for many countries of origin, ethnic groups themselves are replete with individual differences

316 Educ. Res. Rev. and distinct historical backgrounds, thus making it difficult to define a culture (Bean et al., 1997; Bean and Stevens, 2003; Portes and Rumbaut, 1996; Portes and Zhou, 1993). Second, the results may be biased due to the exclusion of some children who did not complete a direct assessment (especially for children from Mexico and to a lesser extent from Asian countries). Such limitations also reflect the need to include diverse cultures and languages in future data collection and measurement development. Third, given the context of the research questions under examination, the importance of home language on children’s academic learning experiences and in turn on their academic achievements should be acknowledged. Although the current analyses controlled for this factor and the results indicate that home language exerts strong effects in all models – with a significant negative effect on initial academic achievements and a significant positive effect on the changes in academic achievements over time – finer-grained analyses are needed to explain these associations. Fourth, obtaining accurate measurements of socioeconomic status for immigrant families is far more complicated than simply identifying parental education, occupation, or family income (Fuligni and Yoshikawa, 2004), especially because it has been observed that parents in immigrant families tend to have lower-level occupations in the U.S. than they did in their native countries (Portes and Rumbaut, 1996). In addition, many immigrant families remit a large proportion of household income to relatives in their country of origin (Schiller, 1999). Thus, this study's measure of family socioeconomic status may be invalid and biased for many immigrants. Fifth, despite many covariates, the author was still unable to control for some characteristics that might help explain these associations. For instance, information on children's interactions with their teachers and peers, as well as the attitudes of teachers toward children from different cultural backgrounds, may have proved fruitful given previous findings on the importance of these variables for children’s academic achievements (e.g., Conchas, 2001; NICHD ECCRN, 2002b; Suárez-Orozco and Suárez-Orozco, 2001). Additionally, despite including some school-level variables (e.g., student minority composition and average student performance) that have been found to be associated with inadequate educational resources and academic failure (Wang and Gordon, 1994) to proxy the segregation and oppression, the data at hand did not allow this study to fully consider factors unique and important to children's daily experiences in immigrant families and likely their academic development, such as racial discrimination and oppression (García Coll, 1996, 2004). Future studies should utilize both qualitative and quantitative methods to understand the broad patterns as well as the rich and intricate diversity of this subject area.
The results from this paper also show that examining a variety of individual, family, and external environments
allows us to better understand some of the factors important to the developmental experiences of children in immigrant families. The heterogeneity of these children as described above further highlights the need for more research consisting of intricate analyses of the ways that familial and social factors intersect in shaping families’, and especially, children's experiences. Specifically, future research should attempt to account for as many aspects of children's culturally shaped social and educational environments as possible because they are essential pieces to our understanding of children's cognitive and emotional development. In addition, while this paper has attempted to provide a general overview of the developmental experiences of young children in many immigrant groups, future research focusing on the similarities and differences within particular immigrant and cultural groups is needed to provide us with a more in-depth understanding of young children in immigrant families. Without a detailed understanding of these complex interactions, we cannot construct informed and effective policies to address the needs of immigrant families today.
ACKNOWLEDGEMENT The Author would like to thank Katherine Magnuson, Ruby Takanish, Jane Waldfogel, and participants at “The Next Generation: Immigrant Youth and Families in Comparative Perspective” conference for valuable discussions, and Rocky Citro for wonderful editorial assistance. In addition, the author gratefully acknowledges support from the Foundation for Child Development Young Scholars Program. REFERENCES Baldwin AL, Baldwin C, Cole RE (1990). Stress-resistant families and
stress-resistant children. In: JE Rolf, AS Masten (Eds.), Risk and protective factors in the development of psychopathology. New York: Cambridge University Press. pp. 257-280.
Bean FD, Van Hook J, Glick JE (1997). Country-of-origin, type of public assistance, and patterns of welfare recipiency among U.S. immigrants and natives. Social Science Quarterly, 78(2), 432-451.
Bean FD, Stevens G (Eds.). (2003). America’s newcomers and the dynamics of diversity. New York: Russell Sage Foundation.
Belsky J (2001). Developmental risk (still) associated with early child care.” J. Child Psychol. Psychiatry, 42, 845-860.
Benard B (1991). Fostering resiliency in kids: Protective factors in the family, school, and community. Portland, OR: Northwest Regional Educational Laboratory.
Board on Children and Families, Commission on Behavioral and Social Sciences and Education, National Research Council, Institute of Medicine. (1995). Immigrant children and their families: Issues for research and policy. The Future of Children, 5(2), 72-89.
Booth A, Crouter AC, Landale N (eds.). (1997). Immigration and the family: Research and policy on U.S. immigrants. New Jersey: Lawrence Erlbaum Associates.
Borman G, Overman LT (2004). Academic resilience in mathematics among poor and minority students. The Elementary Sch. J. 104(3),

177-195. Bornstein MH, Gist NF, Hahn CS, Haynes OM, Voigt MD (2001). Long-
term cumulative effects of daycare experience on children’s mental and socioemotional development. National Institute of Child Health and Human Development, mimeo.
Bradley RH (1995). Environment and parenting. In M.H. Bornstein (ed.), Handbook of Parenting: Volume 2, Biology and Ecology of Parenting New York: Erlbaum. pp. 235-261.
Bradley RH, Caldwell BM, Rock SL, Ramey CT, Barnard KE, Gary C, Hammond MA, Mitchell S, Gottfried AW, Siegel L, Johnson D (1989). Home environment and cognitive development in the first 3 years of life: A collaborative study involving six sites and three ethnic groups in North America. Developmental Psychology, 25(2), 217-235.
Bronfenbrenner U (1979). The ecology of human development: Experiments by nature and design. Cambridge, MA: Harvard University Press.
Bronfenbrenner U (1986). Ecology of the family as a context for human development: Research perspectives. Developmental Psychology, 22, 723-742.
Bryk AS, Lee VE, Holland PB (1993). Catholic schools and the common good. Cambridge, MA: Harvard University Press.
Caplan N, Choy MH, Whitmore JK (1991). Children of the boat people: A study of educational success. Ann Arbor, MI: University of Michigan Press.
Chao RK (1994). Beyond parental control and authoritarian parenting style: Understanding Chinese parenting through the cultural notion of training. Child Development, 65, 1111-1119.
Chao RK (2001). Extending research on the consequences of parenting style for Chinese Americans and European Americans. Child Development, 72, 1832-1843.
Cohen J (1977). Statistical power analysis for the behavioral sciences (revised edition). New York: Academic Press.
Coleman J (1988). Social capital in the creation of human capital. Am(r). J. Sociol., 94(supp), S95-S120.
Conchas GQ (2001). Structuring failure and success: Understanding the variability in Latino school engagement. Harvard Educational Review, 71, 475-504.
Conger RD, Conger KJ, Elder GH, Jr, Lorenz FO, Simons RL, Whitbeck LB (1992). A family process model of economic hardship and adjustment of early adolescent boys. Child Development, 63, 526-541.
Crosnoe R (2005). Double disadvantage or signs of resilience? The elementary school contexts of children from Mexican immigrant families. Am(r). Edu. Res. J. 42(2), 269-303.
Denton K, West J (2002). Children’s reading and mathematics achievement in kindergarten and first grade. Washington, DC: U.S. Department of Education.
Duncan G, Brooks-Gunn J (eds.) (1997). Consequences of growing up poor. New York: Russell Sage Foundation.
Elder GH, Conger RD, Foster EM, Ardelt M (1992). Families under economic pressure. J. Family Issues, 13, 5-37.
Fuligni AJ (1997). The academic achievement of adolescents from immigrant families: The roles of family background, attitudes, and behavior. Child Development, 68, 351-363.
Fuligni AJ, Tseng V, Lam M (1999). Attitudes toward family obligations among American adolescents with Asian, Latin American, and European backgrounds. Child Development, 70, 1030-1044.
Fuligni AJ, Yoshikawa H (2004). Investments in children among immigrant families. In: A Kalil, T DeLeire (eds.), Family Investment in Children’s Potential. Mahwah, NJ: Lawrence Erlbaum Associates, Inc. pp. 139-162.
García Coll C, Lamberty G, Jenkins R, McAdoo HP, Crnic K, Wasik BH, García HV (1996). An integrative model for the study of developmental competencies in minority children. Child Development, 67(5), 1891-1914.
García Coll C, Szalacha LA (2004). The multiple contexts of middle childhood. The Future of Children, 14(2), 81-97.
Gibson MA (1991). Ethnicity, gender, and social class: The school adaptation patterns of West Indian youths. In: MA Gibson, JU Obgu (eds.), Minority status and schooling: A comparative study of
Wei-Jui Han 317
immigrant and involuntary minorities. New York: Garland. pp. 169-204.
Gibson MA, Bhachu PK (1991). The dynamics of educational decision making: A comparative study of Sikhs in Britain and the United States. In: MA Gibson, JU Obgu (eds.), Minority status and schooling: A comparative study of immigrant and involuntary minorities. New York: Garland. pp. 63-96.
Griffith J (2000). School climate as group evaluation and group consensus: Student and parent perceptions of the elementary school environment. The Elementary Sch. J. 101 (1), 35-61.
Griffith J (2003). Schools as organizational models: Implications for examining school effectiveness. The Elementary Sch. J. 104(1), 29-47.
Hagan J, MacMillan R, Wheaton B (1996). New id in town: Social capital and the life course effects of family migration on children. American Sociological Review, 61, 368-385.
Herderson N, Milstein MM (1996). Resiliency in schools: Making it happen for students and educators. Thousand Oaks, CA: Corwin.
Hernandez DJ (ed.). (1999). Children of immigrants. National Research Council Committee on the Health and Adjustment of immigrant Children and Families, Washington, DC: National Academy Press.
Huff R, Trump K (1996). Youth violence and gangs: School safety initiatives in urban and suburban school districts. Educational and Urban Society, 28, 492-503.
Johnson DJ, Jaeger E, Randolph SM, Cauce AM, Ward J, National Institute of Child Health and Human Development Early Child Care Research Network. (2003). Studying the effects of early child care experiences on the development of children of color in the United States: Toward a more inclusive research agenda. Child Development, 74(5), 1227-1244.
Johnson MK, Crosnoe R, Elder GH, Jr (2001). Student attachment and academic engagement: The role of ethnicity. Sociology of Education, 74, 318-340.
Kao G, Tienda M (1995). Optimism and achievement: The educational performance of immigrant youth. Social Science Quarterly, 76, 1-19.
Lamb ME (1998). Nonparental child care: Context, quality, correlates, and consequences. In: W Damon (general ed.) and IE Sigel, KA Renninger (volume eds.) Handbook of child psychology, 5th edition, Volume 4: Child psychology in practice. New York: John Wiley and Sons, Inc. pp. 73-133.
Lee VE, Burkham D (2002). Inequality at the starting gate: Social background differences in achievement as children begin school. Washington, DC: Economic Policy Institute.
Lee VE, Winfield LF, Wilson TC (1991). Academic behaviors among high-achieving African American students. Education and Urban Society, 24, 65-86.
Louie V (2001). Parents’ aspirations and investment: The role of social class in the educational experiences of 1.5- and second-generation Chinese Americans. Harvard Educational Review, 71, 438-474.
Magnuson K, Meyers MK, Ruhm C, Waldfogel J (2004). Inequality in preschool education and school readiness. Am(r) Edu. Res. J. 41(1), 115-157.
Mahoney JL (2000). School extracurricular activity participation as a moderator in the development of antisocial patterns. Child Development, 71, 502-516.
Masten AS (1994). Resilience in individual development: Successful adaptation despite risk and adversity. In: MC Wang, FW Gordon (Eds.), Educational resilience in inner-city America: Challenges and prospects. Hillsdale, NJ: Erlbaum. pp. 3-25.
Matute-Bianchi ME (1986). Ethnic identities and patterns of school success and failure among Mexican-descent and Japanese-American students in a California high school: An ethnographic analysis. Am(r). J. Edu. 95, 233-255.
McLoyd VC (1990). The impact of economic hardship on black families and children: Psychological distress, parenting, and socioemotional development. Child Development, 61, 311-346.
McLoyd VC, Smith J (2002). Physical discipline and behavioral problems in African American, European American, and Hispanic children: Emotional support as a moderator. J. Marriage and Family, 64, 40-53.

318 Educ. Res. Rev. McLoyd VC, Wilson L (1991). The strain of living poor: Parenting, social
support, and child mental health. In: AC Huston (ed.), Children in poverty. Cambridge: Cambridge University Press. pp. 105-135.
McNeal RB, Jr (1995). Extracurricular activities and high school dropouts. Sociology of Education, 68, 62-80.
McNeal R (1997). High school dropouts: A closer examination of school effects. Social Science Quarterly, 78, 209-222.
Moody J (2001). Race, school integration, and friendship segregation in America. Am(r). J. Sociol. 107(3), 679-716.
Moore KA, Halle T (1997). Positive youth development. Washington, D.C. Child Trends, Inc.
National Center for Education Statistics [NCES] (2002). ECLS-K longitudinal kindergarten-first grade public-use data files and electronic code book. Retrieved February 15, 2003 from http://nces.ed.gov/ecls/KinderInstruments.asp
NICHD Early Child Care Research Network (1999). Child care and mother-child interaction in the first 3 years of life. Developmental Psychology 35(6): 1399-1413.
NICHD Early Child Care Research Network (2000). The relation of child care to cognitive and language development. Child Development, 71(4), 960-980.
NICHD Early Child Care Research Network (2002a). Early child care and children’s development prior to school entry: Results from the NICHD Study of Early Child Care. Am(r) Edu. Res. J. 39, 133-164.
NICHD Early Child Care Research Network (2002b). The relation of first grade classroom environment to structural classroom features, teacher, and student behaviors. The Elementary Sch. J., 102, 367-387.
Nord CW, Griffin JA (1999). Educational profile of 3- to 8-year-old children of immigrants. In: DJ Hernadez (ed.) National Research Council Committee on the Health and Adjustment of immigrant Children and Families, Children of immigrants: Health, adjustment, and public assistance . Washington, DC: National Academy Press. pp. 348-409.
Ogbu JU (1978). Minority education and caste: The American system in cross-cultural perspective. New York: Academic Press.
Ogbu JU (1981). Origins of human competence: A cultural ecological perspective. Child Development, 52, 413-429.
Ogbu, J. U. (1988). Cultural diversity and human development. In: D Slaughter (Ed.), Black children and poverty: A developmental perspective. San Francisco: Jossey-Bass. pp. 11-28.
Ogbu J (1991). Minority coping responses and school experience. J. Psychohistory, 18(4), 433-456.
Ogbu JU, Simons HD (1998). Voluntary and involuntary minorities: A cultural-ecological theory of school performance with some implications for education. Anthropology and Education Quarterly, 29, 155-188.
Pérez Carre�n G, Drake C, Barton AC (2005). The importance of presence: Immigrant parents’ school engagement experiences. Am(r). Educ. Res. J. 42(3), 465-498.
Pessar PR (1995). A visa for a dream: Dominicans in the United States. Boston, MA: Allyn and Bacon.
Petterson SM, Albers AB (2001). Effects of poverty and maternal depression on early child development. Child Development, 72(6), 1794-1813.
Portes A, MacLeod D (1999). Educating the second generation: Determinants of academic achievement among children of immigrants in the United States. J.Ethnic and Migration Studies, 25(3), 373-396.
Portes A, Rumbaut RG (1996). Immigrant America: A portrait. (2nd ed). Berkeley, CA: University of California Press.
Portes A, Zhou M (1993). The new second generation: Segmented assimilation and its variants. Annals of the American Academy, 530, 74-96.
Protes PR, Dunham RM, Williams S (1986). Assessing child-rearing style in ecological settings: Its relation to culture, social class, early age intervention and scholastic achievement. Adolescence, 21, 723-735.
Rosenthal DA, Feldman SS (1991). The influence of perceived family and personal factors on self-reported school performance of Chinese
and western high school students. J. Res. Adolescence, 1, 135-154. Rumbaut RG (1994). The crucible within: Ethnic identity, self-esteem
and segmented assimilation among children of immigrants. International Migration Review, 28, 748-794.
Rumbaut RG (1995). The new Californians: Comparative research findings on the educational progress of immigrant children. In: RG Rumbaut, W Cornelius (eds.), California’s immigrant children. LaJolla, CA: Center for U.S.-Mexican Studies. pp. 17-69.
Rumbaut RG (1997). Ties that bind: Immigration and immigrant families in the United States. In: A Booth, AC Crouter, N Landale (eds.), Immigration and the family: Research and policy on U.S. immigrants. New Jersey: Lawrence Erlbaum Associates. pp. 3-46.
Sampson R, Groves W (1989). Community structure and crime: Testing social disorganization theory. American Journal of Sociology, 94, 774-802.
Schiller NG (1999). Transmigrants and nation-states: Something old and something new in the U.S. immigrant experience. In: C Hirschman, P Kasinitz, J DeWind (eds.), The Handbook of International Migration. New York: Russell Sage Foundation.
Shonkoff JP, Phillips DA (eds) (2000). From neurons to neighborhoods: The science of early childhood development. Washington, DC: National Academy Press.
Siantz dL, ML (1997). Factors that impact developmental outcomes of immigrant children. In: A Booth, AC Crouter, N Landale (Eds.), Immigration and the family: Research and policy on U.S. immigrants. Mahwah, New Jersey: Lawrence Erlbaum Associates, Publishers. pp. 149-161.
Smolensky E, Gootman J (eds.) (2003). Working families and growing kids: Caring for children and adolescents. Washington, DC: The National Academies Press.
Suárez-Orozco C, Suárez-Orozco MM (1995). Transformations: Immigration, family life, and achievement motivation among Latino adolescents. Stanford CA: Stanford University Press.
Suárez-Orozco C, Suárez-Orozco MM (2001). Children of immigration. Cambridge, MA: Harvard University Press.
US Census Bureau (2004). The foreign-born population in the United States: 2004. Retrieved on August 1, 2005 from http://www.census.gov/population/www/socdemo/foreign/ppl-176.html.
Valencia R (2000). Inequalities and the schooling of minority students in Texas. Hispanic Journal of Behavioral Sciences, 22, 445-459.
Valenzuela A (1999). Subtractive schooling: U.S.-Mexican youth and the politics of caring. Albany, NY: State University of New York Press.
Wang MC, Gordon EW (Eds.). (1994). Educational resilience in inner-city America: Challenges and prospects. Hillsdale, NJ: Erlbaum.
Weinraub M, Jaeger E (1990). The timing of mothers’ return to the workplace: Effects on the developing infant-mother relationship. In: J Hyde, M Essex (eds.), Parental leave and child care. Philadelphia: Temple University Press. pp. 307-322.
Wilson WJ (1987). The truly disadvantaged: The inner-city, the underclass, and public policy. Chicago, IL: The University of Chicago Press.
Zhou M, Bankston CL III (1994). Social capital and the adaptation of the second generation: The case of Vietnamese youth in New Orleans. International Migration Review, 28(4), 821-845.
Zhou M, Bankston CL III (1998). Growing up American: How Vietnamese children adapt to life in the United States. New York: Russell Sage Foundation.