academic senate 2 p.m. – 4 p.m
TRANSCRIPT

SAN JOSE STATE UNIVERSITY Engineering 285/287 Academic Senate 2 p.m. – 4 p.m.
2017/2018 Academic Senate
MINUTES October 9, 2017
I. The meeting was called to order at 2:00 p.m. and roll call was taken by the Senate Administrator. Forty-five Senators were present.
Ex Officio: Present: Frazier, Van Selst, Manzo, CASA Representatives:
Lee, J. Present: Schultz-Krohn, Shifflett, Grosvenor, Chin Absent: Sen
Administrative Representatives:Present: Feinstein, Faas, COB Representatives:
Wong(Lau), Willey Present: Rodan, Bullen, He Absent: Papazian Absent: None
Deans: EDUC Representatives: Present: Jacobs, Elliott, Stacks Present: Marachi, Mathur Absent: None Absent: None
Students: ENGR Representatives: Present: De Guzman, Gill, Hospidales, Present: Chung, Sullivan-Green
Tran, Busick, Donahue Absent: Hamedi-HaghAbsent: None
H&A Representatives:Alumni Representative: Present: Ormsbee, Khan, Riley, Bacich, McKee Present: Walters Absent: None
Emeritus Representative: SCI Representatives: Present: Buzanski Present: White, Kim, Rangasayee
Absent: Cargill Honorary Representative:Absent: Lessow-Hurley SOS Representatives:
Present: Peter, Wilson, Curry, LiuGeneral Unit Representatives: Absent: HartPresent: Trousdale, Higgins,
Kauppila Absent: Matoush
II. Approval of Academic Senate Minutes– The minutes of September 18, 2017 were approved with no objection.
III. Communications and Questions – A. From the Chair of the Senate: Chair Frazier welcomed Senators and announced this was a special Senate meeting devoted solely to budget presentations.
Chair Frazier announced that the fires in Sonoma had caused mass evacuations and that our former Dean of the College of Humanities and the Arts, Lisa Vollendorf, who is now Provost at Sonoma State University, had been evacuated from her home. However, the President of Sonoma State University, Judy Sakaki, lost her home in the fire.
1

Chair Frazier congratulated former Senator Romey Sabalius on being appointed the Faculty Trustee. Professor Sabalius thanked the President, Provost, and Senators for all their support. Senator Buzanski asked Professor Sabalius if he would be willing to come to the Senate meetings and give the Senate information about issues before the Board of Trustees? Senator Shifflett announced that the Organization and Government Committee would be bringing a resolution to address this at the next Senate meeting.
B. From the President of the University – Not present.
IV. State of the University Announcements. Questions. In rotation. A. Chief Diversity Officer (CDO) – No report.
B. Provost: No report.
C. Vice President of Finance and Administration (VPAF): No report.
D. CSU Statewide Senators – No report.
E. Associated Students President (AS) – No report.
V. Executive Committee Report: A. Minutes of the Executive Committee: No minutes for review.
B. Consent Calendar: There was no dissent to the consent calendar of October 9, 2017.
C. Executive Committee Action Items:
VI. Policy Committee and University Library Board Action Items. In rotation. A. Curriculum and Research Committee (C&R) – No report. B. University Library Board (ULB) – No report. D. Organization and Government Committee (O&G) – No report. E. Instruction and Student Affairs Committee (I&SA) – No report. E. Professional Standards Committee (PS) – No report.
VII. Special Committee Reports – Vice President for Administration and Finance, Charlie Faas, gave a presentation on the state of the university budget for 2017-2018. (See PowerPoint slides attached.)
2

Questions:
Q: How much of the IT Operating Fund expenditure is for hardware versus software? A: It might be worthwhile for Bob Lim to come in and talk to the Senate about what his vision is. Part of Bob’s increase this year was to fund the new Peoplesoft initiatives.
Q: Over the summer the restroom in the Engineering Building was redone. However, nothing was done to the restrooms in the old building. What method was used to determine what restrooms got updated? For the past year, one or the other stalls has been out of order in the bathroom in the old building on the first floor. A: It will be taken care of now.
Q: Is there discussion in University Advancement about tracking donor behavior at SJSU, such as in finding out if there is a drain of donations from other areas on campus in order to fund athletic renovations? A: The main donor we had on South campus this year donated close to $10 million. They weren’t given a dime from the university, so there is no redirection of their money to anywhere else. About ½ a billion dollars in construction efforts is going on right now on campus compared to a few million going in construction at South Campus.
Q: Many years ago lottery funds were allocated largely by a committee. Over the last decade or so, all the lottery funds have gone to the library. My concern is whether these funds are being used to replace regular funding for the library. The Lottery Act states that the net revenue of the lottery funds shall not be used as substantive funds but shall supplement the total amount of money allocated, and no program shall have the amount appropriated to support that program reduced as a result of funds allocated. If these funds are being used to support our acquisitions budget, what’s left of the acquisitions budget other than lottery funds? Have we reduced the library’s acquisitions budget as a result of having the lottery funds, and if we’ve done that, wouldn’t we be vulnerable to some kind of audit about how we are using these lottery funds? A: VP Faas will look into this and get back to the Senate with an answer.
Q: This relates to slide number 4. We receive an alert almost every single day about some crime being committed. For instance, this morning when walking to my office on campus I almost got hit by someone on a skateboard, then a bicycle, and then by a car. I’m hoping we have some budget for police to patrol, especially at night, to increase security? Also, a nice job was done on the S2 locks, but are they going to be finished soon? A: I want our police staff to be way more visible than they are. Skateboarders are hard to control. We spent a lot of time redoing the Chavez arch and every morning when I come in I see skateboard and bike marks on it. It’s a shame.
Q: Can you talk about the upcoming capital campaign and where would that money go? A: What I’ve asked the VP of University Advancement to do is to come talk about the plan and where it goes to, how long it takes to collect it, how it gets distributed, how
3

much we are looking to raise, what levels do you spend, and what the plans are for those funds.
Q: Where is the increased tuition money being directed? A: In general, it goes to those four categories I talked about for student success, and they include safety, capital improvements, etc. It’s not anything in particular. It is everything in general.
Q: On the 16th sheet of the budget report you have a comparison of the large campuses. I find this very helpful in terms of where we compare with other campuses in terms of expenditures. There is one thing that stands out and that is our student financial aid and that is very low compared to the other campuses. Is that just a reflection of the socioeconomic standing of our students, or are our students not applying for financial aid as much as they should? A: Good question. The Provost and VP of Administration and Finance will look into this.
Q: Where are many of the resource centers and where does their funding come from? A: For many of our resource centers, most of the funding is going to come from Student Affairs for staffing. We added a number of resource centers this year and we still have the DACA area that is coming online. Provost Feinstein announced he contributed to several of the resource centers last year as part of his student success efforts.
Dr. Bradley Olin, Interim AVP of Academic Budgets and Planning, gave a presentation on the Academic Affairs Budget for AY 2017-2018. (See PowerPoint slides attached.)
Questions:
Q: On last year’s spending down college reserves, line 24, some items there look to be ongoing costs and not one-time costs. If it is spending down money, how do you sustain the ongoing costs? A: A lot of these can be treated as one-time expenses. AVP Olin agrees some of these should be ongoing expenses in principle, but to some extent the colleges do have some control over the financial levers and to the extent there are ever salary savings in the vacant positions or ongoing recruitment, this is what generates surplus at the end of the year.
Q: A few years ago there was no report from Academic Affairs and we requested that a report be given and this has been wonderful. Thank you. A few years ago we asked that something be done about tenure density and only recently has something being done about tenure density. We complained there wasn’t anything being done about bottleneck courses and only recently has anything been done about bottleneck courses. Then we complained that there wasn’t any money for Research, Scholarship, and Creative Activity (RSCA) and only recently have funds been allocated for RSCA. The Senate should applaud our leadership for granting these requests that have been made for years and
4

have only recently been fulfilled. Now if we could look at the marginal cost of instruction by college, I’m representing the COSS. There was a time that faculty-student ratios were used to allocate funds to colleges. At that time COSS was tied with COB, but now we are at the bottom of the barrel. What do we need to do to crawl out of our hole so that we are not so far behind the other colleges in the amount of resources for our students? Wouldn’t it be in the best interest of the university to admit many more COSS majors, since each one of them brings far more resources than they are costing us? A: In terms of raising the marginal cost of instruction, three things come to mind. One is that the more that you concentrate the classroom density, the more your marginal cost of instruction goes up. The same would be said about increasing faculty salaries. During the RTP process as faculty salaries are increased, certainly through the collective bargaining process as well, general salary increases, those all have an impact on the marginal cost of instruction. Then any increases in assigned time also have an impact. More assigned time actually equals a LOWER cost of instruction since lecturers are paid to replace a T/TT faculty instructor. These levers are under the purview of the deans. Q: Is there a chance that the COSS is being punished for being very, very efficient in 2012? A: To go back to that remember that no college pierced the ceiling of what we call the marginal cost of instruction. The 2012-2013 actuals are what established that baseline. Since that time everyone has pretty much fell below that mark. However, I don’t think the COSS is at the bottom of the barrel any longer, but I don’t have the information with me. A: If you recall back in 2012-2013 and 2013-2014, first there was a drop in resources in 2012-2013, and then a restoration of those resources in 2013-2014. What we have basically done is as the absorption of the base funding back to the colleges occurred, colleges have not actually spent all of the money that they are requiring. Also, we retired 180 faculty members over the last three years. We have not actually reached that ceiling where we are spending more than we’ve allocated.
Q: What is the number of actual tenured faculty we have at the university? A: It is close to 700 tenure/tenure-track and 1,200 lecturers. Q: Of those 700 tenure/tenure-track, about how many of those actually do have tenure? A: We will do some research and report back to the Senate. [AVP Olin reports that the number of tenured faculty members as of 16/17 is 464.] Q: In terms of figuring out the ratio, you mentioned 1,200 lecturers and are they full-time? A: They are all across the board. The FTEF of the lecturers is equivalent to the FTEF of the tenure/tenure-track faculty. There is about 680 FTEF for lecturers.
Q: Over a four-year period you have the same proportion for everyone and that seems like an impossibility. A: I wouldn’t say impossible. We have experienced some changes, but we certainly are back at our original state except for our international numbers. Also, this is just the Frosh. We have had tremendous growth at the graduate level with international students, just not at the undergraduate level. About 11% of our students are graduate students.
5

Q: In slide 11, advising is at 3.7 million, but if you look at number two and three together that is about 1.4, so I’m curious if you can explain this huge difference and if you think of advising as being the main problem in access to classes? Why is advising so much more than restructuring and tutoring? A: The four pillars are not necessarily exclusive of each other. I think advising had a deeper hole to climb out of than some of these other initiatives. When we talk about hiring 50 advisors over a number of years those costs, including salary and benefits, those are not going to be taken lightly. Advising was clearly identified as a way to improve student success outcomes, but that is not to say it is at the expense of other things. However, you can only throw so much money at Math or English restructuring at one time to change the course of it.
Q: What does our net gain of tenure/tenure-track faculty look like? A: Our average net faculty gain per year over the last three years has been 20. We hire 50 faculty members a year, but the net increase is only 20.
Q: What are the outcomes of advising? A: We are working on a final draft of that right now. Q: As far as the library acquisitions, some things are beyond our control as part of the CSU and others are not. The library didn’t add any resources this year, but saw a 5% increase in cost. Trying to keep up with that is difficult. The library is trying to look for more stable funding. Also, the Provost for 17/18 rolled out a new model for the library to allow for flexibility when their FTES increases. The problem is the way the vendors bundle the resources. It really is more about the copyright and not the cost of the materials.
Q: We invested a lot of advisors and that took care of students being able to get an advising appointment, but do you know how much was spent on the quality of the advising versus the quantity of advisors? It is one thing to have an advising appointment, but what money is being spent on training the advisors? A: Yes, we make sure our advisors have the training they need, and also that their caseloads are manageable. In partnership with Student Affairs, Academic Affairs is not only hiring new advisors, but also purchasing a whole suite of new technological tools to assist students to help themselves.
Q: Years ago, there was only the School of Humanities and the Arts. The Provost, at the time, divided the College of Humanities and the Arts into Humanities and the Arts and Social Sciences. The idea was to divide them equally. It turned out it was just about equal except for the History Department and the department had to make a choice where they wanted to go. Unfortunately, History made the wrong choice. I’m just wondering how much better off the History Department would be today if we had made a different choice? A: [laughter]
6
Q: I think it is great we are tracking advisors, but I’ve received complaints from students that say that the advisors are not very welcoming, and that the students feel that the advisors feel it is a burden to help them. A: We want to know about that. That is unacceptable. Q: We give faculty ratings on classes, is there something along those lines we could give to the advisors? A: There should be some way to provide evaluation of advisors. We don’t want students to feel this way. The Provost will address this.
VIII. New Business – None
IX. Adjournment – The meeting adjourned at 4:02 p.m.
7

2017/18 Annual Budget Report
Charlie Faas VP Administration & Finance/CFO

Fiscal Year Budget Overview
Increase in tuition and General Fund appropriation Tuition rate increase ($270, 4.9% increase) +240 funded FTES
CSU Budget Adjustments $20M Funded enrollment growth $2.6M GI 2025 $3.5M Student Aid $2.2M Mandatory Costs, Compensation, & Benefits $12.0M
Operating base budget $357M +$22M over FY1617 budget of $335M
SJSU Total Operating Budget $625M +$25M over FY1617 budget of $601M
Internal budget process: base vs. one-time, three-year outlook 2

Leadership Priorities
Graduation Initiative 2025 - $10.8M GI 2025 Support Sources 2015/16 -2017/18 ($25M)
Advising ($5M)
Clearing Bottlenecks ($2M)
College Readiness ($2M)
Student Engagement ($1M)
Academic Affairs
Reserves 5%2%
SSETF Student Success
24%
Campus Funds 33%
State Support
36%
Koret Foundation
3

Leadership Priorities
Campus Safety and Security Enhancements University Police Department staffing and operations ($913K) MLK Library atrium project ($1.5M) Housing fire life safety projects ($4.5M) Parking cameras ($310K) Classroom clocks ($600K)
4

Leadership Priorities
Planning and Economic Development New Interdisciplinary Science and Innovation Building ($1.5M) Space management and planning ($400K) Campaign staffing and operations ($600K) Hammer Theatre ($1.35M) Welcome Center ($145K)
5

Leadership Priorities
Continually Funding Deferred Maintenance and Capital Improvements Continued focus on aging infrastructure ($2.3M)
- DMH - HGH restrooms ($150K) - Concrete repairs ($760K)
Engineering Building Restroom, Elevator ($1.1M) Fire alarm upgrades ($600K)
6

Capital Improvements
Externally Funded Projects CIES Space in Student Union
- Non General Fund
Spartan Golf Complex - Donor funded
South Campus Plan: Softball, Tennis Complex, Track and Field - Donor / Student Union funded
Ongoing Major Capital Projects Student Recreation & Aquatic Center ($132M)
- Student Union fees
Interdisciplinary Science and Innovation Building ($148M) - CSU funded with campus contribution required
7

SJSU Revenue Budgets
Total $625M
Operating Fund $357M
Athletics Self-
Support $12M
Housing $46M
Parking $6M
Extended Ed.
$33M
Lottery, Other
Revenues $5M
Spartan Shops $25M
Research Fndn $55M
Tower Fndn $33M
Associated Students
$8M
Student Union $11M
Student Health $14M
SSETF $21M
8

Operating Fund Expenditures by Division FY17/18 Budget
Organizational University-Wide Office of the President Development 9.7%
0.8% 1.3%
Academic Affairs 63.1%
Admin & Finance
8.9%
Student Affairs 6.6%
Intercollegiate Athletics
2.4%
University Advancement 2.1%
Information Technology 5.2%
Chart above displays the breakdown of the Operating Fund Base expenditure budget. Budget excludes Restricted Student Aid (primarily a U-Wide tuition discount). Consistent with FY16/17 chart, the benefits are distributed across Divisions. Intercollegiate Athletics does not include one-time funding as reported last year. More details are available in the Annual Budget Report (p. 8). 9

Breakdown of Operating Fund Categories FY17/18 Budget
Financial Aid
Salaries 50%
Benefits 25%
Operating Expenses & Equipment
10%
Utilities 3%
12%
10

For more information, visit:
http://www.sjsu.edu/finance/about_us/budget/budget_reports/
http://www.sjsu.edu/adminfinance/about/budget_central/
http://www.sjsu.opengov.com
11

Main Campus – May 2017
12

Appendix
13

Athletics Operations $29.5 million FY17/18 Budget
Revenue Sources Operating Funds, SSETF-IRA, Ticket sales, conference distribution,
game guarantees, NCAA distribution and development
Functions Supports operating and travel costs for all sports Grants in Aid for student-athletes
Highlights / Accomplishments Spartan Golf Complex facility on South Campus Establish on the University’s tradition of academic & athletic
excellence Recruit and retain top athletes by providing financial incentives
through scholarship 14

Student Health $14.0 million FY17/18 Budget
Revenue Sources Student Health & Health Facility Fees Fee-for-service
Functions Support and provide student health & mental health services Promote health and well-being of student community
Highlights / Accomplishments Student Health & Wellness Center Increased Counseling & Preventative Health support
15

University Housing Services $46.3 million FY17/18 Budget
Revenue Sources Housing Rent and Fees Other Lodging and Conference Fees Rent for Dining Commons and Village Market
Functions Support housing operations & programs
Highlights / Accomplishments Over 4,000 residents Campus Village II opened in Fall 2016 Renovations in Washburn Hall, Joe West Hall Housing Feasibility Study to be initiated in Fall 2017
16

Parking Funds $6.4 million FY17/18 Budget
Revenue Sources Parking permit sales and parking citation fines
Functions Parking operations and enforcement costs Maintenance and repair to existing facilities Alternative transportation program
Highlights / Accomplishments Parking garage cameras, security improvements underway Parking permits available online Provide Park & ride courtesy shuttle Updated bus fleet (2 buses in FY16/17, 1 expected FY17/18)
17

Continuing and Extended Ed $33.4 million FY17/18 Budget
Revenue Sources Tuition and fees from for-credit & noncredit programs
Functions Extended ed. operations and program/curriculum development
Highlights / Accomplishments New Programs: Master of Criminology with Concentration in Global
Criminology, Masters in Nursing with Concentration in Family Nurse Practitioner, among others.
New CIES space in the Student Union - Summer 2017 Partnership with College of Science to build out part of new
Interdisciplinary Science and Innovation Building
18

Student Success, Excellence & Technology Fee $20.6 million FY17/18 Budget
Revenue Sources Student Success, Excellence & Technology Fee Expenditures reviewed by CFAC & Approved by President
Functions Instructionally Related Activities Course Support Student Success
Supported Initiatives Spartan Scholars Program SASS Programs (Task Forces) Academic Technology Improvements
19

Associated Students $8.1 million FY17/18 Budget
Revenue Sources Fees, program revenues, grants and contracts Fee changes must be approved by student referendum
Student fees support AS programs Student Leadership and governance Child Care Center Campus Life Transportation
20

Research Foundation $55.2 million FY17/18 Budget
21
Revenue Sources Federal and state grants and contracts, fees, investment income, and
other revenues
Restrictions Most funding tied to grants or specific programs
Highlights / Accomplishments The Research Foundation also provides employment support to more
than 1,800 individuals, including faculty, students, research affiliates, and staff.
Program sites are located on the SJSU main campus, Moss Landing Marine Laboratories, NASA-Ames Moffett Field, and several other locations.

Spartan Shops $25.1 million FY17/18 Budget
Revenue Sources Dining, event, retail, and real estate services, commissions, interest
and other income
Division Functions Writing Request for Proposal to outsource operations Retail Services operates the Barnes & Noble Bookstore; the current
contract extends through June 30, 2026 Event Services division provides concessions and retail to Event
Center Arena, Hammer Theatre, and Spartan Stadium Real Estate Services to SJSU faculty and staff
22

Student Union $11.4 million FY17/18 Budget
Revenue Sources Mandatory Student Union Fee
Functions Supports Student Union Operations Capital Construction (SU Expansion & New SRAC)
Highlights / Accomplishments Student Union Spaces booked for entire year Construction progress on the new Student Recreation & Aquatic Center
(SRAC)
23

Tower Foundation $32.5 million FY17/18 Budget
Revenue Sources Gifts, pledges, investment income
Functions As a 501(c)(3) auxiliary organization, Tower Foundation directly
manages all financial aspects of funds donated to San Jose State University
Tower Foundation Board approves the annual endowment distribution rate (4% for FY17/18)
Highlights / Accomplishments $140+ million endowment comprised of over 600 individual funds Tower Foundation supporting the expansion of South Campus
24

2017-18 Presentation to the Academic Senate
October 9, 2017
Bradley Olin, Ed.D.
Interim AVP of Academic Budgets and Planning Office of the Provost

Presentation Overview
1. Incoming Class Profile
2. 2017/18 Budget Planning Priorities
3. Looking Ahead

Incoming Class Profile

First Generation
Share of New Freshmen Who Were First Generation to Attend College
29% 30%
Fall 2013 Fall 2014 Fall 2015 Fall 2016 Fall 2017
Dashed line represents a preliminary figure

Incoming Frosh Origins
Entering Freshmen by Origin
42% 42%
33% 33%
Other Areas
Santa Clara
23% 23%East Bay
International
2% 3%
Fall 2013 Fall 2014 Fall 2015 Fall 2016 Fall 2017
Dashed line represents a preliminary figure

Incoming GPA
Incoming Freshman High School GPA
3.31
3.37
Fall 2013 Fall 2014 Fall 2015 Fall 2016 Fall 2017
Dashed line represents a preliminary figure
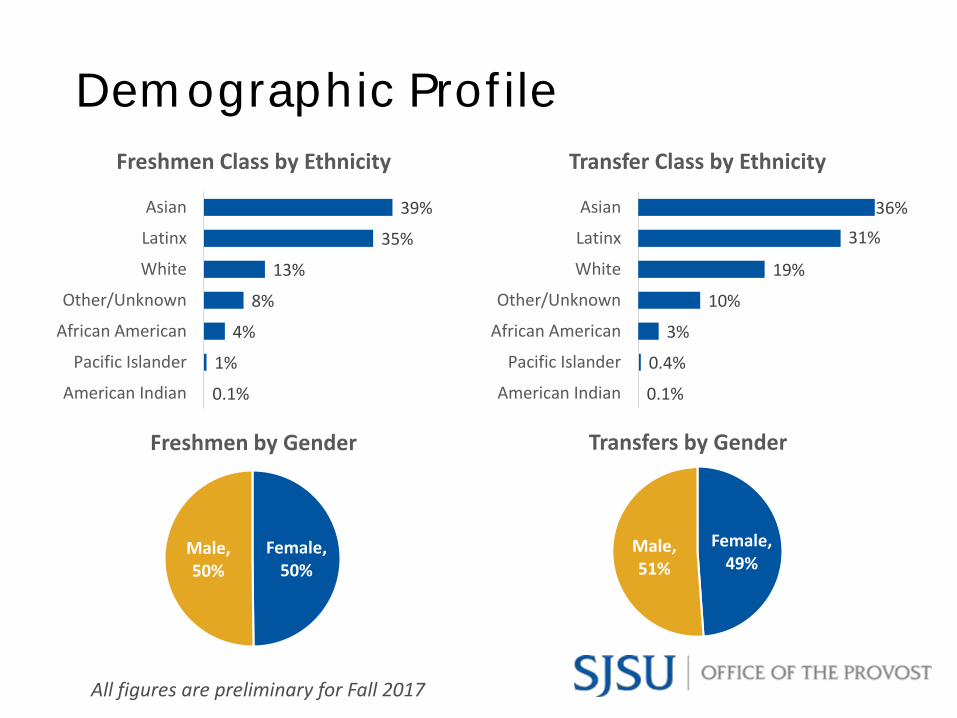
Demographic Profile
Freshmen Class by Ethnicity Transfer Class by Ethnicity
Asian
Latinx
White
Other/Unknown
African American
Pacific Islander
American Indian
39% Asian
35% Latinx
13% White
4%
8%
African American
Other/Unknown
1% Pacific Islander
0.1% American Indian
36%
31%
19%
10%
3%
0.4%
0.1%
Freshmen by Gender Transfers by Gender
Female, 50%
Male, 50%
Female, 49%
Male, 51%
All figures are preliminary for Fall 2017

2017-18 Budget Planning Priorities

2017-18 Budget Planning Priorities
1. Four Pillars of Student Success
2. No Limits Enrollment Plan
3. Continue Improving Tenure Density
4. RSCA Expansion

Four Pillars of Student Success

Notable Investments
$ 3.7M Advising
$ 0.9M English & Math Restructuring* / Tutoring (College Readiness)
$ 0.5M Support for Students in High Failure Rate Courses (Elimination of
Bottlenecks)
$ 0.3M Student Data Warehouse (multiple)
$ 5.4M TOTAL
* The CSU provided $140K for this initiative

0
300
600
900
1200
1500
1800
2100
Advising Progress
1,848 30
857
700
50
40
Additional Positions
Added in Planned and 30
16-17 Budgeted in 17-18
2020 10
10
1:857 0
16/17 Staff Advisors/Student 15-16 16-17 17-18 (Projected) Ratio
Advisor Positions Per Student Ratio Down from 1:1,848 in 15/16

+4%
+1%
37,0 00
38,0 00
39,0 00
40,0 00
41,0 00
42,0 00
43,0 00
44,0 00
45,0 00
46,0 00
47,0 00
Bottleneck Elimination Progress
45,718
Additional Seats Filled in High Wait List / High Demand Courses
2016-17 vs. 2015-16
+1,780 seats
Fall Seat 43,934Growth
+420 seats 38,365Spring Seat 37,945
Growth
2015-16 2016-17

Base vs. One-Time Investments (excludes enrollment funding)
$3 M
$1.6 M
$0.5 M
$0.4 M
$2.0 M
$0.9 M
$ 2.1M One-Time
$2 M
$0.1 M
$ 3.3M Base
$1 M
$140 K $ 5.4M $0 M
Operating Fund Operating Fund SSETF CSU Investment Total (SJSU) (Division)

College Based Funding Model

Budget Model and FTES
Funding Rate
Marginal Cost of
Instruction
17-18 Target
24,911
TARGET FTES (Base Funding)
Funding Rate
$ 2,600 / FTES
17-18 Goal
664
GOAL FTES (1x Funding)

College Enrollment Target (Annualized)
New Enrollment
College 2017-18 2016-17 Change Funding
Applied & Sciences & Arts 3,764 3,664 100 $ 365,700
Business 2,925 2,825 100 $ 336,600
Education 1,409 1,409
Engineering 3,624 3,624
Humanities & the Arts 4,597 4,597
Science 4,077 4,077
Social Sciences 4,515 4,515
Totals 24,911 24,711 200 $ 702,300

Fall Goal Enrollment Update (Actual FTES)
Fall Funded Fall
College per ICLM Actual Change
Applied & Sciences & Arts 3,939 4,209 270
Business 3,168 3,322 154
Education 1,518 1,617 99
Engineering 3,800 4,177 377
Humanities & the Arts 4,904 5,253 349
Science 4,565 4,730 165
Social Sciences 4,874 5,038 164
Totals 26,768 28,347 1,579

Marginal Cost of Instruction Calculation
Marginal Cost of Instruction Total Cost of Instruction / FTES = Marginal Cost of Instruction

Marginal Cost of Instruction by College
College
Marginal Cost of Instruction
Rate
Applied Sciences & Arts $ 3,657
Business $ 3,366
Education $ 3,489
Engineering $ 3,527
Humanities & the Arts $ 3,157
Science $ 3,325
Social Sciences $ 2,710
Colleges receive funding for Target FTES adjustments based on individual Marginal Cost of Instruction rates.
Current rates were established using the 2012-13 instructional cost data.
Actual rates have since declined due to a change in the instructional FTEF definition, increased research activities, and fluctuation in instructional tenure density.
The division is upholding the 2012-13 rates for new enrollment funding until they are exceeded.

University Library New Budget Model
Closely aligns to the college based budget model.
Aims to bring stability and address incremental costs as enrollment expands.
Address inflationary costs for library acquisitions.

University Library New Budget Model Funding Methodology
Budget 2017-18 Category Basis for Adjustments Adjustments
Librarian (enrollment bearing)
Staff and Operating Expense
Library Acquisitions
Changes in target and goal FTES based on Marginal cost rate, currently at $77 / FTES.
Allocate when funds are available. Typically a flat percentage increase.
Inflationary adjustments will be given using the Higher Education Price Index (HEPI). The current rate is 1.8%.
Total Adjustments
$ 18K
$0
$ 56K
$ 74K

SSETF Course Support
Funding will remain the same as 2016/17
Allocations are based on enrollment
Operating Fund & Other Resource Supplements
Extra enrollment-based allocation

College Expenditure Plan Summary Reserve Balance Spend Down
Category Amount
Capital Projects Health Building, Building Safety, 21st Century Teaching Spaces and Classroom Upgrades $ 3.2M
Faculty Recruitment and Start-Up Packages $ 1.9M
RSCA Expansion $ 1.8M
Program Development $ 2.7M
Faculty and Staff Professional Development $ 0.2M
Total Planned Use $ 9.8M

Tenure Density

Tenure Density
52.87%
54.86%
54.15%
52.71%
53.59%
54.37%
Increase in the number of Tenure/Tenure Track Faculty 12%
2011 2012 2013 2014 2015 2016

60
Tenure Track Faculty Increases
188 New Tenured/Tenure Track Faculty since 2015-16
63 Recruitments underway
20 Avg. Net New Faculty Lines/Yr. since 14/15
50
40
30
20
10 43 1110 10 18 87 4
0
Applied Business Education Engineering Humanities & Science Social University
Sciences & the Arts Sciences Library
Arts
18
5
8 6
15
9
4
4
5
17
4
15
7
5
8
10
3
10
11
12
8
2015-16 New Hires 2016-17 New Hires 2017-18 New Hires 2018-19 - Planned

63 Authorized Tenure Track Searches for 2017-18
Mexican American
Studies
1
Applied Sciences
& Arts
9
Business
5
Engineering
10
Humanities &
the Arts
11
Science
12
Social Sciences
8
African American
Studies
2
University Library
4
Education
4

RSCA Investment

RSCA Funding in 2017/18 and Beyond
CSU/SJSU RSCA Sources
$3.0 M $1M PROGRAM
Sources $2.5 M
$ 166K CSU $ 250K Division $2.0 M
$ 584K Division Roll Forward $1.5 M
Uses $ 500K SJSU RSCA (Office of Research)
$1.0 M $ 500K College RSCA Infusion
$0.5 M
$1.76M RSCA EXPANSION $0.0 M
Division Base Division Roll-Forward
$2.76M TOTAL RSCA CSU RSCA Expansion FUNDING

RSCA Expansion
Framework in development
Desired Outcomes: Further engage faculty in RSCA Enhance student learning outcomes Expand recognition and reputation for
the institution and faculty Recognize RSCA with a reduced
teaching load ≤ 9 WTUs (Three 3-Unit Courses) of teaching/sem.

Looking Ahead

CSU Tenure Density Model
❖ Represented as a Percentage
✓ T/TT Faculty ÷ All Instructional Faculty
❖ Limitations Looking Forward ✓ T/TT Faculty Assigned Time ✓ RSCA Expansion ✓ New TT Hires
❖ An Internal Measure Makes Sense ✓ Adjusted Model
✓ Percentage Increase in T/TT Faculty

0
2
6
8
10
12
16
18
20
$0.0M
$10.0M
$20.0M
$30.0M
$40.0M
$50.0M
$60.0M
$70.0M
$80.0M
$90.0M
Estimated Cost of AUL Increases Estimated Total Instructional Cost with Rising AUL
$84.2M Total Cost $83.0M$81.8M$80.6M$79.4M$78.1M $73.2M
Each 0.5 increase in undergraduate AUL is estimated to raise instruc-tional costs by $3 million
12.7 12.9 13.1 13.3 13.5 13.7 13.9
4
Fall 2016 Fall 2017 Fall 2018 Fall 2019 Fall 2020 Fall 2021 Fall 2022
Estimates assume that marginal cost of instruction and undergraduate headcount are held constant at Fall 2017 rates.
Undergraduate AUL 14

Exploring New Allocation Models Looking beyond ICLM for other college needs
❖ RSCA
❖ Course Support
❖ Interdisciplinary Curriculum and ICLM Limitations
❖ Realigning funding in light of increased student unit loads

Additional Resources
2017/18 Academic Affairs Budget Report
2017/18 College Resource Allocation Memo
ICLM Explained

2017-18 Presentation to the Academic Senate October 9, 2017
Bradley Olin, Ed.D.
Interim AVP of Academic Budgets and Planning Office of the Provost