academies benchmark report 2014 - bishop...
TRANSCRIPT

Page | 1 Kreston Academies Benchmark Report 2014
Academies Benchmark Report 2014
In association with
Copyright © 2014 Kreston UK. All Rights Reserved.

Page | 1 Kreston Academies Benchmark Report 2014

Page | 1 Kreston Academies Benchmark Report 2014
Report contents ________________________________________________________________________________________________
Introduction ..................................................................................................................................................... 1
The Authors and Contributors ........................................................................................................................ 2
1. What is the Academies Benchmark Report and how to use it ................................................................ 3
2. Income ........................................................................................................................................................ 5
3. Staff Costs ................................................................................................................................................... 8
4. Teachers and Pupils .................................................................................................................................. 13
5. Non-Staff Costs .......................................................................................................................................... 16
6. Surpluses and Deficits .............................................................................................................................. 18
7. Fixed Assets .............................................................................................................................................. 21
8. Net Current Assets and Cash Balances ................................................................................................... 23
9. Pension Schemes ...................................................................................................................................... 27
10. Multi-Academy Trusts (MATs) ................................................................................................................. 29
Appendix 1 - Definitions ................................................................................................................................ 31
Appendix 2 - Benchmark analysis data - All Academies ............................................................................. 33
Appendix 3 - Benchmark analysis data - Primary Academies ..................................................................... 34
Appendix 4 - Benchmark analysis data - Secondary Converter Academies ............................................. 35
Appendix 5 - Benchmark analysis data - Sponsored Secondary Academies ........................................... 36
Appendix 6 - Benchmark analysis data - Multi-Academy Trusts ................................................................ 37
Appendix 7 - Benchmark analysis data - Regional Breakdown ................................................................... 38
About the Kreston UK Charities and Education Group ............................................................................... 39
Page | 1 Kreston Academies Benchmark Report 2014
Introduction ______________________________________________________________________________________________
Welcome to our 2014 Benchmarking report. The size of the academy sector and the public awareness of it, has continued to grow rapidly over the last 12 months. Responsibilities as Governors/Trustees, Head Teachers/Principals and Business Managers are under increasing scrutiny and it is often a bad news story that can make better reading, rather than the good work taking place in the sector. Our report is focused on taking a vast amount of data from the sector and summarising it with a commentary whilst this data is still timely and relevant. The intention is that in most cases, you can take reassurance on your own financial performance, whilst perhaps identifying some areas for further investigation or improvement. Although there are a large number of ‘first year’ converter academies in our report again this year, around two thirds of our academies have now filed at least 2 years of accounts. Comparative figures available to these schools have further raised the importance of benchmarking and understanding how their figures compare not just to the previous period, but also to other schools. We have segmented our data as far as possible before arriving at our conclusions and I am pleased to see that the authors continue to use personal experiences to illustrate what they have seen. Another significant feature in the last 12 months has been the rapid growth of Multi-Academy Trusts (MATs) – many of these have not been new set ups, but conversions from single unit academies where good and outstanding schools are helping their neighbours. Data in respect of MATs for this year is still fairly thin on the ground but we have drawn conclusions where possible. Many more of our clients have also become MATs from 1 September 2013, or 1 January 2014, or are planning for 1 April 2014, so this will provide some interesting reading in next year’s report! The uniqueness of our survey continues to be the speed with which we produce it. It is based on the largest and most detailed set of submitted client data from August 2013 accounts. Producing this report so soon after the December 31 filing deadline is a real challenge and thanks must go to all eight Kreston Group member firms for submitting their client data within a strict timetable. Thanks must also go to the three principal authors who have worked tirelessly on this to produce such a good quality report in such a short space of time. Finally, thanks must go to our clients. Feedback is always important to us and we have consulted many of our clients after last year’s report, incorporating a number of requested changes. That said, we cannot always satisfy every request, but please do let us know if there are any further benchmarks or improvements that you would like to see. Our clients are what makes this such a fascinating sector to work in and we hope that you find this report as interesting to read as we did to produce it!
Joe Scaife Chair of the Kreston Academies Group January 2014

Page | 2 Kreston Academies Benchmark Report 2014
The Authors ________________________________________________________________________________________________
Chris Beaumont Chris is a Partner with Clive Owen & Co LLP and is responsible for their Not-for-Profit sector clients which includes educational establishments and charities. He qualified as a Chartered Accountant in 1995 and was awarded the Diploma in Charity Accounting (DChA) by the Institute in 2008.
David Butler David is a Partner with Bishop Fleming and specialises in the educational sector. David has a great deal of experience in providing advisory and audit services to both the academy and the independent school sectors and is a member of the Bishop Fleming Not-for-Profit team.
Nick Cudmore Nick is a Partner with Duncan & Toplis and heads up the firm’s academy department. He has considerable experience in the charity and education sector but also looks after a wide ranging portfolio of clients covering a number of other sectors.
The Contributors
Mike Farwell is head of James Cowper's Charities & Education team, and works with a wide range of academies across the south of England. Mike's clients also include independent schools and other charities, and he chairs the audit committee at a further education college.
Laragh Jeanroy is Head of Audit at Peters Elworthy & Moore. She has considerable experience of providing audit and advisory services to the education sectors including academies, MATs and independent schools.
Philip Allsop heads BHP’s academies team and has extensive knowledge and experience in providing audit and advisory services to a wide variety of organisations including schools, charities, social enterprises and owner managed businesses.
Paul Booth is a Partner with Mitchell Charlesworth, with over 20 years of experience in the sector. Paul is a member of the ICAEW Charity & Voluntary Sector Group and holds the ICAEW Diploma in Charity Accounting (DChA).
Peter Manser is a Partner with Reeves & Co LLP heading up its academies team. Peter has considerable experience advising academies and other charities and holds the ICAEW Diploma in Charity Accounting (DChA).

Page | 3 Kreston Academies Benchmark Report 2014
1. What is the Academies Benchmark Report and how to use it ____________________________________________________________________ What is the Academies Benchmark Report?
The Academies Benchmark Report has been produced to help Business Managers, Head Teachers and Governors to gain a deeper understanding of the financial performance of their academy. This is done through comparing their own performance to other academies of a similar size and structure. Our benchmark report is now into its third year and has grown significantly in size and scope since the first report, reflecting the rapid growth in the academy sector. Over the last 12 months a further 1,000 academies have opened, taking the total number to over 3,500. In addition, there are approximately 700 further schools going through the application and conversion processes. This report has been prepared using the financial statements for the period ended 31 August 2013, of all academies audited by the Kreston UK Charities and Education Group. The quantity of data available to us has increased significantly over the prior year and Kreston UK now audit more academy schools than any other accountancy firm, currently acting for over 300 academies. The report covers a number of key benchmark areas and this year also includes a separate section on Multi-Academy Trusts (MATs). The number of MATs has increased significantly over the last year and it is anticipated that there will be further growth in this sector in future years. With each of the key benchmark areas we have analysed the data into four separate categories to make the data and commentary more relevant to each individual academy. These categories are: Primary Academies Secondary Converter Academies Sponsored Secondary Academies Multi-Academy Trusts

Page | 4 Kreston Academies Benchmark Report 2014
1. What is the Academies Benchmark Report and how to use it ________________________________________________________________________________________________
How to use the Academies Benchmark Report
Within the commentary we have focused on the key benchmarks in each category, however the full set of data is given in appendices 2-7. These appendices provide details of the benchmarks used for each category of academy and include the highest and lowest benchmark figures, together with the average and median benchmark results. This enables users to get a broader view of the benchmark results across the academies reviewed and to understand where their academy is positioned within the range.
In relation to the income benchmarks, we have based the total income for each academy on its annualised income from all sources, but excluding any income recognised in relation to assets and funds inherited from the Local Authority on conversion to academy status.
Similarly, in relation to the surplus (and deficit) benchmarks, we have again excluded any income recognised in relation to assets and funds inherited from the Local Authority, as well as excluding any Local Government Pension Scheme (LGPS) deficits inherited from the Local Authority on conversion to academy status.
A detailed explanation of the ratios and definitions used throughout the report can be found in appendix 1. The definitions should enable each academy to calculate their own benchmark data which can then be used to get a clear picture of the position of each academy respective to other similar schools.
Space has been provided in the appendices to record individual benchmark data.
Terminology - What is in a name? Throughout the academy sector there are a lot of interchangeable terms. To make this report as clear as possible we have been consistent throughout. Where we use the word trustees this also covers governors and directors; Head Teacher has been used to cover Headteacher, Principal, Executive Head; Business Manager has been used to cover Finance Director, Bursar, School Accountant, and; Non-teaching staff includes Learning Support Assistants (LSAs). This distinction is made for analysis purposes only!

Page | 5 Kreston Academies Benchmark Report 2014
2. Income ____________________________________________________________________ 2013 ended and 2014 began with a number of good news stories for the economy. The UK is currently the fastest growing developed economy, unemployment is falling and wage rises are starting to catch up with inflation. In the longer term these factors should all help the Government to balance the books, however, in the short term, the national debt continues to rise. To try and eliminate the deficit and to finally start repaying some debt, the Government has announced further reductions in spending due to kick in this year, with more planned for the future – although possibly after the next election. Given this financial position it seems likely that schools will need to get used to managing with budgets that keep pace with inflation at best. Additionally, recent changes to education spending have been attempting to increase funding to schools with a higher proportion of disadvantaged children, but as total funding is not expected to increase then this is likely to be at the expense of other schools. Those schools with higher levels of children qualifying for pupil premium are likely to see increases in their total funding as pupil premium rates continues to rise. In 2012/13 the premium was £619 per pupil, rising to £900 in the current academic year, and £935 in the 2014/15 academic year. However, primary schools will receive even more with the premium rising to £1,300. This is now a significant percentage of the General Annual Grant (GAG) funding per child and will therefore result in sizeable discrepancies between schools based upon the relative levels of deprivation. Consequently some schools may have to be more creative about how they increase their income levels either through the use of their assets or through looking for alternative funding streams. There is likely to be increased competition for grant funding and this has already started to create an industry whereby accountancy firms help schools prepare their grant applications. Although there may be pressures on funding, one thing that has emerged is that academies appear to be getting more value from their income. A recent study of Ofsted data has shown that academies are more likely to improve their Ofsted assessment than Local Authority controlled schools. Whether this is down to a more effective use of the LACSEG funding or whether it is due to the greater autonomy, is not clear from the data. It is perhaps no surprise that Michael Gove believes it is because “academy status lets teachers get on with the job, free from bureaucratic interference.” Given what we have said above, one of the first surprises thrown up by the data is the amount by which income per pupil has increased. The graph below shows that total income per pupil has increased for every school type.
Total income per pupil - current year vs. prior year

Page | 6 Kreston Academies Benchmark Report 2014
2. Income ________________________________________________________________________________________________
Whilst we would anticipate there being an increase in funding, due to inflationary effects, the overall increase is significantly more than that. The average increase in GAG is broadly in line with inflation, at 3%, however the significant increases in total funding are a result of increases in ‘other income’.
The largest stream of other income is Academies Capital Maintenance Fund (ACMF). The data suggests that the amount of ACMF income the Government has made available in the 2013 academic year has significantly increased, with ‘other income’ funding per pupil up by nearly 50% for secondary academies and MATs. This is supported by the evidence we have seen with our clients where more have been successful in securing funds in the 2013 academic year compared to 2012 and a number of our clients have been successful with multiple applications.
Average non GAG income per pupil by academy type
The graph above clearly shows how significant the increase has been in other income across all academy types. The increase for primary academies is just under 20%, but this is dwarfed by the 43.9% increase for secondary converters, 42.2% increase for secondary sponsored academies and 46.6% increase for MATs. In addition to ACMF funding, this income category includes pupil premium which has increased from £619 per pupil to £900 per pupil. It also includes income generated by the academies for providing other services, such as renting out facilities and selling expertise. These income streams are discussed further at the bottom of page 7. It is clear that academies have been able to record increases in income from a number of different sources that have all contributed to the overall significant movement. Furthermore, there do not appear to have been any income streams that have shown any significant decrease which, given the economic environment, is a surprise in itself.

Page | 7 Kreston Academies Benchmark Report 2014
2. Income _______________________________________________________________________________________________
From the Government’s perspective, the big advantage of funding academies via ACMF rather than GAG is that it is income that is non-recurring. Although there would be a budget in place for the total ACMF expenditure it is less politically sensitive for this to be reduced in the future rather than the core GAG funding.
The amount of other income received by the academies has fluctuated over the last three years demonstrating that the value of ACMF funding can go down as well as up. Therefore, there is no certainty that the level of funding available in 2013 will be matched in 2014.
The increase in other income compared to the core GAG funding can be seen in the following graph. This clearly demonstrates the increasing proportion of total income coming from non-core sources.
GAG Income vs. Total Income
Other income and trading We commented last year that there was some evidence that academies are looking for ways to generate income other than Government funding. Anecdotally this trend has developed over the last year, however due to the significant increase in ACMF funding, it is difficult to identify the movements in the data. However, from talking to our clients there is an increase in the number of academies setting up trading subsidiaries, in particular to develop and manage sports facilities. A wide range of schools are also starting to generate income by providing consultancy services. In the 2012 academic year this was largely teaching and leadership expertise but in the current year there have been more academies selling IT services and other non-educational management services. One academy in the survey has been able to generate income in excess of £1million from providing IT support services to other schools in its first year of trading. As academies are becoming more established there is evidence that there is a growing confidence to do things differently and seek out additional income streams. Should there be a reduction in ACMF funding in future years then there is likely to be even more focus on these income streams, but for now many academies are experiencing a time of plenty.

Page | 8 Kreston Academies Benchmark Report 2014
3. Staff Costs _____________________________________________________________________
Staff costs are the most significant recurring expenditure by far, although the proportion of total costs spent on salaries can vary significantly from school to school. It would seem logical for most schools to spend broadly similar levels on staffing so the level of variability we have identified is greater than you may expect. This ratio is influenced by the level of experience of the teaching staff, the number of non-teaching staff employed and also the amount of non-recurring expenditure, such as large maintenance projects. The level of outsourcing also has an impact on the overall staff cost but currently there is no clear trend as to whether this is increasing or decreasing. Many schools are choosing to bring services back in-house to gain control over the activities, whereas others are looking to outsource more to control costs. There is no ‘one size fits all’ approach. The average spend on staff costs as a percentage of total costs by primary academies is 71.2% (2012: 72.3%), with 71.7% (2012: 73.9%) for secondary academies. Although the percentages are broadly consistent with the prior year the overall reduction for secondary academies can be attributed to the increased ACMF funding, resulting in a higher proportion of total cost being spent on maintenance and other building related projects.
Average staff cost ratio per academy
The graph above demonstrates the level of variation between different academies. Those schools at the bottom of the range tended to be either more rural schools, or those with fewer pupils where there are additional costs to be borne, such as transport. There are also a number of schools at the bottom of the range where they have received significant levels of ACMF income that has then been spent in the year, diluting the staff cost as a percentage of total costs.

Page | 9 Kreston Academies Benchmark Report 2014
3. Staff Costs ________________________________________________________________________________________________
Staff costs as a percentage of total costs
The table above shows that staff costs as a percentage of total costs have been fairly consistent year on year, although there is variation depending on the type of academy. In both years it is the sponsored secondary schools and the Multi-Academy Trusts that spend the lowest proportion on staff costs. This reflects the additional funding received by the sponsored academies and the economies of scale achieved by the Multi-Academy Trusts.
Percentage of teaching to non-teaching staff
The table above shows the number and percentages of teaching and non-teaching staff employed for each academy type. This demonstrates that the secondary schools have a lower proportion of non-teaching staff, supporting the assumption that there are economies of scale from being a larger school. The MAT data by itself does not support this as they have a higher proportion of non-teaching staff than primaries, however this is skewed by there being a number of special needs schools within the MATs in this survey. The general principle, based on our data, does appear to be that larger schools need less support staff and so, from a financial perspective, are more efficient. This suggests that there is a strong business case for academies to form or join MATs to access these economies of scale.
2013 %
2012 %
Primary Academies 71.2 72.3
Secondary Converter Academies 71.7 73.9
Secondary Sponsored Academies 66.1 68.0
Multi-Academy Trusts 70.2 69.7
Total number
Teaching staff
number
Non-Teaching staff
number
Teaching %
Non -Teaching %
Primary Academies 33.3 13.4 19.9 40.3% 59.7%
Secondary Converter 126.4 66.4 59.9 52.6% 47.4%
Secondary Sponsored Academies
156.4 81.3 75.1 52.0% 48.0%
Multi-Academy Trusts 199.2 96.5 102.7 48.4% 51.6%
All Schools 105.0 52.8 52.2 50.3% 49.7%

Page | 10 Kreston Academies Benchmark Report 2014
3. Staff Costs ________________________________________________________________________________________________
Performance related pay
We commented last year that although staff costs are the major expense for an academy, it is something they have very little control over as salary rates and pay rises are centrally set, and teachers get automatic pay rises each year as they go up the scale. Also, there is currently very little evidence of academies breaking rank from the maintained sector and setting their own pay levels. Furthermore, if they were to break rank then the likely effect would be to push wages up at a time when many academies do not have certainty over future funding levels. It will be interesting to see what impact the introduction of performance related pay has on the academies as this may give scope to control the cost. The Government wants a more flexible reward framework that would allow teachers to earn up to £70,000 within 5-8 years if their performance is excellent, whereas the unions think it is a cynical attempt to limit the wage bill. At this point it is difficult to predict the overall impact, however it seems unlikely that the Department for Education (DfE) are anticipating a significant increase in total cost as a result of this initiative. Consequently it seems likely that staff costs will remain relatively consistent.
There is a further restricting factor in that for individual schools, where they have excellent teachers, there will be limited scope in the short term to increase rewards as budgets will not allow for higher costs. This is because they still have to pay the high cost for those teachers who are at the top of the scale based on the number of years worked. It may not be until these teachers retire that this system will have any meaningful impact.
Pension schemes Although salary levels are likely to remain consistent, the same cannot be said for pension schemes. Most academies will have noted increases in the funding rates for the next academic year which will increase the cost in future years. The table below shows the total cost of the pension schemes as reported in the financial statements, and so not only includes contributions but also actuarial gains and losses and other pension charges.
The increasing pension burden to academies The cost of servicing both the Teachers’ Pension Scheme (TPS) and the Local Government Pension Scheme (LGPS) deficits is continuing to rise. Increasing contribution rates do not seem to have had any significant impact on the deficit levels, with longer life expectancy counteracting the additional funding.
Pension cost ratio 2013 2012 2011
% % %
Primary Academies 15.0 12.8 13.2
Secondary Converter Academies 14.4 13.1 13.7
Secondary Sponsored Academies 14.1 12.1 13.4
Multi-Academy Trusts 14.0 11.6 -

Page | 11 Kreston Academies Benchmark Report 2014
3. Staff Costs _______________________________________________________________________________________________
There has been debate in the press about the affordability of final salary pension schemes but there does not appear to be any political will to remove them from teachers, although it is likely that there will be a move towards average salary schemes in an attempt to control costs. It may be that in the future, academies will explore pension options for the non-teaching staff in order to manage costs, or look at ways to keep staff off the payroll and therefore out of the pension schemes.
Head Teacher salaries One of the areas that has created a lot of column inches in the media has been the debate regarding Head Teacher salaries. This information needs to be given within the financial statements in virtually all instances and so the level of salaries becomes public record. The major talking point in the press was the number of Head Teachers earning over £100,000 – which is a lovely round number! In reality the range of Head Teacher salaries is vast with there being a major distinction between primary and secondary Head Teacher salaries. Within our survey there were a small number of Head Teachers with salaries in excess of £150,000 but there were a much larger number earning under £50,000. Unsurprisingly, the press have not been very interested in reporting this fact!
Head Teacher salaries by academy type
The graph above shows the distribution of Head Teacher salaries for the different academy types. There is a clear difference between the salaries of primary and secondary Head Teachers which can be seen in the blue and red bars. The surprising finding was the extent of the range in salary levels. Most are clustered between £50,000-£100,000 but there is a significant minority earning in excess of £100,000 and a small number, particularly in MATs and sponsored academies, earning in excess of £150,000.

Page | 12 Kreston Academies Benchmark Report 2014
"...income is rising for many
academies, at a time when the major
costs appear to be well controlled."

Page | 13 Kreston Academies Benchmark Report 2014
4. Teachers and Pupils _______________________________________________________________________________________________
Given that staff costs are the major expense academies have to pay, the number of teachers an academy employs has a direct impact on its level of surplus or deficit. There is a very simple correlation between the number of teaching staff employed and the total salary cost. As funding is largely driven by pupil numbers then it is critical for the financial health of a school that it employs the right number of teachers for the pupils it has. The pupil teacher ratio is the number of pupils in the school divided by the number of teachers, therefore the higher the ratio the more pupils there are for each teacher.
Pupil teacher ratio
In the current environment where schools are conscious of the need to control costs, employing less teachers is a simple way to achieve this. The data above shows that in most cases the pupil teacher ratios have increased, suggesting that this cost reduction may be happening. This is also supported by the relative fall in the proportion of expenditure on salaries, as discussed on page 9. The relative size of the movement has been a surprise to us, being much more than anticipated. This may reflect that additional income, particularly pupil premium, has been spent on non-teaching staff, or it may reflect the success of many of the academies in increasing pupil numbers. It could simply reflect a growing population level, with teacher numbers lagging behind. What the data does show is that incomes are rising for many academies, at a time when the major costs appear to be well controlled. It seems likely that this will result in higher surpluses being generated. This is discussed further in section 6.
2013 2012 2011 Change % change
Primary Academies 24.3 22.7 20.7 1.6 7.0%
Secondary Converter Academies 16.3 16.4 15.8 (0.1) (0.6%)
Secondary Sponsored Academies 13.9 13.1 13.0 0.8 6.1%
Multi-Academy Trusts 18.3 16.4 - 1.9 11.6%

Page | 14 Kreston Academies Benchmark Report 2014
4. Teachers and Pupils ______________________________________________________________________________________________
Non-teaching staff
Having said how important it is for academies to get their teacher pupil ratios right, teaching staff are one of the things that stay constant for an academy after it converts. The area of staffing where there are likely to be the most changes is management and administration staff. We conducted a straw poll in late 2013 of our academy clients to understand the impact on them following conversion. The one area they were unanimous in was that since conversion the administrative burden had increased. We asked the question ‘Since converting has the administrative burden on your academy increased?’ 83% of the responders strongly agreed, with the other 17% agreeing. This increase in workload has resulted in many schools having to increase their levels of non-teaching staff.
As discussed on page 9, the number of non-teaching staff varies by academy type but we would anticipate all academies to have increasing numbers of non-teaching staff. What the graph below shows appears contradictory in that the number of pupils for each member of non-teaching staff has actually increased in most categories.
The exception to this is primary academies where there is a clear trend showing increasing levels of non-teaching staff. For larger schools the data may imply that for second and third year academies they now have more settled staffing levels.
Non-teaching staff ratio

Page | 15 Kreston Academies Benchmark Report 2014
"...academies are now more
commercially minded. The cost
controls are strong… however there is
still plenty more that can be done."
Page | 16 Kreston Academies Benchmark Report 2014
5. Non-Staff Costs ________________________________________________________________________________________________
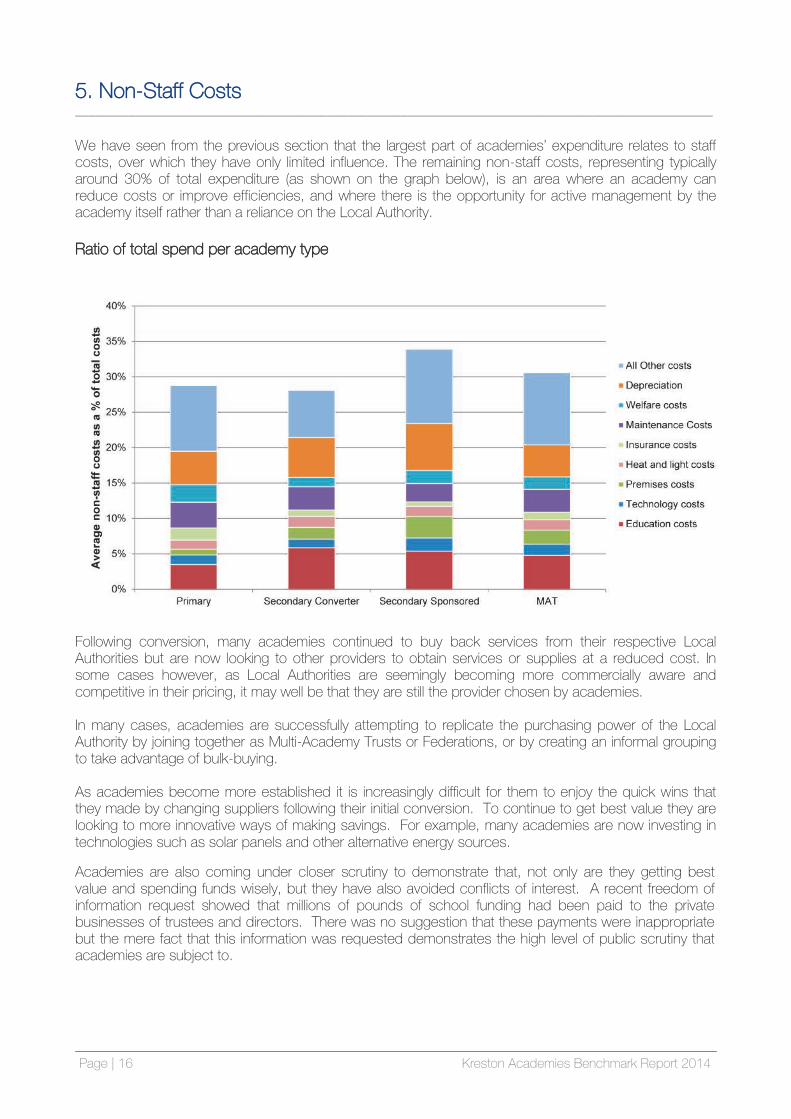
We have seen from the previous section that the largest part of academies’ expenditure relates to staff costs, over which they have only limited influence. The remaining non-staff costs, representing typically around 30% of total expenditure (as shown on the graph below), is an area where an academy can reduce costs or improve efficiencies, and where there is the opportunity for active management by the academy itself rather than a reliance on the Local Authority.
Ratio of total spend per academy type
Following conversion, many academies continued to buy back services from their respective Local Authorities but are now looking to other providers to obtain services or supplies at a reduced cost. In some cases however, as Local Authorities are seemingly becoming more commercially aware and competitive in their pricing, it may well be that they are still the provider chosen by academies. In many cases, academies are successfully attempting to replicate the purchasing power of the Local Authority by joining together as Multi-Academy Trusts or Federations, or by creating an informal grouping to take advantage of bulk-buying. As academies become more established it is increasingly difficult for them to enjoy the quick wins that they made by changing suppliers following their initial conversion. To continue to get best value they are looking to more innovative ways of making savings. For example, many academies are now investing in technologies such as solar panels and other alternative energy sources.
Academies are also coming under closer scrutiny to demonstrate that, not only are they getting best value and spending funds wisely, but they have also avoided conflicts of interest. A recent freedom of information request showed that millions of pounds of school funding had been paid to the private businesses of trustees and directors. There was no suggestion that these payments were inappropriate but the mere fact that this information was requested demonstrates the high level of public scrutiny that academies are subject to.

Page | 17 Kreston Academies Benchmark Report 2014
5. Non-Staff Costs ________________________________________________________________________________________________
From the data we have seen, it is clear that academies are now more commercially minded. The cost controls are strong and they are starting to purchase more effectively, however there is still plenty more that can be done. Despite these additional pressures, from talking to our academy clients we have found that there is an overwhelming view that the change has been positive for their schools. One of our clients said the following: “Becoming an academy has been the best thing that has happened to this school both in losing the burdens that the Local Authority used to place on the school and in accessing funding for capital projects…. The academy is now able to operate in the best interests of its own students and staff, and in a far more business like manner than was ever possible under Local Authority control. We can purchase goods and services at market prices without having irrelevant purchases forced on us. The Local Authority ‘one size fits all’ approach was a huge constraint and we are much better off without it.” When we surveyed our clients we asked whether they would still make the same decision to convert given what they now know - 82% said that they would. At the same time 85% said that they had found the process and administration more complicated than anticipated. Clearly there are a lot of additional burdens that come with academy status but there seems to be consensus that these are greatly outweighed by the benefits.

Page | 18 Kreston Academies Benchmark Report 2014
5. Non-Staff Costs ________________________________________________________________________________________________
From the data we have seen, it is clear that academies are now more commercially minded. The cost controls are strong and they are starting to purchase more effectively, however there is still plenty more that can be done. Despite these additional pressures, from talking to our academy clients we have found that there is an overwhelming view that the change has been positive for their schools. One of our clients said the following: “Becoming an academy has been the best thing that has happened to this school both in losing the burdens that the Local Authority used to place on the school and in accessing funding for capital projects…. The academy is now able to operate in the best interests of its own students and staff, and in a far more business like manner than was ever possible under Local Authority control. We can purchase goods and services at market prices without having irrelevant purchases forced on us. The Local Authority ‘one size fits all’ approach was a huge constraint and we are much better off without it.” When we surveyed our clients we asked whether they would still make the same decision to convert given what they now know - 82% said that they would. At the same time 85% said that they had found the process and administration more complicated than anticipated. Clearly there are a lot of additional burdens that come with academy status but there seems to be consensus that these are greatly outweighed by the benefits.
6. Surpluses and Deficits ________________________________________________________________________________________________
We noted in last year’s report that the EFA was allowing academies to apply to remove the cap (12%) on the GAG that could be carried forward. A number of our academies applied for this, either to give them greater flexibility or because they had been close to breaching the threshold before and thought that they may breach it in the near future. The removal of this GAG carry forward limit has now been automatically granted to schools that are census funded (Para 2.6.30 of the October 2013 Academies Financial Handbook), however some of the older sponsored academies have kept their old style funding agreements as these have other beneficial clauses. There remains some concern around the wording of the new clause as it allows the Secretary of State to impose a restriction (as a percentage of GAG income) on the GAG carry forward balance. Whilst this could be used as a way of cutting the Government’s deficit (via a claw-back of any excess over the imposed limit), the clause is generally seen as being included to discourage academies from building reserves for which they have no plans, to the detriment of the current pupils. The removal of this restriction has meant that the allocation of expenditure to GAG in preference to the use of other funds is now not so critical. The combination of the removal of this carry forward and the fact that the number of academies with a track record of surpluses is increasing, means more academies have an active plan to manage their reserves. This may mean setting aside monies for capital projects whilst also maintaining or building up reserves to cover any potential risks to the academy. The number of academies which are now actively reviewing their risk profiles has increased significantly. This may be as a result of the requirement for larger academies (income greater than £10m or capitalised asset value greater than £30m) to have a dedicated audit committee, whose remit usually includes the risk register together with ensuring that the internal and external audit processes are conducted properly with appropriate implementation of any findings. Alternatively, the risk register may be more actively monitored because of the perceived risk to future funding with a move to a national funding formula. Last year the converter primary and secondary academies typically generated surpluses whilst the older sponsored academies had in-year deficits being a reflection of the greater depreciation that the older sponsored academies incur (most had new buildings as part of the conversion process) and the way that start-up grants were reflected in those academies’ financial statements (a quirk of charity accounting rules). This trend has continued in the 2013 academic year.

Page | 19 Kreston Academies Benchmark Report 2014
6. Surpluses and Deficits _______________________________________________________________________________________________
The graph below shows the proportion of GAG income carried forward, shown in bands. The 0% band shows those academies which fully spent their GAG income, the <0% band shows those who have overspent.
Ratio of GAG carry forward to GAG income
The results above hide the fact that the newer converter academies tend to be very cautious in the period following conversion due to the fear of the unknown. The phrase ‘we don’t know what we don’t know’ is one we often hear when assisting academies in their first periods of operation. In future years, as they have a better understanding of their cost base and they have built up reserves to cover unforeseen risks, they move to more balanced in year budgets.
The academies are mainly operating in the range 0% to 10%, which is to be expected given the 12% cap previously in place. There is obviously concern for those academies which have a low GAG carry forward balance if they have limited other reserves, as they may have insufficient reserves to deal with any risks they encounter now that they are no longer supported by the Local Authority.
Ratio of surplus before depreciation compared to total income

Page | 20 Kreston Academies Benchmark Report 2014
6. Surpluses and Deficits _______________________________________________________________________________________________
Depreciation is usually a significant figure within the Statement of Financial Activities (SOFA) however the amount varies significantly from academy to academy. There are a number of reasons for this including whether the property is included within the accounts, the valuation, and the range of depreciation policies that are being used by academies. Last year the EFA’s desk top valuations included an estimate for the remaining economic life of the building which was very useful for Trustees when deciding their property depreciation policy. Unfortunately, the 2013 EFA valuations did not include this. Removing depreciation therefore makes the results more comparable. As mentioned above the majority of academies have retained surpluses of between 0% (Breakeven) and 10%. This reflects the growing maturity of the sector in which a number of academies will now have met their targeted reserves, and the removal of the 12% cap. It is a concern that some academies did not achieve breakeven, however this number includes some sponsored secondary academies which are now unwinding some of their previous funding. At the other extreme, those retaining a significant surplus should have plans for future investment, either staffing or fixed assets. Now that the cap has been removed, it will be interesting to see if academies do undertake long-term planning either because they have concerns over future funding, or they want to invest.

Page | 21 Kreston Academies Benchmark Report 2014
7. Fixed Assets ________________________________________________________________________________________________
A significant part of the value of an academy’s fixed assets are the premises it operates from. The building valuations vary significantly depending on size, age and condition. We noted last year that the schools built under the Building Schools for the Future (BSF) programme typically cost between £2,200 and £2,900 per square foot to build, with an average total cost of £21m. The Coalition Government’s Priority School Building Programme aims for schools to be comparatively 15% smaller (space savings will be made on corridors, assembly halls, canteens and atriums) and this together with standardisation (80% of schools are expected to have the same components) should result in these schools costing on average £1,450 per square foot to build. It will be interesting to see if the 261 schools due to be built under this programme over the next 5 years will come in at a cost of £2.5bn, the Government’s budget figure. In addition to the Priority School Building Programme, there has been significant capital expenditure by schools which received grants from the EFA under its Academies Capital Maintenance Fund (ACMF). The first round of the 2013-14 programme saw 1,364 academies apply for funding of 2,158 projects which would have cost £1.13bn. 789 academies were successful in obtaining funding for 1,021 projects at a total cost of £325m (the budget for this round). Successful projects included replacement windows, replacement boilers, roof repairs, new classrooms and sports facilities. The first round for 2014-15 opened in December 2013 with a closing date of 31 January 2014. Given the short window within which to apply and the competition for this funding, academies should consider having projects ‘shovel ready’. There are a number of issues to consider with properties which have a significant impact on the value included in the balance sheet. Firstly, does the academy own the building? Whilst the majority do, some do not. This may be because the academy was built using a Private Finance Initiative (PFI), because they are faith schools and have certain terms and conditions attached to the lease or licence, or because the property is on a short lease. The second main issue is the valuation. The EFA has again provided access for new converter academies to desktop valuations, however there are inconsistencies in some of the valuations provided. One school received two independent valuations – the first for £1m, the second for £3m. A big difference in both value and percentage! There have also been examples of small primary schools being valued by the EFA’s advisers at nearly £20million, whilst secondary schools have been valued at £2million. Consequently, in a number of instances the EFA valuation has not been used in the financial statements. The third factor to consider is the range of depreciation policies that are being used by academies. Whilst some can justify low or nil rates of depreciation (we have some schools which are hundreds of years old) others are more aggressive with their policy. In respect of capitalisation policies of other assets e.g. Information Technology equipment, there are significant differences on capitalisation limits and how they are applied (whilst a computer worth £300 would probably be less than the capitalisation limit, a suite of say 30 computers would probably exceed the limit, but the academy may still argue that individually they are below the capitalisation limit and so expend them through the Statement of Financial Activities). Once Information Technology equipment is capitalised there tends to be little divergence from a policy of writing off over 3 - 5 years. Given the range of policies, as with the 2013 report, we have decided to review the academies’ asset costs by adding together capital expenditure in the year and repairs and maintenance costs.

Page | 22 Kreston Academies Benchmark Report 2014
7. Fixed Assets _______________________________________________________________________________________________ Average spend per pupil on capital expenditure and repairs & maintenance
The graph above shows the combined annualised capital expenditure and repairs and maintenance costs for the year ended 31 August 2013. What it clearly demonstrates is that there has been a very significant increase in total spend in both the primary and secondary converters, and as the vast majority of academies fall into these two categories, this is the overall trend. This supports what we have mentioned earlier in the report, that the Government has provided a significant increase in academy funding via the ACMF. It will be interesting to monitor this movement in future years. ACMF funding is an easy way for the Government to control its total spend but it can also be used as a way to stimulate investment in capital projects, an area of Government spending for which there appears to be cross party support.

Page | 23 Kreston Academies Benchmark Report 2014
8. Net Current Assets and Cash Balances ________________________________________________________________________________________________
Net Current Assets The definition of net current assets is the difference between current assets (Trade Debtors, Prepayments, Accrued income, VAT debtor, Stock and Bank/Cash) and current liabilities (Trade Creditors, Accruals, Deferred income and PAYE/National Insurance). This figure is important as it demonstrates how easily an academy can meet its liabilities and is a good indicator of financial health. We would expect this figure to be positive and in the vast majority of instances it is. Where it is not, this ratio should give the Trustees cause for concern. We would typically expect a larger academy to have a larger net current asset balance and so, to aid comparison, in the chart below we have shown net current assets as a percentage of total income.
Net Current Assets and Liquidity
The graph above demonstrates the variation in financial health of the academy sector. From our analysis of the data there appears to be an overall improving trend across all types of academies. It is particularly noticeable that the number of academies with net current assets exceeding 20% of income has increased. This largely reflects the increased cash balances held, as discussed on the next page, which is one of the results of academies generating surpluses. The higher the percentage, the larger the buffer an academy has against unexpected costs, but it may also suggest that an academy should consider spending more money on educational purposes for its current pupils. This is one of the dilemmas facing trustees when deciding upon their reserves policy. They have a legal duty to protect the assets of the academy and having a buffer is one way of doing this, but the primary role of the academy is to use the funds available for the benefit of the children. Due to a lack of financial history it is not clear whether there is an optimum net current asset ratio but a long term rate of below 5% may be cause for concern.

Page | 24 Kreston Academies Benchmark Report 2014
8. Net Current Assets and Cash Balances _______________________________________________________________________________________________
Cash Balances The academy sector generally has strong cash reserves. In part this will be due to a number of the new converter academies being extremely cautious and therefore building cash reserves. The biggest factor though is the timing of the GAG receipts and the fact that a large percentage of an academy’s expenditure is on salaries. Whilst the net pay is paid before the end of the month, the PAYE/National Insurance, pension payments and other salary deductions are not usually paid until the next month, i.e. after the next receipt of GAG monies. The sponsored academies may appear to hold significantly greater cash reserves, however this is because they will have received up to £2m of sponsorship when the trusts were established. Whilst the sponsorship money is shown as an endowment in the financial statements, it is usually held in a separate charitable entity. Those financial statements are combined because of a uniting directive from the Charity Commission. Neither the initial sponsorship money (the endowment) nor any investment income (usually bank interest) can be spent by the academy without the express agreement of the endowment’s Trustees, although the latter is usually earmarked on an annual basis.
Cash balances as a percentage of total income
The graph above shows cash balances as a percentage of income, to aide comparison. It can be seen that for the primary and secondary converters which make up the bulk of the sector, cash balances are increasing due to the surpluses generated. The level of cash reserves within the sector is substantial with the average for primary schools now exceeding £200,000 and secondary schools exceeding £1m. The figure is even higher for the MATs, with the average being £1.6m and sponsored academies being £1.7m. These cash reserves may create the impression that the sector is over funded, it is therefore essential that academies communicate their future spending plans and demonstrate the impact this will have on the education provided.

Page | 25 Kreston Academies Benchmark Report 2014
8. Net Current Assets and Cash Balances _______________________________________________________________________________________________
Even though the cash balances are high this is often the result of money being received in advance of the related expenditure. Consequently, we keep reminding our clients of the need to monitor their cash balances not only to ensure they maximise interest earned (whilst not risking it – remember the problems some of the Local Authorities had recovering monies from the Icelandic banks), but also to avoid the financial problems that have beset some academies. It was reported in 2012 that the EFA had to support eight academies with £10.7m of additional funding. The EFA are obviously keen for this not to become the norm, hence the additional powers they have to change the management of an academy. None of our academies has taken the option of investing in equities, although some are looking to invest in property or sports facilities that can be used by the academy but also be let to the local community to obtain a rental stream. The more established converter academies, now that they are more sure of their cash flow movements, are looking to invest in a combination of three, six and twelve month fixed term deposits in order to maximise the interest earned.
Given the cash reserves that most academies have, it is important they consider treasury management. This will be something new to academies as previously the Local Authority will have undertaken this function. We still see lots of academies paying annual contracts in advance e.g. IT support, photocopying leases and especially Local Authority contracts. Academies should consider if this is appropriate – and if they do then they should be commercial about the value of these arrangements and look to obtain advance payment discounts. In the current economic environment they should also consider the likelihood of their suppliers going bust where amounts are paid in advance. Historically more businesses fail coming out of a recession than within it due to the additional cash flow requirements that expansion brings.

Page | 26 Kreston Academies Benchmark Report 2014
“...cash reserves may create the
impression that the sector is over
funded, therefore it is essential that
academies communicate future
spending plans… and the impact on
education provided.”
Page | 27 Kreston Academies Benchmark Report 2014
9. Pension Schemes _______________________________________________________________________________________________
All academies have at least two pension schemes – The Teachers’ Pension Scheme (TPS) and the Local Government Pension Scheme (LGPS). Both are defined benefit schemes, i.e. the pension paid is based upon a percentage of salary. Historically this has been final salary, however the LGPS is changing to a career average in April 2014 and the TPS is changing in 2015. Importantly for accounting purposes, the TPS scheme is an unfunded scheme. This means that there is no requirement to include the academy’s share of the TPS deficit on the balance sheet. It is only the pension contributions due in the year that are included within that year’s financial statements together with an accompanying note explaining the scheme. The current contribution rates are 14.1% for the employer, whilst the employee contribution is dependent on salary. Academies are ‘Scheduled Bodies’ and as such have to automatically enrol support staff in the LGPS, although the staff can opt out. These schemes are funded and therefore an actuary can calculate the assets and liabilities of the scheme. Therefore, unlike the TPS, the net position of the scheme is included in the financial statements. As a result of there being ninety nine different regional schemes, each has its own employer contribution rates. The employee contribution rates are based on a national formula which is linked to salary. During the latter part of 2013 there was a consultation on the way the academies’ LGPS pension arrangements could be administered. Four options were given: Stay as it is Have the option of pooling with the Local Authority Be forced to pool with the Local Authority Establish a national LGPS specifically for academies
Most schools felt that they did not have the knowledge to respond to the consultation, although the ones that we spoke to felt that option 3 was the least attractive. The last tri-annual valuation available for the academies was 31 March 2010. Another valuation has been prepared as at 31 March 2013 and the results of that will be announced during 2014 - there are one or two Local Authority schemes that have already issued updated valuations. This will lead to changes in the employer contribution rates with effect from 1
April 2014, however differences in the
performance of the individual schemes are likely to result in some contributions falling and many rising. Schools will need to consider this and the impact of auto-enrolment on their future staffing budgets. Most of the LGPS schemes are in deficit and even where they are in surplus, the transfer to the academy tends to be a pension liability. This transfer is shown as a movement in the SOFA. The actuary’s assessment of the future liabilities will depend upon their assessment of future consumer price inflation, retail inflation, wage rate inflation, mortality rates etc. It was interesting to note that a number of the actuarial valuations used a wage rate inflation of between 4.5% and 4.7%, something not seen for a number of years! A small change in any one of these assumptions can have a significant effect on the pension situation – as noted last year when one academy’s pension changed from a pension asset of £1m to a pension liability of £1m within three years.

Page | 28 Kreston Academies Benchmark Report 2014
9. Pension Schemes ________________________________________________________________________________________________
When meeting with the trustees and directors we tend to be asked more questions about the pension scheme than any other issue. This is especially so when the property does not appear on the academy’s Balance Sheet, as in this instance, it often appears as if the academy is insolvent. However, in this situation, provided the trustees believe that they can meet the debts of the academy (including the pension scheme’s annual contributions) then the academy can continue to operate having made appropriate disclosures in its financial statements.
Average closing LGPS Pension Deficit
The average pension scheme deficit was £1.1m (2012: £1.03m). Whilst there was one academy with a small pension scheme asset the largest pension deficit was over £5m. As expected the largest deficits, based upon a per pupil measure, were at the special needs schools which reflects their higher than normal levels of teacher support.
It is perhaps a little concerning for academies that their location can have a significant impact on the size of any deficit transferred. This is a reflection of the significant historical differences in the performance of Local Authorities in managing their pension schemes. Given that there are ninety nine regional administrations it is interesting to note the wide variations in deficits across the country. There was only one area with a surplus!

Page | 29 Kreston Academies Benchmark Report 2014
10. Multi-Academy Trusts (MATs) _______________________________________________________________________________________________
The number of MATs is growing rapidly and many lawyers are now setting up new converters as MATs just in case. MATs are now very much in the mainstream of academy structures, however there are significant differences in the way they are set up and managed. Firstly there are the academy chains such as Oasis, E-ACT, Harris Federation, AET and ARK to name but a few. Some of these chains have academies scattered all over the country whilst others concentrate on a particular geographical area. The stated aim of at least one is to grow so that the chain has 200 academies within it. Usually these MATs have central administrative and finance functions which monitor and provide assistance as required to the individual academies within its chain. The second type of MAT that we often see is the local collaboration. In this situation a school, usually but not exclusively a secondary school, will convert to an academy with either its feeder schools or other local schools. In some instances these schools have been told that they need a sponsor to assist them because they have fallen below the floor targets and they are looking for a local solution. In this situation, whilst in theory all the schools could convert at the same time, it is more usual for the lead school to convert first and then the others to join later. The key to unlocking the financial benefits of being a MAT is the level of collaboration amongst the schools and the extent to which services can be centralised. There are still some instances where a number of academies form a MAT but then continue to operate as individual entities. It is difficult to see any financial reason for forming a MAT in this way. Unlike a single school academy trust, a MAT has another layer of governance. The MAT will have a Board (this will consist of directors/trustees – the names are interchangeable) which sits above a local governing body for each of the schools within the MAT. Again there is no consistency with how these governing bodies are structured and the level of local involvement, although for the larger groups individual Head Teachers may not have any role at all in the overall management of the MAT. It seems likely that as this sector matures a more uniform structure will emerge as groups learn from each other about what works well. We have spent a lot of time in the last twelve months advising single unit academies that plan to become MATs. The mix of schools within a MAT varies widely which may help to explain the wide range of structures in place. We act for some that are only secondary schools, some only primary schools, some only special needs schools and some a mixture of all of these – secondary, primary, special needs schools and, in at least one instance, a free school as well. Given the difference in size of the academy chains (AET has over 75 academies in its chain) and the differing mix of schools within each MAT it is difficult to meaningfully compare their financial performance at this stage. However, the DfE has produced a report to look at the educational performance of academies and specific comment has been made on MATs. The report entitled ‘Performance of converter academies: an analysis of inspection outcomes 2012 to 2013’ was issued in early January 2014. The key findings show that primary and secondary schools
that have converted tend to do better than Local Authority schools in terms of retaining or improving their
Ofsted grade. According to a National College for School Leadership report, the rate of improvement is
even faster at MATs. The reasons given for this are that individuals with a proven track record of
improving schools can implement their techniques, expertise and ethos just as easily over a number of
schools as helping one. Further economies of scale can be achieved by sharing back office functions.
So how does this differ from a Local Authority? Politics - apparently it gets in the way!

Page | 30 Kreston Academies Benchmark Report 2014
“The size of the academy sector, and
the public awareness of it, has
continued to grow rapidly over the
last 12 months."
Page | 31 Kreston Academies Benchmark Report 2014
Appendix 1 - Definitions _______________________________________________________________________________________________
There are a large number of ratios and terms used within this report. Below we have given definitions of relevant terms and an explanation of each ratio used. Academic year: The data used in the report is based on the 2012/13 academic year with comparative data given for the 2011/12 academic year. For ease of reference the academic years are referred to as 2013 and 2012 respectively. Sponsored Academy: Typically academies that were created before the Academies Act 2010 and required a sponsor to enable them to convert. Converter Academy: Academies that have converted under the Academies Act 2010. Multi-Academy Trust: A single legal entity where all academies within the group are governed by one Trust. Federation: A group of academies with some degree of shared governance but with each academy maintaining a separate legal identity. Free School: A state funded school set up to meet a local need. The legal structure is similar to that of an academy. Total income: The annualised total income for the academy excluding any surplus donated on conversion to an academy. Total GAG income: The annualised GAG income for the academy and includes the School Budget Share (SBS), the Local Authority Central Spend Equivalent Grant (LACSEG), rates relief payment and insurance reimbursement. GAG income ratio: The GAG income as a percentage of total income, excluding any surplus donated on conversion. This ratio highlights the level of reliance on GAG funding. The higher the ratio, the greater the level of dependency on GAG income. Staff costs: The total of both teaching and non-teaching staff costs, including national insurance and pension contributions. Teacher salary costs: The total gross salary of teaching staff, excluding LSAs. Other salary costs: The total gross salary cost of all non-teaching staff. Education costs: The total of exam fees, books, education equipment and supplies, and school trips. Premises costs: The total of rates, water, heat and light, rent and other similar costs, but excluding repairs and maintenance. For PFI schools this includes the charge from the provider. We have also separately analysed energy, insurance, catering and technology costs. Repairs and maintenance costs: The total of repairs and maintenance. Management, administration and governance costs: The total of all other costs (not separately identified above), including governance costs, but excluding depreciation.

Page | 32 Kreston Academies Benchmark Report 2014
Appendix 1 - Definitions _______________________________________________________________________________________________
Depreciation cost: The charge made for the period to reflect the usage of the fixed assets held by the academy. Typically land is not depreciated, property is depreciated over 50 years and other classes of assets are depreciated over periods between 3 and 10 years. Pension cost ratio: The total cost per the Statement of Financial Activities for all pension schemes, primarily the Teacher Pension Scheme (TPS) and the Local Government Pension Scheme (LGPS), as a percentage of the total salary costs. Pension costs: The individual costs of the TPS and LGPS pension schemes. LGPS surplus/deficit per non-teaching staff: The LGPS pension scheme surplus or deficit divided by the number of non-teaching staff. Pupil to teacher ratio: The total number of pupils divided by the total number of teachers. Pupil to non-teaching staff ratio: The total number of pupils divided by the total number of non-teaching staff. Teaching staff to non-teaching staff ratio: The total number of teachers divided by total number of non-teaching staff. Surplus/deficit ratio: The surplus or deficit of the academy, excluding any surpluses or deficits transferred upon conversion and excluding any actuarial gains and losses, as a percentage of the total income of the academy. GAG carry forward ratio: The percentage of GAG income received that is unspent at the end of the academic and financial year. Cash balances ratio: The cash balance at 31 August as a percentage of annualised total income. Net current assets/income ratio: The net current assets at 31 August as a percentage of annualised total income. Current assets ratio: The total of current assets divided by current liabilities. A figure of less than one may be an indication that an academy has cash flow difficulties. Property value: The property value as stated in the financial statements, before any depreciation. These values have been calculated on a number of differing bases, including EFA valuation, insurance valuation and cost. Net book value: The value that fixed assets are carried in the financial statements, i.e. cost less depreciation. Capital expenditure: The total amount of fixed asset additions in the period and therefore excludes expenditure on items that are expensed in the year of purchase. Fixed assets depreciation rate: The total depreciation charge as a percentage of the fixed asset cost or valuation. Within the report this ratio is given for property and all other asset classes combined. Cost ratios: Each category of cost that is also expressed as a percentage of total costs. This is to aid comparability across different sized schools.

Page | 33 Kreston Academies Benchmark Report 2014
Appendix 2 _______________________________________________________________________________________________
Benchmark analysis data - All Academies

Page | 34 Kreston Academies Benchmark Report 2014
Appendix 3 ________________________________________________________________________________________________
Benchmark analysis data - Primary Academies

Page | 35 Kreston Academies Benchmark Report 2014
Appendix 4 ________________________________________________________________________________________________
Benchmark analysis data - Secondary Converter Academies

Page | 36 Kreston Academies Benchmark Report 2014
Appendix 5 ______________________________________________________________________________________________
Benchmarking analysis data - Secondary Sponsored Academies
Page | 37 Kreston Academies Benchmark Report 2014
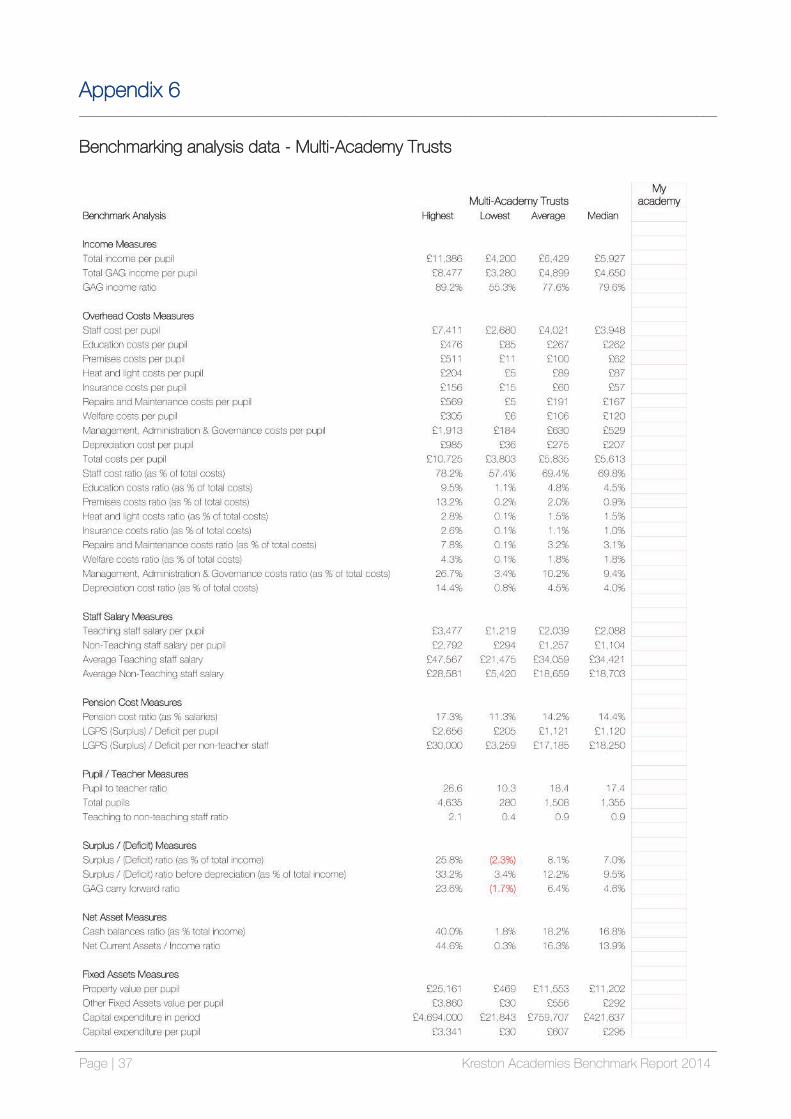
Appendix 6 ________________________________________________________________________________________________
Benchmarking analysis data - Multi-Academy Trusts

Page | 38 Kreston Academies Benchmark Report 2014
Appendix 7 _______________________________________________________________________________________________
Benchmarking analysis data - Regional Breakdown

Page | 39 Kreston Academies Benchmark Report 2014
Derbyshire and Yorkshire
Barber Harrison & Platt Philip Allsop 0114 2667171 [email protected]
South West and West Midlands
Bishop Fleming Joe Scaife 0117 9100250 [email protected]
North East and Yorkshire
Clive Owen & Co LLP Chris Beaumont 01325 349700 [email protected]
East Midlands Duncan & Toplis Nick Cudmore 01507 604841 [email protected]
North West Horsfield & Smith Jonathan Staples 0161 7615231 [email protected]
Oxfordshire, Thames Valley and the South
James Cowper LLP Mike Farwell 01635 35255 [email protected]
North West Mitchell Charlesworth Paul Booth 0161 8176100 [email protected]
Cambridge Peters Elworthy & Moore Laragh Jeanroy 01223 728212 [email protected]
London and South East
Reeves & Co LLP Peter Manser 01227 768231 [email protected]
About the Kreston UK Charities and Education Group ________________________________________________________________________________________________
The Kreston UK Charities and Education Group is a network of independent accounting and business advisory firms in the UK that share a common interest and specialisation in the charity and education sector. The Group advises over 1,500 charities across a wide variety of sectors, including more than 300 academies, and numerous other education related organisations. The UK firms that have participated in this report are as follows:
Kreston UK is a brand representing firms based in the UK, Ireland and Isle of Man which are each members of Kreston International, a global network of independent accounting firms. Each member is a separate and independent legal entity and as such has no liability for the acts or omissions of any other member firm. Kreston UK and Kreston International provide no services to clients and have no liability for the acts or omissions of any member firm.

Page | 1 Kreston Academies Benchmark Report 2014

Page | 2 Kreston Academies Benchmark Report 2014
"Bishop Fleming is one of the UK's leading advisers to academy schools."
www.bishopfleming.co.uk
Copyright © 2014 Kreston UK. All Rights Reserved.
Bath Minerva House Lower Bristol Road Bath BA2 9ER Tel: 01225 486300 Bristol 16 Queen Square Bristol BS1 4NT Tel: 0117 9100250 Exeter Stratus House Emperor Way Exeter Business Park Exeter Devon EX1 3QS Tel: 01392 448800 Plymouth Cobourg House Mayflower Street Plymouth Devon PL1 1LG Tel: 01752 262611 Torquay 50 The Terrace Torquay Devon TQ1 1DD Tel: 01803 291100 Truro Chy Nyverow Newham Road Truro Cornwall TR1 2DP Tel: 01872 275651 Worcester 1, 2 & 3 College Yard Worcester WR1 2LB Tel: 01905 732100