academy of accounting and financial studies - allied … · allied academies international...
TRANSCRIPT

Volume 11, Number 1 2006
Allied AcademiesInternational Conference
New Orleans, LouisianaApril 12-15, 2006
Academy of Accountingand Financial Studies
PROCEEDINGS
Volume 11, Number 1 2006

page ii Allied Academies International Conference
New Orleans, 2006 Proceedings of the Academy of Accounting and Financial Studies, Volume 11, Number 1

Allied Academies International Conference page iii
Proceedings of the Academy of Accounting and Financial Studies, Volume 11, Number 1 New Orleans, 2006
Table of Contents
PRIVATIZATION OF PUBLIC HIGHER EDUCATIONLENDS CREDIBILITY TO NEW REPORTING MODEL . . . . . . . . . . . . . . . . . . . . . . . 1Olin L. Adams III, Auburn UniversityRebecca R. Robichaux, Assessment & Research ConsultantsA. J. Guarino, Auburn University
CONFRONTING THE BIG BOXES: COMPETITIVESTRATEGIES FOR SMALL BUSINESSES . . . . . . . . . . . . . . . . . . . . . . . . . . . . . . . . . . 3Don B. Bradley III, University of Central ArkansasAndrew Spice, Mallory Alexander International LogisticsMichael J. Rubach, University of Central Arkansas
THE FASB�S NEW RULES FOR EXCHANGES OFNONMONETARY ASSETS: A POSSIBLE AVENUE FOR EARNINGS MANAGEMENT? . . . . . . . . . . . . . . . . . . . . . . . . . . . . . . . . . . . . . . . . . . . . 5Stanley J. Clark, University of Southern MississippiJim Henderson, University of Southern MississippiGwen R. Pate, University of Southern Mississippi
DO HOMOGENEOUS GOODS PRODUCE THE SAMERETURNS? AN ANALYSIS OF S&P 500 INDEXMUTUAL FUNDS . . . . . . . . . . . . . . . . . . . . . . . . . . . . . . . . . . . . . . . . . . . . . . . . . . . . . . 9John Cresson, Southeastern Louisiana University
INTELLECTUAL CAPITAL REPORTING:A USER PERSPECTIVE . . . . . . . . . . . . . . . . . . . . . . . . . . . . . . . . . . . . . . . . . . . . . . . . 11Suresh Cuganesan, Macquarie Graduate School of ManagementRichard Petty, Macquarie Graduate School of ManagementNigel Finch, Macquarie Graduate School of Management
U.S. GROWTH MUTUAL FUNDS PERFORMANCE:AN EVALUATION . . . . . . . . . . . . . . . . . . . . . . . . . . . . . . . . . . . . . . . . . . . . . . . . . . . . . 17Amitabh S Dutta, Columbus State University
THE EMERGENCE OF CSR AND SUSTAINABILITY INDICES . . . . . . . . . . . . . . . . . . . . . 19Nigel Finch, Macquarie Graduate School of Management
THE SCALING PROPERTY OF RANDOMNESS:THE IMPACT OF REPORTING FREQUENCYON THE PERCEIVED PERFORMANCE OF INVESTMENT FUNDS . . . . . . . . . . . . 25Nigel Finch, Macquarie Graduate School of ManagementGuy Ford, Macquarie Graduate School of ManagementSuresh Cuganesan, Macquarie Graduate School of ManagementTyrone M Carlin, Macquarie Graduate School of Management
page iv Allied Academies International Conference
New Orleans, 2006 Proceedings of the Academy of Accounting and Financial Studies, Volume 11, Number 1
DO HYBRID INSTRUMENTS LOWER THECOST OF CAPITAL? . . . . . . . . . . . . . . . . . . . . . . . . . . . . . . . . . . . . . . . . . . . . . . . . . . . 31Guy Ford, Macquarie UniversityTyrone M Carlin, Macquarie UniversityNigel Finch, Macquarie University
THE CHANGING RELATIONSHIPS BETWEEN GOLD,OIL, AND STOCK PRICES . . . . . . . . . . . . . . . . . . . . . . . . . . . . . . . . . . . . . . . . . . . . . . 37Ronald C. Kettering, Columbus State University
NEW DEVELOPMENTS IN INNOCENT SPOUSE RULES . . . . . . . . . . . . . . . . . . . . . . . . . . 41John Leavins, University of St. ThomasDarshan Wadhwa, University of Houston-DowntownCharles Smith, Universty of Houston-Downtown
BOARD SIZE AND FIRM PERFORMANCE: THE CASE OF SMALL FIRMS . . . . . . . . . . . . . . . . . . . . . . . . . . . . . . . . . . . . . . . . . . . 43Sharon K. Lee, Western New England CollegeGreg Filbeck, University of Toledo
TESTS OF TECHNICAL TRADING RULESIN THE ASIAN-PACIFIC EQUITY MARKETS:A BOOTSTRAP APPROACH . . . . . . . . . . . . . . . . . . . . . . . . . . . . . . . . . . . . . . . . . . . . 47Camillo Lento, Lakehead University
THE MANY DIMENSIONS OF SOCIALSECURITY REFORM . . . . . . . . . . . . . . . . . . . . . . . . . . . . . . . . . . . . . . . . . . . . . . . . . . . 49David E. Letourneau, Winthrop UniversityDanny R. Memolo, Winthrop University
BEWARE OF PITFALLS WHEN SERVEDWITH IRS LEVIES . . . . . . . . . . . . . . . . . . . . . . . . . . . . . . . . . . . . . . . . . . . . . . . . . . . . . 51Bruce W. McClain, Cleveland State University
THE USEFULNESS OF RATIO ANALYSIS INPREDICTING STOCK MARKET RETURNS . . . . . . . . . . . . . . . . . . . . . . . . . . . . . . . . 53Jonathan E. Miller, Longwood UniversityFrank W. Bacon, Longwood University
BUSINESS ENVIRONMENT FRAUD:ACCOUNTING HAPPENINGS . . . . . . . . . . . . . . . . . . . . . . . . . . . . . . . . . . . . . . . . . . . 59Paula Diane Parker, University of South AlabamaMartha Lair Sale, Sam Houston State UniversityCathy L. Ussery, Institute of Management Accountants
THE IMPACT DETECTION RISK HAS ON TAXCOMPLIANCE: AN ALTERNATIVE VIEW . . . . . . . . . . . . . . . . . . . . . . . . . . . . . . . . 61Paul C. Schauer, Bowling Green State UniversityLawrence Bajor, Bowling Green State University
Allied Academies International Conference page v
Proceedings of the Academy of Accounting and Financial Studies, Volume 11, Number 1 New Orleans, 2006
A SURVEY OF INTERNAL AUDIT DIRECTORS:RESOURCES, PROCESSES, AND SOX COMPLIANCE . . . . . . . . . . . . . . . . . . . . . . 63W. Robert Smith, University of Southern Mississippi
MODELING THE IMPACT OF NEWTECHNOLOGIES ON PACE OF PLAY IN GOLF:SEGWAY GT, RANGE FINDERS, RFID GOLFBALLS, AND LONGER HITTING DRIVERS . . . . . . . . . . . . . . . . . . . . . . . . . . . . . . . 65Jimmy D. Speers, Southeastern Oklahoma State UniversityAndrew A. Tiger, Southeastern Oklahoma State University
THE USEFULNESS OF COST ALLOCATIONS:AN EXPERIMENTAL INVESTIGATION . . . . . . . . . . . . . . . . . . . . . . . . . . . . . . . . . . 69Martha J. Turner, Tiffin UniversityAlan T. Lord, Bowling Green State University
CPA FIRMS OFFERING OF FORENSIC SERVICESSURPRISINGLY CONSISTENT OVER TIME:ARE CPA'S MISSING OUT ON A FORENSICACCOUNTING GOLD RUSH? . . . . . . . . . . . . . . . . . . . . . . . . . . . . . . . . . . . . . . . . . . . 71Michael Watters, Henderson State UniversityK. Michael Casey, University of Central ArkansasJoseph Humphrey, Texas State UniversityGary Linn, American University Paris
SMALL FIRMS AND SARBANES-OXLEY:WHAT ARE THE COSTS OF COMPLIANCE? . . . . . . . . . . . . . . . . . . . . . . . . . . . . . . 73Thomas E. Wilson, Jr., University of Louisiana at Lafayette
DEVELOPING AN EFFECTIVE CORPORATE POLICYFOR EMPLOYEE INTERNET AND EMAIL USE . . . . . . . . . . . . . . . . . . . . . . . . . . . . 75David W. Arnesen, Seattle University

Allied Academies International Conference page 1
Proceedings of the Academy of Accounting and Financial Studies, Volume 11, Number 1 New Orleans, 2006
PRIVATIZATION OF PUBLIC HIGHER EDUCATIONLENDS CREDIBILITY TO NEW REPORTING MODEL
Olin L. Adams III, Auburn [email protected]
Rebecca R. Robichaux, Assessment & Research [email protected]
A. J. Guarino, Auburn [email protected]
ABSTRACT
The Governmental Accounting Standards Board (GASB) makes the rules of accounting forpublic sector entities, including public colleges and universities. In 1999 the GASB set forth newreporting requirements for these organizations, with implementation beginning in 2001. Under thenew reporting model, public colleges and universities may report tuition as operating revenue, muchlike the revenue from sales and services in a business. When the new approach was announced,many questioned the wisdom of the GASB. Most public colleges and universities still dependedheavily on state appropriations, which would be classified as nonoperating revenue in the newsystem and often would be larger than tuition, creating an anomalous operating statement. But arecession soon after and the response of state governments would prove the genius of the GASB.
Tuition at public four-year institutions in the 2003-04 academic year increased at the highestrate in three decades, an average of 14 percent more than the prior year (Farrell, 2003). Theincrease for those institutions in 2004-05 was 10 percent (Hoover, 2004). Colleges and universitieshave implemented large tuition increases to compensate for falling sources of revenue whichhistorically have subsidized the price of higher education, notably state appropriations. (Pulley,2003). State appropriations to public colleges and universities fell 2.1 percent from the 2002-03fiscal year to the 2003-04 fiscal year, the first decline in 11 years (Hebel, 2004). Appropriations topublic institutions of higher education have decreased in some states due to sluggish revenues fromregional economies dependent on manufacturing or technology. Moreover, public colleges anduniversities compete for public funds with other programs, such as K-12 education and Medicaid(Hebel, 2003). Lyall and Sell (2006) assert that public institutions of higher education are effectivelybeing privatized.
This study assesses the extent to which changes in the revenue structure of public highereducation have provided credibility for the new reporting model. The authors used the US News andWorld Report top 20 public institutions of higher education as a sample and examined trends intuition, grants and contracts, auxiliary income, and state appropriations for the fiscal years endedin 2002, 2003, and 2004. It appears the GASB read correctly the realities of state finance andcrafted a system that recognizes the operation of the contemporary university as a business.Implications of the findings will be discussed.

page 2 Allied Academies International Conference
New Orleans, 2006 Proceedings of the Academy of Accounting and Financial Studies, Volume 11, Number 1
Allied Academies International Conference page 3
Proceedings of the Academy of Accounting and Financial Studies, Volume 11, Number 1 New Orleans, 2006
CONFRONTING THE BIG BOXES: COMPETITIVESTRATEGIES FOR SMALL BUSINESSES
Don B. Bradley III, University of Central [email protected]
Andrew Spice, Mallory Alexander International [email protected]
Michael J. Rubach, University of Central [email protected]
ABSTRACT
The past quarter-century has witnessed the rise of the big box retail format and thesubsequent decline of Main Street small businesses. Today’s customers are demanding high-qualityproducts at low prices, greater convenience, and a wide assortment of goods. Wal-Mart’scompetitive advantage lies in its ability to meet these demands. Specifically, Wal-Mart excels inproviding low prices, wide assortment of goods, and the convenience of one-stop-shopping. Thispaper reviews the research on the competitive responses of small retailers to mass merchandisersand discounters. The paper examines the theories surrounding competitive advantage and thestrategies available for small businesses to compete against big box retailers. Although priorresearch has recommended that small businesses can benefit from differentiation strategies,, thispaper argues that a hybrid strategy of low cost and differentiation with an emphasis on providingsuperior customer service may be the most effective competitive weapon against massmerchandisers such as Wal-Mart. A discussion of the success of dollar stores in competing withdiscounters supports the argument that a hybrid strategy is effective.

page 4 Allied Academies International Conference
New Orleans, 2006 Proceedings of the Academy of Accounting and Financial Studies, Volume 11, Number 1

Allied Academies International Conference page 5
Proceedings of the Academy of Accounting and Financial Studies, Volume 11, Number 1 New Orleans, 2006
THE FASB’S NEW RULES FOR EXCHANGES OFNONMONETARY ASSETS: A POSSIBLE AVENUE FOR
EARNINGS MANAGEMENT?Stanley J. Clark, University of Southern MississippiJim Henderson, University of Southern MississippiGwen R. Pate, University of Southern Mississippi
ABSTRACT
The new FASB standard (SFAS No. 153) on accounting for exchanges of nonmonetary assetsfundamentally changes the accounting procedures for these transactions. The previous standard,APBO No. 29, based the accounting for the exchange on whether the assets involved were similaror dissimilar in nature. For assets similar in nature, the general rule was that no gain could berecognized unless other assets were included in the exchange. The new standard introduces asubjective determination of the concept of commercial substance. Any exchange where commercialsubstance exists is accounted for at fair value with gain or loss on the exchange recognized in thecurrent financial statements. This paper examines how this new standard is applied and thepossibility of its provisions being used as an earnings management device by companies.
INTRODUCTION
The latest standard to come from the move to fair value accounting is SFAS No. 153,�Exchanges of Nonmonetary Assets - an amendment of APB Opinion No. 29.� This standard wasissued in 2005 and supercedes many of the provisions of Accounting Principles Board Opinion(APBO) No. 29. APBO No. 29 accounted for asset exchanges at a mixture of fair value and bookvalue based on whether the assets involved were similar or dissimilar in nature. Generally, gainscould not be recognized on exchanges of similar assets unless some other form of assets (commonlyreferred to as boot) was received in the exchange.
SFAS No. 153 eliminates the similar/dissimilar asset aspect of accounting for assetexchanges. Therefore, an exchange of similar productive assets may result in gains or losses on thefinancial statements of each of the companies involved. These financial statement effects open thedoor for possible earnings management behavior on the part of companies. Companies must makeinherently subjective decisions on whether fair value should be used to measure the exchange and,if so, what is the fair value of the asset(s) involved. This subjectivity allows companies to engagein transactions to achieve a specific financial statement result. This paper examines how theprovisions of SFAS No. 153 can be used as an earnings management device and some of the relatedproblems associated with this use including possible auditor/client conflicts and tax issues.
BACKGROUND AND LITERATURE REVIEW
APBO No. 29 did not allow companies to recognize gains on exchanges of similarproductive assets unless a company received other assets in addition to the similar assets. Thereasoning behind this nonrecognition was the company�s economic standing had not really changed.This rule applied to all exchanges of similar productive assets and this created a problem, at leastaccording to the FASB. A different issue exists when one company exchanges a nonproductiveasset for a similar asset that the company believes will be productive. Numerous factors could result
page 6 Allied Academies International Conference
New Orleans, 2006 Proceedings of the Academy of Accounting and Financial Studies, Volume 11, Number 1
in an asset being nonproductive for one company while being productive for another. Geographycan play a role. Some companies have better (or worse) name recognition in certain areas and,therefore, their stores perform better (or worse) depending upon the geographic location of the store.Geography is a key factor in the example used later.
SFAS No. 153 allows for the distinction between these two types of exchanges to berecognized by eliminating the similar/dissimilar provisions of APBO No. 29. The general rule underSFAS No. 153 is that all exchanges are accounted for at fair value (with full gain or loss recognition)unless one of three conditions is present. These conditions are:
1) the fair values of the assets involved are not determinable;2) the exchange is part of a sales transaction; and3) the exchange does not have commercial substance.
The first two of these conditions apply to limited types of transactions. Therefore, the crux ofaccounting for exchanges under SFAS No. 153 centers on the notion of commercial substance. Instraightforward terms, commercial substance means the company has significantly improved (orconceivably worsened) its economic position as a result of the exchange. If commercial substanceis established, the exchange is accounted for at fair value with the difference between the fair valueof the asset(s) received (or given up whichever is more clearly evident) and the book value of theasset(s) given up recognized as gain or loss.
Accounting for an exchange of nonmonetary assets at fair value under SFAS No. 153requires the accountant to make judgments about the transaction. First, the determination ofcommercial substance is subjective in nature and will often not be clear but will depend uponassumptions or expectations related to the future use of the assets. Second, once commercialsubstance is established, a fair value measurement must be derived for the asset received. As theseassets are nonmonetary, this determination is sure to be subjective in nature. It is this inherentsubjectivity in the entire process that creates the potential for this standard to be used as an earningsmanagement tool.
Schroeder, Clark, and Cathey (2005) defined earnings management as �the attempt bycorporate officers to influence short-term reported income.� There are many reasons corporateofficers may engage in earnings management. Healy and Wahlen (1999) list several possiblereasons for this behavior. These include influencing stock prices, increasing managementcompensation, and avoiding violations of debt covenants. It is important to note that earningsmanagement is a short-term focused behavior Another important note is that earningsmanagement is not synonymous with fraudulent financial reporting. There is plenty of leewaywithin generally accepted accounting principles (GAAP) for an accountant to make choices that willmaterially alter reported income. Dechow and Skinner (2000) characterized various earningsmanagement tactics used by companies into one of the following five groups: conservativeaccounting; neutral accounting; aggressive accounting; fraudulent accounting; and backdating salesinvoices. Many of these tactics reported on by Dechow and Skinner were not violations of GAAP.These tactics simply involved management making judgment decisions that might have been eitheraggressive or conservative but were still acceptable within GAAP. This is the type of issue broughton by the subjective nature of the commercial substance test and use of fair value in accounting forexchanges under SFAS No. 153.
Earnings management resulting from fraudulent accounting is clearly unethical. However,earnings management behavior that is within GAAP creates a gray area from an ethical analysisstandpoint. Arguments related to the ethics of this behavior are not the purpose of this paper butrather a growing concern for the profession.

Allied Academies International Conference page 7
Proceedings of the Academy of Accounting and Financial Studies, Volume 11, Number 1 New Orleans, 2006
EXAMPLE APPLYING SFAS NO. 153
To illustrate the potential problem, assume two fictitious national grocery store chains, GreatMidwestern Grocery Company (GMGC) and Great Southeastern Grocery Company (GSGC). Eachof these companies is evaluating their existing stores with plans to dispose of underperformingstores. Each company has a strong reputation and following in their principal geographical area ofoperations. GMGC is particularly strong in Iowa, Illinois, Minnesota, and Wisconsin. GSGC isparticularly strong is Georgia, South Carolina, Alabama, and Florida. Among the stores GMGC hasdecided to dispose of is one in Savannah, Georgia. GSGC has a similar store in Des Moines, Iowathat it has slated for disposal. The companies have heard of each other�s plans related to these storesand begin talks on possibly acquiring the other�s store. In the end, the companies decide to simplyexchange the two stores along with all the fixtures located in the stores.
At this point, each company has to ascertain whether the exchange has commercialsubstance. In this example, each company is giving up a nonperforming store for a store that islocated in the company�s strongest area of operations. It is reasonable to believe that each companythinks the new store will be superior in its performance to that of the store given up. The judgmentcall that each company�s accountants make will affect the company�s financial statements.
In this exchange, it appears reasonable to assume that each company�s economic positionhas been improved. They have given up an underperforming store outside their central region ofoperations and received a store located within their core area of operations. Each new store couldreasonably be expected to perform at least adequately since it is located in the company�s strongestarea of operations. However, there are other factors that need to be considered in the evaluation ofcommercial substance. For example, does GMGC already have stores in Des Moines and, if so, howmany? While the new store there may be profitable, is this profitability at the expense of the otherstores? If this is the case, then the overall cash flows or value of the company may not besignificantly changed. The same issue exists for GSGC and its new Savannah store.
This example is a fairly simple transaction but it illustrates the fact that commercialsubstance is very often almost impossible to either prove or disprove. The fact that the exchangeresulted in a change in expected cash flows or overall value of the company is not enough. Thechange must also be significant. So, while GMGC or GSGC fully expects the new store to performbetter than the old store, is the increased performance a significant improvement? This question,like many associated with fair value accounting, generally has no definitive answer.
In order to take the example forward, let�s assume commercial substance exists. Now thecompanies must determine the fair value of the new store. This fair value will be compared to thebook value of the old store�s assets to determine the recognized gain or loss. Grocery stores are notassets that are bought and sold on an active market like stock of publicly traded companies so quotedmarket prices do not exist for these grocery stores. Therefore, the measurement of the fair value ofthese stores will involve subjective judgments and estimates on the part of the management of bothGMGC and GSGC. The companies could use a number of techniques to develop an estimate of fairvalue. They could have the assets appraised by an expert. They could discount the expected cashflows of the new store at an appropriate interest rate or they could look at the recent sales prices ofother similar assets adjusted for any differences between the asset sold and the asset currently held.The emphasis here is that the fair value measurement like the commercial substance decision is verysubjective.
GMGC has determined the fair value of the new Des Moines store to be $1,000,000 bydiscounting the future expected cash flows at the company�s current cost of capital. GMGC nowcompares this value to the book value of the Savannah store given up. This book value is the onepart of equation that is objective since it comes from GMGC�s books. If we assume a book valueof the Savannah store assets of $600,000, then GMGC would recognize a gain of $400,000 on the
page 8 Allied Academies International Conference
New Orleans, 2006 Proceedings of the Academy of Accounting and Financial Studies, Volume 11, Number 1
exchange in the current period�s income statement. If the book value of the Savannah store assetsexceeded $1,000,000, then, obviously, GMGC would recognize a loss on the exchange.
If GMGC engaged in this exchange for the main purpose of recognizing a gain andimproving the company�s operating results, then they have engaged in an earnings managementtactic. If the fair value of the new store (the Des Moines store) is estimated at $1,000,000 and thebook value of the old store (the Savannah store) is $600,000, then GMGC does recognize a $400,000gain. This will increase reported earnings for the current period. However, as was noted in thedefinition of earnings management, this is a short-term adjustment. Over the long run, the effectsare going to be somewhat if not fully negated. To illustrate, let�s assume the actual assets involvedin this exchange are all depreciable with an average remaining life of twenty years. GMGC�s newassets have a book value of $1,000,000 while the old assets� book value was $600,000. Assumingstraight-line depreciation and no salvage value, GMGC�s depreciation expense for the next twentyyears has increased from $30,000 per year to $50,000 per year. So, over the twenty year asset life,the $400,000 gain is completely offset by increased depreciation charges.
The focus of this example and the paper has been on how accounting for exchanges ofsimilarly productive assets has changed and how this change can be used as an earningsmanagement technique. SFAS No. 153 can also cause changes in accounting for exchanges ofdissimilar assets. These exchanges must also meet the commercial substance test in order to beaccounted for at fair value. Under APBO No. 29 these exchanges were accounted for at fair valuein almost all situations. If an exchange of dissimilar assets is deemed to not have commercialsubstance, the company can account for the exchange under SFAS No. 153 at book value and avoidrecognition of gain or loss. This does create another avenue for earnings management where thecompany has a gain or loss on the exchange but does not want the gain or loss reflected in currentearnings. The company can argue that the exchange does not have commercial substance.
CONCLUSION
SFAS No. 153 continues the FASB�s move toward fair value accounting. It also increasesthe complexity of accounting for exchanges of similarly productive assets. APBO No. 29 generallyresulted in the use of book value to account for these exchanges which was consistent with incometax accounting. How companies adopt and implement SFAS No. 153 over time will determinewhether the potential earnings management uses of the standard will be a problem for the profession.
REFERENCES
Accounting Principles Board (1973), Opinion No. 29: Accounting for Nonmonetary Transactions. New York, NY:AICPA.
Dechow, P.M. & P.J. Skinner (2000). Earnings Management: Reconciling the Views of Accounting Academics,Practitioners and Regulators. Accounting Horizons, 14(2), 235-250.
Financial Accounting Standards Board (2005), Statement of Financial Accounting Standards No. 153: Exchanges ofNonmonetary Assets – an amendment of APB Opinion No. 29. Norwalk, CT: FASB.
Healy, P.M. & J. Wahlen (1999). A Review of the Earnings Management Literature and its Implication for StandardSetting. Accounting Horizons, 13(4), 366-383.
Palepu, K.G., Healy, P.M., and V.L. Bernard (2000). Business Analysis and Valuation Cincinnati,OH: South-WesternCollege Publishing.
Schroeder, R.G., Clark, M.W. & J.M. Cathey (2005). Financial Accounting Theory and Analysis (Eighth Edition).Hoboken, NJ: Wiley Publishing.

Allied Academies International Conference page 9
Proceedings of the Academy of Accounting and Financial Studies, Volume 11, Number 1 New Orleans, 2006
DO HOMOGENEOUS GOODS PRODUCE THE SAMERETURNS? AN ANALYSIS OF S&P 500 INDEX
MUTUAL FUNDSJohn Cresson, Southeastern Louisiana University
ABSTRACT
Standard and Poor’s (S&P) 500 Index mutual funds have become enormously popular withinvestors. S&P 500 Index mutual funds are designed to replicate the S&P 500 Index, and therefore,should move very closely with the Index. Since S&P 500 Index funds are supposed to behomogeneous goods, theoretically, they should yield the same returns. Unlike other investments,investors who hold S&P 500 Index funds have a clear benchmark for performance: the returns onthe S&P 500 Index. In this paper, I analyze the performance of S&P 500 Index funds.

page 10 Allied Academies International Conference
New Orleans, 2006 Proceedings of the Academy of Accounting and Financial Studies, Volume 11, Number 1
Allied Academies International Conference page 11
Proceedings of the Academy of Accounting and Financial Studies, Volume 11, Number 1 New Orleans, 2006
INTELLECTUAL CAPITAL REPORTING:A USER PERSPECTIVE
Suresh Cuganesan, Macquarie Graduate School of [email protected]
Richard Petty, Macquarie Graduate School of [email protected]
Nigel Finch, Macquarie Graduate School of [email protected]
ABSTRACT
The field of intellectual capital (IC) has witnessed rapid growth in recent times, with a rangeof IC measurement and reporting models being developed by academics, consultants andpractitioners. Despite widespread pronouncements that businesses report their IC, and increasinglyregulatory requirements for organisations to do so, surveys of practice indicate limited IC reportingpractice. In addition, there are limited empirically-validated insights in to the reasons for thisapparent ‘disconnect’ between theory and practice, with important questions remaining unresolved:do users of corporate disclosure information find this adequate? Is there demand for IC reporting?If so, how is this best provided? Given these questions, this study examines the need of decisionmakers for IC information.
INTRODUCTION
The Western world has entered what is commonly referred to as the �knowledge age�, whereinformation and ideas have overtaken agricultural produce and manufactured goods as the keycommodities, and where innovation rather than industrial production is emphasised. Manyorganisations are seeking to transform themselves into knowledge-intensive or �knowledge-basedorganisations�, and they are urged to report their intellectual capital (IC) to wider stakeholders inan effort to ensure fair and stable valuations and accurate decisions about the allocation of economicresources. However, few companies appear to be actively engaged in IC reporting (ICR) (Guthrieand Petty, 2000; April et al., 2003), raising concerns �about the effectiveness of present levels ofIC management within even the best practice organisations� (Roslender & Fincham, 2004, p.184).This study�s objective is to uncover user perceptions in relation to company disclosure generally,the demand for ICR specifically and the extent to which these needs are currently being met, andthe potential frameworks that might facilitate the process of ICR.
The structure of the paper is as follows. Firstly, the importance of IC and the implicationsfor measurement, management and reporting is discussed, followed by a description of the researchmethod utilised. The results are then presented while the final section concludes with a synthesis ofthe study�s main findings and implications.
THE IMPORTANCE OF IC AND ICR PRACTICE
There is increasing evidence that the drivers of value creation in modern competitiveenvironments lie in a firm�s IC rather than its physical and financial capital. Studies of listedcompanies consistently find significant gaps between the accounting book value of organisationsand their market value. Analyses made publicly available by the consulting firm Accenture indicatesthat, for knowledge intensive firms, tangible assets and resources typically comprise between fifteen

page 12 Allied Academies International Conference
New Orleans, 2006 Proceedings of the Academy of Accounting and Financial Studies, Volume 11, Number 1
and twenty-five percent of company value in the last five years (Ballow et al., 2004). The samestudy also finds that, across the majority of listed companies in the United States, expectations offuture growth value (as opposed to current earnings) comprise almost sixty percent of currentcompany value. Adopting a formal framework to report on IC is a way for firms to explicitlyidentify, audit and manage intangible sources of value creation and communicate these bothinternally and externally.
However, content analysis studies of annual reports generally conclude that ICR in practiceis deficient. In one of the earlier studies, Guthrie and Petty (2000) examined reporting practicesamongst 20 leading Australian companies and found �a lot of empty rhetoric surrounding the notionof measuring, valuing and reporting intellectual capital� (Guthrie and Petty, 2000, p.246). Otherstudies utilising content analysis methods have found corresponding low levels of ICR (Brennan,2001; April et al. 2003; Ordonez de Pablos, 2002). The parlous state of ICR reported by theseresearchers contrasts with the extensive illustrations of IC statements produced by Scandinavianorganisations, and indicate in relation to IC �the lack of any systematic foundation to either themeasurement or reporting practices� (Roslender and Fincham, 2004, p.203).
While these studies are able to comment on the lack of cohesive ICR, they provide onlylimited explanation for their observations. One plausible explanation involves the degree to whichusers of annual reports require IC information for their decision-making purposes. Indeed, the extantliterature is equivocal in this regard. For example, Johanson (2003) suggested that analysts may notemphasise IC value even when it is voluntarily reported on because investors are not convinced thatinvestment decisions should be based on intangible value. In contrast, Lev (1999) is of the view thatfinancial analysts are likely to use IC information if provided, thereby making capital markets moreefficient and reducing the cost of capital, thereby encouraging growth (p.15). To date, this equivocalstance has not been resolved. To remedy this gap, this paper presents the results of a survey of HongKong Finance Professionals aimed at eliciting their views on the reporting of IC, their knowledgeof the reporting tools available, and also on their ability to privately access information that mighthelp them determine the value of company IC to support their decision-making. Doing so is timelygiven the divergent views expressed in prior literature.
RESEARCH SAMPLE
Much of the literature suggests that financial analysts is the ideal group to study to examinewhether or not voluntary disclosures made in company annual reports are likely to have an impacton the financial markets (Lev, 1999). However, it was not possible to obtain participation from alarge enough number of financial analysts in Hong Kong for the results to possess much externalvalidity. Therefore, a proxy sample group in the form of members of a professional financial bodywas targeted in gathering the survey data. The professional body was large enough in Hong Kongto enable a meaningful sample to be drawn from it. Further, members of the professional body areall known to possess core financial skills relating to the reading and interpretation of annual reports.
The survey instrument was administered face-to-face during professional developmentsessions, and also during office visitation opportunities, to a total of 238 respondents. All responseswere useable. Data were analysed using simple descriptive statistics to obtain percentage values forresponses to each of the closed questions. The open-ended responses were tabulated and analysedon a content basis to identify obvious respondent threads.
RESULTS
As shown in table 1, the majority of respondents are in favour of the accounting professionand / or the regulatory authorities imposing additional IC disclosure requirements on listedcompanies in Hong Kong. Most respondents (91%) believe that they would find IC reports decision-

Allied Academies International Conference page 13
Proceedings of the Academy of Accounting and Financial Studies, Volume 11, Number 1 New Orleans, 2006
useful if they were made available. This finding is shown in Item 2 in table 1. Only a small number(9%) thought they would not find IC information useful in supporting decisions. It may be that theserespondents either could not conceive of what information would be provided by the IC reports orthat they are so used to making decisions without having access to formal reports on IC informationthat they feel equipped to continue along the same path unaided. Overall, however, the majority ofparticipants thought that voluntarily disclosing IC information should have a positive impact onmarket capitalisation (see Item 3 in Table 1)
Table 1. Demand for ICR
% of Respondents(N=238)
Item Yes No
1. Do you think that the accounting profession and/or the regulatorsin Hong Kong should require listed companies in Hong Kong toprovide more information on their IC?
87 13
2. Certain tools are designed to provide information on a company�sIC. Do you think you would find information provided by such toolsuseful in making investment decisions regarding a company?
91 9
3. Do you think that a company voluntarily disclosing additionalinformation on its IC should be rewarded by the capital market in theform of a higher share price?
88 12
Table 2 shows that a majority of respondents (60%) feel they are in a poor or very poorposition to get hold of information on the IC of listed Hong Kong companies through public sources.Fewer than half this number (28%) of respondents rated their ability to obtain such information asgood or very good.
Table 2. Ability to acquire IC information through public information sources?
Please rate your ability to obtain information on the IC of listed Hong Kong companiesthrough public information sources? (%), N=238
Very poor 18
Poor 42
Neutral 12
Good 22
Very good 6
Total 100
The findings presented in Table 2 are in stark contrast to the results shown in table 3. Astable 3 shows, if private information channels are used a majority of respondents (68%) feel theyare able to obtain good or very good information on the IC of listed Hong Kong companies. Only

page 14 Allied Academies International Conference
New Orleans, 2006 Proceedings of the Academy of Accounting and Financial Studies, Volume 11, Number 1
16% of respondents still feel they are in a poor or very poor position to obtain such information onceprivate information sources are considered.
Table 3. Ability to acquire IC information through private information sources?
Please rate your ability to obtain information on the IC of listed Hong Kong companiesthrough private information sources? (%), N=238
Very poor 7
Poor 9
Neutral 16
Good 39
Very good 29
Total 100
Overall, however, perceptions are that ICR is increasing. Table 4 shows that 64% ofrespondents believe that companies listed in Hong Kong are reporting more IC information than theywere 10 years ago.
Table 4. ICR Trends
Do you think Hong Kong listed companies are disclosing more information on their IC thanthey did 10 years ago? (%), N=238
Yes 64
No 26
No idea 10
Total 100
CONCLUSIONS
The survey data offers an empirical account of how a group of financial professionals usesIC information and of the value that this group imputes to IC reporting.
There is considerable support for the mandated disclosure of IC with 87% of respondentsagreeing that the accounting profession or the regulatory authorities in Hong Kong should makelisted companies provide more information on their IC (table 1 item 1). It is worth noting, however,that regardless of what the policy-makers do, most respondents think Hong Kong companies aremore transparent with respect to their IC than they were 10 years ago (table 4). Provided this trendcontinues and the market mechanism efficiently answers the call for increased IC reporting, theeventual intervention by a regulatory body may have little impact unless the requirements to discloseare onerous.
The demand for a market response certainly seems to exist with 88% of respondentsbelieving that voluntary disclosure of IC by companies should be rewarded by the capital marketin the form of a higher share price (table 1 item 3). An even greater number of respondents (91%)

Allied Academies International Conference page 15
Proceedings of the Academy of Accounting and Financial Studies, Volume 11, Number 1 New Orleans, 2006
think that having access to IC reports will assist them in making investment decisions (table 1 item2).
A majority of respondents (68%) claim to be in a good or very good position to obtaininformation on the IC of listed Hong Kong companies through private information sources (table3). The same respondents rate their ability to obtain adequate IC information on listed Hong Kongcompanies via public information channels more poorly with only 28% of respondents in a good orvery good position to get the information they need (table 2).
This finding is significant because it suggests that one group of stakeholders (financialprofessionals in the case of this study) are able to gain an advantage over other stakeholder groupsbecause of information asymmetries created by special relationships. This results in an unevenplaying field in which some stakeholders are empowered, and others are not. Lev (1999) alsoexpressed this view, but with no empirical support. An equitable balance could be restored ifcompanies were to report publicly the information they currently communicate privately to certainelite stakeholder groups.
REFERENCES
April, K.A., Bosma, P. and Deglon, D.A. (2003), �IC measurement and reporting: establishing a practice in SouthAfrican mining�, Journal of IC, Vol. 4 No. 2, pp. 165-80.
Ballow, J., Burgman, R., Roos, G., and Molnar. M., (2004). A New Paradigm for Managing Shareholder Value,Accenture Institute for High Performance Business.
Guthrie, J. and Petty, R. (2000), �IC: Australian annual reporting practices�, Journal of IC, Vol. 1 No. 3, pp. 241-251.
Brennan, N., (2001), �Reporting intellectual capital in annual reports: evidence from Ireland�, Accounting, Auditing andAccountability Journal, 16 (1), pp.49-56.
Lev, B. (2001). Intangibles: Management, Measurement and Reporting. Washington, D.C., Brookings Institutions Press.
Johanson, U., (2003), �Why are capital markets actors ambivalent to information about certain indicators on intellectualcapital�, Accounting, Auditing and Accountability Journal, 16 (1).
Ordónez de Pablos, P. (2002), �Evidence of IC Measurement from Asia, Europe and the Middle East�, Journal of IC,Vol. 3, No. 3, pp. 287-302.
Petty, R. and Guthrie, J. (2000). "IC literature review." Journal of IC 1(2): 155-176.
Quinn, J.B. (1992). Intelligent Enterprise: A Knowledge and Service Based Paradigm for Industry. Free Press: Sydney.
Roslender, R. and Fincham, R. (2004), �IC accounting in the UK: A field study perspective�, Accounting, Auditing &Accountability Journal, Vol. 17, No. 2, pp. 178-209.

page 16 Allied Academies International Conference
New Orleans, 2006 Proceedings of the Academy of Accounting and Financial Studies, Volume 11, Number 1

Allied Academies International Conference page 17
Proceedings of the Academy of Accounting and Financial Studies, Volume 11, Number 1 New Orleans, 2006
U.S. GROWTH MUTUAL FUNDS PERFORMANCE:AN EVALUATION
Amitabh S Dutta, Columbus State [email protected]
ABSTRACT
Prior research has used different techniques to study whether mutual funds are able to repeatedly outperform the market (defined as performance persistence). This study takes asimple but straightforward approach to such a comparison. Based on earlier research, the S&P 500is the market proxy. Each year over the study period (1988 to 1996) a mutual fund’s annual returnis compared to the S&P 500 annual return. Based on whether it is above (outperformance) or below(underperformance) the market return, each fund is categorized as a “winner” or a “loser” for thatyear. Over the eight-year study period, it is seen that in six years the percentage of winnersrepeating exceeds the percentage of repeating losers. This finding supports the hot handsphenomenon documented by prior research (Hendricks, Patel & Zeckhauser 1993; Goetzmann &Ibbotson 1994). The two years when losers are greater in repeat percentage are preceded by yearsin which the market benchmark had very high returns. This result indicates that a year in which themarket has a really high return, it is more likely that losers will repeat their losing performance thefollowing year. Conversely, it also seems to suggest that given the same scenario, winners are lesslikely to demonstrate persistence over the next year.

page 18 Allied Academies International Conference
New Orleans, 2006 Proceedings of the Academy of Accounting and Financial Studies, Volume 11, Number 1

Allied Academies International Conference page 19
Proceedings of the Academy of Accounting and Financial Studies, Volume 11, Number 1 New Orleans, 2006
THE EMERGENCE OF CSR ANDSUSTAINABILITY INDICES
Nigel Finch, Macquarie Graduate School of [email protected]
ABSTRACT
The aim of sustainability performance indices is to provide a benchmark for financialproducts and to measure the financial performance of companies that lead their industry in termsof sustainability. This paper examines sustainability performance indices on global financialmarkets and determines the extent of Australian representation within these global indices.
The paper outlines the emergence of nine major market indices designed to track theperformance of a variety of listed companies that are seen to have desirable sustainability practices.These indices include: ARESE Sustainable Performance Indices; Dow Jones Sustainability Index;FTSE4Good Indices; Calavert, Domini Social Index; E. Capital Partners Ethical Index; EthibelSustainability Index; Humanix Ethical Index; and Jantzi Social Index.
Following a brief description of each of these indices, this paper catalogues each indexaccording to: (a) their launch date; (b) the markets they cover; and (c) their Australian weighting.This section concludes by identifying that Australian listed companies are not well representedamong these major indices.
THE EMERGENCE OF SUSTAINABILITY INDICES
In response to an increasing investor appetite for socially responsible and ethical investments(McKinsey & Company, 2000; Greene, 2003), and in an attempt to develop a performance ratingfor sustainability, a number of stock market indices have emerged on the global financial markets.
These sustainability indices are designed to benchmark the performance of global SociallyResponsible Investments (SRI) and to help investors identify listed companies that employsustainable business practices that incorporate a desire or practice to be socially responsible. Theseare companies that are focused on not just delivering sound financial performance but are equallyfocused on delivering performance around a number of sustainability issues.
Table 1 below lists the nine major stock market indices designed to track the performanceof listed companies that are seen to have desirable sustainability practices.
The nine major sustainability indices mentioned above are briefly described in the followingsection.
Table 1: Australian weightings of major sustainability indices
Index Launched Markets Covered AustralianWeighting
ARESE Sustainable Performance Indices 2001 Europe -
Dow Jones Sustainability Index 1999 Global 2.63%
FTSE4Good Indices 2001 Global 1.46%
Calavert 2000 USA -
Domini Social Index 1990 USA -

page 20 Allied Academies International Conference
New Orleans, 2006 Proceedings of the Academy of Accounting and Financial Studies, Volume 11, Number 1
E. Capital Partners Ethical Index 2000 Global 1.60%
Ethibel Sustainability Index 2002 Global 1.62%
Humanix Ethical Index 2001 Global 1.56%
Jantzi Social Index 2000 Canada -
ARESE SUSTAINABLE PERFORMANCE INDICES (ASPI)
The ARESE Sustainable Performance Indices (ASPI) was launched in July 2001 and tracksthe financial performance of leading sustainability companies across Europe. The ASPI indicesinclusion criteria has four main themes: (1) triple bottom line perspective; (2) positive screeningapproach; (3) risk management; and (4) a stakeholder-centered approach. The ASPI does not includeany Australian companies within its composite.
DOW JONES SUSTAINABILITY INDEX
Launched in September 1999, the Dow Jones Sustainability Indices (DJSI) was the firstglobal indices tracking the financial performance of leading sustainability-driven companiesworldwide. The DJSI is constructed with a selection criteria comprising the following six elements:(1) strategy; (2) financial; (3) customer and product; (4) governance and stakeholder; (5) human;and (6) process. Of the 316 companies included in the DJSI World Index, 16 are Australiancompanies, which represent a total of 2.63% of the total index market capitalisation.
FTSE4GOOD INDICES
The FTSE4Good Indices measure the performance of socially responsible companies aroundthe world. Launched in July 2001, the selection criteria cover environmental sustainability,stakeholder relationships and universal human rights. Of the 627 companies that comprise theFTSE4Good Global Index, 17 companies are Australian and together they represent only 1.46% ofthe indices weighting.
CALAVERT SOCIAL INDEX
Launched in April 2000, the Calvert Social Index measures the performance of US-basedsocially responsible companies included in the 1,000 largest companies (listed stocks on the NYSEand Nasdaq-AMEX) in the US.Companies included in the Calvert index meet the selection criteriacomprising environment, workplace issues, product safety and impact, community relations andinvestments, military weapons contracting, international operations and human rights, andindigenous peoples� rights. The Calavert does not include any Australian companies within itscomposite.
DOMINI SOCIAL INDEX
The Domini Social Index is a socially and environmentally screened index consisting ofprimarily large-cap US companies and is the oldest US socially responsible index and was launchedin 1990. The Domini Social Index excludes companies with significant revenues from alcohol,tobacco, gambling, nuclear power and weapons contracting. It includes companies with positive

Allied Academies International Conference page 21
Proceedings of the Academy of Accounting and Financial Studies, Volume 11, Number 1 New Orleans, 2006
records in community involvement, the environment, employee relations and hiring practices. TheDomini Social Index does not include any Australian companies within its composite.
E. CAPITAL PARTNERS ETHICAL INDEX
The E. Capital Partners Ethical Index was launched in January 2000 and is a global indexcombining traditional financial approaches with social and environmental criteria. The generalguiding principle of the index penalises those companies that operate in sectors E.Capital assessesas being injurious to the rights and dignity of humanity. Primarily, armaments, nuclear, alcohol,tobacco and gambling, and pornography. The E.Capital includes only 1.60% of its weighting inAustralian companies.
ETHIBEL SUSTAINABILITY INDEX
The Ethibel Sustainability Index commenced in June 2002 and is a global index that focuseson sustainable development and stakeholder involvement. Ethibel comprises companies that havebeen screened on the following core themes: internal social policy, environmental policy, externalpolicy and economic-ethical policy. The Ethibel includes only 1.62% of its weighting in Australiancompanies.
HUMANIX ETHICAL INDEX
The Humanix Ethical Index was established in January 2001 and is a globally focused index.Humanix comprises companies that have passed the Humanix ethical screening process and areapproved by the Humanix Ethical Council for inclusion in the index. Humanix includes onlycompanies whose activities are not related to significant environmental risks, respect human rights,and where 97% or more of the total turnover is not derived from production and/or marketing ofarms or the production of alcoholic beverages. The Humanix Ethical Index includes only 1.56% ofits weighting in Australian companies.
JANTZI SOCIAL INDEX
The Jantzi Social Index (JSI) is a socially screened index containing Canadian companiesthat pass a set of broadly based social and environmental criteria. The index was launched in January2000.The JSI does not include companies that have significant involvement in the production ofnuclear power, the manufacture of tobacco products or weapons-related contracting. The JSI alsoavoids companies that have a consistently poor relationship with aboriginal communities; undertakequestionable or fraudulent business practices; have a consistently poor employee relations record;have a consistently poor environmental performance record compared with industry counterparts;have experienced significant problems at their operations outside of Canada, or have operations in,or links with, Burma; or manufacture unsafe products. The JSI does not include any Australiancompanies within its composite.
SUMMARY OF SUSTAINABILITY INDICES
Sustainability indices first emerged on a global basis in 1999 with the Dow JonesSustainability Index (DJSI). While the methodologies used to compile the indices differ betweeneach index, the focus of the selection models are similar in that they screen companies based onfactors such as their corporate governance, workplace practices, social impact and environmentalperformance.

page 22 Allied Academies International Conference
New Orleans, 2006 Proceedings of the Academy of Accounting and Financial Studies, Volume 11, Number 1
These indices have an important role in helping to facilitate SRI and to benchmark SRIperformance (Mckinsey & Company, 2000). The out-performance of these indices (and theindividual companies that together constitute the indices) relative to global stock market indices hasalso been used as evidence to support a growing argument that practicing sustainability increasesthe value of the firm (Bauer et al, 2003; Brown & Caylor, 2004, Grompers et al., 2003; Hamid &Sandford, 2002; Harrison & Freeman, 1999; Pava & Krausz, 1996; Roman et al., 1999; Waddock& Groves, 1997).
Of the nine major sustainability indices, only the Dow Jones Sustainability Index (DJSI) usesa comprehensive approach to CSR and rates its constituent companies using the four key elementsof CSR: (1) environmental impact; (2) corporate governance; (3) social impact; and (4) workplacepractices.
CONCLUSION
Of the nine major sustainability indices, only five have a global reach and of these five, onlya few Australian companies are represented. The absence of stronger Australian representationacross the indices and the absence of a comparable index on the Australian bourse indicate therelative immaturity of sustainability disclosure by Australian companies. This finding is consistentwith a recent Federal Government study which examines corporate sustainability from theperspective of investors and concluded, �companies are not articulating their sustainabilitybehaviours as well as they might� (Mays, 2003, p.6).
This lax behavior regarding sustainability disclosure by the majority of Australian listedcompanies is likely to change with the pressure coming from: (a) an increase in Australian SRIinvestment; (b) new legislation targeting disclosure; and (c) the introduction of an Australian ratingsagency focused on this rating typology.
REFERENCES
Bauer R., Gunter N., & Otten R., (2003), Empirical Evidence on Corporate Governance in Europe: The Effect on StockReturns, Firm Valuation and Performance, Journal of Asset Management, vol. 3, issue 4, pp. 296 � 314.
Brown, D. L. & Caylor M. L., (2004), Corporate Governance Study: The Correlation between Corporate Governanceand Company Performance, Corporate Governance Study, Institutional Shareholder Services.
Gompers P. A., Ishii L. J., & Metrick A., (2003), Corporate Governance & Equity Prices, Quarterly Journal OfEconomics, vol. 118, issue 1, pp.107 - 158.
Greene, D., (2003), Socially Responsible Investment in Australia, Ethical Investment Association, Sydney.
Hamid N. & Sandford Y., (2002), Portfolio, Index & Futures Research: Are SRI Indices Responsible, European EquitiesResearch, Deutsche Bank AG.
Harrison J. S., Freeman R. E., (1999), Stakeholders, Social Responsibility and Performance: Empirical Evidence andTheoretical Perspectives, Academy of Management Journal, Volume 42, issue 5, pp. 479 � 486.
Mays, S., (2003), Corporate Sustainability – an investor perspective; The Mays Report, Department of the Environmentand Heritage, Canberra.
McKinsey & Company, (2000), Investor Opinion Survey on Corporate Governance, McKinsey & Company, London,UK.
Pava, M. L. & Krausz J., (1996), The Association between Corporate Social Responsibility and Financial Performance:The Paradox of Social Cost, Journal of Business Ethics, Issue 15, Volume 3, pp. 321-357

Allied Academies International Conference page 23
Proceedings of the Academy of Accounting and Financial Studies, Volume 11, Number 1 New Orleans, 2006
Roman R. M., Hayobor S., & Agle B. R., (1999), The relationship between social and financial performance, Businessand Society, issue 1, volume 38, pp 109 - 126.
Waddock, S. & Graves S., (1997), The corporate social performance � financial performance link, StrategicManagement Journal, no. 18, pp. 303-319.

page 24 Allied Academies International Conference
New Orleans, 2006 Proceedings of the Academy of Accounting and Financial Studies, Volume 11, Number 1
Allied Academies International Conference page 25
Proceedings of the Academy of Accounting and Financial Studies, Volume 11, Number 1 New Orleans, 2006
THE SCALING PROPERTY OF RANDOMNESS:THE IMPACT OF REPORTING FREQUENCY
ON THE PERCEIVED PERFORMANCE OFINVESTMENT FUNDS
Nigel Finch, Macquarie Graduate School of [email protected]
Guy Ford, Macquarie Graduate School of [email protected]
Suresh Cuganesan, Macquarie Graduate School of [email protected]
Tyrone M Carlin, Macquarie Graduate School of [email protected]
ABSTRACT
This paper reports on the life-time annual returns and volatility of the largest Australianfive-star rated investment funds. Using this actual performance data, we model the likelihood thatan investor would have viewed the actual performance as either positive or negative based upon thefrequency of the performance reporting. By examining the scaling properties of the random returnsgenerated by the investment, we find that the probability of an investor viewing the performance oftheir investment as successful, rather than unsuccessful, can be influenced by the time intervalsunder which the performance is reported. The findings from this research have direct implicationsto Australian investment managers in setting policies regarding the provisions of real-time andperiodic performance reporting to their investors.
INTRODUCTION
Investment funds in Australia currently have an estimated $923 billion in Funds UnderManagement (FUM) and is forecast to grow at 12% per annum to $3 trillion by 2014 (Rainmaker,2004). With more than 2,700 investment funds competing for market share (Finch, 2005), manyfunds are attempting to differentiate their product by offering additional features. One commonfeature is the provision of real-time, end-of-day, or online performance reporting, as well as thecustomisation of reporting periodicity for each investor. From the investors perspective, featuressuch as these offers improved transparency and convenience, as the investor can regularly view theinvestment performance by accessing this information online, Otherwise, they may change the timescale under which their printed valuation statements are prepared, thereby increasing the frequencyof performance reporting..
Features such as these are seen as positive initiatives in that they may be helping to increaseFUM by differentiating the product and attracting additional fund inflows. However, these initiativesmay be delivering the opposite effect, and may play a role in the decline of FUM, as investor�smotivations to withdraw from the fund increase because of a greater probability of perceiving theinvestment performance as unsatisfactory.
We argue that reducing the time scale under which an investor views their performance (eg.from monthly performance reporting to daily performance reporting), will increase the probabilitythat an investor will perceive the performance of their investment as being unsuccessful. This is

page 26 Allied Academies International Conference
New Orleans, 2006 Proceedings of the Academy of Accounting and Financial Studies, Volume 11, Number 1
because under a shorter time scale, the investor will be observing the volatility of their investment,rather than the return (Taleb, 2005, p. 67).
Through the use of Prospect Theory (Kahneman and Tversky, 1979), insights are gained intothe behaviour of investors given volatility of expected returns, and the likelihood of an investorjudging the investment as being either successful or unsuccessful. This paper will model the changein probability that an investor will likely view their investment performance as being unsuccessful,by narrowing the time scale used to report performance.
PROSPECT THEORY
Standard models in economics and finance that deal with investment decision making underuncertainty are based on the expected utility paradigm. In short, they assume that the preferencesof investors are characterised by risk aversion across the entire distribution of outcomes � theirutility functions are everywhere concave. However, based on the observation that individuals exhibitbehaviour counter to expected utility theory, Friedman and Savage (1948) and Markowitz (1952)theorise that the utility functions of individuals must include both concave and convex segments.They base base their claim on the observation that individuals simultaneously purchase lotterytickets and insurance policies, implying both risk-seeking and risk-averse behaviour. In particular,Markowitz argues that investors make decisions based on perceived changes in their wealth, andargues that investors are risk-averse for losses and risk-seeking for gains, except in the case wheregains or losses are extreme, where the situation is reversed and individuals become risk-seeking forlosses and risk averse for gains. Later experiments conducted by Kahneman and Tversky (1979) andTversky and Kahneman (1992) find that individuals maximise the expected value of a function witha convex segment for losses and a concave segment for gains, supporting the earlier theoreticalpropositions of Friedman and Savage (1948) and Markowitz (1952).
In response to their experimental findings, Kahneman and Tversky (1979) and Tversky andKahneman (1992) formulate Prospect Theory and Cumulative Prospect Theory. The essence of theseparadigms is that the preferences of individuals are defined, not over actual payoffs (as per expectedutility theory), but rather over gains and losses relative to some reference point, so that losses aregiven a greater utility weight. The key elements of their paradigms are: (1) Investors base theirdecisions on change of wealth rather than total wealth, in contrast to expected utility theory; (2)Investors employ subjective decision weights rather than objective probabilities; (3) Investors suffernegative utility of around 2.25 times more than they derive positive utility from gains, where thegains are of equal size to the losses.
In summary, the decision to hold or sell an investment will be based on the investmentsvolatility (change in wealth), rather then the absolute performance (total wealth). Further, aninvestor will be subjective when observing random volatility, and where this volatility generates anegative return, the investor will be 2.25 times more inclined to sell the investment, then they willbe to continue to hold it.
METHODOLOGY
Four Australian investment funds were selected to model the success probabilities. Fundswere chosen if they had more than more than $1 billion in FUM and also carried a five-star ratingissued by Morningstar. Due to the large size and high rating of these funds, their investmentperformance is likely to be most representative of a typical Australian mutual fund investor. Thedata was sourced from Morningstar and Iress, and the qualifying funds are shown in Table 1 below:
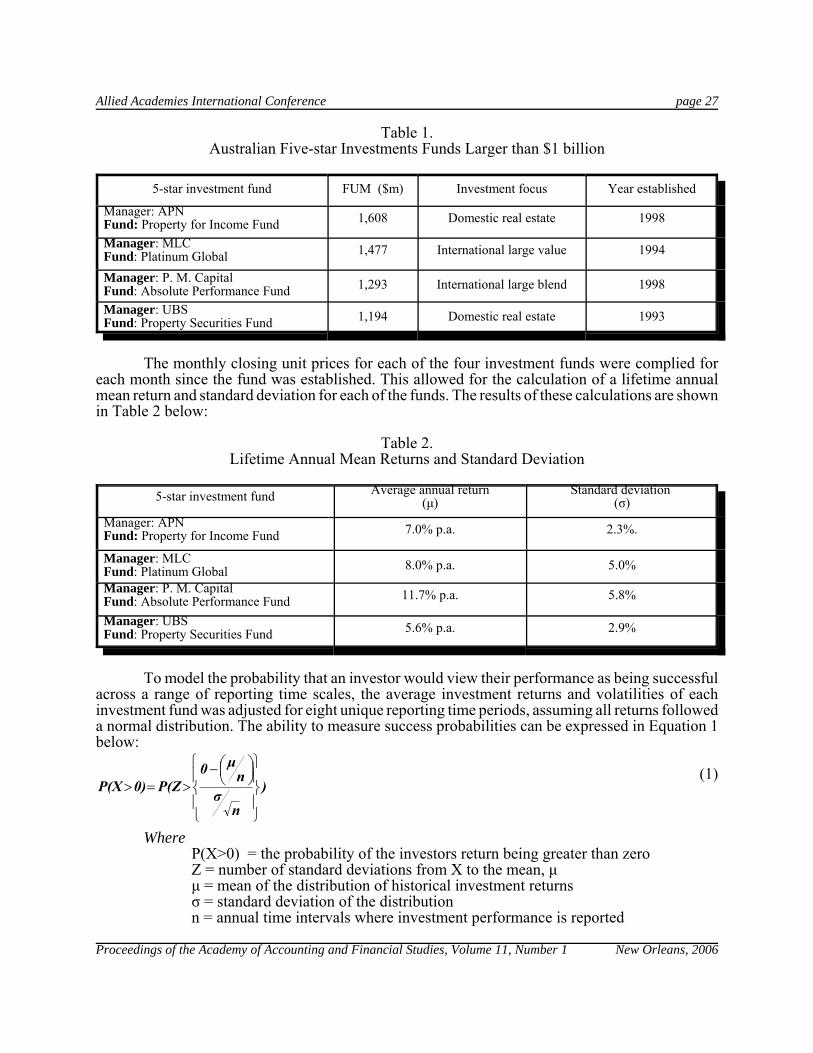
Allied Academies International Conference page 27
Proceedings of the Academy of Accounting and Financial Studies, Volume 11, Number 1 New Orleans, 2006
Table 1.Australian Five-star Investments Funds Larger than $1 billion
5-star investment fund FUM ($m) Investment focus Year established
Manager: APN Fund: Property for Income Fund 1,608 Domestic real estate 1998
Manager: MLC Fund: Platinum Global 1,477 International large value 1994
Manager: P. M. Capital Fund: Absolute Performance Fund 1,293 International large blend 1998
Manager: UBSFund: Property Securities Fund 1,194 Domestic real estate 1993
The monthly closing unit prices for each of the four investment funds were complied foreach month since the fund was established. This allowed for the calculation of a lifetime annualmean return and standard deviation for each of the funds. The results of these calculations are shownin Table 2 below:
Table 2.Lifetime Annual Mean Returns and Standard Deviation
5-star investment fund Average annual return(µ)
Standard deviation (σ)
Manager: APN Fund: Property for Income Fund 7.0% p.a. 2.3%.
Manager: MLC Fund: Platinum Global 8.0% p.a. 5.0%
Manager: P. M. Capital Fund: Absolute Performance Fund 11.7% p.a. 5.8%
Manager: UBSFund: Property Securities Fund 5.6% p.a. 2.9%
To model the probability that an investor would view their performance as being successfulacross a range of reporting time scales, the average investment returns and volatilities of eachinvestment fund was adjusted for eight unique reporting time periods, assuming all returns followeda normal distribution. The ability to measure success probabilities can be expressed in Equation 1below:
(1)
WhereP(X>0) = the probability of the investors return being greater than zeroZ = number of standard deviations from X to the mean, µµ = mean of the distribution of historical investment returnsσ = standard deviation of the distributionn = annual time intervals where investment performance is reported
)n
σn
µ0P(Z0)P(X
−
>=>
page 28 Allied Academies International Conference
New Orleans, 2006 Proceedings of the Academy of Accounting and Financial Studies, Volume 11, Number 1
FINDINGS
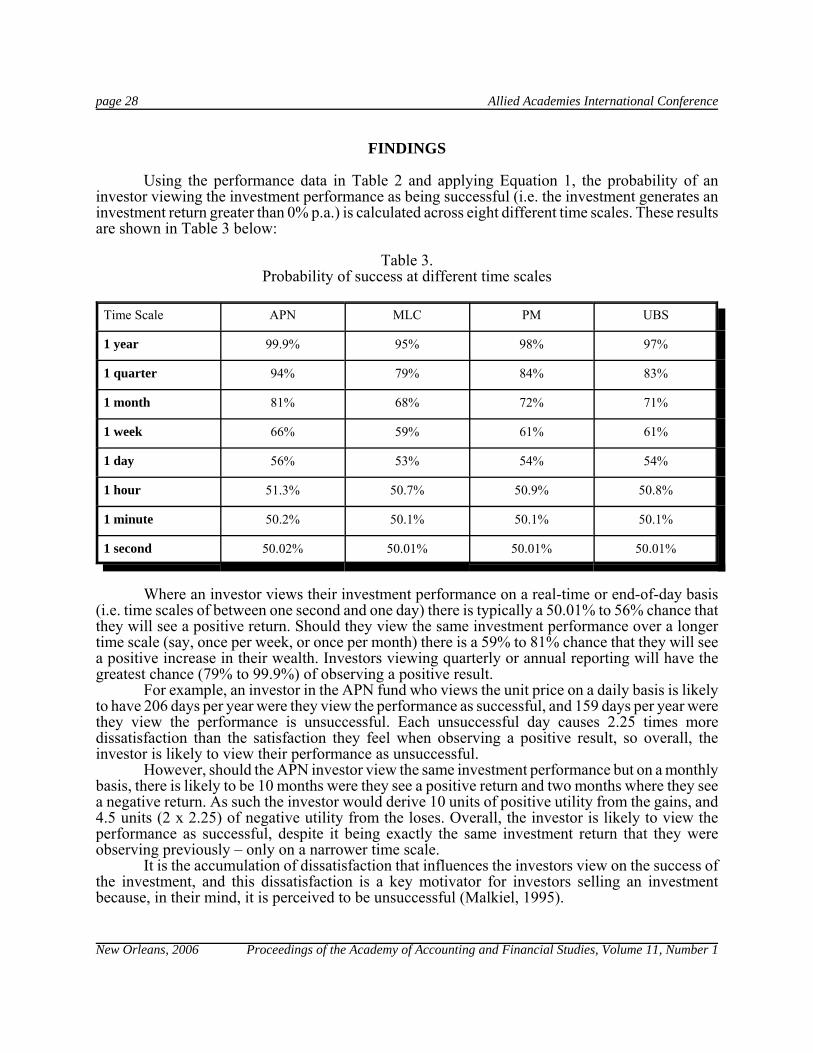
Using the performance data in Table 2 and applying Equation 1, the probability of aninvestor viewing the investment performance as being successful (i.e. the investment generates aninvestment return greater than 0% p.a.) is calculated across eight different time scales. These resultsare shown in Table 3 below:
Table 3.Probability of success at different time scales
Time Scale APN MLC PM UBS
1 year 99.9% 95% 98% 97%
1 quarter 94% 79% 84% 83%
1 month 81% 68% 72% 71%
1 week 66% 59% 61% 61%
1 day 56% 53% 54% 54%
1 hour 51.3% 50.7% 50.9% 50.8%
1 minute 50.2% 50.1% 50.1% 50.1%
1 second 50.02% 50.01% 50.01% 50.01%
Where an investor views their investment performance on a real-time or end-of-day basis(i.e. time scales of between one second and one day) there is typically a 50.01% to 56% chance thatthey will see a positive return. Should they view the same investment performance over a longertime scale (say, once per week, or once per month) there is a 59% to 81% chance that they will seea positive increase in their wealth. Investors viewing quarterly or annual reporting will have thegreatest chance (79% to 99.9%) of observing a positive result.
For example, an investor in the APN fund who views the unit price on a daily basis is likelyto have 206 days per year were they view the performance as successful, and 159 days per year werethey view the performance is unsuccessful. Each unsuccessful day causes 2.25 times moredissatisfaction than the satisfaction they feel when observing a positive result, so overall, theinvestor is likely to view their performance as unsuccessful.
However, should the APN investor view the same investment performance but on a monthlybasis, there is likely to be 10 months were they see a positive return and two months where they seea negative return. As such the investor would derive 10 units of positive utility from the gains, and4.5 units (2 x 2.25) of negative utility from the loses. Overall, the investor is likely to view theperformance as successful, despite it being exactly the same investment return that they wereobserving previously � only on a narrower time scale.
It is the accumulation of dissatisfaction that influences the investors view on the success ofthe investment, and this dissatisfaction is a key motivator for investors selling an investmentbecause, in their mind, it is perceived to be unsuccessful (Malkiel, 1995).

Allied Academies International Conference page 29
Proceedings of the Academy of Accounting and Financial Studies, Volume 11, Number 1 New Orleans, 2006
CONCLUSION
An investor will feel some pleasure when they experience positive performance, but not inan equivalent amount as the pain they experience when the performance is negative (Taleb, 2005).Narrowing the time scale under which investment performance is reported by an investment fund,greatly increases the probability that the investor will experience more pain and dissatisfaction. Thisdissatisfaction will eventually motivate the investor to sell the investment as they perceive it to beperforming unsatisfactorily.
Investment funds attempting to differentiate themselves to secure improved fund flowsshould resist the temptation to provide investors with the ability to view performance reporting overnarrow time periods (such as real-time, end-of-day, or weekly reporting). This strategy ofdifferentiation by allegedly �improving� the investor reporting is counter-productive; as it is likelythis very feature will actually motivate investors to leave the fund.
REFERENCES
Finch N., (2005), �The Trouble with MER: The Disclosure of Fees and Charges in Australian Superannuation andInvestment Funds�, Journal of Law and Financial Management, 4, 1.
Friedman, M. and Savage, L., (1948), �The Utility Analysis of Choices Involving Risk�, Journal of Political Economy,56, 4, pp. 279-304.
Kahneman, D. and Tversky, A. (1979), �Prospect Theory: An Analysis of Decision Under Risk�, Econometrica, 47, pp.263-291.
Malkiel, B.G., (1995), �Returns from investing in equity mutual funds 1971 to 1991�, Journal of Finance, Vol. 50, pp.549-572.
Markowitz, H., (1952), �Portfolio Selection�, Journal of Finance, 7, pp. 77-91.
Rainmaker, (2004), "Super fund and allocated pension fee survey 2004-05", Rainmaker Benchmarking, September, pp.3 -9
Taleb, N. N. (2005), Fooled by Randomness: The Hidden Role of Chance in Life and in the Markets, Random House,New York.
Tversky, A. and Kahneman, D, (1992), �Advances in Prospect Theory; Cumulative Representation of Uncertainty�,Journal of Risk and Uncertainty, 5, pp. 297-323.

page 30 Allied Academies International Conference
New Orleans, 2006 Proceedings of the Academy of Accounting and Financial Studies, Volume 11, Number 1

Allied Academies International Conference page 31
Proceedings of the Academy of Accounting and Financial Studies, Volume 11, Number 1 New Orleans, 2006
DO HYBRID INSTRUMENTS LOWER THECOST OF CAPITAL?
Guy Ford, Macquarie [email protected]
Tyrone M Carlin, Macquarie [email protected]
Nigel Finch, Macquarie [email protected]
ABSTRACT
The issue of hybrid instruments by firms is often justified on the grounds that theseinstruments allow issuers to achieve a lower cost of capital than would be the case under issues ofstraight debt and equity. In order to assess the validity of such claims it is necessary to examine theeconomic impact of hybrid instruments on the issuing company. If a firm can genuinely achieve alower cost of capital than would otherwise be the case with the issue of either straight debt orequity, we argue that this is directly linked to regulatory (reporting) arbitrage, rather than theoutcome of financial synergy that arises when debt, equity and option instruments are combined toform a hybrid security. We evaluate the argument that hybrid structures lower the cost of capitalfrom an opportunity cost and risk perspective. We focus our analysis on two main structures:convertible debt and reset preference shares.
INTRODUCTION
It is not uncommon for chief financial officers and investment bankers to justify the issuanceof hybrid securities by companies on the basis that these instruments allow issuers to achieve a lowercost of capital than would be the case under separate issues of straight equity and straight debt. Asa snapshot, consider the following:
“…..hybrid’s flexibility allows issuers to lower the cash cost of debt by introducing exposure to equityupside. A well-structured hybrid may also allow equity to be issued at a premium in the future, therebylowering the cost of equity”1 “In recent times, we have seen the introduction of considerable amounts of hybrid capital ontocompanies’ balance sheets. These issues all have the same aim of reducing the company’s overall costof capital”2
If we take the case of a simple hybrid structure � a convertible bond under which holdershave the right to either convert their notes to ordinary shares at a prespecified date or redeem thenotes at their face value � the basis of such claims is that if the share price of the issuing firm fallsbelow the conversion price, the firm will have sold an overvalued option, while if the price of thefirm rises above the conversion price, the firm will have issued stock at a premium to the price atthe date of issue of the convertible bond. In either case, the firm can achieve a lower cost of capitalthan would have been the case had the firm issued either straight debt or equity � securing debtfinance at a below-market rate should its share price remain stable or fall and securing equityfinance at a price premium should its share price rise.
In order to assess the validity of such claims it is necessary to examine the economic impactof hybrid instruments on the issuing company. If a firm can genuinely achieve a lower cost of capitalthan would otherwise be the case with the issue of either straight debt or equity, we argue that this

page 32 Allied Academies International Conference
New Orleans, 2006 Proceedings of the Academy of Accounting and Financial Studies, Volume 11, Number 1
is directly linked to regulatory arbitrage, rather than the outcome of some mystical alchemy thatarises when debt, equity and option instruments are combined to form a hybrid security. In thisregard, we evaluate the argument that hybrid structures lower the cost of capital from twoperspectives: opportunity cost and risk. Again, we restrict our focus to a convertible bond, given thisinstrument forms the structural foundation of most hybrid instruments.
OPPORTUNITY COST OF HYBRIDS
The fundamental weakness in the argument that hybrids offer a win-win outcome for issuingfirms is that it only compares the performance of the instrument with straight debt when share pricesfall, and only with straight equity when prices rise. To assess the real economic impact of hybridinstruments on the issuing firm it is necessary to incorporate how the instrument compares withstraight equity when share prices fall and straight debt when share prices rise. To do otherwisepresents only a partial and positively-biased assessment of the impact of hybrids on the cost ofcapital for the issuing firm.
Consider a scenario under which a convertible bond is issued at a coupon rate of 10% anda conversion premium of 20%. The share price of the issuing firm at the time the bond is issued (P0)is $10, and the firm can issue senior debt at the same term as the convertible bond at a coupon rateof 15%. Consider first the outcome if the share price of the firm at the conversion date (P1) falls to$5. Those advocating the cost of capital advantages of hybrids point out that given the fall in shareprice the debt will be redeemed, and the firm has secured debt funding at 500 basis points below therate that it would have paid had it issued straight debt. This, however, only compares the convertiblebond to the issue of straight debt, and ignores the fact the firm could have issued straight equity asan alternative to the convertible bond. What of the opportunity cost of issuing the convertible bondrelative to equity?
While it is true that relative to straight debt the firm has achieved a lower cost of capital byissuing the hybrid, compared to equity, the firm has forgone the opportunity to achieve a lower costof equity by issuing equity at the higher P0 price. In this sense, the opportunity gain in terms of alower cost of debt needs to be weighed against the opportunity cost associated with the firm payinga higher cost of equity than might otherwise have been the case. Subject to relativities associatedthe size of the price fall, the premium associated with the conversion option and the impact on thecost of equity associated with changes in leverage, it may be the case that the cost of capital of thefirm may be unchanged, or even higher, in this setting. It is thus a misconception that a firm is betteroff having issued convertible securities should its share price subsequently fall. To add furtherweight to the argument, the firm in question is likely to experience heightened financial pressuresassociated with servicing the convertible bonds to the extent that the fall in share price at P1accurately reflects significantly lower future cash flows than were envisaged at the time the bondswere issued. This in itself may impact negatively on the cost of capital of the firm.
Now consider the outcome if the share price of the firm at the conversion date (P1) insteadrises to $15. Those advocating the cost of capital advantages of hybrids would do so on the basis thatthe rise in share price will lead holders to convert their bonds to ordinary equity, resulting in the firmissuing stock at a price that is 20% above the price P0 prevailing at the time the convertible bondwere issued. This, however, only compares the convertible bond to the issue of straight equity, andignores the fact the firm could have issued straight debt as an alternative to the convertible bond.What of the opportunity cost of issuing the convertible bond relative to straight debt?
While it is true that the firm has sold equity at on the conversion date at a price of $12compared to the share price at issue of $10, it is unrealistic to directly compare a certain share priceof $10 with an uncertain sale of shares at some future date at a price of $12. With respect to straightdebt, the convertible bond issue is expensive because conversion results in equity dilution. If theshare price at conversion exceeds the conversion price, the firm is obligated to issue equity at a

Allied Academies International Conference page 33
Proceedings of the Academy of Accounting and Financial Studies, Volume 11, Number 1 New Orleans, 2006
below market price, exacerbating the dilution impact. In our example, equity worth $15 per shareis issued to convertible bond holders at $12 per share. Taken from another perspective, the firm inthis case has effectively sold an underpriced option on equity to convertible bond holders � althoughthe cost of the convertible bond is lower than the cost of straight debt, the rate on the convertiblebond is not low enough to justify the benefits accruing to convertible bond holders on exercise oftheir options. Thus while there is an opportunity gain to equity related to the conversion premium,this is offset by opportunity costs related to the issue of equity at a below-market price. The firmwould have been better off issuing straight debt because this would obviate the sale of anunderpriced call option to convertible bond holders. Again, it is a misconception that a firm will bebetter off having issued convertible securities should its share price subsequently rise. Theobligation of the firm sell equity to convertible bond holders at a below-market price works to offsetthe lower coupon rate on the convertible bond.
Our analysis suggests that the principle of �no free lunch� extends to hybrid securities. In thecase of the convertible bond, the hybrid confers greater benefits than straight debt and lower benefitsthan straight equity if the firm performs poorly, while the reverse holds if the firm prospers. Inmarkets exhibit some degree of efficiency, there should be little or no direct benefit to the cost ofcapital arising from the issue of a hybrid instrument when straight debt and equity alternatives exist.
Can a better case for issuing hybrids be advanced if markets are not efficient, in the sensethat the share price of a firm is underpriced or overpriced from the perspective of better-informedinsiders? If insiders perceive the share price of firm to be significantly overvalued, such that bondredemption is highly probable, then the issue of convertible bonds might be justified on the basisof securing low cost debt. If this were the case, however, it may be more efficient for the firm toissue straight equity at the inflated price. Conversely, if insiders believe the share price of the firmto be significantly undervalued, such that bond conversion is highly probable, then the issue ofconvertible bonds might be justified on the basis of deferring the issue of stock until the price hasrisen. If this were the case, however, a similar outcome could be achieved by issuing straight debtin the current period and subsequently issuing equity at the expected higher price at the time of thematurity of the debt, using the proceeds of the equity issue to payout the debt. Again, hybrids appearto provide no significant cost of capital advantage over the use of straight debt and/or equity.
RESET PREFERENCE SHARES
Reset preference shares are a recent hybrid structure that are considered in some circles toimpact positively on the cost of capital of issuing firms by reason of (1) the substantial power theyplace in the hand of issuers to influence outcomes in their favour, and (2) the ability to use frankingcredits to pay dividends. Reset preference shares allow the issuer to reset the terms of the instrumentas permitted by prospectus on each reset date. The issuer can make changes to factors such as thedistribution rate, the term to next reset, conversion ratios and conversion discounts. The holder mayeither accept or reject the new terms - if accepted, the instrument rolls over until the next reset date,while if rejected, typically, the issuer can choose to convert the securities into ordinary equity orredeem the securities for cash.
It is apparent that the reset preference share confers considerable power to the issuing firm� in essence the issuer has full control of any decision to convert or redeem the securities at resetdates, and by controlling the new terms of the security at reset date, the issuer is positioned toinfluence the decision of investors to accept or reject the new terms. The ability to influence theoutcome at reset dates confers significant benefits to the issuing firm, which in turn, may positivelyimpact on the cost of capital of the firm. However if all the benefits appear to accrue to the issuer,surely investors factor this into the price and expected yield on reset preference shares? If this is thecase, the expected higher yield may work to offset some or all of the benefits associated withfunding flexibility that accrue to the issuing firm under this instrument.

page 34 Allied Academies International Conference
New Orleans, 2006 Proceedings of the Academy of Accounting and Financial Studies, Volume 11, Number 1
Two arguments might be put forward to suggest that this is not the case. First, in theAustralian setting, a large proportion of the holders of reset preference shares have been retailinvestors. The complicated nature of these instruments, combined with the lower financialsophistication of this segment, may result in issuing firms achieving better prices on reset preferenceshares than would be the case if investors were better able to assess and price risk into theinstruments. Second, until recently, the ability of issuing firms to recognise these instruments asequity on their balance sheets enabled firms to use franking credits to pay dividends to holders,increasing the after-tax yield for investors. It could be argued that the ability to gross-up yields toreflect the tax benefits of franking credits may compensate investors for the power vested in thehands of issuers at reset dates.
The argument that the payment of franking credits to investors acts to reduce the cost ofcapital of the firm is, however, not clearcut. The basis of the argument is that faced with twocompanies of identical systematic risk, one of which pays fully-franked dividends and one whichdoes not, equity investors will accept a lower rate of return on the firm which pays the fully-frankeddividends because the imputation credits can be used to offset their personal tax liability. While thisis plausible, dividend imputation has had a negligible impact on the after-tax cost of capital ofAustralian firms. Specifically, the value of franking credits is dependent on the tax position ofindividual shareholders. Foreign investors (who comprise approximately one-third of investors inthe Australian market) cannot make use of franking credits. Further, the unrestricted flow ofinternational capital into and out of the Australian market, combined with its low proportion ofglobal share market capitalisation, implies the cost of capital for Australian issuers is largely setinternationally. Lonergan (2003) cites evidence that the majority of independent expert reports(94%) do not make any adjustment to the cost of capital for dividend imputation, and of those thatdo the majority attribute little or zero net effect on the value of the company being assessed.
Evidence that regulatory arbitrage, rather than sustainable cost of capital advantages, hasbeen a major driver of the decision for Australian firms to issue reset preference shares isdemonstrated in the increasing number of issuers who have redeemed their securities or allowedthem to convert since the January 2005 introduction International Accounting Standards (IAS32)which reclassify most reset preference shares as debt rather than equity. It is somewhat ironic thatreset preference shares which were issued for �capital management purposes� are now beingredeemed, converted or restructured for �capital management purposes�.
CONCLUSION
It is concluded that convertible bonds represent neither low-cost debt nor the deferred saleof equity at an attractive price, and as such, should provide no tangible benefits in terms of theoverall cost of capital of the issuing firm. The real cost of convertible bonds is significantly higherthan the coupon rate on the bonds, and potentially higher than the cost of straight debt. Specifically,the cost of capital for convertible bonds should incorporate the implicit opportunity costs associatedwith the conversion rights attached to the instrument. This suggest that favourable accountingtreatment � regulatory arbitrage � whereby these instruments are classified as equity on the balancesheets of issuing firms rather than debt, as being one of the major drivers for the issuance of theseinstruments. This classification increases the debt capacity of firms, such that reported leverage mayunderstate the true leverage of these firms. In the case of reset preference shares, the increase in thenumber of issuers who have redeemed their securities or allowed them to convert since the January2005 introduction International Accounting Standards (IAS32) - which reclassify most resetpreference shares as debt rather than equity � supports the argument that regulatory arbitrage hasbeen a major factor in the issue of these instruments.

Allied Academies International Conference page 35
Proceedings of the Academy of Accounting and Financial Studies, Volume 11, Number 1 New Orleans, 2006
REFERENCES
Brennan, M. and Schwartz, E. (1988), �The Case for Convertibles�, Journal of Applied Corporate Finance, 2, 55-64.
Copeland, T., Weston, J., and Shastri, K., (2005), Financial Theory and Corporate Policy, 4th edition, Pearson AddisonWesley.
Lonergan, W., (2003), The Valuation of Businesses, Shares and Other Equity, 4th edition, Allen and Unwin, Melbourne.
ENDNOTES
1. Andrew Waddell, National Australia Bank, as quoted in CFO, Boardroom Briefing Supplement, May 2004, p.5.2. Pittaway, N. (2001), �Enhancing Shareholder Value Through Capital Risk Management � An Investor�s Perspective�,Conference Proceedings, Aon Re Australia Limited, p.139

page 36 Allied Academies International Conference
New Orleans, 2006 Proceedings of the Academy of Accounting and Financial Studies, Volume 11, Number 1
Allied Academies International Conference page 37
Proceedings of the Academy of Accounting and Financial Studies, Volume 11, Number 1 New Orleans, 2006
THE CHANGING RELATIONSHIPS BETWEEN GOLD,OIL, AND STOCK PRICES
Ronald C. Kettering, Columbus State [email protected]
ABSTRACT
Investors have historically been advised to include gold in their portfolios to combat possiblelosses that occur during periods of inflation, economic chaos, social unrest, and war. Even thoughtimes have changed and there are many other asset selections today that might provide so-calledportfolio risk insurance, many investors prefer to still use gold in either direct or indirect forms.Oil, in either direct or indirect forms, is another asset that is now mentioned by many analysts asan alternative candidate for portfolio inclusion as a form of risk insurance in the 2000's oil-troubledtimes. Consequently, both gold and oil intuitively would be expected to have an inverse relationshipwith stock market movements if either were to be a suitable risk deterrent. Using the same logic,gold and oil should have a close positive relationship. The data from this study demonstrateschanging relationships between gold, oil, and stock price movements in today's economy.
INTRODUCTION
Economic theory has historically demonstrated an inverse relationship between gold pricesand stock prices. This circumstance has been typically attributed with such events as inflation,economic chaos, social unrest, and even war. During most prior crises, gold prices soared as stockprices tumbled. Gold mining stocks often fared even better than direct gold investment as risinggold prices turned many unprofitable or marginally profitable gold mines into moneymakers.Financial advisors were often quick to advise investors to maintain a position in gold during tryingtimes.
Over the 1990s, gold prices remained depressed as inflation and economic or other types ofunrest were nonexistent or minimal. Although there was political uncertainty in various parts of theworld, the degree of unrest evidently was not enough to affect the price of gold. Some researchersat this time, such as (Phillips & Ewing, 1999), suggested that gold had forever lost its luster. Otherresearchers, such as (Clements, 1998), hailed its benefits.
The 2000s, however, brought chaos, social unrest, and even war. Even though investorstoday have a better selection of assets to hold during times of uncertainty, some still prefer to usegold in either direct or indirect forms to provide portfolio risk insurance. Others appear to preferalternate dollar-denominated financial assets, such as oil investments, especially with the situationin the mid-eastern oil-producing nations.
The objective of this paper is to investigate and analyze the use of gold and oil as portfoliorisk averters over various time periods. Brief reviews of the history of gold and oil prices will befollowed by an analysis of the relationships between gold, oil, and stock prices.
GOLD AND OIL PRICE HISTORY
Both oil and gold prices have a long and interesting past. Gold prices remained fairly stableas a store of value for many years that included such crises as world wars, conflicts, and presidentialassassinations. The price of gold began to change in 1971, however, when the United Statesabandoned its policy of buying or selling gold to approved central banks at a fixed price of $35 anounce. This decision demonetized gold, and what was once the bedrock of the global financial

page 38 Allied Academies International Conference
New Orleans, 2006 Proceedings of the Academy of Accounting and Financial Studies, Volume 11, Number 1
system became just another asset in the world of commodities. Gold prices increased from 1971 to1975 before declining. Prices reversed again in late 1976 and reached all-time highs in 1980 withaverage monthly prices in the high $600 range. Since 1980, there has been a decline in prices to thehigh $200 range in the late 1990s. The average price of gold went above $300 in 2002, above $400in late 2003, and recently above $500 in late 2005.
Oil prices have fluctuated randomly for well over a century. Whenever oil prices becameunstable, new energy strategies were often suggested or triggered. Presidents Nixon and Fordsought to reduce the United States' dependence on imports by stimulating domestic energy supplies.President Carter promoted various programs including the introduction of synthetic fuels. Oil andgas prices were also deregulated during his tenure. When the Shah of Iran fell, the upward pricespike of oil stimulated a nationwide drive for greater energy efficiency. The next eight years boredramatic results as domestic oil productivity soared and this demonstrated that the United Statescould exercise more market power than suppliers. Unfortunately, we have not continued ourconservation push as the record-high price of oil today indicates.
METHODOLOGY
Average monthly prices for gold (London fix, US dollar per troy ounce) and oil (West Texasintermediate spot price USD/bbl.) were downloaded from the Financial Forecast Center(www.forecasts.org) for the 30-year period, 1976-2005. Average monthly averages for the DowJones Industrial Average Stock Index was also downloaded for the same time period.
In an effort to investigate the past and current relationships between gold, oil, and the DJIA,the 30 years of data were analyzed with simple correlation coefficients using ten shorter periods thatranged from 1 year to all 30 years. Correlation coefficients were computed between gold and theDJIA; oil and the DJIA; and gold and oil prices.
ANALYSIS
Table 1 shows the relationships between gold prices and the DJIA for the ten definedperiods. Economic theory suggests an inverse relationship between gold prices and the DJIA.
Table 1 Gold Prices and the DJIA Correlation Coefficients
Years Time Period Correlation Coefficient
1 2005-2005 .420
2 2004-2005 .257
3 2003-2005 .813
4 2002-2005 .651
5 2001-2005 .315
10 1996-2005 -.149
15 1991-2005 -.288
20 1986-2005 -.469

Allied Academies International Conference page 39
Proceedings of the Academy of Accounting and Financial Studies, Volume 11, Number 1 New Orleans, 2006
25 1981-2005 -.445
30 1976-2005 -.070
The five time periods from 10 years to 30 years demonstrate the expected inverse relationship. Themost current 5-year, 4-year, 3-year, 2-year, and 1-year observations all exhibit positive relationships.The 3-year period has a very high coefficient of .813.
Table 2 shows the relationships between oil prices and the DJIA for the ten periods.Economic theory suggests an inverse relationship between oil prices and the DJIA if oil might beconsidered in the same risk insurance vein as gold, as some advisors adhere.
Table 2 Oil Prices and the DJIA Correlation Coefficients
Years Time Period Correlation Coefficient
1 2005-2005 .061
2 2004-2005 .255
3 2003-2005 -.799
4 2002-2005 .563
5 2001-2005 .419
10 1996-2005 .427
15 1991-2005 .529
20 1986-2005 .565
25 1981-2005 .266
30 1976-2005 .298
All time periods, except the 3-year 2003-2005 period, exhibit positive relationships. These positiverelationships suggest that perhaps oil has never been a possible portfolio risk friend. The oneinverse relationship period did show a significant relationship.
Table 3 shows the relationships between gold prices and oil prices for the ten periods aspreviously described. Economic theory would suggest a strong positive relationship between goldprices and oil prices if oil might work as a substitute for gold as portfolio insurance.
Table 3 Gold Prices and Oil Prices Correlation Coefficients
Years Time Period Correlation Coefficient
1 2005-2005 .529
2 2004-2005 .729
3 2003-2005 .839
4 2002-2005 .887

page 40 Allied Academies International Conference
New Orleans, 2006 Proceedings of the Academy of Accounting and Financial Studies, Volume 11, Number 1
5 2001-2005 .866
10 1996-2005 .706
15 1991-2005 .478
20 1986-2005 .239
25 1981-2005 .302
30 1976-2005 .506
All ten observation periods of Table 3 exhibit positive relationships. Most of the current periodsshow very high correlation. The longer time periods show lesser relationships, although all arepositive.
CONCLUSION
The study was very interesting. Today's economy, at least the last five years, does notsupport the historic adage that there is an inverse relationship between gold and stock prices. In fact,these last five years of positive relationships suggest that perhaps gold has indeed lost its luster ofproviding portfolio risk insurance benefits. Oil investments don't appear to provide inverse portfolioadvantages either, as various analysts suggest. On the other hand, there is a strong currentrelationship between gold and oil prices. Perhaps times really have changed or else both gold andoil are facing supply/demand factors just like any other asset.
REFERENCES
J. Clements (1998, July 7). Gold is a poor long-term investment, but still has a shine in rough times, The Wall StreetJournal, c1.
M. Phillips & T. Ewing (1999, February 2). Gold loses its luster as an asset, The Wall Street Journal, c1.

Allied Academies International Conference page 41
Proceedings of the Academy of Accounting and Financial Studies, Volume 11, Number 1 New Orleans, 2006
NEW DEVELOPMENTS IN INNOCENT SPOUSE RULESJohn Leavins, University of St. Thomas
[email protected] Wadhwa, University of Houston-Downtown
[email protected] Smith, Universty of Houston-Downtown
ABSTRACT
Both spouses are usually liable for taxes owed to the IRS on a joint tax return. However, the“innocent spouse doctrine” offers relief to a spouse when it would be inequitable to hold that spouseliable for taxes created by the other spouse. The innocent spouse laws have go through numerouschanges over the years and Congress made a major revision to the law in 1998. The revised lawmade it easier to obtain innocent spouse relief when inequitable situations arose. This articleexplains the innocent spouse rules and discusses the implications of Code Section 6015. The articlethen summarizes new developments in the innocent spouse rules with particular emphasis on arecent Tax Court decision that dealt with the innocent spouses rules in community property states.

page 42 Allied Academies International Conference
New Orleans, 2006 Proceedings of the Academy of Accounting and Financial Studies, Volume 11, Number 1
Allied Academies International Conference page 43
Proceedings of the Academy of Accounting and Financial Studies, Volume 11, Number 1 New Orleans, 2006
BOARD SIZE AND FIRM PERFORMANCE: THE CASE OF SMALL FIRMS
Sharon K. Lee, Western New England [email protected]
Greg Filbeck, University of [email protected]
ABSTRACT
Existing literature discusses the inefficiencies in the monitoring role of the board of directorswhen the membership is too large. Several studies have found an inverse relationship betweenboard size and firm performance in large firms. Given the nature of small firms, this relationshipmay not be present. This relationship had not been tested in small U. S. firms. We also find aninverse relationship between board size and firm performance in small firms.
INTRODUCTION
In the aftermath of Enron Corporation�s collapse, the board of directors and the role playedby its members have come under great scrutiny, bringing on the Sarbanes-Oxley Act of 2002, andalso proposals by the New York Stock Exchange (NYSE). Reforms suggested by the Sarbanes-Oxley Act are still in the process of being formally translated into rules by the Securities andExchange Commission (SEC).
With the increase in the perceived risk and responsibilities of serving on a corporate board,there appears to be a decrease in the sizes of boards. Several studies have examined the relationshipbetween the size of the board of directors, and firm value and performance [Bhagat and Black (1996;Yermack (1996); Eisenberg et al. (1998)]. Is board size an important determinant of the board�squality of monitoring and decision-making? If so, what is the effect of these inefficiencies on theprofitability and value of the firm? Yermack (1996) and Eisenberg et al.(1998) both conclude thatthere exists an inverse relationship between board size and firm value. In a discussion on corporategovernance, Lipton and Lorsch (1992) state that larger groups or boards, are less efficient, in thatindividuals are apt to be less open in corporate policy discussions. People tend to be more reservedand polite in larger groups. This type of behavior by board members reduces the effectiveness oftheir monitoring role of management. Jensen (1993) agrees with this point, �when boards getbeyond seven or eight people they are less likely to function effectively and are easier for the CEOto control.� As pointed out by Monks and Minow (1995), in many corporate restructurings (aftersuccessful tender offers), the boards of directors were reduced in number.
Yermack (1996), using a sample of large firms taken from Forbes magazine�s rankings ofthe 500 largest U.S. public corporations between 1984 and 1991, finds an inverse relation betweenfirm value and the size of the board of directors. Most all of the boards in his sample had betweensix and 24 members on the board. The mean number of directors on any one board was 12 in hissample. The largest loss in firm value appeared to be when there were changes in the board betweensix and 12 members. This change in value was approximately equal to that when boards increasedfrom 12 to 24 members. Yermack�s findings hold when controls for variables such as company sizeand board stock ownership were made. The examination of valuation effects of significant changesin board size would provide more evidence on the relationship between board size and firmvaluation and performance. Yermack examines abnormal stock returns of six firms thatsignificantly decreased board size and four firms that significantly increased board size, and
page 44 Allied Academies International Conference
New Orleans, 2006 Proceedings of the Academy of Accounting and Financial Studies, Volume 11, Number 1
concludes that investors react positively to decreases in board size, and negatively to increases inboard size.
In a similar examination, except for size and home country of the sample firms, Eisenberget. al. studies the board-size effect in a sample of 879 Finnish firms. Their sample consisted of meanand median board sizes of three and four members, respectively. These sample firms had mean andmedian assets of about $800,000 and $7 million, respectively. Controlling for variables such asindustry, age of firm, and board stock ownership, they find that board size is inversely related to thefirm�s performance, as measured by an industry-adjusted return on assets. Eisenberg et. al. state thatsmall firms may �lack the same degree of separation of ownership and management that play acentral role� in the explanations of the effect. However, their findings are consistent with Yermack(1996), of an inverse correlation between board size and firm performance.
This study is unique from existing studies in several ways: 1) the effect of board size onfirm profitability is tested, using small U.S. firms, unlike Eisenberg et al. (1998) that uses smallFinnish firms, and 2) the sample includes the financial data from 10-K reports filed either in March2000, or June 2000. Gilson and Roe (1993) and Roe (1994) point out that the extent of the board�srole in the monitoring of management varies by country. The hypothesis that large boards areineffective in their monitoring role due to communication and control difficulties, has not beentested fully on small U.S. firms. The nature of the agency relationships present in small firms canbe very different in that managers may have strong, vested interests, both financial and emotional,in the performance of the firm. This examination of small firms provides further evidence on thisagency-related issue, by comparing the possible relation between board size and firm value andprofitability in more recent samples of small U.S. firms vs. large U.S. firms.
DATA AND METHODOLOGY
The sample in our study includes a random sample of firms on the Compustat data tapes thatmatch our criterion as a �small firm�. Firm size is identified by total assets in the year board sizeis identified. Yermack (1996), with a sample of large firms, finds similar results using either totalassets or net sales as a measure of firm size. Firms on the tape were identified as �small� firms iftotal assets were less than $18 million. This criterion for the small vs. large firm identification stemsfrom the New York Stock Exchange listing requirement. The Compustat financial tape, along with10-K reports, found on the Securities and Exchange Commission�s (SEC) internet Edgarbase, isused to gather profitability measures, total assets, industry averages and board size data. As notedin both Eisenberg et. al (1998) and Yermack (1996), the results of their tests using firm profitabilitywere the same as those using market-based firm valuation data as the dependent variable.
A total of 2,078 firms met the criterion as a �small firm� on the Compustat tape. Our finalsample resulted in 1,013 firms that had met the �small firm� criterion and had recent board dataavailable on their 10-K report on the SEC Edgarbase. The average total assets of the sample firmswas $7.6 million. Board sizes in the sample firms ranged from 18 members down to one member,with the average being five members. We see that nearly 24% of the sample firms are in theBusiness Equipment industry, following by 88 firms, or 9% from the Drug industry. Over 40% ofthe sample firms fell into miscellaneous industries.
A regression analysis is used to test the relation between board size and firm profitabilityamong these �small firms�. Return on Assets, adjusted by industry, and as used in Eisenberg et. al,is used as the profitability measure. The return on assets measure (ROA) is adjusted by industry,by taking the difference between the firm ROA and the industry ROA, or ∆ROA. Our model willcontrol for firm size (the log of total assets), and industry (two-digit SIC industry dummy variables).
For the sample group, a significant inverse relation between board size and firm value couldimply that inefficiencies in communication and monitoring of a large board of directors negativelyeffects firm performance. We regress the variable ∆ROA against the board-size log, control variable
Allied Academies International Conference page 45
Proceedings of the Academy of Accounting and Financial Studies, Volume 11, Number 1 New Orleans, 2006
for industry and firm size. We expect to find negative and significant relations between the financialperformance measures and the board-size log.
RESULTS
Our findings appear to support the negative relationship between board size and firmprofitability found by Yermack who used a sample of large U.S. firms. We find that the ordinaryleast squares regression of ∆ROA on the log of board size and the log of total assets is significant. Further, the coefficient for board size is negative, and the coefficient for total assets is positive.This implies that a large number of directors on a board may harm profitability and firm value.Also, it appears that the larger the firm, the more profitable the firm.
We separated the sample by industry and ran the OLS regression. The results were notsignificantly different from the entire sample. There are a total of nine (9) firms with ROA�s below-1,000%, or above +1,000%. The minimum ROA was -2,177.9% and the maximum +1,573.14%.We ran the regression, omitting these possible outliers, and had similar results. In addition, itappears that the larger the firm, the more profitable the firm. The results of a regression using anROA variable (unadjusted for industry), gave similar, but more significantly negative results, inrelation to board size. It appears that the board-size effect may be due to the inefficiencies incommunication and coordination of large groups, which then leads to possible greater control by theCEO.
This study adds further evidence on this agency-related issue, examining small U.S. firms,which has not been done. This issue of an appropriate size for a board of directors is a very timelyand important one, since the effectiveness of boards is being questioned and examined in thecorporate world. With the added requirements of the Sarbanes-Oxley Act, including boardindependence, it would be beneficial for shareholders to learn of the potential positive effects of anoptimal board size.
REFERENCES
Anonymous, 2003, �Special Report: The Way We Govern Now � Corporate Boards� January 11, The Economisthttp://0-proquest.umi.comwildpac.wnec.edu/
Bhagat, S., and Black, B., 1999, �The Uncertain Relationship Between Board Composition and Firm Performance�Business Lawyer, 54, 921-963.
Eisenberg, T., Sundgren, S., and Wells, M., 1998, �Larger Board Size and Decreasing Firm Value in Small Firms,�Journal of Financial Economics 48, 35-54.
Gilson, R., and Roe, M., 1993 �Understanding the Japanese Keiretsu; Overlaps Between Corporate Governance andIndustrial Organization,� Yale Law Review 102, 871-906.
Hermalin, B., and Weisbach, M., 1988, �The Determinants of Board Composition,� Rand Journal of Economics 19, 589-606.
Hermalin, B., and Weisback, M., 1991, �The Effect of Board Composition and Direct Incentives on Firm Performance,�Financial Management 20, 101 �112.
Hermalin, B., and Weisback, M., 2002, �Boards of Directors as an Endogenously Determined Institution: A Survey ofthe Economic Literature,� Economic Policy Review, 9, 7 � 26.
Jensen, M., 1993, �The Modern Industrial Revolution, Exit, and the Failure of Internal Control Systems,� Journal ofFinance 48, 831-880.

page 46 Allied Academies International Conference
New Orleans, 2006 Proceedings of the Academy of Accounting and Financial Studies, Volume 11, Number 1
Kini, O., Kracaw, W., and Mian, S., 1995, �Corporate Takeovers, Firm Performance, And Board Composition,� Journalof Corporate Finance 1, 383-412.
Lipton, M., and Lorsch, J., 1992, �A Modest Proposal for Improved Corporate Gover- Nance,� Business Lawyer 48, 59-77.
Monks, R., and Minow, N., 1995, Corporate Governance, Basil Blackwell, Cambridge.
Morck, R., Schleifer, A., and Vishny, R., 1988, �Management Ownership and Market Valuation: An EmpiricalAnalysis,� Journal of Financial Economics 20, 293-315.
Roe, M., 1994, Strong Managers, Weak Owners: The Political Roots of American Corporate Finance, PrincetonUniversity Press, Princeton, NJ.
Stock, Howard, 2003, �New Rules May Scare Off Directors� Investor Relations Business, January 13, http://0-proquest.umi.com.wildpac.wnec.edu/
White, H., 1980 �A Heteroskedasticity-Consistent Covariance matrix Estimator and a Direct Test forHeteroskedasticity,� Econometrica 48, 817-838.
Yermack, D., 1996, �Higher Market Valuation of Companies with a Small Board of Directors,� Journal of FinancialEconomics 40, 185-211.

Allied Academies International Conference page 47
Proceedings of the Academy of Accounting and Financial Studies, Volume 11, Number 1 New Orleans, 2006
TESTS OF TECHNICAL TRADING RULESIN THE ASIAN-PACIFIC EQUITY MARKETS:
A BOOTSTRAP APPROACHCamillo Lento, Lakehead University
ABSTRACT
This study examines the effectiveness of nine technical trading rules in eight Asian-Pacificequity markets for periods ranging from January 1987 to November 2005. The annualized returnsfrom each trading rule are compared to a naive buy-and-hold strategy to determine profitability.The TSEC, Straits Times, Hang Seng, Jakarta, KOSPI and the BSE emerge as equity markets wheretechnical trading rules may be profitable. There is no evidence of profitability for the other twomarkets, the Nikkei and the All Ordinaries. Disregarding statistical significance, the results revealthat 56 out of the 72 (77.8 per cent) trading rule variants tested on all data sets were profitable afteraccounting for transaction costs. The results are important because they provide investors withinformation about the Asian-Pacific equity markets that can be used to determine optimal assetallocations and to further diversify portfolios.
Keywords: Technical Analysis; Market Efficiency; Asian Capital Markets; Stock Returns.
JEL Classification: C15; G11; G14

page 48 Allied Academies International Conference
New Orleans, 2006 Proceedings of the Academy of Accounting and Financial Studies, Volume 11, Number 1

Allied Academies International Conference page 49
Proceedings of the Academy of Accounting and Financial Studies, Volume 11, Number 1 New Orleans, 2006
THE MANY DIMENSIONS OF SOCIALSECURITY REFORM
David E. Letourneau, Winthrop [email protected]
Danny R. Memolo, Winthrop [email protected]
ABSTRACT
There is absolutely no way that our Social Security system can continue on its currentcourse. Everybody knows it. The problem is that every solution has its significant cost.Restructuring SSN is going to cost trillions of dollars. Critics of each plan can decry the tremendouscost that an opponent’s plan entails and thereby greatly undermine support of that plan by all butthe most informed advocates. Another impediment to reaching an accommodation is that to admitthat your plan entails significant cost invites the charge, “Aha, even HE knows that his plan isunworkable.” Therefore, proponents of each plan focus on the great perceived benefits of that plan,but typically incompletely address the plan’s drawbacks.
Clearly, what is needed is a comprehensive and cool-headed analysis of all the plansadvanced. While that would be an investigation of incredible scope, it is possible to begin such aneffort by outlining the general cost/benefit of each type of plan. For instance, one plan suggests thatwe raise the SSN tax on all workers. That would certainly solve the problem, if we raise thecontributions high enough. However, we must appreciate that in about 2027, there will be only twoworkers per retired person, and the average SSN check is just over $1,000 per month. In a staticworld that would mean that every worker would, on average, pay $500 each month into SSN.Alternatively, SSN tax could be raised only on the workers making more than the current maximumSSN taxable wage of $94,200 (for 2006). Representative Spratt of S.C. told an audience in 2005 thatthose higher-income people already receive less per dollar contributed than any other group.Raising their taxes might lead to a revolt by those people that would destroy SSN as we know it.
Various personal investment plans, such as the plan proposed by President Bush, promisegreat benefits to participants. However, the dollars that personal investors withhold from thecurrent SSN system are needed to pay current retirees. Those dollars would have to be replaced bymoney from the general fund through higher taxes or greater debt. So, the beneficiaries of Bush’s“ownership society” would end up not only supporting their own retirement, but in addition wouldmake up the shortages that plan causes current retirees.
Of course, in about 2050 when the current workers employing personal accounts retire, anew generation of workers will be able to invest in their retirement without the burden of supportingthen current retirees. This situation introduces an element of “fairness” between generations. Eachplan needs to be considered with a framework of cost, benefit, fairness, time and social goals beforethe nation can alter the current system.

page 50 Allied Academies International Conference
New Orleans, 2006 Proceedings of the Academy of Accounting and Financial Studies, Volume 11, Number 1
Allied Academies International Conference page 51
Proceedings of the Academy of Accounting and Financial Studies, Volume 11, Number 1 New Orleans, 2006
BEWARE OF PITFALLS WHEN SERVEDWITH IRS LEVIES
Bruce W. McClain, Cleveland State [email protected]
ABSTACT
Internal Revenue Code Section 6332(e) provides protection to those who honor IRS levies,even where it turns out that the levy may have been improper or wrongful. Under the protectionof this Code section, those who turn over property or property rights to the government pursuantto an IRS levy are discharged from any obligation or liability to the delinquent taxpayer or to anyother person related to such rights or property.
Section 6332(e) is one of the more vital cogs in the IRS’ enforcement machine. It greatlyincreases the effectiveness of tax levies by affording strong protection from liability to those personsor entities who honor a tax levy served on them. It does not matter if the levy was untimely,wrongful, or improperly made. Sec. 6332(e) keeps the levy recipient safely out of any fight over thepropriety or the effectiveness of the levy, leaving that argument to be made solely between thetaxpayer and the government.
But how far does this protection go? Does it protect levy recipients in any and allcircumstances? What if, for instance, the levy is erroneously or wrongfully served on a person whodoes not actually possess property of the taxpayer, but who instead possesses property of a relatedtaxpayer.?
This paper gives a short summary of the purpose, use and scope of IRS levies. It thenexplores I.R.C. Section 6332(e) and the level of protection it affords (and fails to afford) to thosewho are served with and honor a tax levy. It gives particular attention to fact situations where levyrecipients have found that 6332(e) failed to protect them in honoring a levy.

page 52 Allied Academies International Conference
New Orleans, 2006 Proceedings of the Academy of Accounting and Financial Studies, Volume 11, Number 1

Allied Academies International Conference page 53
Proceedings of the Academy of Accounting and Financial Studies, Volume 11, Number 1 New Orleans, 2006
THE USEFULNESS OF RATIO ANALYSIS INPREDICTING STOCK MARKET RETURNS
Jonathan E. Miller, Longwood [email protected]
Frank W. Bacon, Longwood [email protected]
BACKGROUND
There is much debate over the ability of firms to earn an above-normal return using eitherrules of investing or ratio analysis. If the capital markets are weak-form efficient then the marketwill already have reacted to the past information embodied in financial ratios. Theoretically, if theaverage investor responds irrationally to past information, arbitrageurs would short those stocksthat are over-priced and buy those that are undervalued pushing over-priced shares down andunder-priced shares up. Therefore, if capital markets are always weak-form efficient, one shouldnot be able to predict return or change in stock price using financial ratios, because the price of astock should already reflect the information in those ratio's. If the stock returns can be predictedusing financial ratios, investors could use that information to make greater profit than the marketas a whole.
RESEARCH PROBLEM
Though some researchers believe that the markets are efficient enough to render ratioanalysis useless, there is some evidence that markets may not always be efficient and that ratio's canhelp predict returns. The set of ratio's that may be useful for this purpose include B/M (book tomarket), P/E (price to earnings), and DY(dividend yield). It would be valuable to any investor todetermine to what extent the market is inefficient and, therefore, whether one can out-think themarket and earn above normal returns. Presumably, if the market is efficient, then, holding growthconstant, neither B/M nor market capitalization should effect the average firm's return over anyperiod. Dividend Yield should have already been incorporated in stock prices after holding growthconstant, therefore, over the time-period of the study, it should not have a statistically significanteffect on return assuming the truth of the EMH.
LITERATURE REVIEW
Previous research shows that there are reputable challenges to weak-form market efficiency.If a stock has high book value to market value (B/M), earnings to price (E/P) or Cash Flow to Price(C/P) it is considered a "value" stock. Value stocks have a higher return than growth stocks over theperiod between 1975 and 1995 all else being equal (Fama and French, 1998). From 1963 to 1975,there was a negative and statistically significant relationship between firm size and returns as well(Reinganum, 1982) after accounting for beta and differences in growth. Other research suggests that"B/M and E/P forecast both equal- and value- weighted NYSE returns over the period 1963-1994"after accounting for serial correlation in returns (Lewellen, 2004).
It is also possible that, assuming one can use ratio's to predict returns over certain period, thisresult does not actually challenge the EMH. There are two possibilities which would allow certainratio's to predict dollar returns, one in which "ratios track time-variation in discount rates"(Lewellen,2004) and another in which unexpected different returns are due "to differences in risk, not to a true
page 54 Allied Academies International Conference
New Orleans, 2006 Proceedings of the Academy of Accounting and Financial Studies, Volume 11, Number 1
inefficiency."(Ross, 2005) If ratios reflect changes in the risk premium or differences in risk thenchanges in those ratios should rationally predict changes in stock prices.
METHODOLOGY
This study uses information on 10059 stocks gathered from http://multexinvestor.com andOLS regression (using data analysis software named Stata). The percentage change in a stocks priceover the past fifty-two weeks was regressed on DY, BM, Beta, Market Capitalization and changein EPS Year over Year. This base regression equation was chosen with the expectation that if capitalmarkets were efficient then DY (not change in DY) should not have a statistically significant effecton the change in stock prices over these fifty-two weeks. After accounting for growth in EPS, DYshould have already been accounted for in past prices and should not then be able to help predictstock price. Likewise, market capitalization should have no clear effect on the change in stockprices after accounting for growth in EPS because changes in EPS should account for any possiblechange in the cash flow that can be distributed to stockholders. Similarly, market to book valueshould also not predict returns for the same reasons.
Only companies whose percentage of insider ownership was less than 10% of the company'smarket capitalization were included in the study due to the limited capacity of Small Stata. Stata waschosen over Microsoft excel due to its ability to check for the Variance Inflation Factor and quicklycreate square and interaction terms (and repeat regressions).
QUANTITATIVE TESTS AND RESULTS
The data does provide some evidence that contradicts EMH. Dividend Yield was useful inpredicting the change in stock price over the fifty-two week period at the 99% confidence level evenafter holding growth in EPS constant. For every 1% difference in dividend yield between companiesone could expect to find a 1.338% drop in the percentage change between stock prices between thebeginning and the end of the 52-week period. This is consistent with the findings of Fama andFrench(1998) who also found that DY could help predict returns from 1976 to 1995.
Dividend Yield may not be the variable driving the difference in price. Interestingly, theabsolute value of its t-statistic falls by half when one includes inside ownership as a variable. Thissuggests that the effect of dividend yield (in other words the failure of the market to account for allpast information) may be partially dependent on the amount of insider ownership, though thispossibility must be accepted with a grain of salt because the interaction term was not significant atthe 95% level. If this were true it would imply that some other variable could be driving both.
Insider ownership was significant, after including an interaction term between beta anddividend yield (which was significant at the 99% confidence level.) The interaction between betaand dividend yield is difficult to interpret but it might imply two things: 1. that value and growthstocks have different risks (causing the effect of dividend yield to be dependent upon beta) or 2. thatthe effect of DY over this range of stocks was dependent upon beta (or something correlated withbeta) for some other reason. The interaction between beta and dividend yield is consistent with theidea that growth and value stocks may have different risks. In other words, people, who are riskaverse wealth maximizers, will feel beta's importance to be related to return. If the difference inreturns that can exist between value and growth stocks is caused by a change in risk then the sizeof beta would change how investors perceive that extra risk factor.
Beta was originally statistically significant at the 1% significance level, however, when theeffect on price changes over the range of stocks caused by DY is modeled using a non- linearrelationship and an interaction term between DY and beta is included, beta becomes insignificant.This suggests that the originally statistically significant effects of beta are not due to its interactionwith the change in stock prices but by how it effects the interaction of DY with stock prices. This

Allied Academies International Conference page 55
Proceedings of the Academy of Accounting and Financial Studies, Volume 11, Number 1 New Orleans, 2006
is also consistent with the idea that growth and value stocks have different risks because the effectof beta is different and depends upon the size of DY.
One might counter that this effect could have been caused by variation in DY that wasinsufficient to cause the change from one stock to another in the interaction term between beta andDY to be statistically different than beta itself. This was not the case as the coefficients of variationfor DY and beta are 84 and 185 respectively. Considering that the variation in DY is greater thanthe variation in beta, the resulting statistical insignificance of beta mentioned above could not havebeen caused by a lack of variation in DY. If this were so, then the variation of DY would have tobe smaller than the variation in beta, unless beta and DY are positively correlated to the extent thatone should drop out. However, if this were so, the inclusion of DY in an equation without modelingfor a non-linear relationship and an interaction between DY and beta should have already shownbeta to be insignificant. That was not the case.
Also very interesting, the t-statistic for Dividend Yield rose when a squared term (thesquared term was also statistically significant at the 1% confidence level) was included and thecoefficient DY jumped significantly from �1.33 to �3. Which is a result that also supports the ideathat there is a non-linear relationship between DY and returns over the period of the study. Also, theadjusted R^2 jumped from .073 to .1136 despite the increased number of variables. The change inEPS and the beta was also significant at the 95% confidence level, however, EPS remainedsignificant even after the addition of the interaction term between dividend yield and beta and theinclusion of the squared term for beta.
Dividend Yield had a relationship with returns characterized by a negative coefficient anda decreasing slope. It is logical that during a period of economic growth, investors might generallyprefer stocks with a lower payout ratio. This does not explain why the effect of a loss in DYdecreases as DY becomes smaller. It is possible that this could be caused by a peculiarity in thepsychology of investors. During a period in which investors prefer lower payout ratios, like a periodof expected growth, investors may become more optimistic regarding the growth of companies thatshow more confidence in their ability to grow. This perceived confidence could be seen to beembodied on lower payout ratio's and therefore, in lower DY.
The regression with no interaction terms or modeling for non-linear relationships. Note thatthe F-statistic shows no likelihood of all coefficients being 0 at the 99% confidence level:
Coef. Std. Err. t P>|t| [95% Conf. Interval]
dyield -1.338333 .16328 -8.20 0.000 -1.658725 -1.017941
mb .0038201 .0039604 0.96 0.335 | -.0039512 .0115914
beta 4.329654 1.511084 2.87 0.004 | 1.36457 7.294739
marketcap 6.41e-06 .00003 0.21 0.831 -.0000525 .0000653
pe .0248424 .0214594 1.16 0.247 -.0172657 .0669505
eps .0018834 .000649 2.90 0.004 .0006099 .0031568
insideown -.4273247 .3025704 -1.41 0.158 -1.021035 .1663861
_cons 11.8426 1.945221 6.09 0.000 8.025641 15.65956

page 56 Allied Academies International Conference
New Orleans, 2006 Proceedings of the Academy of Accounting and Financial Studies, Volume 11, Number 1
Number of obs = 1059F( 7, 1051) = 12.91_ Prob > F = 0.0000 R-squared = 0.0792Adj R-squared = 0.0730
After inclusion of the squared term of DY and the interaction term between DY and beta. Pleasenote that the likelihood of all coefficients being zero falls and R^2 rises:
fiftytwo | Coef. Std. Err. t P>|t| [95% Conf. Interval]
dyield -4.295421 .389413 -11.03 0.000 -5.059539 -3.531304
dyields .077892 .01129 6.90 0.000 .0557384 .1000457
mb .0050101 .0038273 1.31 0.191 -.0025 .0125203
beta 2.364032 1.629741 1.45 0.147 -.8338916 5.561955
marketcap 7.34e-06 .000029 0.25 0.800 -.0000496 .0000642
pe .0258046 .0207268 1.24 0.213 -.0148662 .0664754
eps .0018088 .000627 2.88 0.004 .0005784 .0030392
insideown -.6753589 .2945429 -2.29 0.022 -1.253319 -.097398
idyieldand~b -1.544514 .294803 -5.24 0.000 -2.122984 -.9660429
_cons 23.04078 2.353905 9.79 0.000 18.42188 27.65967
Number of obs = 1059F( 9, 1049) = 19.41Prob > F = 0.0000R-squared = 0.1427Adj R-squared = 0.1354
CONCLUSIONS
Different results of this analysis contradict or are consistent with the idea that an abovenormal return could be made using ratio-analysis and, therefore, contradict or support the existenceof weak-form efficiency. Because DY predicted growth in stock price, ratio-analysis might be usefulin predicting returns over certain periods. If value and growth stocks do indeed have different risks,some of which are independent of beta, ratio analysis is useful for tracking this added risk (ratherthan being useful in finding above average return) even if the EMH is correct in the weak-form. Thepossible usefulness of DY in predicting changes in stock prices seems to conflict with EMH, but ifthis difference is caused by different risks (which differ between value and growth stocks) notmeasured by beta, then the effect of DY could simply be a reflection of this added risk.
The variable EPS accounted for change (or growth) in EPS rather than a stagnant value andit will not be useful for predicting changes in stock price because the amount of growth in EPS thathas not already been predicted by the market should not be predictable to any specific investor
Allied Academies International Conference page 57
Proceedings of the Academy of Accounting and Financial Studies, Volume 11, Number 1 New Orleans, 2006
acting upon the same information. However, future research could be devoted to determiningwhether once could beat the market in predicting that change.
There is also evidence present that supports conclusions, which, while not originally sought,could be very interesting and useful. As the coefficient of insider ownership became significant afteraccounting for the relationship between DY and beta (and DY's non-linear relationship to pricechange) this suggests that under some set of conditions, perhaps the percent of insider ownershipcould predict future returns. This is a conclusion that is difficult to reach with certainty, however,because multexinvestor would have recorded this value at the end of the fifty-two weeks. Thisimplies that causality may run in the other direction.
BIBLIOGRAPHY
Fama, E. & French, K. Value (1998) Value versus Growth: The International Evidence Journal of Finance, 53(6), 1975-1999
Reinganum, M.R. (1982) A direct test of Roll�s Conjecture on the Firms Size Effect The Journal of Finance, 37(1), 27-35.
Lewellen, Jonathan (2004) Predicting Returns with Financial Ratio�s Journal of Financial Economics, (74), 209-235
Ross, Stephen A.(2005), Corporate Finance, ( 7th Edition), McGraw-Hill, Inc. New York, NY.

page 58 Allied Academies International Conference
New Orleans, 2006 Proceedings of the Academy of Accounting and Financial Studies, Volume 11, Number 1

Allied Academies International Conference page 59
Proceedings of the Academy of Accounting and Financial Studies, Volume 11, Number 1 New Orleans, 2006
BUSINESS ENVIRONMENT FRAUD:ACCOUNTING HAPPENINGS
Paula Diane Parker, University of South [email protected]
Martha Lair Sale, Sam Houston State [email protected]
Cathy L. Ussery, Institute of Management Accountants
ABSTRACT
Fraud will never be eliminated, but with a better understanding of how and why fraudoccurs, steps can be taken to prevent or minimize the risk of fraud. The purpose of this research isto provide a better understanding of fraud that can be perpetrated in a business organization. Thisresearch covers some of the more common types of fraud and presents several different examplesof fraud.
Fraud is organized into three broad categories; misappropriation of assets, corruption, andfraudulent financial reporting. Each category is briefly discussed including specific types offraudulent activities. These activities include skimming, expense report abuse, and billing andpayroll schemes. Fraud statistics, including the costs and types of fraud, are shown. There is alsoa section about the most effective methods for uncovering existing fraud.
Two important aspects of preventing and detecting fraud are gaining an understanding ofhow and why it occurs. Therefore, this research is designed to help auditors and members ofmanagement become more aware of the risk of fraud within an organization.
An important part of this research addresses the concerns an auditor has when he or shesuspects fraud during an audit. Included are circumstances that could lead to fraud and indicatorsof fraudulent activities. Finally, this research makes recommendations to improve fraud detectionand prevention. For example, an anonymous hotline for employee whistle blowing is one of the mosteffective methods of fraud detection.

page 60 Allied Academies International Conference
New Orleans, 2006 Proceedings of the Academy of Accounting and Financial Studies, Volume 11, Number 1
Allied Academies International Conference page 61
Proceedings of the Academy of Accounting and Financial Studies, Volume 11, Number 1 New Orleans, 2006
THE IMPACT DETECTION RISK HAS ON TAXCOMPLIANCE: AN ALTERNATIVE VIEW
Paul C. Schauer, Bowling Green State [email protected]
Lawrence Bajor, Bowling Green State University
ABSTRACT
Utilizing the uniqueness of the State of Ohio’s tax reporting requirements, this paper usessurvey data and a within subjects methodology to examine the impact detection risk, both actual andperceived, has on taxpayer compliance. This research design provides the opportunity to evaluatethe impact of detection risk for actual taxpayers facing the detection risk of an actual taxingauthority for two different taxes with significantly different detection risks. The within subjectsmethodology also allows for the isolation of detection risk since all other factors are constant.
Consistent with prior research, our study provides evidence that the detection of taxunderreporting and the associated penalties do affect taxpayer compliance, however, our resultsalso provide evidence that the magnitude of the effect of detection risk may not be great. Alternativefactors are suggested that may have a greater role inducing taxpayer compliance

page 62 Allied Academies International Conference
New Orleans, 2006 Proceedings of the Academy of Accounting and Financial Studies, Volume 11, Number 1

Allied Academies International Conference page 63
Proceedings of the Academy of Accounting and Financial Studies, Volume 11, Number 1 New Orleans, 2006
A SURVEY OF INTERNAL AUDIT DIRECTORS:RESOURCES, PROCESSES, AND SOX COMPLIANCE
W. Robert Smith, University of Southern [email protected]
ABSTRACT
This paper presents results of a 2005 survey of internal audit directors (IADs) at domestictelecommunications organizations. The instrument used to collect data included sections onorganization characteristics, internal audit resources, processes, and SOX compliance. Amongother things, IADs reported that SOX-related costs were a large portion of the total internal auditbudget in 2004, but SOX-related costs were expected to decline in 2005. The number of internalaudit positions was expected to grow substantially in 2005, however. No consensus existed onidentified areas of risk or top audit initiatives. Surprisingly, a large majority of IADs reported thatprocesses had not been re-engineered as a result of SOX, and a smaller majority said that there wasno plan to do extensive re-engineering of processes. The survey resulted in a rich source of datafor examining internal audit effectiveness and efficiency.

page 64 Allied Academies International Conference
New Orleans, 2006 Proceedings of the Academy of Accounting and Financial Studies, Volume 11, Number 1

Allied Academies International Conference page 65
Proceedings of the Academy of Accounting and Financial Studies, Volume 11, Number 1 New Orleans, 2006
MODELING THE IMPACT OF NEWTECHNOLOGIES ON PACE OF PLAY IN GOLF:
SEGWAY GT, RANGE FINDERS, RFID GOLFBALLS, AND LONGER HITTING DRIVERSJimmy D. Speers, Southeastern Oklahoma State University
[email protected] A. Tiger, Southeastern Oklahoma State University
ABSTRACT
A model-based decision support system (DSS) is used to study the impact of new technologieson pace of play on golf courses. The DSS is based on a Microsoft Excel simulation model thataccurately represents the variability and interactions that impact pace of play on a golf course.Research shows the economic benefits of understanding the impact of policy on golf course play,specifically throughput (rounds played) and cycle time (round length). The use of a new mode oftransport, the Segway GT, is compared to traditional two player carts. Results indicate that paceof play is improved and that golf course managers have cost/implementation strategic options thatcould offer advantages in a competitive market. Other technologies that are addressed include theuse of radio frequency identification (RFID) to identify lost golf balls, global positioning systems(GPS) and other range finders to identify target distance, and longer hitting clubs.
INTRODUCTION
Golf courses and country clubs are second only to gambling in the amount of revenueproduced in the amusement, gambling and recreation industries. In 2002 there were 12,189 golfcourses that produced $17.4 billion (US Economic Census, 2002). In 2001 there were 518.1 millionrounds of golf played. Since then the number has declined by 4.5 percent, even though 2004 sawan increase of .7 percent. In the late 90�s, 1800 new courses were built at a rate of over 300 per year.That number has declined to just 150 new courses in 2004 (Kuffman, 2005). With the number ofcourses increasing and the number of rounds played decreasing, the imbalance in supply anddemand has many courses struggling to attract customers. One of the major factors in getting peopleon the golf course is the amount of time it requires to complete a round of golf (cycle time). If cycletime can be reduced, the number of rounds played during a day (throughput) can be increased.
Math-based models have been used to analyze stochastic systems such as manufacturingplants or distribution networks. Recent research demonstrates that math-based models are also beingused to model pace of play on golf courses (Tiger and Salzer, 2004; Tiger, et al, 2003). Asimulation model that accurately quantifies queuing on a course, developed by Tiger, et al (2003)is the basis for this research. In Tiger et al�s (2003) paper, a modeling concept was created thatoffered a simple, yet powerful method for modeling course congestion, specifically, waiting for thegroup immediately in front to move out of the way. The concept is call gate methodology.
Gates are modeling constructs used at different points of a course. The gates indicate at whatpoint on the fairway the players behind would be able to safely hit. The location and frequency ofthe gates vary based on golfer characteristics (short or long hitters); hole length and design.Typically, a par 4 hole typically has one fairway gate and a par 5 hole has two fairway gates. No

page 66 Allied Academies International Conference
New Orleans, 2006 Proceedings of the Academy of Accounting and Financial Studies, Volume 11, Number 1
fairway gate is used on par 3 holes because the players behind must wait until all players leave thegreen to safely hit.
Many queuing statistics are available as model output: feature-specific (tee box, fairway,green, and to next hole) and type (par three, par four, and par five) are the primary outputs.
TECHNOLOGIES
The primary technology of interest in this paper was the use of one-person carts, similar tothe Segway GT, and their impact on pace of play. The Segway Golf Transporter (GT) is a Segwaythat has been fitted with a golf bag carrier, extended life range batteries, enhanced traction tires, anda special software-control key (�Business Outlook,� 2006).
Other technologies that could affect pace of play are RFID golf balls, range finders, andlonger (but not necessarily straighter) golf clubs. Radar Golf Inc. produces a ball, with an RFIDchip imbedded in its core, that they claim performs equal to or better than balls from Titleist,Callaway, Nike and Maxfli (LaPedus, 2005).
Another technology that offers the possibility of increasing pace of play is rangefinders.Knowing the exact distance from the tee box to a bunker or the distance to the green can allow theplayer to make a confident swing.
Global positioning systems provide an accurate measurement from the player�s currentlocation to the green. GPS handheld devices can be carried by the golfer to find distances formhis/her location to any waypoint previously set.
Another alternative for range finding is the handheld laser range finder. The laserrangefinders look like small video cameras and are used like binoculars. These rangefinders sendout a laser beam that bounces off the target. The unit measures the amount of time for the beam tobounce back and calculates the distance. The process takes less than a second. The laserrangefinder works only with line of site, but is more accurate than the GPS system (Gleason, 2005).
DATA COLLECTION
Prior research did not identify rates specific to transport mode. No information existed fordetermining different rates for walkers, two person carts, and one-person carts. Additionally, priorresearch assumed that all rates followed a normal distribution. For this research, new data wascollected to (1) generate transport specific rates and (2) determine different rate shapes andparameters. Data was collected for two different transportation methods - two players in a cart andwith one player in a cart. One player in a cart was assumed equivalent to a Segway GT. Noresearch has been done in this area but the Segway GT will travel at 12.5 m.p.h. and the coursewhere the data was collected for this study has its carts set at the 12 m.p.h. setting. The electric golfcarts have faster settings, 20 m.p.h., but most courses do not use this setting because it is too fast foruneven terrain. A global positioning system (GPS) was used to locate the gates on the course aswaypoints. The GPS recorded the route of the players and the time. The times, locations, andspeeds are viewed with software that shows when the waypoint is reached. The times are used tocalculate the rate on the fairway in yards per minute. Also the time on the tee boxes and greens andthe time to travel to the next hole are recorded. The start and stop times when searching for a lostball were also recorded. The rate distributions all had a positive skewness and a lognormaldistribution was found to be a better fit than a normal distribution. Tee box and green timesfollowed a normal distribution, which were the same results as the prior research.

Allied Academies International Conference page 67
Proceedings of the Academy of Accounting and Financial Studies, Volume 11, Number 1 New Orleans, 2006
SIMULATION EXPERIMENT
An experiment was run comparing two players in a cart with one person in a cart fordifferent tee time intervals (6, 8, 10, 12 and 14 minutes). Smaller intervals put more golfers on thecourse, increasing rounds played (throughput) and increasing round length (cycle time). Eachmode/tee time interval was simulated for 100 busy days. A busy day is defined as a day that enoughplayer demand exists to fill all tee time intervals. On most courses, this occurs during weekends andholidays. The main factor is the weather; however, other factors exist that might increase thenumber of busy days: the quality of the course, the size of the market area, the number of othercourses in the area, etc. Courses in the southern United States could have over 100 busy daysannually due to good weather; however, northern U.S. courses may have less than 50 annually.
EXPERIMENT RESULTS AND ANALYSIS
The use of the Segway GT reduced round length and increased rounds played for all tee timeintervals studied. The reason for this is that with only one player on the vehicle, a more direct routeis taken.
For the golf course used in this study, the optimum tee time interval would be 12 minutes.When tee time intervals are reduced to 10 minutes, no improvement in rounds played exists, butround length continues to increase, as shown in Figures 4 and 5. Service is compromised withoutthe benefit of additional revenue. If the players are given a quicker round of golf, they are morelikely to return, thus creating more business on less busy days, or adding to the number of busy daysfor the course.
CONCLUSION
Anecdotal evidence tells us that these technologies can increase the pace of play: in thisstudy we demonstrated that a math-based model has enabled us to quantify the benefits. Benefitscan vary from course to course due to the location of hazards and bunkers, distance traveled betweenholes, cart path routes, terrain, and green size. This study has shown that improvement alwaysoccurs when using the Segway GT on any golf course. Managers of golf courses are always lookingfor ways to improve pace of play. Reducing the time required to play a round of golf will attractmore golfers to a course. It will also allow more players to play on any given busy day. Thesetechnologies offer managers options that can have a significant impact on revenues. The SegwayGT allows golfers to travel through the course in a more direct route. The use of RFID golf ballswill reduce the amount of time searching for lost balls, many of which are caused by golf clubs thatallow the average players to hit farther but not more accurately. Range finders will reduce theamount of time to determine the yardage to the green or to a hazard. When the correct yardage isknown, a player can select the correct club and be less likely to hit into a hazard. Having the ballin the fairway, instead of the hazard, will also speed up play. Implementing any or all of thesetechnologies will improve pace of play and increase revenues.
REFERENCES
Business Outlook (2006). Golf Business, March, 2006. Retrieved March 7, 2006 fromhttp://www.golfbusiness.com/pageview.asp?doc=1096.
Gleason, D. (2004) Pro Shop Insider, Golf Business December, 2004. Retrieved February 17, 2006, fromhttp://www.golfbusiness.com/pageview.asp?m=12&y=2004&doc=1194

page 68 Allied Academies International Conference
New Orleans, 2006 Proceedings of the Academy of Accounting and Financial Studies, Volume 11, Number 1
Kauffman, S. (2005). State of the industry � Is the wild ride over? Golf Business, March, 2005. Retrieved February 17,2006 from http://www.golfbusiness.com/pageview.asp?m=3&y=2005&doc=1241.
LePedus, M. (2005). Radar Golf Claims Breakthrough With RFID Golf Balls, Information Week, January 25, 2005.R e t r i e v e d F e b r u a r y 2 0 , 2 0 0 6 f r o mhttp://www.informationweek.com/story/showArticle.jhtml?articleID=57703713.
Tiger A. and Salzer D. (2004) Improving Golf Course Throughput by Restricting Early Tee Times to Faster Golfers,Academy of Information and Management Science Journal, 7(1), 115-126.
Tiger A. and Salzer D. (2004) Daily Play at a Golf Course: Using Spreadsheet Simulation to Identify SystemC o n s t r a i n t s , I N F O R M S T r a n s a c t i o n s o n E d u c a t i o n , 4 ( 2 ) ,http://ite.pubs.informs.org/Vol4No2/TigerSalzer/index.php
Tiger, A.; Speers, J., Simpson C., & Salzer, D. (2003) "Using simulation modeling to develop a golf course flow DSS",Issues in Information Systems, Volume IV (2), 2003.
US Economic Census (2002), Amusement, Gambling, and Recreation Industries: 2002, Washington, DC: U. S.Department of Commerce, Economics and Statistics Administration.
Average Round Length vs. Tee Time Interval
180220260300340380420
6 8 10 12 14
Tee Time Interval (minutes)
Roun
d Le
ngth
(min
utes
)
Segway GTCart
Figure 1
Average Daily Rounds vs. Tee Time Interval
60708090
100110120
6 8 10 12 14
Tee Time Interval (minutes)
Roun
d Le
ngth
(min
utes
)
Segway GTCart
Figure 2

Allied Academies International Conference page 69
Proceedings of the Academy of Accounting and Financial Studies, Volume 11, Number 1 New Orleans, 2006
THE USEFULNESS OF COST ALLOCATIONS:AN EXPERIMENTAL INVESTIGATION
Martha J. Turner, Tiffin [email protected]
Alan T. Lord, Bowling Green State [email protected]
ABSTRACT
This paper reports the effects of service department cost allocation schemes on demands forservice by divisional managers. Cost allocations have been suggested to be useful in specificmanagerial settings (Thomas 1980). Zimmerman (1979) suggested that if allocation methods thatinclude the costs of externalities (e.g., delays, degraded service) were developed, they shouldencourage decisions that are more behaviorally congruent than decisions made with methods thatdo not incorporate externality costs.
The general experimental setting in this research consists of a decentralized firm with twomanufacturing divisions and a centrally run service department. The role of the division manageris to demand maintenance, knowing the specific benefits the maintenance will have on divisionalprofits, but only the allocation method used to charge for the cost of the service provided. Eachdivision receives all service demanded. A marginally increasing cost function for maintenance anddecreasing marginal benefits for additional units of maintenance are used to discourage excessivedemands by the managers.
Five allocation methods are used in this study along with a control group that makes thesame decision - how much maintenance to demand - with no costs allocated to the division. Averageactual cost and an ad hoc method based on average actual cost are used to test Zimmerman's ideas.The other methods are a fixed (predetermined) rate, marginal cost, and a Shapley value-typeallocation. All allocation methods yielded average demand levels that were significantly differentfrom amounts demanded when no allocation of costs was made. However, the ad hoc method, whichincluded a type of externality cost, did not cause demand levels to be closer to amounts that werebetter for the firm as a whole than a method not including the externality cost. Other comparisonsshowed that the amounts demanded for each allocation method were significantly different fromboth the firm-wide and divisional optimal levels.
Key Words: Cost allocations; service departments; externalities.

page 70 Allied Academies International Conference
New Orleans, 2006 Proceedings of the Academy of Accounting and Financial Studies, Volume 11, Number 1

Allied Academies International Conference page 71
Proceedings of the Academy of Accounting and Financial Studies, Volume 11, Number 1 New Orleans, 2006
CPA FIRMS OFFERING OF FORENSIC SERVICESSURPRISINGLY CONSISTENT OVER TIME:ARE CPA'S MISSING OUT ON A FORENSIC
ACCOUNTING GOLD RUSH?Michael Watters, Henderson State University
K. Michael Casey, University of Central ArkansasJoseph Humphrey, Texas State University
Gary Linn, American University [email protected]
ABSTRACT
This paper presents data generally indicating that, over the seven-year period 1998 through2004, Certified Public Accountant (CPA) firms' offering of forensic accounting services didn'tchange very much at all. While a few fluctuations (up and down) of the percentages of firmsoffering forensic services between years were noted, overall it appears that (1) about the samepercentage of CPA firms offered such services in 2004 compared with 1998 and (2) no meaningfulchanges have occurred during the seven-year period in the types of firms offering such services, forexample, in 2004, as in 1998, only around 10 percent of the smallest CPA firms offered forensicservices compared with around 42 percent of the largest CPA firms. The apparent lack of growthin forensic services provided by CPA firms is quite surprising considering that demand for suchservices has likely increased in recent years. Possible implications: If there really is more forensicbusiness out there now than a few years ago, then it appears, based on the survey data, thatprofessionals other that CPAs are capturing much or most of the new business. If this is the case,perhaps it is because many CPA's don't find such work profitable; or, perhaps many CPAs do notseek such work because of inadequate training/education in forensic techniques; or, perhaps,"forensic specialists" are sought after by the market to a greater extent than 'traditional' CPA's thatoffer forensic accounting as one of many public accounting services. This paper presents the resultsof national surveys of CPA firms over a seven year period indicating the extent to which such firmsoffer forensic services and also discusses several possible implications of the data.

page 72 Allied Academies International Conference
New Orleans, 2006 Proceedings of the Academy of Accounting and Financial Studies, Volume 11, Number 1

Allied Academies International Conference page 73
Proceedings of the Academy of Accounting and Financial Studies, Volume 11, Number 1 New Orleans, 2006
SMALL FIRMS AND SARBANES-OXLEY:WHAT ARE THE COSTS OF COMPLIANCE?
Thomas E. Wilson, Jr., University of Louisiana at Lafayette [email protected]
ABSTRACT
Since its enactment in 2002, a recurring theme in the discussion of the Sarbanes-Oxley Acthas been how costly compliance with its provisions has been and how heavily those costs fall onsmall firms. Many estimates of the costs of Sarbanes-Oxley have relied on self-reported survey dataor have not focused on smaller companies. This study provides direct insight into the issue byfocusing exclusively on small companies and examining their filings with the Securities andExchange Commission (SEC) regarding the costs of compliance with Sarbanes-Oxley. Althoughnot uniform across all small firms, the results indicate that the Sarbanes-Oxley is imposingsignificant costs on many smaller companies.

page 74 Allied Academies International Conference
New Orleans, 2006 Proceedings of the Academy of Accounting and Financial Studies, Volume 11, Number 1
Allied Academies International Conference page 75
Proceedings of the Academy of Accounting and Financial Studies, Volume 11, Number 1 New Orleans, 2006
DEVELOPING AN EFFECTIVE CORPORATE POLICYFOR EMPLOYEE INTERNET AND EMAIL USE
David W. Arnesen, Seattle [email protected]
ABSTRACT
This paper provides the necessary organizational steps to develop an effective employeeInternet and email policy. First, we examine the growth in personal use of the Internet and emailin the workplace. Second, we will explain the potential liability of both the employee and employer.Third, we will discuss whether employer monitoring of employee Internet and email use is effective.Forth, we will examine the need to develop an organizational culture of responsible employeeInternet and email use. Finally, we will look at the required elements of an effective Internet andemail corporate policy.
Recent surveys have shown that most employees use their work email for personal use. Inaddition, over a third of workers admit that they regularly surf the Internet while at work. Theproblem of improper Internet use exposes both the employer and employee to significant liability.Developing an organizational culture that supports responsible Internet and email use is essentialto reducing this liability and increasing employee productivity. Building such an organizationalculture includes employee involvement in developing a policy and communication of that policy toall employees.
This research concludes that a successful corporate policy should provide for responsiblepersonal use of the Internet and email in the workplace.