academy of educational leadership journalcitadel.sjfc.edu/faculty/hsashittal/pubs/educational...
TRANSCRIPT

Volume 15, Number 4 Printed ISSN: 1095-6328 PDF ISSN: 1528-2643
ACADEMY OF EDUCATIONAL LEADERSHIP JOURNAL
Michael Shurden Editor
Lander University
Nancy Niles Editor
Lander University
The Academy of Educational Leadership Journal is owned and published by the DreamCatchers Group, LLC. Editorial content is under the control of the Allied Academies, Inc., a non-profit association of scholars, whose purpose is to support and encourage research and the sharing and exchange of ideas and insights throughout the world .

Page ii
Academy of Educational Leadership Journal, Volume 15, Number 4, 2011
Authors execute a publication permission agreement and assume all liabilities. Neither the DreamCatchers Group nor Allied Academies is responsible for the content of the individual manuscripts. Any omissions or errors are the sole responsibility of the authors. The Editorial Board is responsible for the selection of manuscripts for publication from among those submitted for consideration. The Publishers accept final manuscripts in digital form and make adjustments solely for the purposes of pagination and organization.
The Academy of Educational Leadership Journal is owned and published by the DreamCatchers Group, LLC, PO Box 1708, Arden, NC 28704, USA. Those interested in communicating with the Journal, should contact the Executive Director of the Allied Academies at [email protected].
Copyright 2011 by the DreamCatchers Group, LLC, Arden NC, USA

Page iii
Academy of Educational Leadership Journal, Volume 15, Number 4, 2011
EDITORIAL REVIEW BOARD
M. Meral Anitsal Tennessee Tech University Cookeville, Tennessee
Kazoos Ardalan Marist College Poughkeepsie, New York
Katherine Barker University of South Florida, St. Petersburg St. Petersburg, Florida
Debbie Beard Southeast Missouri State University Cape Girardeau, Missouri
Jane Beese The University of Akron Akron, Ohio
Randall Bowden Kaplan University Hagerstown, Maryland
Linda Bressler University of Houston-Downtown Houston, Texas
Doug Cagwin Lander University Greenwood, South Carolina
Royce Caines Lander University Greenwood, South Carolina
James Cartner University of Phoenix Phoenix, Arizonia
Charles Emery Lander University Greenwood, South Carolina
Horace Fleming Mercer University Atlanta, Georgia
Jerry Garrett Marshall University Graduate College Huntington, West Virginia
Elizabeth E. Grandon University of Bío-Bío Chile
Doug Grider University of Arkansas-Fort Smith Fort Smith, Arkansas
Sanjay Gupta Valdosta State University Valdosta, Georgia
Rassule Hadidi University of Illinois at Springfield Springfield, Illinois
Jim Harbin Texas A&M University-Texarkana Texarkana, Texas
Michael Harris Eastern Michigan University Ypsilanti, Michigan
Steve Harvey Lander University Greenwood, South Carolina
Diana Haytko Missouri State University Springfield, Missouri
Kevin R. Howell Appalachian State University Boone, North Carolina
Robyn Hulsart Austin Peay State University Clarksville, Tennessee
Kanata Jackson Hampton University Hampton, Virginia
Jeff Jewell Lipscomb University Nashville, Tennessee
Timothy Johnston Murray State University Murray, Kentucky

Page iv
Academy of Educational Leadership Journal, Volume 15, Number 4, 2011
EDITORIAL REVIEW BOARD
Ida M. Jones California State University, Fresno Fresno, California
Raghu Korrapati Walden University Blythewood, South Carolina
Melinda Kushniroff Millikin University Decatur, Illinois
Derrick Love Grand Canyon University Phoenix, Arizona
Jeff Mankin Lipscomb University Nashville, Tennessee
Asghar Nazemzadeh University of Houston-Downtown Houston, Texas
Robert Pritchard Rowan University Glassboro, New Jersey
Ganesan Ramaswamy King Saud University Riyadh, Saudi Arabia
Danny L. Rhodes Anderson University Anderson, Indiana
Tony Santella Erskine College Due West, South Carolina
Mel Schnake Valdosta State University Valdosta, Georgia
Barbara Schuldt Southeastern Louisiana University Hammond, Louisiana
Robert W. (Bill) Service Samford University Birmingham, Alabama
Susan Shurden Lander University Greenwood, South Carolina
Neil Terry West Texas A&M University Canyon, Texas
Robert G. Tian Medaille College Buffalo, New York
Marco Wolf The University of Southern Mississippi Hattiesburg, Mississippi

Page v
Academy of Educational Leadership Journal, Volume 15, Number 4, 2011
TABLE OF CONTENTS EDITORIAL REVIEW BOARD .................................................................................................. III LETTER FROM THE EDITORS ................................................................................................ VII CONCEPTUALIZATION AND MEASUREMENT OF PERCEIVED RISK OF ONLINE EDUCATION ........................................................................................................... 1
Fatma A. Mohamed, Morehead State University Ahmad M. Hassan, Morehead State University Barbara Spencer, Mississippi State University
C-SCAPE: ONE BUSINESS SCHOOL’S ANSWER TO THE SOPHOMORE SLUMP .......... 17
Tatiana Isakovski, Millikin University Susan M. Kruml, Millikin University Jon F. Bibb, Millikin University Adam D. Benson, Millikin University
DIFFERENCES OF STUDENTS’ SATISFACTION WITH COLLEGE PROFESSORS: THE IMPACT OF STUDENT GENDER ON SATISFACTION ..................... 35
Kristen M. Maceli, Pittsburg State University Christine E. Fogliasso, Pittsburg State University Donald Baack, Pittsburg State University
PRACTITIONER AND EDUCATOR PREFERENCES REGARDING ACCOUNTING CURRICULM MEETING THE 150-HOUR REQUIREMENT ...................... 47
David L. Crawford, Black Hills State University A RECURSIVE PROCESS MODEL FOR AACSB ASSURANCE OF LEARNING ............... 67
Dennis Zocco, University of San Diego TEACHING STUDENTS TO WORK IN CLASSROOM TEAMS: A PRELIMINARY INVESTIGATION OF INSTRUCTORS’ MOTIVATIONS, ATTITUDES AND ACTIONS..................................................................................................... 93
Hemant C. Sashittal, St. John Fisher College Avan R. Jassawalla, State University of New York at Geneseo Peter Markulis, State University of New York at Geneseo

Page vi
Academy of Educational Leadership Journal, Volume 15, Number 4, 2011
ETHICS IN ACCOUNTING: AN INDISPENSABLE COURSE?............................................ 107
Janice Klimek, University of Central Missouri Kelly Wenell, University of Central Missouri
THE PROFESSOR LIFE CYCLE .............................................................................................. 119
Randy J. Anderson, California State University, Fresno Lydia E. Anderson, California State University, Fresno
MULTI-LEVEL MODELING OF PRINCIPAL AUTHENTICITY AND TEACHERS’ TRUST AND ENGAGEMENT .......................................................................... 125
Chuang Wang, University of North Carolina at Charlotte James J. Bird, University of North Carolina at Charlotte
EVIDENCE ON INSTRUCTIONAL TECHNOLOGY AND STUDENT ENGAGEMENT IN AN AUDITING COURSE ....................................................................... 149
Songtao Mo, Purdue University Calumet
Page vii
Academy of Educational Leadership Journal, Volume 15, Number 4, 2011
LETTER FROM THE EDITORS Welcome to the Academy of Educational Leadership Journal. The editorial content of this journal is under the control of the Allied Academies, Inc., a non profit association of scholars whose purpose is to encourage and support the advancement and exchange of knowledge, understanding and teaching throughout the world. The mission of the AELJ is to publish theoretical, empirical, practical or pedagogic manuscripts in education. Its objective is to expand the boundaries of the literature by supporting the exchange of ideas and insights which further the understanding of education. The articles contained in this volume have been double blind refereed. The acceptance rate for manuscripts in this issue, 25%, conforms to our editorial policies. We intend to foster a supportive, mentoring effort on the part of the referees which will result in encouraging and supporting writers. We welcome different viewpoints because in differences we find learning; in differences we develop understanding; in differences we gain knowledge and in differences we develop the discipline into a more comprehensive, less esoteric, and dynamic metier. Information about the Journal and the Allied Academies is published on our web site. In addition, we keep the web site updated with the latest activities of the organization. Please visit our site and know that we welcome hearing from you at any time.
Michael Shurden and
Nancy Niles Editors

Page viii
Academy of Educational Leadership Journal, Volume 15, Number 4, 2011

Page 1
Academy of Educational Leadership Journal, Volume 15, Number 4, 2011
CONCEPTUALIZATION AND MEASUREMENT OF PERCEIVED RISK OF ONLINE EDUCATION
Fatma A. Mohamed, Morehead State University Ahmad M. Hassan, Morehead State University Barbara Spencer, Mississippi State University
ABSTRACT
While there has been growing interest regarding online education (OE), there is no scale
available to measure students’ perceived risk of OE. This study develops a reliable and valid scale to measure perceived risk of OE using both qualitative method (focus groups, to develop questionnaire items) and quantitative techniques (e.g. factor analysis, to test and refine questionnaire subscales). The study reveals that the construct of perceived risk of OE has five dimensions: performance risk, time-loss risk, social risk, psychological risk, and source risk. Findings indicate that four factors of the scale – performance, time-loss, psychological, and source risks are strongly predictive of OE enrollment intent.
INTRODUCTION
Online education (OE) is coming of age. Over the past few years, a stream of technological innovations, from video streaming to virtual online classrooms, has allowed educational institutions and their faculty members the opportunity to experiment with new teaching methods and to offer new types of degree programs beyond the traditional classroom setting. As a result, students are able to enhance their knowledge and to earn degrees without leaving their jobs and families, and in some cases, without setting foot on a college campus. Today’s OE programs can allow students to attain their educational goals in a manner that is flexible, convenient and cost effective (Furst-Bowe & Dittmann, 2001; Anderson, Banks & Leary, 2002). The question is, how do they perceive this opportunity? That is, do students perceive online programs as comparable to on-campus work, or do they perceive such offerings as higher risk alternatives?
Recent trends appear to suggest that perceptions of OE are becoming more positive. In the five year period from 2002-2007, the number of online students more than doubled (Allen & Seaman, 2008). During the fall 2007 term, nearly 3.9 million students, approximately 20-25% of all students in U.S. colleges, took at least one online course. While many of these students are off-campus students with a wide variety of ages, work experience and family circumstances, about half of all online enrollments are estimated to be traditional students seeking online courses for reasons of convenience (Mayadas, Bourne and Bacsich, 2009). Most of these

Page 2
Academy of Educational Leadership Journal, Volume 15, Number 4, 2011
students are at public institutions; more than two-thirds of all higher education institutions in the United States have implemented some form of online offerings (Allen & Seaman, 2007).
Yet, research has shown that the perceptions of people about risk rarely coincide with the actual risk of certain activities (Kaspar, 1979). Moreover, in the context of OE, there is no comprehensive research that measures the way that people assess multiple aspects of risk in relation to their intention to enroll. That is, they may be attracted to this form of education for its convenience, while at the same time, concerned about its effectiveness, their ability to communicate with other students, or their likelihood of success. Understanding these factors is important in the short run, because they may differentially affect students’ intention to enroll in online classes at all or their decision to enroll in one program versus another (Campbell and Goodstein, 2001). In the long run, a better understanding of the risks associated with OE may help faculty and administrators to influence the learning process in a positive way. For instance, if social factors constitute an important dimension of the perceived risk associated with OE, then programs can be designed to enhance interaction throughout the learning process using processes that range from old-fashioned team assignments to technologically driven virtual classrooms. Consequently, this study takes the first steps in developing a scale for measuring multiple dimensions of perceived risk in OE programs.
The study is organized as follows: First, it describes the notion of perceived risk in OE and defines the types of perceived risk in the OE context. Second, the study creates the item pool that matches the potential dimensions of perceived risk in the OE context and ensures construct validity by using focus groups and a panel of experts to judge the face validity of the construct. Third, the study relates the dimensions of perceived risk to a variety of student demographics to see how different students view online education.
THE NOTION OF PERCEIVED RISK IN OE
Mitchell (1998) defines risk as “the variation in the distribution of possible outcomes, their likelihood and their subjective values” (Mitchell, 1998). The decision to enroll in an online class involves risk because doing so could lead to unexpected or uncertain consequences, some of which could be negative. Potential online students may wonder if they can learn as well online as in a traditional classroom, whether they will be able to communicate with the teacher or their peers, whether their grades will suffer, whether they can finish their program in a timely manner and so on. Their perceptions of these issues, whether accurate or not, will affect their intention to enroll.
Risk assessment is highly subjective. Research has shown that perceptions of people about risk do not always coincide with what we know to have been the actual risk of certain activities (Kasper, 1979). Introduced by Bauer (1960), the concept of perceived risk has been defined as the unexpected and uncertain consequences associated with a product or service that are likely to be unpleasant. Perceived risk has become a central concept in the marketing
Page 3
Academy of Educational Leadership Journal, Volume 15, Number 4, 2011
literature because it helps to explain the consumer’s intention to purchase (Mitchell et al., 1999). Specifically, higher perceived risk reduces the intention to purchase because consumers wish to avoid negative outcomes (Bettman, 1973). In the context of OE, intention to purchase is equivalent to intention to enroll.
Although Bauer’s initial work (1960) viewed perceived risk as a two-dimensional construct (i.e., uncertainty and negative consequences), more recent work views it as a multidimensional construct including financial risk, performance risk, physical risk, psychological risk, and social risk (Jacoby & Kaplan, 1972). Several other potential sources of perceived risk include time risk (Roselius, 1971), source credibility risk (McCorkle, 1990) and privacy risk (Elliot, 1995).
A review of these studies reveals that the importance of various perceived risk dimensions varies widely across different situations. Thus, perceived risk appears to be extremely context-dependent (Stone & Gronhaug, 1993). In online education, students interact with their instructors primarily through the internet and other computer networks as opposed to face to face contact in classrooms or faculty offices (Haigh, 2007). Today’s increasing acceptance of online education by students, faculty and administrators was not widely anticipated. Over the years, many research studies have pointed to likely disadvantages or limitations of online learning. Taken together, this body of work seems to suggest that several sources of perceived risk are relevant to this context.
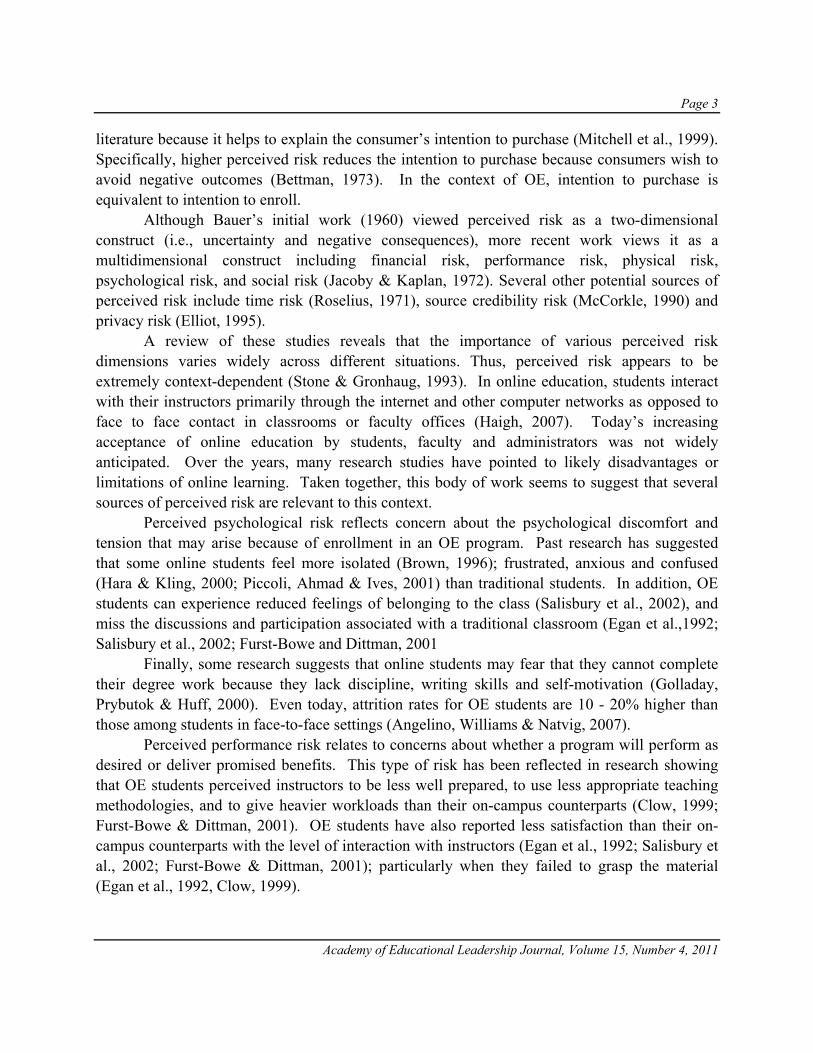
Perceived psychological risk reflects concern about the psychological discomfort and tension that may arise because of enrollment in an OE program. Past research has suggested that some online students feel more isolated (Brown, 1996); frustrated, anxious and confused (Hara & Kling, 2000; Piccoli, Ahmad & Ives, 2001) than traditional students. In addition, OE students can experience reduced feelings of belonging to the class (Salisbury et al., 2002), and miss the discussions and participation associated with a traditional classroom (Egan et al.,1992; Salisbury et al., 2002; Furst-Bowe and Dittman, 2001
Finally, some research suggests that online students may fear that they cannot complete their degree work because they lack discipline, writing skills and self-motivation (Golladay, Prybutok & Huff, 2000). Even today, attrition rates for OE students are 10 - 20% higher than those among students in face-to-face settings (Angelino, Williams & Natvig, 2007).
Perceived performance risk relates to concerns about whether a program will perform as desired or deliver promised benefits. This type of risk has been reflected in research showing that OE students perceived instructors to be less well prepared, to use less appropriate teaching methodologies, and to give heavier workloads than their on-campus counterparts (Clow, 1999; Furst-Bowe & Dittman, 2001). OE students have also reported less satisfaction than their on-campus counterparts with the level of interaction with instructors (Egan et al., 1992; Salisbury et al., 2002; Furst-Bowe & Dittman, 2001); particularly when they failed to grasp the material (Egan et al., 1992, Clow, 1999).

Page 4
Academy of Educational Leadership Journal, Volume 15, Number 4, 2011
Finally, OE students have reported that their knowledge of the subject material increased less and that the course was of less value than students taking the class in the traditional format (Anderson, Banks & Leary 2002). Furthermore, OE students often experience some type of technical problem during their courses (Furst-Bowe and Dittman, 2001). Indeed, some of the negative assessments of OE may be due the students’ difficulty in differentiating between their perceptions of the professor and their perceptions of the delivery system (Silvernail & Johnson, 1992).
Perceived Time-demand risk involves fears about the amount of time and effort that will be required to complete online courses. For many students, a major benefit of online education is the flexibility and convenience of taking such courses from home; however, for those who are employed full time or have family obligations, concerns about the time demands can still arise. In their study of student perceptions of online learning, Smart and Cappel (2006) found that study participants complained about losing previously saved work, the slowness of screen loads and the length of the assignments. Thirty percent of their subjects said that the online units were too long and took too much time to complete. In addition, some OE students have reported frustrations with time spent on carrying out online administrative services such as obtaining textbooks, library access and advising (Furst-Bowe and Dittman, 2001).
Perceived social risk relates to concerns about what others will think about us. In the OE context, students may fear that an online degree may not be well accepted by friends and family, or particularly by employers.
Perceived source risk reflects concern over the credibility of the university offering OE programs. Research shows that when considering whether to enroll in an OE course, students worry about the location of the institution, the reputation of the institution, and whether the program will accept transfer credits earned at other institutions (Furst-Bowe and Dittman, 2001). They also worry that prospective employers may question the value of an OE school or program in comparison to a traditional one.
The next section describes the procedures used to develop a scale to measure these sources of perceived risk.
OVERVIEW OF SCALE DEVELOPMENT AND QUESTIONNAIRE DESIGN
This study followed the scale development paradigm described by Churchill (1979), DeVellis (1991), and Spector (1992) in generating a perceived risk in OE item pool, purifying the scale, and demonstrating the reliability and validity of the scale. The first step in any scale development is to use the definition to generate a number of items designated to capture the conceptual and logical true variance present within the construct (Churchill, 1979; DeVellis, 1991; Spector, 1992). As stated earlier, risk perception is an individual’s subjective assessment of the potentially negative outcomes of a situation. According to Jacoby and Kaplan (1972) and

Page 5
Academy of Educational Leadership Journal, Volume 15, Number 4, 2011
Roselius (1971), perceived risk is a multidimensional construct including an array of factors that may be viewed as uncertain or unpleasant.
After examining the literature on perceived risk, we followed DeVellis’s advice by holding two focus groups with students who had taken one or more OE courses. The first group consisted of 12 undergraduate students, 5 of whom had enrolled in an online class before, and 7 of whom had not. The second group consisted of 10 graduate students, all of them who had enrolled in online classes. The focus groups allowed for the assessment and exploration of the key variables that would impact the perceived risk of OE.
The first step in the focus groups was to ask open-ended question about the students’ problems or concerns about enrolling in on line classes. These questions related to each of the dimensions of risk mentioned in the literature: financial, performance, psychological, social, physical, time demand, source credibility, and privacy.
In each group, students identified concerns associated with five of these dimensions: performance, psychological, social, time demand, and source credibility. Physical risk was not viewed as a factor since OE courses could be taken at home. Privacy was not viewed as an issue either. It was widely agreed among the students that they didn’t have any problem with their privacy, since everything in online classes was password protected, and no one could access their work and grade book except the instructor. Regarding the financial risk, they mentioned that having online classes was a source of savings, not risk; they didn’t need to commute, they could stay with their children without need of day care or baby sitters, and they could avoid living in a dorm or in any other place away from home.
Therefore, this study considered performance risk, time-demand risk, social risk, psychological risk, and source risk as the types of risks in the context of online education. A separate multi-item scale was developed to assess each of the five dimensions of perceived risk (the main scale) in addition to a subscale to measure students’ intention to enroll in online classes (to be used in testing the predictive validity of the main scale). These items were chosen to cover various aspects of each domain. Items had to focus on a single dimension, and not bridge two or more dimensions, a feature important for construct validity. A total of 62 different items were identified from this first step related to the five dimensions of perceived risk. The other 5 items were identified related to the subscale to measuring students’ intention to enroll in online classes.
CONTENT VALIDITY The item pool was developed in an effort to tap each component of the perceived risk dimensions that were derived from a thorough literature review and the focus groups. As noted earlier, the focus groups allowed for the exploration of the key factors related to the perceived risk of OE. They also helped in performing a thorough evaluation of the item wording and eliminating any redundant, ambiguous, or poorly worded items.

Page 6
Academy of Educational Leadership Journal, Volume 15, Number 4, 2011
Overall, 56 acceptable scale items were generated for the main scale and 5 items for the subscale. These items were submitted to a panel of expert judges in order to assess the content validity. These judges consisted of one education professor, one management professor, one marketing professor, and one doctoral student in management and information systems. They were asked to rate the appropriateness and representativeness on a scale from one (inappropriate and unrepresentative) to five (appropriate and representative) for each of the items included in the various domains of perceived risk.
The items that received a rating of less than four were deleted and other changes were made as recommended. After the elimination of 14 redundant items or ‘‘not representative’’ items, the experts agreed that the scale items of perceived risk of OE adequately represented the construct and that each of the subscale items were representative of the intention to enroll construct. The questions included the revised scale that consists of 44 items for the main scale and the subscale of 3 items. It is also included demographic information such as gender, age, student classification, race, and work experience. A five-point, Likert-type response format was used. Sample and data collection
The unit of analysis in this study consists of students who have had at least one class online. Data were gathered from 257 students. This sample size exceeds the conventional requirement that five observations per scale item are needed for conducting factor analysis (Hair et al., 1998; Stevens, 1996). About 75% of the respondents were undergraduate and 25% graduate students. The sample consisted of more females (65%) than males. The mean age was 28 years.
Convenience samples are considered valid under two conditions: if the study is exploratory in nature and if the items on the questionnaire are pertinent to the respondents who answer them (Ferber, 1977). This study satisfies both conditions. Since this is one of the first attempts to develop a scale to measure perceived risk in OE, this study can clearly be considered exploratory. Also, since it was a necessary condition to complete the questionnaire from students to enroll in online class(es), the scale items are relevant to the respondents. Scale Purification
Having generated data using the pools described earlier, the next task was to determine whether any items needed to be eliminated. Items that correlate negatively with one another (after reversing responses to the negatively worded item) or items that did not correlate strongly with the sum of the remaining items were removed. Table 1 provides the correlation matrix among items in the purified scales.

Page 7
Academy of Educational Leadership Journal, Volume 15, Number 4, 2011
* * Correlation is significant at the 0.01 level (2-tailed). * Correlation is significant at the 0.05 level (2-tailed).
Then exploratory factor analysis was used on the items of each scale. Principal
component analysis with varimax rotation “using SPSS” was undertaken for the five dimensions of perceived risk and the subscale that has been created to measure intention to enroll. The different dimensions of scales were analyzed, and the items that didn’t satisfy the following criterion were deleted: (1) dominant loadings greater than .40 and (2) cross-loadings less than .25. The latent root criterion was used as a criterion for accepting factors, which specifies an eignevalue greater than 1 to determine the number of factors to be extracted. In addition, the factor loadings are generally high, and factor loadings ranged from 0.85 to 0.41. Table 2 shows the results of the principle components analysis.

Page 8
Academy of Educational Leadership Journal, Volume 15, Number 4, 2011
Table 2 Varimax-rotated Matrix of Perceived Risk Items
Components Variable Performance Time-demand Social Psychological Source Enrolment intention VAR1 .617 VAR2 .609 VAR3 .552 VAR4 .623 VAR6 .577 VAR8 .780 VAR11 .625 VAR13 .506 VAR14 .660 VAR17 .501 VAR18 .424 VAR23 .553 VAR24 .619 VAR25 .757 VAR27 .817 VAR28 .866 VAR29 .819 VAR31 .736 VAR32 .565 VAR33 .501 VAR37 .726 VAR39 .812 VAR40 .869 VAR41 .448 VAR42 .413 VAR45 .784 VAR46 .671 VAR47 .858
Six factors accounted for 61.4 percent of the total variance. Overall, eight items were
retained from the performance risk scale, six from the time-demand risk scale, three from the social risk scale, four from the psychological risk scale, four from the source risk scale, and three from the intention to enrollment scale (See Appendix). Reliability Assessment
The internal consistency of the six scales exceeded the minimum level of .70 as assessed by coefficient alpha. Coefficient alpha had acceptable levels ranging from 0.83 to 0.80 (Nunnally and Bernstein, 1994). The first factor “Perceived Performance Risk” (α = 0.82) explained 32.7% of the variance. The second factor “Perceived Time-demand Risk” (α = 0.80) accounted for 9.8% of the variance. The third factor “Perceived Social Risk” (α = 0.82) explained 6.7% of the

Page 9
Academy of Educational Leadership Journal, Volume 15, Number 4, 2011
variance. The fourth factor “Perceived Psychological Risk” (α = 0.80) accounted for 5.5% of the variance. The fifth factor “Perceived Source Risk” (α = 0.70) accounted for 5.2% of the variance. The last factor “Intention to Enroll” (α = 0.83) explained 3.9% of the variance. The reliability of the individual items were assessed using the criterion of item-to-total correlations greater than .50 with squared multiple correlations of more than .30 (DeVellis, 1991; Hair et al., 1998). Predictive Validity
Since students perceived risk relative to OE, this risk should have an effect on student’s intention to enroll in online class(es) in the future. This relationship is anticipated to be negative since a higher perceived risk should result in a lower intention to enroll in an OE program. Zero order correlations and multiple regressions were used to assess this predictive validity.
Zero order correlations revealed that enrollment intention significantly and negatively correlated with all the five dimensions of perceived risk for online classes. Table 3 shows the results of the correlation analysis.
Table 3 Zero order correlations
Performance Risk
Time demand Risk
Social Risk
Psychological Risk
Source Risk
Enrollment intention
Performance Risk 1 Time Demand Risk .671** 1 Social Risk .308** .207** 1 Psychological Risk .699** .683** .463** 1 Source Risk .537** .459** .441** .562** 1 Enrollment intention -.534** -.535** -.281** -.574** -.470** 1 ** Correlation is significant at the 0.01 level (2-tailed).
Although the correlation analyses generally supported the predictive validity, multiple
regression analysis was performed to further analyze the relationships between the independent and dependent variables. The results of the multiple regression analysis appear in Table 4.
Table 4 Multiple regression analysis resultsIndependent variables Beta coefficients t Sig. Performance Risk .140 2.225 .027 Time Demand Risk .197 3.215 .001 Social Risk .013 .260 .795 Psychological Risk .245 3.562 .001 Source Risk .161 3.047 .002 Dependent Variable: Enrollment intention

Page 10
Academy of Educational Leadership Journal, Volume 15, Number 4, 2011
These results indicate that four factors of the scale – performance, time-loss, psychological, and source risks - are strongly predictive of OE enrollment intentions. Variation in Perceived Risk
Table 5 Perceived Risk Variation according to some Demographic Variables Source Dependent Variables Mean Square F Sig.
Sex
Performance Risk 1.887 3.844 0.04 Time Demand Risk 1.07 2.49 0.116 Social Risk 0.159 0.335 0.563 Psychological Risk 0.582 0.76 0.384 Source Risk 1.026 2.418 0.121
Age
Performance Risk 0.916 2.199 0.001 Time Demand Risk 0.493 1.171 0.253 Social Risk 0.611 1.371 0.099 Psychological Risk 1.5 2.411 0.001 Source Risk 0.752 2.062 0.001
Graduate And undergraduate
Performance Risk 2.28 4.661 0.032 Time Demand Risk 0.035 0.08 0.777 Social Risk 0.871 1.853 0.175 Psychological Risk 5.17 6.957 0.009 Source Risk 0.979 2.305 0.013
Employed or not
Performance Risk 0.390 0.774 0.380 Time Demand Risk 1.919 4.023 0.046 Social Risk 1.161 2.343 0.127 Psychological Risk 2.795 3.798 0.050 Source Risk 0.390 0.774 0.380
Years How many years they have been working
Performance Risk 0.602 1.265 0.162 Time Demand Risk 0.561 1.381 0.09 Social Risk 0.506 1.088 0.351 Psychological Risk 1.162 1.703 0.013 Source Risk 4.980 4.153 0.042
Hours How many hours a week?
Performance Risk 0.46 0.91 0.623 Time Demand Risk 0.431 0.996 0.484 Social Risk 0.407 0.837 0.736 Psychological Risk 1 1.404 0.045 Source Risk 0.377 0.861 0.701
OE Experience
Performance Risk 1.458 2.956 0.087 Time Demand Risk 0.25 0.577 0.448 Social Risk 0.101 0.213 0.645 Psychological Risk 0.088 0.115 0.735 Source Risk 1.986 4.731 0.031
In addition to its relationship to OE Enrollment, perceived risk varied according to some demographic variables. Using the general linear model, multivariate method (Table 5), shows different effects. For instance, female students perceived more performance risk than male students. Older students experienced more performance risk, psychological risk and source risk than younger students. Graduate students experienced more performance, psychological and source risk than undergraduate students. Students who were working perceived more time risk

Page 11
Academy of Educational Leadership Journal, Volume 15, Number 4, 2011
and psychological risk than the students who were not working. Students with more years of work experience perceived more psychological and source risk than those with less work experience. Students who worked more hours a week perceived more psychological risk when considering OE classes than did those who worked less. While at the same time, students who had taken more online classes perceived more source risk than those who had taken fewer online classes. Contributions, Limitations and Opportunities for Future Research
This study reviewed the dimensions of perceived risk and identified five dimensions that are relevant to the OE context. These dimensions are: perceived performance risk, perceived time-demand risk, perceived social risk, perceived psychological risk, and perceived source risk. An item pool was developed and content validity achieved by independent judges, who evaluated the appropriateness and representativeness of the items. After deleting inappropriate and unrepresentative items, 26 items remained. For these items, the researchers tested the reliability using coefficient alpha and demonstrated that the results support the reliability of the scale. Moreover, the researchers tested the predictive validity of the scale achieving results showing four dimensions out of five are highly predictive of the intention to enroll in online courses.
The study shows that even though OE is becoming much more common and well accepted, perceived risk still occurs and is associated with the decision of whether or not to enroll in such courses. While this is a good beginning, the availability of a reliable scale allows us to look more in depth at a variety of interesting and important questions concerning online education. For instance, the current study only looks at the intention to enroll in general. It could be very useful, however, to see how these dimensions vary when participants are considering the choice between different programs. It is easy to surmise that source credibility could vary across programs, but so could expected performance outcomes and other potential sources of risk. Even more important would be to find out whether these different risk assessments affected the intention to enroll differently at unique institutions.
If the administrators of online programs better understood potential students’ fears and concerns, they could market certain attributes of their programs in a way that might alleviate such fears. For instance, accredited business schools could promote their AACSB credentials in order to reduce the fear of source credibility. They could feature profiles of prior OE students who are now working in well-known organizations with good jobs.
Faculty could also learn how to enhance the online learning process through the use of this scale. It would be very interesting to study the linkage between perceived risk and reported learning outcomes as moderated by different types of course content. For example, students may perceive more psychological risk when considering quantitative classes such as statistics or economics. In such cases, does the perception of risk actually reduce the possibility of success or satisfaction with the course? Do those who perceive more risk perform less well? Or is there

Page 12
Academy of Educational Leadership Journal, Volume 15, Number 4, 2011
an interaction between the type of risk, the content of the class, and the technology used to teach the class? These are complex issues which have yet to be evaluated.
This study has some limitations that also deserve comment. One limitation of the present study was all data were collected through the same questionnaire during the same period of time with cross-sectional research design, common method variance, variance that is attributed to the measurement method rather than the constructs of interest, may cause systematic measurement error and further bias the estimates of the true relationship among theoretical constructs. (Avolio,Yammarino,&Bass,1991; Bagozzi & Yi, 1990; Crampton, & Wagner, 1994; Doty&Gulick, 1998; Podsakoff, MacKenzie, Lee, & Podsakoff, 2003; Podsakoff&Organ, 1986; Spector, 1994; Williams). Therefore, longitudinal or experimental research is needed to provide a more rigorous test of the validity of such scales. It is also important to know how the assessment of risk changes as students become more experienced in taking classes online. Enrolling in an online class can be described as purchasing a service. Research in the marketing literature has shown that perceived risk is higher when purchasing services vs. products because you must purchase services first and then evaluate them which results in increased uncertainty (Mitchell & Greatorex, 1993). Since different institutions and even different teachers utilize different approaches to OE, the risk may appear high every time.
A second limitation of the study is its use of one sample for purifying and validating the scale. The assessment of reliability and validity should be examined using a new sample in effort to avoid capitalizing on chance. Third, the study has been conducted at one university, and this affects the generalizability of the results. Therefore, more studies are needed using data from several randomly selected universities. Finally, the effect of the perceived social risk on the intention to enroll in online classes needs further investigation.
REFERENCES Allen, E. & Seaman, J. (2006). Making the Grade: Online Education in the United States, 2006. Sloan Consortium. Allen, I.E. & Seaman, J. (2007). Online Nation: Five Years of Growth in Online Learning. Babson Survey
Research Group; The Sloan Consortium. Anderson, L. P., Banks, S. R., & Leary, P. A. (2002). The effect of the interactive television courses on student
satisfaction. Journal for Education for Business. 77, 164-168. Angelino, L.M., Williams, F, & Natvig, D. (2007). Strategies to Engage Online Students and Reduce Attrition. The
Journal of Educators Online, 4(2), 1-14. Bauer, R.A. (1960). Consumer Behavior as Risk Taking, in Dynamic Marketing for a Changing World, R.S.
Hancock, ed. Chicago: American Marketing Association, 389-98. Bearden, W. O., & Mason, J. B. (1978). "Consumer-Perceived Risk and Attitudes toward Generically Prescribed
Drugs, Journal of Applied Psychology, 63, 741-46.

Page 13
Academy of Educational Leadership Journal, Volume 15, Number 4, 2011
Bettman, J.R. (1973). Perceived Risk and its Components: A Model and Empirical Test. Journal of Marketing Research, 10(2), 184-190.
Brooker, G. (1983). An Assessment of an Expanded Measure of Perceived Risk, in Proceedings of the Fourteenth
Annual Conference of the Association for Consumer Research, T. Kinnear, ed. Ann Arbor, MI: Association for Consumer Research, 439-41.
Brown, K.M. (1996). The Role of Internal and External Factors in the Discontinuation of Off-Campus Students.
Distance Education, 17(1), 44-71. Butler, D. L., & Winne, P. H. (1995). Feedback and self-regulated learning: A theoretical synthesis. Review of
Educational Research, 65(3), 245–281. Campbell, M.C. & Goodstein, R.C. (2001). The Moderating Effect of Perceived Risk on Consumers’ Evaluations
of Product Incongruity: Preference for the Norm. Journal of Consumer Research, 28(3), 439-449. Churchill, G. A. (1979). Paradigm for developing measures of marketing constructs. Journal of Marketing Research,
16, 64-73. Clow, K. E. (1999). Interactive Online education: Impact on Student Course Evaluations. Journal of Marketing
Education, 21, 97-106. Cox, D. F. (1967). Risk Taking and Information Handling in Consumer Behavior. Boston, MA: Harvard University
Press. Cunningham, S. M. (1967). The major dimensions of perceived risk. In D. F. Cox (Ed). Risk taking and Information
Handling in Consumer Behavior. Graduate School of Business Administration, Harvard University Press: Boston. 82-108.
DeVellis, R. F. (1991). Scale development: Theory and applications. Sage Publications: Newbury Park. Dick, W., & Carey, L. (1990). The systematic design of instruction (3rd ed.). New York: Harper Collins Publishers. Egan, M. W., Welch, M., Page, B., & Sebastian, J. (1992). Learner’s perceptions of instructional delivery systems:
Conventional and television. The American Journal of Distance Education, 6, 47-55. Elliot, S. (1995). The direct marketing industry takes a look at the perils of interactive technology, The New York
Times, 144:C8. Ferber, R. (1977). Research by Convenience, Journal of Consumer Research, 4, 57–58. Furst-Bowe, J. & Dittmann, W. (2001). Identifying the needs of adult women in online education programs. Journal
of Instructional Media, 28, 405-413. Gerbing, D. W., & Anderson, J. C. (1988). An updated paradigm for scale development incorporating
unidimensionality and its assessment. Journal of Marketing Research, 25, 186-192.

Page 14
Academy of Educational Leadership Journal, Volume 15, Number 4, 2011
Golladay, R., Prybutok, V. & Huff, R. (2000). Critical success factors for the online learner. Journal of Computer Information Systems, 40(4), 69-71.
Gunawardena, C. N. (1992). Changing faculty roles for audiographics and online teaching. The American Journal of
Distance Education, 6, 58-71. Haigh, M. (2007). Divided by a Common Degree Program? Profiling Online and Face-to-face Information Science
Students. Education for Information, 25, 93-110. Hair, J. D., Anderson, R.E., Tatham, R.L., & Black, W.C. (1998). Multivariate Data Analysis (Prentice Hall, NJ). Hara, N. & Kling, R. (2000). Students’ Distress with a Web-based Distance Education Course: An Ethnographic
Study of Participants’ Experiences. Information, Communication and Society, 3(4), 557-579. Jacoby, J., & Kaplan, L.B. (1972). The Components of Perceived Risk, in Proceedings of the Third Annual
Conference of the Association for Consumer Research, M. Venkatesh, ed. College Park, MD: Association for Consumer Research, 382-93.
Johnson, K. A. (1998). Students’ attitudes and perceived learning effectiveness of courses offered in the satellite
television mode of instructional delivery at the U.S. Army Logistics Management College. UMI Microform, 9917747.
Kaspar, R. (1980). Perceptions of risk and their effects on decision making. In Societal Risk Assessment: How
safe is safe enough? Edited by R.C. Schwing & W.A. Albers, General Motors Corporation, Research Laboratories.
Kochman, A. F. (1998). An investigation of differences in participant outcomes resulting from the use interactive
televised online education. UMI Microform, 9907752. Mayadas, A.F., Bourne, J. and Bacsich, P. (2009). Online Education Today, Science, 323(5910), 85-89. McClenahan, J. S. (1997). Industry Week 246 (21 July): 19-20. Available from the Internet at http://www.mba,
degree. McCorkle, D. E. (1990). The role of perceived risk in mail order catalog shopping. Journal of Direct Marketing, 4:
26-35. Miller, J. W., McKenna, M. C., & Ramsey, P. (1992). An evaluation of student content learning and effective
perceptions of a two-way interactive video learning experience, Statesboro, GA: Georgia Southern University.
Mitchell, V.W. (1998). Consumer perceived risk: conceptualizations and models. European Journal of Marketing,
33: 163-195. Mitchell, V.W., Davies, F., Moutinho, L. & Vassos, V. (1999). Using Neural Networks to Understand Service Risk
in the Holiday Product. Journal of Business Research, 46(2), 167-180.

Page 15
Academy of Educational Leadership Journal, Volume 15, Number 4, 2011
Mitchell, V.W. & Greatorex, M. (1993). Risk Perception and Reduction in the Purchase of Consumer Services. Service Industries Journal, 13(4), 179-200.
Ohler, J. (1991). Why distance education? The Annals of the American Academy of Political and Social Science,
514(13), 22. Omatseye, J. N. (1999). Teaching trough tele-conferencing: Some curriculum challengers. College Student Journal,
33, 346-353. Peter, J. P., & Ryan, M.J. (1976). An Investigation of Perceived Risk at the Brand Level. Journal of Marketing
Research, 13, 184-87. Peter, J. P., & Tarpey, Sr., L.X. (1975). A Comparative Analysis of Three Consumer Decision Strategies. Journal of
Consumer Research, 2, 29-37. Phillips, M. R & Peters, M. J. (1999). Targeting rural students with distance learning courses: A comparative study
of determinants. Journal of Education for Business, 74, 351-356. Piccoli, G., Ahmad, R. & Ives, B. (2001). Web-based Virtual Learning Environments: A Research Framework and
a Preliminary Assessment of Effectiveness in Basic IT Skills Training. MIS Quartely, 25(4), 401-425. Roselius, T. (1971). Consumer rankings of risk deduction methods. Journal of Marketing, 56-61. Salisbury, W. D., Pearson, R. A., Miller, D. W., & Marett, L. K. (2002). The limitsof the information: A cautionary
tale about the one course delivery experience in the distance education environment. e-service journal. 1, 65-81.
Seay, R. A. & Milkman, M. I. (1994). Interactive television instruction: Anassessment of student performance and
attitudes in an upper division accounting course, Issues in Account Education, 9, 80-96. Silvernail, D. L. & Johnson J. L. (1992). The impact of interactive televised instruction on student evaluations of
their instructors. Educational Technology, 32, 47-50. Smart, K.L., and Cappel, J.J. (2006). Students’ Perceptions of Online Learning: A Comparative Study. Journal of
Information Technology Education, 5, 201-215. Solas, J. (1990). Effective teaching as constructed by social work students. Journal of social Work Education, 26,
145-154. Smart, K.L. and Cappel, J.J. (2006). Students’ perceptions of online learning: A comparative study. Journal of
Information Technology Education, 5, 201-219. Spector, P. E. (1992). Summated rating scale Construction: An introduction. Sage Publications: Newbury Park. Stevens, J. (1996). Applied Multivariate Statistics for the Social Sciences (Mahwah, Lawrence Erlbaum. NJ)

Page 16
Academy of Educational Leadership Journal, Volume 15, Number 4, 2011
Stone, R. N., & Gronhaug, K. (1993). Perceived risk: Further considerations for the marketing discipline. European Journal of Marketing, 27, 39-50.
Wheeler, C., & Batchelder, A. (1996). The instructional practices of televised distance education at Northern
Arizona University. Education, 117, 172-180.
APPENDIX Text of Items
Measuring Perceived Risk in Online education Perceived Performance Risk I think the instructor will be able to make himself/herself clearly understood. (RC) I doubt the instructor will be able to make this type of class work for all of the students. I am concerned about the accessibility of the instructor through phone or fax. I don’t believe the instructor will be very accessible by e-mail. I’m worried about getting feedback about my performance from the instructor. I’m concerned that the technology used in OE won’t be reliable. I believe there will be state-of-the-art technology used in OE courses. (RC) I don’t know who will help me if I have problems with the technology used in this course. Perceived Time-Demand Risk I’m not sure I’ll have the time needed to successfully complete online courses. I am concerned about the availability of books, required readings, or other resources in a timely basis. I feel that the library and research facilities at the remote site will be inadequate. (RC) I’m afraid that OE will take too much time away from my family. I don’t think an online course would interfere with my regular schedule. (RC) If I take an online course, I’ll have less free time. Perceived Social Risk I believe potential employers will be more impressed with a degree earned through OE than with one earned
the traditional way. (RC) In general, people who earn their degrees through online programs are held in higher esteem than are
traditional students. (RC) My family will be prouder of me if earn a degree through an online program than they would if I completed a
traditional program. (RC) Perceived Psychological Risk I am worried about keeping myself motivated in on-line classes. I have a feeling that online classes are less important than the on-campus classes. Just the thought of taking an online class causes me to feel stressed. I think there will be sufficient classroom interaction in an online class. (RC) I have trouble paying attention to the class materials when I have an online class. Perceived Source Risk It is difficult to determine the credibility of some universities offering OE programs. It is not hard to ascertain the expertise of some universities offering OE programs. (RC) It’s not difficult to learn the reputation of universities offering OE programs. (RC) I’m concerned about the credibility of some universities offering OE programs. I think that universities that offer OE programs are just as good as traditional schools. (RC) I believe that OE is the “wave of the future”. (RC) Criterion variables (intention to enroll) If the opportunity arises, I’ll enroll in a distance course. I would never even consider enrolling in a distance-learning program. (RC) There’s a very good chance that I’ll take a distance-learning course in the future.

Page 17
Academy of Educational Leadership Journal, Volume 15, Number 4, 2011
C-SCAPE: ONE BUSINESS SCHOOL’S ANSWER TO THE SOPHOMORE SLUMP
Tatiana Isakovski, Millikin University Susan M. Kruml, Millikin University
Jon F. Bibb, Millikin University Adam D. Benson, Millikin University
ABSTRACT
C-scape is one university’s unique sophomore year integrated learning experience,
designed to help students to plan their careers. It takes students through a comprehensive process of discovering and integrating their personal and professional landscapes, using their personal compass to define their direction, and personally mapping the steps to get there. This program is unique because it builds on Fink’s seminal framework on integrated design of significant learning experiences. The aim of C-scape is to actively engage sophomores in the process of taking responsibility for their own learning and their future personal and professional success.
INTRODUCTION
For more than 50 years, those in higher education have recognized the ‘sophomore slump’ and yet, there is very little research on what and how to effectively overcome it (Lipka, 2006; Tobolosky & Serven, 2007; Toosi, 2004). After a first year filled with novelty and excitement, sophomores often struggle to find their passions and set their goals (Gardner, Pattengale, & Schreiner, 2000; Lemons & Richmond, 1987) which leaves them with a sense of inertia and disorganization (Freedman, 1956). They realize there are discrepancies between their expectations and the realities of college which leads to feelings of uncertainty about their futures (Evenbeck et al. 2000; Gardner, 2000). Consequently, sophomores may become disengaged and may even drop out (Lipka, 2006; Schaller, 2005). Moreover, without the aid of an intentional process to work through this confusion, sophomores are left to choose majors or careers they know little about (Lipka, 2006; Toosi, 2004).
Although the disconnect sophomores experience is well documented (Freedman, 1956), academicians face new challenges when dealing with millennial students (those born between 1980 and 2000) as they try to facilitate connections between students’ interests, strengths, and goals to chosen majors and potential career opportunities. Millennial students typically come to college having been shepherded and given much individual attention. They feel very close to their parents (Oblinger, 2003; Sujansky, 2009) who protected them (Debard, 2004, as cited in
Page 18
Academy of Educational Leadership Journal, Volume 15, Number 4, 2011
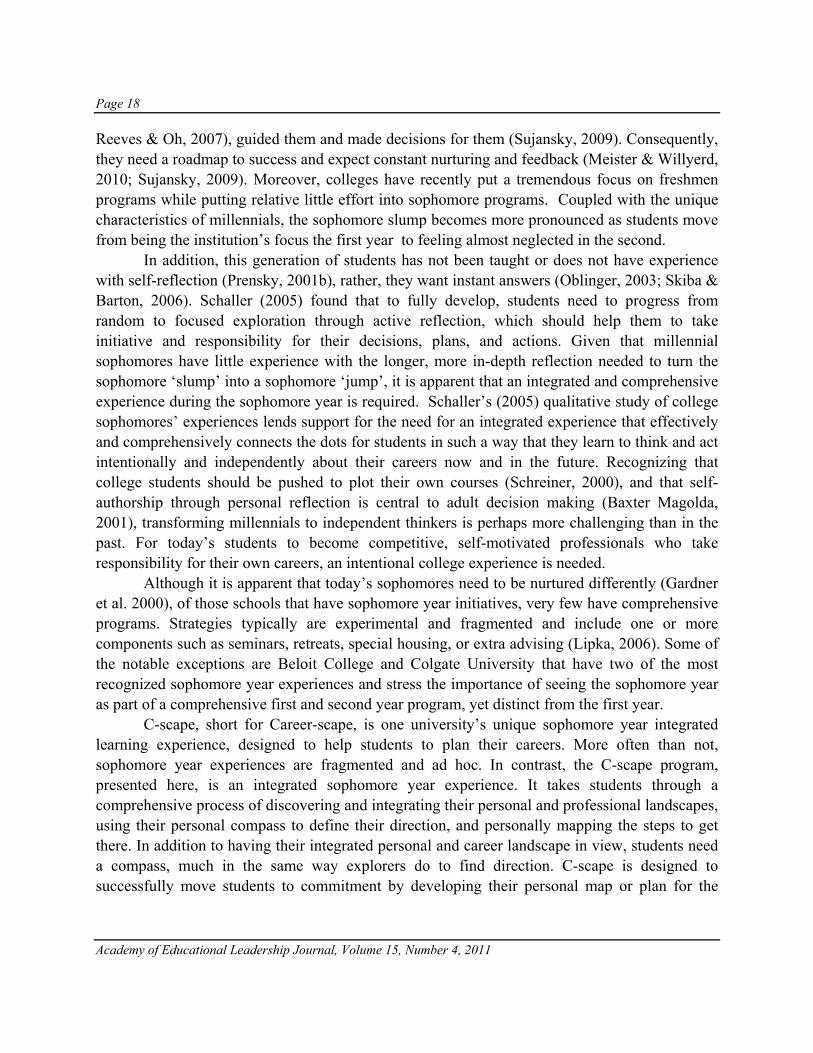
Reeves & Oh, 2007), guided them and made decisions for them (Sujansky, 2009). Consequently, they need a roadmap to success and expect constant nurturing and feedback (Meister & Willyerd, 2010; Sujansky, 2009). Moreover, colleges have recently put a tremendous focus on freshmen programs while putting relative little effort into sophomore programs. Coupled with the unique characteristics of millennials, the sophomore slump becomes more pronounced as students move from being the institution’s focus the first year to feeling almost neglected in the second.
In addition, this generation of students has not been taught or does not have experience with self-reflection (Prensky, 2001b), rather, they want instant answers (Oblinger, 2003; Skiba & Barton, 2006). Schaller (2005) found that to fully develop, students need to progress from random to focused exploration through active reflection, which should help them to take initiative and responsibility for their decisions, plans, and actions. Given that millennial sophomores have little experience with the longer, more in-depth reflection needed to turn the sophomore ‘slump’ into a sophomore ‘jump’, it is apparent that an integrated and comprehensive experience during the sophomore year is required. Schaller’s (2005) qualitative study of college sophomores’ experiences lends support for the need for an integrated experience that effectively and comprehensively connects the dots for students in such a way that they learn to think and act intentionally and independently about their careers now and in the future. Recognizing that college students should be pushed to plot their own courses (Schreiner, 2000), and that self-authorship through personal reflection is central to adult decision making (Baxter Magolda, 2001), transforming millennials to independent thinkers is perhaps more challenging than in the past. For today’s students to become competitive, self-motivated professionals who take responsibility for their own careers, an intentional college experience is needed.
Although it is apparent that today’s sophomores need to be nurtured differently (Gardner et al. 2000), of those schools that have sophomore year initiatives, very few have comprehensive programs. Strategies typically are experimental and fragmented and include one or more components such as seminars, retreats, special housing, or extra advising (Lipka, 2006). Some of the notable exceptions are Beloit College and Colgate University that have two of the most recognized sophomore year experiences and stress the importance of seeing the sophomore year as part of a comprehensive first and second year program, yet distinct from the first year.
C-scape, short for Career-scape, is one university’s unique sophomore year integrated learning experience, designed to help students to plan their careers. More often than not, sophomore year experiences are fragmented and ad hoc. In contrast, the C-scape program, presented here, is an integrated sophomore year experience. It takes students through a comprehensive process of discovering and integrating their personal and professional landscapes, using their personal compass to define their direction, and personally mapping the steps to get there. In addition to having their integrated personal and career landscape in view, students need a compass, much in the same way explorers do to find direction. C-scape is designed to successfully move students to commitment by developing their personal map or plan for the

Page 19
Academy of Educational Leadership Journal, Volume 15, Number 4, 2011
future. C-scape is a systematic process that internally connects students’ decisions to their interests and values.
Strong programs should build on a sound theoretical foundation which facilitates not only program development, but also learning objectives and assessment (NASPA, 2010). Although Bloom’s taxonomy of educational objectives (Bloom, 1956) is well-recognized and widely applied we believe that, given the characteristics of the millennials and mounting pressure on academics to engage students in their own learning, we need to go beyond cognitive aspects of learning. While Bloom’s taxonomy is an important framework for developing learning objectives, today’s students need not only to learn facts and information but also be engaged in reflection and self-discovery process in order to grow and become self-motivated learners in the future.
Consequently, we turned to a new model of significant learning experiences proposed by Fink (2003). In his seminal book, Creating Significant Learning Experiences, he developed a new vision of college teaching and learning. This vision builds on a new paradigm of significant learning experiences, deliberately and explicitly designed into the teaching environment and learning activities. The central idea is that learning experiences should result in true changes that transform students’ lives. In a learner-centered environment, a teacher’s role should be to create value-adding opportunities for students to become actively engaged in and take responsibility for their own learning. Designed and implemented properly, these rich learning experiences should lead to lasting changes in students’ lives. Building on the idea of significant learning experiences Fink (2003) developed the integrated course design (ICD) model that emphasizes the integration of learning goals, learning activities and assessment.
In this paper, we outline an application of the ICD model to the design of the sophomore year experience, C-scape, at Millikin University’s Tabor School of Business. Given the characteristics of today’s students, this model is particularly appropriate because it is designed to actively engage students in the process of taking responsibility for their own learning and their future personal and professional success. Not surprisingly, comprehensive sophomore year programs are most common on small, private college campuses (National Center for the Freshman Year Experience and Students in Transition, 2005) similar to our institution.
To fully understand the underlying rationale for the intentional and systematic design of the C-scape program, a review of Fink’s framework of significant learning experiences and the ICD model in necessary and is discussed in the following section. Then, using this framework, the C-scape program is presented, followed by conclusions.
CREATING SIGNIFICANT LEARNING EXPERIENCES: THE FRAMEWORK
In his seminal book, Creating Significant Learning Experiences, Fink (2003) developed a taxonomy of significant learning (Exhibit 1) that is now widely used by college professors, both in the United States and abroad (Fink and Fink, 2009). It includes important elements of

Page 20
Academy of Educational Leadership Journal, Volume 15, Number 4, 2011
Bloom’s taxonomy of cognitive development (Bloom, 1956) such as foundational knowledge, application, and integration. In addition, it incorporates the social aspect (human dimension), affect (caring), and meta-cognitive self-awareness and self-reflection (learning how to learn). Fink (2003) argues that, while Bloom’s cognitive taxonomy is widely used by college educators, it lacks some aspects of significant learning, such as learning how to learn, interpersonal skills, ethics, and the ability to adopt to change. Thus, new kinds of learning are needed that extend beyond the cognitive domain of learning. Fink’s taxonomy of significant learning provides a conceptual framework for identifying such experiences.
Exhibit 1: Taxonomy of Significant Learning
Learning Goals Specific Kinds of Learning
Foundational Knowledge Understanding and remembering
Application Skills development Critical, creative, practical thinking & Managing complex projects
Integration Connecting ideas, people, realms of life
Human Dimension Learning about oneself and others
Caring Developing new feelings, interests, and values
Learning How to Learn Becoming a better student Inquiring about a subject & Self-directing learners
Source: Fink (2003)
Fink (2003) emphasizes that all six components of significant learning are interrelated rather than hierarchical. The foundational knowledge provides the necessary basis for other kinds

Page 21
Academy of Educational Leadership Journal, Volume 15, Number 4, 2011
of learning. Application makes other kinds of learning useful. Learning to apply the foundational knowledge to different problems and situations shows students the value of what they learn and makes them care about the subject and motivates further learning. The human dimension adds personal and social significance to the material being learned and improves students’ understanding of themselves and others. Integration allows students to understand the connections among different concepts, ideas and people. This, in turn, enables students to see how the material relates to their personal lives and to that of others. The caring dimension adds personal motivation to the learning process: when people care about something, they tend to learn better and retain knowledge longer. Learning how to learn enables students to acquire skills for life-long learning that extends beyond a particular course or a subject matter. When all six components of significant learning are successfully implemented, students’ learning experiences become truly significant. Moreover, to achieve significant learning outcomes they must be explicitly designed into a course/curriculum.
Generally, teaching involves four major components: knowledge of the subject matter, design of instruction, teacher-learner interaction, and course management. Most college instructors hold terminal degrees and have a good command of their subjects. Teacher-learner interaction and course management aspects reflect specific ways the material is delivered and usually depends on the personalities of the faculty, as well as students. The instructional design in higher education, however, is the most significant bottleneck to better teaching and learning (Fink, 2003). More frequent than not, a course design is just a list of topics, assignments, exercises, and tests, arranged in a chronological order. It tends to focus on the subject matter rather than students, the content rather than learners. It emphasizes the organization of the information and supports only learning of the foundational knowledge and does not lead to long-lasting results. Fink (2003) argues that content-oriented teaching model should be replaced by a learning-centered course design. He proposed an integrated course design (ICD) model (Exhibit 2) as a learning-centered alternative to the traditional subject-learning approach. This model has been successfully applied to college courses and programs (Kolar at al, 2009; Fallahi et al. 2009). Exhibit 2: Integrated Course Design Model
Source: Fink (2003)
Teaching and Learning Feedback and Assessment
Learning Goals
Integration
Situational Factors

Page 22
Academy of Educational Leadership Journal, Volume 15, Number 4, 2011
The implementation of the ICD model consists of five steps: 1. An assessment of situational factors about the nature of the subject, students, time
structure, expectations, etc. 2. Defining learning goals using the taxonomy of significant learning. 3. Choosing and designing learning activities that will support learning goals. 4. Deciding on the feedback and assessment procedures. 5. Integrating all components.
Careful assessment of the situational factors is a critical step that must be taken prior to
the design of the other three major components. It ensures that all components of the model reflect students’ characteristics, the nature of the subject, and the institutional goals and expectations. Without this step, it would be impossible to design and implement a well-integrated learning process that meets the demands of both, the students and the instructor.
The next major step is to define the significant learning goals and connect them to the specific learning outcomes, using the taxonomy of significant learning (Exhibit 1). Given the nature of the subject, characteristics of the learner, and institutional expectations, this step should result in the outcomes that would reflect learning of foundational knowledge, its application and integration in the personal and social contexts, and students’ increased ability to become and continue to be self-directed learners. It is important to link the specific outcomes to the significant learning goals because it helps to keep the focus on the learner rather than the content. It also spurs thinking about teaching and learning activities that promote these kinds of learning.
The next step, selecting learning activities, should explicate what exactly students will do to achieve significant learning. Fink (2003) argues that the most effective teachers use active learning principles to design assignments and learning activities. They move away from the traditional “chalk and talk” lecture format toward rich learning experiences and reflection. Rich learning experiences call for students’ active participation, such as debates, role-playing, simulations, and the like, and “doing” rather than just passively listening and observing. These types of activities allow students to achieve multiple kinds of significant learning simultaneously. Another important component of active learning is students’ reflections on what is being learned. Thus, to promote significant learning, activities should include both the “doing” and the reflection.
The feedback and assessment step should incorporate more than mere grading. Grading is infrequent and backward-looking. In contrast, effective assessment should provide continuous feedback and be forward-looking. It should create a dialog between a student and a teacher. Moreover, it should enable students to monitor and evaluate their own learning. The main idea is to create a continuous cycle of “performance-feedback-revision-new performance” so that students become active participants in the learning and assessment process. These types of assessment and feedback should promote the learning process while providing the teacher and the learner with valuable feedback.

Page 23
Academy of Educational Leadership Journal, Volume 15, Number 4, 2011
The final step is to insure that all components are integrated. First, all components must be grounded in the situational factors, such as the characteristics of students, the nature of the subject, and the educational goals of the institution. Second, learning goals, specific learning activities, and assessment procedures should support and reinforce each other.
APPLYING THE ICD MODEL TO C-SCAPE Our Assessment of the Situational Factors
Fink (2003) suggests that instructional design in higher education is the most significant bottleneck to better teaching and learning. To ensure that C-scape is an effective, meaningful, and integrated sophomore year experience, We had to first situational factors specific to our institution and students that would impact the development of the program. What follows is the assessment of those factors and their impact. The Institution
Tabor School of Business is a part of Millikin University, a small Midwestern comprehensive liberal arts institution. The University was founded in 1902 specifically on the premise that the theoretical and the practical should exist equally in the university’s educational philosophy. The Tabor School’s curriculum is integrated across the four years between the different business functions and with very intentional use of both theory and practice. Expectations University expectations.
From time to time, Millikin University critically investigates and thoroughly debates its educational mission in today’s society and specifically how its role should impact our students’ education. Consistent with its foundation, Millikin believes that its role is to prepare students for success in a global environment while leading a life of meaning and value.
School/department expectations. Tabor School of Business embraces an integrated educational foundation designed for its
graduates’ professional and personal achievement. Consequently, C-scape should carry with it a number of indubitable expectations for the improvement of students’ success. Included in these expectations are the following:

Page 24
Academy of Educational Leadership Journal, Volume 15, Number 4, 2011
• Students who are more clearly aware of the connections between where they want to go and the path they are following now and who are therefore, more intentionally engaged with their majors, courses, and co-curricular activities
• Students who are more “self aware” regarding their values, interests, goals, strengths, skills, etc.
• Students who take greater control and responsibility sooner for identifying and following specific career directions
• Confident students who assertively expand their horizons for success and are more willing to push themselves instead of settling for what is comfortable
• Students who determine during this experience IF business is an environment conducive to their success; and if not, they and their advisor proactively determine a better avenue for their success
• Students who do confirm that Tabor’s program is appropriate also develop the information and background necessary to commit to a specific Tabor major through this experience
Professional expectations.
The Tabor School of Business prides itself on being a learning partner valued by the
community. Recognizing this, the C-scape program should aim to develop young professionals capable of evaluating their fit with a firm’s needs as well as the firm’s fit with the young professional’s personal set of values, interests, goals, skills, and capacities. If our program is successful, Tabor graduates should have the capability to add more value to a company they work for and to do so sooner, as they will likely have fewer challenges adapting to the work environment. Characteristics of the learner
Over 40 percent of Millikin students are first generation college students who attend Tabor as a means to become a professional, improve their lifestyle, and insure financial stability. The typical business student who will enroll in C-scape is 19 to 20 years old and is primarily from Illinois or surrounding states. Given our students’ age, C-scape had to be designed specifically with the millennials in mind. The program structure, delivery, and experiences should have been developed to capitalize on millennials’ unique experiences and skills while effectively dealing with their challenges. For instance, we needed to leverage millennials’ fascination with technology (Oblinger, 2003) and their preference to seek information on-line as opposed to in a textbook (Skiba & Barton, 2006). We needed to show students how to capitalize on their strengths and overcome their weakness regarding their knowledge and ability to seek and discern quality information (Oblinger & Oblinger, 2005). In designing C-scape, we also took into account the fact that millennials prefer bottom-up, the trial and error, approach to the

Page 25
Academy of Educational Leadership Journal, Volume 15, Number 4, 2011
top-down, concept-to-application, methods of problem solving (Oblinger, 2003). We also needed to be sensitive to their belief that doing is more important than knowing (Oblinger, 2003). And, while build into the process tools that help satisfy millennials’ need for immediate and constant feedback (Meister & Willyerd, 2010), we also had to design a process that teaches students how to reflect in such a way that they will emerge owning their decisions and their roadmap to success. Finally, in designing C-scape, we recognized millennials’ enthusiasm for social networking (Sujansky, 2009) and their preference for constructing knowledge within a social community (Skiba & Barton, 2006). Time structure
According to Schaller (2005), the longer students stay in focused exploration, the more comprehensive their exploration becomes and the more likely they are to make independent decisions. Consequently, we decided that C-scape needs to be a year-long process that would require students to take a panoramic view as they discover their personal and professional landscapes and how they intersect. Moreover, the program must be fully integrated across two semesters and between a student’s self-assessment and career discovery. Instruction
The two course sequence should be taught by faculty with expertise in personality, values, interests, and career assessments and who are knowledgeable about business careers and occupations. To this end, we should partner with the University Career Center to design and deliver these courses. Students would take a two credit course in the fall and a one credit course in the spring in which they complete a process of discovering self, exploring careers and occupations, and planning for their futures. Course requirements should be enriched and validated through a set of required experiential experiences (addressed later) designed to augment the student’s ability to effectively link personal development to professional aspirations. Advising
At Millikin University’s Tabor School of Business, students are assigned a business faculty member as an advisor when they are freshmen. As students make progress through C-scape, they should document their discoveries and achievements in an electronic career portfolio (addressed later). Students’ advisors then use this portfolio as a vehicle to discuss and ensure students’ progress toward their chosen majors and career paths. Learning Goals and Objectives
Given the situational factors outlined above, we developed three major learning objectives and matched them with significant learning goals from Fink’s ICD model (Exhibit 3).

Page 26
Academy of Educational Leadership Journal, Volume 15, Number 4, 2011
These objectives will later become major parts of students’ portfolios. They are outcome-based and measurable, which is imperative for assessment and student feedback.
Exhibit 3: C-scape Learning Objectives Significant Learning Goals Program Learning Objectives Foundational Knowledge Human Dimension & Caring
Students will discover their strengths, weaknesses, interests, values, and personality types through self-assessment.
Application Integration
Students will apply the self-assessment results to their career exploration, analysis, and decisions.
Integration Learning How to Learn
Students will develop two-year action plan, which reflects students’ personal, educational, and career objectives that fit their chosen career.
Learning Activities
To create significant learning experiences it is no longer possible to rely on a traditional lecture-discussion format. When designing C-scape, a variety of new learning tools were developed within the paradigm of active learning. The most powerful experiences are those that expose students to direct “doing” rather than listening and observing. Active learning is “anything that involves students in doing things and thinking about the things they are doing” (Bonwell and Eison, 1991, p. 2). The extant literature on the application of active learning documents significant advantages of alternative teaching methods over the traditional “chalk and talk” lectures (e.g., Siriopoulos and Pomonis, 2006; Felder and Brent, 2003). Effective implementation of active learning requires selecting learning activities that combines information, experiences and reflection (Fink, 2003).
Exhibit 4 describes C-scape’s learning objectives and examples of the variety of learning activities students will experience. Participation in this wide variety of activities is expected to connect students’ self assessment outcomes with the careers and occupations which provide them the greatest opportunity for personal and profession success. An example of an activity designed to meet the first learning objective is the skills assessment exercise which assists students in identifying their strengths and weaknesses. Other activities related to objective one help students relate their discovery of self in terms that will help them leverage their strengths and compensate for deficits over the remainder of their college careers.
The second objective focuses on developing synergy between self-assessment and career decisions through the process of exploration and analysis. This process is designed to be reflective in nature and is expected to take a full academic year. A number of activities will feature significant alumni involvement. For example, by participating in the year long Alumni Round Table (ART) program, students will network with alumni representing the various business majors and will attend semi-structured discussions with alumni representing specific disciplines and sub-disciplines. For instance, a student interested in marketing might participate in round tables lead by alums involved in market research, sales, integrated marketing

Page 27
Academy of Educational Leadership Journal, Volume 15, Number 4, 2011
communications, advertising, product management, etc. Another activity involves students in an externship where they would spend two to five days working alongside a Millikin alum who is a CEO or senior executive. This experience incorporates significant time for discussions and debriefing. Students will compete for limited spots in this program. Because of activities such as these, we believe C-scape will have greater impact on the amalgamation of student self-discovery with career discovery than most programs we examined.
Exhibit 4: Learning Activities Significant Learning Learning Objectives Activities Examples
Foundational Knowledge Human Dimension Caring
Students will discover their strengths, weaknesses, interests, values, and
personality types through self-assessment.
Self-assessment exercises to discover and reflect on personal,
professional and social skills
Interest assessment Personality assessment
Values assessment Skills assessment Reflective writing
Application Integration
Students will apply the self-assessment results to their
career exploration, analysis, and decisions.
Explore personal, professional and social skills requirements
for a particular career and explore career/industry fit. Connect the results of self-
assessment to specific occupations that fit career
aspirations, personal values and skills set
Personal branding exercises Positive attributes identification
Exploring business majors Alumni and career roundtables
Interview skill development Job/Internship search techniques Networking skill development
Externships Resume/Cover Letter development
Integration Learning How to Learn
Students will develop a two-year action plan, which
reflects students’ personal, educational, and career objectives that fit their
chosen career.
Reflect on career portfolio and develop a two-year plan to further expand personal,
professional and social skills
Goal setting exercise Reflective writing on the best fit
majors and connection to possible careers
To achieve the final objective, students will develop a two year action plan for the
remainder of their college experience. Using their previously selected career paths and up to three related occupations, students will develop a detailed two year curricular, co-curricular, and extra-curricular plan for continued self and professional development that affords them the best opportunity to succeed in their selected careers and occupations. This plan identifies avenues that best enhance the student’s chances to attain their goals and might include such things as coursework, internships, leadership positions, conferences, and involvement in professional organizations. Feedback and Assessment: Career Portfolio
The primary tool that should help us track progress and outcomes in C-scape is an electronic career portfolio (e-portfolio). E-portfolios have been recognized as an asset that

Page 28
Academy of Educational Leadership Journal, Volume 15, Number 4, 2011
supports macro level learning goals (Heinrich et al. 2007). Instructors can use it to determine whether the assignments lead students to develop good understanding of how to apply the material in practice. Advisors can use it to decide whether students need more directions in choosing a career and a major. Moreover, this tool helps to check that assignments and activities are in line with the educational objectives (Heinrich et al. 2007; Clark, 2009). Educators find that e-portfolios are particularly well suited as a tool to assign and supervise a variety of tasks that lead to a richer educational experience by including a clear list of the learning goals, or skills the students are expected to develop and linking them to assignments (Heinrich et al. 2007; Clark, 2009). E-portfolios also help shift the students’ focus from managing individual assignments to reflecting on their overall development (Heinrich et al. 2007).
If students are to develop life-long skills it is imperative that they both see and understand the process they experience. Students can see the learning goals as they go through the learning process and use feedback from instructors and advisors to better understand what skills or material has been mastered and what needs more attention. As a feedback tool e-portfolios provide students with a resource that takes them through a process of asking a series of open-ended questions that have no right or wrong answer. Students can then develop responses to those questions and, through discovery and reflection, determine if the response is appropriate to them at that stage in their lives. As students’ lives and conditions change they can refer to the method of question and reflection again using the e-portfolio as a framework for identifying a question and collecting information and insight to identify a course of action.
Potential employers may also provide useful feedback and external validation that the learning goals address the needs of industry. For example, Heinrich et al. (2007) found that employers are seeking individuals who have demonstrate initiative, interest and commitment. Employers have identified e-portfolios as a means to show a commitment to lifelong learning (Heinrich et al. 2007). The e-portfolio provides students with the means to demonstrate a commitment to their careers by taking the initiative to continue using the e-portfolio after the initial assignments have been made.
Finally, an e-portfolio helps students demonstrate an ability to apply seemingly unrelated information in creative ways, which demonstrate problem-solving skills, innovation, and a capacity to learn (Heinrich et. al, 2007). For most, a career path takes many turns and the combination of opportunities and setbacks can lead to a seemingly disparate list of experiences and skills (Bolles, 2009). E-portfolios can provide students with the tools and the framework needed to help students better understand what they can bring to the table when participating in the workforce. Equally important, the e-portfolio can provide the same tools and framework that helps students reflect and grow in their understanding of themselves, which ultimately benefits the students for their lifetime.
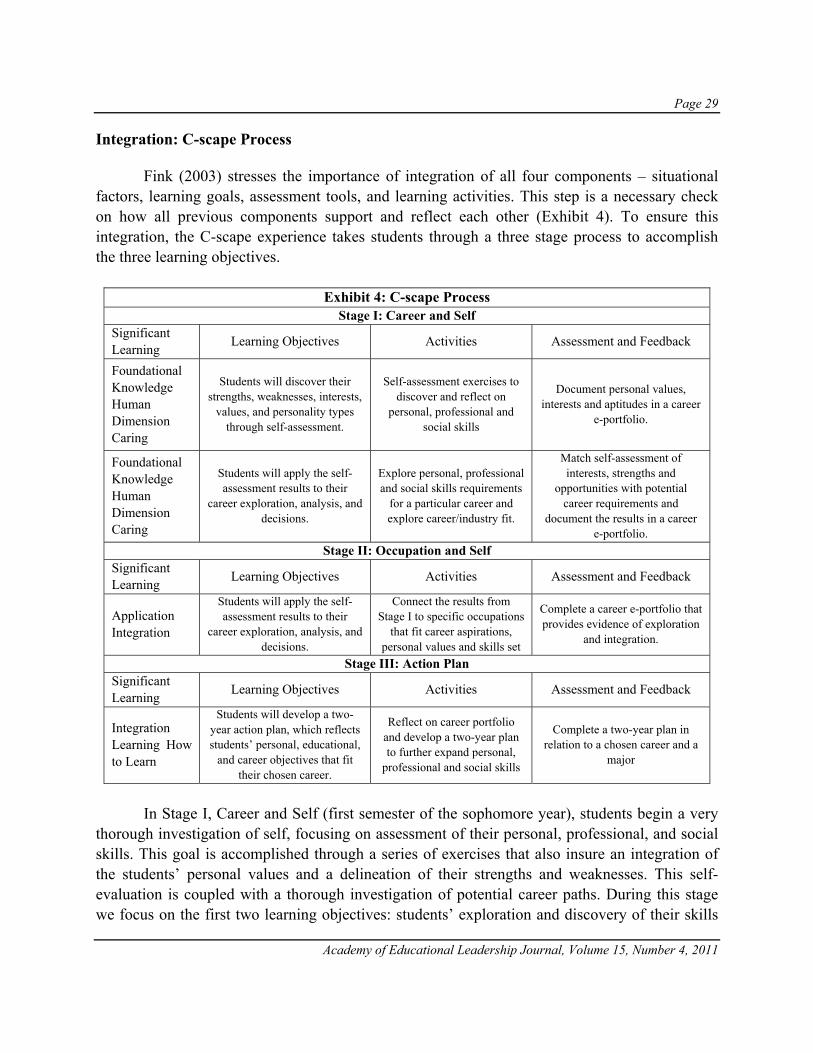
Page 29
Academy of Educational Leadership Journal, Volume 15, Number 4, 2011
Integration: C-scape Process
Fink (2003) stresses the importance of integration of all four components – situational factors, learning goals, assessment tools, and learning activities. This step is a necessary check on how all previous components support and reflect each other (Exhibit 4). To ensure this integration, the C-scape experience takes students through a three stage process to accomplish the three learning objectives.
Exhibit 4: C-scape Process
Stage I: Career and Self Significant Learning Learning Objectives Activities Assessment and Feedback
Foundational Knowledge Human Dimension Caring
Students will discover their strengths, weaknesses, interests,
values, and personality types through self-assessment.
Self-assessment exercises to discover and reflect on
personal, professional and social skills
Document personal values, interests and aptitudes in a career
e-portfolio.
Foundational Knowledge Human Dimension Caring
Students will apply the self-assessment results to their
career exploration, analysis, and decisions.
Explore personal, professional and social skills requirements
for a particular career and explore career/industry fit.
Match self-assessment of interests, strengths and
opportunities with potential career requirements and
document the results in a career e-portfolio.
Stage II: Occupation and Self Significant Learning Learning Objectives Activities Assessment and Feedback
Application Integration
Students will apply the self-assessment results to their
career exploration, analysis, and decisions.
Connect the results from Stage I to specific occupations
that fit career aspirations, personal values and skills set
Complete a career e-portfolio that provides evidence of exploration
and integration.
Stage III: Action Plan Significant Learning Learning Objectives Activities Assessment and Feedback
Integration Learning How to Learn
Students will develop a two-year action plan, which reflects students’ personal, educational,
and career objectives that fit their chosen career.
Reflect on career portfolio and develop a two-year plan to further expand personal,
professional and social skills
Complete a two-year plan in relation to a chosen career and a
major
In Stage I, Career and Self (first semester of the sophomore year), students begin a very
thorough investigation of self, focusing on assessment of their personal, professional, and social skills. This goal is accomplished through a series of exercises that also insure an integration of the students’ personal values and a delineation of their strengths and weaknesses. This self-evaluation is coupled with a thorough investigation of potential career paths. During this stage we focus on the first two learning objectives: students’ exploration and discovery of their skills

Page 30
Academy of Educational Leadership Journal, Volume 15, Number 4, 2011
strengths and weaknesses, with further application of the results to potential career paths. The outcomes are assessed using a career portfolio, where students document personal values, interests, and aptitudes and then match them with the requirements of a particular career.
Stage II, Occupation and Self (second semester), focuses on connecting the results of the first stage to specific occupations that meet students’ values, career aspirations, and skill sets. Students examine how well their strengths, weaknesses and values fit with various occupations. Specifically, they identify areas for personal and professional improvement and develop implementation strategies.
Approaching the end of the C-scape experience, students will complete Stage III – Action Plan where they will develop personal two-year action plans that focus on intentional improvement and expansion of their personal and professional skills. Students will be encouraged to change, extend, add and/or modify their major in ways that have the greatest potential and opportunity for success.
CONCLUSION
For more than 50 years, those in higher education have recognized the ‘sophomore slump’ and yet, there is very little research on what and how to effectively overcome it (Lipka, 2006; Tobolosky & Serven, 2007; Toosi, 2004). C-scape, presented here, is one university’s unique sophomore year integrated learning experience, designed to help students to plan their careers. It is takes students through a comprehensive process of discovering and integrating their personal and professional landscapes by giving them a compass and helping them to map necessary steps. C-scape is a systematic process that internally connects students’ decisions to their interests and values and moves students to commitment by developing their personal plan for the future.
To develop a comprehensive sophomore year program we turned to a new model of significant learning experiences proposed by Fink (2003) that emphasizes the integration of learning goals, learning activities and assessment. Given today’s students, this model is particularly appropriate because it is designed to actively engage students in the process of taking responsibility for their own learning and their future personal and professional success. There are many aspects of the ICD model that prompted the authors to adopt it as the underpinnings for the C-scape program. However, nothing in the model fits our institution’s culture closer than the model components: the theoretical, the practical, and the integration. At the heart of the C-scape program is the belief that students must develop workable career plans for their remaining two years and, to accomplish this, students must be guided and encouraged to apply the art of discovery to the challenge of determining their potential career paths.

Page 31
Academy of Educational Leadership Journal, Volume 15, Number 4, 2011
REFERENCES Baxter Magolda, M. B. (2001). Making their own way: Narratives for transforming higher education to promote
self-development. Sterling, VA.: Stylus. Bloom, B. S., ed. (1956). Taxonomy of educational objectives. The classification of educational goals handbook I:
Cognitive domain. New Yoerk: McKay. Bolles, R. N. (2009). The 2009 what color is your parachute? : a practical manual for job-hunters and career-
changers. Berkeley, CA: Ten Speed Press. Bonwell, C. C., & Eison, J. A. 1991. Active learning: Creating excitement in the classroom. (ASHE_ERIC Higher
Education Report No. 1). Washington, D.C.: George Washingtin University. Clark, T. (2009). 21st centruy scholars. Educational Leadership, 67(1), 66-70. Debard, R. D. (2004). Millennials coming to college. In R. D. Debard & M. D. Coomes (Eds.), Serving the
millennial generation: News directions for student services (pp. 33-45). San Francisco: Jossey-Bass. Evenbeck, S. E., Boston, M., DuVivier, R. S., & Hallberg, K (2000). Institutional approaches to helping
sophomores. In L. A. Schreiner & J. Pattengale (Eds.), Visible solutions for invisible students: Helping sophomores succeed [Monograph No. 31, pp. 79-87]. Columbia, SC: University of South Carolina, National Resource Center for The First-Year Experience and Students in Transition.
Fallahi, C. R., Levine, L. E., Nicoll-Senft, J. M., Tessier, J. T., Watson, C. L., & Wood, R. M. (2009). Using fink’s
integrated course design: How a book changed our students’ learning, our university, and ourselves. New Dimensions for Teaching and Learning, 119 (Fall).
Felder, R.M., & Brent, R. (2003).Learning by Doing. Chemical Engineering Education, 37(4), 282-283 Fink, L. D. (2003). Creating significant learning experiences: An integrated approach to designing college courses.
San Francisco: JosseyBass. Fink, L. D., & Fink, A. K. (Eds.) (2009). Designing courses for significant learning: Voices of experience. New
dimensions for Teaching and Learning, 119 (Fall). Freedman, M. B. (1956). The passage through college. Journal of Social Issues, 12(4), 13-28. Gardner, P. D. (2000). From drift to engagement: Finding purpose and making career connections in the sophomore
year. In L. A. Schreiner & J. Pattengale (Eds.), Visible solutions for invisible students: Helping sophomores succeed [Monograph No. 31, pp. 67-77]. Columbia, SC: University of South Carolina, National Resource Center for The First-Year Experience and Students in Transition.
Gardner, J. N., Pattengale, J., & Schreiner, L. A. (2000). Summary and recommendations. In L. A. Schreiner & J.
Pattengale (Eds.), Visible solutions for invisible students: Helping sophomores succeed [Monograph No. 31, pp. 89-93]. Columbia, SC: University of South Carolina, National Resource Center for The First-Year Experience and Students in Transition.

Page 32
Academy of Educational Leadership Journal, Volume 15, Number 4, 2011
Heinrich, E., Bhattachayra, M.,& Rayudu, R. (2007). Preparation for lifelong learning using ePortfolios. European Journal of Engineering Education, 32(6), 653–663.
Kolar, R. L., Sabatini, D. A., & Muraleetharan, K. K. (2009). Sooner city: Reflections on a curriculum reform
project. New Dimensions for Teaching and Learning, 119(Fall). Lemons, L. J., & Richmond, D. R. (1987). A developmental perspective of sophomore slump. NASPA Journal,
24(3), 15-19. Lipka, S. (2006). After the freshman bubble pops. Retrieved June 1, 2010 from http://chronicle.com Section:
Students Volume 53, Issue 3, Page A34. Meister, J. C. & Willyerd, K. (2010). Mentoring mill: delivering the feedback gen y craves is easier than you think.
Harvard Business Review, (May), 68-72. National Association of Student Personnel Administrators (2010). Retrieved June 1, 2010 from
http://www.naspa.org. National Resource Center for the Freshman Year Experience and Students in Transition. (2005). Sophomore year
initiatives survey. Retrieved June 1, 2010, from http://www.sc.edu/fye. Oblinger, D. (2003). Boomers, gen-xers, and millennials: Understanding the “new students.” EDUCAUSE Review,
(July/August), 37-47. Oblinger, D., & Oblinger, J. (Eds.) (2005). Educating the Net Gen. Washington, DC: EDUCAUSE. Prensky, M. (2001). Digital natives, digital immigrants, part II: Do they really think differently. On the Horizon.
9(6). Reeves, T. C. and Oh, E. J. (2007). Do generational differences matter in instructional design? In J. M. Spector, M.
D. Merrill, J. vanMerrienboer, & M. P. Driscoll (Eds.), Handbook of Research on Educational Communications and Technology (pp. 897-924). Taylor and Francis, Inc.
Schaller, M. (2005). Wandering and wondering: Traversing the uneven terrain of the second college year. About
Campus, July-August, 17-24. Siriopoulos, C. & Pomonis, G.A. (2006, May). Alternatives to “Chalk and Talk’: Active vs. Passive Learning – A
Literature Review of The Debate. Available at SSRN: http://ssrn.com/abstract=977283 Skiba, D. J., & Barton, A. J. (2006). Adapting your teaching to accommodate the net generation of learners, The
Online Journal of Issues in Nursing. 11(2). Retrieved June 1, 2010 from http://www.nursingworld.org. Sujansky, J. G. (2009, November 1). Spoiled, impatient, & entitled: why you need strong millennials in your
workplace. Retrieved June 1, 2010 from http://www.allbusiness.com/company-activities-management/operations-office-management/13588085-1.html.

Page 33
Academy of Educational Leadership Journal, Volume 15, Number 4, 2011
Tobolowsky, B. F. & Serven, S. K. (2007). Introduction. In B. F. Tobolowsky & B. E. Cox (Eds.) Shedding Light on Sophomores: An Exploration of the Second Year to Beyond the First College Year [Monograph No. 47, pp. ix-xii]. Columbia, SC: University of South Carolina, National Resource Center for the First Year Experience and Students in Transition. Retrieved June 1, 2010 from http://www.sc.edu/fye/publications/monograph/excerpt/M47excerpt.pdf.
Toosi, N. (2004, September 16). Second-year programs aim to provide helping hand to college’s wise fools.
Milwaukee Journal Sentinel Online. Retrieved June 1, 2010, from http://www3.jsonline.com.

Page 34
Academy of Educational Leadership Journal, Volume 15, Number 4, 2011
Page 35
Academy of Educational Leadership Journal, Volume 15, Number 4, 2011
DIFFERENCES OF STUDENTS’ SATISFACTION WITH COLLEGE PROFESSORS:
THE IMPACT OF STUDENT GENDER ON SATISFACTION
Kristen M. Maceli, Pittsburg State University
Christine E. Fogliasso, Pittsburg State University Donald Baack, Pittsburg State University
ABSTRACT
This study examines whether the student’s gender impacts his or her perceptions of the
classroom experience. Student satisfaction with a class, and ultimately a university, are influenced by relationships with instructors, as well as success in the classroom. It is conceivable that if student and/ or instructor gender affects student satisfaction levels, that these expectations could carry over into the workforce. This study seeks to identify commonalities among genders, and recognizes that some factors related to satisfaction with a professor can be controlled and some cannot.
INTRODUCTION Students in university settings have many varied expectations of professors. At the very least, they expect for them to be competent in an area of expertise and that the will provide engaging and helpful experience that assists students in achieving their goals. Trends in the workforce are often reflected in academic trends. More women attend college now then in past years, and more women are part of the workforce. In academics, however, male professors greatly outnumber female professors. “The number of professors per 10,000 adults in the United States—what we might call the academic intellectual ratio—has increased dramatically in this century... By and large this dramatic growth in the number and proportion of academic intellectuals has been a male phenomenon. Male professors have outnumbered female professors by about three to one since the turn of the century” (Anderson, p.35). Gender affects the ways in which students learn as well as their needs in the classroom environment (James, In press). In general females tend to be more verbal, while males respond more to visual stimulation. Females seem to have a keener sense of reading body language, while males have more of a need for activity (James, In press). Females have traditionally been expected to speak in ways different than males, more “lady-like” (Lakoff, 1975). As such, a

Page 36
Academy of Educational Leadership Journal, Volume 15, Number 4, 2011
female instructor may have preconceived notions of how she should sound and act; this could be affected by her age, as societal expectations have changed. Her students may have expectations as well. A male instructor may not feel these same constraints. These factors could contribute to how an instructor presents information, and ultimately, how it is received. Further, gender differences could affect how students potentially learn and thrive in a classroom environment, and even what could potentially cause the reverse. Future success is often related to satisfaction with a classroom experience. Therefore, it is conceivable that a classroom environment could be effects by differences gender. What helps one gender may not help the other, and vice versa. This study seeks to determine how gender differences can affect classroom experiences. In particular, it examines the relationship between student gender and subsequent satisfaction with the instructor, by accounting for the professor's gender. It is possible that students will be more satisfied with instructors of their gender. Additional attention is given to with regard to respect issues, or the degree to which professors are respected by students. It is suggested that students will favor male instructors. Age will also be considered as a control variable.
Based on past literature, the following issues are addressed:
1. Do males experience courses differently than females? 2. When taking into account control issues, such as instructor age, if the student wants to be
attending college, and the students’ major, is student satisfaction affected? 3. Does gender identification (students and instructors having the same gender) affect
student satisfaction—are students more satisfied by instructors of their gender? 4. Do classroom respect issues, such as knowing a professor’s tile and following classroom
policies, and the manner in which a course is presented by the instructor, affect student satisfaction?
The above issues are important because student satisfaction with instruction can impact their learning. Improved student involvement and satisfaction can lead to improved learning. Ultimately, gender identification issues could also carry over into the workforce, and be especially germane to new employee and manager training. “Sixty-one million women directly influence the American workforce today; gay and lesbian rights fill legislative proposals; and social conditions constantly shift expectations and circumstances between the sexes” (Florence and Fortson, p. 5). This paper begins with a literature review regarding teaching performance, satisfaction with teaching and the effects of gender on perceptions of those variables. Basic hypotheses are offered. Next, the design of this study will be described. The findings are then analyzed and preliminary conclusions are drawn.

Page 37
Academy of Educational Leadership Journal, Volume 15, Number 4, 2011
LITERATURE REVIEW Evaluating teaching performance is difficult and subjective. More often than not, students are responsible for the evaluation process, which leaves much potential for debate regarding validity and reliability. While many in academe have differing opinions about the process and use of evaluations, most would not argue that it should be abandoned. Even though reasons for evaluations include to improve performance and evaluation for personnel decisions, the ultimate goal is to guide students (Seldin, p.4-6). Perhaps it is the affect that instructors have students that make the evaluations so important yet controversial. Performance evaluations are necessary in all organizations, not just academic, but it is in academic institutions that the impact of the performance being evaluated can sometimes have greater exponential effects. Students in university settings have numerous and varied expectations of professors. Although the traditional triad of professorial duties includes teaching, research, and service, students are often aware of only the teaching element. That is the part of a professor’s day which students see and constitutes the part that most directly affects them. Today’s economic climate has resulted in financial difficulties for many, including those whose goal is to achieve a college degree. Tuition costs are continuing to arise, and (by and large) students’ ability to pay those costs is being challenged as never before. And with those rising costs of attending college come rising expectations from the consumers of the service (i.e., students). Students expect professors to have teaching expertise. They expect teachers to possess superior communication skills and the ability to artfully engage students in the learning process. Many today’s students have spent untold hours in front of computer screens, television sets, and in movie theaters. Those situations are environment in which participants take a primarily passive role, waiting for the medium in which they are participating to engage them and draw them in to the experience. To a great extent student expectations are similar with regard to the education experience and its providers--teachers. Student satisfaction with a class, and ultimately a university, is impacted not only by success in the class, but also by relationships with instructors. At the same time, although effective teaching is acknowledged as important, it is not an easy concept to measure—in fact, individuals often differ as to whether or not they regard a particular teacher to be a “good” educator. One may be reminded of the words of Supreme Court Justice Potter Stewart in Jacobellis v. Ohio, 378 US 184 (1964). When discussing the difficulty of defining obscenity, he wrote that, although he could “never succeed in intelligibly” defining it, nevertheless concluded “But I know it when I see it.” No objective method for measuring teaching performance exists (Berk, p. 4). Given this difficulty in measuring teaching, it is no surprise that few issues in higher education spark as much heat as the evaluation of faculty performance. Everyone in academe seems to have an opinion—often biased by personal experiences—but few claim the necessary detachment for an in-depth understanding of the subject (Seldin, p. vi).

Page 38
Academy of Educational Leadership Journal, Volume 15, Number 4, 2011
Even in situations where consensus that a particular professor is perceived to be a “good teacher,” little agreement about why that is the case may be discovered. Some have suggested that the grade which students expect to receive in the class plays into student evaluations of instructors (Marsh, p 30). Another possibility is that student gender differences affect how they react to the classroom environment, and therefore evaluations of professors (James, in press). Student perceptions that a class is or is not difficult can also affect perceptions of the teacher’s effectiveness (Marsh, p. 27). A student’s interest, or lack thereof, in the course's subject matter can also influence evaluations of the instructor. Course satisfaction is a critical component in improving learning achievement in the traditional classroom and the distance education environment (Chang and Smith, p. 412). As noted above, students’ expectations, with regard to both the grade expected and also course satisfaction, are important. The maxim that posits “expecting success leads to success” may be at least partially true. In a recent study, the researchers discovered that if women were not confounded by gender roles, their own expectations for success changed. In the study, women formed study groups and felt more confident about their place in mathematics courses. Overall, when this comfortable environment was created, “Women could be themselves and not feel oppressed by gender roles and expectations” (Steele, Levin, Blecksmith, Shahverdian, p.31). Even though women viewed themselves differently and more confidently, preconceived notions of their families and friends were more difficult to change. “The findings relating to friends and families did have sobering implications. Families in particular saw their successful daughters as either ‘geniuses’ or aberrations. The underlying preconception that women are uncommon in higher level mathematics remained undisturbed. They continually needed to explain themselves to female and male peers, the major difference being that with their explanations they grew in self-confidence. If those who recognized the young women’s abilities expressed their pride by calling them ‘geniuses,’ those who did not understand their work also alluded to their mental capacities, considering them ‘crazy’ or ‘weird.’ Such comments underscore the way in which the public remains incapable of considering women’s success in mathematics as ordinary or normal” (Steele, et. al, p.31). Many studies have been undertaken to identify the effectiveness of on-line learning. In that environment, the student becomes more dependent on the instructor, as they do not have classmates and the social environment of a classroom. Moore (2002) stated that social interactions prompted by the instructor and prompt instructor feedback were both linked to student satisfaction with the course. The most significant contributor to perceived learning in these online courses was the interaction between the instructor and the students. Students reported that the higher level of interaction with the instructor or classmates led to higher levels of learning in the course” (Chang and Smith, p.409). “Course satisfaction is a critical component in improving learning achievement in the traditional classroom and the distance education environment” (Chang and Smith, p.412).

Page 39
Academy of Educational Leadership Journal, Volume 15, Number 4, 2011
Gender differences are apparent in the types and frequency of on-line interactions in computer-mediated discussions. As these types of discussion have become an integral part of teaching in colleges and universities, as an opportunity emerges to promote a somewhat anonymous form of discussion—without regard to gender, race, class, and other socially constructed categories. Many educators believe this form of communication might become an equalizer to those who feel as though they have been “marginalized” by normal classroom settings (Fauske and Wade, 2003-2004). Theoretically, all students can be heard or hold the floor as long as they wish. Recent research indicates significant differences among discussions of men and women. “…men’s postings tended to be lengthy and frequent, characterized by strong assertions, authoritativeness, distancing, self-promotion, and in some instances flaming—that is criticism, ridicule, and put-downs” (Fauseke and Wade, p.138). Gender cannot be changed; however, classroom environments can. As such, it is conceivable, that with proper feedback, professors can improve performance and ultimately improve the learning environment for the students. “It is held that the feedback from a range of evaluations can produce in a teacher the kind of dissonance or dissatisfaction that sets the psychological stage for change” (Seldin, p.4). Based on this review of the literature, the following hypotheses are offered:
Hypothesis 1: There are differences between student genders as to how satisfied they will be with an
instructor. Hypothesis 2: Student and instructor gender as well as classroom respect issues can impact student
satisfaction levels with instructors.
RESEARCH DESIGN The sample included 328 students from a mid-western university with an annual enrollment of approximately 7,900. Surveys were administered in the college of business, with 190 students (58.1%) reporting themselves as business majors and 137 (41.9%) reporting themselves as non-business majors. Ninety-two percent of the students reported that they were of junior or senior status. The sample included 194 males (59.1%) and 134 (40.9%) females. The study sought to determine whether student or instructor gender and classroom respect issues affected student satisfaction with instructors. Two male and two female instructors gathered data. One male and one female were approximately the same age, and the other male and female instructors were approximately the same age. Approximately 10 years separated the ages of the sets of instructors. The younger professors were both Assistant Professors, while the older professors had attained the rank of University Professor. The older female professor has won numerous “Teacher of the Year Awards”. As such, it was noted that her student evaluations could possibly skew the results. Variables for the study included student gender, instructor gender, instructor age, whether or not the student was attending college because they wanted to, student major, gender match of

Page 40
Academy of Educational Leadership Journal, Volume 15, Number 4, 2011
student and instructor, the student’s satisfaction with course presentation, whether the student followed classroom policies regarding cell phone use, and whether the student knew the instructor’s title. A reliability of scale analysis was run to determine if the survey variables regarding satisfaction with the instructor—instructor demeanor, instructor knowledge, instructor’s control of the classroom, and the instructor’s encouragement of class participation—could be combined. The Cronbach’s Alpha coefficient was .918. The Cronbach’s Alpha coefficient’s if items were deleted were .879 for instructor demeanor, .881 for instructor knowledge, .881 for instructor control of classroom, and .908 for instructor’s encouragement of participation. Since all were lower than the combined, all remained in the study. An independent sample t-test was initially run to determine if there were significant changes of instructor satisfaction based on student gender. Correlations were run to identify significant variables. Then, the data file was split by student gender and correlations for the data were obtained. Hierarchical linear modeling was then used to determine the combined variable effects on student satisfaction. Student satisfaction was the dependent variable. Independent variables were presented in three steps. The first step included the control variables of instructor age, if the student was attending college because he or she wanted to, and major (business or non-business). Step two introduced gender match of instructor and student. Step three added the variables course presentation, whether the student follows classroom policies regarding cell phone use, and whether the student knows the professor’s professional title.
FINDINGS
Hypothesis 1: There are differences between student genders as to how satisfied they are with an instructor.
An initial t-test was run to determine if gender had any significance to student ratings of satisfaction with their instructors. Both genders were on the high end of satisfaction scale. Standard deviation for the males was .518, while standard deviation for the females was .850. The t-tests revealed significant differences at p<.05 level (p=.007). Students had rated instructors on a scale of one to five, with one being the highest rating for satisfaction. Male student satisfaction had a mean of 1.33, while females had a mean of 1.55. Although a large difference among means was not present the analysis indicated that the difference was significant. Thus the first hypothesis was thus confirmed with mild support.

Page 41
Academy of Educational Leadership Journal, Volume 15, Number 4, 2011
CORRELATIONS The combined gender data set produced the following correlation matrix:
Pearson correlation, Sig. *p<.05
Satisfac with
instructor
Student Gender
Instructor age
Want to be at college
Major Gender
match to instructor
Course presenta-
tion
Follow cell
phone policies
Know instructor
title
Satisfaction with instructor
1 .161 .003*
.274 .000*
-.009 .870
.116 .036*
.028
.617 .735 .000*
.050
.367 .149 .007*
Student gender
.161 .003* 1 .114
.040* -.138 .013*
-.128 .021*
-.324 .000*
.064
.249 -.046 .407
.053
.335 Instructor age
.274 .000*
.114 .040* 1 -.019
.735 .121 .029
.055
.323 .325 .000*
.065
.240 .295 .000*
Want to be at college
-.009 .870
-.138 .013*
-.019 .735 1 -.127
.021* -.047 .399
.056
.316 -.004 .937
-.072 .192
Major .116 .036*
-.128 .021*
.121 .029*
-.127 .021* 1 .107
.053 .147 .008*
.169 .002*
.211 .000*
Gender match to instructor
.028
.617 -.324 .000*
.055
.323 -.047 .399
.107
.053 1 .016 .779
.041
.455 .045 .418
Course presentation
.735 .000*
.064
.249 .325 .000*
.056
.316 .147 .008*
.016
.779 1 .029 .602
.144 .009*
Follow cell phone policies
.050
.367 -.046 .407
.065
.240 -.004 .937
.169 .002*
.041
.455 .029 .602 1 .112
.042*
Know instructor title
.149 .007*
.053
.335 .295 .000*
-.072 .192
.211 .000*
.045
.418 .144 .009*
.112 .042* 1
Significant variables to satisfaction with instructor were:
Table 1. Significant variables to student satisfaction with instructor
Satisfaction with instructor correlated to: Pearson coefficient p value (p<.05) Student gender .161 .003 Instructor gender .274 .000 Major .116 .036 Course presentation .735 .000 Know instructor’s title .149 .007
Of note, course presentation had the strongest relationship to student satisfaction with instructors, with a Pearson coefficient of .735. As noted, males constituted a larger portion of the sample (59.1%). Consequently, the data set was then split and correlations obtained to identify any differences among gender when correlated to satisfaction with instructor. The correlation results include only student satisfaction with instructor compared to the independent variables. Results of the male student correlations are as follows:

Page 42
Academy of Educational Leadership Journal, Volume 15, Number 4, 2011
Table 2. Male student significant correlations
Satisfaction with instructor correlated to: Pearson coefficient p value (p<.05) Course presentation .647 .000 Instructor gender -.458 .000 Gender match with instructor -.458 .000
Correlations for female students indicated the following significant variables correlated to satisfaction with instructor:
Table 3. Female student significant correlations Satisfaction with instructor correlated to: Pearson coefficient p value p<.05 Course presentation .817 .000 Know instructor’s title .318 .000 Major (Business/non-business major) .246 .004 Instructor gender -.554 .000 Gender match with instructor -.554 .000 Instructor age .467 .000
These correlations indicate that course presentation and instructor gender were significant variables for both genders. Course presentation had the strongest relationship to satisfaction with instructor. Both genders reported higher satisfaction levels with female instructors; however, female non-business majors were more satisfied than business majors. This could be due to the fact that many non-business majors must take business courses as curriculum requirements. The classes may have exceeded their expectations. Other significant variables for females included knowing the instructor’s title and major. Females tended not to know the instructor’s title, though the correlation was significant. Again, these findings indicate differences in the reactions of male and female students to professors, as hypothesized.
Hypothesis 2: Student and instructor gender as well as classroom respect issues can impact student satisfaction levels with instructors.
A regression model was built using satisfaction with the instructor as the dependent variable and the independent variables of instructor age, students desire to attend college, major, gender match of instructor and student, course presentation, if the student follows cell phone policies, and if the student knows the title proper professional title of the instructor. Hierarchical linear modeling was used to determine the combined variable effects on student satisfaction. Independent variables were presented in three steps. The first step included the control variables of instructor age, if the student was attending college because he or she wanted to, and major (business or non-business). Step two introduced gender identification (if student and instructor genders were the same). Then, step three added variables course presentation, whether the student follows classroom policies regarding cell phone use, and whether the student knows the professor’s professional title.

Page 43
Academy of Educational Leadership Journal, Volume 15, Number 4, 2011
Table 4.
Summary of Hierarchical Regression Analysis for Variables Predicting Student Satisfaction with Instructors
Variables Sig. F Change R Square R Square change
Significant F Change
MALES Step 1
-Major -Instructor age -Wanted to be in college
.272 1.313 .020 .020 .272
Step 2 Gender match .000* 14.295 .233 .213 .000*
Step 3 -Follow cell phone policies -Know instructor title -Course presentation
.000* 26.478 .500 .267 .000*
FEMALES Step 1
-Major -Instructor age -Wanted to be in college
.000* 13.389 .236 .236 .000*
Step 2 Gender match .000* 32.011 .498 .262 .000*
Step 3 -Follow cell phone policies -Know instructor title -Course presentation
.000* 55.734 .756 .258 .000*
Control Variables Male satisfaction levels with their instructors were not impacted by the control variables of major, instructor age, and if they wanted to be in college or not. For females, these same variables were significant and explained 23% of the variance is satisfaction with the course. This suggests support for the first hypothesis, that males and females experience the classroom in different ways. Gender Match As shown, it was not a match of gender that predicted satisfaction with the course. Males tended to be more satisfied with female instructors. Females also preferred female professors. The popularity of the one female professor in part explains this finding. Classroom Respect Issues For both genders, classroom respect issues had a major impact on the amount of explained variance in satisfaction with the course and professor. Classroom respect issues had the largest impact on explained variance for both males and females.
CONCLUSIONS The overriding conclusion of this study is that while gender does affect the classroom experience, instructors and the environment they create ultimately impact learning the most.

Page 44
Academy of Educational Leadership Journal, Volume 15, Number 4, 2011
Course presentation is something instructor’s can control—gender is not. Gender matching is more relevant to females than males, but both male and female students are more influenced by classroom environment and respect issues. Instructor age was also more important to females, with younger professors tending to be given rated with higher satisfaction levels. As a result, the findings suggest that professors are advised to set clear expectations in the classroom with regard to both course content and courtesy issues such as insisting students refrain from using a cell phone or texting during class time. Any penalties for violation of these policies should be routinely enforced. The raw data for this research indicated that students were far more likely to know the title of a male professor. In simple terms, students knew that both the older and younger male professors were Ph.D.s and were to be addressed as "Doctor." Both the older and younger female professors did not enjoy the same level of respect. Students were inclined to refer to one as "Mrs." and the other by a nickname, even though both held the title of Doctor (one was a Ph.D. the other a JDD). This implies that previous stereotypes and assumptions associated with gender may continue to exist. Consequently, it might be in the interests of a female professor to regularly point out her title, especially early in the semester. Conveying the sense of authority implied by a title such as Doctor encourages respect and may result in improved student decorum in the classroom and subsequent satisfaction with the course. The limitations of this study include the small number of professors, even as the number of students in the sample was fairly large. The individual personalities and reputations of the various faculty members may have had some impact on the results. For the future, additional efforts can be made to study how gender affects the classroom experience. In schools of business, such as the one in which this study was conducted, the ultimate goal goes beyond transmitting information to students. Expectations and re-socialization to effective work with either a male or female supervisor may be impacted by the classroom experience. As the culture moves to a more egalitarian structure, the hope would be that the effects of gender and gender match would continue to diminish.
REFERENCES Anderson, Martin (1992). Imposters in the Temple. Simon & Schuster, New York, NY. Berk, Ronald A. (2006). Thirteen Strategies to Measure College Teaching: a Consumer’s Guide to Rating Scale
Construction, Assessment, and Decision Making for Faculty, Administrators, and Clinicians, First Edition, Stylus Publishing, Richmond Virginia.
Caston, Janis J. “The Learning Experience: Impact on Measures of Institutional Effectiveness,” paper presented to
“Leadership 2000,” The Annual International conference of the League of Innovation in the Community College and the Community College Leadership Program, July 17, 1994.

Page 45
Academy of Educational Leadership Journal, Volume 15, Number 4, 2011
Chang, Shu-Hui Hsieh and Smith, Roger A., “Effectiveness of Personal Interaction in a Learner –Centered Paradigm Distance Education Class Based on Student Satisfaction,” Journal of Research on Technology in Education, 40(4), 407-426.
Farley, Jennie (1982). Academic Women and Employment Discrimination: A Critical Annotated Bibliography,
Cornell University, New York. Fauske, Janice, and Wade, Suzanne E. “Research to Practice Online: Conditions that Foster Democracy,
Community, and Critical Thinking in Computer-Mediated Discussions,” Journal of Research on Technology in Education, Winter 2003-2004, Volume 36, Number 2.
Florence, Mari, and Fortson, Ed (2001). Sex at Work, Silver Lake Publishing, Los Angeles, California. Friedman, Lawrence M. (1999). The Horizontal Society, Yale University, New Haven, Connecticut. Lakoff, Robin. (1975). Language and Woman’s Place. Harper & Row Publishers, New York, NY. Marsh, Shelly Jo. (2000). The Impact of Gender on Instructor Evaluations: A Thesis Submitted to the Graduate
School in Partial Fulfillment of the Requirements for the Degree of Master of Science, Pittsburg State University, Pittsburg, Kansas.
Norfleet James, Abigail. “Gender Differences and the Teaching of Mathematics,” Inquiry, Volume 12, Number 1
Spring 2007, 14-25. Peter, Katharin, Horn, Laura, and Carroll, C. Dennis. “Gender Differences in Participation and Completion of
Undergraduate Education and How They Have Changed Over Time,” Postsecondary Education Descriptive Analysis Reports, National Center for Education Statistics, February 2005.
Seldin, Peter (1980). Successful Faculty Evaluation Programs: A Practical Guide to Improve Faculty Performance
and Promotion/Tenure Decisions, Coventry Press, Crugers, New York. Steele, Diana F., Levin, Amy K., Blecksmith, Richard, Shahversdian, Jill, “Women in calculus: The effects of a
supportive setting,” Journal of College Reading and Learning, 39(1), Fall 2008.

Page 46
Academy of Educational Leadership Journal, Volume 15, Number 4, 2011
Page 47
Academy of Educational Leadership Journal, Volume 15, Number 4, 2011
PRACTITIONER AND EDUCATOR PREFERENCES REGARDING ACCOUNTING CURRICULM MEETING
THE 150-HOUR REQUIREMENT
David L. Crawford, Black Hills State University
ABSTRACT Accounting education has been controversial for decades with elevated debate following the introduction and adoption of a 150-hour requirement among most of the 55 jurisdictions that regulate public accounting. Considerable flexibility exists for accounting programs as to coursework and level of education, along with little uniformity guiding the amount and type of experience required for certification and licensure. Such diverse conditions for entry into the profession prompted this study to focus on curricular components of content, program structure, and experiential requirements in accounting. This study surveyed accounting practitioners and educators in an eleven state Midwest region of the United States that had adopted the 150-hour requirement. Findings reveal a 150-hour requirement that influences the time commitment and kind of educational structure preferred by practitioners and educators while garnering little support for specialization during the educational experience. Majorities from both accounting groups clearly prefer two years of experience prior to licensure for entry-level accountants. Significant differences between practitioners and educators as to appropriate subject/course offerings at both the undergraduate and graduate level are identified.
INTRODUCTION Education, experience, and examination have long been the mainstays of preparation for entry into the public accounting profession. Recognizing that examination for certification and licensure is important, the Uniform Certified Public Accountant (CPA) Examination is a national standard that does not vary from state to state. Therefore, this study focused on the first two requirements—education and experience—noting the diversity among accounting programs and licensing jurisdictions in addition to the controversy that has developed from such disparate conditions. While some form of a 150-hour requirement is in place among most of the 55 jurisdictions, there are considerable differences regarding the amount and type of work experience that precedes licensure. Correspondingly, subjects and courses, as well as the level of education vary considerably from one accounting program to the next.

Page 48
Academy of Educational Leadership Journal, Volume 15, Number 4, 2011
For decades, there have been calls for more research related to the structure of accounting programs (Rebele, 2002) with others (Allen & Woodland, 2006) questioning the academic content for inclusion in the 150-hours. The purpose of this study was to address such matters by comparing curricular preferences of CPAs working in public accounting with accounting educators who are preparing students for entry into practice. Acquiring information via an opinion survey from both practitioners and educators is appropriate in addressing concerns of curriculum developers and policy makers who deliberate academic studies and work experience for entry-level accountants. The specific preferences examined included program structure and time requirements with consideration given to the 150-hour requirement, program specialization, experiential requirements for licensure and appropriateness of subjects/courses at the undergraduate and graduate level.
BACKGROUND Experience is complementary to formal education by promoting intellectual growth of the individual when introducing new problems for exploration (Dewey, 1938). The notion of relevant experience following formal education as the preferred method of educating accountants permeates accounting education literature (American Accounting Association, 1972; American Institute of Certified Public Accountants, 1969; Perry, 1955). Pragmatic underpinnings elicit input from both practitioners and educators resulting in a deliberate accounting curriculum tempered by self-imposed checks. However, the linkage between academic theory and accounting practice also creates considerable disagreement among stakeholders as to the preferred accounting curriculum. Two foundation reports—Ford and Carnegie—recommended a liberal arts undergraduate education followed by additional graduate study focusing on the vocational direction of the student (Gordon & Howell, 1959; Pierson, 1959). Supporting scholarship beyond the undergraduate level, the Horizons Study advocated that preparation for public accounting eventually include graduate study (Roy & MacNeill, 1967). The accounting core was defined as “what every accounting major should take (know)” (Ferrara, 1975, p. 224-225) after the introductory course. A follow-up study surveyed accounting practitioners and accounting educators to identify what the common accounting core should be (Flaherty, 1979) and supported specialization in the educational process but did not address details regarding program structure and time requirements. By 1986, both the American Accounting Association (AAA) and the American Institute of Certified Public Accountants (AICPA) recommended adoption of a 150-hour requirement for those entering the profession (Langenderfer, 1987). However, acceptance of a 150-hour requirement by AICPA members did little to unify accounting curriculum among the academic community. Rumble (1998) reported that while many accounting programs have made modifications to meet the requirement, various models exist among Midwestern colleges and

Page 49
Academy of Educational Leadership Journal, Volume 15, Number 4, 2011
universities resulting in a diverse set of curricular requirements. Flexibility in meeting requirements has some advantages for curriculum developers, but an ongoing gap between educators and practitioners regarding curriculum content appears to exist (Novin, Fetyko & Tucker, 1997) and there is little evidence for a 150-hour curriculum model that might help to reconcile such differences.
RESEARCH QUESTIONS The issue of post-baccalaureate education for accountants has been a policy formally embraced by the AICPA since 1959 (Van Wyhe, 1994). Despite calls for reform, substantive change in accounting curricula moves slowly (Previts and Merino, 1998) and by 1988, general membership of the AICPA voted requiring all new members to have 150 semester hours of college education including a minimum of a baccalaureate degree (American Institute of Certified Public Accountants, n.d.). Although this requirement did not take effect until after the year 2000, ostensibly, such a mandate should have ended much of the educational controversy. However, many stakeholders remain unconvinced as to the value of the 150-hour requirement (Albrecht & Sack, 2000) and are uncertain about what course content should be included in the additional year of study. The quest for a common structural framework in accounting curriculum has eluded the profession because issues of content and program structure have never been clearly addressed by accounting educators and practitioners—the two groups recognized as most influential in curricular change. With little curricular clarity and a dearth of information regarding practitioner and educator preferences since widespread implementation of the 150-hour mandate, a variety of program requirements and structures emerged. Accordingly, the opportunity to influence accounting curriculum became apparent to other interested stakeholders and in 2005, the National Association of State Boards of Accountancy (NASBA) submitted a proposal prescribing certain specific curricular content changes. While the NASBA prescriptions were temporarily averted, a fundamental question posed by Tyler (1950) regarding effective organization of educational experiences surfaced as needing attention in accounting. Research Question 1: To what extent do public practitioner and educator preferences differ regarding time commitments and program structures when (a) there is no 150-hour educational requirement for certification and licensure, and (b) there is a 150-hour educational requirement for certification and licensure? The Horizons Study is an oft-cited landmark study pertaining to what new CPAs should know upon entry into the profession (Roy & MacNeill, 1967). However, this study did not design a curriculum but instead emphasized that a modern CPA be well schooled in mathematics, statistics, and quantitative methods and that “preparation for public accounting should come to include graduate study” (Roy & MacNeill, p. 5).

Page 50
Academy of Educational Leadership Journal, Volume 15, Number 4, 2011
A report by Flaherty (1979) used an extensive expert opinion survey of accounting educators and accounting practitioners to determine important topics in identifying an accounting common body of knowledge (referenced as the “common core”) to be acquired by all majors regardless of specialization. The areas of core specialization were broken into managerial accounting and information systems, taxation, financial accounting, auditing, and generalist. Overall, respondents placed more emphasis on conceptual knowledge than on technical ability and the “implications from this finding were that accounting education should be more conceptual than technical in its orientation” (p. 127). Additionally, this monograph noted that while accounting consists of many specialties, significant commonalities exist and concluded that a fair amount of specialization should take place in the formal educational process but gave no details as to what that specialization should be (Flaherty). When the AICPA proposed post-baccalaureate study in the bylaws in 1959, increased education was intended to allow for more specialization, but by the 1980s, a proliferation of information spawned the change to that of broadening the education (Ijiri & Sunder, 1991). The issue of how to best acquire the knowledge and skills needed by entry-level accountants appears to be largely a matter of opinion. Some stakeholders maintain that additional study should broaden the skills and competencies of the individual, a position that coincides with the intention of the AICPA, while others continue to value specialized technical knowledge that would help candidates pass the CPA exam and prepare them for practice. Research Question 2: To what extent do public practitioner and educator preferences differ regarding the type and amount of curricular specialization within the formal educational structure?
Attainment of educational requirements and successful completion of the Uniform CPA examination signal necessary academic preparation for entry into the profession. States have also required experience to complement education and examination and to lend assurance as to competency for practice. However, the amount and type of experience needed is not uniform, resulting in varying requirements among the licensing jurisdictions. Most states require from one to three years of experience but this requirement has been broadening over the years to include training in accounting outside of public accountancy. Some states mandate experience prior to actual licensure keeping the certification and licensing as two separate steps while others require it prior to certification and combine licensure with certification (American Institute of Certified Public Accountants and National Association of State Boards of Accountancy, 2000).
Experience and formal education are issues not easily separated if reasons for the requirements—protection of the public from incompetent practitioners—is considered. Indeed, it is the notion of complementing what formal education cannot do (Merino, 1977) that prompted licensing jurisdictions to mandate experience. Linking scholarly activity with practical experience has provided a pragmatic conduit for imparting theory into practice while helping prepare the individual for the profession of accountancy. In essence, experience coupled with

Page 51
Academy of Educational Leadership Journal, Volume 15, Number 4, 2011
life-long learning are part of the implicit accounting curriculum, and for that reason, both the practitioner and educator need to have a voice in the matter. Illustrative of continuing debate over experience requirements is a monograph issued by a large international accounting firm (PricewaterhouseCoopers, 2003) that calls for an additional year of practice in lieu of an additional year of formal education. Graves (2004) responded to this proposal noting: “To substitute for the 150-hour requirement what entrants already do is to effectively eliminate the 150-hour requirement. It is the 150-hour requirement that adds another dimension to accounting education, not on-the-job training” (p. 3). Research Question 3: To what extent do public practitioner and educator preferences differ regarding the amount and type of work experience that should precede a license to practice public accounting?
By the mid twentieth-century, uniformity of course titles and content in accounting curriculum was common and an evaluation of typical accounting programs (Pierson, 1959) identified required courses from three areas, which included a certain amount of liberal or general studies, general business studies, and accounting studies. Most four-year degree programs required 120 to 128 total semester credit hours with accounting courses constituting from 24 to 30 hours, including accounting principles, intermediate accounting, advanced accounting, cost accounting, auditing, and income tax (Pierson). Although a course in accounting information systems was later added to this mix, common titles for undergraduate courses appears to have varied little over the years according to a study in Nebraska by Garvin (2006).
By 1986, both major bodies most influential in accounting curriculum had just recommended significant change to accounting education and in 1988, the 150-hour requirement became reality with 83 percent of AICPA voting membership in favor. Subsequent clarification of the official position was conveyed with the following statement (American Institute of Certified Public Accountants, 1988, p. 24):
General Education 60-80 semester hrs Education in Business Administration 35-50 semester hrs Accounting Education 25-40 semester hrs
In order to guide accounting educators when designing 150-hour programs, Novin and Tucker (1993) studied the perceived relative importance of various academic subjects by accountants in public practice. The study provided a template for use by educators in determining the composition of 150-hour programs that ranked general education, accounting education, and business education by level of importance according to the public accountants. Novin, Fetyko & Tucker (1997) revealed a gap in perception between accounting department heads and public accounting practitioners regarding curriculum content. In this study, practitioners tended to focus on entry-level job specific skills that emphasized accounting and technology knowledge. Educators, on the other hand, were more inclined to take a long-term

Page 52
Academy of Educational Leadership Journal, Volume 15, Number 4, 2011
view favoring areas of international business, economics and other courses that would help develop critical thinking skills and were generally perceived as better for career building. A study conducted by Rumble (1998) of accounting chairs and deans at Midwestern colleges and universities in 10 states found that while over 87% of programs reported changes to meet the 150-hour requirement, 75% indicated that no particular accounting model was used. Of the respondents, the most widely adopted models were the AICPA model with 13%, and the AACSB model with 6%. Additionally, respondents indicated the two groups most important in identifying accounting skills and competencies were accounting educators and public accountants.
In 2005, NASBA issued an Exposure Draft that would have modified certain rules of the Uniform Accountancy Act by prescribing certain coursework and number of credits in accounting (National Association of State Boards of Accountancy, 2005). Resistance by stakeholders prompted NASBA to table the exposure draft with plans of developing an alternative framework in the future. The AAA then called on the academic community to provide leadership regarding the content of accounting education and to consider developing a useful framework that would be in the form of a common body of knowledge (American Accounting Association, 2006). Accordingly, a commission made up of AAA and AICPA representatives is working to issue a report similar to the 1967 Horizons Study that will define what accounting professionals need to know (American Accounting Association, 2009). Although most accounting programs have made changes in order to address the 150-hour requirement, a trend towards a dual education at both the undergraduate and graduate level for CPAs appears to be developing. Currently, it is unclear as to where practitioners and educators stand regarding a mix of undergraduate and graduate accounting curriculum given the widespread acceptance and implementation of additional educational requirements. Research Question 4: To what extent do public practitioner and educator preferences differ as to (a) accounting subjects or courses most appropriate in comprising a common core for all accounting students at the undergraduate level of study and (b) accounting subjects or courses most appropriate to graduate level accounting students following an undergraduate common core?
METHODOLOGY The population for this study included accounting educators and accounting practitioners in an 11 state Midwest region of the United States consisting of: Kansas, Nebraska, South Dakota, Missouri, Indiana, North Dakota, Iowa, Illinois, Wisconsin, Michigan, and Minnesota. These jurisdictions have passed legislation requiring, in some form, 150 credit hours of education on or before July 1, 2006. A sample of accounting educators was acquired from a population of 187 accounting chairpersons at four-year colleges and universities in the 11 state

Page 53
Academy of Educational Leadership Journal, Volume 15, Number 4, 2011
Midwest region along with a random sample of managing partners from a population of 5,479 CPA firms engaged in the practice of public accounting in the same region. Survey instruments were designed with consideration given to the research questions and a literature review of accounting education including the 150-hour requirement. Three accounting educators and two accounting practitioners reviewed the survey instruments prior to adoption and dissemination. Other than the demographic section, the questionnaires were identical for both practitioners and educators. Cover letters explaining the survey and importance of the study accompanied each questionnaire. In addition to demographic information, the survey instruments consisted of four sections that addressed the research questions in this study:
Part I – Time commitments and program structure of accounting education; Part II – Type and amount of specialization in accounting education; Part III – Experience requirements; Part IV – Accounting subjects and courses at the undergraduate and graduate level. Data analysis used appropriate statistics for each question to help clarify and interpret results from this study. Chi square tests of association were conducted on the categorical data from questions one, two, and three. For each of these first three questions, tables report frequencies and proportions for the dependent variables by factor level. Multivariate Analysis of Variance (MANOVA) tests were used to analyze parametric data from question four followed by Analysis of Variance (ANOVA) tests for each dependent variable. Descriptive statistics of means and standard deviations along with F ratios and significance levels from the inferential statistical analysis are reported for question four.
RESPONSE RATES
Surveys were mailed to 1,000 managing partners based on a random sample from accounting firms located in the Midwest region. Twelve of these surveys were returned by the postal service as undeliverable. After three weeks, a reminder card was sent to practitioners not responding. There were a total of 245 completed surveys from this practitioner group for a return rate of 24.5% (Table 1). Accounting Chairpersons from baccalaureate and higher colleges and universities in the Midwest region were selected from a directory compiled by Hasselback (2006) resulting in 187 mailings to those educators. After three weeks, a reminder card was sent to educators not responding. There were a total of 51 completed surveys for a return rate of 27.3% (Table 1) from this group. The entire mailing of 1,187 survey questionnaires resulted in 296 responses for a total response rate of 25.0% (Table 1).
Table 1: Response Rates of Practitioner and Educator Groups Practitioner Educator Total Number of surveys 1,000 187 1,187 Number of responses 245 51 296 % responding 24.5 27.3 25.0
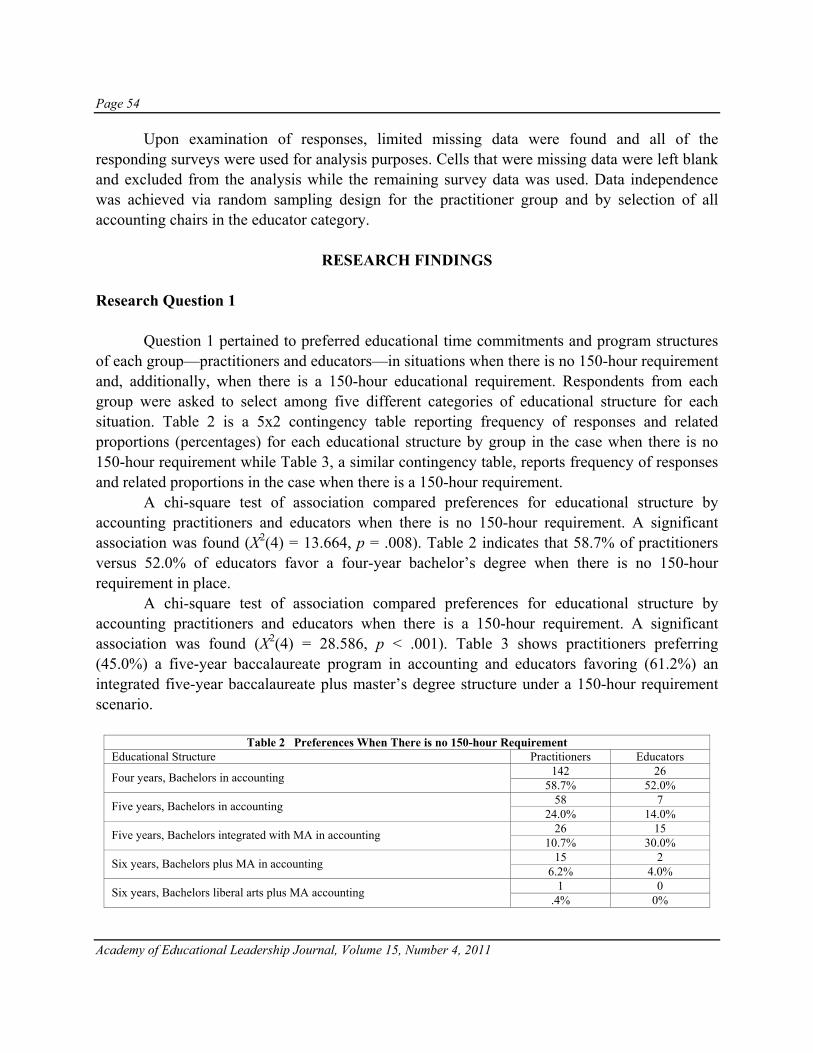
Page 54
Academy of Educational Leadership Journal, Volume 15, Number 4, 2011
Upon examination of responses, limited missing data were found and all of the responding surveys were used for analysis purposes. Cells that were missing data were left blank and excluded from the analysis while the remaining survey data was used. Data independence was achieved via random sampling design for the practitioner group and by selection of all accounting chairs in the educator category.
RESEARCH FINDINGS Research Question 1 Question 1 pertained to preferred educational time commitments and program structures of each group—practitioners and educators—in situations when there is no 150-hour requirement and, additionally, when there is a 150-hour educational requirement. Respondents from each group were asked to select among five different categories of educational structure for each situation. Table 2 is a 5x2 contingency table reporting frequency of responses and related proportions (percentages) for each educational structure by group in the case when there is no 150-hour requirement while Table 3, a similar contingency table, reports frequency of responses and related proportions in the case when there is a 150-hour requirement.
A chi-square test of association compared preferences for educational structure by accounting practitioners and educators when there is no 150-hour requirement. A significant association was found (X2(4) = 13.664, p = .008). Table 2 indicates that 58.7% of practitioners versus 52.0% of educators favor a four-year bachelor’s degree when there is no 150-hour requirement in place. A chi-square test of association compared preferences for educational structure by accounting practitioners and educators when there is a 150-hour requirement. A significant association was found (X2(4) = 28.586, p < .001). Table 3 shows practitioners preferring (45.0%) a five-year baccalaureate program in accounting and educators favoring (61.2%) an integrated five-year baccalaureate plus master’s degree structure under a 150-hour requirement scenario.
Table 2 Preferences When There is no 150-hour Requirement Educational Structure Practitioners Educators
Four years, Bachelors in accounting 142 26 58.7% 52.0%
Five years, Bachelors in accounting 58 7 24.0% 14.0%
Five years, Bachelors integrated with MA in accounting 26 15 10.7% 30.0%
Six years, Bachelors plus MA in accounting 15 2 6.2% 4.0%
Six years, Bachelors liberal arts plus MA accounting 1 0 .4% 0%

Page 55
Academy of Educational Leadership Journal, Volume 15, Number 4, 2011
Table 2 Preferences When There is a 150-hour Requirement
Educational Structure Practitioners EducatorsFour years, Bachelors in accounting 63 6
26.0% 12.2%Five years, Bachelors in accounting 109 12
45.0% 24.5%Five years, Bachelors integrated with MA in accounting 56 30
23.1% 61.2%Six years, Bachelors plus MA in accounting 12 1
5.0% 2.0%Six years, Bachelors liberal arts plus MA accounting 2 0
.8% .0% Research Question 2 Question 2 was designed to examine preferences of accounting practitioners and accounting educators regarding the appropriate type and amount of curricular specialization within the formal educational structure. Samples from each group—practitioners and educators—were asked to select among five types of specialization and five categories of time commitments devoted to those specialties. A chi-square test of association compared the preferences for type of specialization between accounting practitioners and educators. A significant association was found (X2(4) = 11.133, p = .025). Practitioners preferred no specialization (46.9%) while a large majority (70.6%) of educators chose no specialization over certain other specialty areas within the formal educational structure of accounting programs (Table 4).
Table 4 Preferences for Type of Specialization Area
Type of Specialization Practitioners Educators
None—no specialization 114 36 46.9% 70.6%
Accounting systems 11 1 4.5% 2.0%
Auditing and assurance 31 5 12.8% 9.8%
Taxation 17 0 7.0% 0%
Financial accounting and reporting 70 9 28.8% 17.6%
A chi-square test of association was calculated comparing the preferences of accounting
practitioners and educators as to time commitments for specialization within a formal educational structure (Table 5). No significant relationship was found (X2(4) = 6.759, p = .149). The preferences of practitioners and educators appear to be independent events, even though

Page 56
Academy of Educational Leadership Journal, Volume 15, Number 4, 2011
43.7% of practitioners and 63.3% or educators chose no time commitment for specialization within the formal educational process.
Table 5 Preferences as to Time Commitment for Specialization
Time for Specialization Practitioners Educators
None—no time commitment 104 31 43.7% 63.3%
One year or less 44 7 18.5% 14.3%
Two years or less 71 8 29.8% 16.3%
Three years 10 2 4.2% 4.1%
More than three years 9 1 3.8% 2.0%
Research Question 3 Question 3 examined preferences of accounting practitioners and accounting educators regarding the appropriate amount and type of work experience that should precede a license to practice public accounting. Participants from each group—practitioners and educators—were asked to select among five amounts and types of experience following the educational process. A chi-square test of association was calculated comparing the preferences for amount of experience (Table 6) prior to licensure between accounting practitioners and educators. A significant association was found (X2(4) = 29.316, p < .001). A majority of practitioners and educators preferred two years of experience prior to licensure at 58.4% and 51.0% respectively. A chi-square test of association was calculated comparing the preferences for type of experience (Table 7) prior to licensure between accounting practitioners and educators. A significant interaction was found (X2(4) = 22.428, p < .001). Practitioners (57.6%) preferred public accounting experience of all kinds over other types of experience whereas educators favored public accounting experience of all kinds (31.4%) but were evenly split at 17.6% between accounting and assurance services versus public or private accounting experience of any kind (Table 7).
Table 6 Preferences for Amount of Experience Prior to Licensure Amount of Experience Practitioners Educators
No experience necessary 1 0 .4% .0%
No experience if 150-hours of education 3 3 1.2% 5.9%
One year of experience 34 20 13.9% 39.2%
Two years of experience 143 26 58.4% 51.0%
Three years of experience 64 2 26.1% 3.9%

Page 57
Academy of Educational Leadership Journal, Volume 15, Number 4, 2011
Table 7 Preferences for Type of Experience Prior to Licensure
Type of Experience Practitioners Educators
Public accounting—accounting and assurance only 45 9 18.4% 17.6%
Public accounting—any type of public accounting 141 16 57.6% 31.4%
Public or private accounting of any kind 14 9 5.7% 17.6%
Public, private or governmental accounting 25 5 10.2% 9.8%
Public, private, governmental, or academic 20 12 8.2% 23.5%
A statistical summary of the chi-square tests of association appear in Table 8.
Table 8
Chi-Square (X2) Values With Degrees of Freedom (df) and Significance Levels (p) for Research Questions 1-3 Question X2 df p 1a. Educational structure—no 150 requirement 13.664 4 .008* 1b. Educational structure—150 requirement 28.586 4 <.001* 2a. Type of specialization 11.133 4 .025* 2b. Time for specialization 6.759 4 .149 3a. Amount of experience 29.316 4 <.001* 3b. Type of experience 22.428 4 <.001* * indicates level of significance (p) of .05 or less.
Research Question 4
Question 4 investigated differences between accounting practitioners and accounting educators regarding which subjects and courses were considered most appropriate at the undergraduate and graduate level of education. Participants were asked to rate 14 subject/course categories commonly found in accounting programs on a scale of 1 to 5 with 1 being not appropriate and 5 being very appropriate at each level of education. For each of these two sets of questions—undergraduate and graduate—a one-way multivariate analysis of variance (MANOVA) was chosen to determine differences between the two groups of accounting experts who are believed to be most influential in accounting curriculum. An Alpha level of .05 was selected for these tests.
A one-way MANOVA was conducted to determine practitioner versus educator differences in fourteen categories of subjects/courses at the undergraduate level. Wilks’ Lambda = .634, F (14, 274) = 11.274, p < .001, multivariate η2 = .366. Subsequent to the significant MANOVA finding, ANOVA tests were conducted on each of the 14 dependent variables in determining which particular variables contributed to overall differences between the groups (Table 9). The Bonferroni adjustment was also selected to facilitate a stable Type I error rate

Page 58
Academy of Educational Leadership Journal, Volume 15, Number 4, 2011
which resulted in a more stringent level of significance to be met in the univariate tests of .004 (.05/14). Differences at the undergraduate subject/course level were significant for Cost Accounting, F (1, 287) = 38.829, p < .001, partial η2 = .119, Auditing, F (1, 287) = 14.028, p < .001, partial η2 = .047, Accounting Theory, (1, 287) = 34.927, p < .001, partial η2 = .108, Governmental/Fund Accounting, F (1, 287) = 13.236, p < .001, partial η2 = .044, and Advanced Information Systems, F (1, 287) = 10.254, p = .002, partial η2 = .034.
Differences in the undergraduate subjects of Intermediate Financial Accounting, Advanced Financial Accounting, Accounting Systems, Introductory Taxation, Advanced Taxation, Assurance Services, Accounting Research, Accounting Ethics, and Internal Auditing were not significantly influenced by the practitioner/educator groups indicating more ambiguity as to preferential differences. A one-way MANOVA was conducted to determine practitioner versus educator differences in fourteen categories of subjects/courses at the graduate level. Wilks’ Lambda = .902, F (14, 255) = 1.968, p = .021, multivariate η2 = .098. Following the significant MANOVA finding, ANOVA tests were conducted on each of the 14 dependent variables to determine which variables contributed to overall differences between the groups (Table 10). Using the Bonferroni adjustment to hold the Type I error constant, no individual differences among the 14 subjects at the graduate level were found to be significantly influenced by the practitioner or educator categories.
Tables 9 and 10 present means (M), standard deviations (SD), F ratios, and significance levels (p) for undergraduate and graduate courses respectively.
Table 9 Means (M), Standard Deviations (SD), F Ratios, and Significance Levels (p) for Undergraduate Courses
Undergraduate Subject/Course Practitioners Educators M SD M SD F p
Intermediate Financial Acct. 4.79 .446 4.90 .306 2.534 .113 Advanced Financial Acct. 4.05 .888 4.12 .904 .239 .625 Cost/Managerial Acct. 3.78 .933 4.63 .528 38.829 <.001* Accounting Systems 4.29 .769 4.49 .582 3.036 .082 Introductory Taxation 4.47 .748 4.57 .764 .730 .393 Advanced Taxation 4.16 .879 3.98 .968 1.701 .193 Auditing 4.38 .784 4.82 .441 14.028 <.001* Other Assurance Services 3.73 .927 3.43 .957 4.231 .041 Accounting Theory 4.22 .874 3.41 .864 34.927 <.001* Accounting Research 3.60 .967 3.51 .845 .400 .527 Governmental/Fund Acct. 3.25 .996 3.80 .735 13.236 <.001* Accounting Ethics 4.28 .987 4.10 1.046 1.346 .247 Internal Auditing 3.21 .963 3.35 .805 .888 .347 Advanced Information Systems 3.64 .936 3.16 .986 10.254 .002* * indicates level of significance (p) of .004 or less.

Page 59
Academy of Educational Leadership Journal, Volume 15, Number 4, 2011
Table 10
Means (M), Standard Deviations (SD), F Ratios, and Significance Levels (p) for Graduate Courses Practitioners Educators
Graduate Subject/Course M SD M SD F p Intermediate Financial Acct. 3.97 1.231 3.81 1.331 .615 .433 Advanced Financial Acct. 4.36 .891 4.25 .957 .639 .425 Cost/Managerial Acct. 3.87 1.039 3.79 1.166 .236 .627 Accounting Systems 4.11 .987 3.73 1.300 5.151 .024 Introductory Taxation 3.64 1.250 3.40 1.267 1.439 .231 Advanced Taxation 4.26 .919 4.27 1.086 .004 .950 Auditing 4.02 1.011 4.06 1.245 .070 .791 Other Assurance Services 3.96 .960 3.69 1.323 2.826 .094 Accounting Theory 4.10 1.127 4.25 .838 .723 .396 Accounting Research 4.17 1.022 4.35 .887 1.388 .240 Governmental/Fund Acct. 3.44 1.065 3.52 .989 .251 .617 Accounting Ethics 4.29 .998 4.17 1.098 .608 .436 Internal Auditing 3.41 1.028 3.58 1.200 1.112 .293 Advanced Information Systems 4.15 .937 3.98 1.062 1.230 .268 * indicates level of significance (p) of .004 or less.
CONCLUSIONS AND DISCUSSION Conclusions Evidence gained through this study represents a body of information that corroborates the following conclusions. 1. The 150-hour requirement affects the time commitment and kind of educational structure preferred by practitioners and educators. When presented with no 150-hour requirement, a majority from both groups chose a four-year bachelor’s degree in accounting over other program structures. However, when given a 150-hour requirement, the practitioners preferred a five-year bachelor’s degree in accounting while educators chose an integrated five-year bachelor/masters type of program. 2. Practitioners and educators do not support specialization within the formal educational structure. A clear majority of educators favored no specialization within the educational format while practitioners chose no specialization over other alternatives but at a lower rate than practitioners. 3. Majorities from both groups—practitioners and educators—prefer two years of work experience prior to licensure for entry-level accountants. A majority of practitioners chose all types of public accounting as the preferred type of experience while educators were more inclined to choose other categories of experience in addition to public accounting.
4. There are differences between practitioners and educators as to appropriate subject/course offerings at both the undergraduate and graduate level. However, while specific

Page 60
Academy of Educational Leadership Journal, Volume 15, Number 4, 2011
differences can be identified at the undergraduate level of education, findings are more ambiguous at the graduate level. Discussion Acknowledging that additional higher education was desirable for CPAs, most states have passed legislation implementing a 150-hour requirement as a matter of law. However, legislative mandates have done little to quiet debate surrounding the structure and content of accounting programs. Findings from this study indicate that the amount of required education for certification and licensure influences how practitioners and educators view time commitments and program structure at universities and that those views differ between the two groups. Practitioners and educators are influenced by the amount of required education and each group has different opinions about the educational structure and time commitment that best meets those requirements.
Ideally, reason would dictate that additional educational requirements help to protect the public from incompetent practitioners by increasing quality while simultaneously adding to the professional status of public accounting. However, given findings from this study, one might query whether CPAs recognize much value in additional education other than to meet the mandated requirements. Such a conclusion supports assertions of earlier research (Albrecht and Sack, 2000) and promotes an unsettling perspective among those advocating additional education for more profound reasons than merely meeting legislative requirements. No doubt, there is partiality from practitioners and educators given educational achievement differences between the groups, but the pragmatic nature of accounting professionals lends assurance that careful consideration is given to costs and related benefits from additional formal study.
The generalist versus specialist debate has continued over the years with much literature supporting liberal arts followed by accounting education (Ferrara, 1975; Flaherty, 1979) while largely flouting any clear suggestion as to amount and level of education dedicated to specialization. The debate has not disappeared completely, but the trend appears to be in favor of educating the accountant as generalist. This study finds that both practitioners and educators continue to agree with the notion of educating the generalist accountant as was evident when the 150-hour requirement passed.
Most stakeholders would agree that specialists are needed within the actual practice of accounting. However, there is little evidence supporting specialization during the formal educational process. The pragmatic accountant concedes that specialization is not easily attained given the time constraints of formal education. While a few stakeholders might advocate for specialization within the extra year of study that the 150-hour requirement affords, the great majority understand that this is unrealistic and would result, at best, in superficial coverage of what specialists really need for practice. In short, education of specialists for the practice of accountancy cannot be sensibly produced in five or even six years of college.

Page 61
Academy of Educational Leadership Journal, Volume 15, Number 4, 2011
Findings from this study support continuation of experience requirements as part of the learning process preceding licensure as CPAs. A clear majority of both practitioners and educators prefer two years of experience with second choices of three years and one year from each group respectively. Additionally, majorities of practitioners prefer public accounting to other types of experience while educators chose public accounting as the first choice but are open to accepting other types of accounting experience as viable alternatives. Both practitioners and educators value experience by a margin that offers little support for the notion of substituting additional education in lieu of experience.
This study found that significant differences exist between accounting practitioners and educators with regard to what the most appropriate subject/course offerings are. At the undergraduate level, the significant findings include a moderate effect size of .366 with contribution by five specific subject/courses that were individually significant. The five undergraduate subjects found to comprise differences between practitioners and educators at a significance level of .004 or less were Cost Accounting, Auditing, Accounting Theory, Governmental/Fund Accounting, and Advanced Information Systems. Nine other undergraduate subjects were not found to be significant which denotes no major differences between practitioner and educator ratings for those courses. Of the five courses with significant findings, practitioner mean scores were higher for Accounting Theory and Advanced Information Systems than were educators, while educators rated Cost Accounting, Governmental, and Auditing higher than the practicing accountants. Although the differences were significant, the mean scores from both practitioners and educators for Governmental and Advanced Information Systems were rated lower than four on a five point scale indicating that neither group found them to be particularly appropriate (important) at the undergraduate level. Additionally, Auditing was statistically significant but was also rated highly (above four) by both groups. Subject matter viewed through the practitioner lens versus that of the educator will certainly shape perceptions and offers a viable explanation for many of the course differences. Therefore, perceptions of coursework from the vantage point of either group must be considered when discussing reasons for ratings diversity. Practitioners rated the subject matter in Accounting Theory above four on a five point scale and notably higher than educators. From the educator viewpoint, theory is often covered in related class work and many programs do not include this as a separate course. Practitioners, on the other hand, might perceive an Accounting Theory course as highly appropriate because of the conceptual nature of accounting that acknowledges theory as the foundation for practice. Arguably, this finding, while somewhat surprising, maintains the perception that accounting is a conceptual discipline, even by those who practice on a day-to-day basis. Using data from the five point Likert scale rating for question four, selection of courses with mean scores of four or higher provided a convenient and meaningful ranking system. While courses with a mean score of at least four did not all represent significant findings statistically, such a ranking allowed for a representation of the most appropriate subjects and courses at the

Page 62
Academy of Educational Leadership Journal, Volume 15, Number 4, 2011
undergraduate level as selected by both practitioners and educators. The ranked courses in Table 11 provide a synopsis for those charged with developing undergraduate core accounting curriculum or modification of program structures that are acceptable to both practicing accountants as well as academicians.
Table 11 Rankings of Undergraduate Courses with Mean (M) Ratings of 4.00 or Higher
Undergraduate subject/course Practitioners Educators1. Intermediate financial accounting M M 2. Auditing 4.79 4.90 3. Introductory taxation 4.38 4.82 4. Accounting systems 4.47 4.57 5. Accounting ethics 4.29 4.49 6. Advanced financial accounting 4.28 4.10
Upon analysis of data from practitioners and educators, graduate level accounting education was also found to be statistically significant but with a much smaller effect size (.098) than undergraduate education. There were no specific subject/course findings meeting the .004 significance level while only one course, Accounting Systems, at .024 approached a reliable level of significance. Therefore, it is not possible from this study to discern clear differences between practitioners and educators regarding graduate level curriculum. However, while specific differences were not explicitly identified, potentially useful information emerges from the overall results. The ranked courses in Table 12 represent a meaningful starting point as to appropriate subjects for consideration by those involved in curriculum and program development that incorporates graduate study.
Table 12 Rankings of Graduate Courses with Mean (M) Ratings of 4.00 or Higher
Graduate subject/course Practitioners Educators Graduate subject/course M M
1. Advanced financial accounting 4.36 4.25 2. Advanced taxation 4.26 4.27 3. Accounting research 4.17 4.35 4. Accounting ethics 4.29 4.17 5. Accounting theory 4.10 4.25 6. Auditing 4.02 4.06
The questionnaires for undergraduate and graduate level courses were purposefully constructed with 14 identical subject/course categories. Therefore, some overlap between rankings was anticipated since the questions were not intended to be mutually exclusive. Overlap between undergraduate and graduate course preferences did occur with respect to Auditing, Accounting Ethics, and Advanced Accounting indicating that these subjects were important

Page 63
Academy of Educational Leadership Journal, Volume 15, Number 4, 2011
enough for participants to rate highly in both undergraduate and graduate level curriculum. Information presented in Tables 11 and 12 is not intended to represent a complete accounting curriculum at ether the undergraduate or graduate level. Rather, the information includes subject/course areas that should be considered for inclusion among core accounting curriculum at each level. The Cohen Commission (American Institute of Certified Public Accounttants, 1978) and others (Patten & Williams, 1990) observed a split between practitioners and educators that has existed for many years but were unable to determine the exact cause. Sterling (1973) noted harmony of curricular content in accounting because of continuous influences of both practice and theory. Ijiri and Sunder (1991) echo this harmonious or “symbiotic relationship” (p. 11) of both education and practice that are dependent on a continual evolutionary process necessary in a good system of education. Therefore, to say that differences between practitioners and educators lead to a defective educative process that reflects poorly on the profession would be a dangerous, and, perhaps, incorrect interpretation.
LIMITATIONS OF THE STUDY Findings from this study are limited to a population in an eleven state area located in a Midwest geographical region of the United States. Therefore, the findings should not be generalized beyond the area represented by this population. Intentionally, this paper did not consider the fact that currently, many states are allowing students to sit for the CPA exam with 120 hours while setting licensing standards at 150 hours—a movement not supported by the AICPA. While there is ongoing discussion regarding this issue, it is beyond the focus and scope of this study. However, had this option been presented, results from the survey may have changed. This study used a random sample of managing partners in order to avoid a “big firm” bias noted from criticism in some previous studies. Here, the number of practitioners from small firms (five or fewer professionals) was 72% of the respondents—a potential bias of its own introduced in the results.
RECOMMENDATIONS FOR FURTHER STUDY
Recommendations for additional inquiry are made after considering this study and others that suggest a need for further research:
1. Researchers should consider replicating this study among the other six regional (AAA)
accounting associations in the United States to confirm the findings in those geographical regions.

Page 64
Academy of Educational Leadership Journal, Volume 15, Number 4, 2011
2. Future studies should consider analyzing differences between accountants in industry (rather than public accounting) and educators to determine if there are considerable variations from preferences of participants in this study.
3. This study used quantitative methodology for conducting the research. Future researchers might wish to explore and use qualitative methods for a study with similar questions while employing different methodology to discern if findings and conclusions are similar.
4. This study surveyed educators by using accounting chairpersons to represent that group. Future research might consider using faculty other than chairpersons as the primary respondents.
5. Future studies should consider the delineation of results by accredited versus non-accredited accounting and business programs when surveying educators.
CONCLUDING COMMENTS
Recognizing the unique and important influence that practitioners and educators exert on accounting curriculum, this study focused on preferential differences between those groups. Additionally, implementation of a 150-hour requirement among all jurisdictions in the selected population resulted in certain curricular issues emerging as timely topics for examination. While numerous significant findings between educators and practitioners became apparent, other complementary information, reporting no material differences between these groups is also considered important. Critics may question a system that appears to generate continuous controversy fueled by different opinions among shareholder groups. However, with checks and balances in place, responsible debate can strengthen accounting education. Such an approach serves to generate a dynamic and responsive curriculum that avoids haphazard change while seeking improvement. Indeed, debate can be useful to the accounting profession when accompanied by evidence-based research that lends clarity to issues contemplated by curriculum developers, policy makers, and other stakeholders, involved in implementation, modification, and evaluation of educational programs in accountancy.
REFERENCES Albrecht, W. S., & Sack, R. J. (2000). Accounting education: Charting the course through a perilous future.
Sarasota, FL: American Accounting Association. Allen, R. D., & Woodland, A. M. (2006). The 150-hour requirement and the number of CPA exam candidates,
passrates, and the number passing. Issues in Accounting Education. 21(3), 173-193. American Accounting Association (1972). Report of the Committee to Examine the 1969 Report of the
AICPACommittee on Education and Experience Requirements for CPAs. The Accounting Review, 47, 236-257.
American Accounting Association (2006). President’s message. Accounting Education News, 34(1), 1-3.

Page 65
Academy of Educational Leadership Journal, Volume 15, Number 4, 2011
American Accounting Association (2009). Thought leadership in accounting. Accounting Education News, 37(4), 2-
3. American Institute of Certified Public Accountants (1969, March). Report of the Committee on Education and
Experience Requirements for CPAs. New York: Author. American Institute of Certified Public Accountants (1978). The Commission on Auditor’s Responsibilities: Report,
conclusions and recommendations. New York: Author. American Institute of Certified Public Accountants (1988, February). Education requirements for entry into the
accounting profession (2nd Edition, Revised). New York: Author. American Institute of Certified Public Accountants (n.d.). Background information on the 150-hour education
requirement for CPA certification and licensure. Retrieved April 10, 2005, from http://www.aicpa.org. American Institute of Certified Public Accountants & National Association of State Boards of Accountancy (2000).
Digest of State accountancy laws and State board regulations. New York & Nashville: Authors. Dewey, J. (1938). Experience and education. New York: Touchstone. Ferrara, W. L. (Ed.). (1975). Researching the accounting curriculum: Strategies for change. Sarasota, FL: American
Accounting Association. Flaherty, R. E. (1979). The core of the curriculum for accounting majors. Sarasota, FL: American Accounting
Association. Garvin, S. K. (2006). Using stakeholder perceptions of relative importance to prioritize the AICPA core
competencies. Paper presented at the Midwest Regional AAA meeting. Chicago, IL. Gordon, R. A., & Howell, J. E. (1959). Higher education for business (Ford Foundation). New York: Columbia
University Press. Graves, O. F. (2004). A dialogue on accounting education. The CPA Journal 74(2), 14. Hasselback, J. R. (2006). Accounting faculty directory 2006-2007. Upper Saddle River, NJ: Prentice Hall. Ijiri, Y., & Sunder, S. (1991). Reals and ideals of accounting education: Building educational leverages on
fundamentals. In G. L. Sundem & C. T. Norgaard (Eds.), Models of accounting education (pp. 1-13). Torrance, CA: Accounting Education Change Commission.
Langenderfer, H. Q. (1987). Accounting education’s history – a 100 year search for identity. Journal of
Accountancy, 163(5), 302-331. National Association of State Boards of Accountancy, (2005, February). Exposure draft: Uniform accountancy act
rules 5-1 and 5-2. Nashville, TN: Author.
Page 66
Academy of Educational Leadership Journal, Volume 15, Number 4, 2011
Novin, A. M., Fetyko, D. F., & Tucker, J. M. (1997). Perceptions of accounting educators and public accounting practitioners on the composition of 150-hour accounting programs: A comparison. Issues in Accounting Education, 12(2), 331-352.
Novin, A. M., & Tucker, J. M. (1993). The composition of the 150-hour accounting programs; The public
accountants’ point of view. Issues in Accounting Education, 8(2), 273-291. Patten, R. J., & Williams, D. Z. (1990). There’s trouble – right here in our accounting programs: The challenge to
accounting educators. Issues in Accounting Education, 5(2), 175-79. Perry, D. P. (1955). Work of the commission on CPA standards. The Accounting Review, 30(2), 183-193. Pierson, F. C. (1959). The education of American businessmen: A study of university- college programs in business
administration (Carnegie Foundation). New York: McGraw-Hill Book Co. Inc. Previts, G. J., & Merino, B. D. (1998). A history of accountancy in the United States: The cultural significance of
accounting. Columbus: Ohio State University Press. PricewaterhouseCoopers (2003). Educating for the public trust: The PricewaterhouseCoopers position on
accounting education. New York: Author. Rebele, J. S. (2002). Accounting education’s uncertain environments: Descriptions and implications for accounting
programs and accounting education research. Accounting Education, 11(1), 3-25. Roy, R. H., & MacNeill, J. H. (1967). Horizons for a profession: The common body of knowledge for certified
public accountants. New York: American Institute of Certified Public Accountants. Rumble, R. W. (1998). Accounting skills and programs needed for the next century as reviewed by colleges and
universities. Dissertation Abstracts International, 59(12), 4329. (UMI No. 8814572) Sterling, R. R. (1973). Accounting research, education and practice. In A. C. Bishop, E. K. St. Pierre, & R. L Benke,
Jr. (Eds.), Research in accounting education. Harrisburg, VA: James Madison University. Tyler, R. W. (1950). Basic principles of curriculum and instruction. Chicago: University of Chicago Press. Van Wyhe, G. (1994). The struggle for status: A history of accounting education. New York: Garland Publishing,
Inc.

Page 67
Academy of Educational Leadership Journal, Volume 15, Number 4, 2011
A RECURSIVE PROCESS MODEL FOR AACSB ASSURANCE OF LEARNING
Dennis Zocco, University of San Diego
ABSTRACT
In 2003, AACSB International made an evolutionary revision of its Assurance of
Learning (AoL) standards for accreditation, putting more emphasis on direct assessment of learning and calling for degree program leadership accountability for high quality and continuous improvement of the program curriculum. This study presents a comprehensive five-step AoL procedure to address the revised standards. The uniqueness and effectiveness of the procedure is based upon the process of invoking recursive procedure calls to assure structural viability as well as continuous and orderly assessment of learning achievement and curriculum improvement. Learning quality measurement is addressed through the use of course-embedded assignments and scoring rubrics designed to evaluate achievement of program learning objectives. A graphical presentation component of the process allows a static and dynamic assessment of student learning against score and “breadth of learning” benchmarks.
INTRODUCTION
A key element in a successful AACSB accreditation is a process-based approach to meeting the current AACSB International “Assurance of Learning” (AoL) accreditation standards. AoL is one of three areas (Strategic Management Standards, Participants Standards, and AoL) that are represented by the current twenty-one standards that comprise the AACSB International Eligibility Procedures and Standards for Business Accreditation, adopted by member vote in April, 2003 (AACSB, 2010).
As a historical perspective, prior to 1991, AACSB learning standards were based on a “Common Body of Knowledge” requirement of all undergraduate and graduate business majors. These standards were based on discipline (e.g., finance and accounting) as well as more specific sub-disciplines which were evaluated based on contact hours within the program. In 1991, AACSB adopted mission-linked, outcome-oriented AoL standards and the peer-review process. The measurement of outcomes was broadly defined, with surveys of students, alumni, or employers allowed.
The latest conceptual change in AoL standards for initial accreditation and reaccreditation occurred in April, 2003, with the most recent revision to the 2003 standards occurring in Jan. 2010. The 2003 standards called for a more direct measure of learning achievement for each degree program as a natural extension of the concept of “outcomes

Page 68
Academy of Educational Leadership Journal, Volume 15, Number 4, 2011
assessment” introduced in the 1991 standards. Milton R. Blood, managing director of AACSB International at the time of the 2003 revision, stated that the new standards were more “evolutionary” than “revolutionary” and that the 2003 AoL element of accreditation is based on “achievement of” learning rather than the pre-2003 “intention to provide” learning (Thompson, 2004; Miles, Hazeldine and Munilla, 2004).
AACSB currently provides twenty-one standards for business accreditation divided into three categories – Strategic Management (1-5), Participants – Students and Faculty (6-14), and Assurance of Learning (15-21). The greater emphasis on AoL is demonstrated by the seven AoL standards representing 33% of the 2003 AACSB standards compared to less than 10% of the 1991 standards. The current AoL standards are clear in definition and specific in purpose yet leave discretion to schools as to how AoL results are achieved. The standards support the principle of accountability through direct (rather than the pre-2003 indirect) assessment and continuous improvement.
Explicit in the new standards are the establishment of (a) degree-based learning goals linked to the missions of the school and each degree program, (b) direct measures of learning achievement (indirect measures are allowed as a supplement), and (c) an action plan for and documentation of progress toward achievement of program learning goals.
The AoL process presented below is based on the concept of recursion and drawn from recursive processes found in the sciences. The recursive process model was implemented in 2008 at the University of San Diego for a cohort-based specialized Master’s level degree program (Program) offered by the School of Business Administration (SBA). The university is a private institution with approximately 8,800 students. The SBA is comprised of 1,152 undergraduate and 444 graduate students and is AACSB-accredited.
AoL Standard 19 addresses the knowledge and skills required for a Master’s level degree in specialized programs and states that (AACSB, 2010):
The level of knowledge represented by the students of a specialized Master’s level program is the:
• Application of knowledge even in new and unfamiliar circumstances through a conceptual understanding of the specialization.
• Ability to adapt and innovate to solve problems. • Capacity to critically analyze and question knowledge claims in the specialized discipline. • Capacity to understand the specified discipline from a global perspective.
The knowledge and skills identified in the points addressed in AACSB Standard 19 are
represented in the Program by six learning goals (LGs) and multiple associated learning objectives (LOs). The LGs and LOs form the core of the AoL structure with the learning assessment approach, tools, and analysis designed to meet those goals and objectives. The post-2003 AoL process is often described as one of “closing the loop”, i.e., using assessment data to continually improve the curriculum (Palomba and Banta, 1999; Maxim, 2004; Martell and

Page 69
Academy of Educational Leadership Journal, Volume 15, Number 4, 2011
Calderon, 2005; Green, Stark, and Haley, 2007; Betters-Reed, Nitkin, and Sampson, 2008). The innovation of the approach presented below is that it is recursive in nature, “closing the loop” on program curriculum improvement through recursive calls from the five-step AoL procedure. Although the process described is implemented in a specialized Master’s level degree program, the process can be applied to any program requiring AACSB-mandated AoL.
REVIEW OF LITERATURE
As of April, 2010, 477 academic institutions in the United States have AACSB accreditation, while an additional 116 from 37 countries other than the U.S. also have AACSB accreditation. Of the accredited institutions, 173 have additional specialized accreditation for their accounting programs (http://www.aacsb.edu/accreditation/accreditedmembers.asp). The world-wide scope of AACSB accreditation and the influence of a major revision of accreditation standards and AoL guidelines elicit considerable commentary from thought leaders regarding the motivation and implications of the revisions. Researchers provide empirical results from studies of new assessment tools and methodologies and offer innovative procedures that facilitate compliance with the new standards. The literature related to the 2003 AoL revision (and on-going amendments and additions) can be considered in three areas: critical thought, assessment approaches, and AoL procedures. Critical Thought
Some critics of the 2003 revision argued that the new standards do not meet their strategic objective of supporting continuous improvement because they are not process based (Hedin, Barnes and Chen, 2005) or that the standards are likely to be interpreted and acted upon in a manner not supporting best practices in education (Kilpatrick, Dean, and Kilpatrick, 2008). Motivation was another criticism, as Lowrie and Willmott (2009) presented their view that the “mission-linked architecture” of the AACSB international standards is based on expansionist and not pedagogical considerations, resulting in more U.S. business schools receiving accreditation. White, Miles, and Levernier (2009) contended that the new guidelines are excessively rigid, and proposed that AACSB make the accreditation standards more flexible by establishing different levels of accreditation with different standards and level of prestige. Schools could then decide the level of accreditation depending upon the resources they allocate to business education and the level of prestige they desire from accreditation. Julian and Ofori-Dankwa (2006) questioned the impact of the revisions on the ability of traditional U.S. business schools to address the market threats of on-line education and corporate universities.
Support of accreditation focused on the representation of quality in business education to key stakeholders (Trapnell, 2007) and as a quality differentiator among part-time working and international students (Zammuto, 2008). Romero (2008) argued that AACSB accreditation

Page 70
Academy of Educational Leadership Journal, Volume 15, Number 4, 2011
supports a school’s ability to demonstrate long-term accountability in maintaining the quality of its educational products. Assessment Approaches
The new AACSB guidelines are explicit in their direction that schools adopt a direct approach to assessment but provide flexibility in adopting types of tools, such as course-embedded measures (assignments), stand-alone testing or performance (end-of-program standardized exam, thesis, or project), and selection (standardized admission exam). The guidelines allow schools to supplement direct measures of achievement with indirect measures. The AACSB Resource Center website provides examples of the assessment practices applied at several schools (http://www.aacsb.edu/resources/assessment/spotlight-archives.asp).
Innovators are extending existing learning assessment tools, such as the Information Systems Analyst (ISA) certification exam which measures competencies in eight information technology skill areas, to address and measure more qualitative skills in IT, accounting, and other business areas (Beard, Schwieger, and Surandrem, 2008). The literature on AoL provides numerous cases for using the results of the Educational Testing Service's Major Field Test in Business to assess student achievement and development (Mirchandani, Lynch and Hamilton, 2001; Black and Duhon, 2003; Bagamery, Lasik, and Nixon, 2005; Bush, Duncan, Sexton and West, 2008). Natarajan and Barger (2008) explained how the Baldrige Organizational Profile is used to assess the learning benefits in the areas of organizational diagnostic and consulting skills while Betts (2008) reported the use of Bloom’s Taxonomy of educational objectives to guide course design and assessment considerations. Bycio and Allen (2004) recommended supplementing standardized questionnaires used to obtain student opinions on AACSB accreditation issues with an open-format, "critical incidents" approach to outcomes assessment in order to access students’ views on the aspects of their university experience that were successful and also need improvement.
In the context of AoL, some researchers have supported forms of student self- (Lynn and Robinson-Backmon, 2005) or peer-assessment (Roberts, Johnson, ,and Groesbeck, 2004; Venables and Summit, 2005; Rieber, 2006). Campbell, Mothersbaugh, Brammer, and Taylor (2001) studied the efficacy of peer versus self-assessment of oral presentation skills. Their results indicated that when raters are trained, both holistic and analytical peer assessments are meaningful but that self assessment is a weak substitute for either peer or instructor assessments.
Cho, Schunn and Wilson (2006) found that scaffolded four-peer assessments of writing utilizing peer-guidance, clear rubrics, and incentives to take assessments seriously were as highly reliable and valid as instructor ratings, although students found them low in reliability and validity. Nicol and Macfarlane-Dick (2006) extended the formative assessment theory of Sadler (1989) by presenting a student self-regulation model in support of their contention that assessment practices can be strengthened by giving students more responsibility in learning.

Page 71
Academy of Educational Leadership Journal, Volume 15, Number 4, 2011
The trend toward creative approaches to measuring learning of qualitative skills, such as critical thinking and critical reflection (Treleaven and Voola, 2008) is increasing. Indiana University is using an Assessment Center to measure learning in seven qualitative skill areas: decision-making, initiative, leadership, planning, organizing, teamwork and oral communication (Bommer, Rubin, and Bartels, 2005). Much progress is being made in activities-based assessment of learning (Coates, 2005; Laditka and Houck, 2006; Brickner and Etter, 2008), including an innovative ‘outside-the-classroom’, co-curricular program (Santella and Emery, 2007). Mallet (2007) presented the results of the use of a mock “conference day” assessment technique where advanced undergraduate students in applied mathematics and engineering wrote and presented papers on “mathematics and sports” and were assessed on those activities.
Schools have considered and adopted technology-enabled assessment tools for measuring, collecting, and analyzing learning (Bennett, 2002; Buzzetto-More and Alade, 2006; Vendlinski and Stevens, 2002). Marriott and Lau (2008) found that the introduction of a qualitative study of the introduction of on-line summative assessments into a first-year financial accounting course resulted in student perception of increased learning, motivation, and engagement. Ridgway, McCusker, and Pead (2004) presented the case that technology-based assessment encourages the rethinking of curricula and supported the use of tools such as e-portfolios in the assessment of skills linked to business management, such as social skills and group work.
E-portfolios are being used to both enhance and assess learning, with innovative assessment approaches using e-portfolios such as the Pentagonal E-portfolio Model to assess degree mastery in the Department of Business, Management, and Accounting at the University of Maryland Eastern Shore (Buzzetto-More and Alade, 2007). Merrimack College (Popper, 2005) and Alverno College (Buzzetto-More, 2010) also use e-portfolios to complement assessment. Bhattacharya and Hartnett (2007) described a methodology to assess learning based on the design and development of e-portfolios.
Researchers also have provided recommendations and results on the use of simulations to assess business subject learning (Thavikulwat, 2004; Hall and Ko, 2006; Schumann, Scott, and Anderson, 2006; Paranto, Neumann, and Zhang, 2008; Seaton and Boyd, 2008). Baker, Campbell, Capozzoli, Malgeri, and Roberts (2007) described how an integration of a business environment simulation (CompXM®) with Major Field Tests addresses measurement of learning.
The recent literature on assessment approaches reflects a mix of more traditional means of assessment with new technology-driven approaches. One of the benefits of an AACSB AoL revision is the positive and creative reaction of program leaders to the challenge. AoL Procedures
Researchers and program leaders have responded to the revised AACSB AoL standards and guidelines with innovative AoL procedures that incorporate new approaches, methodologies,

Page 72
Academy of Educational Leadership Journal, Volume 15, Number 4, 2011
and assessment tools as describe above. Many of procedures already implemented conform to the multi-step AACSB guideline and have “closing the loop” processing approaches (based on those procedures) to curriculum improvement, showing results for on-site programs (Ammons and Mills, 2005; Hollister and Koppell, 2007; Welch and Kleckner, 2008; Borin, Metcalf, and Tietje, 2009; Gardiner, Corbitt, and Adams, 2010) as well as in online learning environments (Lu, Hayes, and Yu, 2009). The recursive AoL model presented below is an extension of that innovative effort.
RECURSIVE AOL MODEL STRUCTURE
Although AACSB does not direct schools to adopt a specific AoL procedure or follow a specific AoL process, the organization does provide guidance that the procedure should include the following five steps in some form (AACSB, 2007):
1. Definition of student learning goals and objectives. 2. Alignment of curricula with the adopted goals. 3. Identification of instruments and measures to assess learning. 4. Collection, analyzing, and dissemination of assessment information. 5. Using assessment information for continuous improvement of the program curriculum including
documentation that the assessment process is being carried out in a systematic, ongoing basis.
The Program’s five-step, recursive AoL procedure, as illustrated in Figure 1, conforms to the AACSB guidance. The fifth step of the AACSB guidance includes two elements: (a) the use of assessment information to implement continuous and systematic curriculum improvement and (b) the documentation of that improvement. The Program AoL process provides the first element - continuous improvement - through recursive calls from Step 4 and the second element – documentation - in Step 5 of the Program AoL procedure.
Recursion (from the Latin recurrere, meaning to “run back”) is the process through which one of the steps of a procedure calls for the complete procedure to be processed again from within the calling procedure. A procedure is recursive when recursion takes place during one of the steps of the procedure. Therefore, recursion occurs during the process, not in the set-up of the procedure. In the AoL procedure illustrated in Figure 1, the recursive AoL process occurs in the implementation of the AoL procedure, and recursive calls are made during the AoL process that takes place during an accreditation review cycle.
Recursion is used in many fields. Computer programming languages such as C++ and Java are recursive in structure by allowing programmers to write a procedure that repeatedly calls itself until some terminating condition is met (Van-Roy and Haridi, 2004). In mathematics, a recursive function, such as the factorial function or the Fibonacci sequence, depends on the function’s previous values to create new ones (Johnsonbaugh, 2008). In economics, Stokey, Lucas, and Prescott (1989) have pioneered the development of recursive economics which is

Page 73
Academy of Educational Leadership Journal, Volume 15, Number 4, 2011
based on complex models using dynamic differential equations. Recursion also occurs in linguistics where sentences or phrases can be embedded in other sentences or phrases, lending to the infinite nature of languages (Tomalin, 2006, pp. 60-67,168-174).
The validity of applying recursion to a process such as AoL rests on four criteria.
1. The procedure must have a base case that can be solved. Recursive procedures (or functions) are stated in terms of a base case and general cases. A base case is non-recursive and represents a final solution, terminating condition, or end of the process. In the AoL procedure, the base case is the AoL section of the final five-year reaccreditation review document or, for multi-review cycles, a longer-term AoL assessment cycle document. Either of those final documents represents the end of the AoL process. At that point, as AoL is a continuous requirement for accreditation, program leadership restarts the AoL procedure, not as a recursive call, but as a fresh start. Over time, programs evolve. The program-specific body of knowledge advances. Courses, course content, and instructors change. Therefore a periodic “start-from-scratch” approach to re-establishing the structure for AoL within a program can provide significant benefits.
2. The procedure must have a general case. General cases are complete procedures from which a process can be run. At some step during the processing of a general case, a recursive call can be made. Recursive processes can have one or more recursive calls, each generating a new and identical general case procedure to be run to completion before returning to the general case from which the recursive call was made. An additional recursive call can be made from a new general case created from the previous recursive call as shown in Figure 1 for General Case #3 created by the second recursive call. When all returns from recursive calls are completed and the AoL process returns to the first (original) general case procedure, the process is completed to the terminating base case, i.e., the final documentation aggregating all the curriculum improvement activities performed during the assessment cycles.
3. The recursive call must make the problem smaller and approach the base case. For initial accreditation and reaccreditation, AACSB expects their five-step guidance to be implemented to demonstrated continuous curriculum improvement. Over a five-year reaccreditation period, there are logical and discrete time-frames associated with multiple learning assessment cycles as groups of students progress through a program to graduation. The recursion approach to AoL allows each recursive call to initiate a revision of the curriculum based on the analysis of assessment data collected during the previous assessment cycle. Therefore, each recursive call reduces the size of the long-term curriculum improvement task (by one assessment cycle) and moves one assessment cycle closer to the final, base case document.
4. Recursion must be the most efficient way to implement the procedure. This criterion normally is applied to computer-based tasks and refers to the amount of computer memory and system resources used in accomplishing the task. In the context of the AoL procedure, efficiency is derived from having a consistent and systematic approach to assessing student learning and improving the curriculum. Program leaders can plan in

Page 74
Academy of Educational Leadership Journal, Volume 15, Number 4, 2011
advance for AoL resource allocation. Consistency allows the program leadership, staff, and faculty to become proficient in implementing the process. Documentation is efficient and time-based, allowing the accreditation review team to easily understand the actions taken and results achieved in assessing learning and improving the curriculum.
Figure 1
Recursive AoL Model Structure
The following is a description of the five steps of the Program AoL procedure. Step 1. Definition of student learning goals and objectives
AACSB provides guidance that a degree program should develop 4-10 broadly-defined LGs consistent with the missions of the school and program and stated in student life-long learning outcomes upon graduation. LGs should address knowledge and skill areas from both a
.
.
••
••
1. Define 2. Align 3. Identify 4. Analyze 5. Document (Interim)
Recursive Call #2; General Case #3: 3rd Assessment Cycle (Curriculum Improvement)
1. Define 2. Align 3. Identify 4. Analyze 5. Document (Interim)
Recursive Call #1; General Case #2: 2nd Assessment Cycle (Curriculum Improvement)
1. Define 2. Align 3. Identify 4. Analyze 5. Final Document (Base Case)
1. Define 2. Align 3. Identify 4. Analyze 5. Document (Interim)
Recursive Call #n; General Case #N: Nth Assessment Cycle (Curriculum Improvement)
General Case #1: Long-Term Assessment Cycle

Page 75
Academy of Educational Leadership Journal, Volume 15, Number 4, 2011
general business and program-specific perspective. Furthermore, each LG should have more specific LOs that describe “a measurable attribute of the overall learning goal.” Finally, development of LGs and LOs should be a collaborative effort that includes faculty, alumni, students, and employers (AACSB, 2007).
The Program has an Executive Committee (EC) and a Curriculum Committee (CC) that reports to the EC. Each committee is comprised of the Program Director (PD), faculty, and alumni who are also employers of students. The SBA Dean sits on the EC but not the CC. The CC developed a set of six LGs which are consistent with the missions of the school and program and broadly stated as to the desired competency of graduating students. Although Palmer and Short (2008), in a recent survey of 408 AACSB-accredited business schools on the use and content of mission statements, found that the mission statements of many business schools lacked comprehensiveness, the mission statements of the SBA and Program were comprehensive in their scope and allowed the CC to identify LGs consistent with those statements.
For each LG, the CC defined from 2-6 LOs which are specific and measurable and map closely with their associated LGs. Students entering the Program are given the Program LGs and LOs with their orientation material. Figure 2 shows the mission-centric relationship between LGs and LOs. Step 2. Alignment of program curriculum with the defined LGs and LOs.
Curricular alignment occurs when a program organizes its teaching and learning activities to reflect desired student outcomes (Martell and Calderon, 2005). AACSB is specific in the importance of not only adopting LGs but also addressing them through LOs in the curriculum. To ensure that the Program curriculum addresses all LGs through their associated LOs, during the administrative preparation for their course, each instructor is required to select three Program LOs for which their course provides the most appropriate learning environment and to identify those LOs in their course syllabus. LO selections are monitored by the PD to ensure that all LOs are represented in two or more courses. Having LOs associated with specific courses demonstrates that students’ activities in those courses are contributing to achieving the program LGs and that the LGs and curriculum are aligned.
If, during a complete Program cycle, an LO is not represented by faculty selection in at least two courses, the PD will review that LO with the following questions: Is the LO only indirectly associated with the LG and possibly not appropriate for the Program curriculum? Does the curriculum need to be revised to more directly address the LO? Assuming that the LO was associated with a course in the previous cycle but not in the current cycle, what was the reason for the LO to be removed from that course? Is there rationale in the evolution of the program to replace an LO? The PD evaluates these questions and, based on that evaluation, makes recommendations to the CC.
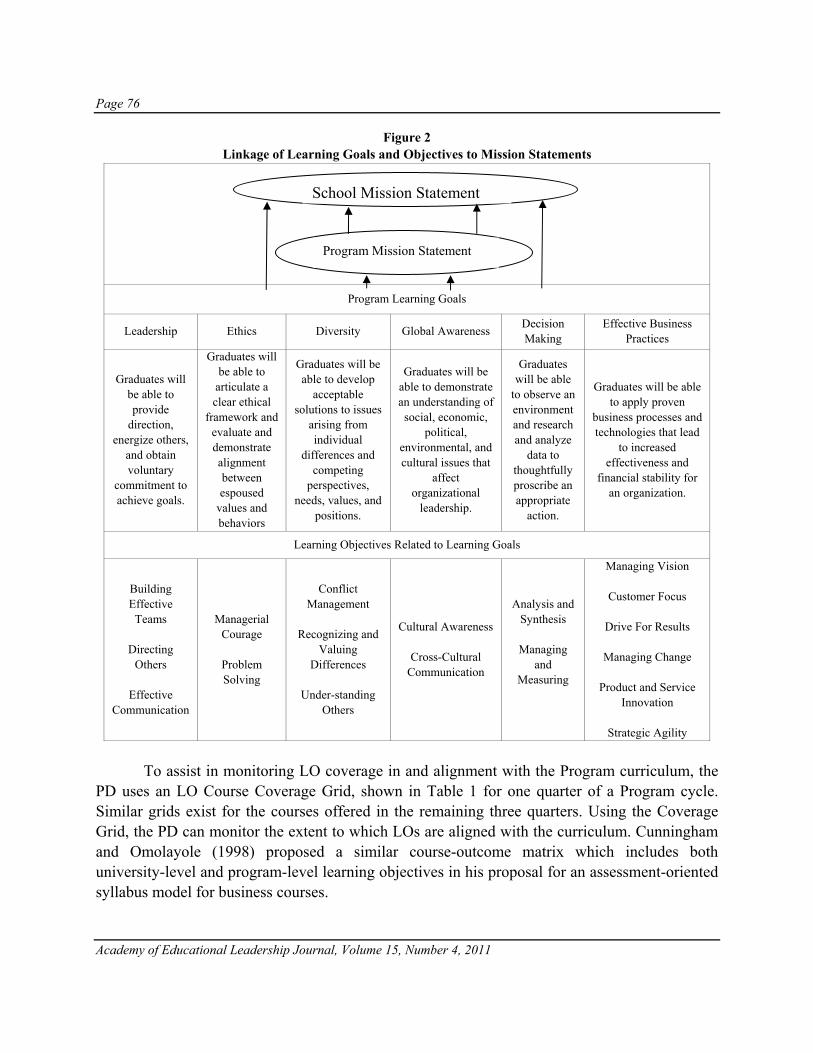
Page 76
Academy of Educational Leadership Journal, Volume 15, Number 4, 2011
Figure 2 Linkage of Learning Goals and Objectives to Mission Statements
Program Learning Goals
Leadership Ethics Diversity Global Awareness Decision Making
Effective Business Practices
Graduates will be able to provide
direction, energize others,
and obtain voluntary
commitment to achieve goals.
Graduates will be able to
articulate a clear ethical
framework and evaluate and demonstrate alignment between espoused
values and behaviors
Graduates will be able to develop
acceptable solutions to issues
arising from individual
differences and competing
perspectives, needs, values, and
positions.
Graduates will be able to demonstrate an understanding of social, economic,
political, environmental, and cultural issues that
affect organizational
leadership.
Graduates will be able
to observe an environment and research and analyze
data to thoughtfully proscribe an appropriate
action.
Graduates will be able to apply proven
business processes and technologies that lead
to increased effectiveness and
financial stability for an organization.
Learning Objectives Related to Learning Goals
Building Effective Teams
Directing
Others
Effective Communication
Managerial Courage
Problem Solving
Conflict Management
Recognizing and
Valuing Differences
Under-standing
Others
Cultural Awareness
Cross-Cultural Communication
Analysis and Synthesis
Managing
and Measuring
Managing Vision
Customer Focus
Drive For Results
Managing Change
Product and Service Innovation
Strategic Agility
To assist in monitoring LO coverage in and alignment with the Program curriculum, the
PD uses an LO Course Coverage Grid, shown in Table 1 for one quarter of a Program cycle. Similar grids exist for the courses offered in the remaining three quarters. Using the Coverage Grid, the PD can monitor the extent to which LOs are aligned with the curriculum. Cunningham and Omolayole (1998) proposed a similar course-outcome matrix which includes both university-level and program-level learning objectives in his proposal for an assessment-oriented syllabus model for business courses.
Program Mission Statement
School Mission Statement

Page 77
Academy of Educational Leadership Journal, Volume 15, Number 4, 2011
Table 1 Coverage of Learning Objectives within Program Curriculum
Quarter 1 Courses
Learning Goal
Learning Objectives
Preparing for Leadership
Optimizing Individual Learning
Leadership, Power & Politics
Ethics in the Workplace
Communicating Your Leadership Point-of- View
Diversity
Conflict Management X X X
Recognizing &Valuing Differences
X X
Understanding Others X X
Step 3. Identification of instruments and measures to assess learning.
AACSB provides program leadership with significant flexibility in identifying instruments and measures to assess the achievement of LGs and LOs and suggests three assessment approaches.
1. Selection is an approach by which students are selected for a program based upon an existing knowledge or skill acquired through a previous educational experience. Examples are knowledge of a second language or an acceptable competency in an area of study such as statistics, writing, or the use of a certain technology.
2. Demonstration of student achievement is an approach that measures student achievement of one or more LGs through stand-alone testing or performance, normally done outside the classroom and using a standardized assessment form or exam. According to AACSB, this approach works best when assessment is done as a requirement for graduation, e.g., a case or written thesis.
3. Course-embedded measures are examples of student course work (e.g., assignments or presentations) which provide evidence of achievement of program LGs and LOs.
The Program has adopted “course-embedded” measures to assess LGs. Each instructor is
required to identify one or more of their course assignments to measure the degree of achievement of the three LOs they have aligned with their course. For example, the instructor for the “Leadership in a Team Context” course might align the LOs “Building Effective Teams”, “Conflict Management”, and “Effective Communication” with her course although other LOs might be addressed in the course, but less directly. She then would identify course assignments that she believes are most related to students making progress in achieving the three LOs of the course. For example, she may identify Assignment A with both “Building Effective Teams” and “Conflict Management” and Assignment B with “Effective Communication.”. Alternatively, she might have one large assignment to which she would align all three LOs.
The instructor will inform students, through her syllabus and in class, that their performance on specific course assignments will be evaluated for two separate and distinct purposes: (a) their course assignment grade and (b) their competency level in the LOs aligned with the course.

Page 78
Academy of Educational Leadership Journal, Volume 15, Number 4, 2011
Students will also be informed that the Program LO assessment is a separate and distinct process from the former and driven by accreditation-based Program AoL requirements.
To facilitate Program LO assessments, the Program provides instructors with scoring rubrics using a five-point Likert scale. Descriptions for three score levels (1, 3, and 5) are provided on each rubric form to promote consistency in assessments across all courses (and different instructors) with which a particular LO is aligned. The Program CC creates the rubrics in cooperation with instructors. Allen and Knight (2009) have provided a methodology for creating rubrics internally, although others have used well-established rubrics that have been widely published and evaluated in the literature (Rexeisen and Al-Khatib, 2009). The CC also selects the Program-wide rubric score benchmark, based on the 1-5 scale, against which course- and Program-level LG and LO achievement is evaluated. The PD guides instructors to give students realistic scores in line with the competency demonstrated through their performance in the assignments.
Figure 3 shows the rubric for the “Effective Communication” LO. Instructors can distribute these assessments to students so that students are able to monitor their progress on LOs throughout the Program. Discussions among instructors and students can provide valuable counseling to students on strengths and weaknesses as well as plans for improvement as they continue through the program. Step 4. Collection, analysis, dissemination, and use of assessment information for continuous curriculum improvement.
AACSB directs that assessment data should be collected “systematically across AACSB review cycles . . . at least twice within each review cycle.” Furthermore, data should be shared with a standing faculty committee and analyzed to determine the degree to which LGs are being achieved and whether curriculum improvements are needed (AACSB, 2007). The timely availability, use, and management of assessment measurement data by AoL administrators and faculty are critical to the success of the AoL effort (Dhir, 2005).
Recursive calls are invoked in this step of the Program’s AoL procedure. Each recursive call creates a new general case which is a revisionary repeat of the complete five-step AoL procedure over a new assessment cycle, concentrating efforts on those areas where improvement is needed. Improvement areas are identified through the analysis of the assessment data collected during the previous assessment cycle.
In this step, score data are collected on a continuing basis from the LO rubrics completed for each course. Table 2 shows the format of the rubric score matrix for a program cycle. Program leadership will need to decide on the mathematical approach to representing individual student scores that comprise the overall average. The weighted mean is the most logical choice to represent AoL outcomes.
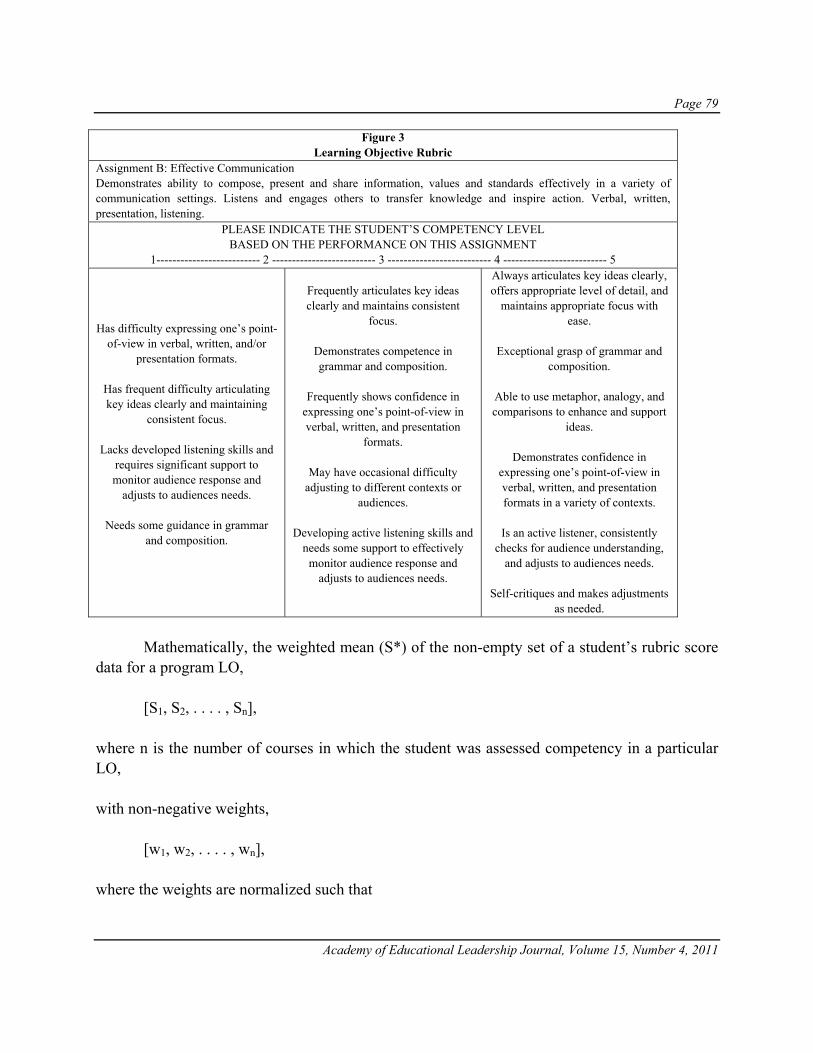
Page 79
Academy of Educational Leadership Journal, Volume 15, Number 4, 2011
Figure 3 Learning Objective Rubric
Assignment B: Effective Communication Demonstrates ability to compose, present and share information, values and standards effectively in a variety of communication settings. Listens and engages others to transfer knowledge and inspire action. Verbal, written, presentation, listening.
PLEASE INDICATE THE STUDENT’S COMPETENCY LEVEL BASED ON THE PERFORMANCE ON THIS ASSIGNMENT
1-------------------------- 2 -------------------------- 3 -------------------------- 4 -------------------------- 5
Has difficulty expressing one’s point-of-view in verbal, written, and/or
presentation formats.
Has frequent difficulty articulating key ideas clearly and maintaining
consistent focus.
Lacks developed listening skills and requires significant support to monitor audience response and
adjusts to audiences needs.
Needs some guidance in grammar and composition.
Frequently articulates key ideas clearly and maintains consistent
focus.
Demonstrates competence in grammar and composition.
Frequently shows confidence in
expressing one’s point-of-view in verbal, written, and presentation
formats.
May have occasional difficulty adjusting to different contexts or
audiences.
Developing active listening skills and needs some support to effectively
monitor audience response and adjusts to audiences needs.
Always articulates key ideas clearly, offers appropriate level of detail, and
maintains appropriate focus with ease.
Exceptional grasp of grammar and
composition.
Able to use metaphor, analogy, and comparisons to enhance and support
ideas.
Demonstrates confidence in expressing one’s point-of-view in verbal, written, and presentation formats in a variety of contexts.
Is an active listener, consistently
checks for audience understanding, and adjusts to audiences needs.
Self-critiques and makes adjustments
as needed.
Mathematically, the weighted mean (S*) of the non-empty set of a student’s rubric score data for a program LO,
[S1, S2, . . . . , Sn], where n is the number of courses in which the student was assessed competency in a particular LO, with non-negative weights,
[w1, w2, . . . . , wn],
where the weights are normalized such that

Page 80
Academy of Educational Leadership Journal, Volume 15, Number 4, 2011
is the quantity
If the arithmetic mean is used, then all weights (wi) are equal resulting in LO competencies scores in earlier courses contributing the same to the mean as scores in later courses. However, most students will show progress in the competencies addressed by the Program LOs as they advance through courses of the Program and, as a result, will show increasing scores. The use of arithmetic means would likely under-represent the actual learning taking place in a program.
Use of a weighted mean allows rubric scores achieved in later courses to have more importance (higher weights) in the overall mean than scores in the earlier courses (lower weights). However, the ultimate objective is to have all students achieve a benchmark LG score by the end of the program. Since LG scores are not directly measured, they are comprised of the scores of the LOs associated with them. An appropriate measure of a students’ achievements of program LOs is the score for the final course of the program with which an LO was aligned. In the context of the weighted mean, the weight of the final score is 1.0 and the weights of all others are zero.
A consideration in using an LO rubric score in the final course aligned with that LO is that the course may occur earlier rather than later in the program. This creates the possibility that the rubric scores achieved in that final course aligned with an LO will be lower by some degree than the actual achievement of that LO at the end of the Program. The Program PD has the overview of the LO/course alignments through the “LO Course Coverage Grid” (Table 1) and can assure that all LOs are aligned with and assessed in courses throughout the program. Also, instructors could have the option of aligning more than three LOs in later courses to increase the coverage of LO achievement assessment toward the end of the program. Of course, earlier courses could completely address some program LOs, in which case the rubric score for the final course aligned with those LOs would be sufficient.
In the body of Table 2, the arithmetic mean of all students’ final rubric scores are shown for the LOs associated with the LG, Effective Business Practices. This information allows the PD to see the progress of learning within an assessment cycle. The bottom line of the table shows the arithmetic mean of the scores achieved by students in the final course with which the LO is aligned. Note that data shown in all tables and figures are for illustration purposes and do not reflect the actual Program scores.
i=1 Σwi = 1 n
i=1 S*=ΣwiSi
n

Page 81
Academy of Educational Leadership Journal, Volume 15, Number 4, 2011
Regarding learning benchmarks, the Program CC recommends to the Executive Committee Program-wide learning achievement benchmarks for (a) final rubric scores for all individual LOs and aggregate LO scores for LGs, and (b) the percentage of students achieving the benchmark LO and LG scores. These benchmarks, e.g., 4.0 for both elements of (a) and 90% for (b), represent reference points for learning achievement and curriculum improvement and conform to the AACSB guideline that “internal benchmarks should provide challenging, but attainable goals” (AACSB, 2007). The latter benchmark - percentage of students achieving the benchmark LO and LG scores – can be considered a program-based “breadth of learning” indicator.
Table 2 Arithmetic Mean Of Students’ Rubric Scores by Course for “Effective Business Practices” Learning Objectives
Managing Vision
Customer Focus
Drive for Results
Managing Change
Product & Service
Innovation
Strategic Agility
Course 1 3.4 3.5 Course 2 3.9 3.8 Course 3 3.7 3.2 Course 4 3.7 3.8 Course 5 4.2 3.4 Course 6 3.8 4.0 Arithmetic mean of final LO rubric scores
4.2 4.1 4.4 4.3 3.7 4.2
Learning Goal Mean* = 4.15 * Learning Goal Mean = the arithmetic mean of all final rubric scores for the LOs associated with the “Effective Business
Practices” LG
From the completed assessment cycle data, the PD assembles, displays, and analyzes the data on the following five levels for the Program leadership (Curriculum Committee and Executive Committee):
1. Current assessment cycle arithmetic mean levels of the final rubric scores and their standard deviations for all Program LOs (Figure 4),
2. Arithmetic mean of students’ final rubric scores for the “effective business practices” learning objectives – three program cycles (Figure 5),
3. Percent of students achieving benchmark score for “effective business practices” learning objectives – three program cycles (Figure 6),
4. Aggregated learning goal scores – three program cycles (Figure 7), and 5. Percent of students achieving benchmark score in learning goals – three program cycles (Figure 8).
Figures 5-8 are multi-cycle assessment data representations. The dynamic context of the
figures allows program leadership to determine whether improvement measures have been effective.

Page 82
Academy of Educational Leadership Journal, Volume 15, Number 4, 2011
In the analyses, the PD looks for areas of learning that do not meet the benchmark levels for Program LOs and LGs. For example, Figure 4 shows the arithmetic mean levels of the final rubric scores and their standard deviations for all Program LOs. Standard deviations are included to indicate the dispersion of scores among students. The data shown in Figure 4 reveal that four LOs - Problem Solving, Recognizing & Valuing Differences, Understanding Others, and Product & Service Innovation – did not meet the benchmark level of 4.0. Figure 4
Arithmetic Mean Levels of Final Rubric Scores and Standard Deviations for all Program Learning Objectives
Figure 5 displays the arithmetic mean of students’ final rubric scores for the “Effective
Business Practices” LOs over three assessment cycles. The figure shows that the LOs of “Managing Vision”, “Customer Focus”. “Drive For Results”, and “Strategic Agility” had advances in learning achievement with above-benchmark score results in the most recent cycle. The LO of “Managing Change” maintained a stable learning level above the benchma rk. However, the LO of “Product and Service Innovation” showed a decline in learning over the last three assessment cycles with all three cycles having below-benchmark mean scores. The PD would address the below-benchmark condition in the curriculum improvement actions taken during the next recursive call.
Figure 6 presents a “breadth of learning” perspective by showing the percentage of students who have finished the program with higher-than-benchmark LO scores during the last three assessment cycles. In the example presented in the figure, the “breadth of learning benchmark” is 90%, i.e., at least 90% of students achieve a higher-than-benchmark (4.0) final LO rubric score. Figure 6 shows that all of the “Effective Business Practices” LOs except “Product & Service Innovation” exceeded the “breadth of learning” benchmark. The “breadth of
0.00.51.01.52.02.53.03.54.04.55.0
Scor
es
Learning Objectives Scores Std. Dev. of Scores

Page 83
Academy of Educational Leadership Journal, Volume 15, Number 4, 2011
learning” perspective is important in that solely analyzing the arithmetic mean of the final scores may mask a bimodal distribution, e.g., half of the students achieve lower-than-benchmark scores and half achieve higher-than-benchmark scores, clearly subpar “breadth of learning” achievement.
In addition to the scores for the individual LOs, aggregate LG scores are calculated as an arithmetic mean of their associated LO score averages. The LG score benchmark is the same as the LO benchmark of 4.0. Program leadership looks for achievement of LGs in the current assessment cycle as well as improvement in learning over multiple cycles. The data in Figure 7 show that all but two LGs – Ethics and Diversity – had aggregated scores in excess of the benchmark. All LGs except Ethics had improvement in learning from the prior to the current period. Even though the Diversity LG had lower than benchmark results in the current cycle, improvement is taking place but needs to be accelerated.
The data presented in Figure 8 complement that of Figure 7 by showing the “breadth of learning” associated with LGs. Analysis of the “breadth of learning” data validates the need for improvement in both the Ethics and Diversity LGs by showing that less than the 90% of students are achieving the benchmark rubric score of 4.0 in those LGs.
Figure 5 Arithmetic Mean of Students’ Final Rubric Scores for the “Effective Business Practices” Learning Objectives
– Three Program Cycles
0.0
0.5
1.0
1.5
2.0
2.5
3.0
3.5
4.0
4.5
5.0
Managing Vision Customer Focus Drive for Results Managing Change Product & Service Innovation
Strategic Agility
Sco
re
Effective Business Practices Learning Objectives Cycle 1 Cycle 2 Cycle 3

Page 84
Academy of Educational Leadership Journal, Volume 15, Number 4, 2011
Figure 6 Percent of Students Achieving Benchmark Score for “Effective Business Practices”
Learning Objectives – Three Program Cycles
Figure 7
Aggregated Learning Goal Scores – Three Program Cycles
The data presented in Figures 4-8 as well as the PD’s analysis of that data are distributed
to the CC for members to determine whether the Program is (a) achieving its LG and LO benchmarks and (b) curriculum improvement actions are effective. Based on the analysis of the data presented in Figures 4-8 and the xxx for continuous improvement, the PD invokes a recursive call from this step of the AoL procedure. The effect of the recursive call is to begin a process of curriculum improvement during the upcoming assessment cycle based on the analysis of the data presented in Figures 4-8. The revisionary process is based on a repeat of the five-step AoL procedure and is described below with recursive steps denoted by an asterisk.
Step 1*. The CC addresses “re-defining” the LOs associated with the LGs of Ethics and Global Awareness, as those LGs did not meet the Program benchmark score. Also, at the
0.0
1.0
2.0
3.0
4.0
5.0
6.0
Leadership Ethics Diversity Global Awareness Decision Making Effective Business Practices
Scor
es
Learning Goals Cycle 1 Cycle 2 Cycle 3
0
10
20
30
40
50
60
70
80
90
100
Managing Vision Customer Focus Drive for Results Managing Change Product & Service Innovation
Strategic Agility
Perc
ent
Effective Business Practices Learning Objectives Cycle 1 Cycle 2 Cycle 3

Page 85
Academy of Educational Leadership Journal, Volume 15, Number 4, 2011
discretion of the CC, the PD will evaluate the four LOs - Product & Service Innovation, Problem Solving, Recognizing & Valuing Differences, and Understanding Others - that did not individually meet the benchmark level of 4.0 to determine whether they are still relevant to the Program or whether they need to be replaced by others more directly associated with the LG. If any other LOs show declining scores, they can also be subject to re-definition.
Step 2*. All instructors “re-evaluate” the alignment of the Program LOs they have selected as most associated with their course to determine whether, in the evolution of the course, they remain appropriate. If any are no longer appropriate, then instructors will select Program LOs more aligned with the course. Particular attention is paid to under-performing LOs.
Step 3*. All instructors “re-identify” the assignments in their course that most appropriately measure achievement of the Program LOs they have aligned with their course. If instructors determine that previously selected assignments no longer apply to the course LOs, then they will identify new assignments or reconfigure existing ones.
Figure 8 Percent of Students Achieving Benchmark Score in Learning Goals – Three Program Cycles
Step 4*. The PD collects and analyzes (using Figures 4-8 with updated data) the new
rubric score data generated over the new assessment cycle to determine whether (a) the revisions (Steps 1*-3* above) have resulted in improved learning and (b) what additional curriculum improvements are needed. Based on the CC’s identification of areas of improvement, the PD invokes another recursive call from this step, initiating another general case (repeat of the five-step process) for the upcoming assessment cycle.
76.0
78.0
80.0
82.0
84.0
86.0
88.0
90.0
92.0
94.0
96.0
Leadership Ethics Diversity Global Awareness Decision Making Effective Business Practices
Per
cent
Learning Goals Cycle 1 Cycle2 Cycle3

Page 86
Academy of Educational Leadership Journal, Volume 15, Number 4, 2011
Steps 5 and 5*. Documentation of the use of assessment information for continuous and systematic improvement of the program curriculum.
AACSB requires that business schools “demonstrate that assessment data are being used to inform the leadership and faculty about the effectiveness of their educational programs” and “…for AACSB accreditation reviews, schools should present examples of student performance on assessment measures and document how and where assessment outcomes have been used for continuous improvement of curricula” (AACSB, 2007). The final Step 5 (base case) of the AoL procedure represents the completion of the general cases and is the formal documentation of the curriculum improvement actions and results over the five-year reaccreditation period.
The path to the base case from the final general case (created by the final recursive call) is controlled by two operational requirements of a recursive procedure: (a) a recursive call must be completed before returning to the general case from which the call was made and (b) on the return, processing continues to the step immediately after the step that triggered the call. As shown in Figure 1, when the final general case is completed with the Step 5* documentation of the final assessment cycle’s curriculum improvement activities, control returns to Step 4* of the previous general case. The return completes that Step 4* and allows that general case to progress to its own Step 5* documentation of curriculum revisions and student learning results that have occurred during that single assessment cycle. The sequence continues until control returns to the initial general case (#1) and the “base case” aggregation of the documentation of all general cases. The base case product is the final AoL documentation for the accreditation review team.
CONCLUSION
The recursive approach to AoL provides the following benefits:
• A continuous, recurring process of curriculum improvement is inherent in the approach. • The five-step procedure follows the AACSB guidelines in content and order. • Recursive calls initiate periodic and distinct curriculum assessment and improvement cycles which allows
program leaders to take a dynamic, analytical approach to AoL. • Each cycle of curriculum improvement has a discrete short-term time-frame which is logical within the
longer-term time-frame of reaccreditation. • The processes invoked by the recursive calls provide systematic information on and the analysis of the
results of (a) curriculum-improving revisions to LG and LO definitions, (b) alignment of LOs with the curriculum, and (c) identification of assessment instruments to measure LO achievement.
• As a result of the revisionary actions taken during each discrete recursive call, curriculum improvements can be documented in an efficient and time-based manner for evaluation by the accreditation review team.
Implementing an AoL Process, whether using the recursive approach described above or any
other, requires leadership commitment and faculty support. All instructors understand the importance of accreditation, yet may see participation in an AoL process as (a) an additional
Page 87
Academy of Educational Leadership Journal, Volume 15, Number 4, 2011
responsibility in their course offering or (b) an additional means by which the instructor will be evaluated (for example, whether student scores exceed the program benchmark) or (c) a violation of academic freedom or a combination of all. Leadership efforts to ensure faculty understanding of and involvement in the AoL process, even on merely an informational basis, with the clear objectives of high quality of learning and continuous improvement of the curriculum will help alleviate these perceptions.
REFERENCES AACSB (Association to Advance Collegiate Schools of Business International). (2007). AACSB Assurance of
Learning Standards: An Interpretation. [Electronic version]. Retrieved May 1, 2010, from www.aacsb.edu/accreditation/papers/AoLPaper-final-11-20-07.pdf
AACSB (Association to Advance Collegiate Schools of Business International). (2010). Eligibility Procedures and
Accreditation Standards for Business Accreditation [Electronic version]. Retrieved May 1, 2010, from http://www.aacsb.edu/accreditation/AAACSB-Standards-2010.pdf
Allen, S., & Knight, J. (2009). A method for collaboratively developing and validating a rubric. International
Journal for the Scholarship of Teaching and Learning, 3(2), 1-17. Ammons, J. L., & Mills, S. K. (2005). Course-embedded assessments for evaluating cross-functional integration and
improving the teaching-learning process. Issues in Accounting Education, 20(1), 1-20. Bagamery, B. D., Lasik, J. J., & Nixon, D. R. (2005). Determinants of success on the ETS business major field exam
for students in an undergraduate multisite regional university business program. The Journal of Education for Business, 81(1), 55-63.
Baker, H., Campbell, J., Capozzoli, E., Malgeri, L., & Roberts, G. (2007). Developing A customized program
assessment methodology for assurance of learning: A case study. Journal of College Teaching & Learning, 4(8), 47-64.
Beard, D., Schwieger, D., & Surendran, K. (2008). Integrating soft skills assessment through university, college, and
programmatic efforts at an AACSB accredited institution. Journal of Information Systems Education, 19(2), 229-240.
Bennett, R. E. (2002). Inexorable and inevitable: The continuing story of technology and assessment. Journal of
Technology, Learning, and Assessment, 1 (1). Available at http://www.jtla.org Betters-Reed, B. L., Nitkin, M. R., & Sampson, S. D. (2008). An assurance of learning success model: Toward
closing the feedback loop. Organization Management Journal, 5(4), 224-240. Betts, R. (2008). Teaching and assessing basic concepts to advanced applications: Using bloom’s taxonomy to
inform graduate course design. Academy of Educational Leadership Journal, 12(3), 99–106.

Page 88
Academy of Educational Leadership Journal, Volume 15, Number 4, 2011
Bhattacharya, M., & Hartnett, M. (2007). E-portfolio assessment in higher education. Frontiers in Education Conference-Global Engineering: Knowledge without Borders, Opportunities without Passports, 2007. FIE'07. 37th Annual, T1G-19.
Black, H. T., & Duhon, D. L. (2003). Evaluating and improving student achievement in business programs: The
effective use of standardized assessment tests. The Journal of Education for Business, 79(2), 90-98. Bommer, W. H., Rubin, R. S., & Bartels, L. K. (2005). Assessing the unassessable: Interpersonal and managerial
skills. In K. Martell & T. Calderon (Eds.) Assessment of Student Learning in Business Schools: Best Practices Each Step of the Way, 1 (pp. 103-129). Tallahasee, FL: The Association for Institutional Research and AACSB International.
Borin, N., Metcalf, L. E., & Tietje, B. C. (2008). Implementing assessment in an outcome-based marketing
curriculum. Journal of Marketing Education, 30(2), 150-159. Brickner, D. R. & Etter E. R.. (2008). Strategies for promoting active learning in a principles of accounting course.
Academy of Education Leadership Journal, 12(2), 87- 93. Bush, H. F., Duncan, F. H., Sexton, E. A., & West, I. C. T. (2008). Using the major field test-business as an
assessment tool and impetus for program improvement: Fifteen years of experience at Virginia Military Institute. Journal of College Teaching & Learning, 5(2), 75-88.
Buzzetto-More, N. (2010). Applications of E-Portfolios for Value Added Assessment. In N. Buzzetto-More (Ed.),
The E-Portfolio Paradigm: Informing, Educating, Assessing, and Managing With E-Portfolios (pp. 225-246). Santa Rosa: CA: Informing Science Press.
Buzzetto-More, N., & Alade, A. (2008). The pentagonal electronic portfolio model for selecting, adopting, building,
and implementing an e-portfolio. Journal of Information Technology in Education, 7, 45-70. Available at http://www.jite.org/documents/Vol7/JITEv7IIP045-070More383.pdf
Buzzetto-More, N., Alade, A. & Panda, D. (2007). Using e-learning to drive a student learning outcomes based
assessment program. In N. Buzzetto-More (Ed.), Advanced Principles of Effective E-Learning (pp. 213-244). Santa Rosa: CA: Informing Science Press.
Bycio, P., & Allen, J. S. (2004). A critical incidents approach to outcomes assessment. The Journal of Education for
Business, 80(2), 86-92. Campbell, K. S., Mothersbaugh, D. L., Brammer, C., & Taylor, T. (2001). Peer versus self assessment of oral
business presentation performance. Business Communication Quarterly, 64(3), 23-42. Cho, K., Schunn, C. D., & Wilson, R. W. (2006). Validity and reliability of scaffolded peer assessment of writing
from instructor and student perspectives. Journal of Educational Psychology, 98(4), 891-901. Coates, H. (2005). The value of student engagement for higher education quality assurance. Quality in Higher
Education, 11(1), 25-36.

Page 89
Academy of Educational Leadership Journal, Volume 15, Number 4, 2011
Cunningham, B., & Omolayole, O. (1998). An assessment-oriented syllabus model for business courses. The Journal of Education for Business, 73(4), 234-240.
Dhir, K. (2005). Content access and the use of data for student learning: The case of Berry College. In K. Martell &
T. Calderon (Eds.) Assessment of Student Learning in Business Schools: Best Practices Each Step of the Way, 1(2) (pp. 167-183). Tallahasee, FL: The Association for Institutional Research and AACSB International.
Gardiner, L. R., Corbitt, G., & Adams, S. J. (2010). Program assessment: Getting to a practical how-to model. The
Journal of Education for Business, 85(3), 139-144. Green, J., K.W., Stark, C., & Haley, J. (2007). Closing the loop on assessment in a school of business. International
Journal of Management in Education, 1(1), 43-56. Hall, O. & Ko, K. (2006). Learning assurance using business simulations: applications to executive management
education. Developments in Business Simulation and Experiential Learning, 33, 1-6. Hedin, S. R., Barnes, C. H., & Chen, J. C. H. (2005). AACSB 2003 accreditation standards: Impact on continuous
quality improvement. International Journal of Services and Standards, 1(3), 358-378. Hollister, K. K., & Koppel, N. B. (2007). Framework for meeting AACSB international's assurance of learning
requirements: Application to information technology. Journal of Informatics Education Research, 8(3), 1-14.
Johnsonbaugh, R. (2008). Discrete mathematics (7th ed.). Upper Saddle River, NJ: Pearson Prentice Hall. Julian, S. D., & Ofori-Dankwa, J. C. (2006). Is accreditation good for the strategic decision making of traditional
business schools? Academy of Management Learning and Education, 5(2), 225-233. Kilpatrick, J., Dean, K. L., & Kilpatrick, P. (2008). Philosophical concerns about interpreting AACSB assurance of
learning standards. Journal of Management Inquiry, 17(3), 200. Laditka, S. B., & Houck, M. M. (2006). Student-developed case studies: An experiential approach for teaching
ethics in management. Journal of Business Ethics, 64(2), 157–167. Lowrie, A., & Willmott, H. (2009). Accreditation sickness in the consumption of business education: The vacuum in
AACSB standard setting. Management Learning, 40(4), 411-420. Lynn, S. A., & Robinson-Backmon, I. (2005). Course-level outcomes assessment: an investigation of an upper-
division undergraduate accounting course and the factors that influence learning outcomes. Journal of Accounting and Finance Research, 13(4), 133-140.
Mallet, D. (2007). Authentic assessment for advanced undergraduate students. Australian and New Zealand
Industrial and Applied Mathematics Journal, 47, C524--C540. Marriott, P., & Lau, A. (2008). The use of on-line summative assessment in an undergraduate financial accounting
course. Journal of Accounting Education, 26(2), 73-90.

Page 90
Academy of Educational Leadership Journal, Volume 15, Number 4, 2011
Martell & T. Calderon (2005), Assessment of student learning in business schools: Best practices each step of the way (Vol. 1, pp. 167-183). Tallahassee, FL: Association for Institutional Research.
Maxim, B. R. (2004). Closing the loop: Assessment and accreditation. Journal of Computing Sciences in Colleges,
20(1), 7-18. Miles, M. P., Hazeldine, M. F., & Munilla, L. S. (2004). The 2003 AACSB accreditation standards and implications
for business faculty: A short note. The Journal of Education for Business, 80(1), 29-34. Mirchandani, D., Lynch, R., & Hamilton, D. (2001). Using the ETS major field test in business: Implications for
assessment. The Journal of Education for Business, 77(1), 51-56. Natarajan, R., & Barger, B. (2008). Improving performance through the Baldrige organizational profile: An
application in business education. Academy of Educational Leadership Journal, 12(1), 63-82. Nicol, D. J., & Macfarlane-Dick, D. (2006). Formative assessment and self-regulated learning: A model and seven
principles of good feedback practice. Studies in Higher Education, 31 (2), 199-218. Palmer, T. B., & Short, J. C. (2008). Mission statements in US colleges of business: An empirical examination of
their content with linkages to configurations and performance. The Academy of Management Learning and Education (AMLE), 7(4), 454-470.
Palomba, C.A., and T. W. Banta. (1999). Assessment Essentials. San Francisco, CA: Josey-Bass. Paranto, S., Neumann, H., & Zhang, L. (2008). Information Systems: Performing Application-Specific Assessment
of Student Performance. Issues in Information Systems, 9(1), 87-94. Popper, E. (2005). Learning goals: The foundation of curriculum development and assessment. In K. Pringle, C., &
Michel, M. (2007). Assessment practices in AACSB-accredited business schools. The Journal of Education for Business, 82(4), 202-211.
Rexeisen, R. J., & Al-Khatib, J. (2009). Assurance of learning and study abroad: A case study. Journal of Teaching
in International Business, 20(3), 192-207. Ridgway, J., McCusker, S., & Pead, D. (2004). Literature Review of e-Assessment. Bristol, UK: Nesta Future Lab.
Retrieved 5/1/10 from http://www.futurelab.org.uk/resources/documents/lit_reviews/Assessment_Review.pdf
Rieber, L. J. (2006). Using peer review to improve student writing in business courses. The Journal of Education for
Business, 81(6), 322-326. Roberts, W. A. Jr., Johnson, R., & Groesbeck, J. (2004). The faculty perspective on the impact of AACSB
accreditation. Academy of Educational Leadership Journal, 8(1), 111-125. Romero, E. J. (2008). AACSB accreditation: Addressing faculty concerns. The Academy of Management Learning
and Education (AMLE), 7(2), 245-255.
Page 91
Academy of Educational Leadership Journal, Volume 15, Number 4, 2011
Sadler, D. R. (1989). Formative assessment and the design of instructional systems. Instructional Science, 18(2), 119–144.
Santella, A. P., & Emery, C. A. (2007). Collegiate adventure program: Creating a business personality. Academy of
Educational Leadership Journal, 11(2), 81-91. Schumann, P. L., Scott, T. W., & Anderson, P. H. (2006). Designing and introducing ethical dilemmas into
computer-based business simulations. Journal of Management Education, 30(1), 195-219. Seaton, L. J., & Boyd, M. (2008). The effective use of simulations in business courses. Academy of Educational
Leadership Journal, 12, 107-118. Stokey, N. L., Lucas, R. E., & Prescott E. C. (1989). Recursive methods in economic dynamics. Cambridge, MA:
Harvard University Press. Thavikulwat, P., 2004. The tournament concept in assessment. Simulation & Gaming, 35(1), 5-28. Thompson, K. R. (2004). A conversation with Milton Blood: The new AACSB standards. Academy of Management
Learning & Education, 3(4), 429-439. Tomalin, M. 2006. Linguistics and the formal sciences: the origins of generative grammar. Cambridge, MA:
Cambridge University Press. Trapnell, J. E. (2007). AACSB International accreditation. Journal of Management Development, 26(1), 67-72. Treleaven, L., & Voola, R. (2008). Integrating the development of graduate attributes through constructive
alignment. Journal of Marketing Education, 30(2), 160-173. Van-Roy, P. and Haridi, S. (2004). Concepts, techniques, and models of computer programming. Cambridge, MA:
MIT Press. Venables, A., & Summit, R. (2003). Enhancing scientific essay writing using peer assessment. Innovations in
Education and Teaching International, 40(3), 281-290. Vendlinski, T., & Stevens, R. (2002). Assessing student problem-solving skills with complex computer-based tasks.
Journal of Technology, Learning, and Assessment, 1 (3). Retrieved 5/1/10 from http://escholarship.bc.edu/cgi/viewcontent.cgi?article=1010&context=jtla
Welch, O. & Kleckner, M. (2008). The use of an action item based system to implement and document embedded
assurance of learning activities in support of a School/Program’s strategy elements. Issues in Information Systems, 9(1), 37-43.
White, J. B., Miles, M. P., & Levernier, W. (2009). AACSB international and the management of its brand:
Implications for the future. Journal of Management Development, 28(5), 407-413. Zammuto, R. F. (2008). Accreditation and the globalization of business. The Academy of Management Learning and
Education (AMLE), 7(2), 256-268.

Page 92
Academy of Educational Leadership Journal, Volume 15, Number 4, 2011

Page 93
Academy of Educational Leadership Journal, Volume 15, Number 4, 2011
TEACHING STUDENTS TO WORK IN CLASSROOM TEAMS: A PRELIMINARY INVESTIGATION OF
INSTRUCTORS’ MOTIVATIONS, ATTITUDES AND ACTIONS
Hemant C. Sashittal, St. John Fisher College
Avan R. Jassawalla, State University of New York at Geneseo Peter Markulis, State University of New York at Geneseo
ABSTRACT
Teaching teamwork skills is strongly advocated in the management education literature.
What remains relatively under-investigated is what instructors do in terms of teaching teamwork after they assign team projects to their students, and why they do what they do. This paper reports findings of a two-stage study, and aims to discuss preliminary findings about instructors’ motivations, attitudes and actions relevant to the teaching of teamwork skills in management classes. Findings suggest that instructors’ motivations, attitudes, and actions related to teaching teamwork skills in classrooms are related in important ways, and hold several implications for new thinking and research.
INTRODUCTION
It is not uncommon for instructors of undergraduate management and MBA courses to assign complex class-related projects to student teams, and hold them collectively responsible for producing multiple learning-related outcomes. Scholars agree that student teams can represent active learning environments (Chowdhury, Endres & Lanis, 2002; Deeter-Schmelz, Kennedy & Ramsey, 2002; Holtham, Melville & Sodhi, 2006; Michaelson, Knight & Fink, 2002), and that teamwork can help students learn critical skills valued by potential employers (e.g., O’Conner & Yballe, 2007). A review of literature highlights the following: (a) even though team projects are common in management classes, too many students do not receive necessary coaching and instruction for teamwork (O’Conner & Yballe, 2007; Vik, 2001), and (b) poorly prepared and inadequately instructed students often disengage and view teamwork with cynicism (Buckenmyer, 2000; Connerley & Mael, 2001; Holmer, 2001). Scholars strongly argue in favor of teaching and instruction to help students cope with the demands of teamwork (see Bolton, 1999; Chen, Donahue & Klimoski, 2004; Deeter-Schmelz, Kennedy & Ramsey, 2002; Ettington & Camp, 2002; Holmer, 2001; McKendall, 2000; Page & Donelan, 2003; Vik, 2001).

Page 94
Academy of Educational Leadership Journal, Volume 15, Number 4, 2011
Despite the advocacy, the literature is mostly silent when it comes to describing business school instructors’ motivations and attitudes about, and actions directed toward teaching teamwork skills to students – particularly when they assign students to teams and require them to collectively complete comprehensive class-related projects. Our purpose here is to discuss preliminary evidence of instructors’ motivations, attitudes, and actions, and identify areas for future research that might help explain why the literature’s advocacy has not sufficiently translated into practice (i.e., why fewer instructors teach teamwork skills in their classrooms than those that assign students to teams). We aim to stimulate new thinking, and spur new research that can produce findings that speak to the practical, day-to-day realities of instructors – versus the intent to produce widely generalizable findings. Consistent with this intent, our findings emerge from: (a) a small-scale exploratory study (n=19) we conducted to produce a guiding hypothesis and develop scales, and (b) a survey that used a small (n=56), purposeful sample of instructors who share an interest in innovative teaching methods and assign students to classroom teams. We find evidence to suggest that instructor motivations and attitudes are misaligned, and that key motivators for assigning teamwork in classrooms ought to be acknowledged and legitimized before the literature’s advocacy produces meaningful results in the classroom.
METHOD Stage 1. Qualitative-data, hypotheses and scales We began by depth-interviewing nineteen instructors who taught Organizational Behavior courses in twelve business schools located in the Northeastern US, of whom sixteen taught only undergraduate courses and three taught only graduate courses. Participants: (a) allocated 25% or more of the students’ grades based on team-based assignments. Aligned with our interest in teamwork-instruction-related motivations, attitudes and actions, the depth interviews were guided by the following questions (asked in the following order):
• What is the purpose of assigning team projects in your classes? In other words, why do you assign students to teams and hold them responsible for completing class-related projects?
• What are your views about teambuilding? Do you believe it is your responsibility to conduct team building in your classes? Why or why not?
• What actions do you require students to take to improve team performance? Our sample included nine male and ten female instructors, who had taught full-time in business programs for an average of 14 years (minimum 2 years, maximum 30 years). They reported an average enrollment of 29 students in their Organizational Behavior classes (minimum 12, maximum 40). All interviews were tape recorded, transcribed, and content analyzed using the guidelines in Glaser & Strauss (1967) and Strauss & Corbin (1998). While

Page 95
Academy of Educational Leadership Journal, Volume 15, Number 4, 2011
each question began a discussion, the bulk of the findings emerged from the probing questions that sought clarifications and additional information. The process of content analysis was as follows. Two co-authors worked independently and identified the key themes in the responses of each instructor. First, based on transcripts, the co-authors created a data matrix; each row represented an interview, and each column represented a question. In each cell, the co-authors briefly summarized what the instructor had said in response to the relevant question. Then, based on data contained in the cells of each column, the co-authors identified themes and developed scales for assessing instructor motivations, attitudes, and actions. Second, the independently developed hypothesis and scales were compared and contrasted. Based on a consensus (i.e., 100% inter-coder reliability), a guiding hypotheses and relevant scales were developed to guide the second stage of the study. Findings, scales & hypothesis
We identified several key motivations for assigning students to classroom teams. First, the conviction that teamwork could produce deeper and wider learning of course content emerged as a primary driver. Second, some assigned teamwork because it promoted creativity among students. Third, instructors wanted students to learn important teamwork-related skills so that they could function better in work-teams. Fourth, instructors were driven by the desire to make more efficient use of their time and energy; i.e., teamwork reduced their workload at the end of the semester – when they could grade fewer team projects versus more individual assignments. Fifth, instructors were motivated by the desire to align their activities with the customs and traditions of the departments or business schools. In particular, they noted that they assigned teamwork in their classes because the business school required such assignments, and/or the previous instructor had assigned similar work, and they intended to continue in that tradition. The scales for assessing motivations for assigning teamwork that emerged from this data were (5-point Likert scale):
I assign students to teams in my classes because . . . • I believe teamwork enhances student learning of material. • I believe teamwork enhances creativity. • I want students to learn teamwork skills. • I want students to gain experience relevant to business. • It reduces my grading load. • The business department/program requires it. • The previous instructor used them.
This scale suggested the presence of two underlying dimensions: (a) the motivation to improve student learning, and (b) the motivation to increase faculty members’ convenience (i.e., reduce my grading load, do what the department suggests, and continue the tradition of the

Page 96
Academy of Educational Leadership Journal, Volume 15, Number 4, 2011
previous instructor). This led to the following hypothesis (please note, all hypotheses relate to business school instructors):
H1 Business school instructors assign students to teams and expect them to collectively complete
assignments motivated by: (a) the desire to improve student learning, and (b) the desire to increase their convenience.
Instructors take a variety of actions to improve teamwork; six required students to participate in teambuilding exercises they led. Among the specific activities they required of students were: (a) participating in ice-breakers, (b) setting of ground rules for participation in the team, and (c) providing mid-semester feedback to other team members. It is important to note no instructor required students to participate in all activities included on the list, and the requirements were not evenly distributed, i.e., only some instructors required their students to engage in some of these teamwork-enhancing activities. We compiled the following list of actions that the sampled instructors required of their students, whether they led formal teambuilding sessions or not:
I always REQUIRE students working in teams to (tick all those that apply) . . .
• Participate in team building exercise that I lead. • Conduct peer evaluations at the end of the semester. • Read relevant literature on effective teamwork. • Participate in an ice-breaker activity at the beginning of the semester. • Set formal goals for their team at the beginning of the team project. • Set ground rules for participation in the team. • Set milestones and deadlines for team-related activities. • Provide formal mid-term written feedback to each other.
This finding led to the development of the following hypothesis about instructors’ motivations and actions directed at improving teamwork:
H2 Proportionately fewer instructors require students to engage in teambuilding activities. H3 Instructors motivated by the desire to improve student learning are more likely to require students
to participate in teambuilding activities than those motivated by the desire to increase their convenience.
We identified multiple themes in instructors’ attitude toward teamwork-related instruction. In general, instructors said they did not conduct teambuilding in their classroom to the extent they liked, and identified four major reasons for this deficiency. First, lack of time was cited a principal reason for choosing to focus on course content related material, rather than on teambuilding (n=18). Second, most said they preferred to empower their students, and let them manage teamwork on their own (n=13). Third, some (n=5) noted that they were content
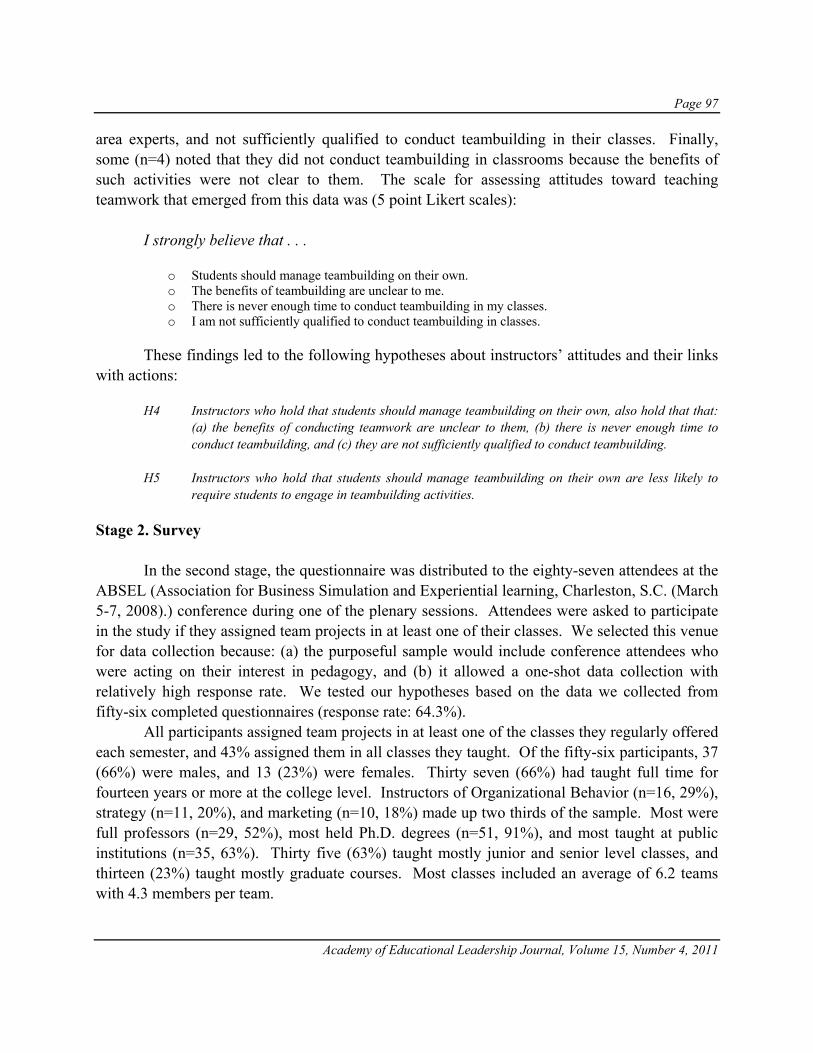
Page 97
Academy of Educational Leadership Journal, Volume 15, Number 4, 2011
area experts, and not sufficiently qualified to conduct teambuilding in their classes. Finally, some (n=4) noted that they did not conduct teambuilding in classrooms because the benefits of such activities were not clear to them. The scale for assessing attitudes toward teaching teamwork that emerged from this data was (5 point Likert scales):
I strongly believe that . . .
o Students should manage teambuilding on their own. o The benefits of teambuilding are unclear to me. o There is never enough time to conduct teambuilding in my classes. o I am not sufficiently qualified to conduct teambuilding in classes.
These findings led to the following hypotheses about instructors’ attitudes and their links with actions:
H4 Instructors who hold that students should manage teambuilding on their own, also hold that that: (a) the benefits of conducting teamwork are unclear to them, (b) there is never enough time to conduct teambuilding, and (c) they are not sufficiently qualified to conduct teambuilding.
H5 Instructors who hold that students should manage teambuilding on their own are less likely to
require students to engage in teambuilding activities. Stage 2. Survey
In the second stage, the questionnaire was distributed to the eighty-seven attendees at the ABSEL (Association for Business Simulation and Experiential learning, Charleston, S.C. (March 5-7, 2008).) conference during one of the plenary sessions. Attendees were asked to participate in the study if they assigned team projects in at least one of their classes. We selected this venue for data collection because: (a) the purposeful sample would include conference attendees who were acting on their interest in pedagogy, and (b) it allowed a one-shot data collection with relatively high response rate. We tested our hypotheses based on the data we collected from fifty-six completed questionnaires (response rate: 64.3%).
All participants assigned team projects in at least one of the classes they regularly offered each semester, and 43% assigned them in all classes they taught. Of the fifty-six participants, 37 (66%) were males, and 13 (23%) were females. Thirty seven (66%) had taught full time for fourteen years or more at the college level. Instructors of Organizational Behavior (n=16, 29%), strategy (n=11, 20%), and marketing (n=10, 18%) made up two thirds of the sample. Most were full professors (n=29, 52%), most held Ph.D. degrees (n=51, 91%), and most taught at public institutions (n=35, 63%). Thirty five (63%) taught mostly junior and senior level classes, and thirteen (23%) taught mostly graduate courses. Most classes included an average of 6.2 teams with 4.3 members per team.
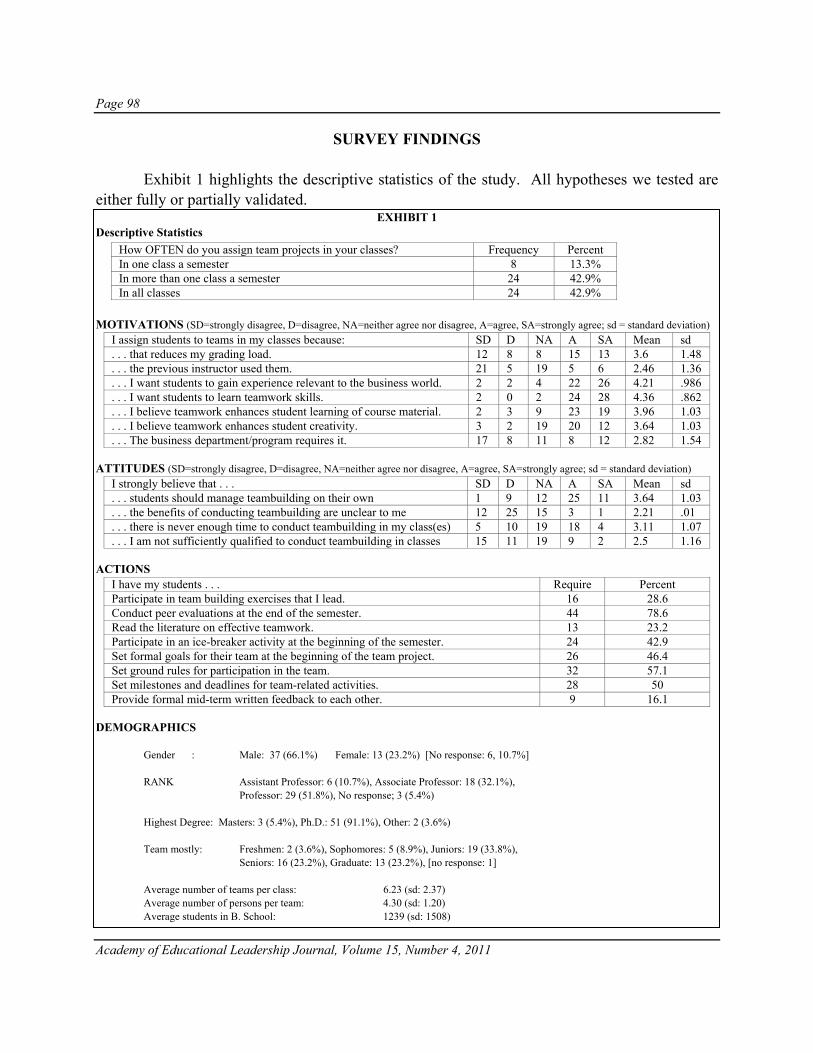
Page 98
Academy of Educational Leadership Journal, Volume 15, Number 4, 2011
SURVEY FINDINGS Exhibit 1 highlights the descriptive statistics of the study. All hypotheses we tested are either fully or partially validated.
EXHIBIT 1 Descriptive Statistics
How OFTEN do you assign team projects in your classes? Frequency Percent In one class a semester 8 13.3% In more than one class a semester 24 42.9% In all classes 24 42.9%
MOTIVATIONS (SD=strongly disagree, D=disagree, NA=neither agree nor disagree, A=agree, SA=strongly agree; sd = standard deviation)
I assign students to teams in my classes because: SD D NA A SA Mean sd . . . that reduces my grading load. 12 8 8 15 13 3.6 1.48 . . . the previous instructor used them. 21 5 19 5 6 2.46 1.36 . . . I want students to gain experience relevant to the business world. 2 2 4 22 26 4.21 .986 . . . I want students to learn teamwork skills. 2 0 2 24 28 4.36 .862 . . . I believe teamwork enhances student learning of course material. 2 3 9 23 19 3.96 1.03 . . . I believe teamwork enhances student creativity. 3 2 19 20 12 3.64 1.03 . . . The business department/program requires it. 17 8 11 8 12 2.82 1.54
ATTITUDES (SD=strongly disagree, D=disagree, NA=neither agree nor disagree, A=agree, SA=strongly agree; sd = standard deviation)
I strongly believe that . . . SD D NA A SA Mean sd . . . students should manage teambuilding on their own 1 9 12 25 11 3.64 1.03 . . . the benefits of conducting teambuilding are unclear to me 12 25 15 3 1 2.21 .01 . . . there is never enough time to conduct teambuilding in my class(es) 5 10 19 18 4 3.11 1.07 . . . I am not sufficiently qualified to conduct teambuilding in classes 15 11 19 9 2 2.5 1.16
ACTIONS
I have my students . . . Require Percent Participate in team building exercises that I lead. 16 28.6 Conduct peer evaluations at the end of the semester. 44 78.6 Read the literature on effective teamwork. 13 23.2 Participate in an ice-breaker activity at the beginning of the semester. 24 42.9 Set formal goals for their team at the beginning of the team project. 26 46.4 Set ground rules for participation in the team. 32 57.1 Set milestones and deadlines for team-related activities. 28 50 Provide formal mid-term written feedback to each other. 9 16.1
DEMOGRAPHICS Gender : Male: 37 (66.1%) Female: 13 (23.2%) [No response: 6, 10.7%] RANK Assistant Professor: 6 (10.7%), Associate Professor: 18 (32.1%), Professor: 29 (51.8%), No response; 3 (5.4%) Highest Degree: Masters: 3 (5.4%), Ph.D.: 51 (91.1%), Other: 2 (3.6%) Team mostly: Freshmen: 2 (3.6%), Sophomores: 5 (8.9%), Juniors: 19 (33.8%), Seniors: 16 (23.2%), Graduate: 13 (23.2%), [no response: 1] Average number of teams per class: 6.23 (sd: 2.37) Average number of persons per team: 4.30 (sd: 1.20) Average students in B. School: 1239 (sd: 1508)

Page 99
Academy of Educational Leadership Journal, Volume 15, Number 4, 2011
As Table 1 shows, a principal component analysis (Varimax with Kaiser Normalization) identifies two underlying dimensions in the multiple motivations that lead instructors to assign teamwork in their classes; i.e., the motivation to improve student learning (four-item scale, Cronbach’s alpha=0.853), and the motivation to improve instructors’ convenience (three-item scale, Cronbach’s alpha=0.673). Hypothesis 1 is therefore validated.
Table 1: Multiple Motivations that drive assignment of team projects (Results of the rotated component matrix)
Extraction Method: Principal Component Analysis. Rotation Method: Varimax with Kaiser Normalization
Components of MOTIVATIONS
I assign team projects in my classes because . . .”
Factor 1: Student learning related motivations (Cronbach’s Alpha for
highlighted 4 items =0.853) (see highlighted, italicized factor
loadings)
Factor 2: Instructors’ convenience Cronbach’s Alpha for highlighted 4
items =0.673) (see highlighted, italicized factor
loadings) it reduces my grading load -.105 .705 the previous instructor used them .092 .829 I want students to gain experience relevant to business .829 .074
I want students to learn teamwork skills .880 -.051
I believe teamwork enhances student learning of material .800 .044
I believe teamwork enhances creativity .766 .247 the business department/program requires it .103 .790
Table 2
PROPORTION OF INSTRUCTORS WHO ASSIGN TEAMWORK RELATED ACTIVITIES
I require students to . . . Number of instructors who
ticked YES (of 56 participants)
Proportion Calculated Z statistic for
proportions* (null proportion = .5)
Provide formal mid term written feedback to each other
9 0.16 -6.68♪♪
Read the literature on effective teamwork 13 0.23 -4.76♪♪ Participate in team building exercises I lead 16 0.29 -3.43♪♪ Participate in an ice breaker activity at the beginning of the semester
24 0.43 -1.06
Set formal goals for their teams at the beginning of the team project
26 0.46 -0.59
Set milestones and deadlines for team-related activities
28 0.5 0
Set ground rules for participating in the team 32 0.57 1.04 Conduct peer evaluations at the end of the semester
44 0.79 5.28♪♪
* Z = (Observed proportion – 0.5)/Sp Where 0.5 represents P, i.e., proportion under null hypothesis, and
Sp = 1/)1( −− nPP
♪♪ Z values significant at 99% confidence.

Page 100
Academy of Educational Leadership Journal, Volume 15, Number 4, 2011
Table 2 shows the Z tests we conducted to test H2, and establish that over half of the instructors do not require students to take teamwork related actions. As the table shows, the hypothesis is partially supported. Over half of the instructors do require students to conduct peer evaluations. However, less than half of the instructors require students to provide formal mid-term feedback to each other, or require them to read literature on effective teamwork, or require them to participate in teambuilding exercises that they lead.
Table 3: MOTIVATIONS AND ACTIONS LINKAGES
Motivated to increase instructor's convenience Proportion
1 (a+b)/n Proportion 2 (a+c)/n
(b-c)/n Proportion difference
McNemar’s Chi-square = (b-c)2/b+c High Low Total
Require students to participate in team building
Motivation to produce student learning
High 4 8 12
0.75 0.25 0.5 8 Low 0 4 4
Total 4 12 16
Require students to read literature on effective teamwork
Motivation to produce student learning
High 4 6 10
0.7692 0.3077 0.4615 6.0* Low 0 3 3
Total 4 9 13
Require students to set formal goals at the beginning
Motivation to produce student learning
High 4 15 19
0.7307 0.2692 0.4615 8.0** Low 3 4 7
Total 7 19 26
Require students to set ground rules for participation
Motivation to produce student learning
High 8 17 25
0.7812 0.3125 0.4687 11.84** Low 2 5 7
Total 10 22 32
Require students to set milestones and deadlines
Motivation to produce student learning
High 5 13 18
0.6428 0.2727 0.4285 10.28** Low 1 9 10
Total 6 22 28
Require students to provide formal mid-term feedback
Motivation to produce student learning
High 2 6 8
0.8888 0.3333 0.55 3.57 Low 1 0 1
Total 3 6 9
Require students to conduct peer evaluations end of semester
Motivation to produce student learning
High 10 22 32
0.7272 0.2954 0.4318 14.44** Low 3 9 12
Total 13 31 44
Require students to participate in ice-breakers
Motivation to produce student learning
High 4 16 20
0.8333 0.1667 0.6666 16.0** Low 0 4 4
Total 4 20 24 McNemar’s Test Chi-square statistic: (B-C)2/B+C; degree of freedom = 1
Motivation 2: High Motivation 2: Low Motivation 1: High a b Motivation 1: Low c d Proportion 1 = (a+b)/n, Proportion 2 = (a+c)/n, Proportional difference = (b-c)/n

Page 101
Academy of Educational Leadership Journal, Volume 15, Number 4, 2011
In terms of requiring students to participate in ice-breakers, or setting formal goals, milestones, and ground rules for participation, the faculty members seem evenly split. Table 3 shows the results of the McNemar’s Chi-square procedure to test whether instructors motivated by the desire to produce student learning are more likely to require students to engage in teambuilding activities, than those motivated by the desire to increase their convenience. This hypothesis is largely validated; instructors motivated by the desire to improve student learning require students to engage in teambuilding activities except when it comes to requiring them to provide mid-term evaluations to their team members. In other words, by and large, instructors motivated by the desire to increase their convenience do not require students to engage in teambuilding activities. Table 4 shows the results of correlation analysis for testing H4. As the table shows, the hypothesis is partially supported; i.e., instructors who hold that students should manage teamwork on their own also hold that: (a) the benefits of conducting teamwork are unclear to them, and (b) they are not sufficiently qualified to teach teamwork to their students. However, there is no significant link between the view that students should be left to manage on their own and their perceptions of not having enough time to teach teamwork.
Table 4: CORRELATIONS AMONG ATTITUDINAL ITEMS
Students should manage on their
own
Benefits of conducting teamwork are unclear to
me
There is never enough time
I am not sufficiently
qualified
Students should manage on their own
Pearson Correlation 1 .315* 0.232 .288*
Sig. (2-tailed) 0.018 0.086 0.031
Benefits of conducting teamwork are unclear to me
Pearson Correlation .315* 1 0.256 .310*
Sig. (2-tailed) 0.018 0.057 0.02
There is never enough time Pearson
Correlation 0.232 0.256 1 .526**
Sig. (2-tailed) 0.086 0.057 0
I am not sufficiently qualified Pearson
Correlation .288* .310* .526** 1
Sig. (2-tailed) 0.031 0.02 0
*. Correlation is significant at the 0.05 level (2-tailed).
Finally, Table 5 shows the results of the chi-squares we conducted to test H5. As the table shows, this hypothesis is fully validated; i.e., instructors who hold that students should be left to manage teamwork on their own also do not require students to participate in teambuilding activities.

Page 102
Academy of Educational Leadership Journal, Volume 15, Number 4, 2011
Table 5
ACTIONS AND ATTITUDES Require students to participate in team building that I lead NO YES
Instructors who hold the view that students should be left to manage teamwork on their own Chi-square = 7.32 (p = 0.007)
NO 14 12
Favor high empowerment 26 4
Require students to read literature on effective teamwork NO YES Instructors who hold the view that students should be left to manage teamwork on their own Chi-square = 9.926 (p = 0.002)
NO 15 11
YES 28 2
Require students to participate in ice breakers NO YES Instructors who hold the view that students should be left to manage teamwork on their own Chi-square = 13.785 (p = 0.000)
NO 8 18
YES 24 6
Require students to set formal goals for their team at the beginning of the team project NO YES Instructors who hold the view that students should be left to manage teamwork on their own Chi-square = 4.455 (p = 0.032)
NO 10 16
YES 20 10
Require students to set ground rules for participation in the team NO YES Instructors who hold the view that students should be left to manage teamwork on their own Chi-square = 7.754 (p = 0.006)
NO 6 20
YES 18 12
Require students to set milestones and deadlines for team related activities NO YES Instructors who hold the view that students should be left to manage teamwork on their own Chi-square = 4.595 (p = 0.03)
NO 9 17
YES 19 11
IMPLICATIONS FOR FUTURE RESEARCH The general theme in the findings from our second-stage survey is as follows. Instructors assign students to teams motivated both by the desire to increase their own convenience and the desire to promote student learning, but largely do not require students to engage in teambuilding activities and prefer to let students manage on their own even when the benefits of teambuilding are clear to them. They are also likely to attribute their disinterest in providing teambuilding-related instruction to the lack of time and skills. These findings raise two inter-related issues that deserve additional research. Motivations-Attitude Gap
The link between what instructors say about their motivations and their attitudes (or behavioral intents) raises several questions, and suggests that a motivations-attitude gap likely exists in practice. For instance, all instructors in the sample assign teams in their classrooms,

Page 103
Academy of Educational Leadership Journal, Volume 15, Number 4, 2011
and most (73.2%) say they are strongly motivated by the desire to increase student learning, whereas only 25% say they are motivated by their desire to increase their convenience. However, the attitudes strongly favor student empowerment. Eighty three percent of instructors agree or strongly agree with the statement that students should manage teambuilding on their own, yet 66% suggest that the benefits of conducting teambuilding are clear to them. Moreover, 73% agree or strongly agree that they do not have sufficient time to conduct teambuilding, and over half say they are not qualified to conduct teambuilding. The motivations suggest that they seek to improve student learning as a result of teamwork, and their attitudes suggest they prefer not to teach teamwork skills; i.e., their attitudes belie their stated motivations. The questions that arise are: If instructors mostly say they assign students to teams in order to improve their learning: (a) why are their attitudes predominantly in favor of empowerment, and letting students manage on their own, and (b) why does this attitude suggest a lowered desire to improve learning and an increased desire to increase their convenience? There is, however, considerable consonance between attitudes and actions; i.e., consistent with their attitudes in favor of empowerment, few require teambuilding-related actions from students. This motivation-attitude gap may exist for a potentially large number of reasons including: (a) misalignment between business-school (or departmental) objectives, and assessment and reward systems, or (b) greater concern for teaching the content of the course within the time available at the expense of concern for learning processes (i.e., learning as a team), or (c) the implicit assumption that teaching teamwork is soft-stuff, and less worthy than the course content, or (d) the instructors’ implicit belief that teaching teamwork is not what they do, or (e) a significant segment of instructors do not possess the skills necessary for teaching teamwork in classes – which half of the instructors in our study indicate is the case. The gap may also relate to causal factors rooted in the organization of business-schools (i.e., rooted in its processes, systems, rewards, structure, leadership and culture), and in instructors’ socio-cognitive make-up (i.e., in their knowledge, attitudes, experiences, skills, motivations and aptitudes). Knowing the root causes of motivation-attitude gap, from larger random samples, represents one of the initiating step in the process of defining implementable solutions to the problem; i.e., more classroom teams are assigned, and few instructors teach teamwork skills. Legitimizing traditions and economy related motivations
While most instructors espouse that they are motivated by the desire to increase student learning, their attitudes and actions suggest that they are driven by the desire to increase their own convenience, i.e., they largely act to: (a) align their activities with those prevalent in the department, reduce the effort necessary to negotiate new teaching approaches and strategies, and pre-empt questions about why their classroom practices differ from the norms set by previous instructors, (b) empower students and delegate a part of the learning responsibility to teams, i.e., they have to do less in class in terms of subject matter content, and (c) directly reduce their

Page 104
Academy of Educational Leadership Journal, Volume 15, Number 4, 2011
grading burden, i.e., instead of grading individual final papers, they are now required to read fewer team papers. The misalignment suggests that the motivation to increase convenience deserves examination in broad daylight; i.e., discussions about how and why classroom team projects serve to reduce a faculty member’s teaching-burden ought to occur in open forums, and ought to enter legitimate conversations about business school related pedagogy. At present, “I use team projects also because it fits with what people already do, and reduces my grading burden” remains part of informal conversations – if it enters conversations at all. The current advocacy in the literature fails to speak to the practical reality of management instructors because it plainly spells do more, when at least motivations and attitudes that guide instructors’ behavior vigorously spell align yourself with the practices of the department/program and reduce your workload. Little change can occur unless these currently undiscussible motivators of instructor behaviors remain undiscussible. To the advocates of teaching teamwork in classrooms, our study suggests that this undiscussed motivation gets in the way of translating the literature’s advocacy in favor of teaching teamwork skills into practice. Instructors may be more receptive to advice: (a) if the motivations related to traditions and economy are acknowledged and their discussion is legitimized, and (b) if such advice speaks to their practical, day-to-day reality and spells work smarter rather than work more and longer (as it currently tends to do).
CONCLUSION Despite strong and well meaning advocacy, more instructors assign team projects in management classes than those that provide teamwork-related instruction. Despite proliferating knowledge about what instructors can and ought to do, there is little evidence to suggest that it is producing changes in classroom instruction. New thinking and research is essential before the well meaning advice is implemented in practice. In this regard, our study suggests that the motivations to increase instructors’ convenience and the attitudes that favor “empowerment” may help explain the gap between theory and practice. Before implementable insights emerge, new research is needed to understand how these motivations can be managed, and why the gap between knowledge and practice exists.
REFERENCES Bolton, M. K. (1999). The role of coaching in student teams: A “just-in-time” approach to learning. Journal of
Management Education, 23 (3), 233-250. Buckenmyer, J. A. (2000). Using teams for class activities: Making course/classroom teams work. Journal of
Education for Business, 76(2), 98-107.

Page 105
Academy of Educational Leadership Journal, Volume 15, Number 4, 2011
Chen, G., Donahue, L.M., & Klimoski, R.J. (2004). Training undergraduate students to work in organizational teams. Academy of Management Learning and Education, 3(1): 27-40.
Chowdhury, S., Endres, M., & Lanis, T. W. (2002). Preparing students for success in team work environments: The
importance of building confidence. Journal of Managerial Issues, 14(3), 346-359. Connerley, M. L., & Mael, F. A. (2001). The importance and invasiveness of student team selection criteria.
Journal of Management Education, 25(5), 471-494. Deeter-Schmelz, D. R., Kennedy, K. N., & Ramsey, R. P. (2002). Enriching our understanding of student team
effectiveness. Journal of Marketing Education, 24(2), 114-124. Ettington, D. R., & Camp, R. R. (2002). Facilitating transfer of skills between group projects and work teams.
Journal of Management Education, 26(4), 356-379. Glaser, B.G., Strauss A.K. (1967). The Discovery of Grounded Theory. Chicago, IL: Aldine, Holmer, L. L. (2001). Will we teach leadership or skilled incompetence? The challenge of student project teams.
Journal of Management Education, 25(5), 590-605. Holtham, C. W., Melville, R. R., & Sodhi, M. S. (2006). Designing student groupwork in management education.
Journal of Management Education, 30(6), 809-817. McKendall, M. (2000). Teaching groups to become teams. Journal of Education for Business, 75(5), 277-282. Michaelson, L., Knight, A., & Fink, L. (2002). Team based learning: A transformative use of small groups.
Westport, CT: Praeger. O’Connor, D., & Yballe, L. (2007). Team leadership: Critical steps to great projects. Journal of Management
Education, 31(2), 292-312. Page, D., & Donelan, J. G. (2003). Team-building tools for students. Journal of Education for Business, 78(3),
125-129. Strauss, A. L., & Corbin, J. (1998). Basic of Qualitative Research: Grounded Theory Procedures and Techniques.
Newbury Park, CA: Sage Publications. Vik, G.N. (2001). Doing more to teach teamwork than telling students to sink or swim. Business Communication
Quarterly, 64(4), 112-119.

Page 106
Academy of Educational Leadership Journal, Volume 15, Number 4, 2011
APPENDIX 1 SCALES
How OFTEN do you assign team projects in your classes?
In one class a semester In more than one classes per semester in all classes 1. MOTIVATIONS. I assign students to teams in my classes because . . . (5 point Likert scales) . . . that reduces my grading load. . . . the previous instructor used them. . . . I want students to gain experience relevant to the business world. . . . I want students to learn teamwork skills. . . . I believe teamwork enhances student learning of course material. . . . I believe teamwork enhances student creativity. . . . The business department/program requires it. 2. ATTITUDES. I strongly believe that . . . (5 point Likert Scale) . . . students should manage their teambuilding on their own. . . . the benefits of conducting teambuilding are unclear to me. . . . there is never enough time to conduct teambuilding in my class(es). . . . I am NOT sufficiently qualified to conduct teambuilding in my classes. 3: ACTIONS. I always REQUIRE students working in teams to (tick all those that apply). . .
Participate in team building exercises that I lead. Conduct peer evaluations at the end of the semester. Read the literature on effective teamwork. Participate in an ice-breaker activity at the beginning of the semester. Set formal goals for their team at the beginning of the team project. Set ground rules for participation in the team. Set milestones and deadlines for team-related activities. Provide formal mid-term written feedback to each other.
Please tell us about yourself (please tick): Gender: Male Female Rank: Assistant Associate Full Adjunct/part time Highest degree earned: Master’s Ph.D. Ed.D. Other I teach mostly: Freshman Sophomores Juniors Seniors Graduate/MBA I have taught FULL TIME for: < 3 years 4-7 years 7 – 10 years 11 -13 years 14 years + I mostly teach courses in: OB Strategy Accounting Economics Finance
POM Marketing MIS Other: ____________________________ Average number of teams in my classes: 2 3 4 5 6 7 8 9 10+ Average number of students per team: 2 3 4 5 6 7 8 9 10+ I teach at a: Private College Public University With approximately _______ students in the B. School, and ______ students in the College/University

Page 107
Academy of Educational Leadership Journal, Volume 15, Number 4, 2011
ETHICS IN ACCOUNTING: AN INDISPENSABLE COURSE?
Janice Klimek, University of Central Missouri Kelly Wenell, University of Central Missouri
ABSTRACT
Following the unmasking of billion-dollar earnings manipulations at corporations such as
Enron and WorldCom in the early 2000s, the accounting profession has had to reexamine ethics and its implications (Duska & Duska, 2003). Shortly after, the National Association of State Boards of Accountancy (NASBA) proposed adding two required ethics courses to the accounting curriculum (Shawver, 2006). NASBA backed off on the recommendation due to pressure from the accounting profession and accounting educators. While nearly all college accounting programs integrate ethics into accounting courses to meet the public demand for ethical accountants, schools in Texas are required to offer a 3-hour stand alone course. Conflicting research exists regarding whether requiring a separate ethics course instead of integration has a significant effect on accounting students’ ethical reasoning abilities. In this paper, the ethical reasoning abilities of accounting students in an Ethics in Accounting course were compared to the ethical reasoning abilities of accounting students who had ethics discussions integrated into their accounting courses instead of a required course. Ethical reasoning abilities were tested using an instrument called the Defining Issues Test-2. The students who took an Ethics in Accounting course before graduation did seem to have higher ethical reasoning abilities than those students who had ethics integrated into their accounting courses. Based on the results of this study, it is recommended that NASBA reconsider its decision to eliminate the requirement of a 3-hour course on Ethics for accounting majors.
INTRODUCTION It is well known that companies such as Enron and WorldCom engaged in unethical earnings manipulations such as falsely recording expenses as assets and hiding debt in complicated off balance sheet financial arrangements. Such practices led many to unknowingly invest in corporations that were on the brink of bankruptcy. In the aftermath of these companies’ failures, the accounting profession has had to reexamine ethics and its implications (Duska & Duska, 2003). In 2002, the Sarbanes-Oxley Act and Statement of Auditing Standard 99 (SAS 99) were enacted to clarify issues related to ethics and fraudulent financial reporting and to help restore investor confidence in financial statements (Shawver, 2006). The Sarbanes-Oxley Act created new standards for corporate accountability as well as stiffer penalties for noncompliance including imprisonment for up to twenty years (Klutz, 2006). SAS 99 aimed to further integrate the auditor’s consideration of fraud

Page 108
Academy of Educational Leadership Journal, Volume 15, Number 4, 2011
into the audit processes developed for a publicly traded company. In response to the Sarbanes-Oxley Act and SAS 99, accounting profession regulators began to look at enhancing ethics training for current and future accounting professionals (Ramos, 2003).
ETHICS AND ACCOUNTING EDUCATION The issue of how ethics should be integrated into the accounting curriculum and to what degree state professional boards of accountancy should influence such curriculum decisions is of great interest to the accounting profession. State Boards of Public Accountancy determine the educational requirements needed for a candidate to sit for the Uniform Certified Public Accountant (CPA) examination and CPA licensure. Individual state boards look to the National Association of State Boards of Accountancy (NASBA) for guidance in setting these educational requirements (Mastracchio, 2008). In 2003, NASBA addressed the ethics content of the education requirement and initially determined that two stand-alone courses should be included. It later developed the Rules 5-1 and 5-2 Exposure Draft (2005) which suggested the addition of two required 3-hour courses, Ethical and Professional Responsibilities of CPAs and Ethical Foundations and Applications in Business, to the accounting curriculum. Topics to be incorporated into these courses included:
• The nature of ethics • Differences in rule-based versus principle-based approaches to ethics • Compliance with fundamental ethical principles of integrity, objectivity, commitment to
professional competence and due care and confidentiality • Professional behavior and compliance with technical standards and laws • Concepts of independence, skepticism, conflicts of interest accountability and public expectations • Social responsibility • Nature of professional fiduciary responsibilities • Ethical dilemmas and consequences of unethical behavior to the individual, to the
profession, and to society at-large • Corporate governance and public interest. (Mastracchio, 2008)
The NASBA proposal met with widespread criticism from accounting educators and the profession, specifically the American Accounting Association (AAA) and the American Institute of Certified Public Accountants (AICPA). (Van Wyhe, 2007) Many educators felt that NASBA’s proposal would be too difficult to implement, considering the costs of recruiting qualified individuals to develop and teach such courses (Hurtt & Thomas, 2008) and there is little evidence that stand-alone courses in ethics actually increases students’ ethical reasoning abilities (Desplaces et al., 2007). As of 2007, NASBA changed its requirement to include either a 3-hour course in ethics or the integration of equivalent topics in the accounting and business curriculum (Mastracchio, 2008).
Still others, however, argue that a separate course is necessary. Armstrong (1993) found that students who took a general ethics course followed by an ethics and professionalism capstone course

Page 109
Academy of Educational Leadership Journal, Volume 15, Number 4, 2011
achieved significantly higher ethical reasoning scores. This suggests that increased numbers of ethics courses in an academic setting does lead to an increase in one’s ethical sensitivity (Bean and Bernardi, 2007). Bernardi (1994) also found that accounting managers who scored higher on a measure of ethical sensitivity also detected fraud at a higher rate, which suggests that teaching ethics to students may increase ethical behavior once these students become professionals.
Even though arguments have been made for adding an Ethics in Accounting course to the accounting curriculum, based on a review of the websites of the fifty State Board of Accountancy websites, it appears that only Texas and Maryland have implemented ethics course requirements to date. Texas specifically requires an Ethics in Accounting course. Maryland allows for a business ethics course to fulfill its ethics education requirement. Since 2005, the Texas State Board of Public Accountancy (TSBPA) has required that students complete an approved 3-hour college course in ethics, as opposed to an ethics-integrated accounting curriculum, in order to sit for the Uniform CPA exam. (Hurtt and Thomas, 2008) This requirement was added shortly after the passage of the Sarbanes-Oxley Act. The State Board believed that it would be easier to evaluate a CPA candidate’s completion of the ethics education requirement if the candidate was required to submit a transcript with a TSBPA-approved ethics course. The TSBPA also believed that requiring the separate course would allow the board to have more influence on the accounting curriculum since all accounting programs seeking to have an ethics course must have their ethics course syllabus approved by the TSBPA (Hurtt & Thomas, 2008).
A direct consequence of the TSBPA’s ethics requirement is that many colleges and universities in Texas and nation-wide have implemented ethics courses for accounting majors in order for their graduates to be qualified to sit for the Uniform CPA examination in Texas. While Texas currently requires a 3-hour Ethics in Accounting course, is this approach really better than the approach of integrating ethics related topics into the curriculum via several accounting courses? This paper investigates whether requiring a separate ethics course instead of integration has a significant effect on accounting students’ ethical reasoning abilities.
MEASURING ETHICAL REASONING ABILITIES
For many years, researchers have based their measurement of ethical reasoning abilities on Kohlberg’s model of moral development, the Cognitive Moral Theory (CMT). (Armstrong, 1993, and Bernardi, 1994) In the CMT, Kohlberg (1969) identified three major levels of moral judgment in children: pre-conventional, conventional, and post-conventional. In the pre-conventional level, a child has not yet become aware of social conventions. In the conventional level, children no longer perceive individuals such as parents as authority but instead view social groups as authority. In the post-conventional level, a child’s morality goes beyond the frame of reference of any one particular society (Dubuc, 2002). For each level, Kohlberg proposed two stages of moral development as follows: pre-conventional stage - (1) punishment and obedience

Page 110
Academy of Educational Leadership Journal, Volume 15, Number 4, 2011
and (2) instrumental exchange; conventional stage - (3) interpersonal conformity and (4) law and order; post-conventional stage - (5) prior rights and social contract and (6) universal moral principles (Jacobs, 2008).
At Stage 1 (from age 2-3 to about 5-6), individuals seek to avoid punishment from authority figures such as a parent. At Stage 2 (from about age 5 to 7), individuals learn, through receiving rewards, that it is in their best interest to behave well. At Stage 3 (from about age 7 to 12), individuals begin to long to meet the expectations of other members of their peer group. At Stage 4 (from about age 10 to 15), the conventions that guide an individual’s behavior expand to include those of the society. In examining a dilemma, an individual considers the norms and laws of society. At Stage 5 (starting as early as age 12, in some cases), individuals feel contractually committed to every person around them because of a rational assessment of the benefits that everyone can derive from the existence of rules. At Stage 6, individuals’ judgments of what is good and bad are influenced by universal moral principles. Individuals at Stage 6 agree that laws and societal values are valid, but if these laws conflict with their own principles of human dignity, they will still follow their established principles. According to Kohlberg, people go through these six stages of moral development in the order listed above. Most children are at the pre-conventional level, and most adults have reached the conventional level. However, Kohlberg estimated that only 20 to 25% of adults will ever reach the post-conventional level of morality (Dubuc, 2002).
Based on the CMT, Rest (1979a) developed the Defining Issues Test (DIT) to quantify ethical reasoning ability. The P score, originally used to measure an individual’s moral development, was based on a participant’s rankings of items related to ethical dilemmas written to test Kohlberg’s Stages 5 and 6. It shows the relative importance participants give to these stages when making a moral decision. The latest version, DIT-2, improves upon the DIT with updated dilemmas and an improved method of detecting unreliable participants. Rest added the N2 score to the DIT-2. The N2 score combines two effects, “acquisition of new thinking” represented by the increasing P scores (post-conventional schema) and “systematic rejection of simplistic thinking” represented by decreasing stage 2 and 3 scores (personal-interest schema). This score is believed to be a more valid indicator of ethical reasoning (Bebeau & Thoma, 2003). The DIT-2 has been employed in the accounting literature to investigate how gender, culture, and specific ethics courses affect the ethical reasoning abilities of accounting students. For example, Venezia (2005) used the DIT-2 to research differences in the ethical reasoning of Chinese accounting students and American accounting students. He concluded that culture did indeed have an effect because the Chinese students achieved higher P scores. Richmond (2001) also used the DIT-2 to compare female versus male accounting students’ P scores. The findings suggested that females possess a higher ethical reasoning ability. When compared to a control group of intermediate accounting students, the results were that the seniors enrolled in the Ethics in Accounting course did have higher scores. However, according to Rest (1979a), moral judgment (or the P score) is strongly related to education, so testing students at the same education level should produce more decisive results. Armstrong (1993) used the DIT to ascertain whether a senior-level

Page 111
Academy of Educational Leadership Journal, Volume 15, Number 4, 2011
Ethics in Accounting course had an effect on students’ P scores. Results showed that students who took a general ethics course followed by an ethics and professionalism capstone course achieved significantly higher ethical reasoning scores.
THE CURRENT STUDY The current study expands on prior research by comparing students from two different accounting programs, all of whom were at the same point in the educational process. One group of students was required to take a 3-hour Ethics in Accounting course and the other where students obtain ethics-related content that is integrated within several accounting courses. (See Table 1 below for descriptive statistics.) The study sought to determine whether graduating seniors who took an Ethics in Accounting course displayed higher ethical reasoning abilities than graduating seniors whose ethics exposure occurred through integration into several accounting courses. The current study differs from prior studies in three significant areas. First, unlike Armstrong (1993), this study compares students who are at the same educational level, all senior accounting majors in their final semester of coursework. Armstrong compared students enrolled in Intermediate Accounting with senior accounting students who chose to take an elective ethics and professionalism course that, at the time of the study, was a one-time offering. Rest (1979b) stated that moral judgment is related to education level so comparing juniors beginning their accounting program with seniors may itself be reason for significant differences in P scores among the two groups. In addition, the fact that students self-selected into the ethics course presents another weakness of the 1993 study.
Second, this study compared students who had ethics integrated into the curriculum of several courses throughout their undergraduate program and students who were required to take one accounting ethics course to meet the ethics requirement. In Armstrong (1993), there was no reason to believe that the students in the control group had any exposure to ethics in their previous coursework. In the current study, all seniors had been exposed to ethics; however, in one group, exposure to ethics in accounting was obtained through several courses while in the second group, the exposure took place almost exclusively through the required accounting course.
Finally, the Armstrong (1993) study used the DIT, specifically a comparison of P scores among the two groups of students. The current study employs the latest version, the DIT-2, which improves upon the DIT with updated dilemmas and an improved method of detecting unreliable participants. Unlike the P score, the N2 score added in the latest version combines two effects, “acquisition of new thinking” represented by the increasing P scores (post-conventional schema) and “systematic rejection of simplistic thinking” represented by decreasing stage 2 and 3 scores (personal-interest schema). As noted previously, this score is believed to be a more valid indicator of ethical reasoning (Bebeau & Thoma, 2003).

Page 112
Academy of Educational Leadership Journal, Volume 15, Number 4, 2011
DESCRIPTION OF THE STUDY Participants In the current study, the ethical reasoning abilities of 60 senior undergraduate accounting students in their final semester of accounting undergraduate coursework were measured at two mid-sized, accredited higher-education institutions in the United States. A test measuring ethical reasoning abilities was administered to senior-level accounting students who had just completed the Auditing course at an accredited public university in the Midwest and to senior-level accounting students who were just completing the Business and Professional Ethics for Accountants course at a Texas University. All students were tested at the end of the spring semester of their final year. Students in the Auditing course had completed a program where ethics was integrated into the accounting curriculum through discussions in several different upper level accounting courses. Students in the ethics course were required to take the course. The school’s general studies program did not include any other required ethics course; however all were required to take a religion course. A review of 45 syllabi associated with all of the undergraduate courses in the accounting program also showed that ethics was not consistently incorporated into other required accounting courses for the Texas school. A couple of sections did require attendance at a one-day integrity roundtable and one course included a one-day lecture on the legal and ethical issues for IT auditors, so these students received virtually all of their ethics training from the required Business and Professional Ethics for Accountants course. Of the 60 students involved, 8 were purged from the analysis due to inconsistencies in ratings and rankings of the questions posed within the test instrument. Table 1 below lists descriptive statistics for the 52 usable subjects. There were no significant differences between the two groups with regard to Age, Educational Level, Citizenship and Primary Language. However, there were significantly more females at the institution where ethics is integrated across the accounting curriculum. This difference did not affect the overall results, though, as gender was not correlated with the N2 score. (See Table 3.)
MATERIALS AND PROCEDURES
This study utilized the DIT-2 test provided by The Center for the Study of Ethical Development at the University of Minnesota. The DIT-2 consists of five storied dilemmas followed by twelve issues which participants are asked to rate in terms of importance. The DIT-2 scores reflect each student’s ethical reasoning ability based on their responses to the questions asked after each dilemma.

Page 113
Academy of Educational Leadership Journal, Volume 15, Number 4, 2011
Table 1 DEMOGRAPHIC VARIABLES
3-HOUR COURSE INTEGRATED ETHICS
GENDER Female: 5 Male: 8
Female: 28 Male: 11
AGE Mean: 22.39 Mean: 23.97 EDUCATIONAL LEVEL All Seniors All Seniors
U.S. CITIZENSHIP Yes: 13 No: 0
Yes: 36 No: 3
ENGLISH PRIMARY LANGUAGE Yes: 13 No: 0
Yes: 37 No: 2
VARIABLES
Following are the variables used to measure the ethical reasoning abilities assessed in Rest’s DIT-2 instrument (Bebeau & Thoma, 2003). Personal Interest Schema Score This score represents the proportion of items selected, after reading a dilemma, that appeal to Stage 2 and Stage 3 thinkers. Stage 2 focuses on the direct advantages to the actor and on the fairness of simple exchanges of favor for favor. Stage 3 focuses on the good or evil intentions of the parties, on the party’s concern for maintaining friendships and good relationships, and maintaining approval. Maintaining Norms Schema Score This score represents the proportion of items selected that appeal to Stage 4 thinkers. Stage 4 focuses on maintaining the existing legal system, maintaining existing roles and formal organizational structure. Post-conventional Schema Score This score, the P score, represents the proportion of items selected that appeal to Stage 5 and Stage 6 thinkers. Stage 5 focuses on organizing a society by appealing to consensus-producing procedures. Stage 6 focuses on organizing social relationships in terms of intuitively appealing ideals. The P Score is calculated by adding each participant’s scores from Stages 5 and 6. The percentage P Score can range from 0 to 95 and is interpreted as the extent to which the participant prefers post-conventional moral thinking.

Page 114
Academy of Educational Leadership Journal, Volume 15, Number 4, 2011
Utilizer Score (U) The U Score represents the degree of match between items endorsed as most important and the action choice taken on that story. A high U score represents consistency between item endorsement and action choice; a low score represents a lack of consistency. Humanitarian/Liberalism (HUMLIB) Early in the development of the DIT, researchers determined that a certain population of participants, those who were professionals in either political science or philosophy, consistently delivered high P scores. The HUMLIB score is simply an indicator of how close a participant came to answering questions exactly like the “professionals.” Scores range from 0 to 6 matches. Political Liberalism (CONLIB) This score is determined from a participant’s self rating of his or her political views. The scores range from 1 (very liberal) to 5 (very conservative). Religious Orthodoxy (CANCER10) This score represents the sum of the rates and ranks for item 9 in the doctor’s dilemma scenario within the DIT-2. This dilemma asks the subject to decide whether to provide a dying woman a drug that will hasten her death. Item 9 addresses the issue of whether only God can determine if someone should live or die.
STUDY RESULTS Independent samples t-tests were used to compare mean scores of the two student groups. (See Table 2.) The study did find differences between the two groups of students. With regard to the general comparison scores, HUMLIB, CONLIB, U-Score and CANCER10, only one of the four scores varied significantly between groups. The CONLIB variable differed significantly between groups. It is a self-reported indicator of conservatism. Students from the school that required a 3-hour ethic course rated themselves as significantly more conservative than the integrated ethics group. U score means between schools were not significantly different, suggesting that both schools’ students made consistent, although varied, choices. Also, HUMLIB scores did not vary significantly between schools, suggesting that neither student group answered questions in a manner more in line with the “professionals” than the other. Finally, the CANCER10 scores showed no significant differences between groups with regard to religious orthodoxy or how God factors in to an ethical decision related to life and death.

Page 115
Academy of Educational Leadership Journal, Volume 15, Number 4, 2011
Table 2: RESULTS OF DIT-2 TESTING
3-HOUR COURSE MEANS
INTEGRATED ETHICS MEANS
T-TEST SIGNIFICANCE (P-VALUE)
N2 43.9428 33.9774 .027* STAGE2/3 (schema 1) 18.1538 26.8205 .035* STAGE4P (schema 2) 38.0000 33.1282 .222 PSCORE (schema 3) 40.3077 35.0256 .208 CANCER10 4.7692 4.3077 .612 CONLIB 3.6200 2.9200 .054* HUMLIB 1.5385 2.1538 .101 U .1647 .1404 .536 STAGE2 2.3077 3.0513 .428 STAGE3 6.7692 10.3590 .035* STAGE4 19.0000 16.5641 .222 STAGE5 16.2308 14.1282 .258 STAGE6 3.9231 3.3846 .517 AGE 22.3850 23.9740 .315 * .05 level of significance
Although there was no significant difference in P scores between the groups of students, students from the Ethics in Accounting course had higher N2 scores. These results are important. First, it lends credibility to the revised DIT-2 in that only the more refined score actually produced significant results. Second, it suggests that students who took an Ethics in Accounting course have higher levels of ethical reasoning ability than students who studied ethics in an integrated curriculum. As for the three schemas, only the personal interest schema (Stages 2 and 3) varied between schools. It seems that those students who did not take a 3-hour Ethics in Accounting course were more likely to answer questions based on direct advantages to the actor in the dilemma. Upon further analysis, results differed significantly for only the Stage 3 individual score, which seems to have driven the significant results for the combined personal interest schema and ultimately the N2 score as well. As discussed above, individuals at Kohlberg’s moral development Stage 3 tend to make decisions that meet the expectations of other members of their peer group. They concentrate on fairness and maintaining friendships. It appears that students who have studied ethics in a more concentrated setting are more able to make decisions based on the facts of the situation and not revert to choices based on what their peers expect. Table 3 shows correlations among the variables. As noted earlier, the variable SCHOOL is significantly correlated with the N2 score, a measure of moral development. However, it seems that the significant N2 score is driven by significant variations between schools for only the STAGE 3 variable. No other stage variable was significantly correlated with school.

Page 116
Academy of Educational Leadership Journal, Volume 15, Number 4, 2011
Table 3 CORRELATIONS
SCHOOL AGE GENDER CONLIB HUMLIB U CANCER10
N2 Pearson Correlation Sig. (2-tailed)
-.307* .027
-.284* .041
.162
.251 -.100 .482
-.116 .414
-.079 .580
-.052 .717
PSCORE Pearson Correlation Sig. (2-tailed)
-.177 .208
-.176 .121
.194
.169 -.144 .308
-.085 .550
-.195 .166
-.049 .729
STAGE 2 Pearson Correlation Sig. (2-tailed)
.112
.428 -.026 .854
.118
.407 .136 .335
.127
.369 .012 .934
-.217 .122
STAGE 3 Pearson Correlation Sig. (2-tailed)
.293* .035
.389** .004
-.220 .117
.113
.426 .475** .000
.107
.452 -.293* .035
STAGE2/3 Pearson Correlation Sig. (2-tailed)
.294* .035
.311* .025
-.130 .358
.155
.272 .452** .001
.094
.508 -.341* .013
STAGE 4 Pearson Correlation Sig. (2-tailed)
-.173 .220
-.220 .117
.002
.989 .105 .458
-.391** .004
.185
.189 .322* .020
STAGE 5 Pearson Correlation Sig. (2-tailed)
-.160 .258
-.218 .120
.206
.143 -.052 .713
-.067 .638
-.196 .164
-.058 .685
STAGE 6 Pearson Correlation Sig. (2-tailed)
-.092 .517
.043
.763 .029 .836
-.249 .075
-.065 .646
-.056 .696
.004
.976 * .05 level of significance **.01 level of significance
AGE was negatively correlated with the N2 score, a surprising result given previous study results. AGE was also positively correlated with the STAGE 3 variable, another surprising result as this variable is a component of the N2 score where AGE was negatively correlated. It is also important to note that AGE was not significantly different between schools, so it doesn’t explain differences in N2 scores between schools. The STAGE 3 variable is also significantly correlated with HUMLIB and CANCER10, measures of conservatism and religiosity, although once again, neither was significantly correlated with SCHOOL.
CONCLUSION
Students who take an Ethics in Accounting course before graduation do seem to have higher ethical reasoning ability than students who have had ethics integrated into their accounting courses. A class specifically concentrating on ethics seems to help students learn to focus on the facts of a given situation when making a decision instead of on how they might be perceived by peers. Given these findings, it seems that adding a 3-hour course to the accounting curriculum may be warranted.
Limitations of this study, however, may suggest avenues for future research. First, the small sample size makes it difficult to make broad generalizations about the effectiveness of a stand-alone Ethics is Accounting course. Next, one of the schools studied is a private, religious university while the second is a state-funded university. Although scores related to religious orthodoxy were not significantly different between schools, the CONLIB scores did vary. CONLIB results indicated that one group of students saw themselves as more conservative than

Page 117
Academy of Educational Leadership Journal, Volume 15, Number 4, 2011
the other. Future research should seek to determine the effects of such differences on mean N2 scores of the two groups.
Future research should also examine whether the type of school, the state in which each school is located, or some other factor may have caused such differences to occur. Finally, whether students’ ethical reasoning abilities change as they gain work experience in the accounting profession should also be examined in future longitudinal studies. It may be that experiences in the workplace dictate how professionals react to ethical dilemmas, regardless of the method in which they were exposed to ethics in accounting as part of their undergraduate curriculum. In summary, ongoing accounting scandals call attention to the deepening crisis in ethics that, if not addressed by the profession and academicians, will cause the government to act again in the interest of the public. It seems that the National Association of State Boards of Accountancy (NASBA) may want to consider revisiting its decision to back off requiring additional ethics training for accountants. The results of the current study suggest that more ethics training in the form of a separate 3-hour Ethics in Accounting course does correlate with higher ethical reasoning abilities. Adding an ethics course to the accounting curriculum may produce students with higher ethical reasoning abilities. Given that accountants in all practice areas are frequently faced with ethical dilemmas, universities should consider offering a required or elective Ethics in Accounting course for seniors and graduate students regardless of whether it is a NASBA requirement.
REFERENCES Armstrong, M.B. (1993). Ethics and professionalism in accounting education: A sample course. Journal of
Accounting Education, 11, 77-92. Bean, D. F. & R. A. Bernardi (2007). Accounting ethics courses: do they work? The CPA Journal, January, 64-67. Bernardi, R. A. (1994). Fraud detection: the effect of client integrity and competence and auditor cognitive style.
Auditing: A Journal of Practice and Theory, 13(supplement), 68-84. Bebeau, M.J., & S. J. Thoma (2003). Guide for DIT-2. Minneapolis, MN: University of Minnesota Press. Dubuc, B. (2002). Moral development. The Brain from Top to Bottom. McGill University. Retrieved March 5, 2010,
from http://thebrain.mcgill.ca/flash/i/i_09/i_09_s/i_09_s_dev/i_09_s_dev.html Desplaces, D. E., D. E. Melchar, L. L. Beauvais & S.M. Bosco (2007). The impact of business education on moral
judgment competence: an empirical study. Journal of Business Ethics, 74, 73-87. Duska, R. F. & B. S. Duska (2003). Accounting ethics. Malden, MA: Blackwell Publishing. Hurtt, R. K., & C. W. Thomas (2008). Implementing a required ethics class for students in accounting: the texas
experience. Issues in Accounting Education, 23(1), 31-52.

Page 118
Academy of Educational Leadership Journal, Volume 15, Number 4, 2011
Jacobs, R. M. (2008). Kohlberg’s stages of moral development. Retrieved March 5, 2010, from http://www83.homepage.villanova.edu/richard.jacobs/MPA%208300/theories/kohlberg.html
Klutz, A. (2006). Sarbanes-Oxley essential information. SOX-Online. Retrieved March 5, 2010, from
http://www.sox-online.com/basics.html Kohlberg, L. (1969). Stage and sequence: the cognitive- developmental approach to socialization. In D. A. Golsin
(Ed.), Handbook of Socialization Theory and Research (pp. 347-480). Chicago: Rand McNally. Mastracchio, N. (2008). The role of NASBA and state boards in accounting education. The CPA Journal, March,
64-69. National Association of State Boards of Accountancy (NASBA), 2007. Rules 5-1 and 5-2 Exposure Draft. Retrieved
3/5/2010, www.nasba.org/nasbaweb/NASBAWeb.nsf/PS/09C424C42CDE90BE862573A30078A798? OpenDocument
National Association of State Boards of Accountancy (NASBA) , 2005. UAA Education Rules 5-1 and 5-2
Exposure Draft. Retrieved 3/5/2010, www.nasba.org/nasbaweb/NASBAWeb.nsf/PS/264D55C613 B9747D862571B900755C7F? OpenDocument
Ramos, M. (2003). Auditors’ responsibility for fraud detection. Journal of Accountancy. January, 28-35. Rest, J.R. (1979a). Development in Judging Moral Issues. Minneapolis: University of Minnesota Press. Rest, J.R. (1979b). Revised Manual for the Defining Issues Test. Minneapolis: University of Minnesota Press. Rest, J. R., S. J Thoma, D. Narvaez & M. J. Bebeau (1997). Alchemy and beyond: indexing the defining issues test.
Journal of Educational Psychology, 89, 498-507. Richmond K. A. (2001). Ethical reasoning, machiavellian behavior, and gender: the impact on accounting students’
ethical decision making (Doctoral dissertation, Virginia Polytechnic and State University, 2001). Shawver, T. J. (2006). An exploratory study assessing the effectiveness of a professional responsibility course.
Global Perspectives on Accounting Education, 3, 49-66. Van Wyhe, G. (2007). A history of S.S. higher education of accounting, part II: reforming accounting within the
academy. Issues in Accounting Education, 22(3), 481-501. Venezia, C. C. (2005). The ethical reasoning abilities of accounting students. Journal of American Academy of
Business, 200-207.

Page 119
Academy of Educational Leadership Journal, Volume 15, Number 4, 2011
THE PROFESSOR LIFE CYCLE
Randy J. Anderson, California State University, Fresno Lydia E. Anderson, California State University, Fresno
ABSTRACT
There is a well known economic and marketing theory named the Product Life Cycle that
states that products go through a series of four distinct stages (Introduction, Growth, Maturity, and Decline), with each stage requiring a strategy that adapts to each marketing situation respect of each stage. This theory is well adapted to toasters and washing machines, but how does it apply to academia? This paper will discuss the lifecycle from the perspective of those who have chosen academia as a vocation. This perspective is aptly named, The Professor Life Cycle. Those who have dedicated their professional careers to college teaching pass through these four recognized stages. Time wise, each stage is measured on somewhat of a nebulous sliding scale, with some spending more time in one stage than another. But there is no denying that a retrospective review of one’s career will have distinct demarcations with the linear passing from one stage to the next. This paper analyzes each stage of the Professor Life Cycle as it applied to the professors’ experiences throughout their teaching careers. Professors will relate to each identifiable stage in the Life Cycle, creating an imprint, a historical marker, for those who will follow in their footprints.
THE INTRODUCTION STAGE
The four stages of the Product Life Cycle include Introduction, Growth, Maturity, and Decline stages [Lamb, Hair & McDaniel, 2011]. During the Introduction Stage, a non-tenured professor focuses on heavy campus involvement, establishing a teaching methodology, increasing confidence in both subject matter and command of the classroom. The new professor spends most of his/her classroom time lecturing and using publisher-provided materials. Because the new professor is attempting to increase job security, he/she becomes heavily involved in on-campus activities ranging from service as an advisor for student organizations to service on a campus committee. It is imperative that the new professor actively engages in numerous research and publication activities, sometimes individually or coauthoring with a mentor or colleague. Collegially, during this stage, the professor is attempting to establish credibility and create political allies in an effort to secure tenure.
Academia hires and invests in prospective faculty based upon the new professor’s vision, enthusiasm, and expertise, and then administration smothers the new employee (albeit sometimes unintentionally) with academic sand and debris. This “sand and debris” can mask itself in

Page 120
Academy of Educational Leadership Journal, Volume 15, Number 4, 2011
various forms of rigid probationary periods, an inefficient organizational culture, bureaucracies, and poor leadership. Too many times new hires are unconsciously thrown directly into these murky waters without ever realizing what long term damage may have been created [Anderson, 2000].
Often these new faculty members experience the “invisible flyswatter” effect during the introductory stage. There may be one or two disgruntled senior faculty members who make the professional life of the new person miserable. No matter the quality or quantity of teaching evaluations, research publications, or committee memberships that the new hire submits and experiences, the outcomes are not quite good enough for the disgruntled [Anderson, 2000]. There always seems to be a criticism which pits the new person against the establishment. In academia, the politics are often vicious as there is so little to gain and practically nothing to lose, except some very good, potentially productive new faculty members. Some may view this intellectual hazing as a rite of passage. Those who support this unprofessional behavior believe if a new faculty member can overcome the obstacles, he/she will be admitted to the exclusive club with the offering of a lifetime guarantee of employment in the form of tenure. It is the duty of senior faculty to watch out for the new, junior faculty to ensure and attempt to protect him/her from the invisible fly swatter.
THE GROWTH STAGE
Passing to the Growth Stage, the professor increases his/her classroom confidence. This passing, from the introductory stage, usually takes between four to six years to achieve, depending upon the length of the tenuring and promotion process. As classroom confidence increases, the professor spends less time at the lectern and begins to introduce hands-on learning exercises into the teaching methodology. The instructor also begins supplementing his/her own material as opposed to publisher produced materials and perhaps begins to integrate results from the introductory-stage research. The professor takes his/her current research to a more in-depth level and expands both research topics and publication. Campus and student involvement continues as the professor becomes further entrenched in academia. The time spent in the growth stage has no set timetable, as it depends upon the vocational intent of the professor. More often than not, it is during the growth stage that some tenured professors reassess membership at the school that granted tenure. It is still possible to move to a different institution which might offer more visibility, more money, consulting opportunities, etc. Because the successful professor has already survived the tenuring process, the mystery and stress of jumping through the tenure hoop a second time is somewhat minimized and certainly less threatening. The professor who has shown promise by the number of published articles is in a much greater position to bargain with administration for certain perquisites. Moreover, new institutions are always looking for the motivated young professor, especially if this person can contribute to the institution’s accreditation efforts. The rite of flight is always a possibility at this stage.

Page 121
Academy of Educational Leadership Journal, Volume 15, Number 4, 2011
THE MATURE STAGE
As the professor transitions to the Maturity Stage, the professor finally finds balance both
in the classroom and on campus among colleagues. Lectures, while still current and invigorating, become more routine. This routine is often reflected in the confidence of the professor’s command of the subject matter. The majority of lecture material is original and, while the professor teaches a subject or concept, the professor seldom utilizes or refers to the text. Outside of the classroom, the professor continues his/her research, but does not place as much emphasis on the research, viewing the exercise more as an opportunity to stay current in the field rather than a necessary requirement for advancement. Campus and student involvement begins to decrease due to an increase in personal priorities.
THE DECLINE STAGE
When the professor finally moves to the Decline Stage, the professor embarks on a time of reflection. The reflection includes a self examination of his/her career and the identification of successes and accomplishments in the classroom, on campus, and in research publication. Little to no preparation is given to classroom lectures. Campus involvement is little to null, and research becomes minimal. It is at this stage that the professor is sought out by junior faculty as a mentor, to help counsel tenure-track professors.
With the exception of the movement from the introduction to the growth stages through the awarding of tenure, the majority of professors are subconsciously unaware of the transition from each stage of the Professor Life Cycle. While it may be too late for those in the decline stage to improve his/her current status, it is suggested professors in the other stages of the Professor Life Cycle make the most of each stage and avoid career stagnation and pitfalls they may later regret. It is hoped that professors enter academia to leave a legacy of student success as a result of one’s classroom performance and conducts research that results in stimulated thinking. That said, it is important that those new to academia recognize that few if any professors can truly excel in both the classroom and true academic research. Some will argue that it is possible, but both areas, if done correctly, require a tremendous amount of time, effort, and creativity.
CONCLUSION
The majority of new professors beginning their careers in the introduction stage have already established a leg up on academic research through their dissertation process, as many Ph.D. candidates are now required to author or co-author a series of research papers with their major professor (chair of the dissertation committee). For example, Purdue doctoral candidates

Page 122
Academy of Educational Leadership Journal, Volume 15, Number 4, 2011
are required to publish four articles in lieu of a dissertation before the doctoral degree is conferred [Hashim, 2010]. Moreover, these same doctoral candidates should have also gained experience in the classroom as teaching assistants. While a professor in the introductory stage may have little or no choice other than to conduct and publish research in addition to the classroom performance, the professor should begin utilizing this period to identify in which area he/she most enjoys and in which he/she excels. This is also the period in which the new professor should identify a mentor amongst the senior faculty (who are usually in the decline stage) that reflects the new professor’s teaching and/or research philosophy. The introductory stage professor should request permission to sit through several lectures provided by his/her mentor to identify best classroom practices. It is also highly appropriate to request assistance with lecture materials and resources so as not to be dependent on publisher materials. As mentioned earlier, the introduction stage is where the professor is working diligently to earn tenure. This tedious and somewhat political process, if not handled appropriately, can result in burn-out and paranoia, based up the threat of other faculty members who may not support the awarding of tenure. Professors must stay true to who they are and focus on the process of fulfilling the requirements to gain tenure. Moreover, they should make every attempt to avoid university politics and, at the very least, not take them personal.
Upon the awarding of tenure, an “invisible fly swatter” representing the threats of non-support virtually disappears as should a large portion of faculty politics. This is the period where it should become evident as to which area the professor will focus the majority of his/her attention (i.e., research vs. classroom). When the professor identifies which factor he/she most enjoys, he/she must remember that those with a thriving career in academia cannot ignore the other element. The key is to identify how to successfully have the lesser of the requirement not go ignored. For example, if a professor prefers the classroom over research, the professor should conduct the required research on a topic related to classroom instruction. If a professor prefers research over the classroom, the professor should identify how to keep lecture material fresh and not ignore student needs. Although the professor now has tenure, collegial faculty relationships cannot be ignored. The new tenured professor will still be required to serve on departmental, divisional, and campus committees. This will be the first stage where the professor may begin to serve as a mentor to a non-tenured professor and/or adjunct lecturer.
The maturity stage will quickly segregate tenured professors into two groups. One group will continue his/her involvement in both the classroom and/or research. Those in this group will enjoy a lengthy period in the maturity stage, finding his/her reward in either academic research or academic instruction. The other group will begin a quick transition from the maturity stage to the Decline Stage. For the sake of discussion, the first group will be referred to M-R (signifying maturity-reward). The second group will be referred to M-D (signifying maturity-decline). M-R professors work diligently to challenge themselves in their selected area of expertise (research or classroom). They strive to be innovators and attempt to distinguish themselves from their colleagues. This is an important time to begin succession planning by actively serving as a

Page 123
Academy of Educational Leadership Journal, Volume 15, Number 4, 2011
mentor and sharing expertise with less senior faculty. M-D professors typically had a difficult time obtaining tenure or experienced an atypical amount of academic politics. Consequently, they have openly chosen to retire on the job, still showing up to the classroom and/or conducting research (albeit non-descript research) but divest themselves from real contributions. M-D professors typically do not have a desire to serve on a campus committee, much less as a mentor. While M-D professors are protected by tenure in addition to a union contract, they need to continually remind themselves of the reason they initially chose academia as a profession and attempt to transition from M-D back to M-R. It is possible to reverse the general apathy that is prevalent with the professors in decline. This can be done by the change in attitude and a change in administration. Simply, the leaders of academic units themselves at universities and colleges are partially responsible for the professor who has retired on the job. When favoritism and cronyism are practiced to any degree, the professors in decline can feel left out of the mix. By engaging the once productive professor, administration can offer certain perquisites to keep all professors connected to their students, their universities, and their professions.
The final stage of the Professor Life Cycle is that of the decline stage. While M-D professors spend a longer time in this stage, M-R professors generally stay in the decline stage for a very brief period. Once it is time to retire, the M-R professors make their announcement and commit themselves to a quick and successful exit. They usually have a secondary vocation waiting for them after all of the accolades have settled and the cake has been eaten. One of the main objectives of all professors in the Decline Stage is to serve as mentors for the new professors who are entering the Introductory Stage. It is imperative that any professor who has knowledge of how the university system works be a “lead blocker” for the neophytes entering into the system. The decline stage need not be somber time, but rather a time for genuine reflection. University professors generally do not write best selling memoires about their life and times in the classroom. But they can add to the general body of learning by publishing one final account of what is important to students and faculty members alike.
SUMMARY
The Professor Life Cycle has four distinct phases which can be delineated based upon time of service and time of accomplishment. Newly graduated doctoral students (Introductory Stage) who have chosen academia as a vocation always have the most difficult entry into the somewhat exclusive club. They are required to serve many different masters with a smile on their collective faces without demonstrating any animosity towards the senior faculty, while trying to engage a mentor who can fend off the academic wolves. Once tenure is granted, they move on to the Growth Stage. This is where the junior faculty really prospers as their contributions to the university life are less calculated and more for the expansion of knowledge and professional exposure. The Mature Stage professor is more confident in classroom presence and has established a name in the research world. It is here where professors determine how

Page 124
Academy of Educational Leadership Journal, Volume 15, Number 4, 2011
much effort they will expend on their vocation, active and engaged or resting on their laurels, satisfied with previous efforts. Finally, professors all end up in the Decline Stage. It is not that they have been completely consumed like an old toaster, but they are looking forward to a time when they will be honored with emeriti status, be given a lifetime parking sticker, and be invited to the annual Christmas party. They have weathered the politics, watched the changes in administration, and have published and not perished. It is now their turn to help the next generation of university professors start their careers, and watch the Professor Life Cycle begin all over again.
REFERNCES Anderson, Lydia (2000, Feb. 7). The invisible flyswatter. The Business Journal. 4. Hashim, Mathew. Conversation with Purdue graduate student. July, 2010. Lamb, Hair, & McDaniel (2011). MKTG4. Mason, OH: Centage/ SouthWestern.

Page 125
Academy of Educational Leadership Journal, Volume 15, Number 4, 2011
MULTI-LEVEL MODELING OF PRINCIPAL AUTHENTICITY AND TEACHERS’ TRUST AND
ENGAGEMENT
Chuang Wang, University of North Carolina at Charlotte James J. Bird, University of North Carolina at Charlotte
ABSTRACT
This study examined multi-level structural equation modeling process between teacher perceptions of authentic leadership and its relationship to trust and engagement levels. The study took place in three county school districts of a southeastern state. A total of 917 teachers from 60 schools were surveyed concerning their perceptions of authentic leadership and levels of trust and engagement. Statistical analyses included descriptive statistics, confirmatory factor analysis, Structure Equation Modeling, and Hiearchical Linear Modeling. All three surveys were found to have valid construct validity although the data were more favorable toward the second-order factor model than the first-order factor model for authenticity and trust but not for engagement. Intra-class correlation coefficients were calculated for each item in the survey and, on average, there was approximately 15% of the variance between schools for authenticity, trust, and engagement, respectively. Therefore, a multi-level SEM was used to account for between-school and within-school variances. Teacher’s perception of principal authenticity levels was highly related to their trust and engagement levels between and within schools. The results are discussed with regard to their implications for future research and the improvement of practice. Authentic leadership of building principals and its relationship to teacher levels of trust and engagement should be of interest to professional development programs, school district hiring, and assessment practices.
INTRODUCTION Teachers play a significant role in education (Easton-Brooks & Davis, 2009; Gere, Buehler, Dallavis, & Haviland, 2009; McKown & Weinstein, 2007; Stronge, Ward, Tucker, & Hindman, 2007). Therefore, it is of utmost importance to provide a healthy work condition for the teachers. As the leader of a school, principal’s behaviors and management skills have an impact on teachers’ job satisfaction, efficacy, trust in the organization, and engagement levels (Bird, Wang, Watson, & Murray, 2009; Bogler, 2001; Dipaola & Tschannen-Moran, 2001; Hipp & Bredeson, 1995; Koh, Steers, & Terborg, 1995). Most of the previous studies on these topics are in the business management field and rarely linked the three constructs of principal

Page 126
Academy of Educational Leadership Journal, Volume 15, Number 4, 2011
authenticity, teacher trust and teacher engagement (Branson, 2007; Connell, Ferres, & Travaglione, 2003; George, Sims, McLean, & Mayer, 2007). Very few studies have considered employee’s trust and engagement and the employer’s leadership style simultaneously (Yammarino, Dionne, Schriesheim, & Dansereau, 2008). The purpose of this study is to investigate the relationships between principal’s authenticity and teacher’s trust and engagement using a multi-level approach. The use of a multi-level approach allows the researcher to examine relationships among variables within schools as well as between schools (Goddard, Tschannen-Moran, & Hoy, 2001; Stapleton, 2006). Authentic Leadership Style Authentic leadership style is usually understood as being true to oneself (Harter, 2002) and has been researched extensively recently in management literatures (Gardner & Schermerhorn, 2004; George et al., 2007; Luthans & Avolio, 2003). Drawing upon Luthans and Avolio’s (2003) initial definition of authentic leadership that focused on self-awareness and self-regulated behaviors as well as Gardner, Avolio, Luthans, May, and Walumbwa’s (2005) emphasis on the self-regulation components of authentic leadership (i.e., internalized regulation, balanced processing of information, relational transparency, and authentic behavior), Walumbwa, Avolio, Gardner, Wernsing, and Peterson (2008) defined authentic leadership as “a pattern of leader behavior that draws upon and promotes both positive psychological capacities and a positive ethical climate, fosters greater self-awareness, an internalized moral perspective, balanced processing of information, and relational transparency on the part of leaders working with followers, fostering positive self-development.” (p. 6). This concept of authentic leadership in educational settings, however, is relatively new although some scholars have investigated principal’s leadership behaviors, teacher’s trust in the schools, as well as school climate and their impacts on student learning outcomes (Bird et al., 2009; Begley, 2001; Branson, 2007; Lambert, 2002; Marzano, Waters, & McNulty, 2005). Trust
Trust is a critical component of school improvement and effectiveness (Tschannen-Moran, & Hoy, 2001). Mayer, Davis, and Schoorman (1995) defined trust as “the willingness of a party to be vulnerable to the actions of another party based on the expectation that the other party will perform a particular action important to the trustor, irrespective of the ability to monitor or control that party” (p. 712). Scholars in the past paid attention to trust as an important factor that influences employees’ well-being, retention, and the success of the institution (Connell et al., 2003; Kramer & Tyler, 1996; Mayer & Davis, 1999; Shaw, 1997). In education, Tschannen-Moran and Hoy (2000) reviewed a wide variety of theoretical articles and empirical studies on trust as it related to relationships within schools and concluded that trust included such

Page 127
Academy of Educational Leadership Journal, Volume 15, Number 4, 2011
constructs as willing vulnerability, benevolence, reliability, competence, honesty, and openness. Tschannen-Moran and Hoy (2000) further concluded that trust is required for many of the reforms in American schools and collaborative decision-making and teacher empowerment depend upon trust. Engagement The concept of engagement was defined as employees’ commitment and the positive emotions they experience (Ostrem & Wheeler, 2006). Levels of engagement were found to be positively related to success, rapport, sense of belonging, and trust in the organization (Buckingham & Coffman, 1999; Fredrickson, 1998; Ostren & Wheeler, 2006). In educational settings, Dipaola and Tschennan-Moran (2001) noted a strong positive relationship between organizational citizenship behavior and school climate and posit that trust in the principals and trust in the schools are essential for teachers to engage in their teaching and to help students improve their academic learning outcomes. Another study in education noted that teachers’ participation in the decision-making process will increase teachers’ sense of belonging, commitment to the school, and self-efficacy beliefs (Bogler & Somech, 2004). A more recent study by Hoy, Hoy, and Kurz (2008) found that teachers’ engagement was associated with their dispositional optimism, classroom management, and efficacy for classroom success. This study is unique in that it combines previous literature in business management and education fields and examines the three constructs (authenticity, trust, and engagement) simultaneously by considering the feature that teachers’ trust and engagement are nested within principal’s authentic leadership. Specifically, the research questions addressed by this study are as follows:
• What is the measurement model for each of the surveys used: authenticity, trust, and engagement? • How well is the principal’s self-report of authenticity related to their teacher’s report of their principal’s
authenticity? • Are there between-school variances of these measurement models? If so, what are the relationships
between principals’ authenticity and teachers’ trust and engagement levels within and between schools?
METHOD Participants A total of 83 principals and 1240 teachers from 83 public schools in three county school districts of a southeastern state completed the surveys. For the sake of statistical analyses and the concern of representativeness of the target population, all teacher and principal data where there were fewer than five teacher participants were removed from the multi-level modeling process. Due to the limitations of mean imputation method, list-wise deletion was used to remove all

Page 128
Academy of Educational Leadership Journal, Volume 15, Number 4, 2011
cases with missing values after an examination of the assumption that missing is completely at random. This resulted in a sample of 60 principals (72% of the original sample) and 917 teachers (74%). Of the 917 teachers, 798 (87%) were female and 119 (13%) were male. These teachers were predominantly (90%) Caucasian (n = 825) with 55 (6%) African American, 18 (2%) Hispanic, and 18 (2%) reporting other ethnic background. This demographic information matches that of the teacher population at the school districts (80% female and 20% male; 89% Caucasian, 8% African American, 2% Hispanic, and 1% other). Of the 917 teachers who reported their highest education level achieved, 537 (59%) had Bachelor’s degrees, 358 (39%) had Master’s degrees, 9 (1%) had Educational Specialist degrees, and 7 (1%) had Doctorate degrees. Six teachers did not report this information. Teachers’ teaching experience (M = 13.36, SD = 9.21) ranged from 1 to 42 years, number of years working in the current school (M = 6.16, SD = 5.67) ranged from 1 to 32 years, and number of years working under the current principal (M = 3.08, SD = 2.02) ranged from 1 to 17 years. Teacher information of educational background and experience was not available at the school district level, however, the variance of these variables suggest that the respondents were diverse in educational background and experience. Therefore, we had no concern of a possible bias of voluntary selection of a particular group. Of the 60 school principals, 36 (60%) were female and 24 (40%) were male. These principals were also predominantly (90%) Caucasian (n = 54) with six (10%) being African American. The distribution of these principals’ highest education level was 45 (75%) Master’s degrees, 10 (17%) Educational Specialist degrees, and 5 (8%) Doctorate degrees. Seven of these principals 11 (18%) were of high schools, 14 (23%) were of middle schools, and 35 (59%) were of elementary schools. Their teaching experience (M = 13.10, SD = 6.91) ranged from 3 to 33 years, number of years in administration (M = 10.86, SD = 6.37) ranged from 3 to 30 years, and number of years working as the principal at the current school (M = 3.97, SD = 4.07) ranged from 0 to 25 years. Instruments Authentic leadership questionnaire To measure authentic leadership style, Walumbwa, Avolio, Gardner, Wernsing, and Peterson (2008) developed a 16-item questionniare (Appendix A) which consists of four subscales: (a) self-awareness, (b) relational transparency, (c) internalized moral reasoning, and (d) balanced processing. The questionnaire has two forms. The first is for the organization’s leader to self-report their own levels of authenticity. The second form is for the organization’s employees to report their leader’s level of authenticity. Self-awareness is measured by four items that reflect the extent to which leaders are aware of their strengths and limitations and how others perceive them. Relational transparency is measured by five items that reflect the extent to

Page 129
Academy of Educational Leadership Journal, Volume 15, Number 4, 2011
which leaders reinforce a level of openness with others. Internalized moral reasoning is measured by four items that reflect the extent to which leaders set high standards for moral and ethical conduct. Balanced processing is measured by three items that reflect the extent to which leaders solicit sufficient opinions and viewpoints of others prior to making important decisions. The original version of the questionnaire was designed for raters to assess their leaders. The internal reliability for each sub-scale is as follows: self-awareness, .92; relational transparency, .87; internalized moral perspective, .76; and, balanced processing, .81. Content validity of the 16 items was established through discussions of faculty members and a group of doctoral students, and the construct validity was confirmed with a sample of 224 participants in the United States and another sample of 212 participants in the People’s Republic of China. The comparative fit index ranges was .97 for the U.S. sample and .95 for the Chinese sample. The root mean square error of approximation was .05 for the U.S. sample and .06 for the Chinese sample. Predictive validity of the authentic leadership questionnaire was checked by correlating each of the four sub-scales to variables such as ethical leadership, organizational citizenship behavior, organizational commitment, and satisfaction with supervisor. All reliability and validity information in this paragraph is from the work of Walumbwa et al. (2008). Principal participants in this study completed the self-report version of this questionnaire at a principal’s meeting while teacher participants completed the rater version on-line. Participants were asked to rate the frequency of each statement that fits the leadership style using a 5-point scale ranging from 1 (not at all) to 5 (frequently, if not always). Workplace trust survey Ferris and Travaglione (2003) developed a 32-item survey (Appendix B) that consists of three subscales: (a) trust of the supervisor (9 items), (b) trust of co-workers (12 items), and (c) trust of the organization (14 items). The reliability for the subscales is .96 for trust of the supervisor, .93 for trust of co-workers, and .95 for trust of the organization (Ferris & Travaglione). Concurrent validity was established by correlating the subscale of trust in the organization with Cook and Wall’s (1980) subscale of trust in management (r = .91) and correlating the subscale of trust of co-workers with Cook and Wall’s (1980) subscale of trust in peers (r = .93). Trust of the supervisor was also significantly related to trust in co-workers (r = .52) and trust in the organization (r = .65). Discriminant validity was also established by finding no significant relationships between these three subscales and age, gender, position level, and tenure. Teacher participants in this study completed the survey on-line to report their trust in their principals, colleagues, and the schools where they were working. A 5-point scale ranging from 1 (strongly disagree) to 5 (strongly agree) was used.
Page 130
Academy of Educational Leadership Journal, Volume 15, Number 4, 2011
Gallup organization’s Q12 survey Buckingham and Coffman (1999) developed 12 items (Appendix C) to measure employee engagement as a result of thousands of focus groups and interviews. The reliability for this survey was .88. Concorrent validity of the 12 items were established by correlating the sum of the 12 items with customer satisfaction, profitablity, and productivity, respectivley (Harter, Schmidt, & Keyes, 2002). Teacher participants in this study completed the survey on-line to report their engagement levels. A 5-point scale ranging from 1 (strongly disagree) to 5 (strongly agree) was used. Procedures Box-plots were used to check outliers for each variable, and residuals of the multivariate models were checked as well. No outlier was found in the data set. Descriptive statistics and internal consistency of the instruments were examined to explore and examine the constructs measured before inferential statistical procedures. Construct validity of the instruments was checked with confirmatory factor analysis (CFA). Both hierarchial linear modeling (HLM) and stucture equation modeling (SEM) were used to examine the relationships between teachers’ trust and engagement levels with their ratings of principals’ authentic leadership skills.
RESULTS All the instruments used in this study were reliable: the internal consistency ranged from .76 to .93 for principal’s self-report of authenticity; from .81 to .96 for teacher’s report of their principal’s authenticity; from .93 to .97 for teacher’s trust, and .86 for teacher’s engagement (Tables 1 and 2). Means and standard deviations of all the first-order and second-order constructs were also reported in Tables 1 and 2, respectively. The means for all the constructs were close to 4 out of 5, which suggested that, on average, the principal and teachers rated favorably on their authenticity, trust, and engagement. Comparisons of the mean scores and standard deviations of the first-order and second-order constructs of authenticity between principal’s self-report and teachers’ ratings also revealed that principals rated themselves significantly higher than what their teachers rated them, F (5, 54) = 4.19, p =.001; η2 = .14; and that the distribution of principal’s self-ratings had much higher values of leptokurtosis than teacher ratings, which means that the variance for the principal’s self-ratings was much smaller than that for the teachers’ ratings. On average, principals rated themselves 4.64 whereas teachers rated principals 4.02 out of 5. Follow-up multiple comparisons with Tukey’s Honestly Significant Difference (HSD) method showed that principal’s rated themselves significantly higher than teachers rated them on all first-order and second-order constructs of authenticity (p values less than .01).

Page 131
Academy of Educational Leadership Journal, Volume 15, Number 4, 2011
Table 1
Means, Standard Deviations, Inter-Correlations, and Internal Consistencies for Authentic Leadership Questionnaire (n = 60 for principals and n = 917 for teachers)
1 2 3 4 5 6 7 8 9 10 1 -- .88** .91** .92** .82** .12 2 -- .73** .74** .63** .11 3 -- .79** .64** .08 4 -- .69** .21 5 -- .07 6 -- .94** .93** .91** .91** 7 -- .81** .80** .85** 8 -- .81** .78** 9 -- .78** M 4.64 4.50 4.59 4.88 4.59 4.02 3.86 4.06 4.26 3.88 SD 0.55 0.58 0.59 0.67 0.64 0.82 1.02 0.81 0.82 0.95
Alpha .93 .81 .76 .87 .76 .96 .91 .84 .88 .81 Note. (a). 1-5 were principal’s self-report, and 6-10 were means of teachers’ ratings; (b). 1 & 6 were total authentic scores, 2 & 7 were self-awareness, 3 & 8 were transparency, 4 & 9 were ethical/moral, and 5 & 10 were balanced processing; (c). ** p < .01.
The correlation coefficients among all first-order constructs of principal authenticity were highly correlated to each other with a minimum value of .63 for principal’s self-report and .78 for teacher’s rating of their principal’s authenticity. Moreover, all first-order constructs of authenticity were highly related to the second-order construct of authenticity (the minimum correlation coefficient was .82 for principal’s self-report and .91 for teachers’ rating of their principal’s authenticity). These high coefficient values suggest that the measurement model for authenticity is second order with all first-order constructs loaded to the second-order construct of authenticity. Similar patterns were found in Table 2 about the relationships among the first-order and second-order constructs of trust.
Table 2 Means, Standard Deviations, Inter-Correlations, and Internal Consistencies for Teacher Engagement and
Trust (n = 917) 1 2 3 4 5 Engagement (1) -- .79** .77** .64** .72** Trust Total (2) -- .96* .81** .92** Trust School (3) -- .67** .90** Trust Colleagues (4) -- .58** Trust Principal (5) -- M 4.08 3.97 3.85 3.95 4.12 SD 0.58 0.67 0.83 0.65 0.76 Alpha .86 .97 .95 .93 .94 Note. ** p < .01.
Table 1 also showed that the relationships between teachers’ rating of their principal’s authenticity was not statistically significantly related to the principal’s self-report of authenticity

Page 132
Academy of Educational Leadership Journal, Volume 15, Number 4, 2011
for the general construct of authenticity (r = .12), self-awareness (r = .11), relational transparency (r = .08), internalized moral reasoning (r = .21), or balanced processing (r = .07). A further analysis with multi-level structure equation modeling would be needed to understand this phenomenon. The goodness-of-fit indices of the measurement models for principal’s self-report of authenticity, teachers’ ratings of their principal’s authenticity, engagement, and trust were presented in Table 3.
Table 3 Goodness-of-Fit Statistics of the Measurement Models for Each Construct
χ2 df NFI NNFI CFI GFI SRMR RMSEA LCI HCI Authenticity (Principal) 147.36 100 .73 .83 .86 .68 .11 .110 .069 .140
Authenticity (Teacher) 705.20 100 .98 .98 .98 .92 .04 .080 .074 .085
Engagement 387.13 52 .96 .96 .96 .94 .05 .082 .075 .090 Trust 3482.21 461 .98 .98 .98 .81 .07 .083 .080 .086 Note. These models were second-order for authenticity and trust but first order for engagement. NFI = normed fit index; CFI = comparative fit index; GFI = goodness of fit index; SRMR = Standardized Root Mean Square Residual; RMSEA = Root Mean Square Error of Approximation; ICL = lower bound 90% confidence interval of RMSEA; HCI = higher bound 90% confidence interval of RMSEA.
We evaluated the goodness of the fit of the models using various fit indices reported in previous studies, including the 2χ statistic, normed fit index (NFI), non-normed fit index (NNFI), comparative fit index (CFI) goodness of fit index (GFI); Standardized Root Mean Square Residual (SRMR); and Root Mean Square Error of Approximation (RMSEA). Although Hu and Bentler’s (1999) joint criteria for absolute and incremental models (i.e., NNFI ≥ .96, CFI ≥ .96, and SRMR ≤ .09) have been widely used to judge model fit, they have been criticized for too restrictive assumptions and rejecting adequately fit models (Marsh, Hau, & Wen, 2004). In addition, Fan and Sivo (2005) questioned the validity of the two-index strategy in model fit assessment presented by Hu and Bentler (1999). Therefore, Hu and Bentler’s (1999) criteria were used with caution in this study. The suggestions provided by LISREL to add paths from observable variables to latent variables or to add error covariance between observable variables were not followed because of the concern of mechanically fitting the model (MacCallum, Roznowski, & Necowitz, 1992). The measurement models for teacher’s trust (Figure 1) and engagement (Figure 2) were confirmed. The authenticity measurement model was confirmed at the teacher-level (Figure 3; teachers’ ratings of their principal’s authenticity) but not at the principal level (principal’s self-report of authenticity). Although the ratio of the chi-square value to the degree of freedom for the principal’s self-report of authenticity was relatively lower than those for other models, the sample size for the principal’s self-report is 60 whereas that for teacher’s ratings was 917.

Page 133
Academy of Educational Leadership Journal, Volume 15, Number 4, 2011
Therefore, comparison of the ratio between chi-square values between principal’s self-report and teacher ratings was not appropriate.
Figure 1. Measurement Model for Authenticity.
Figure 2. Measurement Model for Trust.
Q8 0.960.210.81 Q9 0.340.82
Q10 0.330.59
Q11 0.650.55
0.97 Q12 0.70
0.86 Q13 0.25
0.76 Q14 0.42
0.91 0.77 Q15 0.41
1.00 0.81 Q16 0.34
0.66 Q17 0.560.80
0.98 Q18 0.35
0.89 Q19 0.21
\ 0.99 Q20 0.260.860.79 Q21 0.38
0.90 Q22 0.200.86
Q23 0.26
Transparency
Moral
Process
Selfaware
Authenticity
Q24 0.34
0.81 Q25 0.30
0.83 Q26 0.310.83
Q27 0.390.780.66 Q30 0.560.840.84 Q32 0.29
0.76 Q33 0.290.760.81 Q35 0.42
0.79 Q42 0.42
Q49 0.35
Q54 0.37
0.99 Q29 0.54
Q34 0.470.68
Q37 0.490.730.72 Q38 0.40
0.77 Q40 0.530.68
1.00 0.63 0.78 Q43 0.390.800.82 Q45 0.370.74
Q47 0.330.770.71 Q48 0.45
Q50 0.41
Q53 0.490.87
Q28 0.44
0.75 Q31 0.57
0.65 Q36 0.260.86
Q39 0.240.870.82 Q41 0.330.90
Q44 0.200.85
Q46 0.270.790.41 Q51 0.38
0.87 Q52 0.83
Q55 0.25
Trust School
Trust Colleagues
Trust Principal
Trust

Page 134
Academy of Educational Leadership Journal, Volume 15, Number 4, 2011
Figure 3. Measurement model for engagement.
Estimates of intra-class correlation (ICC), a ratio of the univariate between-school variance over the total variance, are presented in Table 4 for all items, first-order and second-order constructs for all surveys.
Table 4 shows that around 14% of the variance in teachers’ ratings of the principal’s authentic leadership, around 15% of the variance in teachers’ ratings of trust in their principals, and around 6% of the variance in teachers’ ratings of engagement existed between schools. As a result, the nested feature of the data was considered in multi-level structure equation modeling and HLM analyses. Please note that the first-order construct of trust in their principals, instead of the second order trust, was used in the structure model because there was only about 7% of variance existing between schools for trust in their colleagues and we believe that trust in their principals is a more meaningful construct related to their principal’s authenticity.
Q57 0.73
Q58 0.8 0.52
Q59 0.71 0.44
Q60 0.57 0.540.66 Q61 0.49 0.720.74 Q62 0.45
1.00 0.770.68 Q63 0.41
0.46 Q64 0.53 0.34
Q65 0.79 0.56
Q66 0.88 0.62
Q67 0.68
Q68 0.62
engagement

Page 135
Academy of Educational Leadership Journal, Volume 15, Number 4, 2011
Table 4
Estimates of ICC for Items, First-Order, and Second-Order Constructs Authenticity Trust Engagement Variables ICC Variables ICC Variables ICC Q8 10.07 Q24 14.35 Q57 5.97 Q9 16.83 Q25 18.02 Q58 7.37 Q10 11.33 Q26 10.73 Q59 5.28 Q11 13.98 Q27 24.93 Q60 7.74 Q12 13.04 Q30 7.38 Q61 4.99 Q13 15.47 Q32 17.65 Q62 4.19 Q14 9.88 Q33 22.38 Q63 6.94 Q15 9.99 Q35 12.19 Q64 8.29 Q16 16.55 Q42 14.11 Q65 9.51 Q17 7.26 Q49 18.81 Q66 2.85 Q18 18.47 Q54 13.52 Q67 5.22 Q19 17.05 Q37 8.74 Q68 6.00 Q20 15.68 Q38 5.83 Engagement 6.19 Q21 13.86 Q40 4.11 Q22 15.94 Q43 4.58 Q23 17.66 Q45 10.31 Self-awareness 15.79 Q47 7.80 Relational Transparency 13.05 Q48 9.68 Internalized Moral Reasoning 12.97 Q50 3.76 Balanced Processing 14.26 Q53 6.01 Authenticity 13.94 Q28 17.44 Q31 18.62 Q36 14.54 Q39 16.87 Q41 11.61 Q44 18.10 Q46 21.16 Q51 22.98 Q52 9.18 Q55 2.33 Trust School 15.82 Trust Colleagues 6.76 Trust Principal 15.28 Trust Total 13.54
The multi-level structure equation model was found to be satisfactory: χ2 =24457.40, df = 1707, NFI = .96, NNFI = .97, CFI = 97, GFI = .53, SRMR = .09, and RMSEA = .12. The 90% confidence interval for RMSEA was from .119 to .120. Figure 4 shows the structure equation model of the three major constructs (authenticity, trust, and engagement) between and within schools, respectively.
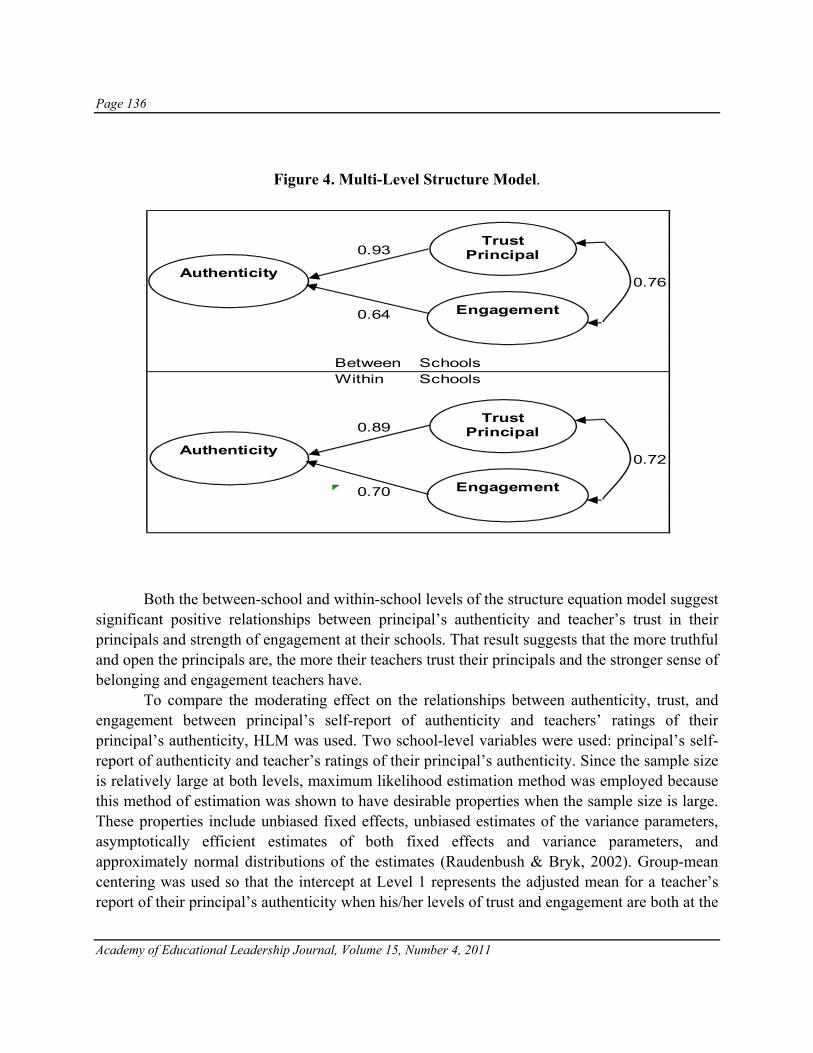
Page 136
Academy of Educational Leadership Journal, Volume 15, Number 4, 2011
Figure 4. Multi-Level Structure Model.
Both the between-school and within-school levels of the structure equation model suggest significant positive relationships between principal’s authenticity and teacher’s trust in their principals and strength of engagement at their schools. That result suggests that the more truthful and open the principals are, the more their teachers trust their principals and the stronger sense of belonging and engagement teachers have.
To compare the moderating effect on the relationships between authenticity, trust, and engagement between principal’s self-report of authenticity and teachers’ ratings of their principal’s authenticity, HLM was used. Two school-level variables were used: principal’s self-report of authenticity and teacher’s ratings of their principal’s authenticity. Since the sample size is relatively large at both levels, maximum likelihood estimation method was employed because this method of estimation was shown to have desirable properties when the sample size is large. These properties include unbiased fixed effects, unbiased estimates of the variance parameters, asymptotically efficient estimates of both fixed effects and variance parameters, and approximately normal distributions of the estimates (Raudenbush & Bryk, 2002). Group-mean centering was used so that the intercept at Level 1 represents the adjusted mean for a teacher’s report of their principal’s authenticity when his/her levels of trust and engagement are both at the
0.93
0.76
0.64
Between SchoolsWithin Schools
0.89
0.72
0.70
TrustPrincipal
Authenticity
Engagement
TrustPrincipal
Authenticity
Engagement

Page 137
Academy of Educational Leadership Journal, Volume 15, Number 4, 2011
mean of the teacher’s school. A two-step strategy for the conditional model was used (Speece, Ritchey, Cooper, Roth, & Schatschneider, 2004). First, simple conditional models were run to examine each variable individually. Then, the variables significant at the first step were examined simultaneously (complete conditional model) at a significance level of p < .05. Estimates of the HLM were presented in Table 5.
Table 5 Estimates for Principal’s Authentic Leadership with Hierarchical Linear Models
Simple Conditional Model Complete Conditional Model Coefficient SE t p Coefficient SE t p
Teacher Level Trust-Principal 0.89 0.02 37.36 <.001 0.86 0.03 25.14 <.001 Engagement 0.76 0.05 16.64 <.001 0.02 0.03 0.68 .50
School-Level (Adjusted Mean Authenticity) Self-Report 0.01 0.08 0.09 .93 Teacher-Rated 0.99 0.01 141.44 <.001 0.99 0.01 141.44 <.001
School-Level (Trust-Principal) Self-Report -0.01 0.05 -0.26 .80 Teacher-Rated -0.11 0.05 -2.18 .03 -0.10 0.06 -1.63 .10
School-Level (Engagement) Self-Report 0.02 0.07 0.27 .79 Teacher-Rated -0.41 0.09 -4.70 <.001 -0.01 0.05 -0.26 .79
The simple conditional models implied in Table 5 suggest that principal’s self-report of authenticity had no statistically significant impact on the adjusted mean score of teachers’ ratings of principal’s authenticity or the relationship between this construct and teacher’s level of trust or engagement. The average of teacher’s ratings of their principal’s authenticity, however, had a negative impact on the relationships between teacher’s trust and principal’s authenticity and between teacher’s engagements with principal’s authenticity, respectively. The higher the teachers rated their principal’s authenticity, the weaker the strength of these relationships. When teachers rated their principal’s authenticity low, they were more than likely to have lower levels of trust and lower levels of engagement. The complete conditional model revealed that teachers’ level of engagement was no longer statistically related to their ratings of principal’s authenticity when their trust in their principal was controlled. That is, for teachers who had the same level of trust in their principal, their levels of engagement were not related to their ratings of the principal’s authenticity anymore. Magnitude of effect, or proportion of the variance explained by the conditional models in comparison to the unconditional model, was 70.75%. This magnitude of effect suggests that the variables that we put in the complete conditional model explained 70.75% of the variance with respect to principal’s authenticity rated by their teachers (Raudenbush & Bryk, 2002). The comparison between the HLM model that has both trust and engagement as predictors and the HLM model that has only trust as the predictor suggested that

Page 138
Academy of Educational Leadership Journal, Volume 15, Number 4, 2011
adding engagement as an additional predictor to trust increased the magnitude of effect by only 0.01%.
DISCUSSION The measurement models for the key constructs examined in this study (authenticity, trust, and engagement) provided further validity information of the instruments developed by Walumbwa et al., (2008); Ferris and Travaglione (2003), and Buckingham and Coffman (1999), respectively. The relatively low fit indices of the principal’s self-report of authenticity measurement model, however, suggested that the data do not support the construct structure of this instrument in self-report form and cautioned further users of the self-report form of authenticity instrument. This is not surprising because the literature suggests that other ratings are more trust-worthy than self-ratings (Atkins & Wood, 2002; Atwater & Yammarino, 1992; Furnham & Stringfield, 1994). To our knowledge, this is the first study that examined the construct validity of the self-report form of the authenticity instrument (Walumbwa, Wang, Wang, Schaubroeck, & Avolio, 2010). The finding that principal authenticity is positively and significantly related to teacher levels of trust and engagement is consistent with previous studies in business (Ostrem &Wheeler 2006) and in education (Bird et al., 2009). It seems reasonable that teachers would respond positively to the four components of authentic leadership: strong self-awareness, relational transparency, balanced processing, and moral integrity. A school principal is faced with many varied and complex situations on a daily basis. Coping with this triage-like working condition requires a certain degree of courage, confidence, and consistency of performance. This self-efficacy engenders trust amongst faculty and sets examples for teachers to follow in the pursuit of their responsibilities. Principals with strong relational transparency patterns of behavior develop deep, open, and meaningful relationships with their staff members. These principals are concerned about the further professional development of their subordinates and are supportive of their career advancement and future success. Teachers appreciate this notion of “we’re in this together” sense of teamwork and it portends to strengthen their levels of trust and engagement (Dipaola & Tschennan-Moran, 2001; Tschannen-Moran, & Hoy, 2000). Decision-making and problem-solving responsibilities are pervasive in the principalship. Faculties appreciate a leader who approaches these tasks with equanimity, free from bias and preconceived notions of outcomes. Principals, who seek input and advice from diverse sources of information and then rationally sifts the data according to rubrics reflecting established organizational goals rather than personal leanings, garner trust from their staff. “Letting the chips fall where they may” means everyone has an equal chance for consideration rather than having cliques and favoritism rule the day. Such patterned behavior generates confidence and consistency with operational matters thereby creating clarity of purpose throughout the school.

Page 139
Academy of Educational Leadership Journal, Volume 15, Number 4, 2011
Finally, principals who demonstrate moral integrity display a strong sense of right from wrong discernment. This is appreciated by teachers who deal daily with conflicting demands from parents and students. Principals, who are able to effectively and efficiently frame issues in light of “what’s best for kids” and to judge accordingly towards outcomes that reflect a client-based enterprise, win the trust of their faculty members (Bogler & Somech, 2004; Hoy et al., 2008). Teachers who know with clarity the parameters and the perimeters of what is acceptable and that which is not, are able to complete their responsibilities with confidence and dispatch. Implications for Future Research and Practice The focus of this study was on the relationship between school building principals and their respective faculties. Two different approaches were used to examine these relationships: SEM and HLM. While SEM suggested that both trust and engagement were positively related to authenticity, HLM revealed that only trust was statistically significantly related to authenticity. One possible reason is the multicolliearity between the independent variables in HLM (Iacobucci, Saldanha, & Deng, 2007) since these two constructs are highly correlated (r = .79). Another possible reason is that engagement is not related to teacher’s ratings of their principal’s authenticity when their levels of trust to their principal are the same. The structure equation model for the between-schools and within-schools show that the relationship between trust and authenticity was stronger than that between engagement and authenticity. The HLM approach showed that adding engagement as an additional predictor of authenticity had a minimal impact on the improvement of the model (the magnitude of effect increased by 0.01%). The same approaches could be applied to other leader-follower relationships within educational settings. Such pairings as superintendents and principals; boards of education and superintendents; deans and department chairs; or, chancellors and deans have the potential of extending our understandings of the value of authentic leader behavior and its relationship to follower behavior. Another arena of research exploration could be the extension of the leader-follower pairing to the inclusion of outcomes. Do students benefit from authentic leaders and trusting, engaged teachers? Is there a relationship with student performance?
Since having trusting and engaged employees is generally seen as being a desirable set of working conditions, leader authenticity should also be sought, developed, and rewarded in practice. Hiring boards and departments of human resources should seek candidates who demonstrate the components of authenticity: self-awareness, relational transparency, balanced processing, and moral integrity. These patterns of behavior can be observed in their conduct during the interview process; can be queried through actual questioning; and, can be documented through reference checking with past work settings. University preparation programs and professional development enterprises can include the concept of leader authenticity in their course content. Adding the study of authenticity to their knowledge domains would improve the chances that their clients will become aware of the

Page 140
Academy of Educational Leadership Journal, Volume 15, Number 4, 2011
positive relationships between leader behavior and follower response in this regard. Creating simulation exercises that would include opportunities for instructive role-playing would allow participants to practice authentic behavior in guided situations. Teaching methods of gathering and analyzing data from subordinates concerning their perceptions of leader authenticity would be informative for those aspiring to become future leaders. Leader supervisors should include authentic behavior as a desirable strategy and reward its implementation. Explicit feedback during goal-setting, formative, and summative evaluation sessions would reveal the importance of authenticity to the leader being assessed. Tying the demonstration of authentic behavior to compensation programs would directly bind desired behavior to expected practice.
REFERENCES Atkins, P. W. V., & Wood, R. E. (2002). Self- versus others’ ratings as predictors of assessment center ratings:
Validation evidence for 30-degree feedback programs. Personal Psychology 55, 871-904. Atwater, L. A., & Yammarino, F. J. (1992). Does self-other agreement on leadership perceptions moderate the
validity of leadership and performance predictions? Personnel Psychology, 45, 141-164. Begley, P. (2001). In pursuit of authentic leadership practices. International Journal of Leadership in Education, 4,
353-365. Bird, J. J., Wang, C., Watson, J., & Murray, L. (2009). Relationships among principal authentic leadership and
teacher trust and engagement levels. Journal of School Leadership, 19, 153-171. Bogler, R. (2001). The influence of leadership style on teacher job satisfaction. Educational Administration
Quarterly, 37, 662-683. Bogler, R., & Somech, A. (2004). Influence of teacher empowerment on teachers’ organizational commitment,
professional commitment and organizational citizenship behavior in schools. Teaching and Teacher Education, 20(2), 277-289.
Branson, C. (2007). Effects of structured self-reflection on the development of authentic leadership practices among
Queensland primary school principals. Educational Management Administration & Leadership, 35(2), 225-246.
Buckingham, M., & Coffman, C. (1999). First break all the rules: What the world’s greatest managers do
differently. New York: Simon & Schuster. Connell, J., Ferres, N., & Travaglione, T. (2003). Trust in the workplace: The importance of interpersonal and
organizational support. Journal of Management Research, 3(3), 113-118. Cook, J., & Wall, T. D. (1980). New work attitude measures of trust, organizational commitment and personal need
non-fulfillment. Journal of Occupational Psychology, 53, 39-52.

Page 141
Academy of Educational Leadership Journal, Volume 15, Number 4, 2011
Dipaola, M. & Tschannen-Moran, M. (2001). Organizational citizenship behavior in schools and its relationship to
school climate. Journal of School Leadership, 11, 424-447. Easton-Brooks, D. & Davis, A. (2009). Teacher qualification and the achievement gap in early primary grades.
Education Policy Analysis Archives, 17(10), 1-19. Fan, X., & Sivo, S. A. (2005). Sensitivity of fit indices to misspecified structural or measurement model
components: Rationale of two-index strategy revisited. Structural Equation Modeling, 12, 343-367. Ferres, N., & Travaglione, T. (2003, December). The development and validation of the workplace trust survey:
Combining qualitative and quantitative methodologies. Paper presented at the 9th Asia Pacific Researchers in Organization Studies Conference, Oaxaca, Mexico.
Fredrickson, B. (1998). What good are positive emotions? Review of General Psychology, 3, 300-319. Furnham, A. & Stringfield, P. (1994). Congruence of self- and subordinate ratings of managerial practices as
correlate of supervisor evaluation. Journal of Occupational and Organizational Psychology, 67, 57-67. Gardner, W., Avolio, B., Luthans, F., May, D., & Walumbwa, F. (2005). “Can you see the real me?” A self-based
model of authentic leader and follower development. The Leadership Quarterly, 16, 343-372. Gardner, W., & Schermerhorn, J., Jr. (2004). Unleashing individual potential: Performance gains through positive
organizational behavior and authentic leadership. Organizational Dynamics, 33, 270-281. George, B., Sims, P., McLean, A., & Mayer, D. (2007). Discovering your authentic leadership. Harvard Business
Review, 85, 129-138. Gere, A. R., Buehler, J., Dallavis, C., Haviland, V. S. (2009). A visibility project: Learning to see how preservice
teachers take up culturally responsive pedagogy. American Educational Research Journal, 46(3), 816-852. Goddard, R. D., Tschannen-Moran, M., & Hoy, W. K. (2001). A multilevel examination of the distribution and
effects of teacher trust in students and parents in urban elementary schools. The Elementary School Journal, 102(1), 3-17.
Harter, J. K., Schmidt, F. L., & Keyes, C. L. (2002). Well-being in the workplace and its relationship to business
outcomes: A review of the Gallup studies. In C. L. Keyes & J. Haidt (Eds.), Flourishing: The positive person and the good life (pp. 205-224). Washington D. C.: American psychological Association.
Hipp, K. A., & Bredeson, P. V. (1995). Exploring connections between teacher efficacy and principal’s behavior.
Journal of School Leadership, 5(2), 136-150. Hoy, A. W., Hoy, W. K., & Kurz, N. M. (2008). Teachers’ academic optimism: The development and test of a new
construct. Teaching and Teacher Education, 24(4), 821-835. Hu, L., & Bentler, P. M. (1999). Cutoff criteria for fit indexes in covariance structure analysis: Conventional criteria
versus new alternatives. Structural Equation Modeling: A Multidisciplinary Journal, 6, 1-55.

Page 142
Academy of Educational Leadership Journal, Volume 15, Number 4, 2011
Iacobucci, D., Saldanha, N., & Deng, X. (2007). A meditation on mediation: Evidence that structural equation
models perform better than regressions. Ilies, R., Morgeson, F., & Nahrgang, J. (2005). Authentic leadership and eudaemonic well-being: Understanding
leader-follower outcomes. The Leadership Quarterly, 16, 373-394. Jensen, S., & Luthans, F. (2006). Relationship between entrepreneurs’ psychological capital and their authentic
leadership. Journal of Managerial Issues, 18, 254-273. Johnson, S. M., & Birkeland, S. E. (2003). The schools that teachers choose. Educational Leadership, 60(8), 20-24. Kahn, W. (1990). Psychological conditions of personal engagement and disengagement at work. Academy of
Management Review, 33, 692-724. Kaplowitz, M. D., Hadlock, T. D., & Levine, R. (2004). A comparison of web and mail survey response rates,
Public Opinion Quarterly, 68, 94-101. Kenny, D. A., & Judd, C. M. (1986). Consequences of violating the independence assumption in analysis of
variance. Psychological Bulletin, 99, 422-431. Koh, W. L., Steers, R. M., & Terbog, J. R. (1995). The effects of transformational leadership on teacher attitudes
and student performance in Singapore. Journal of Organizational Behavior, 16, 319-333. Kramer, R. M., & Tyler, T. R. (1996). Trust in organization: Frontiers of theory and research. London: Sage. Kreft, I., & de Leeuw, J. (1998). Introducing multilevel modeling. Newbury Park, CA: Sage. Lambert, R. (2002). Evaluating management climate in Head Start programs: The measurement properties of the
policy and program management inventory. NHSA Dialog, 6, 37-52. Luthans, F., & Avolio, B. (2003). Authentic leadership development. In K. Cameron, J. Dutton, & R. Quinn (Eds.),
Positive organizational scholarship: Foundations of a new discipline (pp. 241-258). San Francisco: Berrett-Koehler.
MacCallum, R. C., Roznowski, M., & Necowitz, L. B. (1992). Model modifications in covariance structure analysis:
The problem of capitalization on chance. Psychological Bulletin, 111, 490-504. Marsh, H. W., Hau, K. T., & Wen, Z. (2004). In search of golden rules: Comment on hypothesis-testing approaches
to setting cutoff values for fit indexes and dangers in overgeneralizing Hu and Bentler's (1999) findings. Structural Equation Modeling, 11, 320-341.
Marzano, R., Waters, T., & McNulty, B. (2005). School leadership that works: From research to results.
Alexandria, VA: Association for Curriculum and Supervision. May, D., Chan, A., Hodges, T., & Avolio, B. (2003). Developing the moral component of authentic leadership.
Organizational Dynamics, 32, 247-260.

Page 143
Academy of Educational Leadership Journal, Volume 15, Number 4, 2011
Mayer, R. C., & Davis, J. H. (1999). The effect of the performance appraisal system on trust for management: A
field quasi-experiment. Journal of Applied Psychology, 84, 123-136. Mayer, R., Davis, J., & Schoorman, F. (1995). An integrative model of organizational trust. Academy of
Management Review, 20, 709-734. McKown, C., & Weinstein, R.S. (2007). Teacher expectations, classroom context, and the achievement gap. Journal
of School Psychology, 46, 235-261. Michie, S., & Gooty, J. (2005). Values, emotions, and authenticity: Will the real leader please stand up? The
Leadership Quarterly, 16, 441-457. Ostrem, L., & Wheeler, D. (2006, October) Engagement and trust as outcomes of servant leadership. Paper
presented at the Gallup Leadership Summit, Washington, DC. Palmer, N., & Fleig-Palmer, M. (2006, October). Emergent adult’s authentic leadership development accelerated
through self-awareness. Paper presented at the Gallup Leadership Summit, Washington, DC. Raudenbush, S. W., & Bryk, A. S. (2002). Hierarchical linear models: Applications and data analysis methods.
Thousand Oaks, CA: Sage. Shamir, B., & Eilam, G. (2005). “What’s your story?” A life-stories approach to authentic leadership development.
The Leadership Quarterly, 16, 395-417. Shaw, R. B. (1997). Trust in the balance: Building successful organizations on results, integrity and concern. San
Francisco, CA: Jossey-Bass Publishers. Sparrowe, R. (2005). Authentic leadership and the narrative self. The Leadership Quarterly 16, 419-439. Speece, D. L., Ritchey, K. D, Cooper, D. H., Roth, F. P., & Schatschneider, C. (2004). Growth in early reading skills
from kindergarten to third grade. Contemporary Educational Psychology, 29, 312-332. Spritzer, G. (2006). Leading to grow and growing to lead: Leadership development lessons from positive
organizational studies. Organizational Dynamics, 35(4), 305-315. Stapleton, L. M. (2006). Using multilevel structural equation modeling techniques with complex sample data (pp.
345-383). In G. R. Hancock & R. O. Mueller (Eds.), Structural equation modeling: A second course. Charlotte, NC: Information Age Publishing.
Stronge, J., Ward, T., Tucker, P., & Hindman, J. (2007). What is the relationship between teacher quality and
student achievement? An exploratory study. Journal of Personnel Evaluation in Education, 20(3/4), 165-184.
Tschannen-Moran, M., & Hoy, W. K. (2000). A multidisciplinary analysis of the nature, meaning, and measurement
of trust. Review of Educational Research, 70(4), 547-593.

Page 144
Academy of Educational Leadership Journal, Volume 15, Number 4, 2011
Walumbwa, F. O., Avolio, B. J., Gardner, W. L., Wernsing, T. S., & Peterson, S. J. (2008). Authentic leadership: Development and validation of a theory-based measure. Journal of Management, 34(1), 89-126.
Walumbwa, F. O., Wang, P., Wang, H., Schaubroeck, J., & Avolio, B. J. (2010). Psychological processes linking
authentic leadership to follower behaviors. The Leadership Quarterly, doi: 10.1016/j.leaqua.2010.07.015. Wynn, S., Carboni Wilson, L., & Patall, E. (2005). Beginning teachers’ perceptions of mentoring, climate and
leadership: Promoting retention through a learning communities perspective. Paper presented at the American Educational Research Association, San Francisco, CA.
Yammarino, F. J., & Atwater, L. E. (1997). Do managers see themselves as others see them? Implications of self-
other rating agreement for human resources management. Organizational Dynamics, 24(4), 35-44. Yammarino, F. J., Dionne, S. D., Schriesheim, C. A., & Dansereau, F. (2008). Authentic leadership and positive
organizational behavior: A meso, multi-level perspective. The Leadership Quarterly, 19(6), 696-707.
Appendix A. Authentic Leadership Questionnaire (Self) Instructions:
The following survey items refer to your leadership style, as you perceive it. Please judge how frequently
each statement fits your leadership style using the following scale:
0 1 2 3 4
Not at all Once in a while Sometimes Fairly often Frequently, if not always
As a leader I…
1. say exactly what I mean 0 1 2 3 4 2. admit mistakes when they are made 0 1 2 3 4 3. encourage everyone to speak their mind 0 1 2 3 4 4. tell you the hard truth 0 1 2 3 4 5. display emotions exactly in line with feelings 0 1 2 3 4 6. demonstrate beliefs that are consistent with actions 0 1 2 3 4 7. make decisions based on my core values 0 1 2 3 4 8. ask you to take positions that support your core values 0 1 2 3 4 9. make difficult decisions based on high standards of ethical conduct 0 1 2 3 4
10. solicit views that challenge my deeply held positions 0 1 2 3 4 11. analyze relevant data before coming to a decision 0 1 2 3 4 12. listen carefully to different points of view before coming to conclusions 0 1 2 3 4 13. seek feedback to improve interactions with others 0 1 2 3 4 14. accurately describe how others view my capabilities 0 1 2 3 4 15. know when it is time to reevaluate my position on important issues 0 1 2 3 4
16. show I understand how specific actions impact others 0 1 2 3 4

Page 145
Academy of Educational Leadership Journal, Volume 15, Number 4, 2011
Copyright © 2007 Authentic Leadership Questionnaire (ALQ) by Bruce J. Avolio, William L. Gardner, & Fred O. Walumbwa. All rights reserved in all medium. Distributed by Mind Garden, Inc. www.mindgarden.com.
Appendix A: Authentic Leadership Questionnaire (Teacher Form) Instructions:
The following survey items refer to your leader’s style, as you perceive it. Judge how frequently each
statement fits his or her leadership style using the following scale:
0 1 2 3 4
Not at all Once in a while Sometimes Fairly often Frequently, if not always
My leader…
Q8. says exactly what he or she means 0 1 2 3 4 Q9. admits mistakes when they are made 0 1 2 3 4 Q10. encourages everyone to speak their mind 0 1 2 3 4 Q11. tells you the hard truth 0 1 2 3 4 Q12. displays emotions exactly in line with feelings 0 1 2 3 4 Q13. demonstrates beliefs that are consistent with actions 0 1 2 3 4 Q14. makes decisions based on his or her core values 0 1 2 3 4 Q15. asks you to take positions that support your core values 0 1 2 3 4 Q16. makes difficult decisions based on high standards of ethical conduct 0 1 2 3 4 Q17. solicits views that challenge his or her deeply held positions 0 1 2 3 4 Q18. analyzes relevant data before coming to a decision 0 1 2 3 4 Q19. listens carefully to different points of view before coming to
conclusions 0 1 2 3 4
Q20. seeks feedback to improve interactions with others 0 1 2 3 4 Q21. accurately describes how others view his or her capabilities 0 1 2 3 4 Q22. knows when it is time to reevaluate his or her positions on important
issues 0 1 2 3 4
Q23. shows he or she understands how specific actions impact others 0 1 2 3 4 Copyright © 2007 Authentic Leadership Questionnaire (ALQ) by Bruce J. Avolio, William L. Gardner, & Fred O. Walumbwa. All rights reserved in all medium. Distributed by Mind Garden, Inc. www.mindgarden.com
Appendix B. Trust Survey Please judge how frequently each statement fits your level of trust in your leadership using the following scale:
0 1 2 3 4
Strongly disagree Disagree Neutral Agree Strongly agree
Q24. I feel that information can be shared openly within my school. 1 2 3 4 5 Q25. I think that processes within my school are fair. 1 2 3 4 5 Q26. I honestly express my opinion at my school with the knowledge that employee views are valued. 1 2 3 4 5
Q27. There is a widely held belief that my school is moving forward for the better. 1 2 3 4 5

Page 146
Academy of Educational Leadership Journal, Volume 15, Number 4, 2011
Q28. I feel that my principal keeps personal discussions confidential. 1 2 3 4 5
Q29. I think that my co-workers act reliably from one moment to the next. 1 2 3 4 5 Q30. I perform knowing that my organization will recognize my work. 1 2 3 4 5 Q31. I feel that my principal trusts his/her employees to work without excessive supervision. 1 2 3 4 5
Q32. I think that my school offers a supportive environment. 1 2 3 4 5 Q33. I have positive feelings about the future direction of my school. 1 2 3 4 5 Q34. Employees at my school generally feel that coworkers appreciate their quality performance. 1 2 3 4 5
Q35. I believe that my school recognizes and rewards employees' skills and abilities. 1 2 3 4 5 Q36. I feel that my principal listens to what I have to say. 1 2 3 4 5 Q37. Most employees at my school believe that co-workers will be supportive if problems arise. 1 2 3 4 5
Q38. I feel that my co-workers are truthful in their dealings with me. 1 2 3 4 5
Q39. I proceed on the basis that my principal will act in good faith. 1 2 3 4 5
Q40. I behave on the basis that my coworkers will not disclose personal information. 1 2 3 4 5
Q41. I think that my principal appreciates additional efforts I make. 1 2 3 4 5
Q42. I act on the basis that my school follows plans with action. 1 2 3 4 5 Q43. I feel confident that my coworkers appreciate my good work. 1 2 3 4 5
Q44. I act knowing that my principal will keep his/her word. 1 2 3 4 5 Q45. Most employees at my school believe that co-workers are reliable. 1 2 3 4 5 Q46. I believe that my principal follows words through with action. 1 2 3 4 5
Q47. I proceed with the knowledge that my co-workers are considerate of my interests. 1 2 3 4 5
Q48. I will act on the foundation that my co-workers display ethical behavior. 1 2 3 4 5
Q49. Employees commonly believe that they are treated fairly at my school. 1 2 3 4 5 Q50. I believe that my co-workers support me if I have problems. 1 2 3 4 5 Q51. I feel that my principal is available when needed. 1 2 3 4 5 Q52. I feel that I can trust my co-workers to do their jobs well. 1 2 3 4 5 Q53. I believe that my co-workers give me all the information to assist me at work. 1 2 3 4 5
Q54. It is generally accepted that my school takes care of employee interests. 1 2 3 4 5 Q55. I act on the basis that my principal displays integrity in his/her actions. 1 2 3 4 5

Page 147
Academy of Educational Leadership Journal, Volume 15, Number 4, 2011
Appendix C. Engagement Survey Instructions:
Please judge how frequently each statement fits your level of engagement at work using the following scale:
0 1 2 3 4
Strongly disagree Disagree No opinion Agree Strongly agree
57. Do you know what is expected of you at work? 1 2 3 4 5 58. Do you have the materials and equipment you need to do your work right? 1 2 3 4 5 59. At work, do you have the opportunity to do what you do best every day? 1 2 3 4 5 60. In the last seven days, have you received recognition or praise for doing good work? 1 2 3 4 5 61. Does your supervisor, or someone at work, seem to care about you as a person? 1 2 3 4 5 62. Is there someone at work who encourages your development? 1 2 3 4 5 63. At work, do your opinions seem to count? 1 2 3 4 5 64. Does the mission/purpose of your company make you feel your job is important? 1 2 3 4 5 65. Are your associates (fellow employees) committed to doing quality work? 1 2 3 4 5 66. Do you have a best friend at work? 1 2 3 4 5 67. In the last six months, has someone at work talked to you about your progress? 1 2 3 4 5 68. In the last year, have you had opportunities at work to learn and grow? 1 2 3 4 5

Page 148
Academy of Educational Leadership Journal, Volume 15, Number 4, 2011
Page 149
Academy of Educational Leadership Journal, Volume 15, Number 4, 2011
EVIDENCE ON INSTRUCTIONAL TECHNOLOGY AND STUDENT ENGAGEMENT IN AN AUDITING COURSE
Songtao Mo, Purdue University Calumet
ABSTRACT The introduction of the instructional technology initiates the shift of the focus of learning environment from instructors to students. The availability of the online learning tools provides the chance for instructors to enhance the student engagement in the learning process. This paper provides evidence on the impact of instructional technology on student engagement in the learning process, measured by student activities on Blackboard Vista in a face-to-face auditing course. Further analysis indicates that improved course interactions are associated with the introduction of the new function of instructional technology. In addition, the students with high motivations are more likely to have better performance in the auditing course. This paper contributes to existing literature and teaching practice. First, the research design captures the unique features of objective data with measurement of reality, which are rarely included in self-reported research methodology. Second, the study supports the view that the integration of instructional technology into face-to-face courses enhances student learning engagement and motivation, hence has the potential of improving student performance.
INTRODUCTION
Multiple platforms have made it possible to utilize web-based instructional tools to facilitate the interactions between faculty members and students between classes, and to enhance the student motivations and engagement in the learning process. The introduction of the instructional technology initiates the shift of the focus of the learning environment from instructors to students. While prior studies have examined the effect of student motivation and engagement on course performance (Vruwink & Otto, 1987; Elikai & Baker, 1988), little attention has been directed to this research question in the era of instructional technology. The purpose of this paper is to examine how instructional technology influences learner motivation and engagement, proxied by student activities on the Blackboard Vista course site. It is evident that a number of technological changes have irreversibly changed the landscape of the traditional classroom setting of higher education. Most previous research generally provides positive results regarding the influence of information technology. Prior studies in accounting education employ the research methodology of surveys and questionnaires, which are subject to the limitations of self selection and biased inference of the results. To fully

Page 150
Academy of Educational Leadership Journal, Volume 15, Number 4, 2011
address the research question, this paper utilizes research methodology using objective data. This paper employs student tracking statistics at Blackboard Vista and provides an analysis on the role of instructional technology in a face-to-face auditing course.
LITERATURE REVIEW AND HYPOTHESIS DEVELOPMENT The use of various instructional technologies in higher education has been on the rise at an accelerated pace. Despite the prominence of the impact of technology on the traditional classroom, limited evidence is available on the incremental contribution of these technologies to the in-class student learning environment. Previous research has focused on the influence of instructional technology on distance education, when face-to-face meetings are not required. While the quality assurance of online classes and the trade-off between quality and convenience are constantly called into question (e.g., Ryan, 2000), the merits of the use of instructional technology in college education should not be diminished. There has been constant debate on the effectiveness of the delivery of management courses in the format of distance education. Leidner and Jarvenpaa (1995) provide a theoretical view on the influence of information technology on management school education. They point out that advanced technology would facilitate the display and access of information, thus increase the process of “sharing and construction” of knowledge (Leidner & Jarvenpaa, 1995).The evaluation results of e-learning via WebCT by Halawi, McCarthy, & Pires (2009) also indicate that e-learning is an effective instructional tool for MIS courses. The study by De Lange et al. (2003) examines the student evaluations of Virtual Learning Environment (VLE) products in higher education in an attempt to determine whether such tools produce benefits with regards to student learning outcomes. Their survey concludes that accounting undergraduate students show a higher level of satisfaction after using such tools as lecture notes, bulletin boards, and online assessments. Their findings further indicate that overall student learning motivation and engagement is enhanced by the features generated from the implementation of instructional technology (De Lange, Suwardy, & Mavondo, 2003). Empirical research within accounting education is limited with regards to the effectiveness of technology applied to in-class courses. McVay et al. (2008) employ a survey instrument and find that classroom configuration and information technology have positive effects on student learning experience. Prior studies also find that most accounting students do not have difficulty in adapting to the learning environment aided by instructional technology (e.g., Basile & D’Aquila, 2002). Another stream of literature on accounting education focused on the association between student engagement and learning. The theory of learning developed by Norman (1981) suggests that pedagogical techniques with a feedback system are associated with improved learning outcomes (Norman, 1981). Vruwink and Otto (1987) report that accounting instructors have observed that homework assignments and quizzes assist in motivating students in the learning

Page 151
Academy of Educational Leadership Journal, Volume 15, Number 4, 2011
process. Based on this learning theory, Elikai and Baker (1988) provide empirical evidence that quizzes associated with rewards can be used to improve student performance. I develop hypothesis 1 as follows:
Hypothesis 1: The availability of instructional technology functions is associated with increased student engagement in the learning process.
In a learner-centered environment, Chang and Smith (2008) examine course-related interactions in the context of long distance education. Using data collected from a survey, they find that a high student satisfaction level is associated with all three interactions, namely student-instructor, student-student, and student-content interactions, in a computer science course (Chang & Smith, 2008). The research by Gagne and Shepherd (2001) also shows that primary communications between the instructor and the students are emails for both online and in-class students. I predict that the introduction of a new instructional tool would have an effect on course interactions.
Hypothesis 2: Increased usage of information technology is associated with increased course-related interactions.
Lammers, Kiesler, & Curren (2005) examine the impact of student effort on performance in college coursework. They find that students expect to study hard to obtain satisfactory grades. Consequently, it is expected that the students with higher grades are more likely to make the best out of the instructional technology available to them. On the other hand, students with low grades may be neutral in regards to exposure to enhanced instructional technology. I develop the following hypothesis:
Hypothesis 3: Increased student engagement is more likely to be associated with students with higher grades.
BACKGROUND
Auditing is a required course for students in the Bachelor of Science in Accounting at a regional campus of a public university. This course is also an elective course for students in Bachelor of Science in Management with a concentration in accounting. This campus was a commuter campus until August 2005, when student housing became available. The student body is a mixture of traditional students and non-traditional students, who work full time and attend college part time. To enroll in the Auditing course, students are required to have a grade of C or better in Intermediate Accounting II. Some students with extraordinary performance in Intermediate Accounting I may gain administrative permission to enroll in the course. Those students generally take Auditing and Intermediate Accounting II in the same semester.

Page 152
Academy of Educational Leadership Journal, Volume 15, Number 4, 2011
Table 1: Description of Chapters covered in the Auditing Course
Chapter 1: The Role of the Public Accountant in the American Economy Chapter 2: Professional Standards Chapter 3: Professional Ethics Chapter 4: Legal Liability of CPAs Chapter 5: Audit Evidence and Documentation Chapter 6: Audit Planning, Understanding the Client, Assessing Risks, and Responding Chapter 7: Internal Control Chapter 17: Auditors’ Reports Chapter 18: Integrated Audits of Public Companies
Source: Whittington, O. R. & K. Pany (2008). Principles of Auditing & Other Assurance Services (17th Edition). New York, NY: McGraw-Hill Irwin. This Auditing course aims at giving the student an understanding of the philosophy and environment of the auditing profession. The course highlights the nature and economic purpose of the auditing profession, auditing standards, professional conduct, legal liability, audit evidence, audit planning, internal control, and audit working papers. One section of the course was offered in spring 2009 and two sections were offered in fall 2009. All students who completed Auditing during the spring and fall semesters of 2009 are the subjects of the study. The same instructor taught all classes and collected the data. The students used the same textbook (Whittington & Pany), from which nine chapters were included in the lecture. The description of the chapters covered in the course is detailed in Table 1. Although different editions were used for the two semesters (the 16th edition was used for the spring semester and the 17th edition was used for the fall semester), the quizzes and exams were very similar except in regards to the delivery method. In spring 2009, the instructor used paper based quizzes to monitor student attendance and performance. The use of the course site on Blackboard Vista was limited to the functions of course material and email. The instructor posted course materials including chapter outlines, lecture slides, and solutions to the in-class exercises for students’ review. Blackboard emails remained the primary communication channel between the instructor and the students. The instructor sent a group email to the students after each class, summarizing the material covered and the plan for the next class. Group emails were also used to remind the students of important due dates or to clarify questions raised by the students. In addition to the above routine practices, the instructor introduced an application of instructional technology in fall 2009. Using this new application, the instructor prepared a self assessment quiz for each chapter, which could only be accessed on Blackboard Vista. Each self assessment quiz consisted of various numbers of objective questions. The students were allowed multiple attempts at taking the quizzes and they were also able to view the correct answers to the

Page 153
Academy of Educational Leadership Journal, Volume 15, Number 4, 2011
questions after each attempt. The students were not required, but were encouraged to take the online quizzes. In other words, the student usage of the online assessment tools was strictly voluntary and the student performance on the online quizzes was not counted towards the course grade. As a follow-up measure, the instructor prepared in-class quizzes, which incorporated some of the objective questions from self-assessment quizzes and one essay question from the lectures. Twelve quizzes were given throughout the semester, including nine quizzes on the chapters, two evaluation quizzes, and one take-home quiz. The four lowest grades were dropped at the end of the semester.
RESEARCH METHODOLOGY The study is based on the instructor’s experience of using an instructional tool on Blackboard Vista. The instructional tool was made available for the voluntary use of the students. Based on the comparison of student activities in two semesters with and without the utilization of the instructional tool, the paper examines changes of student activities and course-related interactions. The study also investigates the association between student activities on Blackboard Vista and grades. The data on student activity were collected from the tracking feature at Blackboard Vista. Table 2 presents the variable definitions provided by the Blackboard Vista administration. The dataset also contains student performance data from the Blackboard grade book. Table 3 presents the descriptive statistics for student activities on Blackboard Vista. As illustrated, there were 31 subjects and 44 subjects in the spring and fall semesters, respectively. The statistics for variables related to the assessment tool (assessment began, assessment finished, and time for assessment) are only available for fall 2009. The normality tests of the variables (skewness and kurtoisis) show that the variables are not normally distributed.
Table 2: Blackboard Vista Variable Definitions Variable Variable Definition Session Times of each access to the course section. Time Total time spent throughout the semester. Assessment_began Total number of assessments started. Assessment_finished Total number of assessments finished. Assessment time Total time spent on assessments. Mail read Total times of reading email messages received. Mail sent Total times of sending email messages. Content Viewed Total times of viewing the content folders. Files Viewed Total times of viewing the files.
The definitions of blackboard variables are adopted from the definition menu provided by the Instructional Technology Office at Purdue University Calumet.

Page 154
Academy of Educational Leadership Journal, Volume 15, Number 4, 2011
The Kruskal-Wallis test is a nonparametric test and this test is normally used when the assumption of normal distribution is violated. As discussed previously, the variables included in the dataset are not normally distributed, thus the Kruskal-Wallis test is appropriate. The null hypothesis of the test assumes that the groups are from identical populations. Rejection of the null hypothesis indicates that the variables are not statistically similar in the groups. The tables of mean comparison are prepared using statistics derived from the Kruskal-Wallis tests. The tables also illustrate the mean ranks for each variable, and the corresponding Chi Square of the mean comparison across the groups.
Table 4: Kruskal-Wallis Test - Comparison between Spring and Fall Semesters Spring Fall Chi-Square ( N=31) (N=44) Sessions 28 45 11.67** time_session ( in seconds) 25.94 46.50 16.19** Mail (read) 21.63 49.53 29.83** Mail (sent) 31.00 42.19 4.89** Content Folders viewed 27.60 45.33 12.04** Files Viewed 32.74 41.70 3.08* ** Significant at p<0.05; * Significant at p< 0.1
N Mean Std. DeviationStatistic Statistic Statistic Statistic Std. Error Statistic Std. Error
Spring Sessions 31 74.32 35.34 2.27 0.42 6.99 0.82
2009 time_sessions (in second) 31 41395.06 51335.45 2.63 0.42 6.78 0.82
Mail Read 31 54.35 28.11 2.77 0.42 10.17 0.82
Mail Sent 31 8.26 6.99 1.74 0.42 3.66 0.82
Content Folders 31 136.00 65.11 1.00 0.42 0.70 0.82
Files 31 59.68 29.37 0.79 0.42 -0.14 0.82
Fall Sessions 44 102.75 39.14 0.27 0.36 -0.01 0.70
2009 time_sessions ( in second) 44 61999.18 40447.97 2.44 0.36 8.33 0.70
Mail (read) 44 111.00 60.63 2.50 0.36 11.28 0.70
Mail (send) 43 13.26 9.67 0.71 0.36 -0.10 0.71
Assessments began 44 31.41 21.74 1.70 0.36 2.45 0.70
Assessment Finished 44 30.89 21.77 1.71 0.36 2.48 0.70
time_ assessment ( in second) 44 89437.41 105954.53 2.17 0.36 4.77 0.70
Content Folders 44 212.02 105.09 1.02 0.36 1.45 0.70
Files 44 83.57 60.60 2.19 0.36 6.58 0.70
Skewness Kurtosis
Table 3: Descriptive Statistics

Page 155
Academy of Educational Leadership Journal, Volume 15, Number 4, 2011
Table 5: Kruskal-Wallis Test - Comparison of two Semesters by Category
Letter Grade Spring Fall Chi-Square A ( N=17) (N=12) Sessions 12.12 19.08 4.71** time_session ( in seconds) 11.53 19.92 6.83** Mail (read) 9.91 22.21 14.68** Mail (send) 14.38 15.88 0.22 Content Folders viewed 11.12 20.50 8.54** Files Viewed 11.94 19.33 5.31** B ( N=12) (N=22) Sessions 10.88 21.11 8.21** time_session ( in seconds) 10.00 21.59 10.52** Mail (read) 8.83 22.23 14.06** Mail (send) 13.79 19.52 2.58 Content Folders viewed 11.17 20.95 7.501** Files Viewed 15.00 18.86 1.17 C ( N=2) (N=10) Sessions 6.50 6.50 0.00 time_session ( in seconds) 4.00 7.00 1.15 Mail (read) 4.00 7.00 1.16 Mail (send) 4.50 6.33 0.50 Content Folders viewed 7.50 6.30 0.19 Files Viewed 5.50 6.70 0.19 A and B (N=29) (N=34) Sessions 22.17 40.37 15.45** time_session ( in seconds) 21.66 40.82 17.12** Mail (read) 17.91 40.82 31.75** Mail (send) 26.57 36.67 4.74** Content Folders viewed 22.34 40.24 14.91** Files Viewed 26.66 35.56 4.57** ** Significant at p<0.05; * Significant at p< 0.1
The hypotheses are tested by comparing the means of the various groups. In testing Hypothesis 1 on the association between usage and the availability of additional technical application, I perform a mean comparison between the spring and fall semesters. Table 4 shows that variables of the number of sessions, the time spent on the sessions, content folders viewed, and files viewed are significantly different across the two semesters. Further examination of the descriptive statistics of Table 3 reveals that the means of the above variables of the fall semester exceed those of the spring semester. Empirical results support Hypothesis 1, illustrating that increased student activities are associated with the availability of the new function on Blackboard.

Page 156
Academy of Educational Leadership Journal, Volume 15, Number 4, 2011
Similarly, Table 4 indicates that the interactions within the course are also different in the two semesters. Consequently, Hypothesis 2 holds because the means of the variables “number of mail read” and “number of mail sent” in fall 2009 (mean of number of mail read = 111; mean of number of mail sent = 13.26) have increased from those of spring 2009 (mean of number of mail read = 54.35; mean of number of mail sent = 8.26). The results suggest that improvement in the interactions is related to the introduction of the online assessment tool. The study also examines the relationship between enhanced instructional technology and student grades. As indicated in Table 5, students with grades A and B have different levels of activity across the two semesters. Students with a grade of C are similar in all activities on Blackboard. It is suggested that the existence of the online assessment instrument does not change the behavior of the students with a grade of C. On the other hand, the students with grades A and B are motivated to participate in the voluntary-based online assessment activities. The empirical results support Hypothesis 3, indicating that increased usage of information technology is more likely to be associated with students with higher grades.
DISCUSSION This study investigates the effect of instructional technology on student activities on Blackboard. The empirical results show that, first and foremost, the application of instructional technology is a prominent factor associated with increased student engagement in the learning process. The results also indicate that the enhanced interactions are also associated with the new function of instructional technology. The findings provide insight on how instructional technology impacts the students in various grade categories. Relative to the students with a grade of C, students with grades A and B are more likely to use the instructional tools efficiently and effectively. Interestingly, when comparing students with grades A and B separately, the student interaction in terms of “mail sent” remains statistically similar in the two semesters (Table 5). I also perform the Kruskal-Wallis test on separate datasets to examine the differences between various grades in the two semesters. The results show that the student activities are insignificantly different across the grade categories in spring 2009 (untabulated). Instead, Table 6 reveals that in fall 2009, the students in different grade categories can be differentiated by major. As illustrated, the variable time of sessions is significantly different across the grade categories. It is implied that the better performers did not necessarily log in the course site more, but they spent more time to gather information they needed. Also, the better performers tended to have more assessment sessions but completed each session more quickly. The analysis indicates that better performance is associated with students who are willing to take advantage of advances in instructional technology to improve their grades. The relationship between the improved student performance and student engagement sheds light on the practice to motivate the students to be involved in the learning process. While face-to-face

Page 157
Academy of Educational Leadership Journal, Volume 15, Number 4, 2011
courses are traditionally designed to be instructor-centered in the classroom, the development in instructional technology provides opportunities for students to be an active component in achieving their own learning objectives.
Table 6: Kruskal-Wallis Test - Comparison of Categories of Fall 2009
C B A Chi-Square (N=10) (N=22) (N=12) Sessions 15 25 23 4.43 time_session ( in seconds) 12.70 23.91 28.08 8.35** Mail (read) 20.00 26.25 17.71 3.93 Mail (send) 23.17 24.16 17.17 2.518 Assessment began 17.00 20.70 30.38 6.78** Assessment Finished 17.00 20.61 30.54 7.02** time_assessment( in seconds) 18.40 22.14 26.58 2.25 Content Folders viewed 14.70 24.14 26.00 4.95* Files Viewed 15.65 22.39 28.42 5.40* ** Significant at p<0.05; * Significant at p< 0.1
SUMMARY Developments in instructional technology provide new opportunities for improving teaching and learning in accounting and auditing courses. Web-based instructional tools give students more opportunities to interact with instructors and to engage and motivate themselves in the learning process. Similar to other education papers, the application of the results to other learning environments should be exercised with caution. This paper nevertheless provides a starting point to investigate how instructors may effectively integrate instructional technology into conventional classroom courses. The incorporation of web-based instructional tools in teaching accounting and auditing courses will continue to grow. The continuing challenge to instructors will be learning how to use technology, together with other teaching strategies, to further motivate and engage students in the learning process. This paper contributes to existing literature and teaching practice. First, the research design captures the unique features of objective data with measurement of reality, which are rarely included in self-reported research methodology. Second, the study supports the view that the integration of instructional technology into face-to-face courses enhances the student learning engagement and motivation, hence has the potential of improving student performance.

Page 158
Academy of Educational Leadership Journal, Volume 15, Number 4, 2011
REFERENCES Basile, A. & J. M. D’Aquila (2002). An Experimental Analysis of Computer-Mediated Instruction and Student
Attitude in a Principles of Financial Accounting Course. Journal of Education for Business, 77 (3), 137-143.
De Lange, P., T. Suwardy & F. Mavondo (2003). Integrating a Virtual Learning Environment into an Introductory
Accounting Course: Determinants of Student Motivation. Accounting Education, 12 (1), 1-14. Chang, S. H. & R. A. Smith (2008). Effectiveness of Personal Interaction in a Learner-Centered Paradigm Distance
Education Class Based on Student Satisfaction. Journal of Research on Technology in Education, 40 (4), 407-426.
Elikai, F. & J. Baker (1988). Empirical Evidence on the Effectiveness of Quizzes as a Motivational Technique.
Issues in Accounting Education, 3(2), 248-254. Gagne, M. & Shepherd, M (2001). A Comparison Between a Distance and a Traditional Graduate Accounting Class.
Transforming Education Through Technology Journal, April, 58-64. Halawi, L., R. V. McCarthy & S. Pires (2009). An Evaluation of E-Learning on the Basis of Bloom’s Taxonomy:
An Explanatory Study. Journal of Education for Business, July/ August, 374-380. Lammers, H. B., T. Kiesler, M. T. Curren, D. Cours & B. Connett (2005). How Hard Do I Have to Work? Student
and Faculty Expectations Regarding University Work. Journal of Education for Business, March/April, 210-213.
Leidner, D. & S. L. Jarvenpaa (1995). The Use of Information Technology to Enhance Management School
Education: A Theoretical View. MIS Quarterly, September, 265- 291. McVay, G. J., P. R. Murphy & S. W. Yoon (2008). Good Practices in Accounting Education: Classroom
Configuration and Technological Tools for Enhancing the Learning Environment. Accounting Education: an international journal, 17 (1), 41-63.
Norman, D. A. (1981). What is Cognitive Science? In D. A. Norman (Ed.), Perspectives on Cognitive Science (p.
40-50), Ablex Publishing Co.. Palocsay, S. W. & S. P. Stevens (2008). A Study of the Effectiveness of Web-Based Homework in Teaching
Undergraduate Business Statistics. Decision Sciences Journal of Innovative Education, 6 (2), 213- 232. Ryan, R. (2000). Student Assessment Comparison of Lecture and Online Construction Equipment and Methods
Classes. Transforming Education Through Technology Journal, 27 (6), 78-83. Vruwink, D. R. & J. R. Otto (1987). Evaluation of Teaching Techniques for Introductory Accounting Courses. The
Accounting Review, LXII (2), 402-408.