acams - integrated software for accelerator alignment and
TRANSCRIPT

ACAMS – INTEGRATED SOFTWARE FOR ACCELERATOR
ALIGNMENT AND MEASUREMENT∗
K.J. Tremblay, K.S. Baggett and C. J. Curtis
Thomas Jefferson National Accelerator Facility
12000 Jefferson Avenue
Newport News, Virginia, USA
1. INTRODUCTION
ACAMS (Accelerator Combined Alignment and Measurement System) is a software package
that has been developed at Thomas Jefferson National Accelerator Facility (Jefferson Lab).
ACAMS was developed to replace four MS-Dos based software programs. These programs
operated independently and commonly used theodolite observations as the basis for data
collection. The methodology used to collect the data had similarities, but there were
inconsistencies and shortcomings in these various processes.
ACAMS integrates all the reductions, adjustment and reporting into one package. Jefferson
Lab Alignment Group now relies on ACAMS for most of the field surveys undertaken. Many
new features that were lacking in the older packages have been included in the development of
ACAMS. This paper will discuss the reasoning behind the development, currently available
features, and the future direction that the software will take.
2. JUSTIFYING DEVELOPMENT
2.1 Commercial vs. In-House Development Packages
Prior to the development of ACAMS, the alignment group at Jefferson Lab evaluated two
commercially available software packages. Both commercial packages are very complete, with a
long list of features available to the end user. However, both packages appeared to be designed
towards certain specific applications in the industrial measurement community, rather than fitting
the requirements that were desired at our facility. There are distinct advantages for using an off
the shelf package but as this software is crucial to the operation of our group, the decision was
made to develop a custom package. Some of the main arguments for and against this decision are
outlined below.
One of the main issues addressed when evaluating commercial versus in-house software was
the control of the database. Both of the evaluated packages were locked into a proprietary
database, which limited the ability to manipulate the data during post processing. Items such as
text point names have historically been part of our database, and we wished to continue with this
capability.
A second issue was the degree of customization. Again, both packages had some level of
customization, but the degree of customization which was required was very high and neither
∗ This work was supported by the United States Department Of Energy under contract number DE-AC05-84ER40150.

package addressed customization to the desired level. Our field crews continually contribute
valid suggestions which help guide the development direction of the software. Having the ability
to control changes and add features was one of the most important factors in the decision to
proceed with in-house development.
The cost of development and debugging were a disadvantage to be considered. Overall the
first debugged copy, suitable for field work, took approximately six months or a half man year to
deliver. There is also the maintenance costs of the software to consider. There are approximately
thirty thousand lines of C++ code to maintain, plus several older FORTRAN routines that have
been modified and turned into 32 bit windows DLLs.
Theodolites are used for approximately seventy percent of the field alignment tasks at
Jefferson Lab. Optical tooling and a portable coordinate measuring machine (CMM) are used for
most of the remaining tasks. There is an effort to decrease the use of optical tooling since there is
minimal redundancy of observations. With such emphasis on the use of theodolites, our group
felt that our software should maximize the effectiveness of our lab-specific tasks. These tasks
included stand and magnet alignment, alignment of various spectrometers, fiducialization of
components and other tasks typically carried out by intersecting theodolites.
3. SOFTWARE FEATURES AND DETAILS
3.1 Hardware Requirements and Interface
The requirements for the field version of the software are either a laptop or regular desktop
computer, with access to a compact flash (CF) reader and an expanded serial card, or 2 PCMCIA
cards. Most laptops allow for 2 PCMCIA cards. One of the cards is for a multi-port serial card
(National Instruments part NI PCMCIA 232/4, Socket part SL0751-161 or similar). Each
instrument to be connected, must have a serial port available on the computer. The second card is
for a CF card adaptor. The CF card is automatically read when the program initializes and all
files on the laptop are updated. By using this technique, all files on all the various computers are
kept up to date. The office version of the software does not check for a CF card, but all
initialization files and software version operations are handled from a lab network server.
ACAMS has been tested on various laptops. The standard operating system is Windows
2000, but it has been used with Windows 98, Windows NT 4.0 and Windows XP, with no
apparent problems. The slowest processor speed that the software has been tested on is an Intel
Celeron 300. The software has not shown any adverse effects utilizing the latest Pentium 4
processors available. The minimum ram that has been used with a Windows 98 system is 64
megabytes.
The lab has also developed a new multiplexer interface box that powers the theodolites, and
handles communications between the computer and theodolites. The cost of these multiplexer
boxes is significantly less than the units required for the commercial packages.
3.2 Survey Selection / Project Details
As stated earlier, ACAMS has been developed to integrate all the various types of theodolite
survey packages that existed at Jefferson Lab. After the program initializes, the user is asked to
select a method, type of survey, or continue an existing project. The main options are to conduct

either stand alignment (rough alignment of stands / bolts etc. Step 1), Step 2 alignment
(alignment of machine elements), fiducialization of elements and finally, spectrometer
positioning. Other options are available to the user, such as re-starting existing job, copying and
using control from an existing job, and resuming the last job.
After the crew has selected the task type the target and control information is generated by
following prompts. For example, in the stand alignment option, users are prompted for a nearby
control monument. This one monument is used as the basis for a search of nearby stands and
other control which are displayed in checklists. Users can chose to either reject or include data in
the project. By carrying out these tasks in a specific manner, errors are reduced.
3.3 Common Interface
Upon completion of the job information section, the users are presented with the common
interface (Fig. 1). There are a group of commands on the top taskbar that take the user to various
options. Two of these options are for moving to the data collection screen. Using the ‘New
Position’ option, allows the users to start a new theodolite position, while ‘Resume Position’,
allows the users to resume theodolite setups (see section 3.5). The upper task bar also contains
the Adjustment options (see section 3.4), Observation Tabulator (section 3.5), Spectrometer
Options (section 3.6) and the Transfer File option.
Fig. 1 Common Interface
The default screen displays the control points. Control point z, x and y coordinates are
displayed along with their associated weight. Weights may be adjusted by clicking on the
appropriate cell, and are then updated for use in further adjustments.
At the bottom of the common interface screen are tabs which take you to six associated
commands. Figure 2, shows an example of the report generated based on a project’s results.
Figure 3, shows a sample of the raw data that has been captured. There are a second group of
tabs in the Raw Data screen which allow the users to page through to the respective theodolite
data. Other options available from the lower task bar include screens for the target data and the
adjusted theodolite coordinates.
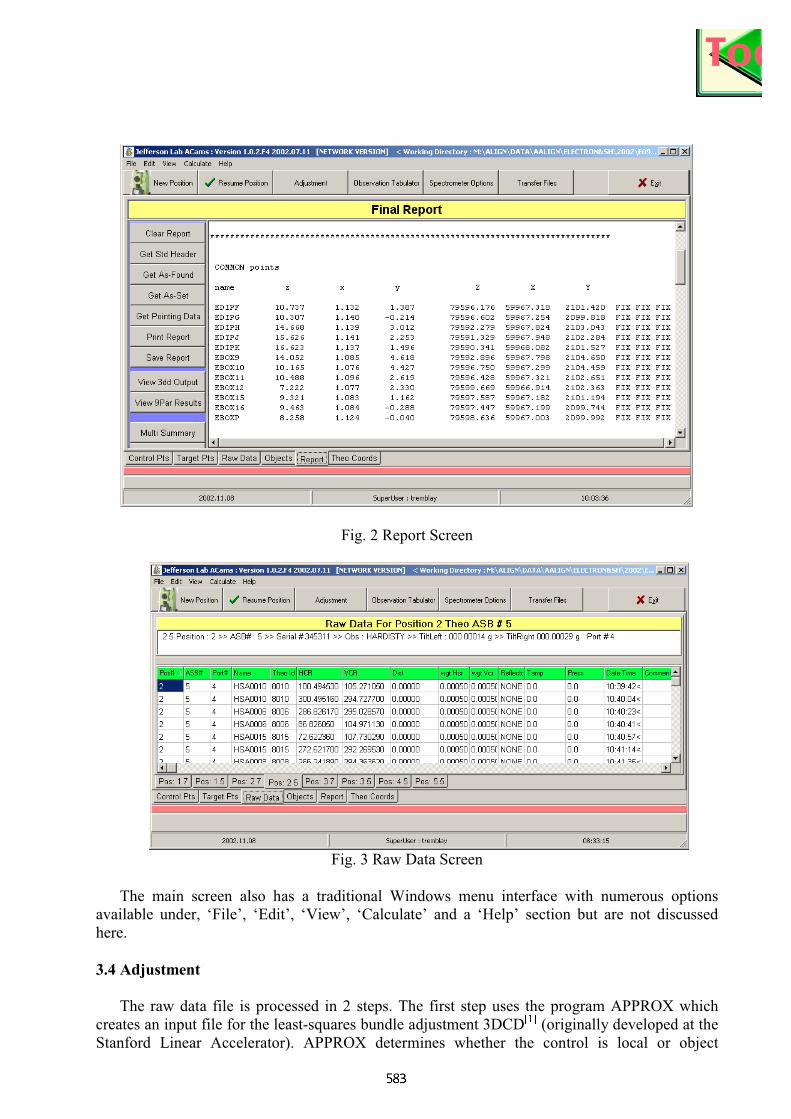
Fig. 2 Report Screen
Fig. 3 Raw Data Screen
The main screen also has a traditional Windows menu interface with numerous options
available under, ‘File’, ‘Edit’, ‘View’, ‘Calculate’ and a ‘Help’ section but are not discussed
here.
3.4 Adjustment
The raw data file is processed in 2 steps. The first step uses the program APPROX which
creates an input file for the least-squares bundle adjustment 3DCD[1]
(originally developed at the
Stanford Linear Accelerator). APPROX determines whether the control is local or object

oriented. There is no need for orientation of the theodolites, as APPROX will create an iterative
solution to arrive at a theodolite position. 3DCD has been modified at the lab and now runs as a
background Windows DLL, with the results generated and displayed as shown in figure 4. Other
options available through this screen allow you to view the complete adjustment results, weight
the observations (figure 5), and control points and allowances for a gravity / non-gravity
adjustment.
Fig. 4 Adjustment Results Screen
Fig. 5 Weighting Schemes Fig. 6 Observation Tabulator

3.5 Observation Tabulator
The observation tabulator (fig 6) allows the user to see which targets or control points have
been observed at the various theodolite stations. It displays whether a point has been observed
with both faces (displays a �), single face (½), or not at all (shows a X) for each station. This
allows the users to ensure that the proper number of observations have been recorded for each
target or control point.
3.6 Data Collection
From the main menu, once ‘New Position’ or ‘Resume Position’ are selected, the program
passes into data collection mode. Theodolites, attached via a serial port, are automatically sensed
and polled. In theory, up to nine theodolites could be attached at one time, although the
maximum tested to date has been five. Figure 7 shows the data capture screen, which displays
the target name, plus the theodolite ID number on the left pane; the observations are displayed on
the right pane. The theodolite ID number or target ID is defined as the numeric value that the
theodolite sends for each observation. Each theodolite operator may observe any point in any
sequence. Additionally the operators can shoot forward and reverse face observations in any
order. If theodolite positions have been established by shooting the control points first,
‘AutoPoint’ can be invoked to determine which point is being observed without the operator
having to enter in any point ID number at the theodolite. Another feature available is that all
observations are kept in the data file, but any point can be re-observed, with the latest points
being used for calculations. The earlier observed data can also be used in calculations so that it
can show a final difference between as-found targets, and as-set targets in the report.
As shown in the capture data screen, points that have both a forward and reverse observation
are updated by highlighting the cells displaying the target name in green. If an observation is out
of tolerance the cells displaying the angles are highlighted in red. This color coding gives the
operators an immediate warning of any problems. If a point ID is sent from the theodolite to the
computer, and there is no matching angle or matching ID number, the point is flagged but does
not cause the operation to come to a halt. The crews review the data before moving the
theodolites to a new position, and determine if the point was erroneous or if it was a new point to
be added.
Another feature available from the top tool bar is the ‘Show Movements’ option. This option
allows the users to see how far a surveyed object is from its design or ideal location (figure 8).
Also available are standard windows drop down menus that include fitting routines,
calculation options, real time positioning (RTP) options and a short cut to the observation
tabulator.
Distances can be observed in the data capture routine. There is a facility for selecting
particular prisms, as well as recording atmospheric conditions. The data can also be reduced
directly from ACAMS and incorporated into the adjustment routine.

Figure 7 Capture Data Screen
Figure 8 Display Movements Screen
3.7 RTP Routine
One of the main features available in ACAMS is the Real Time Positioning (RTP) routine.
This routine is used to position any object into its desired alignment. The procedure requires the
crew to observe the control points, the components to be aligned, and obtain an adjustment from
3DCD. They can then use the ‘RTP Toggle’ option on the main data capture toolbar. This takes
the program to a new screen (figure 9) where the theodolites are polled at set time intervals or the

instrument operators take manual observations, to align a component to any given set of design
coordinates.
As the instrument operators take observations, the coordinates are automatically updated,
using a least squares solution. A value, based upon the original forward and reverse observations
taken to the targets, is used to correct single face observations taken in RTP. The input file to
3DCD is updated with the corrected angles, and after the adjustment, the differences between
design and the presently located target are calculated. The differences are then displayed (fig 9),
and the crew can make the necessary adjustments to the object, and iterate to an acceptable
position. After adjusting all the required elements by using the RTP routine, the crews will lock-
down the elements and conduct a final survey using forward and reverse observations. An
additional feature currently being added, is the tie to our fiducial database and calculating the
reverse least squares transformation to find the component center.
Figure 9 RTP Screen
3.8 Spectrometer Alignment
Jefferson Lab’s Hall A contains two high resolution spectrometers and Hall C has a High
Momentum (HMS) and a Short Orbit (SOS) spectrometer. All four spectrometers rotate about a
central target. The alignment group is frequently called upon to determine the angle between the
incoming beam and the centerline of the spectrometers. ACAMS is used to survey the
spectrometer with respect to the local monuments. After a satisfactory adjustment with 3DCD,
the results are processed using transformation software to determine the central axis of the
spectrometers with respect to the beam. ACAMS automates this process resulting in smooth flow
of information.

3.9 Reporting
Final reports can be auto-generated based on specific job related tasks or there is a facility for
building a custom report. These reports are useful summaries, as well as providing a means for
our group to track the history of various projects.
4. FUTURE ENHANCEMENTS
One of the main reasons for developing ACAMS was to allow our group to customize the
software as circumstances dictated. To this end, some of the planned enhancements are outlined.
4.1 Enhanced Coordinate System Manipulation and Shape Fitting Routines
Currently ACAMS uses SLAC’s geometric fitting routines in WINFIT[2]
that were developed
in the early 1990’s. It is envisioned that, as time allows, our software group will develop our own
set of shape fitting routines and at the same time integrate the use of alternate coordinate systems
which will allow the field crews greater flexibility while undertaking various surveys.
4.2 Integration with Portable CMM
Traditionally, the target surveys have been performed with theodolites, but as the
experiments have become more complex, lines of sight have disappeared, which has
necessitated the greater reliance on the portable CMM. The group’s portable CMM has
successfully been used for target alignment in experimental Halls A and C. Many of these
operations have required that local control first be established with the use of theodolites. It is
our goal to integrate the portable CMM into ACAMS, and have all the data for the project be
collected using one set of data collecting tools. Preliminary work has been undertaken, with
communications being worked out and the calculation of coordinates from the portable CMM
being successfully achieved. Further work is required to make this addition a smooth operation.
4.3 Wireless Data Updates
Many areas of Jefferson Lab are now equipped to accept wireless network connections.
Occasionally, there is a need to update information required for immediate use in the field. This
now requires a return trip to the office to receive an updated CF card. Tapping into the
capabilities of the wireless network is a possibility which may alleviate this situation.
4.4 Additional Theodolite Integration
ACAMS was designed to be as modular as possible. As updated theodolite equipment
becomes available, we will endeavor to integrate it into the software.
4.5 Integration with Laser Tracker
At some stage, it is envisioned that the lab will obtain a laser tracker. It is hoped that prior to
our obtaining a tracker, we will be able to obtain a unit temporarily, in order to work out the
communication parameters, and integrate it into our data collection routines. As with other labs,
the tracker will probably become one of our more heavily used tools, and an evaluation will be
undertaken whether to use the supplied software or integrate it into ACAMS.

5. CONCLUSION
With an investment of approximately a half man-year of coding, ACAMS has combined
several disjointed field operations and procedures into a tightly integrated operation. Additions
have been made to the software, which have provided several new and valuable tools to the
users. The crews have commented on the software’s ease of use, the ability to rapidly align
components, and conduct other essential alignment tasks.
ACAMS was developed in order to integrate Jefferson Lab’s existing theodolite based
alignment software into one package. ACAMS is now the main tool used by the Alignment
Group. The software has given Jefferson Lab a tool that fits it’s requirements, and traditional
alignment operations while also allowing the group to have the flexibility and control over its
development as circumstances dictate.
Future development that includes integration of updated and new equipment, and the ability to
customize the software to specific tasks should make ACAMS a tool that will be used at the lab
for many years.
6. ACKNOWLEDGMENTS
We would like to thank and recognize the alignment group at the Stanford Linear
Accelerator for supplying the original code for the bundling program 3DCD, and a particular
thanks to Catherine LeCocq for the use of the WINFIT program. A special thanks also goes out
to all the field staff at the lab for their patience, suggestions and verification of all the processes
developed for ACAMS.
7. REFERENCES
[1] 3DCD, Software Authors; J.M.Gaunt, C.LeCocq, B.Crittenden, Stanford Linear Accelerator Center, 2575 Sand
Hill Road, Menlo Park, CA 94025 1991.
[2] WINFIT, Software Author; C.LeCocq, Stanford Linear Accelerator Center, 2575 Sand Hill Road, Menlo Park,CA 94025 1991.