acc615104 managerial accounting project report
TRANSCRIPT

IS 615-104 – MANAGERIAL ACCOUNTING
Financial Accounting Project
Date: 3rd
May 2014
Participants
Tejas Agarwal (#2)
Nancy Gupta (#8)
Karan Weller (#36)
Kanchi Patel (#44)
2 | P a g e
Table of Contents
1 Introduction……………………………………………………………………..3
1.1 American Airlines………………………………………………………….3
1.1.1 Company Profile………………………………………………...........3
1.1.2 Stock Info……………………………………………………………..4
1.2 Delta Airlines………………………………………………………………4
1.2.1 Company Profile……………………………………………………...4
1.2.2 Stock Info……………………………………………………………..5
2 Vertical Analysis………………………………………………………………..6
2.1 Income Statement Comparison…………………………………………….6
2.2 Balance Sheet Comparison…………………………………………………7
3 Horizontal Analysis……………………………………………………………..8
3.1 Income Statement Comparison…………………………………………….9
3.2 Balance Sheet Comparison………………………………………………..10
4 Ratio Analysis…………………………………………………………………10
4.1 Liquidity Ratio……………………………………………………………10
4.2 Profitability Ratio…………………………………………………………11
4.3 Solvency Ratio……………………………………………………………13
5 Bibliography…………………………………………………………………...15

3 | P a g e
1. Introduction
1.1 American Airlines Group Inc.
1.1.1 Company Profile:
AMR knows America's spacious skies -- and lots of others. Its main subsidiary is American
Airlines, one of the largest airlines in the world. Together with sister company American Eagle
and a regional carrier that operates as AmericanConnection under contract, American Airlines
serves more than 339 destinations in 50+ countries in the Americas, Europe, and Asia/Pacific.
The overall fleet exceeds 880 aircraft; American Airlines operates about 600 jets. The carrier
extends its geographic reach through code-sharing arrangements and is part of the oneworld
Alliance, along with British Airways, Cathay Pacific, Iberia, Qantas, and others. The company
grew even bigger by merging with US Airways in late 2013.
1.1.2 Stock Info:
American Airlines Group Inc. (AAL)
37.22 0.55(1.50%) After Hours : 37.20 0.02 (0.05%) Prev Close: 36.67
Open: 36.58
Bid: 37.11 x 1000
Ask: 37.22 x 4900
1y Target Est: 46.31
Beta: 3.85
Earnings Date: Jul 14 - Jul 18
(Est.)
Day's Range: 36.31 - 37.31
52wk Range: 15.28 - 39.88
Volume: 7,800,951
Avg Vol (3m): 10,036,800
Market Cap: 26.81B
P/E (ttm): N/A
EPS (ttm): -3.60
Div & Yield: N/A (N/A)

4 | P a g e
1.2 Delta Airlines, Inc.
1.2.1 Company Profile:
Just as a delta is a symbol for change in math, Delta Air Lines symbolizes the changing
mathematics of the airline industry. Delta became one of the world's largest airlines by traffic
after its $2.8 billion acquisition of Northwest Airlines in 2008. Through its regional carriers
(including subsidiary Comair), the company serves about 320 destinations in more than 60
countries, and it operates a mainline fleet of 700-plus aircraft, as well as maintenance, repair, and
overhaul (MRO) and cargo operations. Delta is a founding member of the SkyTeam marketing
and code-sharing alliance (airlines extend their networks by selling tickets on one another's
flights), which includes carriers Air France, KLM, and Alitalia.

5 | P a g e
1.2.2 Stock Info:
Delta Air Lines Inc. (DAL)
38.24 0.61(1.62%) After Hours : 38.19 0.05 (0.13%) Prev Close: 37.63
Open: 37.80
Bid: 37.82 x 100
Ask: 38.30 x 900
1y Target Est: 45.47
Beta: 0.98
Earnings Date: Jul 21 - Jul 25
(Est.)
Day's Range: 37.31 - 38.26
52wk Range: 16.94 - 38.82
Volume: 10,518,652
Avg Vol (3m): 11,903,200
Market Cap: 32.27B
P/E (ttm): 3.05
EPS (ttm): 12.54
Div & Yield: 0.24 (0.60%)

6 | P a g e
2. Vertical Analysis
Vertical analysis, also called common-size analysis, is a technique that expresses each financial
statement item as a percentage of a base amount. It helps in comparing the performance and
financial position of two businesses of different size. American Airlines (NYSE: AAMRQ) and
Delta Airlines (NYSE: DAL) draw frequent comparisons, as two are most major U.S. airlines.
Both airlines operate an extensive international and domestic network around the globe.
2.1 - Income Statement Comparison
Currency in Millions of US
Dollars
American Airlines Delta Airlines
Dec-12 Dec-13 Dec-12 Dec-13
Restated Restated
Dollars % Dollars % Difference
in % Dollars % Dollars % Difference
in %
TOTAL
REVENUES 24855 100 26743 100 36670 100 37773 100
COST OF GOODS
SOLD 19744 79.44 19805 74.06 -5.38 29323 79.96 29466 78.01 -1.96
GROSS PROFIT 5111 20.56 6938 25.94 5.38 7347 20.04 8307 21.99 1.96
OTHER
OPERATING
EXPENSES,
TOTAL
4577 18.41 4980 18.62 0.21 4747 12.95 4781 12.66 -0.29
NET INTEREST
EXPENSE -606 -2.44 -836 -3.13 -0.69 -1005 -2.74 -852 -2.26 0.49
NET INCOME -1876 -7.55 -1834 -6.86 0.69 1009 2.75 10540 27.90 25.15
Delta Airlines total revenue, as per Dec-13 is US$37 billion, which in comparison to American
Airlines is approximately US$10 billion more. Although both airlines recorded a percentage
decrease in cost of goods sold with respect to income statement but there was a steady increase
in gross profit margin when comparing the percentage difference for year 2012-2013.
Comparing the other operating expenses of both the airlines there was an increase of 0.21% seen
in American Airlines whereas Delta Airlines recorded a percentage decline of 0.29% in the
operating expense on the other hand the Net Interest Expense was completely vice-versa
comparing to the other operating expense where American Airlines recorded a percentage

7 | P a g e
decline of 0.69% and Delta Airlines recorded percentage increase of 0.49% in the Net Interest
Expense.
Looking at the Net income of both Airlines, even though there was a percentage decline in
American Airlines Net income they tried to reduce the decline by 0.69% whereas there is a
positive growth in Net income of Delta Airlines, which increased to 25.15% from 2012 to 2013.
2.2 - Balance Sheet Comparison
Currency in
Millions of US
Dollars
American Airlines Delta Airlines
Dec-12 Dec-13 Dec-12 Dec-13
Amount % Amount % Difference Amount % Amount % Difference
Assets
TOTAL
CURRENT
ASSETS 7072 30.08 14323 33.88 3.80 8272 18.57 9651 18.47 -0.10
NET
PROPERTY
PLANT AND
EQUIPMENT 12692 53.99 18182 43.01 -10.98 20460 45.93 21473 41.10 -4.83
GOODWILL 0 0.00 4086 9.66 9.66 9794 21.98 9794 18.74 -3.24
OTHER
INTANGIBLES 869 3.70 2311 5.47 1.77 4679 10.50 4658 8.91 -1.59
OTHER LONG
TERM ASSET 2877 12.24 3376 7.99 -4.25 1131 2.54 1575 3.01 0.48
TOTAL
ASSETS 23510 100% 42278 100% 44550 100% 52252 100%
LIABILITIES & EQUITY
TOTAL
CURRENT
LIABILITIES 9453 40.21 13806 32.66 -7.55 13270 29.79 14152 27.08 -2.70
TOTAL LONG
TERM
LIABILITIES 22044 93.76 31203 73.80 -19.96 33411 75.00 0 0.00 -75.00
TOTAL
LIABILITIES 31497 133.97 45009 106.46 -27.51 46681 104.78 40609 77.72 -27.07
TOTAL
EQUITY -7987 -33.97 -2731 -6.46 27.51 -2131 -4.78 11643 22.28 27.07
TOTAL
LIABILITIES
AND EQUITY 23510 100% 42278 100% 44550 100% 52252 100%
American Airlines Group Inc. may have more financial risk than Delta Airlines. It remains one
of the most highly leveraged, despite its Debt to Total Capital ratio shrinking to 115.26% over

8 | P a g e
the last fiscal year. Although debt as a percent of total capital decreased at Delta Air Lines Inc.
over the last fiscal year, it is still in-line with the Airlines industry's norm. Delta Airlines
inventory levels, relative to its Cost of Goods Sold, are typical for the industry and have shown a
consistent decrease during the last 2 years. This implies that management of Delta Airlines is
becoming more efficient. Additionally, even though there are not enough liquid assets to satisfy
current obligations considering both the airlines but Operating Profits are more than adequate to
service the debt.
3. Horizontal Analysis
Horizontal analysis of financial statements involves comparison of a financial ratio, a
benchmark, or a line item over a number of accounting periods. This method of analysis is also
known as trend analysis. Horizontal analysis allows the assessment of relative changes in
different items over time. It also indicates the behavior of revenues, expenses, and other line
items of financial statements over the course of time.
3.1 - Horizontal Analysis of Income Statements
From the horizontal analysis of American Airlines' and Delta Airlines' Income statement, we can
see that the growth in the sales revenue for both the companies (year-to-year) is almost the same.
However, American Airlines had a growth in its expenses such as the "other operating expenses"
which makes the company less profitable than Delta Airlines. All these figures suggest that Delta
Airlines had better sales than American Airlines and was successful in cutting down on
expenses.

9 | P a g e
Fig: Income Statement Comparison Sheet
3.2 - Horizontal Analysis of Balance
While Analyzing balance sheets of both the companies, we can see that American Airlines has
taken the necessary measures to increase the assets (current assets mainly). The company
reported a huge growth of 111.9 % from 2011 through 2013 in its current assets section.
However, their total equity went on to decrease by about 60% and the total liabilities increased
by 45%. Delta Airlines, on the other hand reported a growth of 24.8% and 20.12% in 'total assets'
and 'total liabilities and equity' respectively. This data suggests that Delta Airlines couldn’t
utilize the funds raised from equity in an efficient way like American Airlines.

10 | P a g e
Fig: Balance Sheet Comparison
4. Ratio Analysis
Ratio analysis expresses the relationship among selected items in financial statement as per 2013
year. In this project, we used ratio to evaluate Liquidity, Profitability and Solvency of American
Airline and Delta Airline.
4.1 - Liquidity Ratio
Measures the short-term ability of a company to pay its maturing debt obligations and
unexpected need of cash.
Current Ratio = Current Assets / Current Liabilities
American Airline
14,323/ 13,806 = 1.037447487
Delta Airline
9,651/ 14,152 = 0.681953081
Since working capital ratio, by definition measures company’s liquidity & short-term debt
paying ability, American Airline is 1.5 times more liquid as compared to Delta Airlines. For
every dollar of current liabilities American Airline has only 1.037 dollar of current assets while it
is .6819 for Delta airlines.
11 | P a g e
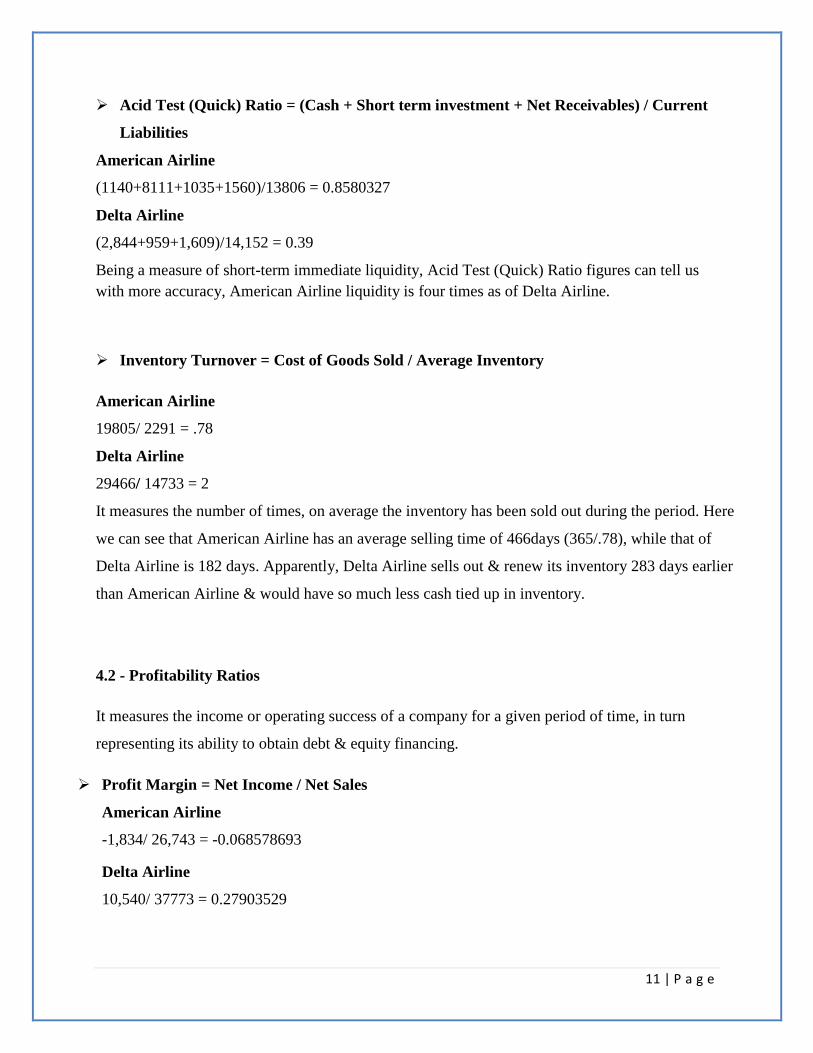
Acid Test (Quick) Ratio = (Cash + Short term investment + Net Receivables) / Current
Liabilities
American Airline
(1140+8111+1035+1560)/13806 = 0.8580327
Delta Airline
(2,844+959+1,609)/14,152 = 0.39
Being a measure of short-term immediate liquidity, Acid Test (Quick) Ratio figures can tell us
with more accuracy, American Airline liquidity is four times as of Delta Airline.
Inventory Turnover = Cost of Goods Sold / Average Inventory
American Airline
19805/ 2291 = .78
Delta Airline
29466/ 14733 = 2
It measures the number of times, on average the inventory has been sold out during the period. Here
we can see that American Airline has an average selling time of 466days (365/.78), while that of
Delta Airline is 182 days. Apparently, Delta Airline sells out & renew its inventory 283 days earlier
than American Airline & would have so much less cash tied up in inventory.
4.2 - Profitability Ratios
It measures the income or operating success of a company for a given period of time, in turn
representing its ability to obtain debt & equity financing.
Profit Margin = Net Income / Net Sales
American Airline
-1,834/ 26,743 = -0.068578693
Delta Airline
10,540/ 37773 = 0.27903529

12 | P a g e
With a profit margin of -.068, American Airline has -6.8% of each dollar of sales that result in net
income, while for Delta it is 27.9% . Delta Airline makes more net income as compared to
American Airline.
Asset Turnover = Net Sales / Average assets
American Airline
26,743/ (25,612 + 23,264) / 2 = 0.27348801
Total assets 2013: 25,612
Total assets 2012: 23,264
Delta Airline
37773/(52,252+ 44,550)/2 = 0.506836449
Total Assets 2013:52,252
Total Assets 2012: 44,550
As a measure of how efficiently a company uses its assets to generate sales, Asset Turnover figures
shows that American Airline generated a sales of $27.3 dollar invested in each asset, but Delta
earned 50.68 dollar. Apparently, Delta uses 1.85 of its assets more efficiently than American
Airline to improve sales.
Return on assets = Net Income / Average assets
American Airline
(1834) / (23510 + 42278) / 2 = 0.013938712
Delta Airline
10,540 / (52252 + 44550) / 2 = 0.141425255
Ratio measure the overall profitability, American Airline has a return of 1.13% , but Delta Airline
has a return of 14.14%. Delta airline has more return on assets and use more efficiently as compared
to American airline.

13 | P a g e
Earnings per share (EPS) = NI / weighted average common stock holdings
American Airline
(1834)/ 163,046 = 11.12
Delta Airline
10,540/ 849 = 12.41
The portion of a company's profit allocated to each outstanding share of common stock. Earnings
per share serves as an indicator of a company's profitability. Therefore , Delta Airline has higher
EPS 12.41 as compared to American airline 11.12. It is more profitable to buy Delta airline
shares.
Price Earnings Ratio = Market price per share / Earnings per share
American Airline
18.395/ 11.25 = 1.635111111
Delta Airline
20.49 / 12.41 = 1.65108783
The ratio reflects investor’s assessment of company’s future earnings. American Airline stock
sold for 1.63 times the amount that the company earned on each share while Delta Airline stock
sold for only 1.65 times the amount that the company earned on each share. This shows that
Delta Airline stock has high investment rate by the investors.
4.3 - Solvency Ratio
It measures the ability of a company to survive over a long period of time.
Debt to Total Assets = Total Debt / Total Assets
American Airline
45009/ 42278 = 1.064596244
Delta Airline
14,152+26,457 / 52,252 = 0.777175993

14 | P a g e
As a measure of percentage of total assets that creditors provide, American Airline has only
106% of its total assets provided by creditors while 77.77% of Delta Airline of total assets is
creditor’s money. Lower the ratio; more equity buffer is available to the creditors. Delta airline is
a better option to invest as per this analysis.
Times interest earned = Income before income taxes & Interest expense / Interest expense
American Airline
-1,324,000/ 856,000 = -1.546728972
Delta Airline
2527/ -698 = -3.62034384
American airline interest expense is covered .42 times more than that of Delta airline. American
airline manages to control its interest expense .42 times better than delta airlines.

15 | P a g e
5. Bibliography
The new American is arriving. (n.d.). American Airlines. Retrieved May 8, 2014, from
http://www.aa.com/homePage.do
SkyMiles.It's Very Rewarding. . (n.d.). Airline Tickets and Flights to Worldwide Destinations.
Retrieved May 8, 2014, from http://www.delta.com/
. (n.d.). . Retrieved May 8, 2014, from
http://investing.businessweek.com/research/stocks/financials/financials.asp?ticker=AAL
Financial Statements for delta air lines inc (DAL). (n.d.). Businessweek.com. Retrieved May 8,
2014, from
http://investing.businessweek.com/research/stocks/financials/financials.asp?ticker=DAL&dataset
=incomeStatement&period=A¤cy=native
No Ticker Symbol - Yahoo! Finance. (n.d.). No Ticker Symbol - Yahoo! Finance. Retrieved May
8, 2014, from
http://finance.yahoo.com/q/hp?a=00&b=01&c=2013&d=11&e=31&f=2013&g=m&s=DAL%2C
+&ql=1
Delta Air Lines. (n.d.). , Inc.. Retrieved May 8, 2014, from http://ir.delta.com/stock-and-
financial/sec-filings/default.aspx
. (n.d.). . Retrieved May 8, 2014, from
http://www.sec.gov/Archives/edgar/data/4515/000000451513000022/aa-10kx20121231.htm
Delta Air Lines. (n.d.). , Inc.. Retrieved May 8, 2014, from http://ir.delta.com/shareholder-
resources/stock-information/default.aspx
. (n.d.). . Retrieved May 8, 2014, from http://phx.corporate-
ir.net/phoenix.zhtml?c=117098&p=irol-stockquote
Delta Air Lines, Inc. Company Profile - Yahoo Finance. (n.d.). Delta Air Lines, Inc. Company
Profile - Yahoo Finance. Retrieved May 8, 2014, from http://biz.yahoo.com/ic/10/10448.html
American Airlines Group Inc. Company Profile - Yahoo Finance. (n.d.). American Airlines
Group Inc. Company Profile - Yahoo Finance. Retrieved May 8, 2014, from
http://biz.yahoo.com/ic/10/10021.html