acca f5 read free pdf
TRANSCRIPT

ACCA Paper F5
Performance Management
For exams in 2010
theexpgroup.com
Notes

ExPress Notes ACCA F5 Performance Management
Page | 2 © 2010 This material is the copyright of the ExP Group. Individuals may reproduce this material if it is for their own private use. It is illegal for any individuals to reproduce this for commercial use or for companies to reproduce this
material partially and/or in full by any means, be it printed, photocopied, on electronic devices or any other means of reproduction. All examples presented in these course materials are for information and educational purposes only and
should not be applied to a specific real life situation without prior advice. Given the nature of information presented in these materials, and given that legislation may change at any time, The ExP Group will not be held liable for any information presented in these materials as to its application to any specific cases.
theexpgroup.com
Contents
About ExPress Notes 3
1. Specialist Cost & Management Accounting Techniques
7
2. Decision Making – Linear Programming 10
3. Pricing Decisions 12
4. Make-or-buy and other short-term decisions 16
5. Risk and Uncertainty in Decision Making 19
6. Budgeting – an Introduction 22
7. Budgeting and Standard Costing #1 26
8. Budgeting and Standard Costing #2 32
9. Performance Measurement & Control 35
ExPress Notes ACCA F5 Performance Management
Page | 3 © 2010 This material is the copyright of the ExP Group. Individuals may reproduce this material if it is for their own private use. It is illegal for any individuals to reproduce this for commercial use or for companies to reproduce this
material partially and/or in full by any means, be it printed, photocopied, on electronic devices or any other means of reproduction. All examples presented in these course materials are for information and educational purposes only and
should not be applied to a specific real life situation without prior advice. Given the nature of information presented in these materials, and given that legislation may change at any time, The ExP Group will not be held liable for any information presented in these materials as to its application to any specific cases.
theexpgroup.com
START About ExPress Notes
We are very pleased that you have downloaded a copy of our ExPress notes for this paper.
We expect that you are keen to get on with the job in hand, so we will keep the introduction
brief.
First, we would like to draw your attention to the terms and conditions of usage. It’s a
condition of printing these notes that you agree to the terms and conditions of usage.
These are available to view at www.theexpgroup.com. Essentially, we want to help people
get through their exams. If you are a student for the ACCA exams and you are using these
notes for yourself only, you will have no problems complying with our fair use policy.
You will however need to get our written permission in advance if you want to use these
notes as part of a training programme that you are delivering.
WARNING! These notes are not designed to cover everything in the syllabus!
They are designed to help you assimilate and understand the most important areas for the
exam as quickly as possible. If you study from these notes only, you will not have covered
everything that is in the ACCA syllabus and study guide for this paper.
Components of an effective study system
On ExP classroom courses, we provide people with the following learning materials:
The ExPress notes for that paper
The ExP recommended course notes / essential text or the ExPedite classroom
course notes where we have published our own course notes for that paper
The ExP recommended exam kit for that paper.
In addition, we will recommend a study text / complete text from one of the ACCA
official publishers, but we do not necessarily give this as part of a classroom course,
as we think that it can sometimes slow people down and reduce the time that they
are able to spend practising past questions.
ExP classroom course students will also have access to various online support materials,
including:
The unique ExP & Me e-portal, which amongst other things allows “view again” of
the classroom course that was actually attended.
ExPand, our online learning tool and questions and answers database
Everybody in the World has free access to ACCA’s own database of past exam questions,
answers, syllabus, study guide and examiner’s commentaries on past sittings. This can be

ExPress Notes ACCA F5 Performance Management
Page | 4 © 2010 This material is the copyright of the ExP Group. Individuals may reproduce this material if it is for their own private use. It is illegal for any individuals to reproduce this for commercial use or for companies to reproduce this
material partially and/or in full by any means, be it printed, photocopied, on electronic devices or any other means of reproduction. All examples presented in these course materials are for information and educational purposes only and
should not be applied to a specific real life situation without prior advice. Given the nature of information presented in these materials, and given that legislation may change at any time, The ExP Group will not be held liable for any information presented in these materials as to its application to any specific cases.
theexpgroup.com
an invaluable resource. You can find links to the most useful pages of the ACCA database
that are relevant to your study on ExPand at www.theexpgroup.com.
How to get the most from these ExPress notes
For people on a classroom course, this is how we recommend that you use the suite of
learning materials that we provide. This depends where you are in terms of your exam
preparation for each paper.
Your stage in
study for each paper
These ExPress
notes
ExP
recommended course notes, or
ExPedite notes
ExP
recommended exam kit
ACCA online
past exams
Prior to study, e.g.
deciding which optional papers
to take
Skim through the ExPress notes
to get a feel for what’s in the
syllabus, the
“size” of the paper and how much it
appeals to you.
Don’t use yet Don’t use yet Have a quick look at the two
most recent real ACCA exam
papers to get a
feel for examiner’s style.
At the start of
the learning
phase
Work through
each chapter of
the ExPress notes in detail before
you then work through your
course notes.
Don’t try to feel that you have to
understand everything – just
get an idea for
what you are about to study.
Don’t make any annotations on
the ExPress notes at this stage.
Work through in
detail. Review
each chapter after class at least once.
Make sure that you understand each
area reasonably
well, but also make sure that you can
recall key definitions,
concepts,
approaches to exam questions,
mnemonics, etc.
Nobody passes an
exam by what they
have studied – we pass exams by
being efficient in being able to prove
what we know. In
other words, you need to have
effectively input the knowledge and be
effective in the
output of what you know. Exam
practice is key to this.
Try to do at least one past exam
question on the
learning phase for each major chapter.
Don’t use at
this stage.

ExPress Notes ACCA F5 Performance Management
Page | 5 © 2010 This material is the copyright of the ExP Group. Individuals may reproduce this material if it is for their own private use. It is illegal for any individuals to reproduce this for commercial use or for companies to reproduce this
material partially and/or in full by any means, be it printed, photocopied, on electronic devices or any other means of reproduction. All examples presented in these course materials are for information and educational purposes only and
should not be applied to a specific real life situation without prior advice. Given the nature of information presented in these materials, and given that legislation may change at any time, The ExP Group will not be held liable for any information presented in these materials as to its application to any specific cases.
theexpgroup.com
Your stage in study for each
paper
These ExPress notes
ExP recommended
course notes, or ExPedite notes
ExP recommended
exam kit
ACCA online past exams
Practice phase Work through
the ExPress notes again, this time
annotating to
explain bits that you think are easy
and be brave enough to cross
out the bits that
you are confident you’ll remember
without reviewing them.
Avoid reading
through your notes again. Try
to focus on doing
past exam questions first and
then go back to your course notes/
ExPress notes if
there’s something in an answer that
you don’t understand.
This is your most
important tool at this stage. You
should aim to
have worked through and
understood at least two or three
questions on each
major area of the syllabus. You pass
real exams by passing mock
exams. Don’t be tempted to fall
into “passive”
revision at this stage (e.g.
reading notes or listening to CDs).
Passive revision
tends to be a waste of time.
Download the
two most recent real exam
questions and
answers.
Read through the
technical articles written
by the examiner.
Read through the two most recent
examiner’s reports in detail.
Read through some other older
ones. Try to see if
there are any recurring
criticisms he or she makes. You
must avoid these!
The night before the real
exam
Read through the ExPress
notes in full.
Highlight the bits that you think are
important but you think you are most
likely to forget.
Unless there are specific bits that
you feel you must
revise, avoid looking at your
course notes. Give up on any areas
that you still don’t
understand. It’s too late now.
Don’t touch it! Do a final review of the two most
recent
examiner’s reports for the
paper you will be taking tomorrow.
At the door of the exam room
before you go
in.
Read quickly through the full
set of ExPress
notes, focusing on areas you’ve
highlighted, key workings,
approaches to
exam questions, etc.
Avoid looking at them in detail,
especially if the
notes are very big. It will scare you.
Leave at home. Leave at home.
ExPress Notes ACCA F5 Performance Management
Page | 6 © 2010 This material is the copyright of the ExP Group. Individuals may reproduce this material if it is for their own private use. It is illegal for any individuals to reproduce this for commercial use or for companies to reproduce this
material partially and/or in full by any means, be it printed, photocopied, on electronic devices or any other means of reproduction. All examples presented in these course materials are for information and educational purposes only and
should not be applied to a specific real life situation without prior advice. Given the nature of information presented in these materials, and given that legislation may change at any time, The ExP Group will not be held liable for any information presented in these materials as to its application to any specific cases.
theexpgroup.com
Our ExPress notes fit into our portfolio of materials as follows:
Notes
Notes
Notes
Provide a base understanding of the most important areas of the syllabus only.
Provide a comprehensive coverage of the syllabus and accompany our face to face professional exam courses
Provide detailed coverage of particular technical areas and are used on our Professional Development and Executive Programmes.
To maximise your chances of success in the exam we recommend you visit
www.theexpgroup.com where you will be able to access additional free resources to help
you in your studies.
START About The ExP Group
Born with a desire to be the leading supplier of business training services, the ExP Group
delivers courses through either one of its permanent centres or onsite at a variety of
locations around the world. Our clients range from multinational household corporate
names, through local companies to individuals furthering themselves through studying for
one of the various professional exams or professional development courses.
As well as courses for ACCA and other professional qualifications, our portfolio of expertise covers all areas of financial training ranging from introductory financial awareness courses for non-financial staff to high level corporate finance and banking courses for senior executives.
Our expert team has worked with many different audiences around the world ranging from
graduate recruits through to senior board level positions.
Full details about us can be found at www.theexpgroup.com and for any specific enquiries
please contact us at [email protected].

ExPress Notes ACCA F5 Performance Management
Page | 7 © 2010 This material is the copyright of the ExP Group. Individuals may reproduce this material if it is for their own private use. It is illegal for any individuals to reproduce this for commercial use or for companies to reproduce this
material partially and/or in full by any means, be it printed, photocopied, on electronic devices or any other means of reproduction. All examples presented in these course materials are for information and educational purposes only and
should not be applied to a specific real life situation without prior advice. Given the nature of information presented in these materials, and given that legislation may change at any time, The ExP Group will not be held liable for any information presented in these materials as to its application to any specific cases.
theexpgroup.com
Chapter 1
Specialist Cost & Management Accounting Techniques
KEY KNOWLEDGE Activity Based Costing (ABC)
ABC is a method that seeks to group overhead costs according to the activities causing those costs. The activities giving rise to the costs are called “cost drivers”. By linking costs to activities (cost drivers), it becomes possible to charge costs to the agents undertaking those activities.
EXAMPLE
A factory clinic with total annual costs of $500,000 serves two Workshops A and B. Workshop A has 200 employees and Workshop B has 300 employees.

ExPress Notes ACCA F5 Performance Management
Page | 8 © 2010 This material is the copyright of the ExP Group. Individuals may reproduce this material if it is for their own private use. It is illegal for any individuals to reproduce this for commercial use or for companies to reproduce this
material partially and/or in full by any means, be it printed, photocopied, on electronic devices or any other means of reproduction. All examples presented in these course materials are for information and educational purposes only and
should not be applied to a specific real life situation without prior advice. Given the nature of information presented in these materials, and given that legislation may change at any time, The ExP Group will not be held liable for any information presented in these materials as to its application to any specific cases.
theexpgroup.com
A conventional way of apportioning the cost would be on the basis of employees: Workshop A: (200/500) x 500,000 = 200,000 Workshop B: (300/500) x 500,000 = 300,000 500,000 An ABC approach might look at the number of visits to the clinic by the employees of A and B. Workshop A: 150 visits p.a. Workshop B: 70 visits p.a. In this case, the apportionment could be: Workshop A: (150/220) x 500,000 = 340,909 Workshop B: ( 70/220) x 500,000 = 159,091 500,000 The different levels of usage may reflect different degrees of occupational hazard present in the two workshops. ABC advantages: provides a more precise way to determine costs per unit of output, especially since not all overhead costs are driven by production volumes. Budgetary planning, pricing decisions and managing performance are all facilitated by ABC. ABC disadvantages: it can be complex and costly to implement. It is not a “plug-in-and-go” system! It is therefore imperative that management carefully weigh the costs against the (expected) benefits from ABC before deciding to implement it.
KEY KNOWLEDGE Target costing
This is a market-oriented approach to costing which starts by identifying the likely price that a product can fetch in the market, deducts the profit that the product is expected to earn, and arrives at the maximum (target) cost of manufacturing the product. Such a method usually requires successive iterations in order to close a “cost gap”, i.e. where the costs are above the targeted level. Product re-design, alternative materials and production processes are examined in order to achieve the desired level of costs.
ExPress Notes ACCA F5 Performance Management
Page | 9 © 2010 This material is the copyright of the ExP Group. Individuals may reproduce this material if it is for their own private use. It is illegal for any individuals to reproduce this for commercial use or for companies to reproduce this
material partially and/or in full by any means, be it printed, photocopied, on electronic devices or any other means of reproduction. All examples presented in these course materials are for information and educational purposes only and
should not be applied to a specific real life situation without prior advice. Given the nature of information presented in these materials, and given that legislation may change at any time, The ExP Group will not be held liable for any information presented in these materials as to its application to any specific cases.
theexpgroup.com
KEY KNOWLEDGE Life-cycle costing
A product normally “lives” beyond one accounting period and the costs connected to its development/design, launch and maintenance fall unevenly across time periods. This method takes a comprehensive view of the costs relating to the product throughout its life-cycle.
KEY KNOWLEDGE Back-flush Accounting
This is a simplified costing method which can be used in conditions of short operational cycles and low inventories. Companies working on a Just-In-Time (JIT) basis may practise it, as it avoids the detailed tracking of costs during production; instead, it records costs when goods are completed. These costs are then “back-flushed” through the system based on standard costs.
KEY KNOWLEDGE Throughput accounting
This method is also consistent with a JIT environment and focuses on the bottlenecks in a production process; by eliminating these bottlenecks, it raises the amount of output that can flow through the process (assuming there is demand for the output – the idea is not to produce for inventory!). The throughput accounting approach itself considers all costs (including direct labour) as fixed and treats only direct materials as being variable in the short term.

ExPress Notes ACCA F5 Performance Management
Page | 10 © 2010 This material is the copyright of the ExP Group. Individuals may reproduce this material if it is for their own private use. It is illegal for any individuals to reproduce this for commercial use or for companies to reproduce this
material partially and/or in full by any means, be it printed, photocopied, on electronic devices or any other means of reproduction. All examples presented in these course materials are for information and educational purposes only and
should not be applied to a specific real life situation without prior advice. Given the nature of information presented in these materials, and given that legislation may change at any time, The ExP Group will not be held liable for any information presented in these materials as to its application to any specific cases.
theexpgroup.com
Chapter 2
Decision Making – Linear Programming
KEY KNOWLEDGE Multi-limiting factors and the use of linear programming and shadow pricing.
When resources are scarce, or other limiting factors are present in a given situation, then management is concerned with achieving the most efficient allocation of available resources. Whereas planning with one limiting factor involves the use of “key factor analysis” (in which typically one seeks to maximize the contribution per unit of the limited, or bottleneck, resource – see Paper F2), the presence of several limiting factors requires the use of linear programming. In such cases, linear programming is typically used to either maximise contribution or to minimize costs. The usual steps to be followed are:
1) Define the variables 2) Define the “objective function” 3) Express the constraints as equations 4) Solve the equations simultaneously as well as feasible values corresponding to
the corner points; 5) Determine the combination of specific values that satisfies the objective function.

ExPress Notes ACCA F5 Performance Management
Page | 11 © 2010 This material is the copyright of the ExP Group. Individuals may reproduce this material if it is for their own private use. It is illegal for any individuals to reproduce this for commercial use or for companies to reproduce this
material partially and/or in full by any means, be it printed, photocopied, on electronic devices or any other means of reproduction. All examples presented in these course materials are for information and educational purposes only and
should not be applied to a specific real life situation without prior advice. Given the nature of information presented in these materials, and given that legislation may change at any time, The ExP Group will not be held liable for any information presented in these materials as to its application to any specific cases.
theexpgroup.com
The answer can also be graphed and Step 5 determined visually. A graph also shows the “feasible region” of value combinations that are consistent with the constraints.
EXAMPLE
An aircraft manufacturing company producing propellers and wing ribs operates under the following conditions: Propellers Wing ribs (set) Materials (kg) 6 12 Labour (hrs) 8 6 Contribution ($) 50 30 Materials are limited to 120 kg. per week while labour must not exceed 100 hours.
1) Define the variables: p = propellers w = wing ribs
2) Maximise contribution = 50p + 30w
3) Materials: 6p + 12w ≤ 120 Labour: 8p + 6w ≤ 100
4) Simultaneous solving results in: p = 8 and w = 6; the feasible corner points are p = 12.5 (when w=0) and w = 10 (when p=0)
5) Calculate the highest contribution at each of the combinations in Step 4 This can also be graphed for easier visualisation of the feasible region and solution. Shadow (dual) price A shadow price is the additional value to be obtained (usually an increase in contribution) by having available one more unit of a scarce resource. In the example above, the shadow price of 1 kg of material can be determined by re-solving the simultaneous equations with 121 (kg) substituted for 120. Similarly, the shadow price of an additional hour of labour can be expressed by re-solving the equations with labour equal to 101, and determining what the increase in contribution will be. Slack This represents the amount of a resource that has not been exhausted (i.e. its availability does not act as a constraint or limiting factor in a given set of circumstances).

ExPress Notes ACCA F5 Performance Management
Page | 12 © 2010 This material is the copyright of the ExP Group. Individuals may reproduce this material if it is for their own private use. It is illegal for any individuals to reproduce this for commercial use or for companies to reproduce this
material partially and/or in full by any means, be it printed, photocopied, on electronic devices or any other means of reproduction. All examples presented in these course materials are for information and educational purposes only and
should not be applied to a specific real life situation without prior advice. Given the nature of information presented in these materials, and given that legislation may change at any time, The ExP Group will not be held liable for any information presented in these materials as to its application to any specific cases.
theexpgroup.com
Chapter 3
Pricing Decisions
START The Big Picture
The pricing of a product or service is crucially influenced by several factors: Internal: How much does it cost us to produce it? External: How much is a customer willing to pay for it? The latter is further influenced by how much the competition is charging for the same (or similar) product or service.
KEY KNOWLEDGE The price elasticity of demand (PED)
This measures the sensitivity of (customer) demand to a change in prices. There is usually an inverse relationship: when price goes up, demand goes down (and vice versa). PED = % change in demand % change in price
ExPress Notes ACCA F5 Performance Management
Page | 13 © 2010 This material is the copyright of the ExP Group. Individuals may reproduce this material if it is for their own private use. It is illegal for any individuals to reproduce this for commercial use or for companies to reproduce this
material partially and/or in full by any means, be it printed, photocopied, on electronic devices or any other means of reproduction. All examples presented in these course materials are for information and educational purposes only and
should not be applied to a specific real life situation without prior advice. Given the nature of information presented in these materials, and given that legislation may change at any time, The ExP Group will not be held liable for any information presented in these materials as to its application to any specific cases.
theexpgroup.com
EXAMPLE
A cinema increases its ticket prices from $4 to $6; as a result, the number of cinema goers drops from 2,000 to 1,500. The PED = (500/2000) = 25% = 0.5 (Note:Ignore + or – signs; take the absolute value) (2/4) 50% In the above example, demand is considered inelastic, because the PED < 1. When PED > 1, then demand is considered elastic.
KEY KNOWLEDGE Demand Equation
Whereas the PED is expressed in percentages, the demand equation (or function) is portrayed as a downward sloping straight line which shows price and demand combinations in their full values. The equation is expressed as P = a – bQ Where: P = price – corresponding to the dependent variable (y-axis) on a graph; Q = (Quantity) demanded – corresponding to the independent variable (x-axis); a = the maximum price (where Q = 0) -- corresponding to the y-intercept; and b = the slope of the (negatively-sloping) line (change in P / change in Q)
EXAMPLE
On an average Saturday night, a cinema (capacity: 225) attracts 150 visitors at a price of $5. If the price of the ticket is decreased by $0.50 then 25 more people will come. In order to fill up the cinema, the ticket price would have to be set at:

ExPress Notes ACCA F5 Performance Management
Page | 14 © 2010 This material is the copyright of the ExP Group. Individuals may reproduce this material if it is for their own private use. It is illegal for any individuals to reproduce this for commercial use or for companies to reproduce this
material partially and/or in full by any means, be it printed, photocopied, on electronic devices or any other means of reproduction. All examples presented in these course materials are for information and educational purposes only and
should not be applied to a specific real life situation without prior advice. Given the nature of information presented in these materials, and given that legislation may change at any time, The ExP Group will not be held liable for any information presented in these materials as to its application to any specific cases.
theexpgroup.com
5 = a – (0.50/25) x 150; therefore, a = 8, and P = 8 – 0.02Q At Q = 225, P = $3.50
KEY KNOWLEDGE Total Cost Function
An equation can also be formulated to express the relationship between total costs and variable costs: Y = aX + b Where: Y = Total costs; X = Output – corresponding to the independent variable; a = fixed cost – corresponding to the Y-intercept; b = the variable cost per unit -- corresponding to the slope of the total cost line
EXAMPLE
The variable cost per unit of a bottling process is 10 cents per unit. Fixed costs amount to $5,000. At an output level of 20,000 units, what is the total cost? Y = $5,000 + ($0.10) x 20,000 = $7,000 When working with bulk discounts and other sales volumes, it is important to make sure that fixed costs remain unchanged over the output range covered. If they increase (as a result of expanding the production capacity, for example) then the new (higher) level of fixed costs need to be included in the calculation of total costs.
ExPress Notes ACCA F5 Performance Management
Page | 15 © 2010 This material is the copyright of the ExP Group. Individuals may reproduce this material if it is for their own private use. It is illegal for any individuals to reproduce this for commercial use or for companies to reproduce this
material partially and/or in full by any means, be it printed, photocopied, on electronic devices or any other means of reproduction. All examples presented in these course materials are for information and educational purposes only and
should not be applied to a specific real life situation without prior advice. Given the nature of information presented in these materials, and given that legislation may change at any time, The ExP Group will not be held liable for any information presented in these materials as to its application to any specific cases.
theexpgroup.com
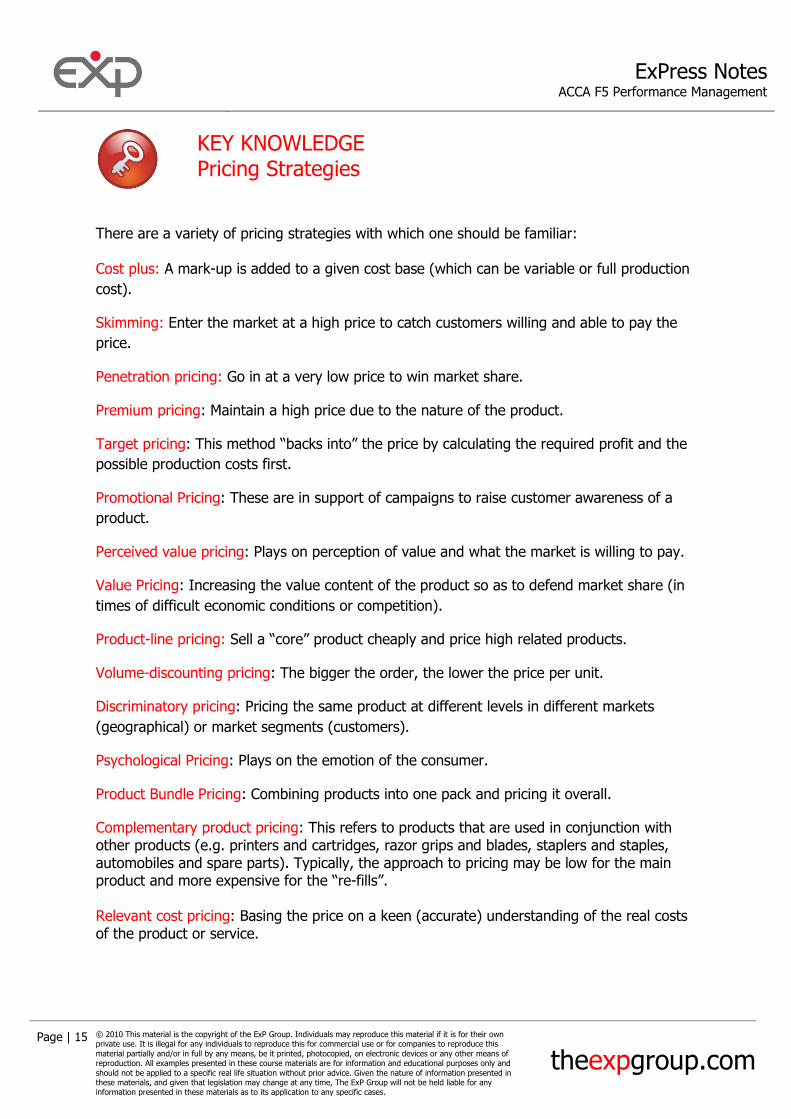
KEY KNOWLEDGE Pricing Strategies
There are a variety of pricing strategies with which one should be familiar: Cost plus: A mark-up is added to a given cost base (which can be variable or full production
cost).
Skimming: Enter the market at a high price to catch customers willing and able to pay the
price.
Penetration pricing: Go in at a very low price to win market share.
Premium pricing: Maintain a high price due to the nature of the product.
Target pricing: This method “backs into” the price by calculating the required profit and the
possible production costs first.
Promotional Pricing: These are in support of campaigns to raise customer awareness of a
product.
Perceived value pricing: Plays on perception of value and what the market is willing to pay.
Value Pricing: Increasing the value content of the product so as to defend market share (in
times of difficult economic conditions or competition).
Product-line pricing: Sell a “core” product cheaply and price high related products.
Volume-discounting pricing: The bigger the order, the lower the price per unit.
Discriminatory pricing: Pricing the same product at different levels in different markets
(geographical) or market segments (customers).
Psychological Pricing: Plays on the emotion of the consumer.
Product Bundle Pricing: Combining products into one pack and pricing it overall.
Complementary product pricing: This refers to products that are used in conjunction with other products (e.g. printers and cartridges, razor grips and blades, staplers and staples, automobiles and spare parts). Typically, the approach to pricing may be low for the main product and more expensive for the “re-fills”. Relevant cost pricing: Basing the price on a keen (accurate) understanding of the real costs of the product or service.

ExPress Notes ACCA F5 Performance Management
Page | 16 © 2010 This material is the copyright of the ExP Group. Individuals may reproduce this material if it is for their own private use. It is illegal for any individuals to reproduce this for commercial use or for companies to reproduce this
material partially and/or in full by any means, be it printed, photocopied, on electronic devices or any other means of reproduction. All examples presented in these course materials are for information and educational purposes only and
should not be applied to a specific real life situation without prior advice. Given the nature of information presented in these materials, and given that legislation may change at any time, The ExP Group will not be held liable for any information presented in these materials as to its application to any specific cases.
theexpgroup.com
Chapter 4
Make-or-buy and other short-term
decisions
START The Big Picture
One of management’s responsibilities involves making decisions affecting the firm in the
short-run based on relevant costs.
What is relevance? A relevant cost is a cash cost which is uniquely incurred (or avoided) as a consequence of
taking a decision; cash, because it is the main determinant of value (unlike accounting
profit); and unique in the sense that is not common to the alternative choices that are under
consideration.

ExPress Notes ACCA F5 Performance Management
Page | 17 © 2010 This material is the copyright of the ExP Group. Individuals may reproduce this material if it is for their own private use. It is illegal for any individuals to reproduce this for commercial use or for companies to reproduce this
material partially and/or in full by any means, be it printed, photocopied, on electronic devices or any other means of reproduction. All examples presented in these course materials are for information and educational purposes only and
should not be applied to a specific real life situation without prior advice. Given the nature of information presented in these materials, and given that legislation may change at any time, The ExP Group will not be held liable for any information presented in these materials as to its application to any specific cases.
theexpgroup.com
EXAMPLE
A company seeking to determine whether to continue to transport its products by truck or to
switch to the railroad discovers that insurance costs are identical in both choices; in that
case, insurance costs are not relevant to the decision.
If, however, there is a difference in the two insurance costs, then one can speak of the
difference between the two choices as being “incremental”; this difference (referred to in
some places as the “differential”) is relevant to the decision under consideration.
Future
Relevant costs refer to the future, i.e. they can be influenced prospectively by choice. It
follows that:
Sunk costs are not relevant: They have already taken place and cannot be reversed.
Committed costs, if they cannot be avoided, are likewise not relevant, even if the timing of
their occurrence is in the future. Their “unavoidability” has already been established in the
past (making them effectively the equivalent of sunk costs).
In keeping with the above logic, relevant costs therefore involve cash, are incremental and
relate to the future.
Relevant costs need to be identified with care, as they may include opportunity costs.
EXAMPLE
A company considers building a storage facility on the site of a parking lot. If the parking lot
had been generating parking fees which will now be lost, then this foregone revenue is an
opportunity cost.
Make-Buy
A make-buy decision requires the determination of all relevant costs.

ExPress Notes ACCA F5 Performance Management
Page | 18 © 2010 This material is the copyright of the ExP Group. Individuals may reproduce this material if it is for their own private use. It is illegal for any individuals to reproduce this for commercial use or for companies to reproduce this
material partially and/or in full by any means, be it printed, photocopied, on electronic devices or any other means of reproduction. All examples presented in these course materials are for information and educational purposes only and
should not be applied to a specific real life situation without prior advice. Given the nature of information presented in these materials, and given that legislation may change at any time, The ExP Group will not be held liable for any information presented in these materials as to its application to any specific cases.
theexpgroup.com
EXAMPLE
An automotive components producer can supply itself externally with car heaters for $210
per unit. In considering whether to make these internally, the company calculates that an
equivalent unit can be made in 2 labour hours using $100 worth of materials.
Labour is currently at full capacity producing carburettors which generate contribution of
$100. A carburettor takes 2.5 hours to produce. Labour costs $10 per hour. The carburettor
also absorbs fixed overhead costs at the rate of $20 per labour hour.
The relevant costs are ($):
Materials: 100
Contribution lost (carburettors): 80
Labour (added-back): 20
200
It is cheaper to produce internally.
Shut Down decisions
Whether to close a plant making (accounting) losses depends on relevant costs:
Superior
Revenues (m) 40
Costs (m) (44)
Profits (m) (4)
If 25% of the costs are fixed costs allocated by H.O., then it appears that closing the plant
will leave the company worse off, as 40m in revenues and only 33m in costs will disappear.
A careful examination of all costs needs to be made before arriving at a final decision.
ExPress Notes ACCA F5 Performance Management
Page | 19 © 2010 This material is the copyright of the ExP Group. Individuals may reproduce this material if it is for their own private use. It is illegal for any individuals to reproduce this for commercial use or for companies to reproduce this
material partially and/or in full by any means, be it printed, photocopied, on electronic devices or any other means of reproduction. All examples presented in these course materials are for information and educational purposes only and
should not be applied to a specific real life situation without prior advice. Given the nature of information presented in these materials, and given that legislation may change at any time, The ExP Group will not be held liable for any information presented in these materials as to its application to any specific cases.
theexpgroup.com
Chapter 5
Risk and Uncertainty in Decision Making
START The Big Picture
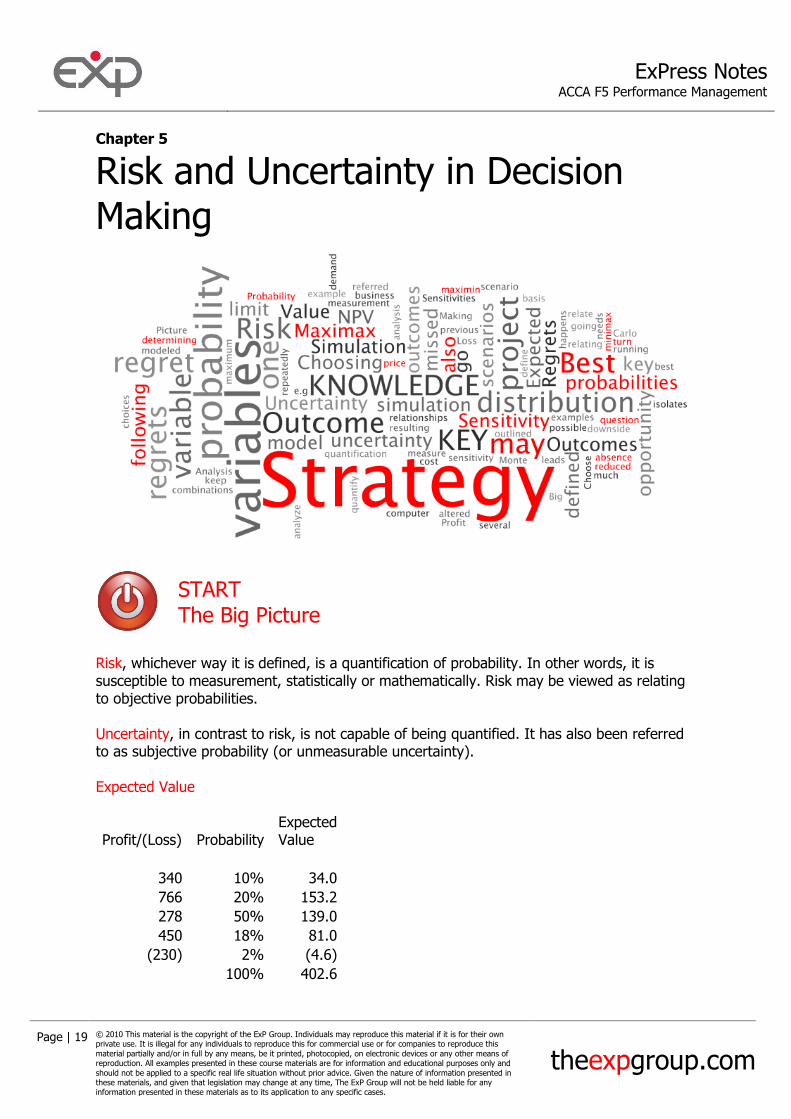
Risk, whichever way it is defined, is a quantification of probability. In other words, it is susceptible to measurement, statistically or mathematically. Risk may be viewed as relating to objective probabilities. Uncertainty, in contrast to risk, is not capable of being quantified. It has also been referred to as subjective probability (or unmeasurable uncertainty). Expected Value
Profit/(Loss) Probability
Expected Value
340 10% 34.0
766 20% 153.2
278 50% 139.0
450 18% 81.0
(230) 2% (4.6)
100% 402.6
ExPress Notes ACCA F5 Performance Management
Page | 20 © 2010 This material is the copyright of the ExP Group. Individuals may reproduce this material if it is for their own private use. It is illegal for any individuals to reproduce this for commercial use or for companies to reproduce this
material partially and/or in full by any means, be it printed, photocopied, on electronic devices or any other means of reproduction. All examples presented in these course materials are for information and educational purposes only and
should not be applied to a specific real life situation without prior advice. Given the nature of information presented in these materials, and given that legislation may change at any time, The ExP Group will not be held liable for any information presented in these materials as to its application to any specific cases.
theexpgroup.com
KEY KNOWLEDGE Sensitivity
Sensitivity Analysis This asks the following question: What happens to the NPV of a project if certain key variables are altered. It is a one-dimensional approach as it isolates and alters each (key) variable in turn in order to measure the impact. Sensitivities by scenario One can also go beyond determining project sensitivity to one variable and define scenarios, in which several variables move simultaneously (as outlined in the previous paragraph). Based on these scenarios, the NPV outcomes can be evaluated.
KEY KNOWLEDGE Simulation
Simulation -- Monte Carlo This is a simulation model that uses probability distribution analysis to analyze the possible outcomes of a project. It is built on the simultaneous changes of many variables, the relationships between these variables being defined in advance, e.g. if price is reduced, how much demand may go up. Each variable itself has a probability distribution and the combinations of variables are modeled through running the model repeatedly by computer, resulting in a distribution of simulation results.
ExPress Notes ACCA F5 Performance Management
Page | 21 © 2010 This material is the copyright of the ExP Group. Individuals may reproduce this material if it is for their own private use. It is illegal for any individuals to reproduce this for commercial use or for companies to reproduce this
material partially and/or in full by any means, be it printed, photocopied, on electronic devices or any other means of reproduction. All examples presented in these course materials are for information and educational purposes only and
should not be applied to a specific real life situation without prior advice. Given the nature of information presented in these materials, and given that legislation may change at any time, The ExP Group will not be held liable for any information presented in these materials as to its application to any specific cases.
theexpgroup.com
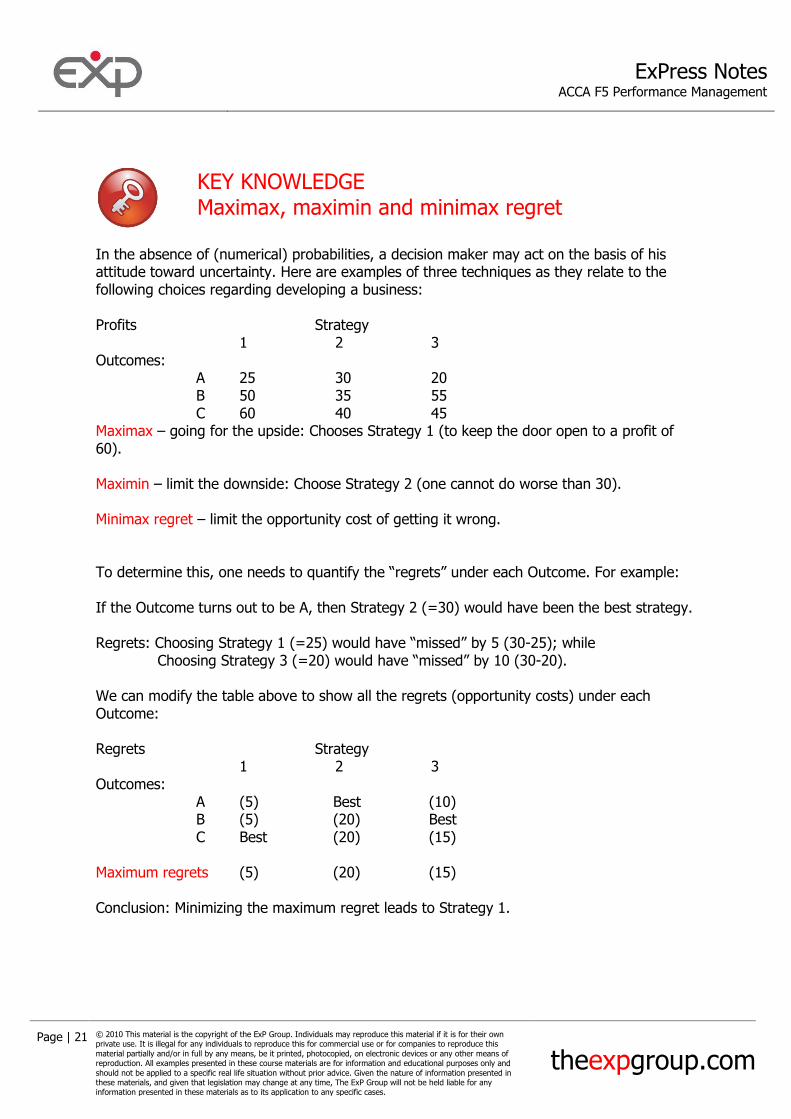
KEY KNOWLEDGE Maximax, maximin and minimax regret
In the absence of (numerical) probabilities, a decision maker may act on the basis of his attitude toward uncertainty. Here are examples of three techniques as they relate to the following choices regarding developing a business: Profits Strategy 1 2 3 Outcomes: A 25 30 20 B 50 35 55 C 60 40 45 Maximax – going for the upside: Chooses Strategy 1 (to keep the door open to a profit of 60). Maximin – limit the downside: Choose Strategy 2 (one cannot do worse than 30). Minimax regret – limit the opportunity cost of getting it wrong. To determine this, one needs to quantify the “regrets” under each Outcome. For example: If the Outcome turns out to be A, then Strategy 2 (=30) would have been the best strategy. Regrets: Choosing Strategy 1 (=25) would have “missed” by 5 (30-25); while Choosing Strategy 3 (=20) would have “missed” by 10 (30-20). We can modify the table above to show all the regrets (opportunity costs) under each Outcome: Regrets Strategy 1 2 3 Outcomes: A (5) Best (10) B (5) (20) Best C Best (20) (15) Maximum regrets (5) (20) (15) Conclusion: Minimizing the maximum regret leads to Strategy 1.

ExPress Notes ACCA F5 Performance Management
Page | 22 © 2010 This material is the copyright of the ExP Group. Individuals may reproduce this material if it is for their own private use. It is illegal for any individuals to reproduce this for commercial use or for companies to reproduce this
material partially and/or in full by any means, be it printed, photocopied, on electronic devices or any other means of reproduction. All examples presented in these course materials are for information and educational purposes only and
should not be applied to a specific real life situation without prior advice. Given the nature of information presented in these materials, and given that legislation may change at any time, The ExP Group will not be held liable for any information presented in these materials as to its application to any specific cases.
theexpgroup.com
Chapter 6
Budgeting – an introduction
START The Big Picture
Budgets A budget is a quantitative plan addressing the future. Budgetary control systems seek to monitor performance against the budget in a timely way so that deviations can be identified and rectified. The system can only work as well as the care and thought that went into defining performance targets to be measured, and the incentives (and sanctions) that follow from achievement (or not) of those targets. Goal congruence at all levels of the organisation – corporate, divisional and individual – must exist for a budget, and its attendant control systems, to be effective.
Problems frequently encountered when using conventional budgets:
They invite “gaming” of the system; They can be inflexible;
They are often imposed from the top – “Top Down”; There is an indirect connection with the company’s strategy; They are used for too many different purposes; They reinforce centralising tendencies in the company; There is a lack of goal congruence between corporate, divisional and individual goals
ExPress Notes ACCA F5 Performance Management
Page | 23 © 2010 This material is the copyright of the ExP Group. Individuals may reproduce this material if it is for their own private use. It is illegal for any individuals to reproduce this for commercial use or for companies to reproduce this
material partially and/or in full by any means, be it printed, photocopied, on electronic devices or any other means of reproduction. All examples presented in these course materials are for information and educational purposes only and
should not be applied to a specific real life situation without prior advice. Given the nature of information presented in these materials, and given that legislation may change at any time, The ExP Group will not be held liable for any information presented in these materials as to its application to any specific cases.
theexpgroup.com
KEY KNOWLEDGE Budgetary Systems / Types of Budgets
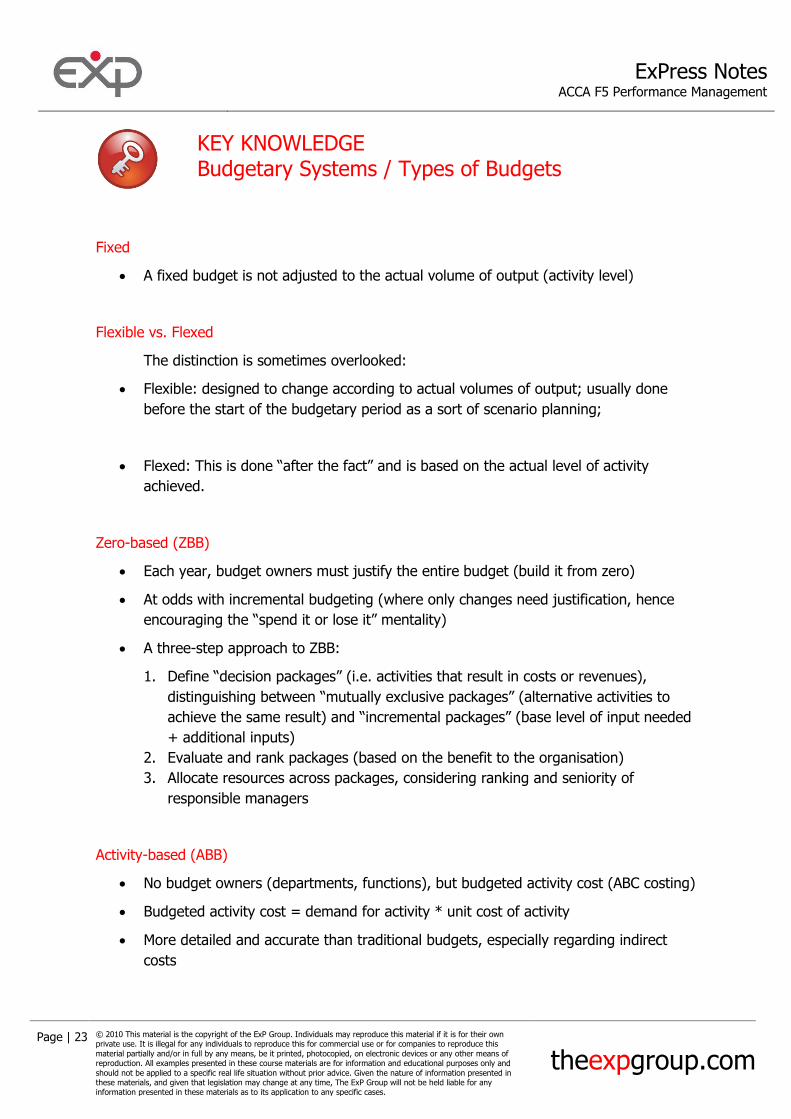
Fixed
A fixed budget is not adjusted to the actual volume of output (activity level)
Flexible vs. Flexed
The distinction is sometimes overlooked:
Flexible: designed to change according to actual volumes of output; usually done
before the start of the budgetary period as a sort of scenario planning;
Flexed: This is done “after the fact” and is based on the actual level of activity
achieved.
Zero-based (ZBB)
Each year, budget owners must justify the entire budget (build it from zero)
At odds with incremental budgeting (where only changes need justification, hence
encouraging the “spend it or lose it” mentality)
A three-step approach to ZBB:
1. Define “decision packages” (i.e. activities that result in costs or revenues),
distinguishing between “mutually exclusive packages” (alternative activities to
achieve the same result) and “incremental packages” (base level of input needed
+ additional inputs)
2. Evaluate and rank packages (based on the benefit to the organisation)
3. Allocate resources across packages, considering ranking and seniority of
responsible managers
Activity-based (ABB)
No budget owners (departments, functions), but budgeted activity cost (ABC costing)
Budgeted activity cost = demand for activity * unit cost of activity
More detailed and accurate than traditional budgets, especially regarding indirect
costs

ExPress Notes ACCA F5 Performance Management
Page | 24 © 2010 This material is the copyright of the ExP Group. Individuals may reproduce this material if it is for their own private use. It is illegal for any individuals to reproduce this for commercial use or for companies to reproduce this
material partially and/or in full by any means, be it printed, photocopied, on electronic devices or any other means of reproduction. All examples presented in these course materials are for information and educational purposes only and
should not be applied to a specific real life situation without prior advice. Given the nature of information presented in these materials, and given that legislation may change at any time, The ExP Group will not be held liable for any information presented in these materials as to its application to any specific cases.
theexpgroup.com
Incremental Such budgets are based on what went on during the period before. Typically, this approach results in modest changes and adjustments to the earlier budget. At worst, they retain and perpetuate inefficiencies and old assumptions. This might be termed the “lazy man’s budget”.
KEY KNOWLEDGE Quantitative Analysis in Budgeting
The High-Low method and regression analysis have been covered in F2. Learning Curves Learning curve effects can be applied to variance analysis, as they allow standards to be adapted to a dynamic situation, i.e. one where the time to produce units declines with the increase in output.
EXAMPLE
A product requires 20 hrs of labour per unit at a cost of $6 per hr. A traditional labour standard would expect 4 units to be produced in 80 hrs at a labour cost of $480. If a 90% learning curve effect applies, then one would expect the 4 units to be completed in less time. How long will they require? Utilizing the formula: y = axb Where: y = cumulative time required per unit a = time to produce the first unit (in the example above = 20) x = cumulative number of units produced ( = 4 units) b = log r/log2 r = learning curve ( = 90%)
ExPress Notes ACCA F5 Performance Management
Page | 25 © 2010 This material is the copyright of the ExP Group. Individuals may reproduce this material if it is for their own private use. It is illegal for any individuals to reproduce this for commercial use or for companies to reproduce this
material partially and/or in full by any means, be it printed, photocopied, on electronic devices or any other means of reproduction. All examples presented in these course materials are for information and educational purposes only and
should not be applied to a specific real life situation without prior advice. Given the nature of information presented in these materials, and given that legislation may change at any time, The ExP Group will not be held liable for any information presented in these materials as to its application to any specific cases.
theexpgroup.com
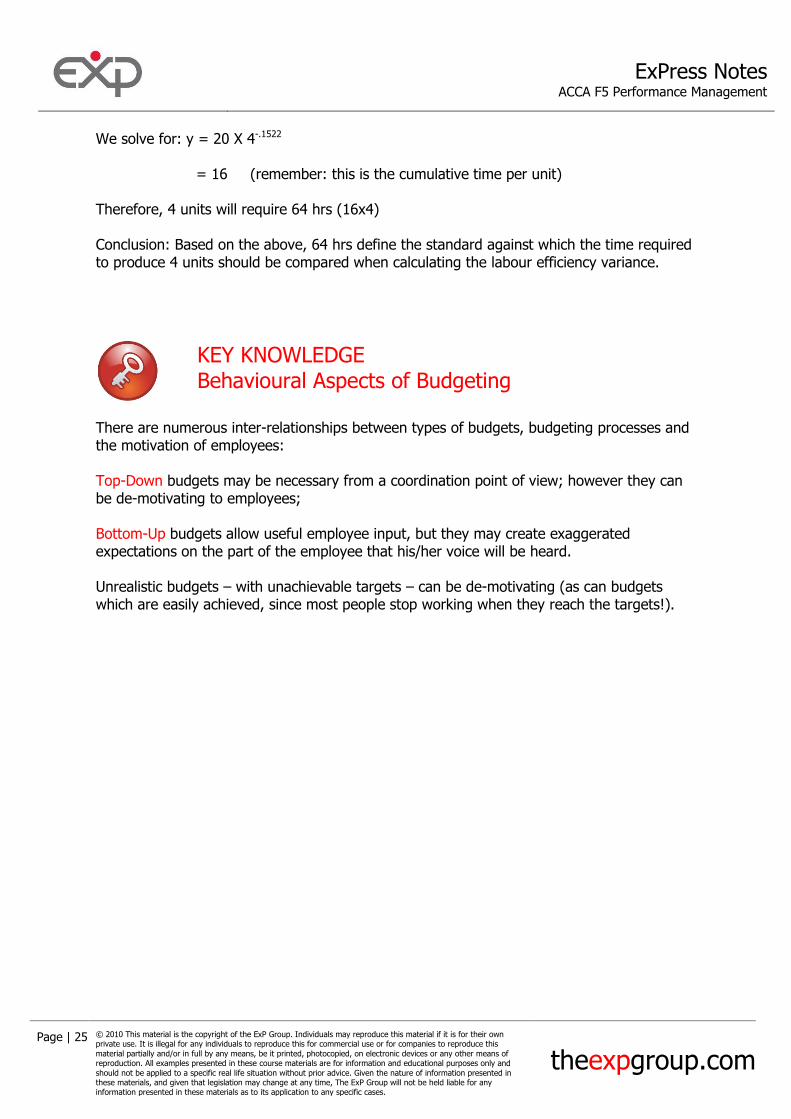
We solve for: y = 20 X 4-.1522 = 16 (remember: this is the cumulative time per unit) Therefore, 4 units will require 64 hrs (16x4) Conclusion: Based on the above, 64 hrs define the standard against which the time required to produce 4 units should be compared when calculating the labour efficiency variance.
KEY KNOWLEDGE Behavioural Aspects of Budgeting
There are numerous inter-relationships between types of budgets, budgeting processes and the motivation of employees: Top-Down budgets may be necessary from a coordination point of view; however they can be de-motivating to employees; Bottom-Up budgets allow useful employee input, but they may create exaggerated expectations on the part of the employee that his/her voice will be heard. Unrealistic budgets – with unachievable targets – can be de-motivating (as can budgets which are easily achieved, since most people stop working when they reach the targets!).

ExPress Notes ACCA F5 Performance Management
Page | 26 © 2010 This material is the copyright of the ExP Group. Individuals may reproduce this material if it is for their own private use. It is illegal for any individuals to reproduce this for commercial use or for companies to reproduce this
material partially and/or in full by any means, be it printed, photocopied, on electronic devices or any other means of reproduction. All examples presented in these course materials are for information and educational purposes only and
should not be applied to a specific real life situation without prior advice. Given the nature of information presented in these materials, and given that legislation may change at any time, The ExP Group will not be held liable for any information presented in these materials as to its application to any specific cases.
theexpgroup.com
Chapter 7
Budgeting and Standard Costing #1
START The Big Picture
Standard costs are useful in that they assist the budgeting and planning process before an activity commences, as well as the analysis of actual costs (including variance analysis) as the activity proceeds.
KEY KNOWLEDGE Basic Variances and Operating Statements
Variances Variance analysis is the process by which the differences between actual and budgeted (standard) results are quantified and examined. Variances can either be favorable (F) or adverse (A).

ExPress Notes ACCA F5 Performance Management
Page | 27 © 2010 This material is the copyright of the ExP Group. Individuals may reproduce this material if it is for their own private use. It is illegal for any individuals to reproduce this for commercial use or for companies to reproduce this
material partially and/or in full by any means, be it printed, photocopied, on electronic devices or any other means of reproduction. All examples presented in these course materials are for information and educational purposes only and
should not be applied to a specific real life situation without prior advice. Given the nature of information presented in these materials, and given that legislation may change at any time, The ExP Group will not be held liable for any information presented in these materials as to its application to any specific cases.
theexpgroup.com
EXAMPLE
The following is a fully-worked illustration based on the following data:
Cost card (per unit) Materials (5kgs x $9 per kg) 45 Labour (3hrs x $6 per hr) 18 Variable O/Hs (3 hrs x $3 per hr) 9 Fixed O/Hs (3 hrs x $5 per hr) 15 87
Budget Production: 1,100 units Sales: 1,000 units Sales Price: $120 / unit Actual results Production: 1,000 units Sales: 950 units Materials: 4,900 kg, $45,025 Labour: 3,100 hrs, $19,050 Variable O/Hs: $9,250 Fixed O/Hs: $17,000 Sales price: $115 / unit
Variances analysis is best performed by asking a series of parallel questions in a systematic way:
Material variances
(i) Material price variance
Materials used (4,900 kg) should have cost @ $9 44,100 Materials (4,900 kg) did cost 45,025
Materials price variance $925 (A)
ExPress Notes ACCA F5 Performance Management
Page | 28 © 2010 This material is the copyright of the ExP Group. Individuals may reproduce this material if it is for their own private use. It is illegal for any individuals to reproduce this for commercial use or for companies to reproduce this
material partially and/or in full by any means, be it printed, photocopied, on electronic devices or any other means of reproduction. All examples presented in these course materials are for information and educational purposes only and
should not be applied to a specific real life situation without prior advice. Given the nature of information presented in these materials, and given that legislation may change at any time, The ExP Group will not be held liable for any information presented in these materials as to its application to any specific cases.
theexpgroup.com
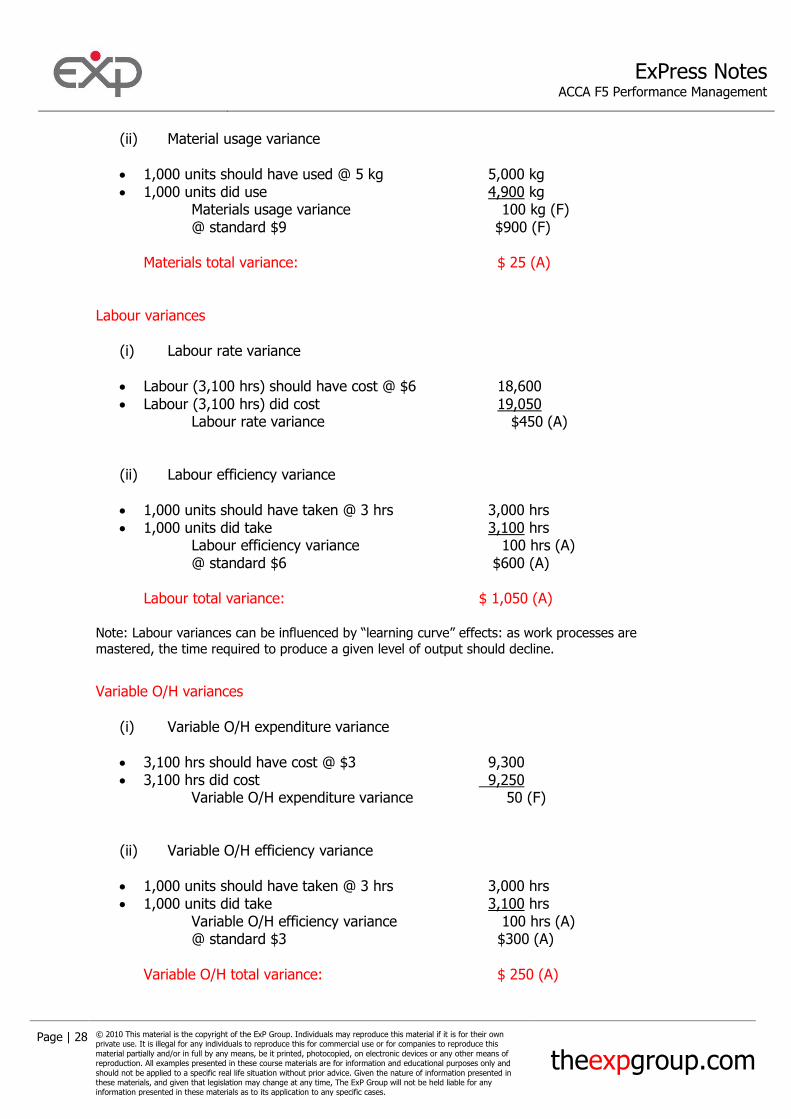
(ii) Material usage variance
1,000 units should have used @ 5 kg 5,000 kg 1,000 units did use 4,900 kg
Materials usage variance 100 kg (F) @ standard $9 $900 (F) Materials total variance: $ 25 (A) Labour variances
(i) Labour rate variance
Labour (3,100 hrs) should have cost @ $6 18,600
Labour (3,100 hrs) did cost 19,050 Labour rate variance $450 (A)
(ii) Labour efficiency variance
1,000 units should have taken @ 3 hrs 3,000 hrs 1,000 units did take 3,100 hrs
Labour efficiency variance 100 hrs (A) @ standard $6 $600 (A) Labour total variance: $ 1,050 (A) Note: Labour variances can be influenced by “learning curve” effects: as work processes are
mastered, the time required to produce a given level of output should decline.
Variable O/H variances
(i) Variable O/H expenditure variance
3,100 hrs should have cost @ $3 9,300 3,100 hrs did cost 9,250
Variable O/H expenditure variance 50 (F)
(ii) Variable O/H efficiency variance
1,000 units should have taken @ 3 hrs 3,000 hrs 1,000 units did take 3,100 hrs
Variable O/H efficiency variance 100 hrs (A) @ standard $3 $300 (A) Variable O/H total variance: $ 250 (A)

ExPress Notes ACCA F5 Performance Management
Page | 29 © 2010 This material is the copyright of the ExP Group. Individuals may reproduce this material if it is for their own private use. It is illegal for any individuals to reproduce this for commercial use or for companies to reproduce this
material partially and/or in full by any means, be it printed, photocopied, on electronic devices or any other means of reproduction. All examples presented in these course materials are for information and educational purposes only and
should not be applied to a specific real life situation without prior advice. Given the nature of information presented in these materials, and given that legislation may change at any time, The ExP Group will not be held liable for any information presented in these materials as to its application to any specific cases.
theexpgroup.com
Fixed O/H variances Fixed O/H total variance
Overhead actually incurred $17,000 Overhead absorbed (1,000 units x $15) $15,000
Fixed O/H total variance $ 2,000 (A) This can be broken down into two components:
(i) Fixed O/H expenditure variance
Budgeted O/H should have cost (1,100 units x $15) 16,500 Actual O/H cost 17,000
Fixed O/H expenditure variance $500 (A)
(ii) Fixed O/H volume variance
Budgeted production 1,100 units Actual production 1,000 units
Fixed O/H volume variance 100 units (A) @ standard $15 $1,500 (A) Sales volume variance The absorption costing system calculates sales volume variances as follows:
Budgeted sales volume 1,000 Actual sales volume 950
Sales volume variance 50 (A) @ standard margin ($120-$87) $1,650 (A) Sales price variance
950 units should have sold @$120 114,000 Actual revenues (950 units x $115) 109,250
Sales price variance 4,750 (A)

ExPress Notes ACCA F5 Performance Management
Page | 30 © 2010 This material is the copyright of the ExP Group. Individuals may reproduce this material if it is for their own private use. It is illegal for any individuals to reproduce this for commercial use or for companies to reproduce this
material partially and/or in full by any means, be it printed, photocopied, on electronic devices or any other means of reproduction. All examples presented in these course materials are for information and educational purposes only and
should not be applied to a specific real life situation without prior advice. Given the nature of information presented in these materials, and given that legislation may change at any time, The ExP Group will not be held liable for any information presented in these materials as to its application to any specific cases.
theexpgroup.com
Operating statement A reconciliation between profit budgeted (absorption costing) and that realized follows:
Budgeted profit 33,000 Sales volume variance 1,650 (A) Sales price variance 4,750 (A) 26,600 Cost variances: Materials F A Price 925 Usage 900 Labour Rate 450 Efficiency 600 Variable Expenditure 50 Efficiency 300 Fixed Expenditure 500 Volume 1,500 950 4,275 3,325 (A)
Actual profit 23,275
Note: Closing inventory is valued at standard cost

ExPress Notes ACCA F5 Performance Management
Page | 31 © 2010 This material is the copyright of the ExP Group. Individuals may reproduce this material if it is for their own private use. It is illegal for any individuals to reproduce this for commercial use or for companies to reproduce this
material partially and/or in full by any means, be it printed, photocopied, on electronic devices or any other means of reproduction. All examples presented in these course materials are for information and educational purposes only and
should not be applied to a specific real life situation without prior advice. Given the nature of information presented in these materials, and given that legislation may change at any time, The ExP Group will not be held liable for any information presented in these materials as to its application to any specific cases.
theexpgroup.com
Marginal costing
A marginal approach to costing focuses on the variable (marginal) costs generated in a
business and considers fixed costs as period costs. This allows the company to be able to
quantify the amount by which its costs rise, if it produces/sells an additional unit of output.
Based on the data above, an Operating Statement based on Marginal costing follows:
Budgeted contribution 48,000 Sales volume variance 2,400 (A) Sales price variance 4,750 (A) 40,850 Cost variances: Materials F A Price 925 Usage 900 Labour Rate 450 Efficiency 600 Variable Expenditure 50 Efficiency 300 950 2,275 1,325 (A) Actual contribution 39,525 Fixed O/Hs Budgeted 16,500 Fixed O/Hs Expenditure variance 500 (17,000) Actual profit 22,525
Absorption costing and Marginal costing Operating Statements compared
When preparing the Operating Statements, note that Marginal Costing:
Starts with standard contribution (not profit); and
Recognizes only Fixed O/H expenditure variance
Variance analysis can also be applied to the Activity-Based Costing (ABC) system.
ExPress Notes ACCA F5 Performance Management
Page | 32 © 2010 This material is the copyright of the ExP Group. Individuals may reproduce this material if it is for their own private use. It is illegal for any individuals to reproduce this for commercial use or for companies to reproduce this
material partially and/or in full by any means, be it printed, photocopied, on electronic devices or any other means of reproduction. All examples presented in these course materials are for information and educational purposes only and
should not be applied to a specific real life situation without prior advice. Given the nature of information presented in these materials, and given that legislation may change at any time, The ExP Group will not be held liable for any information presented in these materials as to its application to any specific cases.
theexpgroup.com
Chapter 8
Budgeting and Standard Costing #2
KEY KNOWLEDGE Mix and Yield Variance
Mix and yield variance When materials are combined in the production process in standard proportions, with the possibility of substituting one for the other, then the materials usage variance can be broken down into two further measures: Mix: This examines the (monetary) impact of altering the proportions of the two materials. Yield: This focuses on the total amount of inputs to produce the output achieved. The sum of the mix and yield variances is equal to the materials usage variance.
EXAMPLE
One unit of product requires the following standard inputs: $ Material X: 5 kg @ $8 40 Material Y: 10kg @ $3 30 70
ExPress Notes ACCA F5 Performance Management
Page | 33 © 2010 This material is the copyright of the ExP Group. Individuals may reproduce this material if it is for their own private use. It is illegal for any individuals to reproduce this for commercial use or for companies to reproduce this
material partially and/or in full by any means, be it printed, photocopied, on electronic devices or any other means of reproduction. All examples presented in these course materials are for information and educational purposes only and
should not be applied to a specific real life situation without prior advice. Given the nature of information presented in these materials, and given that legislation may change at any time, The ExP Group will not be held liable for any information presented in these materials as to its application to any specific cases.
theexpgroup.com
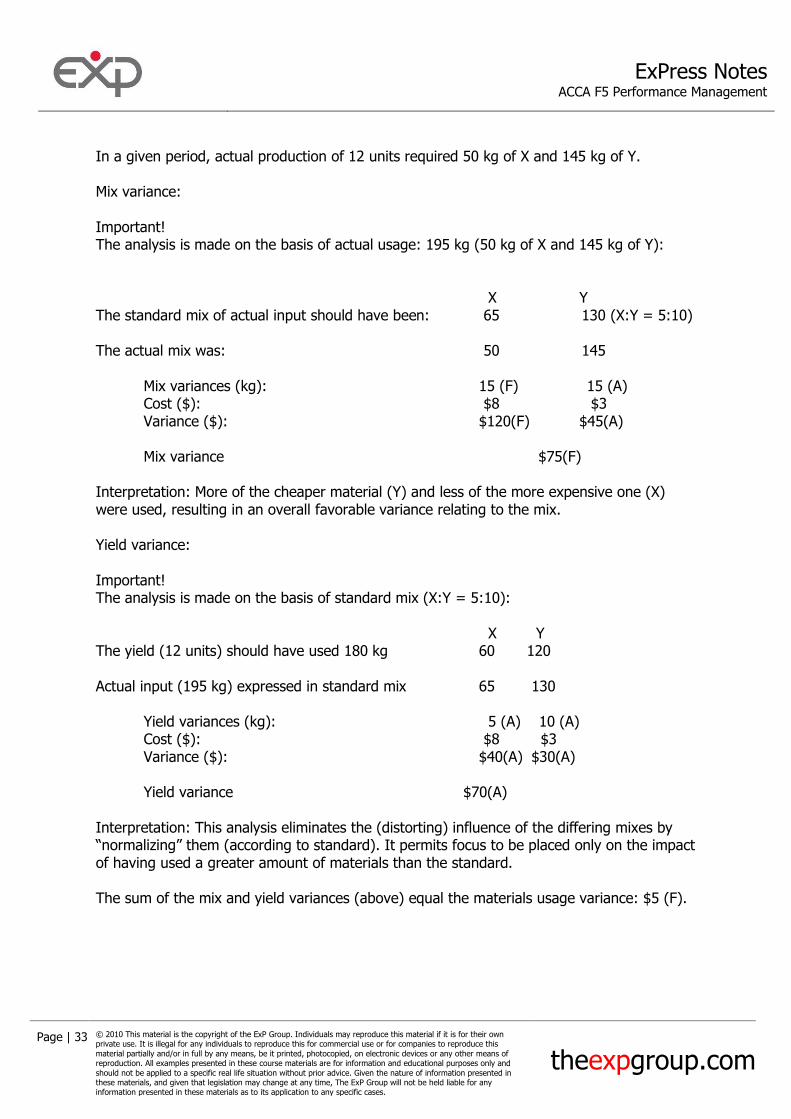
In a given period, actual production of 12 units required 50 kg of X and 145 kg of Y. Mix variance: Important! The analysis is made on the basis of actual usage: 195 kg (50 kg of X and 145 kg of Y): X Y The standard mix of actual input should have been: 65 130 (X:Y = 5:10) The actual mix was: 50 145 Mix variances (kg): 15 (F) 15 (A) Cost ($): $8 $3 Variance ($): $120(F) $45(A) Mix variance $75(F) Interpretation: More of the cheaper material (Y) and less of the more expensive one (X) were used, resulting in an overall favorable variance relating to the mix. Yield variance: Important! The analysis is made on the basis of standard mix (X:Y = 5:10): X Y The yield (12 units) should have used 180 kg 60 120 Actual input (195 kg) expressed in standard mix 65 130 Yield variances (kg): 5 (A) 10 (A) Cost ($): $8 $3 Variance ($): $40(A) $30(A) Yield variance $70(A) Interpretation: This analysis eliminates the (distorting) influence of the differing mixes by “normalizing” them (according to standard). It permits focus to be placed only on the impact of having used a greater amount of materials than the standard. The sum of the mix and yield variances (above) equal the materials usage variance: $5 (F).
ExPress Notes ACCA F5 Performance Management
Page | 34 © 2010 This material is the copyright of the ExP Group. Individuals may reproduce this material if it is for their own private use. It is illegal for any individuals to reproduce this for commercial use or for companies to reproduce this
material partially and/or in full by any means, be it printed, photocopied, on electronic devices or any other means of reproduction. All examples presented in these course materials are for information and educational purposes only and
should not be applied to a specific real life situation without prior advice. Given the nature of information presented in these materials, and given that legislation may change at any time, The ExP Group will not be held liable for any information presented in these materials as to its application to any specific cases.
theexpgroup.com
Note: Some prefer an alternative approach to calculating the yield variance.
1) The actual usage (195 kg) should, according to the standard, produce 13 units (195/15 = 13)
2) The actual number of units produced: 12 units 3) The difference of 1 unit (13-12) is adverse and valued at standard cost: $70 (A).
KEY KNOWLEDGE Planning and Operational Variances
Due to changing market and technical circumstances, standards may become outdated. In such cases, it may be necessary to alter a standard, even during a budget period already in progress. Planning and operational variances capture these changes in two steps: Planning variance: Compares results based on the revised standard compared to the initial standard. The result is usually considered to be outside the area of control of management. Operational variance: Compares actual results with the budget based on the revised standard. This is often considered to be within the control of management. The distinction above between “controllable” and “uncontrollable” factors is critical insofar as it relates to the idea of “responsibility accounting”, i.e. expecting people who have delegated authority to take responsibility for decisions within their area of control.
KEY KNOWLEDGE Behavioural Aspects of Standard Costing
Standard costing in the “wrong” environment can be like a duck out of water.
If products are non-standard; or
Standards are changing rapidly (due to technical or market developments); or
Manufacturing processes involve a high degree of automation with little labour input, then standard costing may not be very useful.

ExPress Notes ACCA F5 Performance Management
Page | 35 © 2010 This material is the copyright of the ExP Group. Individuals may reproduce this material if it is for their own private use. It is illegal for any individuals to reproduce this for commercial use or for companies to reproduce this
material partially and/or in full by any means, be it printed, photocopied, on electronic devices or any other means of reproduction. All examples presented in these course materials are for information and educational purposes only and
should not be applied to a specific real life situation without prior advice. Given the nature of information presented in these materials, and given that legislation may change at any time, The ExP Group will not be held liable for any information presented in these materials as to its application to any specific cases.
theexpgroup.com
Chapter 9
Performance Measurement and Control
KEY KNOWLEDGE The scope of performance measurement
Balanced scorecard
The balance scorecard addresses a number of parameters (or “perspectives”) in monitoring
business performance by asking the following questions:
Financial perspective: “To succeed financially how should we appear to our
shareholders?”
Customer perspective: “To achieve our vision how should we appear to our
customers?”
Internal business processes: “To satisfy our shareholders and customers what
business processes must we excel at?”
Learning and growth: “To achieve our vision how will we sustain our ability to
change and improve?”
ExPress Notes ACCA F5 Performance Management
Page | 36 © 2010 This material is the copyright of the ExP Group. Individuals may reproduce this material if it is for their own private use. It is illegal for any individuals to reproduce this for commercial use or for companies to reproduce this
material partially and/or in full by any means, be it printed, photocopied, on electronic devices or any other means of reproduction. All examples presented in these course materials are for information and educational purposes only and
should not be applied to a specific real life situation without prior advice. Given the nature of information presented in these materials, and given that legislation may change at any time, The ExP Group will not be held liable for any information presented in these materials as to its application to any specific cases.
theexpgroup.com
Fitzgerald and Moon
This is another model of performance management.
Qualitative measures Service quality is an area that can be difficult to assess in “objective” terms. Certain actions can be measured numerically and serve as an indication for quality; for example, measuring the turn-around time (in days or minutes) in responding to customer requests: naturally, the quicker (one reacts), the better. To be fully useful, however, such a measure assumes two things: (1) that the action being measured is of value (or relevance) to the customer; and (2) that one has a rule or a benchmark as to what constitutes a maximum acceptable turn-around time (from the client’s point of view). Purely qualitative factors, such as client satisfaction, can be measured by employing a scale; e.g. a scale of 1-5, with 5 = Very satisfied, to 1 = Dissatisfied. (Note: to avoid confusion, it may be better to use the labels without numbers, and to assign numbers when analyzing the results.)
KEY KNOWLEDGE Divisional Performance and Transfer Pricing
There are various bases on which transfer prices can be determined:
Market price
Outlay cost (standard) + opportunity cost to the seller
Outlay cost (actual) + opportunity cost to the seller
Outlay cost + notional mark-up
Production cost (full absorption)
Best bargain (negotiation between divisions)
Divisional performance and internal (transfer) pricing
Divisional objectives may not be aligned with one another or with corporate objectives.

ExPress Notes ACCA F5 Performance Management
Page | 37 © 2010 This material is the copyright of the ExP Group. Individuals may reproduce this material if it is for their own private use. It is illegal for any individuals to reproduce this for commercial use or for companies to reproduce this
material partially and/or in full by any means, be it printed, photocopied, on electronic devices or any other means of reproduction. All examples presented in these course materials are for information and educational purposes only and
should not be applied to a specific real life situation without prior advice. Given the nature of information presented in these materials, and given that legislation may change at any time, The ExP Group will not be held liable for any information presented in these materials as to its application to any specific cases.
theexpgroup.com
Return on Investment (ROI) at the Divisional Level
Earnings can be measured at the divisional level in relation to the financial resources they
use. The ROI measure is very similar to ROCE (return on capital employed) with the only
exception being the use of profit in the formula:
ROI = Net Profit Capital Employed ROI as defined above is commonly used for investment appraisal and for business sector (divisional) performance, whereas ROCE is common at the overall corporate level.
EXAMPLE
A division head with an actual ROI of 20% may be reluctant to accept a project offering a
15% ROI, especially if his bonus is based on ROI achieved.
If the corporate overall ROI target is 12%, then the division head is missing a value-creating
opportunity.
Residual Income (RI)
Convert results into monetary magnitudes:
Residual Income = Divisional EBIT (minus) Imputed interest
Where
Imputed interest = Capital Employed X Capital charge (or cost of capital)
A positive result adds profits to the division beyond the incremental capital cost. An
investment should be accepted if the RI is positive.

ExPress Notes ACCA F5 Performance Management
Page | 38 © 2010 This material is the copyright of the ExP Group. Individuals may reproduce this material if it is for their own private use. It is illegal for any individuals to reproduce this for commercial use or for companies to reproduce this
material partially and/or in full by any means, be it printed, photocopied, on electronic devices or any other means of reproduction. All examples presented in these course materials are for information and educational purposes only and
should not be applied to a specific real life situation without prior advice. Given the nature of information presented in these materials, and given that legislation may change at any time, The ExP Group will not be held liable for any information presented in these materials as to its application to any specific cases.
theexpgroup.com
Drawbacks of RI and ROI
EXAMPLE
A division of a corporation currently generating an ROI of 12% is examining a new project which requires an investment of $4.5m. Cash inflows are expected to be $1.5m p.a. and the cost of capital: 10% ROI and RI computations will be as follows:
Year 1 2 3 4
NBV initial 4500 3375 2250 1125
Net cash inflow 1500 1500 1500 1500
Depreciation -1125 -1125 -1125 -1125
Profit 375 375 375 375
Capital charge(10%) -450 -337.5 -225 -112.5
RI -75 37.5 150 262.5
ROI 8% 11% 17% 33% From both RI and ROI points of view, the project does not look favorable to the division, even if it would be from the corporate point of view. (Eg, at a cost of capital of 10%, the project has a positive net present value). Performance analysis in not for profit organisations and the public sector
Not-for-profit organizations share many similar issues with profit-making firms in terms of careful management of costs and ensuring that organizational objectives are being fulfilled.

ExPress Notes ACCA F5 Performance Management
Page | 39 © 2010 This material is the copyright of the ExP Group. Individuals may reproduce this material if it is for their own private use. It is illegal for any individuals to reproduce this for commercial use or for companies to reproduce this
material partially and/or in full by any means, be it printed, photocopied, on electronic devices or any other means of reproduction. All examples presented in these course materials are for information and educational purposes only and
should not be applied to a specific real life situation without prior advice. Given the nature of information presented in these materials, and given that legislation may change at any time, The ExP Group will not be held liable for any information presented in these materials as to its application to any specific cases.
theexpgroup.com
External considerations and behavioural aspects Performance management systems which are completely internal (introverted) in focus risk
losing touch with the external world. A system of external bench-marking serves to
counteract the tendency of individuals to perform only to a sufficient level rather than to a
superior level.
Organizations that figure out how to motivate and actualize the true potential in people will
win.
(end of ExPress notes)