accelerated data transformation
TRANSCRIPT

SNP I The Data Transformation Company
Analyst & Investor Call
Full Year Results 2020
ACCELERATED DATA TRANSFORMATION

Overview
FINANCIALS
Q1 2021 & OUTLOOK
QUESTIONS & ANSWERS
AGENDA
© 2021 SNP I The Data Transformation Company – www.snpgroup.com

2020 - Main Topics
> Revised sales guidance for the year was basically met (€ 145-170m)
> Software sales increased by 5% while Service went down by -4%
> Q4 2020 project postponements led to a margin guidance miss
> Order Entry 2020 down by -8% to € 184.4m
> 2019 EBIT adjusted by € -3.6m due to impairment of US real estate
> Additional Compliance audits with no findings
> Guidance 2021: € 160m – 180m revenue and 5% - 8% EBIT-margin
> Continued focus on strategic execution and on profitable growth
> Partner business with increasing pipeline
Software Revenue: € 49.9m
+5%
Service Revenue: € 93.9m
-4%
Total Revenue: € 143.8m
-1%
Order Entry: € 184.4m
-8%
© 2021 SNP I The Data Transformation Company – www.snpgroup.com | 3

Revenue 2020 by region (performance view)
| 4
74%
26%
CEU
Software
JAPAC
€ 71.0m(-15%)
75%
25%
72%
28%
37%
63%
67%
33%
64%
36%€ 12.7m(+92%)
€ 14.6m(+7%)
Services
EEMEA
€ 22.6m(+7%)
€ 15.3m(+14%)
€ 7.6m(+1%)
UKI
LATAM
USA
© 2021 SNP I The Data Transformation Company – www.snpgroup.com
Software
Services
Software
Services
Software
Services
Software
Services
Software
Services

Overview Partner Business 2020
| 5
Partner Revenue: € 26.2m
18% of Group Revenue
Partner Order Entry: € 47.6
26% of Group Order Entry
> Worldwide partner business established
> +16 Partners joined our network
> Pipeline increased to ~ € 230m
> More than 500 Partner consultants trained in 2020
> Order Entry is growing faster than revenue
> Clear focus on Partner enablement and support
© 2021 SNP I The Data Transformation Company – www.snpgroup.com | 5

Scenarios: Key business and IT drivers
IT OPTIMIZATION
> Landscape consolidation
> Data harmonization
> Upgrades
> Risk & Compliance
BUSINESS TRANSFORMATION
> Mergers & Acquisitions
> Divestitures
> Restructuring of business units
CLOUD MIGRATION
> SAP RISE
> Microsoft Azure
> AWS Cloud
> Google Cloud
> IBM Cloud
TECHNOLOGY INNOVATION
> SAP HANA® platform
> SAP S/4HANA®
> New cloud solutions
© 2021 SNP I The Data Transformation Company – www.snpgroup.com | 6

Consequences resulting from Business Transformations
> M&A and business reorganisation activities will be
accelerated
> A leading edge technology platform will be key for business
agility
> Cloud environments will become more attractive due to risk
and cost reduction
> An industrialised approach is required to cut costs and
program duration
> Companies will need strategic partners for their
transformation journey
© 2021 SNP I The Data Transformation Company – www.snpgroup.com
Companies will need a
holistic and longterm plan
for data transformation
challenges
| 7

Moving from project to enterprise licenses
PROJECT LICENSE PROGRAM LICENSE ENTERPRISE LICENSE
▪ Scope: clearly defined for one project
▪ Team: „hop on hop off“
▪ Example: carve out of a business unit
▪ Scope: several projects with common
goal/ scenario
▪ Team: some synergies if stable
▪ Example: 3 carve outs
▪ Scope: All activities within one or more
scenarios, timeline and projects unclear
▪ Team: „private factory“ of trusted
resources
▪ Example: All M&A activities in 5 years
Project 1
Licence
Project n Project 1 – 3
Services Licence Services Licence Services Software Services Training
© 2021 SNP I The Data Transformation Company – www.snpgroup.com | 8

The factory approach is keyfor transformation journeys
> Standardized methodology & governance
> Industrialized services
> Intelligent software platform
© 2021 SNP I The Data Transformation Company – www.snpgroup.com
Sustainable and scalable infrastructure for complex,
multiple migration projects with customers & partners
| 9
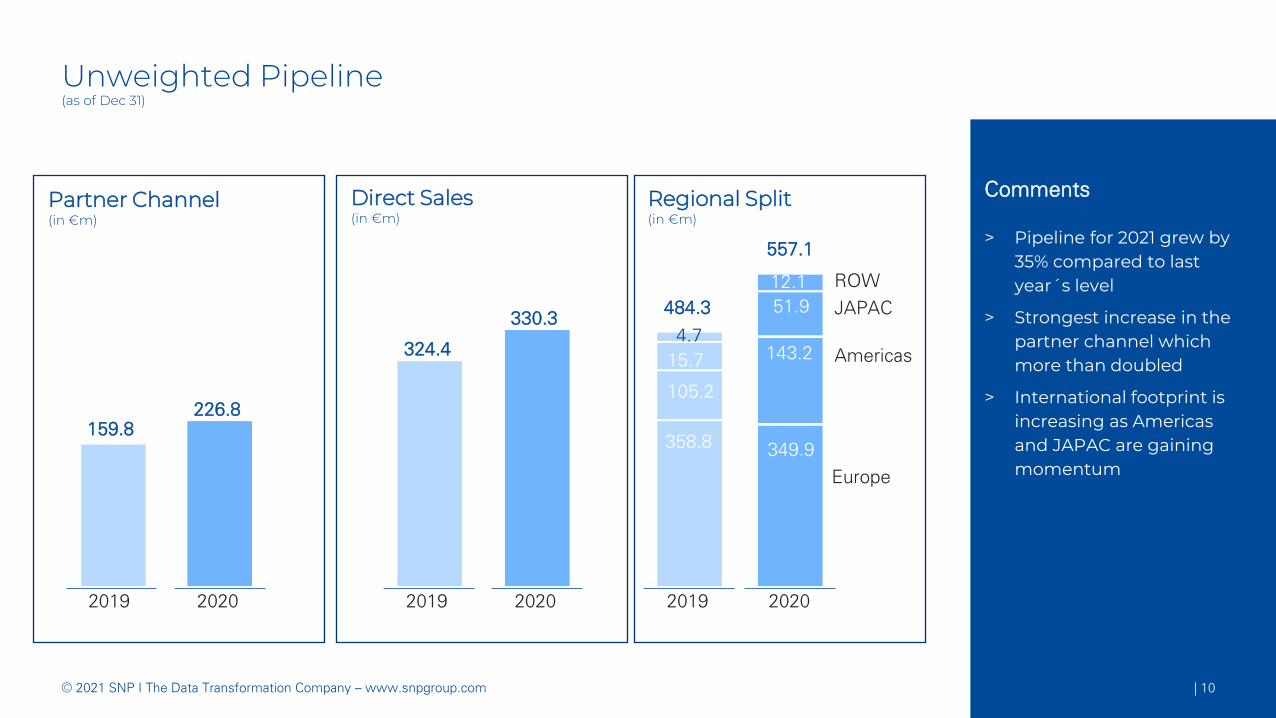
Unweighted Pipeline(as of Dec 31)
© 2021 SNP I The Data Transformation Company – www.snpgroup.com
2019
Partner Channel(in €m)
2020 2019
Direct Sales(in €m)
2020
Regional Split(in €m)
2019 2020
Europe
Americas
JAPAC
ROW
Comments
> Pipeline for 2021 grew by 35% compared to last year´s level
> Strongest increase in the partner channel which more than doubled
> International footprint is increasing as Americas and JAPAC are gaining momentum
| 10
159.8
324.4
330.3
358.8
105.2
15.7
4.7
484.3
349.9
143.2
51.9
12.1
557.1
226.8

Headcount Evolution
© 2021 SNP I The Data Transformation Company – www.snpgroup.com
2019 R&D Admin, Sales
Operations
Students,
Trainees, etc.
2020
1,365
ConsultingSales&
Marketing
1,463
Marketing
&Sales
Admin, Sales Operations,
Students/Trainees, etc.
11%
52%
12%
26%
Consulting
R&D
+39
+9
+49
+1
1,463
| 11
Headcount split by function 2020

Overview
FINANCIALS
Q1 2021 & OUTLOOK
QUESTIONS & ANSWERS
AGENDA
© 2021 SNP I The Data Transformation Company – www.snpgroup.com

Income Statement Q4 / FY 2020Comments
> Revenue decrease in Q4 2020 mainly attributable to Service segment (-6m €) due to postponed projects
> D&A in 2019 with impairment of real estate in the US, technically shown in Q4 2019 (-3.6m €)
> Slight decrease in Revenue and Gross profit in 2020
> Increase in personal expenses as we are prepared for additional growth (+90 FTE in sales and R&D)
> Higher PEX partially compensated by lower other expenses (mostly travel) but include one-time effects of around 4m € (Non-IFRS).
| 13
(in €m)
Revenue
Gross profit
Personal expenses
Other income/expenses
EBITDA
EBIT
EBT
Net income
Q4 2020 Q4 2019 Δ (abs.)
37.5 45.9 -8.4
32.6 41.4 -8.8
-22.5 -23.5 +1.0
-7.0 -9.8 +2.8
3.1 8.1 -5.0
0.5 5.8 -5.4
0.0 5.1 -5.1
-1.3 1.9 -3.2
2020 2019 Δ (abs.)
143.8 145.2 -1.4
126.0 128.2 -2.2
-93.5 -84.6 -8.9
-23.3 -28.5 +5.1
9.2 15.1 -5.9
0.8 3.4 -2.6
-0.7 1.9 -2.6
-1.8 -1.4 -0.4
Gross profit margin
EBITDA margin
EBIT margin
86.8% 90.3% -3.5pp
8.2% 17.7% -9.5pp
1.3% 12.7% -11.4pp
87.6 88.3 -0.7pp
6.4 10.4 -4.0pp
0.6 2.4 -1.8pp
© 2021 SNP I The Data Transformation Company – www.snpgroup.com© 2021 SNP I The Data Transformation Company – www.snpgroup.com | 13
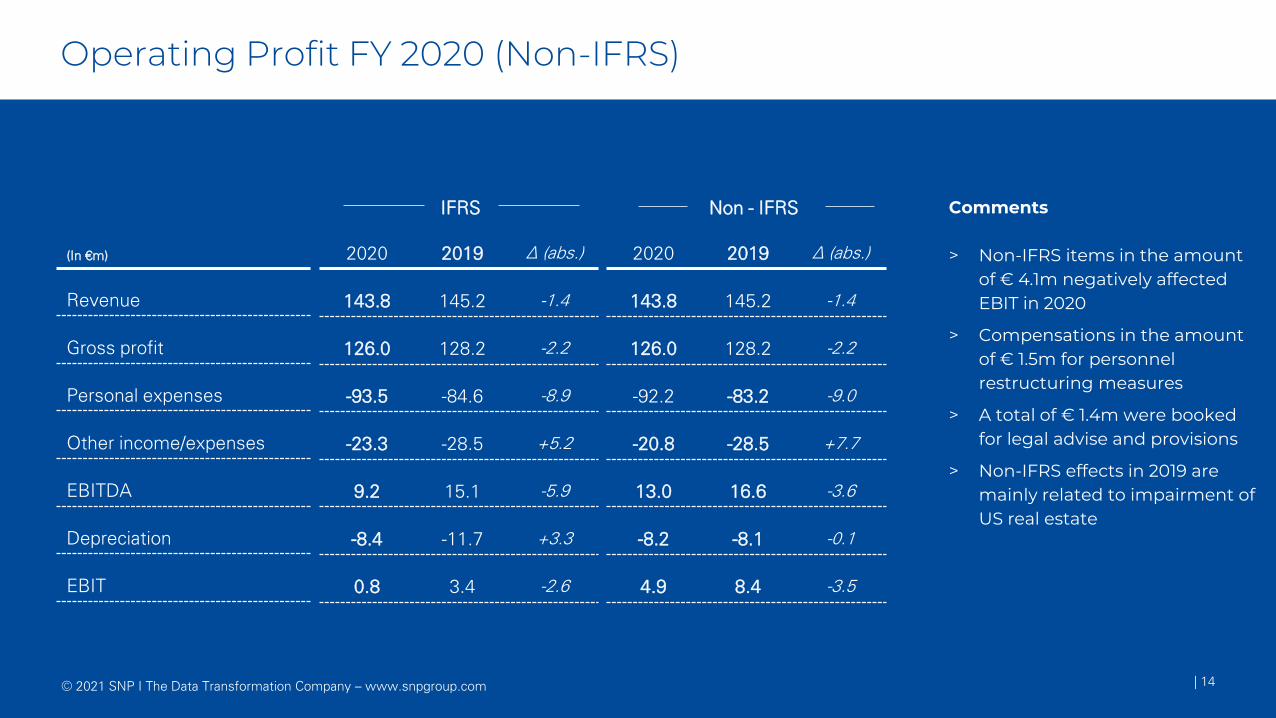
Operating Profit FY 2020 (Non-IFRS)
| 14
(In €m)
Revenue
Gross profit
Personal expenses
Other income/expenses
EBITDA
Depreciation
EBIT
2020 2019 Δ (abs.)
143.8 145.2 -1.4
126.0 128.2 -2.2
-93.5 -84.6 -8.9
-23.3 -28.5 +5.2
9.2 15.1 -5.9
-8.4 -11.7 +3.3
0.8 3.4 -2.6
2020 2019 Δ (abs.)
143.8 145.2 -1.4
126.0 128.2 -2.2
-92.2 -83.2 -9.0
-20.8 -28.5 +7.7
13.0 16.6 -3.6
-8.2 -8.1 -0.1
4.9 8.4 -3.5
IFRS Non - IFRS
© 2021 SNP I The Data Transformation Company – www.snpgroup.com | 14
Comments
> Non-IFRS items in the amount of € 4.1m negatively affected EBIT in 2020
> Compensations in the amount of € 1.5m for personnel restructuring measures
> A total of € 1.4m were booked for legal advise and provisions
> Non-IFRS effects in 2019 are mainly related to impairment of US real estate

Cost ratios*
| 15
6.4%
14.6%
6.5%10.4%
2020
SellingGeneral & Administration
Total Sales: € 143.8m
R & D
(In €m)
Revenue
Research & Development
Selling
Marketing
General & Administration
EBITDA
2020 Q1 20 Q2 20 Q3 20 Q4 20
143.8 34.4 34.3 37.6 37.5
9.2 2.7 2.3 2.0 2.2
21.0 5.0 5.0 5.1 5.9
9.3 2.6 2.2 1.7 2.7
14.9 3.4 4.1 3.8 3.6
9.2 -2.0 1.2 7.0 3.1Marketing
© 2021 SNP I The Data Transformation Company – www.snpgroup.com
* Based on cost-of-sales method that was implemented 2020 – comparable figures not available for 2019
| 15

97.6
93.9
-3.8%
| 16
Segment Service – Revenue and EBIT Q4 / FY 2020
2019 2020 2019* 2020
2.1
3.1
-32.3%
29.1
23.1
-20.6%
Q4 2019 Q4 2020 Q4 2019 Q4 2020
0.6
-72.7%
2.2
© 2021 SNP I The Data Transformation Company – www.snpgroup.com
Revenue(in €m)
EBIT(in €m)
Comments
> After a good H1 2020 effect of corona pandemic led to a drop in utilization in Q3 and Q4 2020
> As a result, 2020 revenue fell by -3.8%
> Due to a calculation error, the Service earnings for 2019 were reported € 0.5m too high and Software earnings were reported € 0.5m too low
> Based on adjusted earnings for 2019 EBIT went down by 32.3%
> Segment EBIT margin at 2.2% for 2020
* adjusted

47.649.9
+4.8%
| 17
Revenue(in €m)
Segment Software – Revenue and EBIT Q4 / FY 2020
2019 2020
9.7
13.6
-28.7%
2019* 2020
16.814.4
-14.1%
Q4 2019 Q4 2020
2.8
-45.1%
5.1
Q4 2019 Q4 2020
© 2021 SNP I The Data Transformation Company – www.snpgroup.com
EBIT(in €m)
Comments
> Q4-on-Q4 Software revenue down as a result of a larger partner contract which did not materialize
> Y-on-Y Software revenue increased despite lower group revenues
> With higher investments in R&D and Sales EBIT decreased Y-on-Y
> Consequently EBIT margin went down to 19.4% in 2020 (previous year: 28.5%)
* adjusted

Revenue by Industry
| 18
IT & Consulting
IT & Consulting
Manufacturing
Consumer Goods & Retail
Pharma & Healthcare
Energy & Utilities
Commodities
Telecom / Media / Technology
Services
Financial Services
2020 2019
35.3 37.1
33.5 40.5
24.3 16.8
10.7 7.9
10.5 10.0
9.0 3.5
8.9 7.9
7.8 15.6
4.4 4.4
24%
23%
17%
7%
7%
6%
6%
5%3%
Manufacturing
Consumer
Goods & Retail
Pharma &
Healthcare
Energy &
Utilities
Commodities
Telecom / Media
/ Technology
ServicesFinancial
Services
(in €m)
© 2021 SNP I The Data Transformation Company – www.snpgroup.com
2020

201.3
184.4
-8.4%
| 19
Order Entry(in m€ )
Order Backlog(in m€)
Order Entry Q4 / FY 2020 and Order Backlog
2019 2020 2019 2020
110.8
92.7
+19.5%
18.8
52.9 44.7
-15.0%
Q4 2019 Q4 2020
Softw
are
Serv
ices
Serv
ices
So
ftware
Softw
are
Serv
ices
© 2021 SNP I The Data Transformation Company – www.snpgroup.com
68.7
115.8
78.1
123.2
11.1
33.6
19.1
33.8
49.3
61.5
39.0
53.7
Comments
> After a strong Q4 2019, Order Entry in Q4 2020 fell short by 15% mainly coming from the software segment as one expected partner contract did not materialize
> Order Entry for the full year 2020 also below previous year
> Both segments contributed to the increase in order backlog which grew by 19.5%
| 19

Order Entry by region (performance view)
| 20
31%
69%
CEU
Software
JAPAC
€ 96.0m(-18.5%)
28%
72%
37%
63%
72%
28%
32%
68%
47%
53%
€ 21.3m(+150%)
€ 13.9m(-29.2%)
Services
EEMEA
€ 26.2m(+11.7%)
€ 18.6m(-14.3%)
€ 8.4m(-18.5%)
UKI
LATAM
USA
© 2021 SNP I The Data Transformation Company – www.snpgroup.com
Software
Services
Software
Services
Software
Services
Software
Services
Software
Services
| 20

Revenue31 Dec 2019
(reported)31 Dec 2020
(reported)
Comments
> New Backlog-Reporting-Policy implemented for 2020 and going forward
> Goal is to increase transparency on the effects from volume and currency changes
> For projects in 2020 the effect for both items was € -11.2m
> Additionally, for projects from previous years an additional effect of € -11.3m was booked
Order Entry Currency
changes
Volume
adjustments
2020
Reconciliation Order Backlog 2020
92.7
184.4 143.8
Adjustments
order backlog
previous years
-5.1-6.1 -11.3
110.8
One-time effect on order backlog
© 2021 SNP I The Data Transformation Company – www.snpgroup.com
(in €m)
| 21

| 22
Balance sheet structure I/II
Assets (in €m)
Cash, cash equivalents and other financial assets
Receivables
Contract assets
Assets held for sale
Other currents assets
Total current assets
Goodwill
Intangible Assets
Right of use
Contract assets
Other non-current assets
Total non-currents assets
Total assets
31/12/2020 31/12/2019
46.3 19.8
25.6 33.3
19.7 21.0
31.4 -
2.9 2.6
126.0 76.7
33.6 54.2
5.4 7.9
17.5 17.9
12.6 2.0
11.6 11.9
80.7 93.8
206.7 170.5
© 2021 SNP I The Data Transformation Company – www.snpgroup.com
Comments
> Cash position increased strongly mainly from the capital raise in July 2020
> Divestment of polish subsidiary is now reflected in assets held for sale
> Goodwill fell accordingly
> Additional € 3m cash are included in assets held for sale
> Non-current contract assets rose on the back of new long-term partnerships closed in 2020
| 22

| 23
Balance sheet structure II/II
Equity & Liabilities (in €m)
Payables
Contract liabilities
Current financial liabilities
Other non-financial liabilities
Liabilities held for sale
Other current liabilities
Total current liabilities
Non-current financial liabilities
Pensions
Other non-current liabilities
Total non-current liabilities
Equity
Total Equity & Liabilities
© 2021 SNP I The Data Transformation Company – www.snpgroup.com
31/12/2020 31/12/2019
4.6 10.2
6.2 6.4
12.8 13.0
18.2 18.7
8.8 -
3.4 1.2
54.0 49.6
59.5 49.8
2.8 2.9
2.7 1.4
65.0 54.0
87.7 66.9
206.7 170.5
Comments
> Liabilities of the polish subsidiary are now reported as held for sale
> Non-current financial liabilities rose with additional credit facilities arranged with KfW
> Net debt position at the end of the year was -25.9m €
> Increase in equity relates to capital raise carried out in July 2020
> Equity ratio went up to 42.4% (from 39.2% the previous year)
| 23

Cash flow Statement Q4 / FY 2020
| 24
(in €m)
Net income
Depreciation
Change in W/C
Change in other items
Operating Cash flow
Investing Cash flow
Repayment of lease liabilities
Free cash flow
W/C ratio
2020 2019 Δ (abs.)
-1.8 -1.4 -0.4
8.4 11.7 -3.3
-2.9 -21.3 +18.4
-1.6 5.9 -7.5
2.0 -5.1 +7.1
-3.2 -8.2 -5.0
-5.2 -6.3 +0.9
-6.4 -19.6 +13.2
18.0% 14.7%
Q4 2020 Q4 2019 Δ (abs.)
-1.0 -1.7 +0.7
2.3 5.9 -3.6
1.1 -6.5 +7.6
-1.2 6.3 -7.5
1.1 4.1 -3.0
-2.7 -0.6 -2.1
-0.7 -1.0 +0.3
-2.3 2.5 -4.8
- -
© 2021 SNP I The Data Transformation Company – www.snpgroup.com
Comments
> Positive operating cash flow both in Q4 and FY 2020
> Cash out from W/C improved in 2020 and is mostly related to additional contract assets
> As SNP is preparing for further growth free cash flow is negative
> W/C ratio increased as additional partners with upfront committed volumes joined our network

INTRODUCTION
FINANCIALS
Q1 2021 & OUTLOOK
QUESTIONS & ANSWERS
AGENDA
© 2021 SNP I The Data Transformation Company – www.snpgroup.com

-3.8%
| 26
Group Revenue(in €m)
Preliminary Figures Q1 2021
Q1 2020 Q1 2021
33.134.4
© 2021 SNP I The Data Transformation Company – www.snpgroup.com
+33.7%
Group EBIT(in €m)
Q1 2020 Q1 2021
-2.6-3.9
X.X%
Q1 2020 Q1 2021
47.7
Order Entry(in €m)
Order Backlog(in €m)
Pipeline(in €m)
52.5
Q1 2020 Q1 2021
106.2X.X
Q1 2020 Q1 2021
473.922.0
30.531.0
16.7
+10.1%
62.1
44.1
133.9
72.3
61.6+26.1%
508.8+7.4%
9.1
25.3
9.8
23.3
So
ftw
are
Se
rvic
e
Se
rvic
eS
oft
ware
Se
rvic
eS
oft
ware

M&A Activities 2021
Revenue 2020 € 23m
EBIT 2020 € 1.8m
Employees ~400
Timeline Latest by end of Q3 2021
Business focusNon-Transformation, SAP
Consulting, Cloud hosting
Strategic rationalFocus on transformation
business
Ownership
49% will remain at SNP
until end of 2023 (Call and
Put option)
Revenue 2020 € 10m
EBIT 2020 ~€ 2.5m
Employees ~140
Timeline Closed March 1, 2021
Business focusGlobal Value Chain,
Transferpricing
Strategic rationalExpand value chain,
Increase recurring revenues
Ownership
25.1% will remain at EXA
founder until 2024 (Put
option) or 2025 (Call option)
SNP Poland (Divestment) EXA AG (Acquisition)
© 2021 SNP I The Data Transformation Company – www.snpgroup.com | 27

Efficiency measures
> Termination of Golf sponsoring (immediate effect)
> Streamlining of local sport sponsoring
> Normalize level of sponsoring activities e.g. culture, politics
> Some savings will be spent with more direct link to SNP business
© 2021 SNP I The Data Transformation Company – www.snpgroup.com | 28
Review of sponsoring
activities
Reduced number of
managing directors
Office space efficiency
(Heidelberg)
Travel expenses
> No replacement of CHRO
> Responsibilities of former CEO are reallocated to existing CEO and CFO
> Termination of office space in second Heidelberg location
> Reallocation of all employees under one roof
> Savings of ~€ 3.8m due to corona restrictions in 2020
> Only 60% are expected to come back as remote work has been proven to be just as
efficient in many cases
Total EBIT effect going forward: € 2 – 3m per annum

| 29
Group Revenue
Software Revenue
Service Revenue
Group EBIT-margin
Group EBIT
Group Order Entry
2020 Actuals
€ 143.8m
€ 49.9m
€ 93.9m
0.6%
€ 0.8m
€ 184.4m
2021 Outlook
€ 160m – 180m
5% - 8%
Outlook 2021
© 2021 SNP I The Data Transformation Company – www.snpgroup.com

Financial Calendar 2021
Publication of the Annual Report 2020Apr 21, 2021
Publication of the Interim Statement Q1 2021Apr 29, 2021
Annual General Meeting 2021Jun 17, 2021
Publication of the Half-Year Financial Report 2021Aug 10, 2021
Publication of the Interim Statement Q3 2021Oct 28, 2021
© 2021 SNP I The Data Transformation Company – www.snpgroup.com | 30

WE ARE HAPPY TO TAKE
YOUR QUESTIONS!
© 2021 SNP I The Data Transformation Company – www.snpgroup.com

Thank you for your time
SNP Schneider-Neureither & Partner SE
Speyerer Str. 4
69121 Heidelberg
Germany
Christoph Marx, Global Head of IR
+49 6221 64 25 – 172
Marcel Wiskow, Director IR
+49 6221 64 25 – 637
© 2021 SNP I The Data Transformation Company – www.snpgroup.com