accelerating change in air traffic control?
TRANSCRIPT
ACCELERATING
CHANGE IN AIR
TRAFFIC CONTROL?
NICOLE ADLER, HEBREW UNIVERSITY
ERAN HANANY, TEL AVIV UNIVERSITY
STEF PROOST, KU LEUVEN
Motivation
• present ATC system in EU is composed of 37 national
providers
• each system charges more or less average cost, hence:
• weak incentives for cost-efficient operation
• slow adaptation of cost saving technologies
• airlines choose flight paths to minimize costs without fully
considering congestion on routes
• could this system be more efficient through changes in
incentive schemes?
• changes in ownership form
• changes in price regulation
• application of new technologies
ACCHANGE: Adler, Hanany & Proost 2
Content
• Modeling approach:
• players: air traffic control providers & airlines
• system versus user optimal
• 2 stage congestion game
• Scenarios:
• base-case: reproduction of equilibria outcome in 2011
• price regulation
• functional air space blocks
• regional forerunners
• technology: SESAR
• Empirical exploration:
• 6 ANSP region in Europe covering 50% of traffic
ACCHANGE: Adler, Hanany & Proost 3
2 stage game
• Stage 1 - ANSPs set charges according to regulatory
rules • Cost recovery
• Profit maximization
• Incentive based price-caps
• Stage 2 - Airlines choose flight paths given
schedules • User optimal: Airlines set flight paths to minimize own costs
• System optimal: EUROCONTROL set flight paths to minimize sum of airline costs
• 3 cost components: operational, congestion & ATC en-route charges
• Option to ‘not fly’ necessary for demand elasticity
ACCHANGE: Adler, Hanany & Proost 4
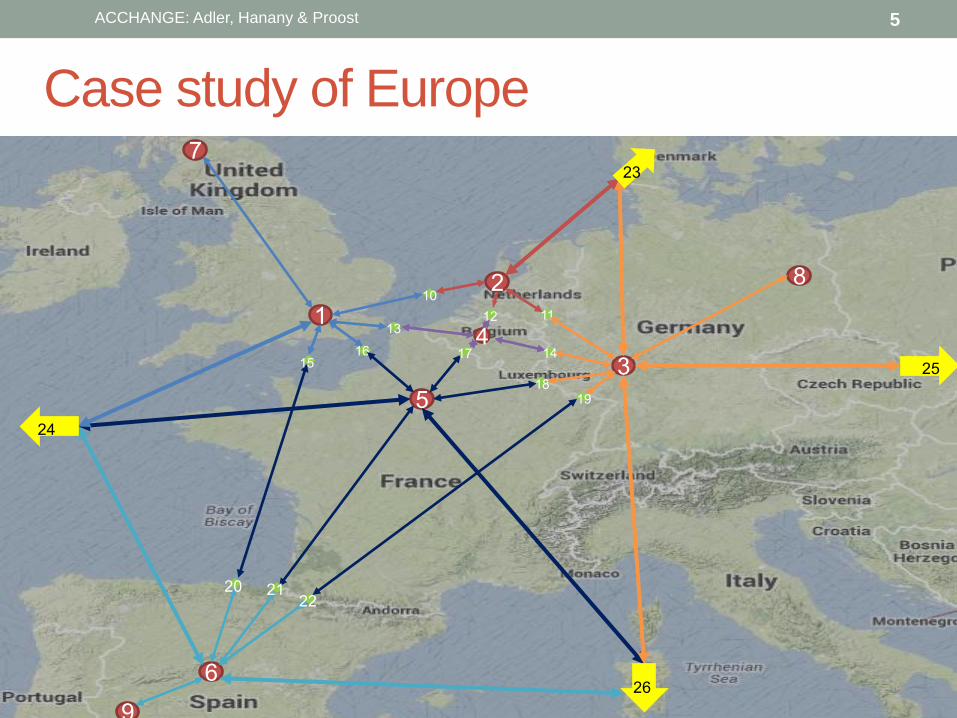
Case study of Europe
ACCHANGE: Adler, Hanany & Proost 5
5
1
3
6
2
4
7
8
9
10
13
16 15
11
14
18
23
24
25
26
12
19
17
21 20 22
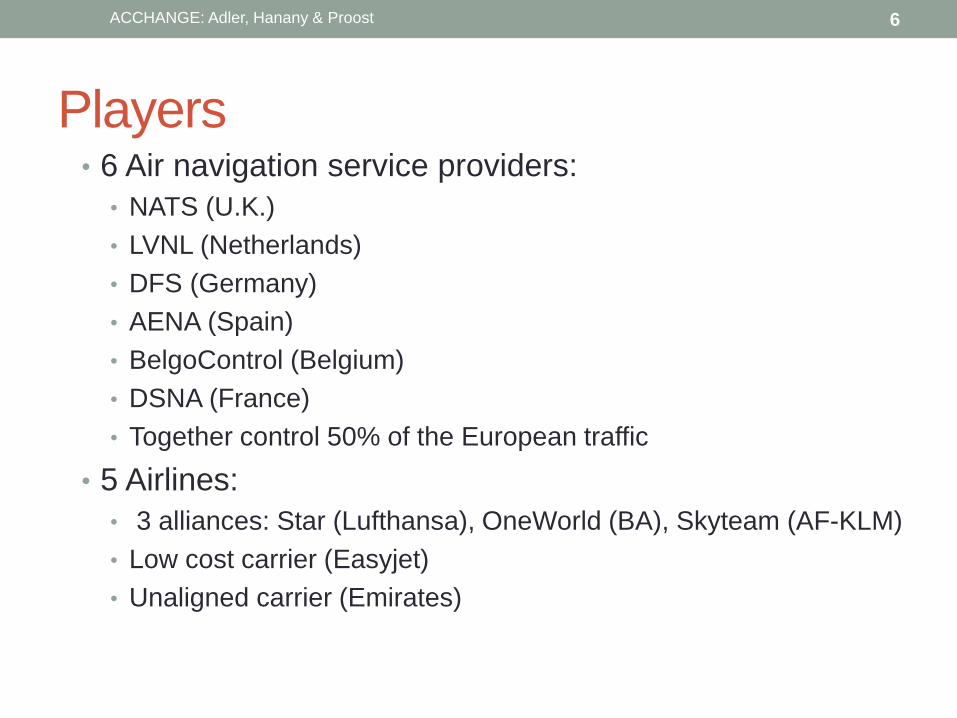
Players • 6 Air navigation service providers:
• NATS (U.K.)
• LVNL (Netherlands)
• DFS (Germany)
• AENA (Spain)
• BelgoControl (Belgium)
• DSNA (France)
• Together control 50% of the European traffic
• 5 Airlines:
• 3 alliances: Star (Lufthansa), OneWorld (BA), Skyteam (AF-KLM)
• Low cost carrier (Easyjet)
• Unaligned carrier (Emirates)
ACCHANGE: Adler, Hanany & Proost 6
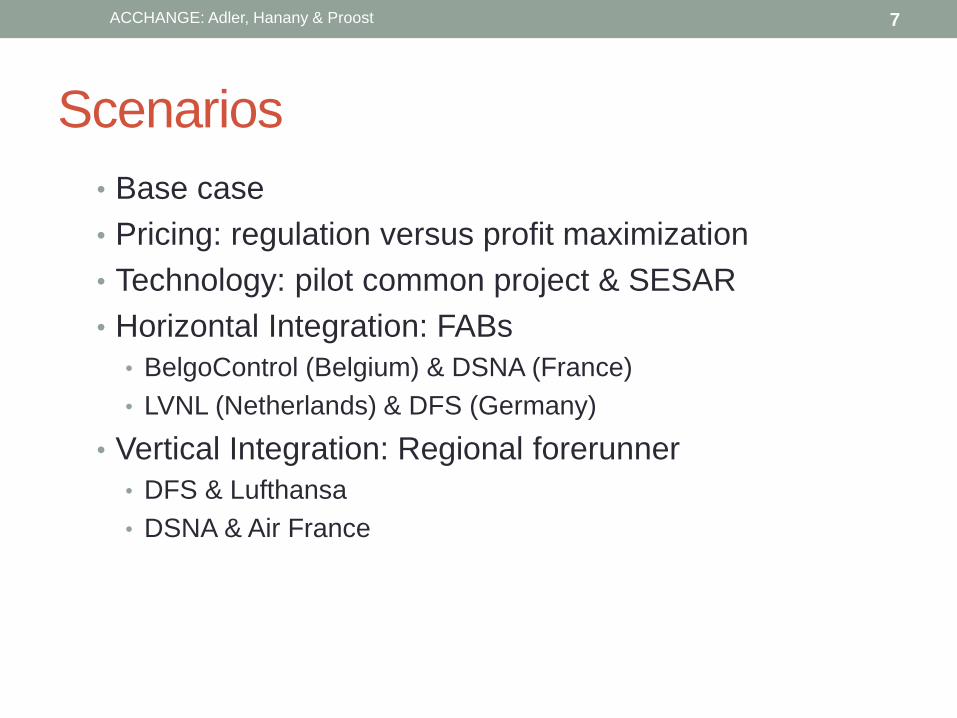
Scenarios
• Base case
• Pricing: regulation versus profit maximization
• Technology: pilot common project & SESAR
• Horizontal Integration: FABs
• BelgoControl (Belgium) & DSNA (France)
• LVNL (Netherlands) & DFS (Germany)
• Vertical Integration: Regional forerunner
• DFS & Lufthansa
• DSNA & Air France
7 ACCHANGE: Adler, Hanany & Proost
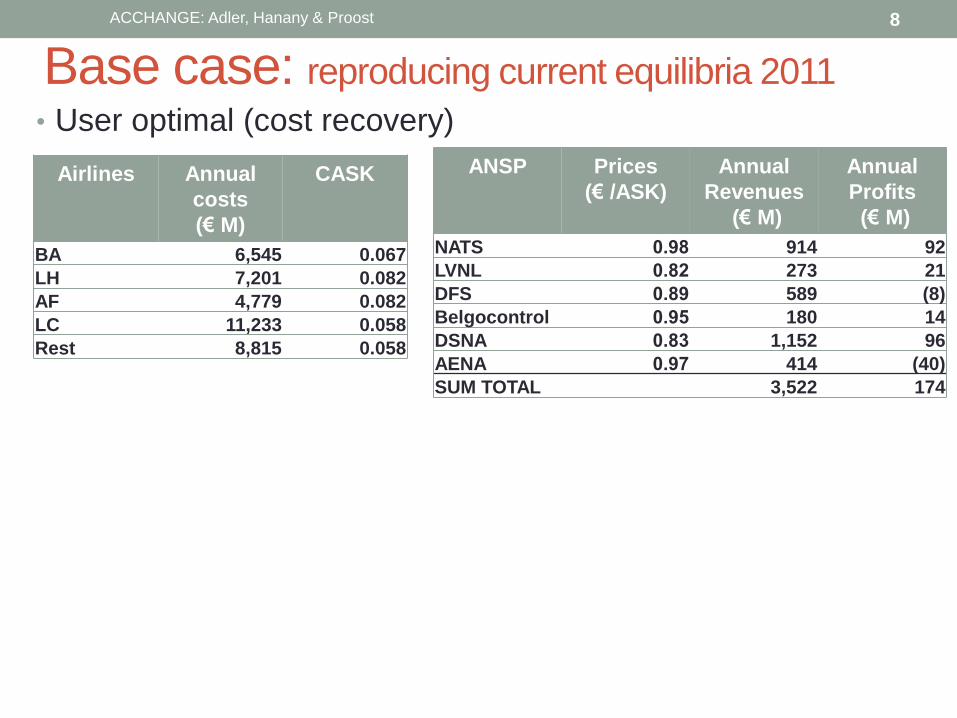
Base case: reproducing current equilibria 2011
• User optimal (cost recovery)
8
CASK Annual
costs
(€ M)
Airlines
0.067 6,545 BA
0.082 7,201 LH
0.082 4,779 AF
0.058 11,233 LC
0.058 8,815 Rest
Annual
Profits
(€ M)
Annual
Revenues
(€ M)
Prices
(€ /ASK)
ANSP
92 914 0.98 NATS
21 273 0.82 LVNL
(8) 589 0.89 DFS
14 180 0.95 Belgocontrol
96 1,152 0.83 DSNA
(40) 414 0.97 AENA
174 3,522 SUM TOTAL
ACCHANGE: Adler, Hanany & Proost
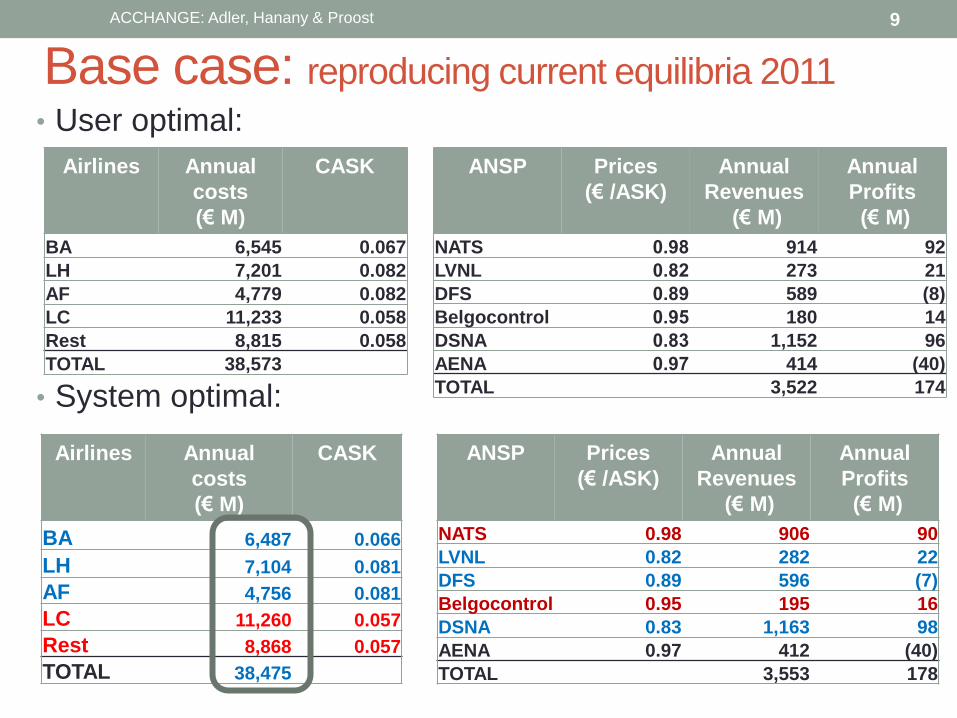
Base case: reproducing current equilibria 2011
• User optimal:
• System optimal:
9
CASK Annual
costs
(€ M)
Airlines
0.067 6,545 BA
0.082 7,201 LH
0.082 4,779 AF
0.058 11,233 LC
0.058 8,815 Rest
38,573 TOTAL
Annual
Profits
(€ M)
Annual
Revenues
(€ M)
Prices
(€ /ASK)
ANSP
92 914 0.98 NATS
21 273 0.82 LVNL
(8) 589 0.89 DFS
14 180 0.95 Belgocontrol
96 1,152 0.83 DSNA
(40) 414 0.97 AENA
174 3,522 TOTAL
ACCHANGE: Adler, Hanany & Proost
CASK Annual
costs
(€ M)
Airlines
0.066 6,487 BA
0.081 7,104 LH
0.081 4,756 AF
0.057 11,260 LC
0.057 8,868 Rest
38,475 TOTAL
Annual
Profits
(€ M)
Annual
Revenues
(€ M)
Prices
(€ /ASK)
ANSP
90 906 0.98 NATS
22 282 0.82 LVNL
(7) 596 0.89 DFS
16 195 0.95 Belgocontrol
98 1,163 0.83 DSNA
(40) 412 0.97 AENA
178 3,553 TOTAL
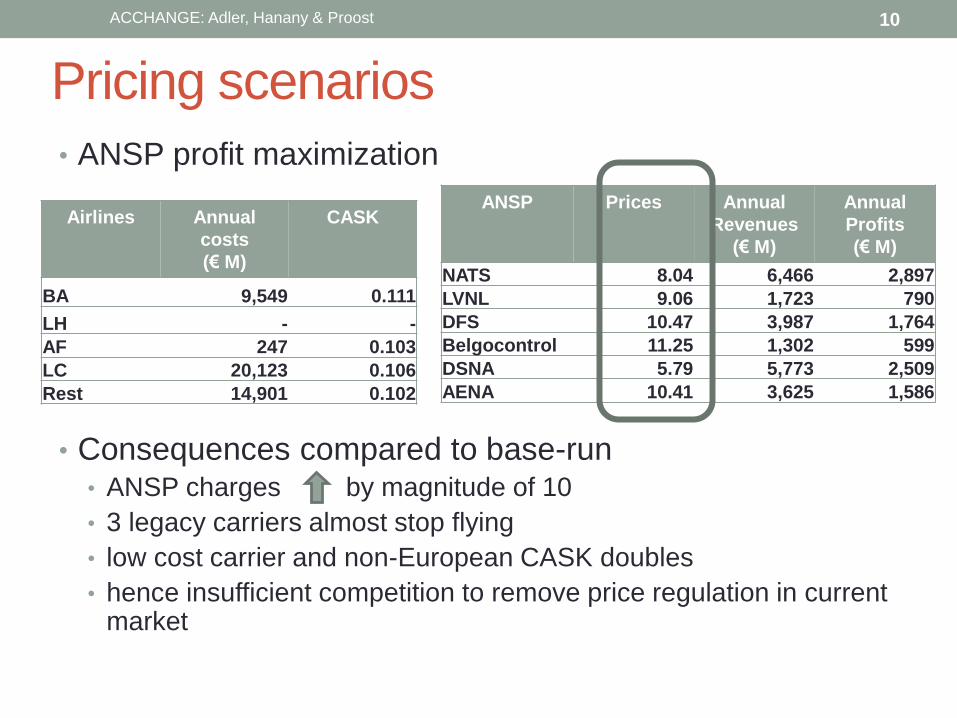
Pricing scenarios
• ANSP profit maximization
• Consequences compared to base-run • ANSP charges by magnitude of 10
• 3 legacy carriers almost stop flying
• low cost carrier and non-European CASK doubles
• hence insufficient competition to remove price regulation in current market
10
CASK Annual
costs
(€ M)
Airlines
0.111 9,549 BA
- - LH
0.103 247 AF
0.106 20,123 LC
0.102 14,901 Rest
Annual
Profits
(€ M)
Annual
Revenues
(€ M)
Prices ANSP
2,897 6,466 8.04 NATS
790 1,723 9.06 LVNL
1,764 3,987 10.47 DFS
599 1,302 11.25 Belgocontrol
2,509 5,773 5.79 DSNA
1,586 3,625 10.41 AENA
ACCHANGE: Adler, Hanany & Proost
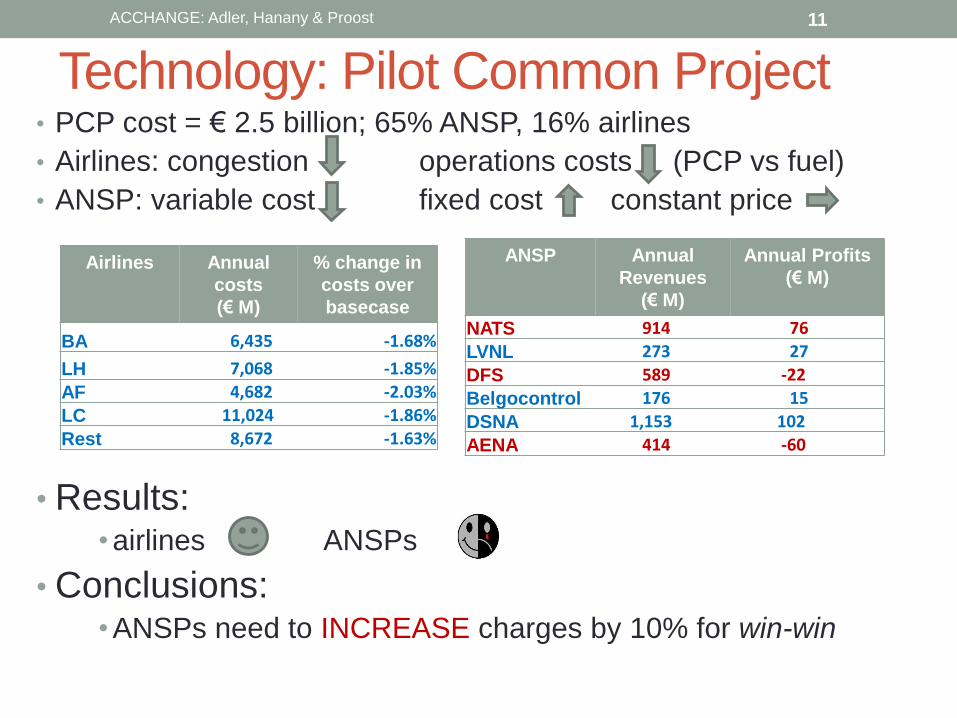
Technology: Pilot Common Project • PCP cost = € 2.5 billion; 65% ANSP, 16% airlines
• Airlines: congestion operations costs (PCP vs fuel)
• ANSP: variable cost fixed cost constant price
• Results: • airlines ANSPs
• Conclusions: • ANSPs need to INCREASE charges by 10% for win-win
11
% change in
costs over
basecase
Annual
costs
(€ M)
Airlines
-1.68% 6,435 BA
-1.85% 7,068 LH
-2.03% 4,682 AF
-1.86% 11,024 LC
-1.63% 8,672 Rest
Annual Profits
(€ M)
Annual
Revenues
(€ M)
ANSP
76 914 NATS
27 273 LVNL
-22 589 DFS
15 176 Belgocontrol
102 1,153 DSNA
-60 414 AENA
ACCHANGE: Adler, Hanany & Proost
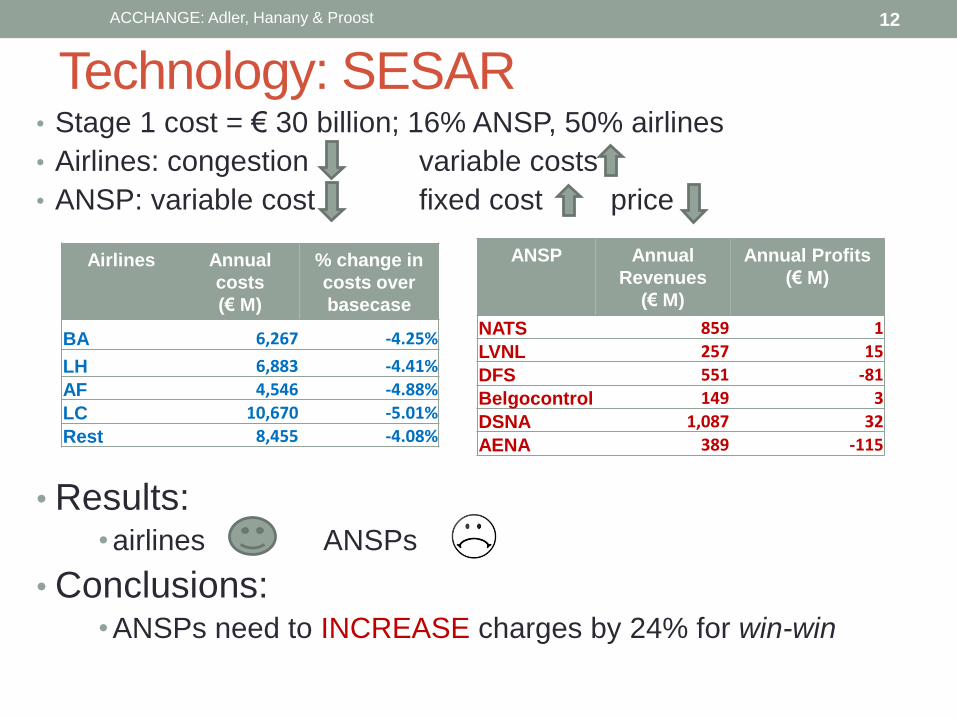
Technology: SESAR • Stage 1 cost = € 30 billion; 16% ANSP, 50% airlines
• Airlines: congestion variable costs
• ANSP: variable cost fixed cost price
• Results: • airlines ANSPs
• Conclusions: • ANSPs need to INCREASE charges by 24% for win-win
12
% change in
costs over
basecase
Annual
costs
(€ M)
Airlines
-4.25% 6,267 BA
-4.41% 6,883 LH
-4.88% 4,546 AF
-5.01% 10,670 LC
-4.08% 8,455 Rest
Annual Profits
(€ M)
Annual
Revenues
(€ M)
ANSP
1 859 NATS
15 257 LVNL
-81 551 DFS
3 149 Belgocontrol
32 1,087 DSNA
-115 389 AENA
ACCHANGE: Adler, Hanany & Proost
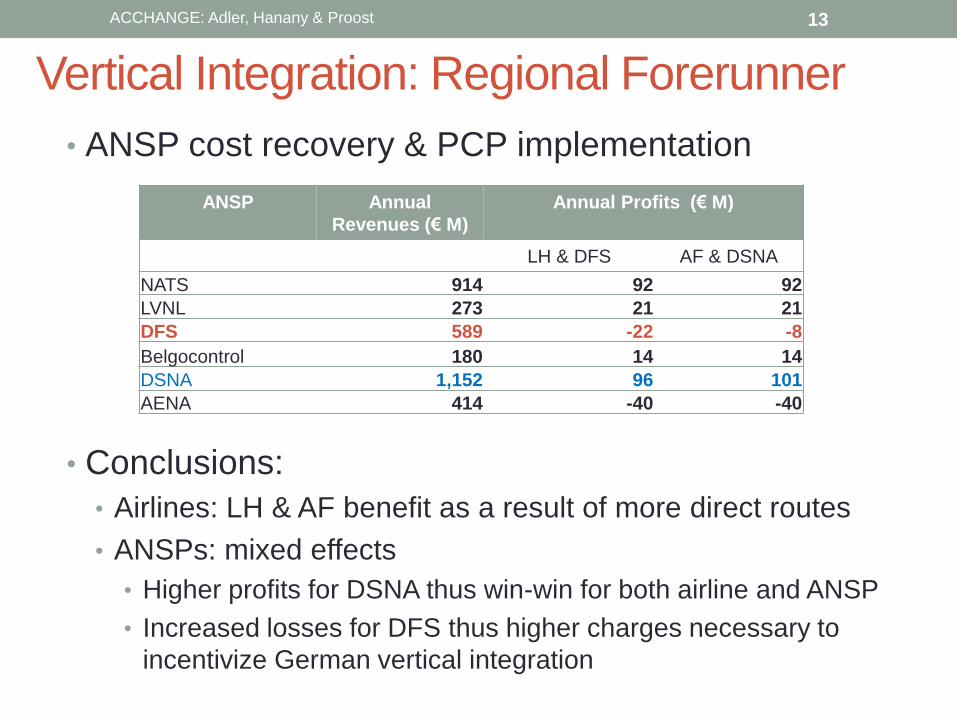
Vertical Integration: Regional Forerunner
• ANSP cost recovery & PCP implementation
• Conclusions:
• Airlines: LH & AF benefit as a result of more direct routes
• ANSPs: mixed effects
• Higher profits for DSNA thus win-win for both airline and ANSP
• Increased losses for DFS thus higher charges necessary to
incentivize German vertical integration
13
Annual Profits (€ M) Annual
Revenues (€ M)
ANSP
AF & DSNA LH & DFS
92 92 914 NATS
21 21 273 LVNL
-8 -22 589 DFS
14 14 180 Belgocontrol
101 96 1,152 DSNA
-40 -40 414 AENA
ACCHANGE: Adler, Hanany & Proost
Summary & Conclusions
• Modeling air traffic control via congestion game enables potential cost-benefit scenario evaluation
• Under user optimal approach: • insufficient competition to ensure ANSPs charge reasonable prices
• Technology • Pilot common project is positive for airlines but unlikely to be employed
without permitting ANSPs to charge higher prices
• SESAR even more unlikely to occur without increased demand and re-balancing of charges &/or subsidies
• Vertical Integration • Regional forerunner approach may be preferable to Functional
Airspace Blocks but dependent on partnership
• Thank you for listening. This is a work in progress and any comments very welcome!
ACCHANGE: Adler, Hanany & Proost 14