accelerating change in the arctic? perspectives from observations and global climate models david...
TRANSCRIPT
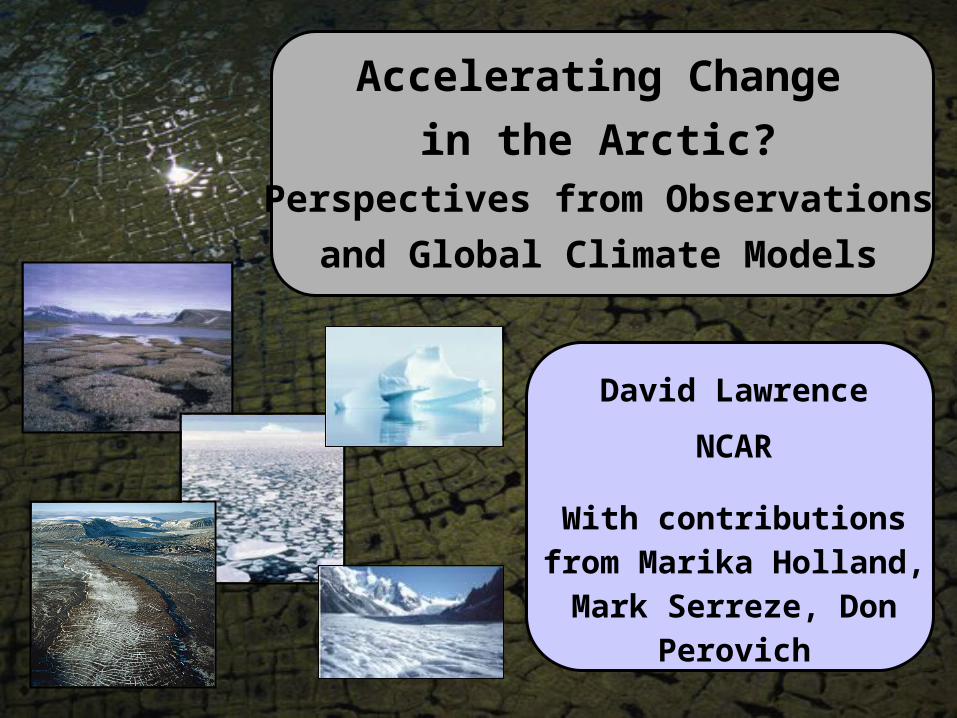
Accelerating Change
in the Arctic?Perspectives from Observations
and Global Climate Models
David Lawrence
NCAR
With contributions from Marika Holland,
Mark Serreze, Don Perovich
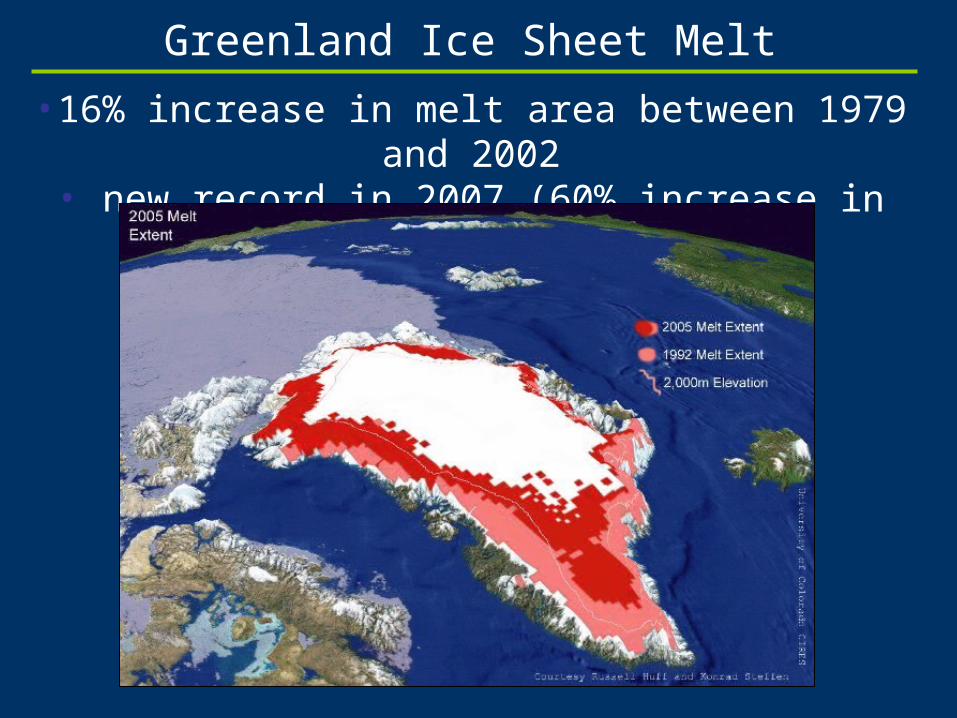
Greenland Ice Sheet Melt
• 16% increase in melt area between 1979 and 2002 • new record in 2007 (60% increase in area)

Arctic sea ice is disappearing
Stroeve et al. 2008
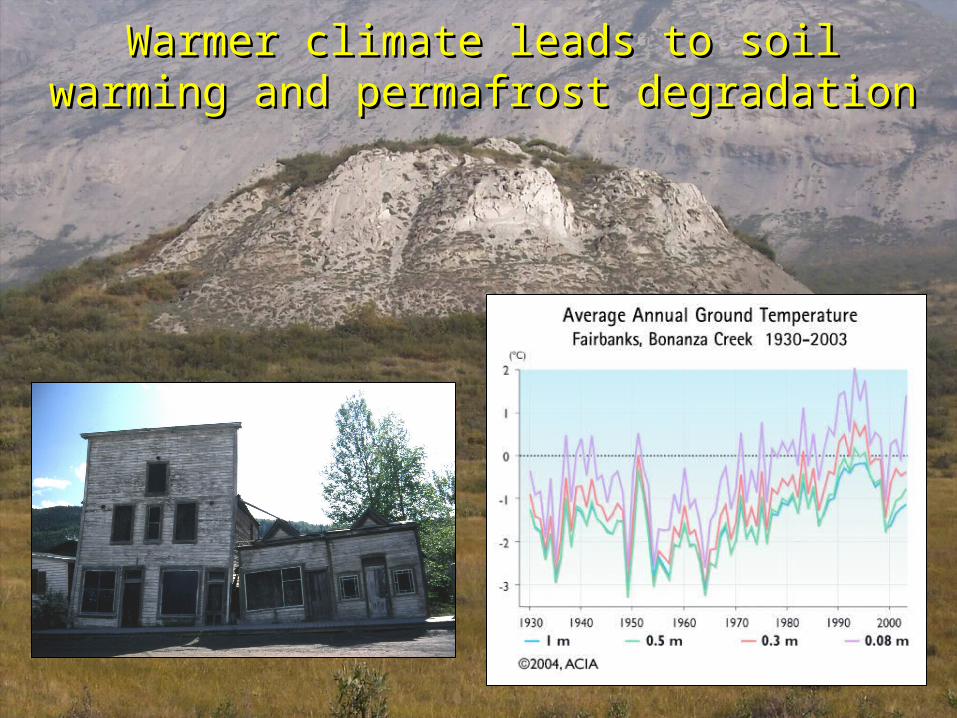
Permafrost FeaturesWarmer climate leads to soil warming and Warmer climate leads to soil warming and permafrost degradationpermafrost degradation

http://www.arctic.noaa.gov/reportcard/index.html
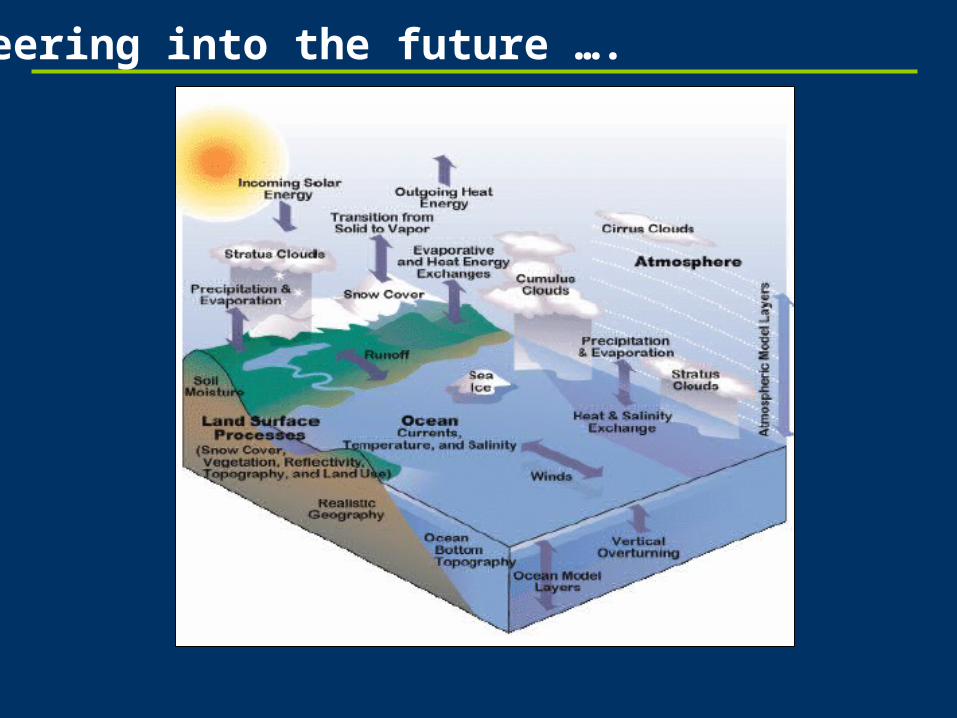
Peering into the future ….
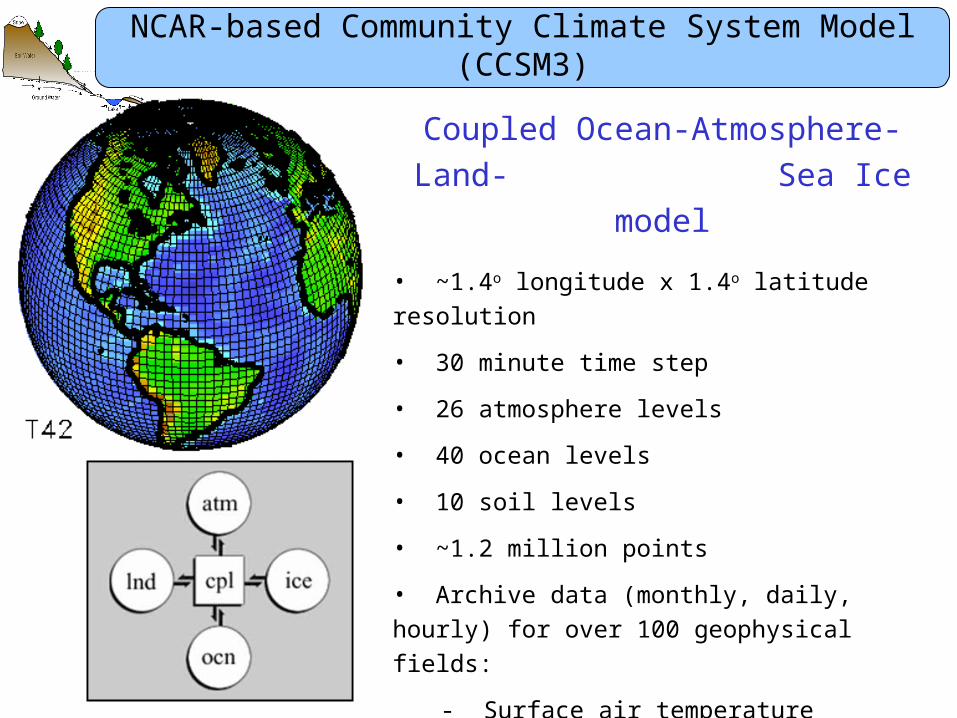
NCAR-based Community Climate System Model (CCSM3)
Coupled Ocean-Atmosphere-Land- Sea Ice model
• ~1.4o longitude x 1.4o latitude resolution
• 30 minute time step
• 26 atmosphere levels
• 40 ocean levels
• 10 soil levels
• ~1.2 million points
• Archive data (monthly, daily, hourly) for over 100 geophysical fields:
- Surface air temperature
- Sea ice thickness
- Snow age

Abrupt reductions in the September sea ice cover
“Abrupt”transition
Holland et al., 2006
Ice E
xte
nt
( 1
06 k
m2 )
September sea ice extent
9 events
across 8-
member
CCSM3 A1B
ensembleSSMI observed
CCSM3
CCSM3 – smoothed

Observed rate of loss is faster than projected
Adapted from Stroeve et al., 2007

What impact does sea ice loss have on Arctic?

Impacts on Polar Bears

…and on broader Arctic climate … in the 1970’s
D. Perovich, CRREL
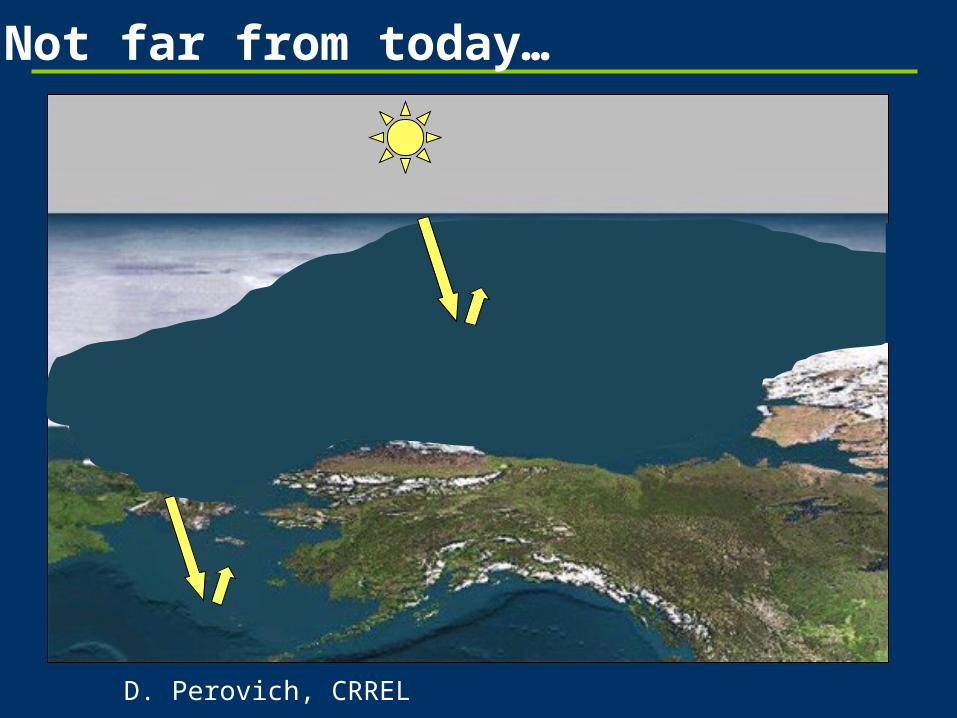
Not far from today…
D. Perovich, CRREL

Arctic Land Area: Surface Air Temperature Change (CCSM3)
}
Glo
bal
Warming is ~2x faster in Arctic compared to global average

September Sea- ice Extent
3.5-fold increase in rate of warming over land during rapid sea ice loss
Lawrence et al. 2008

‘Present-day’ permafrost distribution
IPA Permafrost Distribution Map
Continuous (90 – 100% coverage)
Discontinuous (50 – 90%)
Sporadic (10 – 50%)
Isolated (0 – 10%)
Brown et al. 1998
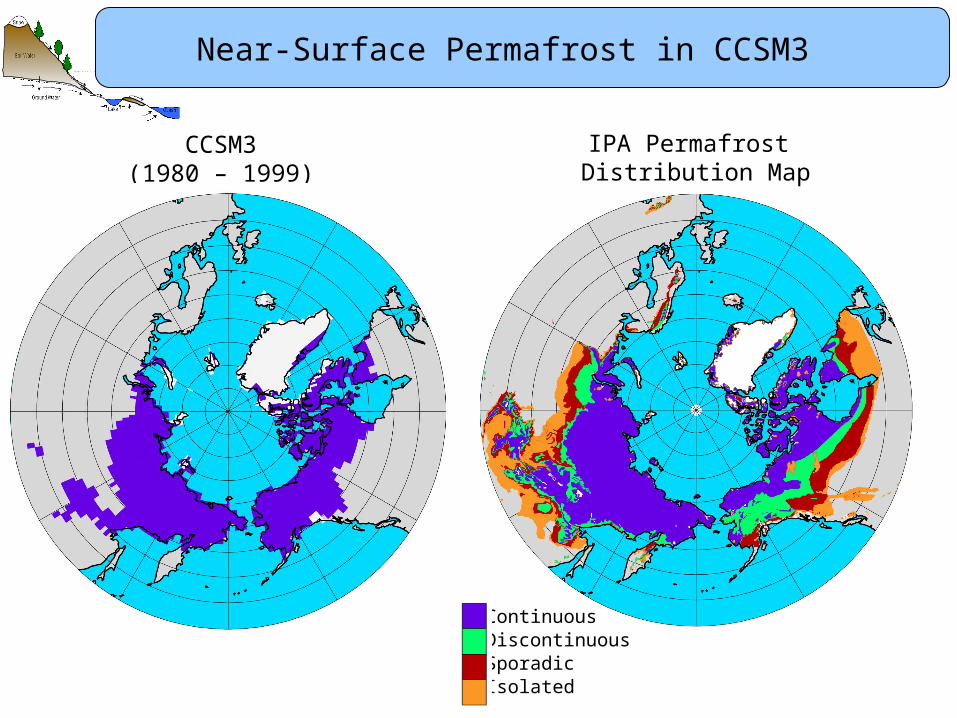
Near-Surface Permafrost in CCSM3
IPA Permafrost Distribution Map
Continuous Discontinuous Sporadic Isolated
CCSM3(1980 – 1999)
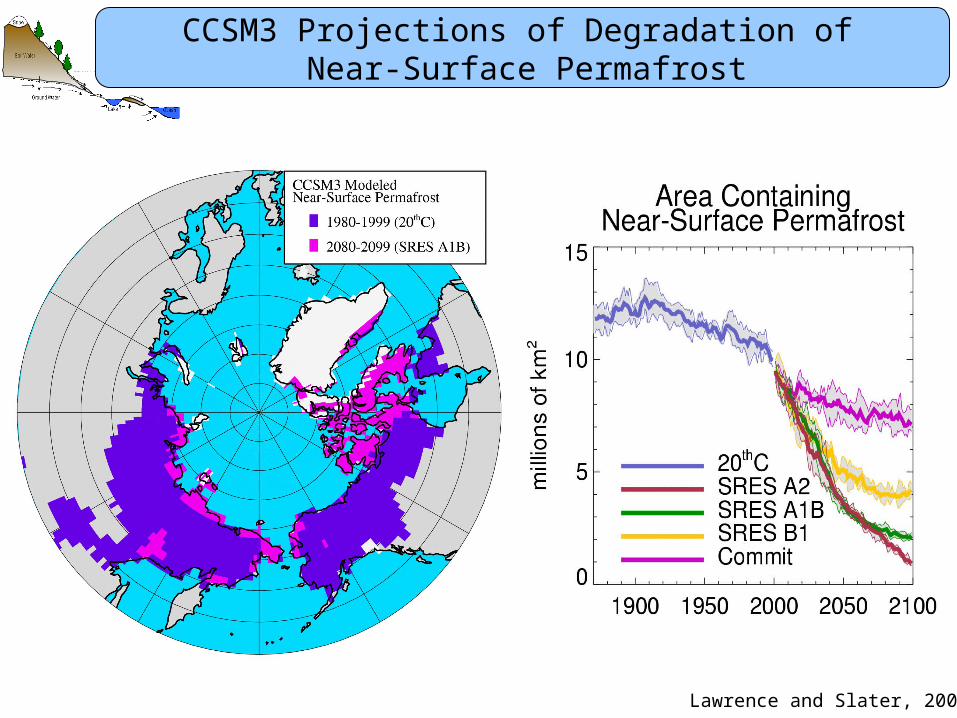
CCSM3 Projections of Degradation of Near-Surface Permafrost
Lawrence and Slater, 2005

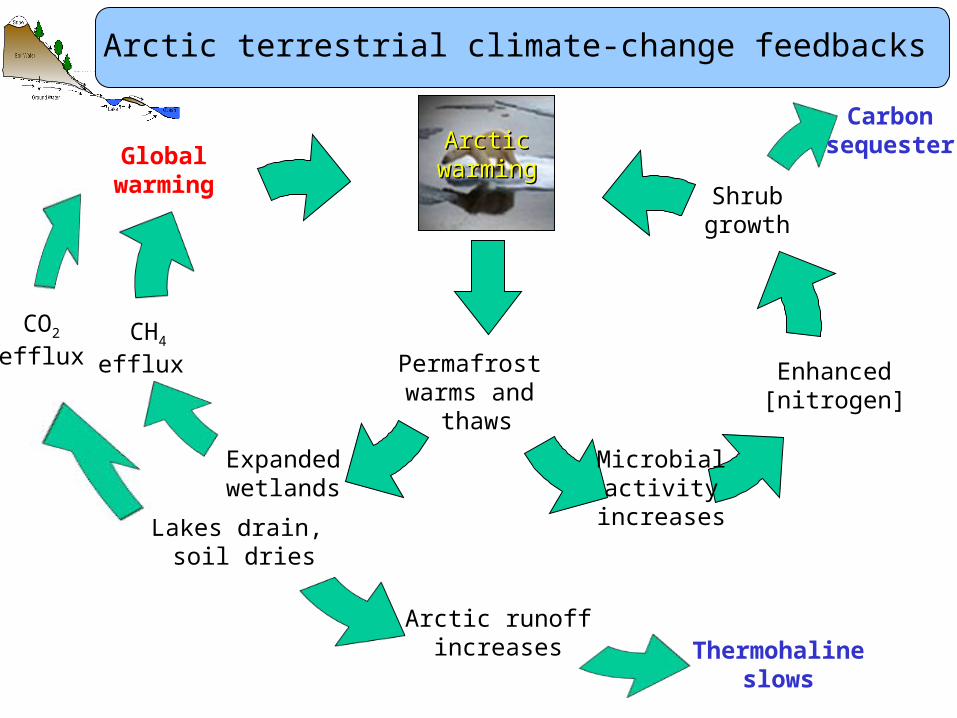
Lakes drain, soil dries
Arctic terrestrial climate-change feedbacks
Enhanced[nitrogen]
CO2
efflux
Globalwarming
CH4
efflux
Microbial activity
increases
Shrubgrowth
Expandedwetlands
Carbonsequester
Arctic runoffincreases Thermohaline
slows
Permafrost warms and
thaws
ArcticArcticwarmingwarming

Lakes drain, soil dries
Arctic terrestrial climate-change feedbacks
CO2
efflux
Globalwarming
CH4
efflux
Expandedwetlands
Permafrost warms and
thaws
ArcticArcticwarmingwarming
Carbon stocks in permafrost soil
~ 800 – 1300 PgC
Atmospheric carbon content
~ 750 PgC + 8-9 PgC yr-1

What happens to soil carbon as soil warms and permafrost thaws?
If soils get drier aerobic decomposition CO2 emissions
If more wetlands anaerobic microbial activity CH4 production (25x GWP)
19781978
19981998Bubier et al. 1995
Lakes drain, soil dries
Arctic terrestrial climate-change feedbacks
Enhanced[nitrogen]
CO2
efflux
Globalwarming
CH4
efflux
Microbial activity
increases
Shrubgrowth
Expandedwetlands
Carbonsequester
Arctic runoffincreases Thermohaline
slows
Permafrost warms and
thaws
ArcticArcticwarmingwarming
Bernhard Edmaier National Geographic
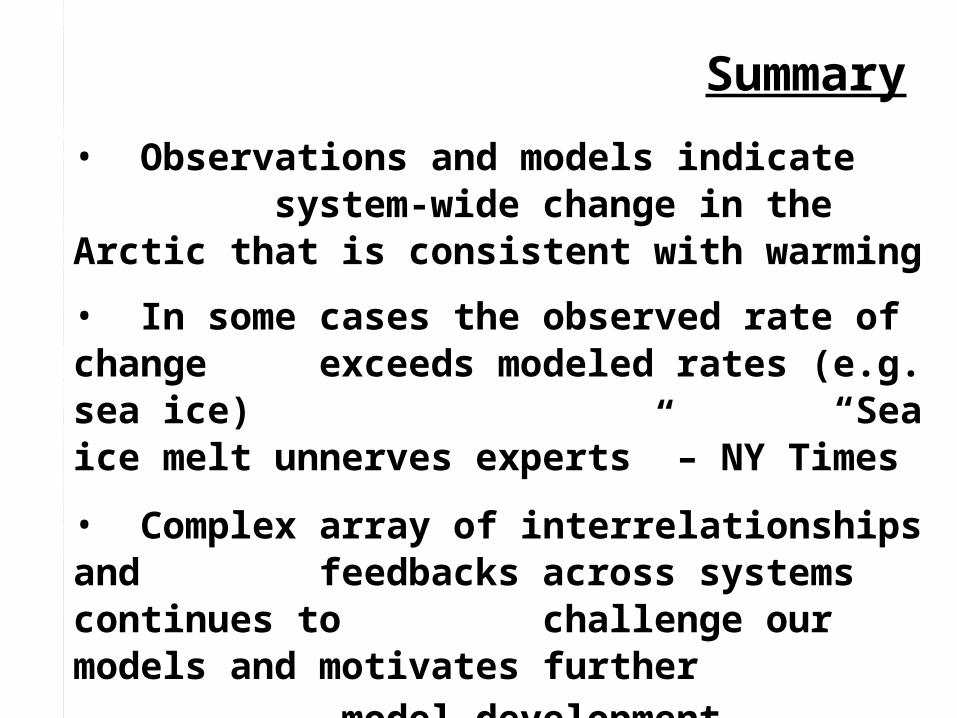
Summary
• Observations and models indicate system-wide change in the Arctic that is consistent with warming
• In some cases the observed rate of change exceeds modeled rates (e.g. sea ice) “Sea ice melt unnerves experts” – NY Times
• Complex array of interrelationships and feedbacks across systems continues to challenge our models and motivates further model development

Timeline of Climate Model Development

Timeline of Climate Model Development

Permafrost “Humor”

ChemistryClimate
ChemistryClimate
BioGeoChemistryBioGeoChemistry
Software EngineeringSoftware Engineering
Climate VariabilityClimate Variability
Polar ClimatePolar
ClimateLand ModelLand Model
PaleoClimate PaleoClimate
Ocean Model Ocean Model
CCSM Working GroupsCCSM Working GroupsCCSM Working GroupsCCSM Working Groups DevelopmentDevelopmentDevelopmentDevelopment
ApplicationApplication ApplicationApplication
AtmModel
AtmModel
Climate ChangeClimate Change
CCSM is primarily sponsored by the National Science Foundation
and the Department of Energy

Mountain Glaciers are Melting / Retreating
Pasterze Gletscher, Austria
2003
1900

CO2 emissions and concentrations increasing faster than expected
Fraction of CO2 emissions staying in atmosphere is increasing (0.4 to 0.45)
Is the earth system losing its capability to soak up CO2?
1960 2000

Appearing and Disappearing Lakes in Siberia (Smith et al.
2005)
Smith et al., 2005
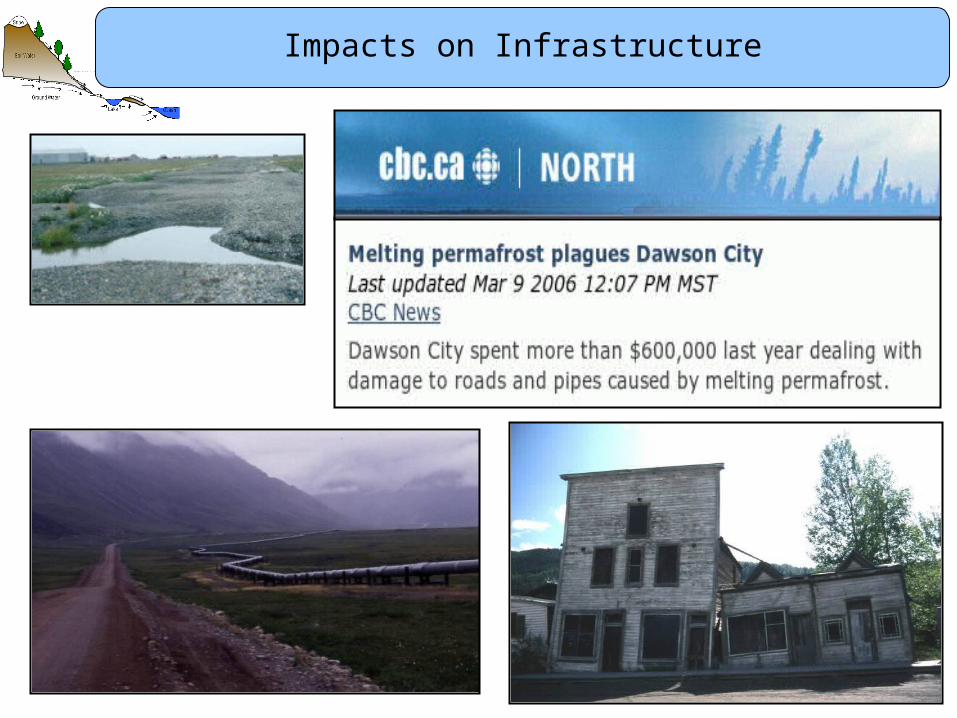
Impacts on Infrastructure

Permafrost: Soil or rock that remains below freezing for two or more years
Continuous (90 – 100% coverage)
Discontinuous (50 – 90%)
Sporadic (10 – 50%)
Isolated (0 – 10%)
IPA Permafrost Distribution Map
Continuous Discontinuous
Brown et al. 1998