accelerating success. southern california lodging forecast southern california lodging forecast...
Post on 20-Dec-2015
214 views
TRANSCRIPT

Accelerating success.
Southern California Lodging ForecastNovember 10, 2011
Bruce Baltin, Jeff Lugosi, Mark Van Stekelenburg and Brandon Feighner
PKF Consulting Los Angeles
.
How Good Should You Feel?The Road to Recovery Continues:

Question Last Year:Question Last Year:
What Was Top of Mind a Year Ago?
Some said yes; most said no.
Will there be a double dip recession?.Will there be a double dip recession?.
2
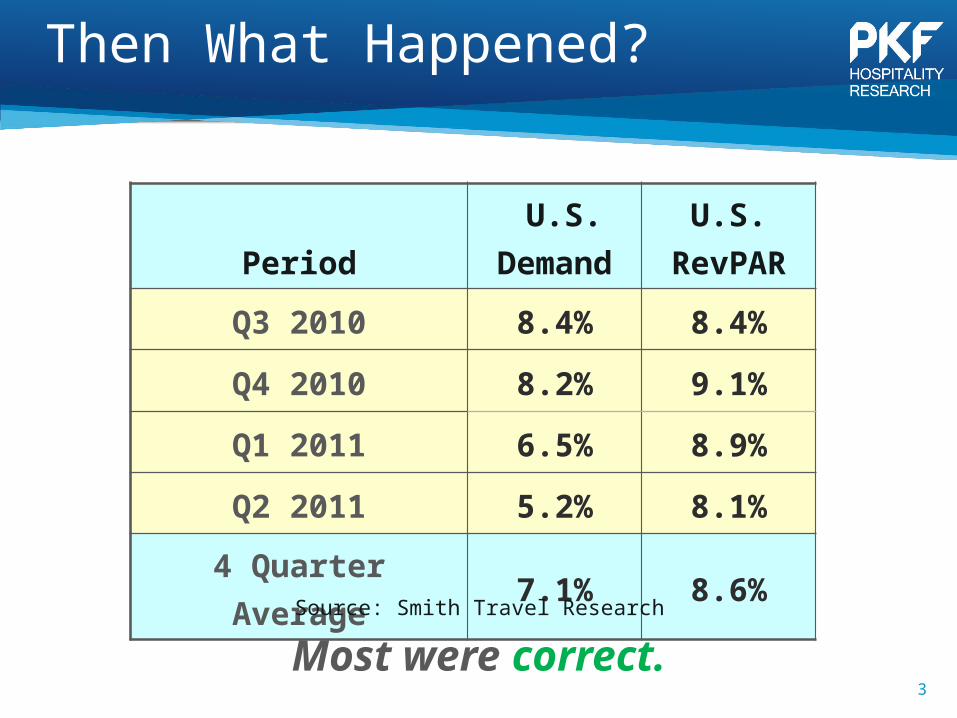
Then What Happened?
3
Period U.S.
DemandU.S.
RevPAR
Q3 2010 8.4% 8.4%
Q4 2010 8.2% 9.1%
Q1 2011 6.5% 8.9%
Q2 2011 5.2% 8.1%
4 Quarter Average 7.1% 8.6%
Most were correct.Source: Smith Travel Research

1988Q1 1990Q1 1992Q1 1994Q1 1996Q1 1998Q1 2000Q1 2002Q1 2004Q1 2006Q1 2008Q1 2010Q1 2012Q1 2014Q1100
105
110
115
120
125
130
135
140
145
1990Q2110
1991 Q3110
2001 Q4132
2005 Q1133
2008 Q1138
2010 Q3129
2014 Q1138
U.S. TOTAL EMPLOYMENT LEVELS……are starting to gain
6 Years From Peak-to-Peak - 8 Million Jobs Lost
Source: Moody’s Analytics
We’re here4 Years From Peak-to-Peak - 2.5 Million
Jobs Lost
1.25 Years From Peak-to-Peak –
2.0 Million Jobs Lost
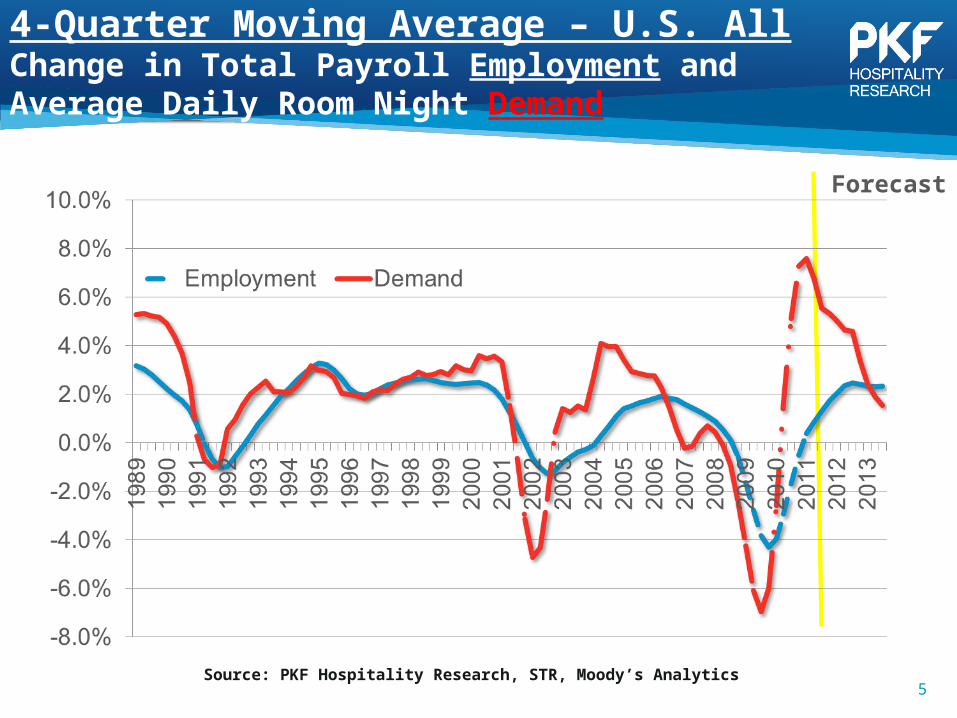
4-Quarter Moving Average – U.S. AllChange in Total Payroll Employment andAverage Daily Room Night Demand
Forecast
Source: PKF Hospitality Research, STR, Moody’s Analytics5

4-Quarter Moving Average – U.S. AllChange in Corporate Profits andAverage Daily Room Night Demand
Forecast
Source: PKF Hospitality Research, STR, Moody’s Analytics

The More Education, the Lower the Unemployment Rate …

The Wealthier Represent a Growing Percentage of All Demand
Under $75K $75K-$149K $150K+2011 (Preliminary): 42.7% 42.6% 14.7%
2010: 42.2% 44.1% 13.7% 2007: 45.8% 43.3% 10.8%
Domestic U.S. Room-Nights by U.S. Travelers
Source: D. K. Shifflet & Associates 2011 Performance Monitor

Uncertainty Levels at an All Time High
Source: Baker, Bloom and Davis
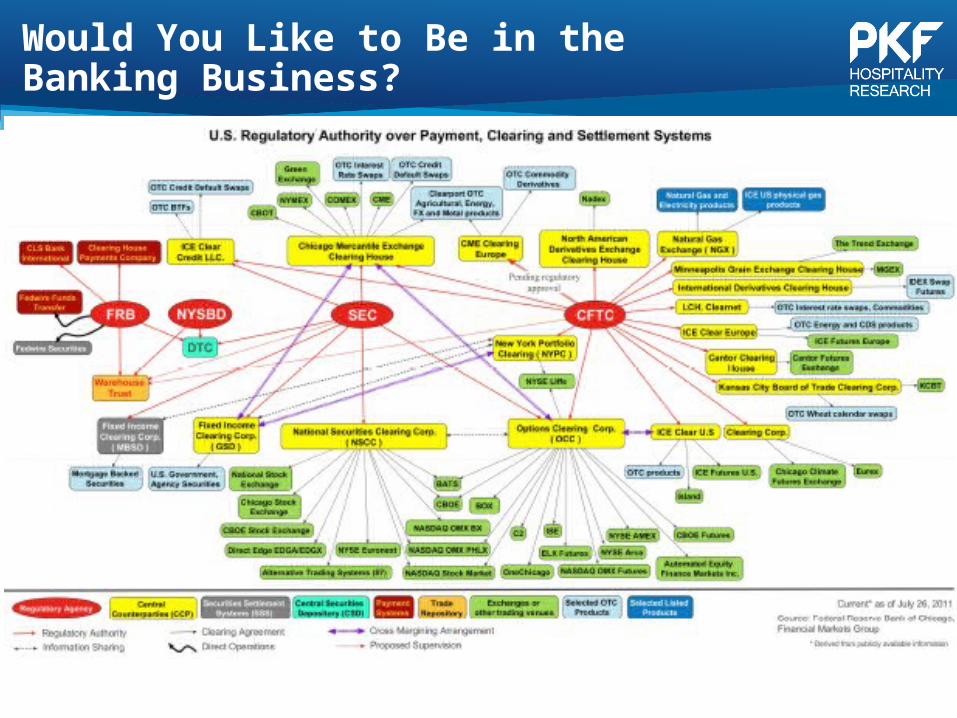
Would You Like to Be in the Banking Business?

The Hotel Market Cycle
11
Rapid Development
Occupancy Declines, ADR Follows
Development at Minimum Levels
Lodging Decline, Leads Other
Sectors
Occupancy Recovers
ADR and Margins Recover
Development Picks Up
Development Slows
Lodging Recovers, Lags Other Sectors (Not this
Time!)
Long RunOccupancy
Rapid Development
Equilibrium ADR
U.S. is Here
2012-2013
2014-2015
A Year Ago
The Long, Hard Climb Up Growth Hill

Demand Recovery Has Been Strong for Many
12
Market
Number of Markets at or Above Past
Peak as of Q2 2011
All Hotels 44
Upper-Priced 46
Lower-Priced 14
Setting the Stage for Attractive ADR Growth.
Source: PKF-HR; STR

Economic Assumptions – U.S. Forecasts
13
PayrollEmployment
Real Personal Income Real GDP CPI (Inflation)
2009 -4.3% -1.9% -2.6% -0.3%
2010 -0.7% 1.9% 3.0% 1.6%
2011 1.1% 0.9% 2.1% 2.9% 2.5% 1.6% 3.0% 3.0%
2012 1.7% 0.7% 4.0% 4.4% 3.8% 2.7% 1.8% 2.1%
2013 2.5% 1.8% 5.0% 3.9% 4.1% 3.5% 2.5% 2.8%
L.R.A. 1.2% 2.7% 2.7% 2.9%
Source: Moody’s Analytics, July 2011 L.R.A. = Long Run Average
July 2011 Forecast (September in Red)

Long Term Average 2006 2007 2008 2009 2010 2011F 2012F
Supply 2.2% 0.2% 1.3% 2.5% 3.0% 1.8% 0.6% 0.7%
Demand 1.8% 0.5% 0.7% -2.5% -6.1% 7.5% 4.5% 3.1%
Occupancy 62.0% 63.1% 62.8% 59.8% 54.5% 57.6% 59.8% 61.2%
ADR 2.8% 7.6% 6.4% 2.9% -8.5% -0.1% 3.2% 4.8%
RevPAR 2.5% 7.9% 5.9% -2.1% -16.6% 5.5% 7.2% 7.3%
National Horizon – 2011, 2012
And a Quicker Demand
Turnaround
For a Record Decline
Source: PKF Hospitality Research – September-November 2011 Hotel Horizons® Report, Smith Travel Research
14
Severe Rate Discounting Set
the Stage
Approaching Long Run Average

Recovery Timelines Mixed Across Markets:Year when ADR levels Surpass Previous Peak (4Q Moving Average)
20112012201320142015 & Beyond Source: PKF Hospitality Research

National Hotel Horizons
Source: PKF Hospitality Research – September-November 2011 Hotel Horizons® Report, Smith Travel Research
16
National vs. Regional Lodging Comparison
2011 Year-End Estimates
Location Occ ADRRevPA
R%Increa
se
United States 59.8% $101.28$60.5
4 7.2%
Los Angeles County 71.7% $122.14
$87.58 11.0%
Orange County 70.7% $112.52$79.5
7 8.3%
San Diego County 68.6% $125.73
$86.21 6.4%

National Hotel Horizons
Source: PKF Hospitality Research – September-November 2011 Hotel Horizons® Report, Smith Travel Research
17
National vs. Regional Lodging Comparison
2012 Year-End Forecasts
Location Occ ADRRevPA
R%Increa
se
United States 61.2% $106.16$64.9
5 7.3%
Los Angeles County 73.0% $129.64
$94.69 8.1%
Orange County 72.7% $119.80$87.1
0 9.5%
San Diego County 70.1% $134.00
$93.91 8.9%
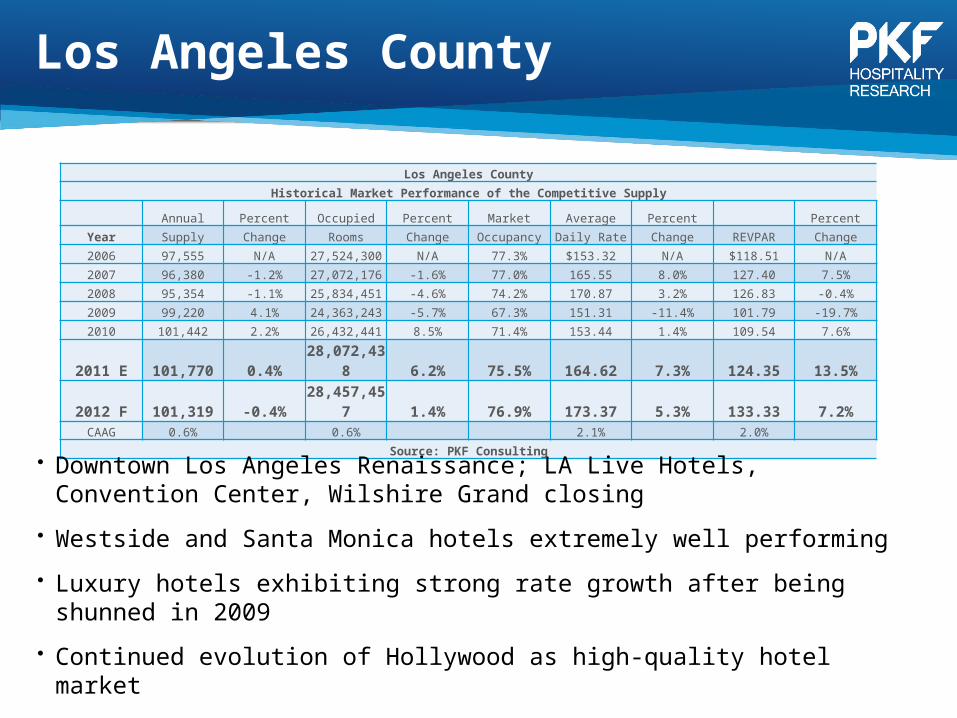
Los Angeles County
Los Angeles County
Historical Market Performance of the Competitive Supply
Annual Percent Occupied Percent Market Average Percent Percent
Year Supply Change Rooms Change Occupancy Daily Rate Change REVPAR Change
2006 97,555 N/A 27,524,300 N/A 77.3% $153.32 N/A $118.51 N/A
2007 96,380 -1.2% 27,072,176 -1.6% 77.0% 165.55 8.0% 127.40 7.5%
2008 95,354 -1.1% 25,834,451 -4.6% 74.2% 170.87 3.2% 126.83 -0.4%
2009 99,220 4.1% 24,363,243 -5.7% 67.3% 151.31 -11.4% 101.79 -19.7%
2010 101,442 2.2% 26,432,441 8.5% 71.4% 153.44 1.4% 109.54 7.6%
2011 E 101,770 0.4% 28,072,438 6.2% 75.5% 164.62 7.3% 124.35 13.5%2012 F 101,319 -0.4% 28,457,457 1.4% 76.9% 173.37 5.3% 133.33 7.2%CAAG 0.6% 0.6% 2.1% 2.0%
Source: PKF Consulting
• Downtown Los Angeles Renaissance; LA Live Hotels, Convention Center, Wilshire Grand closing
• Westside and Santa Monica hotels extremely well performing
• Luxury hotels exhibiting strong rate growth after being shunned in 2009
• Continued evolution of Hollywood as high-quality hotel market
• Compression to secondary markets as primary markets are maxed out

Orange County
Orange CountyHistorical Market Performance of the Competitive Supply
Annual Percent Occupied Percent Market Average Percent PercentYear Supply Change Rooms Change Occupancy Daily Rate Change REVPAR Change2006 17,192,230 N/A 12,444,937 N/A 72.4% $120.64 N/A $87.32 N/A2007 18,214,595 5.9% 13,177,558 5.9% 72.3% 130.81 8.4% 94.64 8.4%2008 18,976,715 4.2% 13,431,010 1.9% 70.8% 130.80 0.0% 92.58 -2.2%2009 19,302,567 1.7% 12,485,124 -7.0% 64.7% 117.20 -10.4% 75.81 -18.1%2010 19,529,455 1.2% 13,498,588 8.1% 69.1% 115.90 -1.1% 80.11 5.7%
2011 E 19,574,187 0.2% 13,988,803 3.6% 71.5% 121.29 4.7% 86.68 8.2%2012 F 19,655,811 0.4% 14,349,771 2.6% 73.0% 126.63 4.4% 92.44 6.6%CAAG 2.3% 2.4% 0.8% 1.0%
Source: PKF Consulting
• Strength of the Anaheim destination for business and leisure
• Significant renovations at Disney’s Amusement Parks and hotels
• Maturation of Coastal Resorts
• Recent addition of the Courtyard OC Airport and planned February 2012 addition of the Residence Inn San Juan Capistrano.

San Diego CountyHistorical Market Performance of the Competitive Supply
Annual Percent Occupied Percent Market Average Percent PercentYear Supply Change Rooms Change Occupancy Daily Rate Change REVPAR Change2006 11,676,761 N/A 8,829,077 N/A 75.6% $161.70 N/A $122.27 N/A2007 11,858,850 1.6% 8,894,775 0.7% 75.0% 171.95 6.3% 128.97 5.5%2008 12,269,597 3.5% 8,838,933 -0.6% 72.0% 175.01 1.8% 126.07 -2.2%2009 12,999,840 6.0% 8,619,023 -2.5% 66.3% 151.61 -13.4% 100.52 -20.3%2010 13,185,625 1.4% 9,220,879 7.0% 69.9% 146.83 -3.2% 102.68 2.2%
2011 E 13,260,815 0.6% 9,584,480 3.9% 72.3% 151.19 3.0% 109.28 6.4%2012 F 13,392,975 1.0% 9,799,591 2.2% 73.2% 158.87 5.1% 116.24 6.4%CAAG 2.3% 1.8% -0.3% -0.8%
Source: PKF Consulting
San Diego County
• Bay Areas back to peak levels
• Strong performance of North County and planned hotel development
• Proposed San Diego Convention Center and Hilton expansion
• Significant hotel renovations: La Costa, Marriott Marquis, Hyatt Manchester

Inland Empire
Inland EmpireHistorical Market Performance of the Competitive Supply
Annual Percent Occupied Percent Market Average Percent PercentYear Supply Change Rooms Change Occupancy Daily Rate Change REVPAR Change2006 2,245,845 N/A 1,624,035 N/A 72.3% $98.97 N/A $71.57 N/A2007 2,344,395 4.4% 1,674,420 3.1% 71.4% 101.13 2.2% 72.23 0.9%2008 2,484,190 6.0% 1,629,720 -2.7% 65.6% 99.79 -1.3% 65.47 -9.4%2009 2,725,820 9.7% 1,576,256 -3.3% 57.8% 87.59 -12.2% 50.65 -22.6%2010 2,814,880 3.3% 1,726,810 9.6% 61.3% 83.37 -4.8% 51.14 1.0%
2011 E 2,869,630 1.9% 1,815,309 5.1% 63.3% 85.33 2.3% 53.98 5.5%2012 F 2,944,455 2.6% 1,884,254 3.8% 64.0% 87.71 2.8% 56.13 4.0%CAAG 4.6% 2.5% -2.0% -4.0%
Source: PKF Consulting
• Supply additions at the lowest level since 2001
• During the Economic downturn hotels were also hurt by foreclosures, bankruptcies, and changes in ownership/management
• Demand returning, but at somewhat depressed rates
• Supply additions (Embassy, Hyatt Place) will be challenging in the short-term, but are improving the hotel stock in the region
• Similar story with the temporary closing of the Riverside Convention Center
• Long-term will be an area of growth once fundamentals return
Coachella Valley
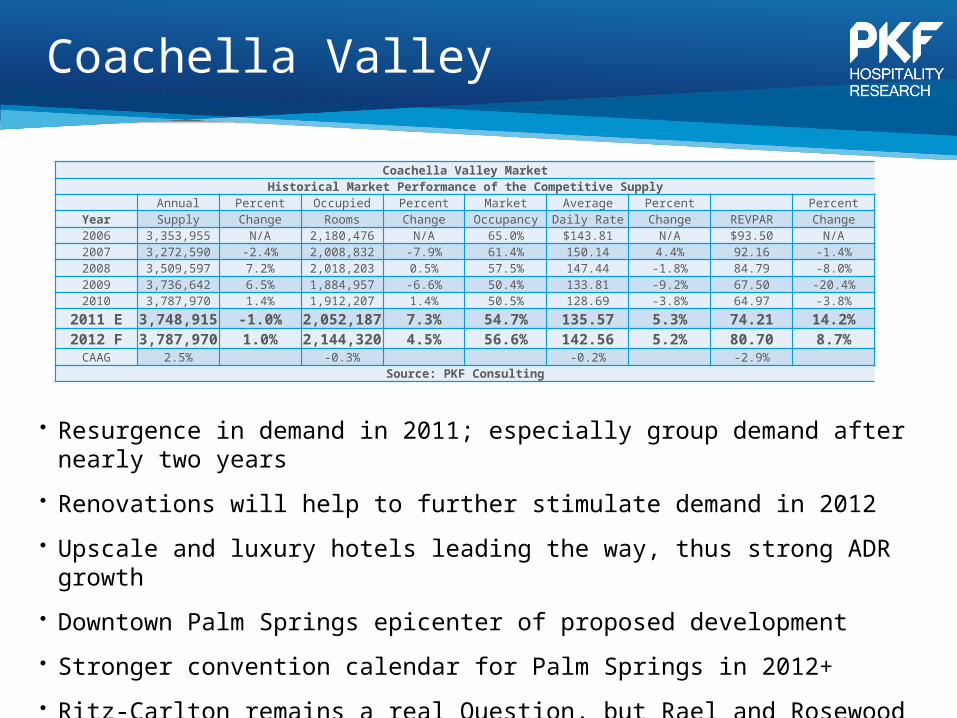
Coachella Valley MarketHistorical Market Performance of the Competitive Supply
Annual Percent Occupied Percent Market Average Percent PercentYear Supply Change Rooms Change Occupancy Daily Rate Change REVPAR Change2006 3,353,955 N/A 2,180,476 N/A 65.0% $143.81 N/A $93.50 N/A2007 3,272,590 -2.4% 2,008,832 -7.9% 61.4% 150.14 4.4% 92.16 -1.4%2008 3,509,597 7.2% 2,018,203 0.5% 57.5% 147.44 -1.8% 84.79 -8.0%2009 3,736,642 6.5% 1,884,957 -6.6% 50.4% 133.81 -9.2% 67.50 -20.4%2010 3,787,970 1.4% 1,912,207 1.4% 50.5% 128.69 -3.8% 64.97 -3.8%
2011 E 3,748,915 -1.0% 2,052,187 7.3% 54.7% 135.57 5.3% 74.21 14.2%2012 F 3,787,970 1.0% 2,144,320 4.5% 56.6% 142.56 5.2% 80.70 8.7%CAAG 2.5% -0.3% -0.2% -2.9%
Source: PKF Consulting
• Resurgence in demand in 2011; especially group demand after nearly two years
• Renovations will help to further stimulate demand in 2012
• Upscale and luxury hotels leading the way, thus strong ADR growth
• Downtown Palm Springs epicenter of proposed development
• Stronger convention calendar for Palm Springs in 2012+
• Ritz-Carlton remains a real Question, but Rael and Rosewood PD are approved

Ventura County
Historical Market Performance of the Competitive Supply
Annual Percent Occupied Percent Market Average Percent Percent
Year Supply Change Rooms Change Occupancy Daily Rate Change REVPAR Change
2006 1,574,610 N/A 1,085,348 N/A 68.9% $98.27 N/A $67.74 N/A
2007 1,603,810 1.9% 1,080,962 -0.4% 67.4% 102.81 4.6% 69.29 2.3%
2008 1,620,965 1.1% 1,069,734 -1.0% 66.0% 103.21 0.4% 68.11 -1.7%
2009 1,574,610 -2.9% 983,532 -8.1% 62.5% 98.32 -4.7% 61.41 -9.8%
2010 1,634,835 3.8% 1,059,819 7.8% 64.8% 96.76 -1.6% 62.73 2.1%
2011 E 1,650,530 1.0% 1,065,059 0.5% 64.5% 97.08 0.3% 62.64 -0.1%2012 F 1,650,530 0.0% 1,092,434 2.6% 66.2% 99.51 2.5% 65.86 5.1%CAAG 0.8% 0.1% 0.2% -0.5%
Source: PKF Consulting
Ventura County
• Slower growth market, evidenced in the 0.1% CAAG of occupied rooms
• Pockets of strength in the County; such as Camarillo, but the Oxnard submarket is estimated to experience a decline in demand in 2011.
• More often than not demand is shifted to newly opened or renovated hotels rather than induced into the market
• Potential to boost tourism to the region; Ojai is one example
• Dependence on Government could be a long-term threat to hotel performance

Santa Barbara CountyHistorical Market Performance of the Competitive Supply
Annual Percent Occupied Percent Market Average Percent PercentYear Supply Change Rooms Change Occupancy Daily Rate Change REVPAR Change2006 1,860,040 N/A 1,329,952 N/A 71.5% $171.75 N/A $122.81 N/A2007 1,856,025 -0.2% 1,321,922 -0.6% 71.2% 183.05 6.6% 130.38 6.2%2008 1,880,480 1.3% 1,303,829 -1.4% 69.3% 182.68 -0.2% 126.66 -2.9%2009 1,939,975 3.2% 1,239,684 -4.9% 63.9% 168.84 -7.6% 107.89 -14.8%2010 1,950,925 0.6% 1,315,649 6.1% 67.4% 168.19 -0.4% 113.42 5.1%
2011 E 1,950,925 0.0% 1,350,544 2.7% 69.2% 173.65 3.2% 120.21 6.0%2012 F 1,970,270 1.0% 1,408,342 4.3% 71.5% 180.58 4.0% 129.08 7.4%CAAG 1.0% 1.0% 0.8% 0.8%
Source: PKF Consulting
Santa Barbara County
• RevPAR performance indicates a forecasted return to peak 2007 levels
• Continues to evolve as a destination; Hyatt & Bacara to further the Riviera experience
• Future hotels to included: El Encanto and Miramar
• Growth opportunities in North County; Santa Ynez Valley BID as a example
• Goleta, very strong performance, and locale for supply additions, which should be absorbed given relatively affordability and strength of demand drivers, especially UCSB

San Luis Obispo CombinedHistorical Market Performance of the Competitive Supply
Annual Percent Occupied Percent Market Average Percent PercentYear Supply Change Rooms Change Occupancy Daily Rate Change REVPAR Change
2006 1,278,595 N/A 862,335 N/A 67.4% $128.04 N/A $86.36 N/A2007 1,417,660 10.9% 943,524 9.4% 66.6% 131.06 2.4% 87.23 1.0%2008 1,503,800 6.1% 983,710 4.3% 65.4% 129.20 -1.4% 84.51 -3.1%2009 1,522,780 1.3% 952,703 -3.2% 62.6% 125.13 -3.1% 78.29 -7.4%2010 1,541,760 1.2% 985,208 3.4% 63.9% 124.54 -0.5% 79.58 1.7%
2011 E 1,557,820 1.0% 1,030,388 4.6% 66.1% 129.05 3.6% 85.36 7.3%2012 F 1,579,355 1.4% 1,061,429 3.0% 67.2% 134.03 3.9% 90.08 5.5%CAAG 3.6% 3.5% 0.8% 0.7%
Source: PKF Consulting
San Luis Obispo County
• Drive market, which benefits from proximity to S. CA and SF
• Wine industry continues to drive leisure demand, especially in Paso Robles
• The area’s Wine Country Alliance serves as a model for collaborative marketing
• City of San Luis Obispo remains a strong market, with hotels in early planning
• Supply changes include the opening of the Hampton Inn Arroyo Grande and the conversion of the Mission Inn to a Hilton Garden Inn

Coastal MarketHistorical Market Performance of the Competitive Supply
Annual Percent Occupied Percent Market Average Percent PercentYear Supply Change Rooms Change Occupancy Daily Rate Change REVPAR Change2006 2,478,411 N/A 1,748,223 N/A 70.5% $305.06 N/A $215.18 N/A2007 2,531,427 2.1% 1,782,824 2.0% 70.4% 325.58 6.7% 229.29 6.6%2008 2,669,488 5.5% 1,789,490 0.4% 67.0% 328.37 0.9% 220.12 -4.0%2009 2,975,358 11.5% 1,703,819 -4.8% 57.3% 284.46 -13.4% 162.90 -26.0%2010 3,086,501 3.7% 1,896,597 11.3% 61.4% 277.04 -2.6% 170.24 4.5%
2011 E 3,086,501 0.0% 2,047,826 8.0% 66.3% 292.46 5.6% 194.04 14.0%2012 F 3,125,921 1.3% 2,136,810 4.3% 68.4% 307.12 5.0% 209.94 8.2%CAAG 3.9% 3.4% 0.1% -0.4%
Source: PKF Consulting
Southern California Coastal Market
• Absorption of new supply in recent years (Grand Del Mar, Pelican Hill, Terranea)
• Limited future supply growth (Hilton Carlsbad) will facilitate demand growth
• Rates are also projected to increase as the newer hotels complete an elongated ramp up
• World-class Coastal Resorts successful in attracting international demand

Q & AWhat questions can we answer for you?