accelerating transformation hmg - pa
TRANSCRIPT
Accelerating Transformation…. with Data
Driving Decisions with Data
HMG Palo AltoPresented by: Matt Mandich, Director
Innovation & Strategy
Info-Tech Research Group 2Info-Tech Research Group 2
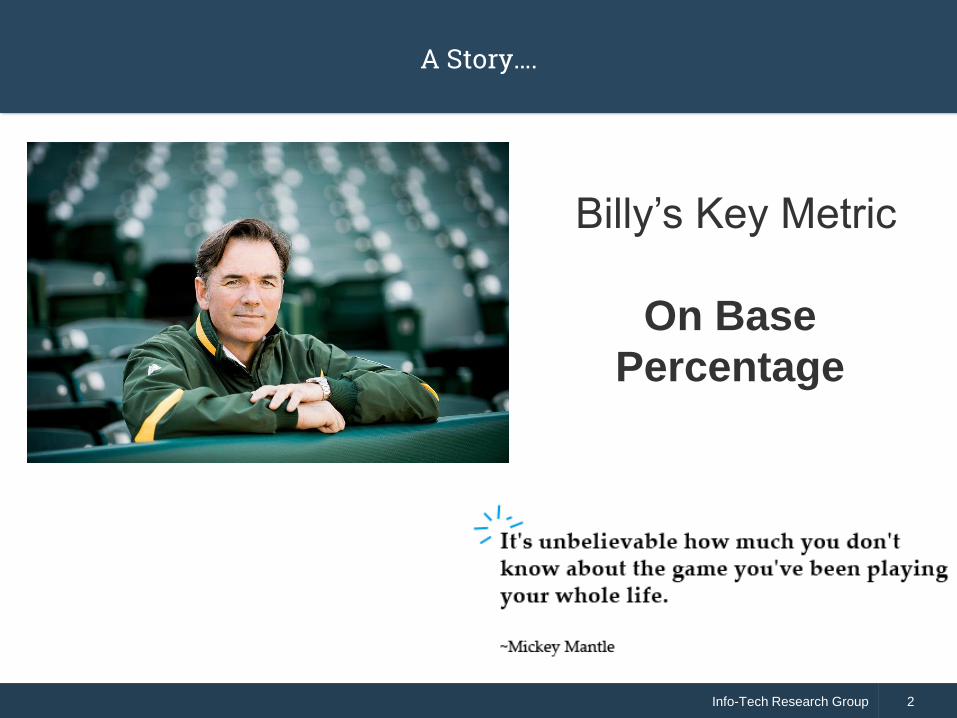
A Story….
Billy’s Key Metric
On Base
Percentage
Info-Tech Research Group 3Info-Tech Research Group 3
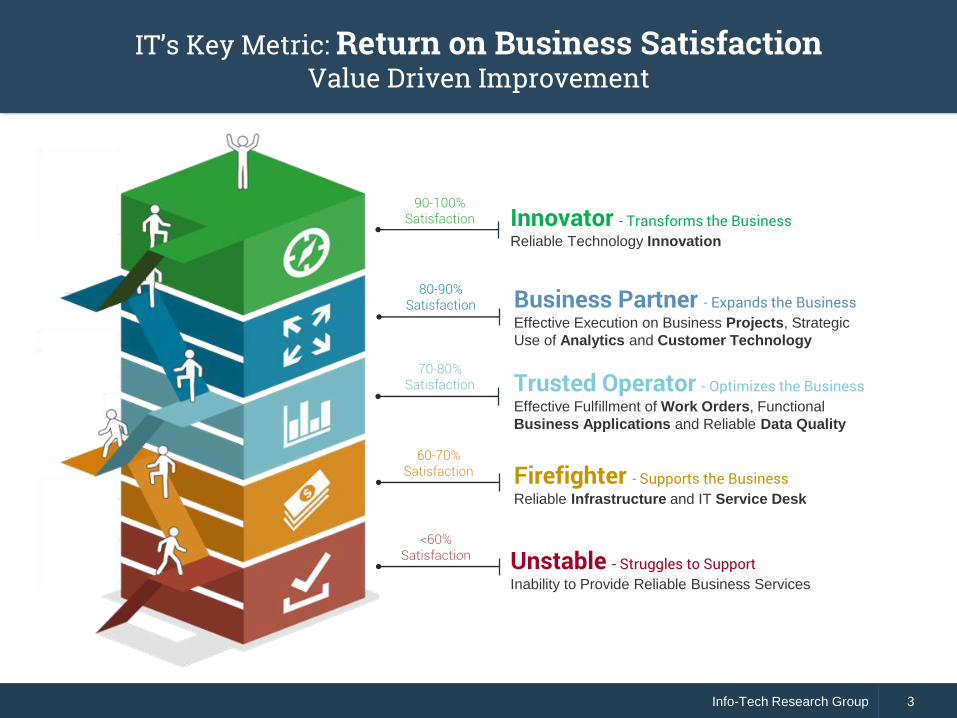
IT’s Key Metric: Return on Business SatisfactionValue Driven Improvement
Innovator - Transforms the BusinessReliable Technology Innovation
90-100% Satisfaction
Business Partner - Expands the BusinessEffective Execution on Business Projects, Strategic
Use of Analytics and Customer Technology
80-90% Satisfaction
Trusted Operator - Optimizes the BusinessEffective Fulfillment of Work Orders, Functional
Business Applications and Reliable Data Quality
70-80% Satisfaction
Firefighter - Supports the BusinessReliable Infrastructure and IT Service Desk
60-70% Satisfaction
Unstable - Struggles to SupportInability to Provide Reliable Business Services
<60% Satisfaction
Info-Tech Research Group 4Info-Tech Research Group 4
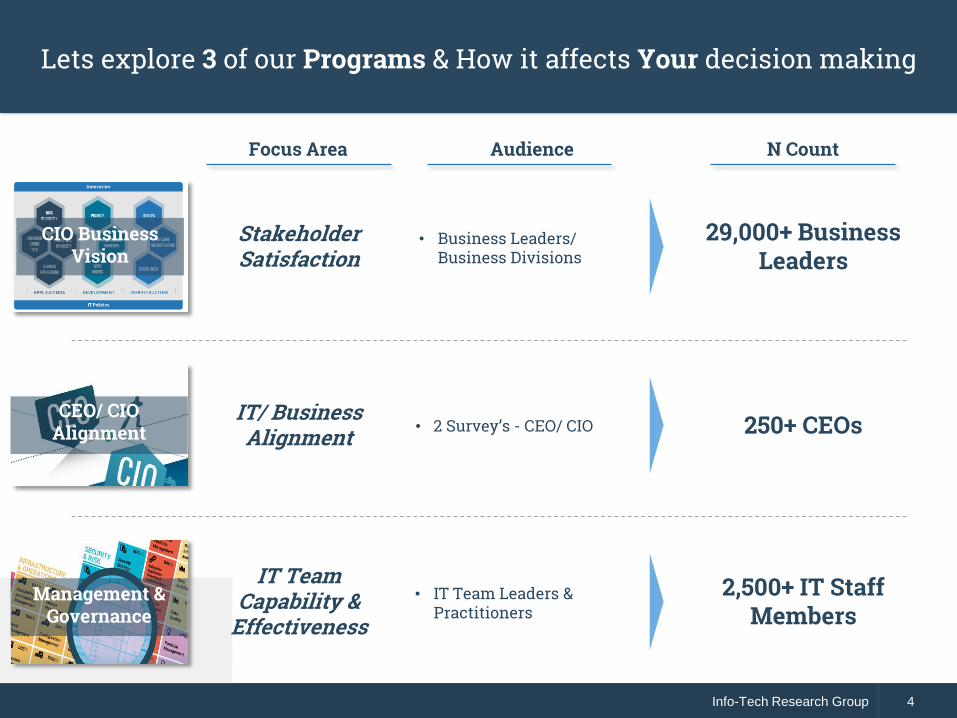
Lets explore 3 of our Programs & How it affects Your decision making
Focus Area Audience N Count
CIO Business Vision
Stakeholder Satisfaction
• Business Leaders/ Business Divisions
Management & Governance
IT Team Capability &
Effectiveness• IT Team Leaders &
Practitioners 2,500+ IT Staff
Members
29,000+ Business Leaders
CEO/ CIO Alignment
IT/ Business Alignment • 2 Survey’s - CEO/ CIO 250+ CEOs
Business SatisfactionFindings from CIO Business Vision
Info-Tech Research Group 6Info-Tech Research Group 6
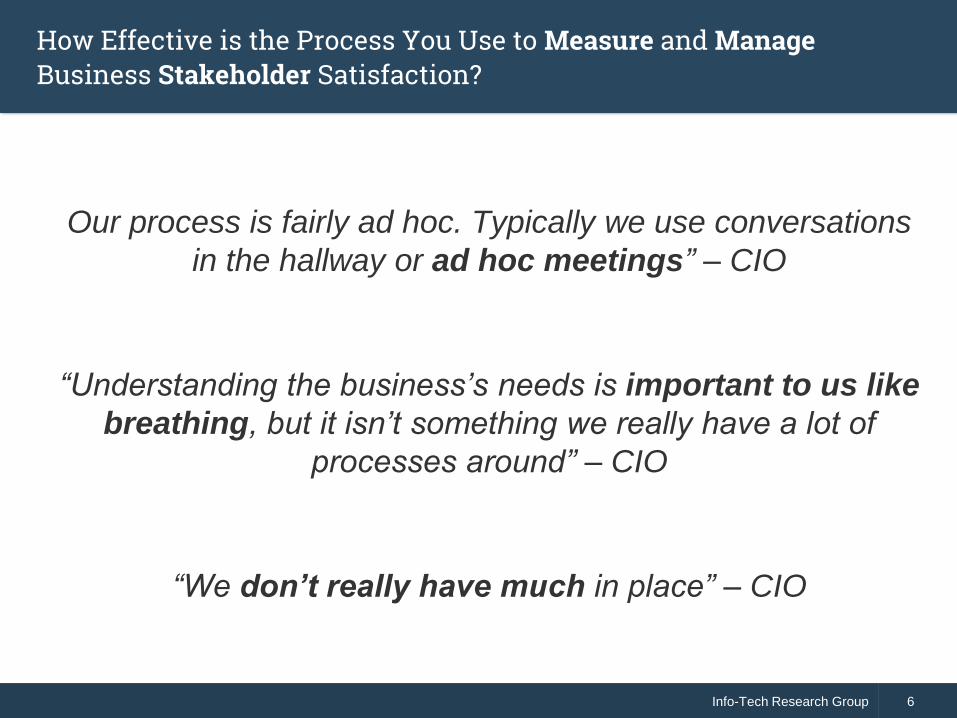
How Effective is the Process You Use to Measure and ManageBusiness Stakeholder Satisfaction?
Our process is fairly ad hoc. Typically we use conversations
in the hallway or ad hoc meetings” – CIO
“Understanding the business’s needs is important to us like
breathing, but it isn’t something we really have a lot of
processes around” – CIO
“We don’t really have much in place” – CIO
Info-Tech Research Group 7Info-Tech Research Group 7
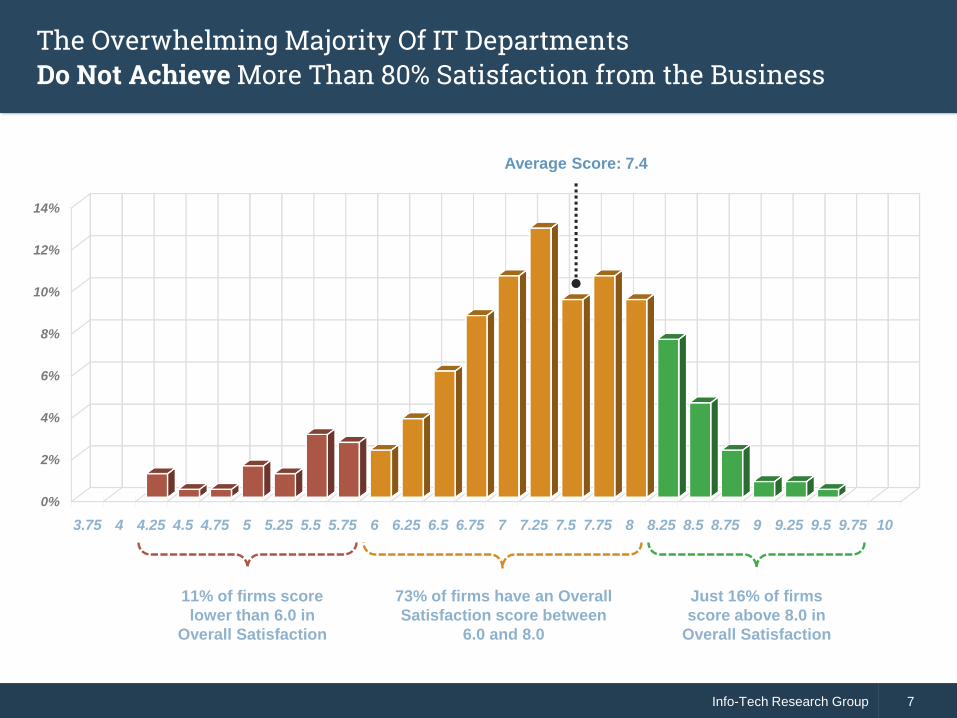
The Overwhelming Majority Of IT Departments Do Not Achieve More Than 80% Satisfaction from the Business
0%
2%
4%
6%
8%
10%
12%
14%
3.75 4 4.25 4.5 4.75 5 5.25 5.5 5.75 6 6.25 6.5 6.75 7 7.25 7.5 7.75 8 8.25 8.5 8.75 9 9.25 9.5 9.75 10
73% of firms have an Overall
Satisfaction score between
6.0 and 8.0
Just 16% of firms
score above 8.0 in
Overall Satisfaction
11% of firms score
lower than 6.0 in
Overall Satisfaction
Average Score: 7.4
Info-Tech Research Group 8Info-Tech Research Group 8
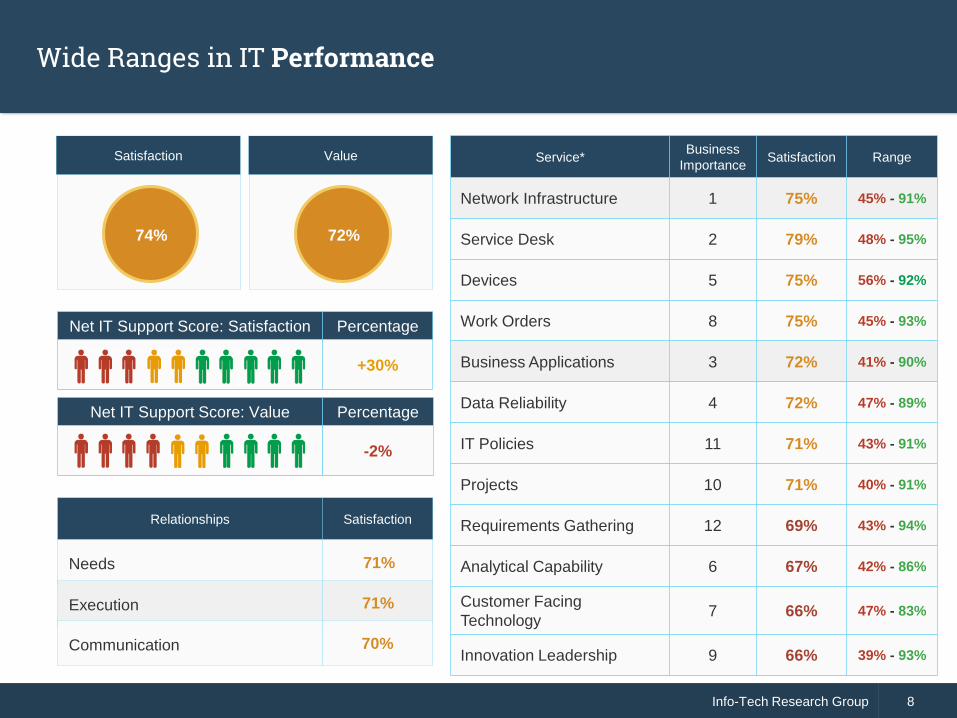
Wide Ranges in IT Performance
Relationships Satisfaction
71%
71%
70%
Needs
Execution
Communication
Satisfaction
74%
Net IT Support Score: Satisfaction Percentage
+30%
Net IT Support Score: Value Percentage
-2%
Value
72%
Service*Business
Importance Satisfaction Range
Network Infrastructure 1 75% 45% - 91%
Service Desk 2 79% 48% - 95%
Devices 5 75% 56% - 92%
Work Orders 8 75% 45% - 93%
Business Applications 3 72% 41% - 90%
Data Reliability 4 72% 47% - 89%
IT Policies 11 71% 43% - 91%
Projects 10 71% 40% - 91%
Requirements Gathering 12 69% 43% - 94%
Analytical Capability 6 67% 42% - 86%
Customer Facing
Technology7 66% 47% - 83%
Innovation Leadership 9 66% 39% - 93%
Info-Tech Research Group 9Info-Tech Research Group 9
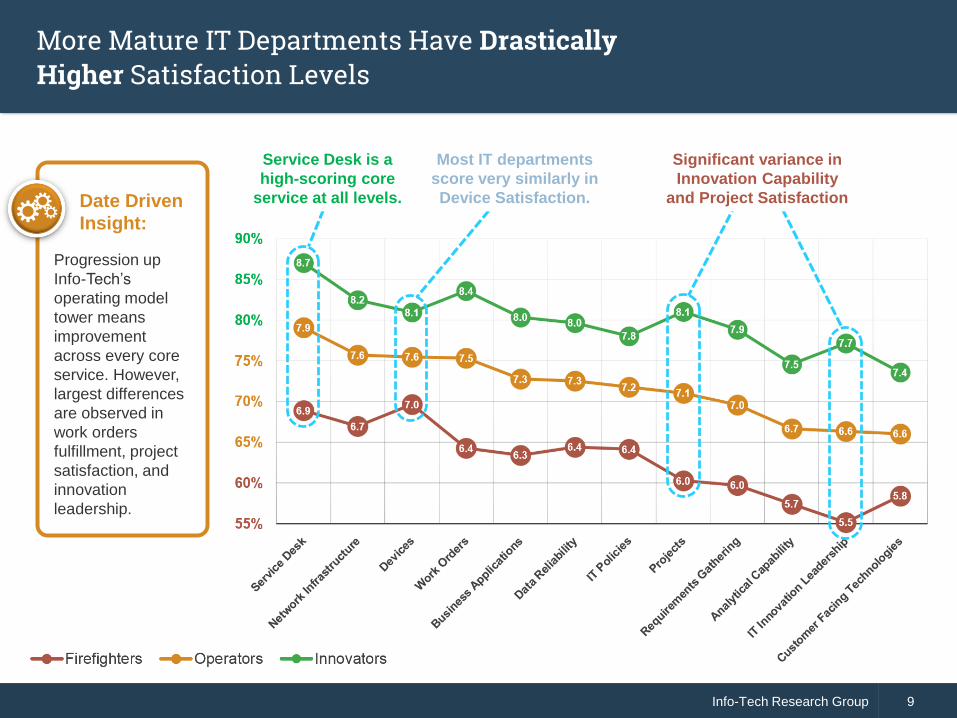
More Mature IT Departments Have Drastically Higher Satisfaction Levels
Date Driven
Insight:
Progression up
Info-Tech’s
operating model
tower means
improvement
across every core
service. However,
largest differences
are observed in
work orders
fulfillment, project
satisfaction, and
innovation
leadership.
Most IT departments
score very similarly in
Device Satisfaction.
Service Desk is a
high-scoring core
service at all levels.
Significant variance in
Innovation Capability
and Project Satisfaction
Info-Tech Research Group 10Info-Tech Research Group 10
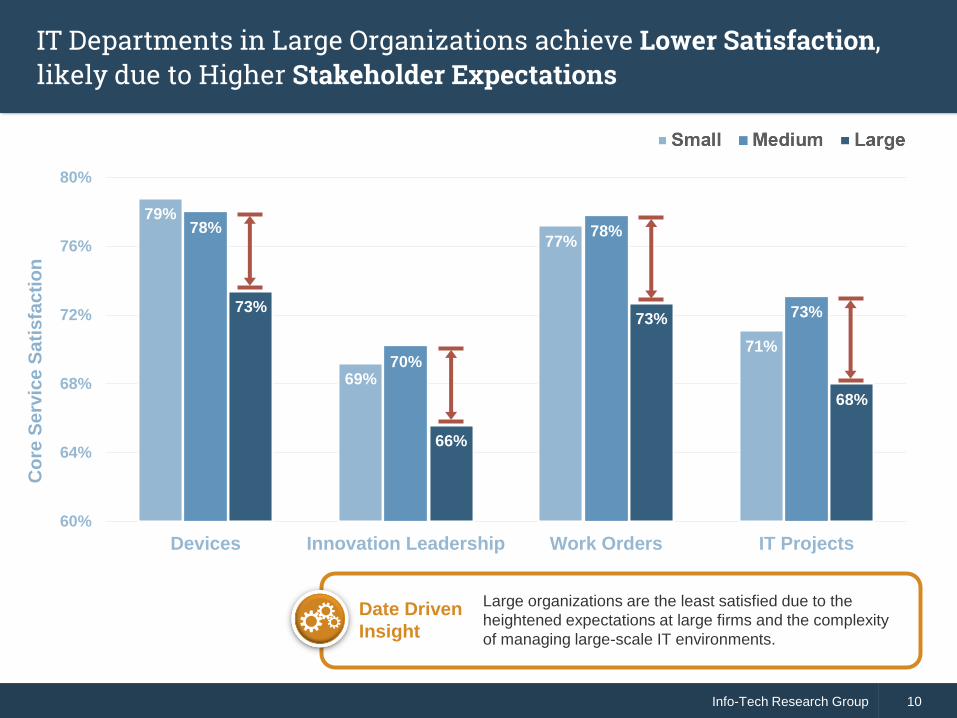
IT Departments in Large Organizations achieve Lower Satisfaction, likely due to Higher Stakeholder Expectations
79%
69%
77%
71%
78%
70%
78%
73%73%
66%
73%
68%
60%
64%
68%
72%
76%
80%
Devices Innovation Leadership Work Orders IT Projects
Co
re S
erv
ice
Sa
tis
fac
tio
n
Date Driven
Insight
Large organizations are the least satisfied due to the
heightened expectations at large firms and the complexity
of managing large-scale IT environments.
Info-Tech Research Group 11Info-Tech Research Group 11
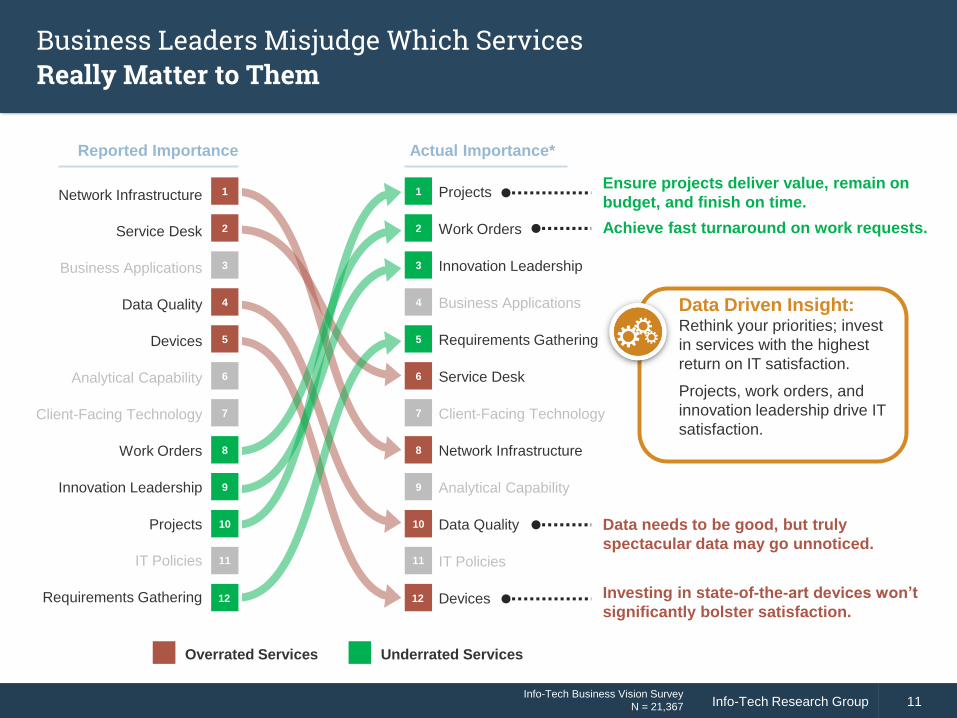
Business Leaders Misjudge Which Services Really Matter to Them
Network Infrastructure
Service Desk
Business Applications
Data Quality
Devices
Analytical Capability
Client-Facing Technology
Work Orders
Innovation Leadership
Projects
IT Policies
Requirements Gathering
Projects
Work Orders
Innovation Leadership
Business Applications
Requirements Gathering
Service Desk
Client-Facing Technology
Network Infrastructure
Analytical Capability
Data Quality
IT Policies
Devices
Data Driven Insight:Rethink your priorities; invest
in services with the highest
return on IT satisfaction.
Projects, work orders, and
innovation leadership drive IT
satisfaction.
Ensure projects deliver value, remain on
budget, and finish on time.
Data needs to be good, but truly
spectacular data may go unnoticed.
Investing in state-of-the-art devices won’t
significantly bolster satisfaction.
11
10
12
1
2
4
5
8
9
7
6
3
11
10
12
1
2
4
5
8
9
7
6
3
Info-Tech Business Vision Survey
N = 21,367
Achieve fast turnaround on work requests.
Reported Importance Actual Importance*
Overrated Services Underrated Services
Info-Tech Research Group 12Info-Tech Research Group 12
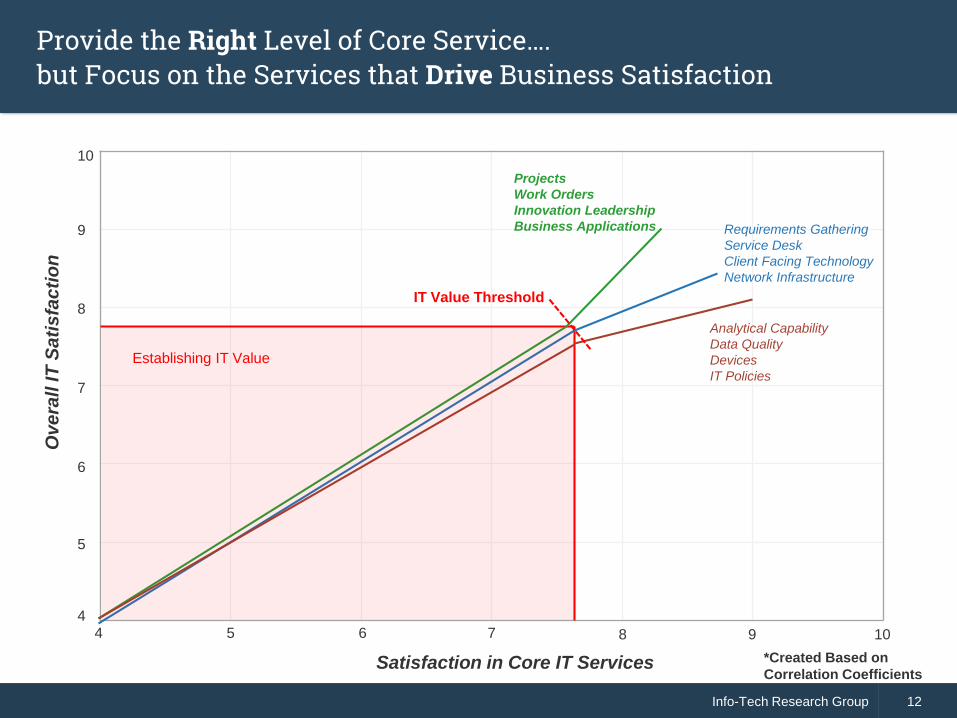
Provide the Right Level of Core Service….but Focus on the Services that Drive Business Satisfaction
Ov
era
ll IT
Sa
tis
fac
tio
n
Satisfaction in Core IT Services
10
9
8
7
6
5
44 5 6 7 8 9 10
Projects
Work Orders
Innovation Leadership
Business Applications Requirements Gathering
Service Desk
Client Facing Technology
Network Infrastructure
Analytical Capability
Data Quality
Devices
IT Policies
Establishing IT Value
IT Value Threshold
*Created Based on
Correlation Coefficients
Info-Tech Research Group 13Info-Tech Research Group 13
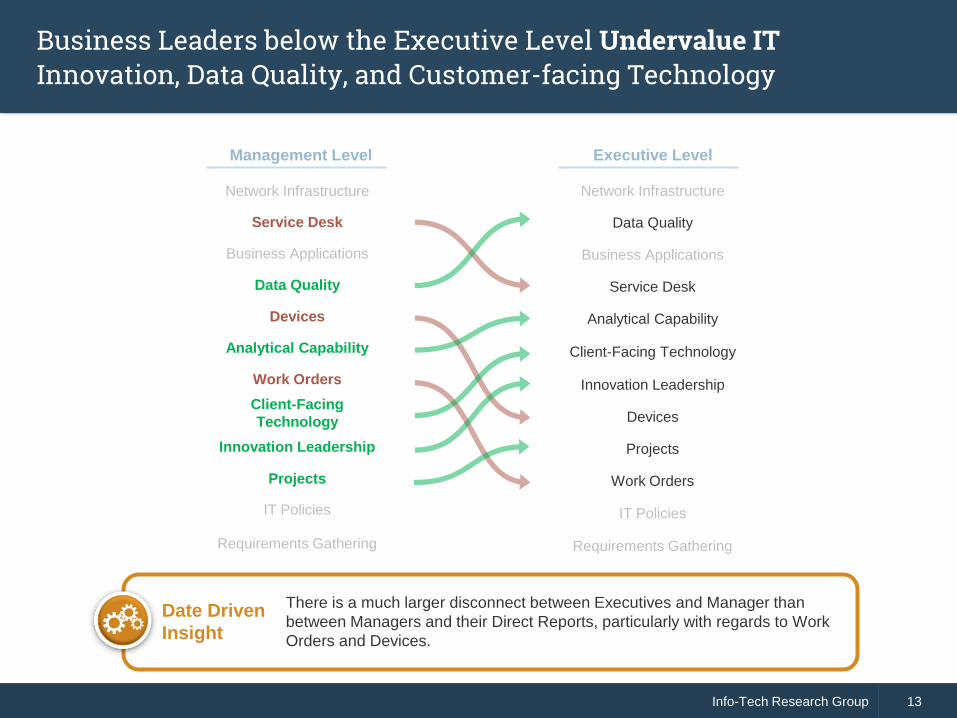
Business Leaders below the Executive Level Undervalue IT Innovation, Data Quality, and Customer-facing Technology
Network Infrastructure
Service Desk
Business Applications
Data Quality
Devices
Analytical Capability
Work Orders
Client-Facing
Technology
Innovation Leadership
Projects
IT Policies
Requirements Gathering
Network Infrastructure
Data Quality
Business Applications
Service Desk
Analytical Capability
Client-Facing Technology
Innovation Leadership
Devices
Projects
Work Orders
IT Policies
Requirements Gathering
Management Level Executive Level
Date Driven
Insight
There is a much larger disconnect between Executives and Manager than
between Managers and their Direct Reports, particularly with regards to Work
Orders and Devices.
Info-Tech Research Group 14Info-Tech Research Group 14
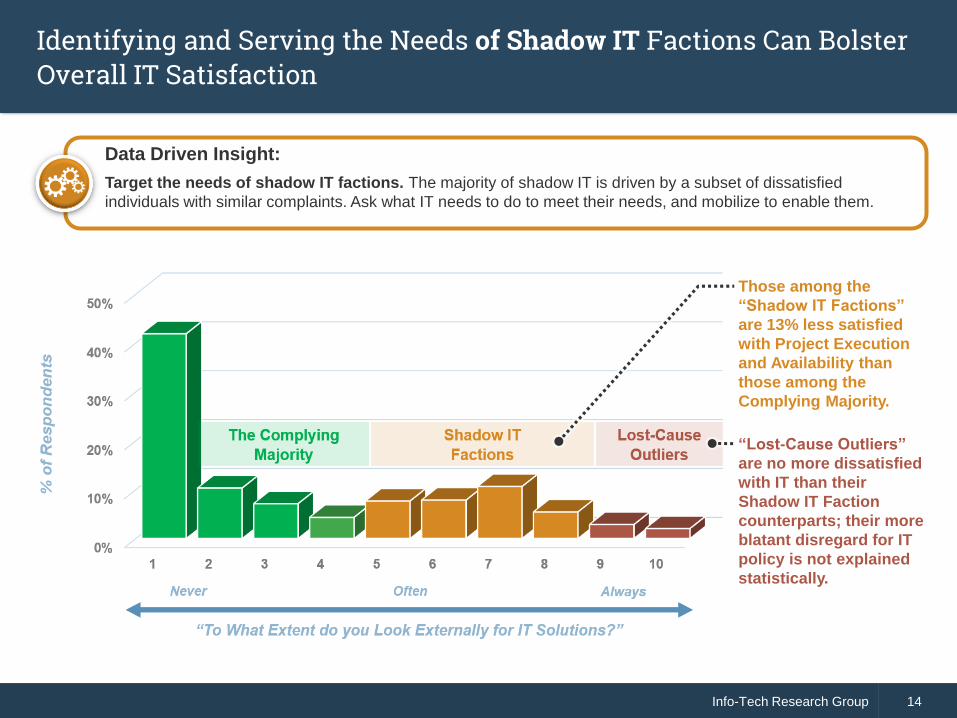
Identifying and Serving the Needs of Shadow IT Factions Can Bolster Overall IT Satisfaction
Those among the
“Shadow IT Factions”
are 13% less satisfied
with Project Execution
and Availability than
those among the
Complying Majority.
“Lost-Cause Outliers”
are no more dissatisfied
with IT than their
Shadow IT Faction
counterparts; their more
blatant disregard for IT
policy is not explained
statistically.
Data Driven Insight:
Target the needs of shadow IT factions. The majority of shadow IT is driven by a subset of dissatisfied
individuals with similar complaints. Ask what IT needs to do to meet their needs, and mobilize to enable them.
Info-Tech Research Group 15Info-Tech Research Group 15
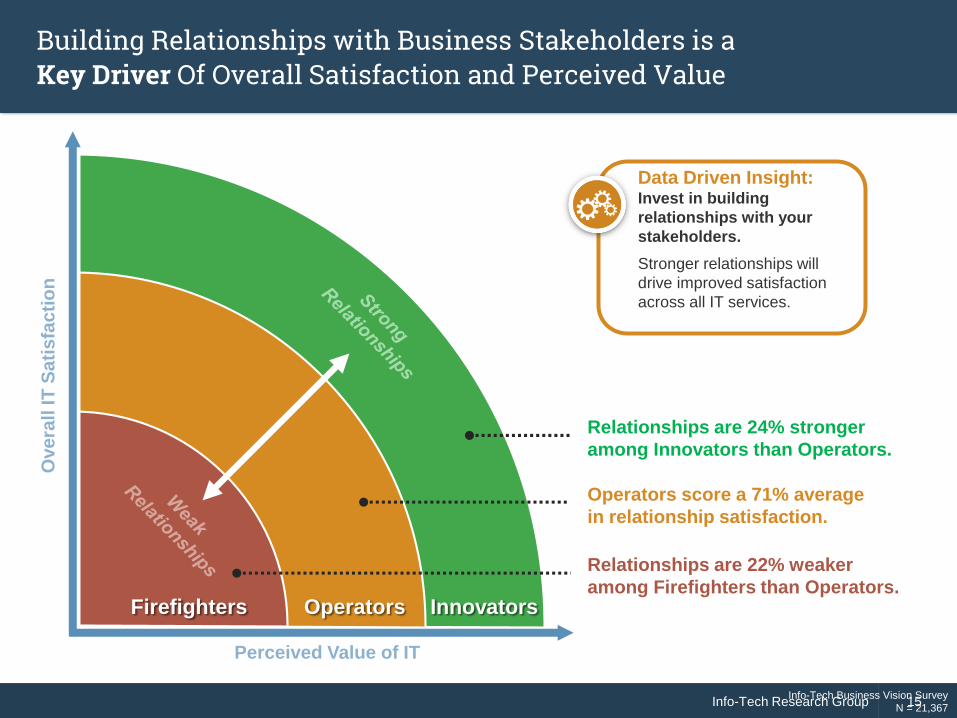
Building Relationships with Business Stakeholders is a Key Driver Of Overall Satisfaction and Perceived Value
Ove
rall
IT
Sa
tis
fac
tio
n
Perceived Value of IT
Firefighters Operators Innovators
Relationships are 24% stronger
among Innovators than Operators.
Operators score a 71% average
in relationship satisfaction.
Relationships are 22% weaker
among Firefighters than Operators.
Info-Tech Business Vision Survey
N = 21,367
Data Driven Insight:Invest in building
relationships with your
stakeholders.
Stronger relationships will
drive improved satisfaction
across all IT services.
CEO-CIO AlignmentFindings from the Office of the CEO
Info-Tech Research Group 17Info-Tech Research Group 17
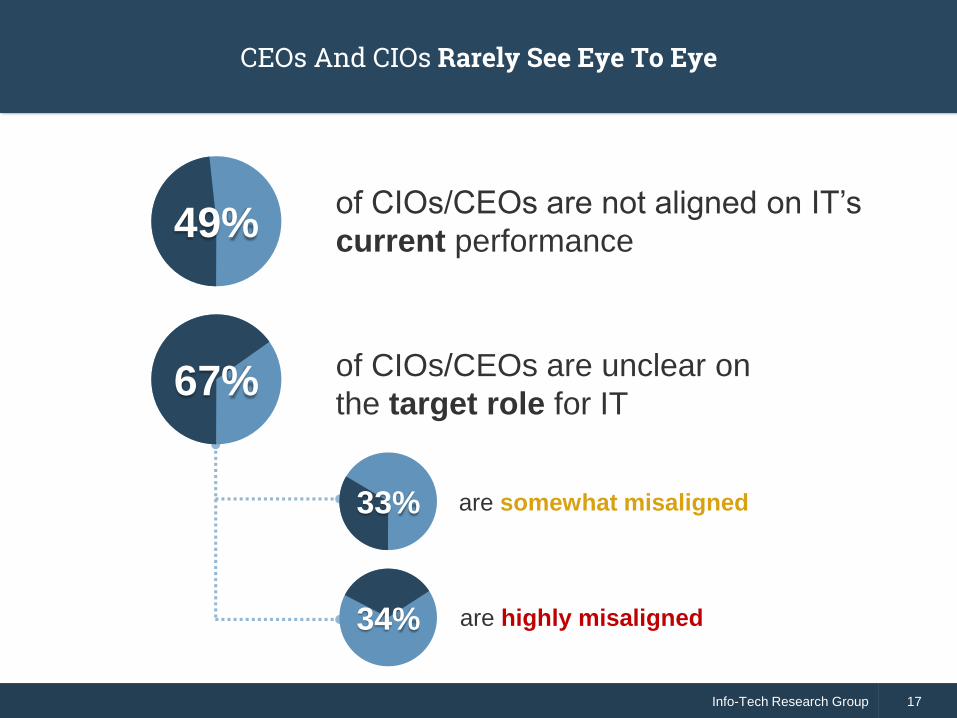
CEOs And CIOs Rarely See Eye To Eye
of CIOs/CEOs are not aligned on IT’s
current performance49%
67%
are somewhat misaligned
of CIOs/CEOs are unclear on
the target role for IT
33%
34% are highly misaligned
Info-Tech Research Group 18Info-Tech Research Group 18
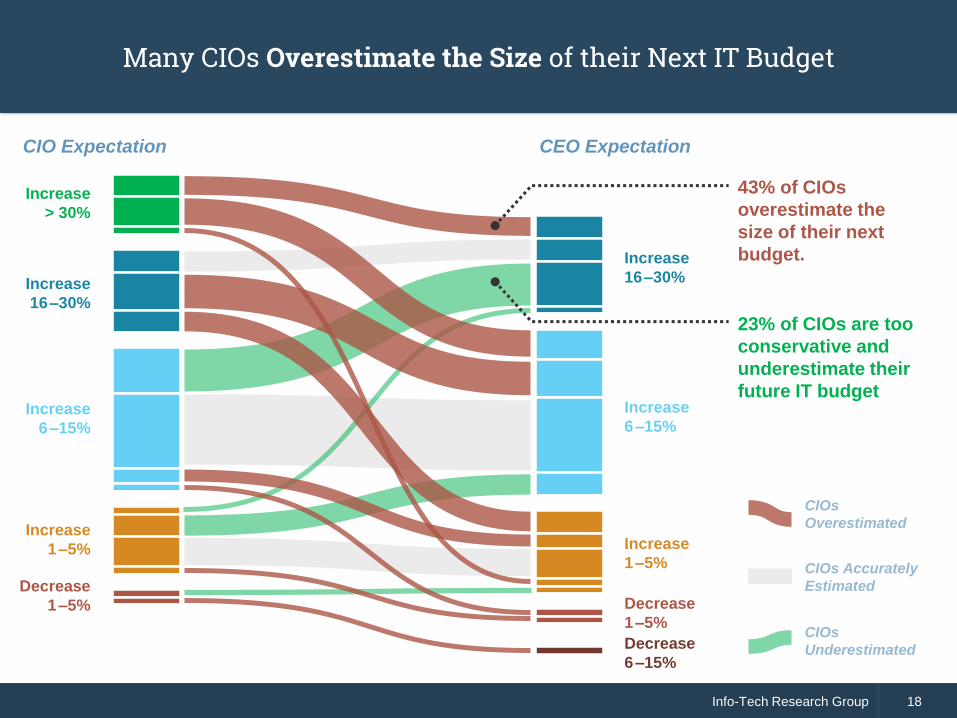
Many CIOs Overestimate the Size of their Next IT Budget
Increase
16–30%
Increase
> 30%
Increase
6–15%
Increase
1–5%
Decrease
1–5%
Increase
16–30%
Increase
6–15%
Increase
1–5%
Decrease
1–5%
Decrease
6–15%
CIO Expectation CEO Expectation
CIOs Accurately
Estimated
CIOs
Overestimated
CIOs
Underestimated
43% of CIOs
overestimate the
size of their next
budget.
23% of CIOs are too
conservative and
underestimate their
future IT budget
Info-Tech Research Group 19Info-Tech Research Group 19
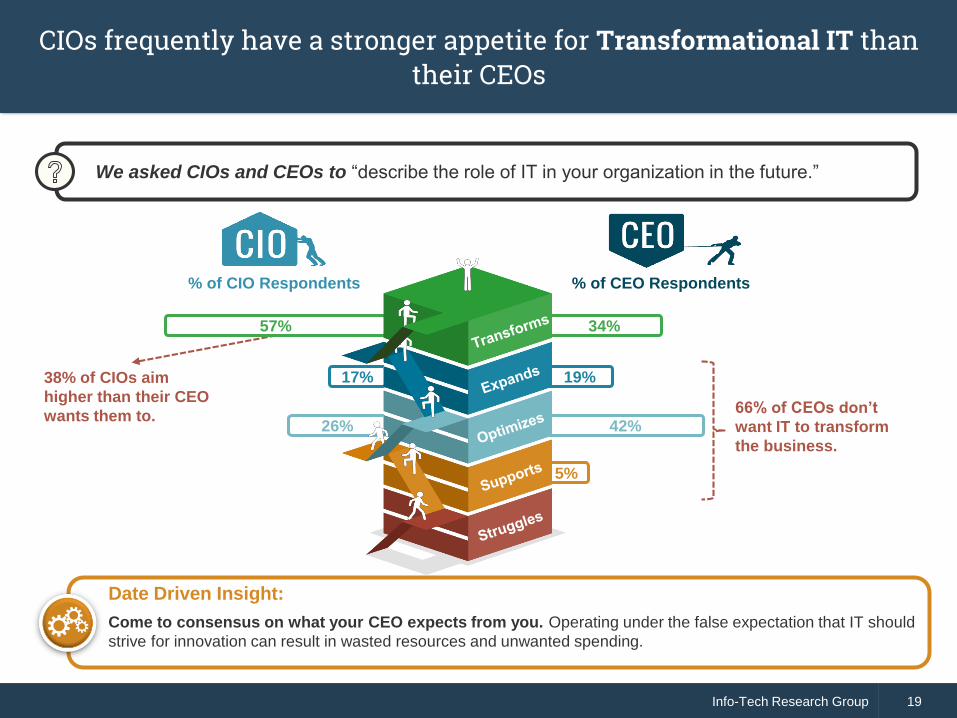
CIOs frequently have a stronger appetite for Transformational IT than their CEOs
66% of CEOs don’t
want IT to transform
the business.
38% of CIOs aim
higher than their CEO
wants them to.
We asked CIOs and CEOs to “describe the role of IT in your organization in the future.”
17%
34%57%
26%
19%
42%
5%
% of CIO Respondents % of CEO Respondents
Date Driven Insight:
Come to consensus on what your CEO expects from you. Operating under the false expectation that IT should
strive for innovation can result in wasted resources and unwanted spending.
Info-Tech Research Group 20Info-Tech Research Group 20
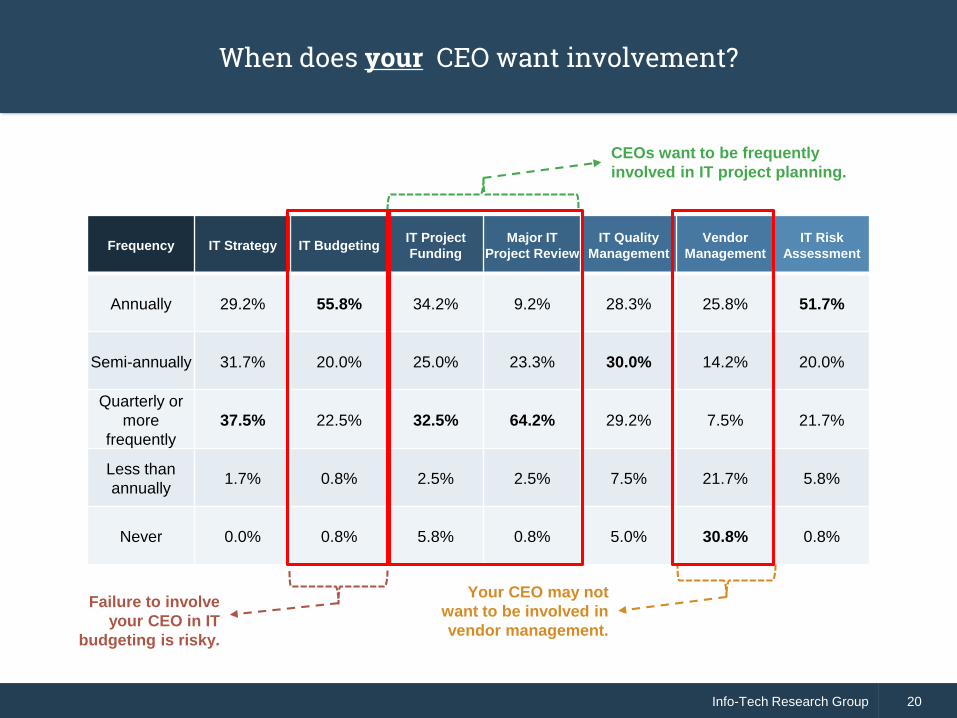
When does your CEO want involvement?
Frequency IT Strategy IT BudgetingIT Project
Funding
Major IT
Project Review
IT Quality
Management
Vendor
Management
IT Risk
Assessment
Annually 29.2% 55.8% 34.2% 9.2% 28.3% 25.8% 51.7%
Semi-annually 31.7% 20.0% 25.0% 23.3% 30.0% 14.2% 20.0%
Quarterly or
more
frequently
37.5% 22.5% 32.5% 64.2% 29.2% 7.5% 21.7%
Less than
annually1.7% 0.8% 2.5% 2.5% 7.5% 21.7% 5.8%
Never 0.0% 0.8% 5.8% 0.8% 5.0% 30.8% 0.8%
CEOs want to be frequently
involved in IT project planning.
Failure to involve
your CEO in IT
budgeting is risky.
Your CEO may not
want to be involved in
vendor management.
Info-Tech Research Group 21Info-Tech Research Group 21
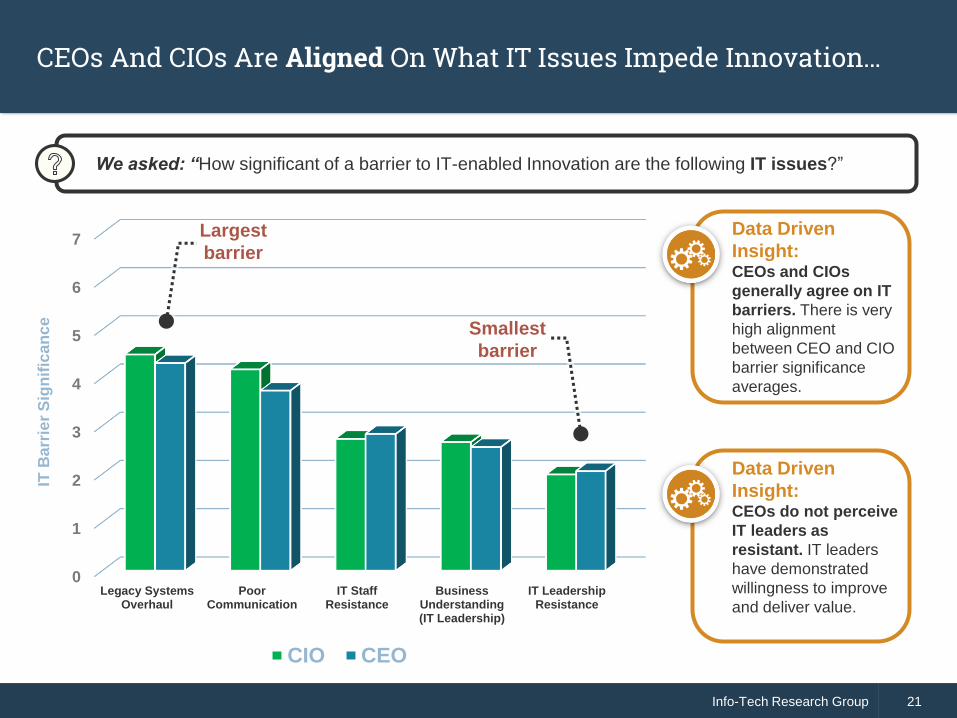
CEOs And CIOs Are Aligned On What IT Issues Impede Innovation…
0
1
2
3
4
5
6
7
Legacy SystemsOverhaul
PoorCommunication
IT StaffResistance
BusinessUnderstanding(IT Leadership)
IT LeadershipResistance
CIO CEO
We asked: “How significant of a barrier to IT-enabled Innovation are the following IT issues?”
IT B
arr
ier
Sig
nif
ica
nc
e
Largest
barrier
Data Driven
Insight:CEOs and CIOs
generally agree on IT
barriers. There is very
high alignment
between CEO and CIO
barrier significance
averages.
Data Driven
Insight:CEOs do not perceive
IT leaders as
resistant. IT leaders
have demonstrated
willingness to improve
and deliver value.
Smallest
barrier
Info-Tech Research Group 22Info-Tech Research Group 22
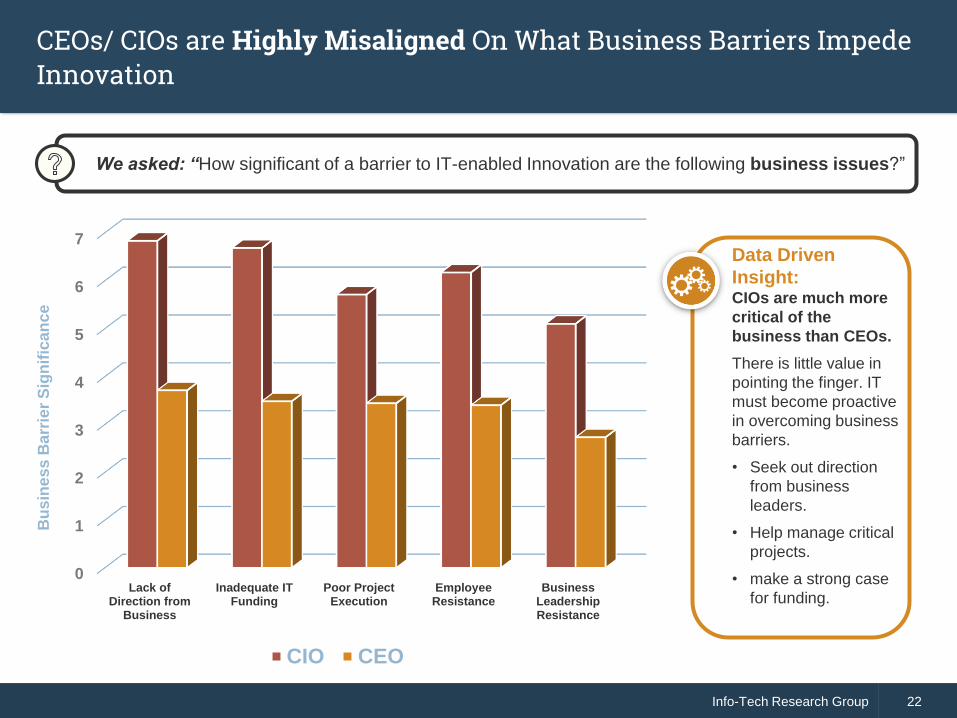
CEOs/ CIOs are Highly Misaligned On What Business Barriers Impede Innovation
0
1
2
3
4
5
6
7
Lack ofDirection from
Business
Inadequate ITFunding
Poor ProjectExecution
EmployeeResistance
BusinessLeadershipResistance
CIO CEO
We asked: “How significant of a barrier to IT-enabled Innovation are the following business issues?”
Bu
sin
es
s B
arr
ier
Sig
nif
ica
nc
e
Data Driven
Insight:CIOs are much more
critical of the
business than CEOs.
There is little value in
pointing the finger. IT
must become proactive
in overcoming business
barriers.
• Seek out direction
from business
leaders.
• Help manage critical
projects.
• make a strong case
for funding.
Info-Tech Research Group 23Info-Tech Research Group 23
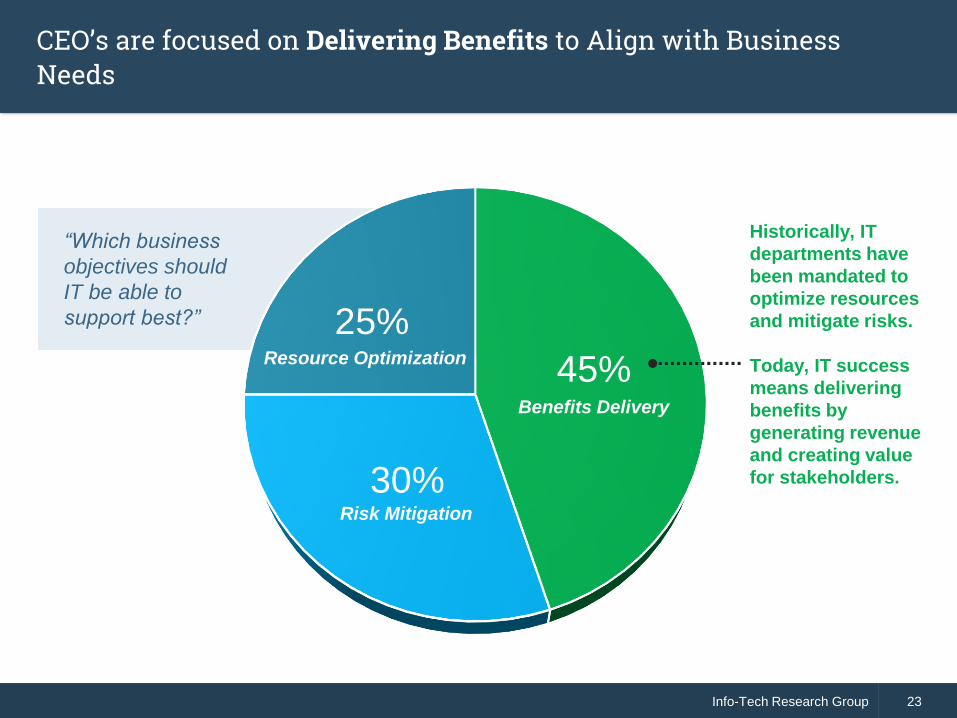
CEO’s are focused on Delivering Benefits to Align with Business Needs
45%
30%
25%Resource Optimization
Benefits Delivery
Risk Mitigation
“Which business
objectives should
IT be able to
support best?”
Historically, IT
departments have
been mandated to
optimize resources
and mitigate risks.
Today, IT success
means delivering
benefits by
generating revenue
and creating value
for stakeholders.
Info-Tech Research Group 24Info-Tech Research Group 24
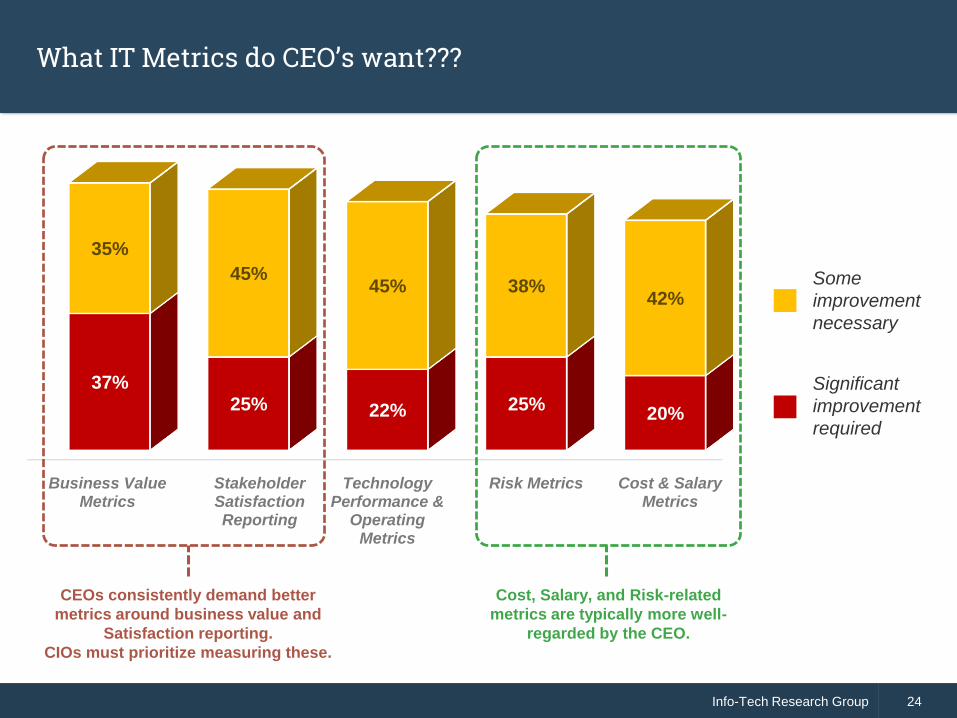
What IT Metrics do CEO’s want???
Business ValueMetrics
StakeholderSatisfactionReporting
TechnologyPerformance &
OperatingMetrics
Risk Metrics Cost & SalaryMetrics
37%25% 22% 25%
20%
35%
45%45% 38%
42%Some
improvement
necessary
Significant
improvement
required
CEOs consistently demand better
metrics around business value and
Satisfaction reporting.
CIOs must prioritize measuring these.
Cost, Salary, and Risk-related
metrics are typically more well-
regarded by the CEO.
Info-Tech Research Group 25Info-Tech Research Group 25
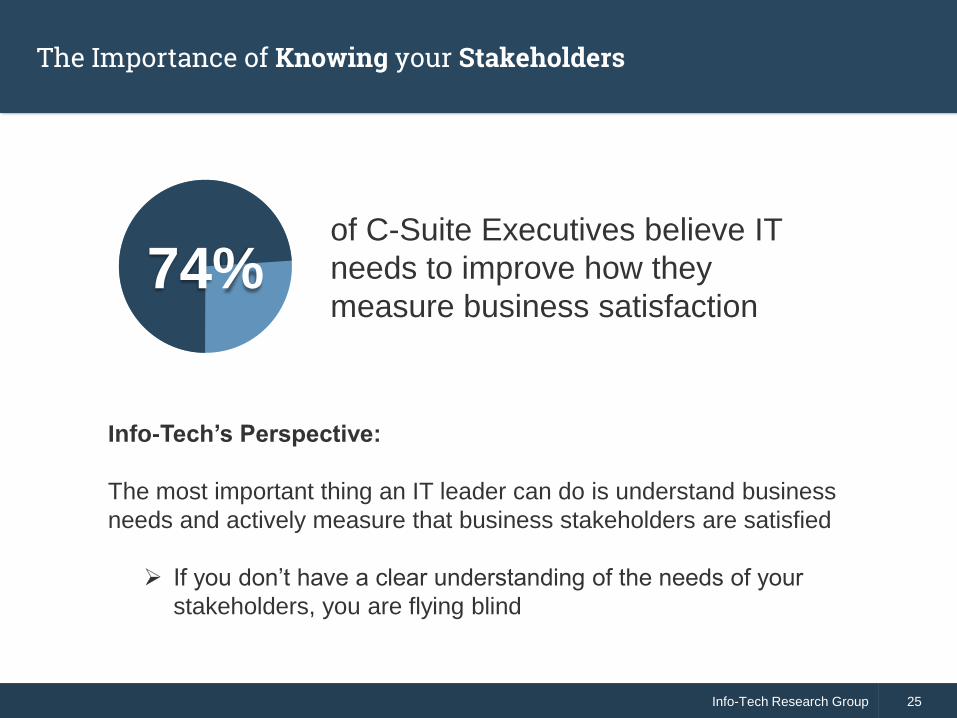
The Importance of Knowing your Stakeholders
Info-Tech’s Perspective:
The most important thing an IT leader can do is understand business
needs and actively measure that business stakeholders are satisfied
If you don’t have a clear understanding of the needs of your
stakeholders, you are flying blind
of C-Suite Executives believe IT
needs to improve how they
measure business satisfaction74%
Management & Governance
Findings from IT Organizations
Info-Tech Research Group 27Info-Tech Research Group 27
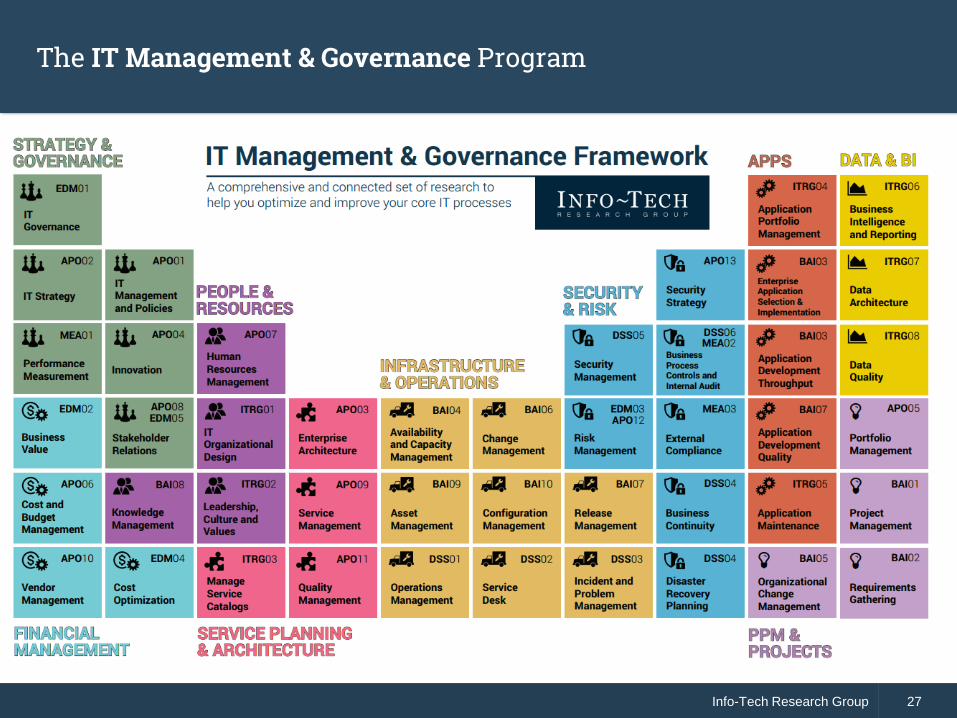
The IT Management & Governance Program
Info-Tech Research Group 28Info-Tech Research Group 28
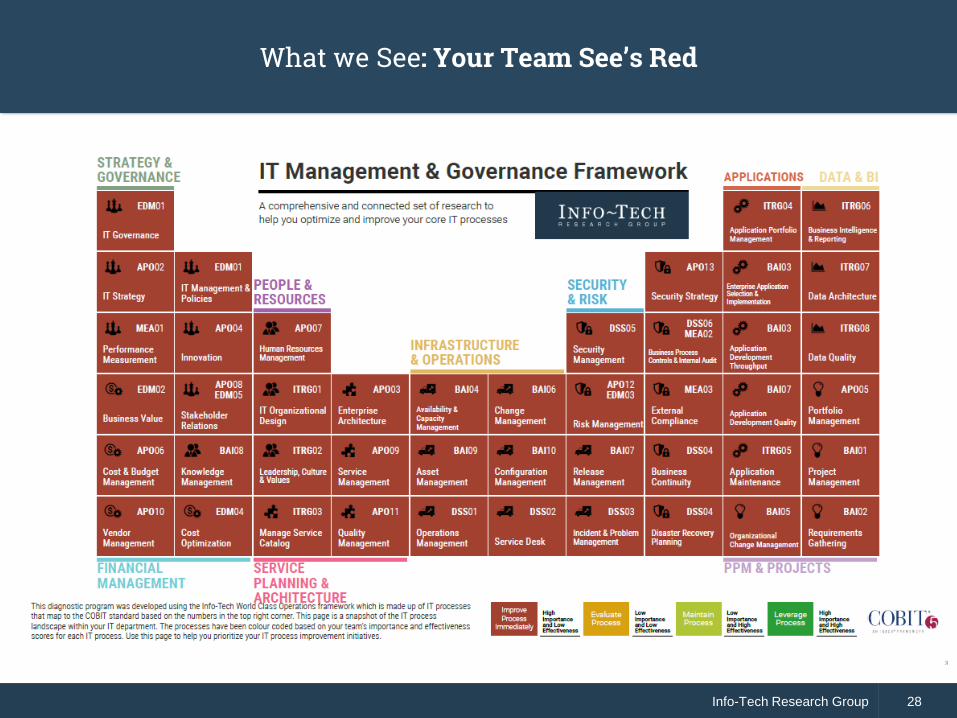
What we See: Your Team See’s Red
Info-Tech Research Group 29Info-Tech Research Group 29
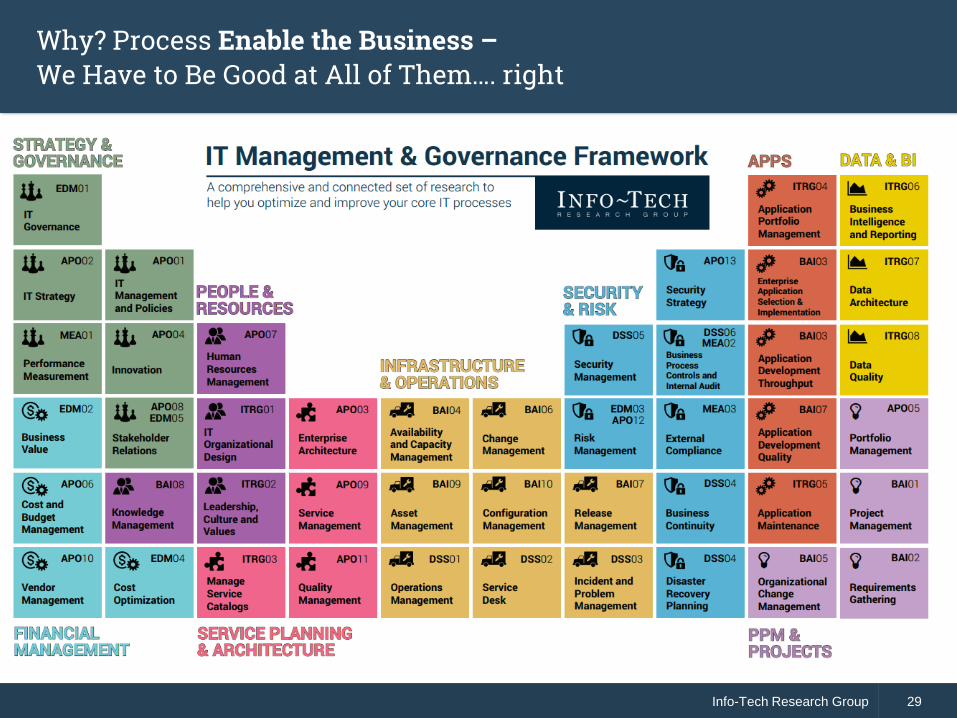
Why? Process Enable the Business –We Have to Be Good at All of Them…. right
Info-Tech Research Group 30Info-Tech Research Group 30
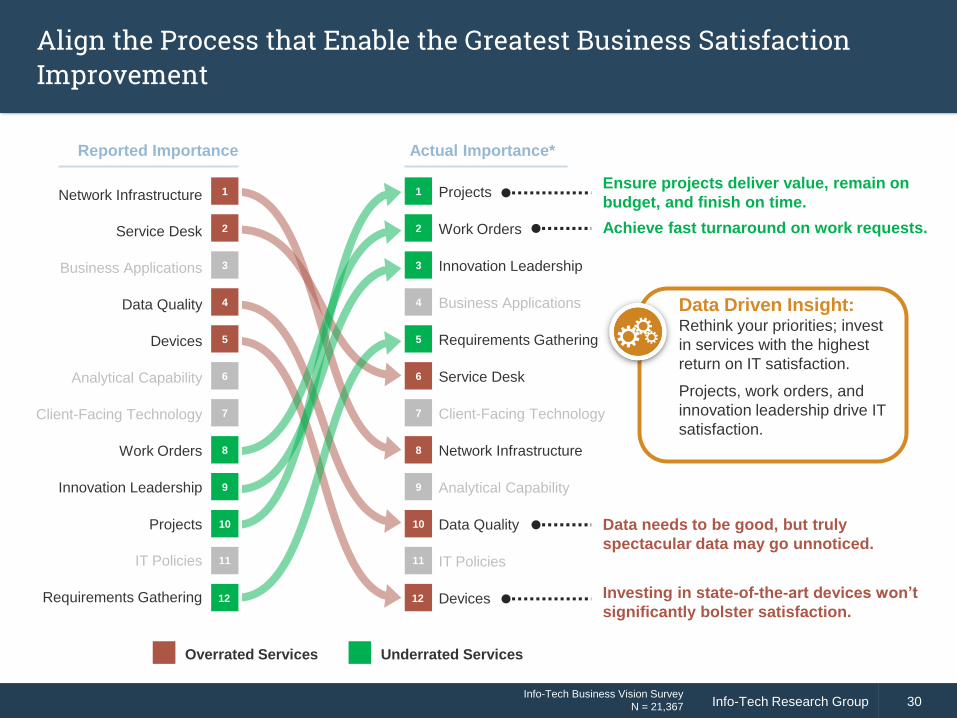
Align the Process that Enable the Greatest Business Satisfaction Improvement
Network Infrastructure
Service Desk
Business Applications
Data Quality
Devices
Analytical Capability
Client-Facing Technology
Work Orders
Innovation Leadership
Projects
IT Policies
Requirements Gathering
Projects
Work Orders
Innovation Leadership
Business Applications
Requirements Gathering
Service Desk
Client-Facing Technology
Network Infrastructure
Analytical Capability
Data Quality
IT Policies
Devices
Data Driven Insight:Rethink your priorities; invest
in services with the highest
return on IT satisfaction.
Projects, work orders, and
innovation leadership drive IT
satisfaction.
Ensure projects deliver value, remain on
budget, and finish on time.
Data needs to be good, but truly
spectacular data may go unnoticed.
Investing in state-of-the-art devices won’t
significantly bolster satisfaction.
11
10
12
1
2
4
5
8
9
7
6
3
11
10
12
1
2
4
5
8
9
7
6
3
Info-Tech Business Vision Survey
N = 21,367
Achieve fast turnaround on work requests.
Reported Importance Actual Importance*
Overrated Services Underrated Services
Info-Tech Research Group 31Info-Tech Research Group 31
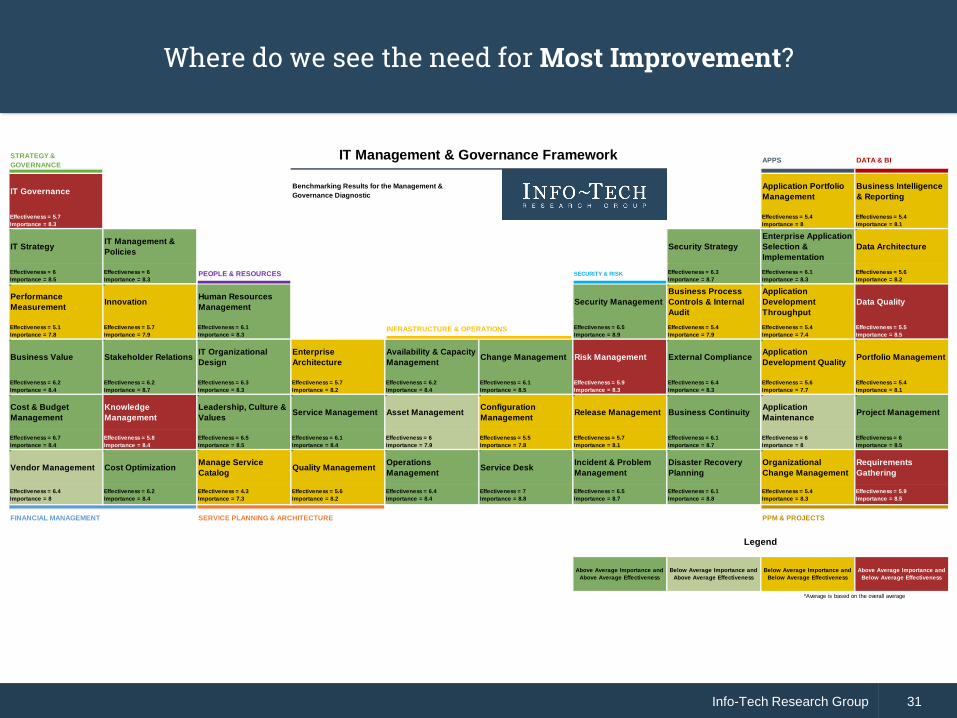
Where do we see the need for Most Improvement?
STRATEGY &
GOVERNANCEAPPS DATA & BI
IT GovernanceApplication Portfolio
Management
Business Intelligence
& Reporting
Effectiveness = 5.7
Importance = 8.3
Effectiveness = 5.4
Importance = 8
Effectiveness = 5.4
Importance = 8.1
IT StrategyIT Management &
PoliciesSecurity Strategy
Enterprise Application
Selection &
Implementation
Data Architecture
Effectiveness = 6
Importance = 8.5
Effectiveness = 6
Importance = 8.3PEOPLE & RESOURCES SECURITY & RISK Effectiveness = 6.3
Importance = 8.7
Effectiveness = 6.1
Importance = 8.3
Effectiveness = 5.6
Importance = 8.2
Performance
MeasurementInnovation
Human Resources
ManagementSecurity Management
Business Process
Controls & Internal
Audit
Application
Development
Throughput
Data Quality
Effectiveness = 5.1
Importance = 7.8
Effectiveness = 5.7
Importance = 7.9
Effectiveness = 6.1
Importance = 8.3
Effectiveness = 6.5
Importance = 8.9
Effectiveness = 5.4
Importance = 7.9
Effectiveness = 5.4
Importance = 7.4
Effectiveness = 5.5
Importance = 8.5
Business Value Stakeholder RelationsIT Organizational
Design
Enterprise
Architecture
Availability & Capacity
ManagementChange Management Risk Management External Compliance
Application
Development QualityPortfolio Management
Effectiveness = 6.2
Importance = 8.4
Effectiveness = 6.2
Importance = 8.7
Effectiveness = 6.3
Importance = 8.3
Effectiveness = 5.7
Importance = 8.2
Effectiveness = 6.2
Importance = 8.4
Effectiveness = 6.1
Importance = 8.5
Effectiveness = 5.9
Importance = 8.3
Effectiveness = 6.4
Importance = 8.3
Effectiveness = 5.6
Importance = 7.7
Effectiveness = 5.4
Importance = 8.1
Cost & Budget
Management
Knowledge
Management
Leadership, Culture &
ValuesService Management Asset Management
Configuration
ManagementRelease Management Business Continuity
Application
MaintenanceProject Management
Effectiveness = 6.7
Importance = 8.4
Effectiveness = 5.8
Importance = 8.4
Effectiveness = 6.5
Importance = 8.5
Effectiveness = 6.1
Importance = 8.4
Effectiveness = 6
Importance = 7.9
Effectiveness = 5.5
Importance = 7.8
Effectiveness = 5.7
Importance = 8.1
Effectiveness = 6.1
Importance = 8.7
Effectiveness = 6
Importance = 8
Effectiveness = 6
Importance = 8.5
Vendor Management Cost OptimizationManage Service
CatalogQuality Management
Operations
ManagementService Desk
Incident & Problem
Management
Disaster Recovery
Planning
Organizational
Change Management
Requirements
Gathering
Effectiveness = 6.4
Importance = 8
Effectiveness = 6.2
Importance = 8.4
Effectiveness = 4.3
Importance = 7.3
Effectiveness = 5.6
Importance = 8.2
Effectiveness = 6.4
Importance = 8.4
Effectiveness = 7
Importance = 8.8
Effectiveness = 6.5
Importance = 8.7
Effectiveness = 6.1
Importance = 8.8
Effectiveness = 5.4
Importance = 8.3
Effectiveness = 5.9
Importance = 8.5
FINANCIAL MANAGEMENT PPM & PROJECTS
Above Average Importance and
Above Average Effectiveness
Below Average Importance and
Above Average Effectiveness
Above Average Importance and
Below Average Effectiveness
Below Average Importance and
Below Average Effectiveness
*Average is based on the overall average
Legend
INFRASTRUCTURE & OPERATIONS
SERVICE PLANNING & ARCHITECTURE
IT Management & Governance Framework
Benchmarking Results for the Management &
Governance Diagnostic
Info-Tech Research Group 32Info-Tech Research Group 32
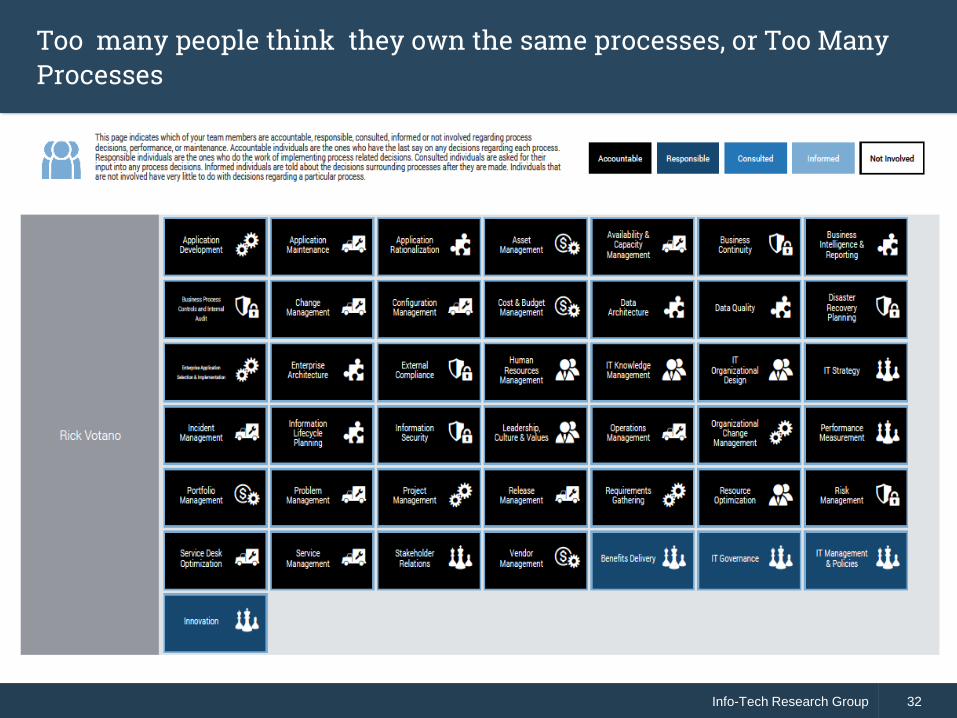
Too many people think they own the same processes, or Too Many Processes
Info-Tech Research Group 33Info-Tech Research Group 33
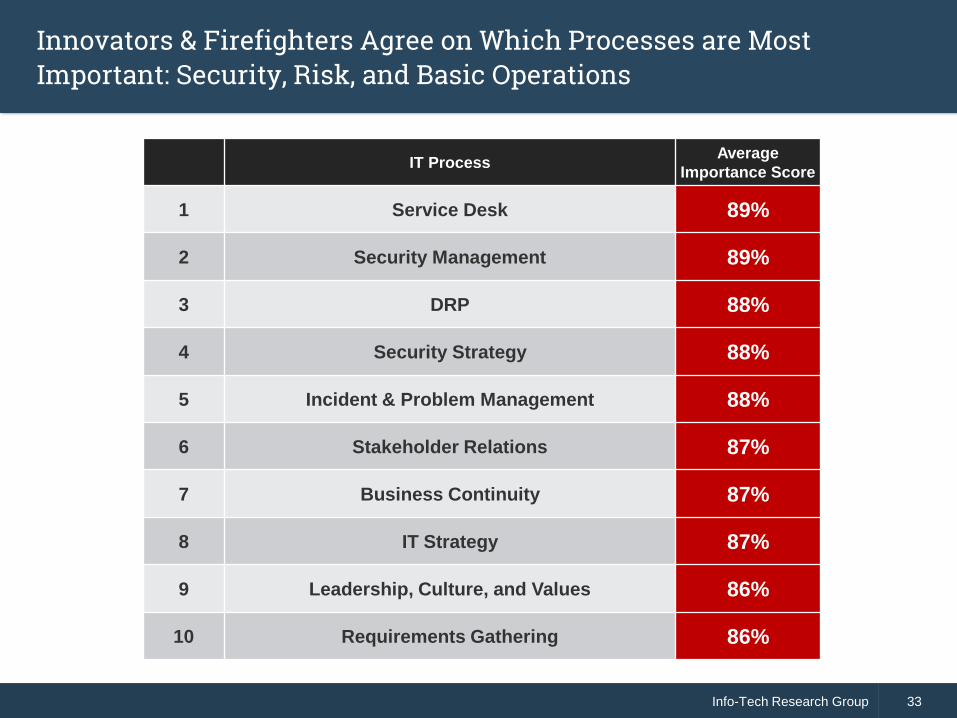
Innovators & Firefighters Agree on Which Processes are Most Important: Security, Risk, and Basic Operations
IT ProcessAverage
Importance Score
1 Service Desk 89%
2 Security Management 89%
3 DRP 88%
4 Security Strategy 88%
5 Incident & Problem Management 88%
6 Stakeholder Relations 87%
7 Business Continuity 87%
8 IT Strategy 87%
9 Leadership, Culture, and Values 86%
10 Requirements Gathering 86%
Info-Tech Research Group 34Info-Tech Research Group 34
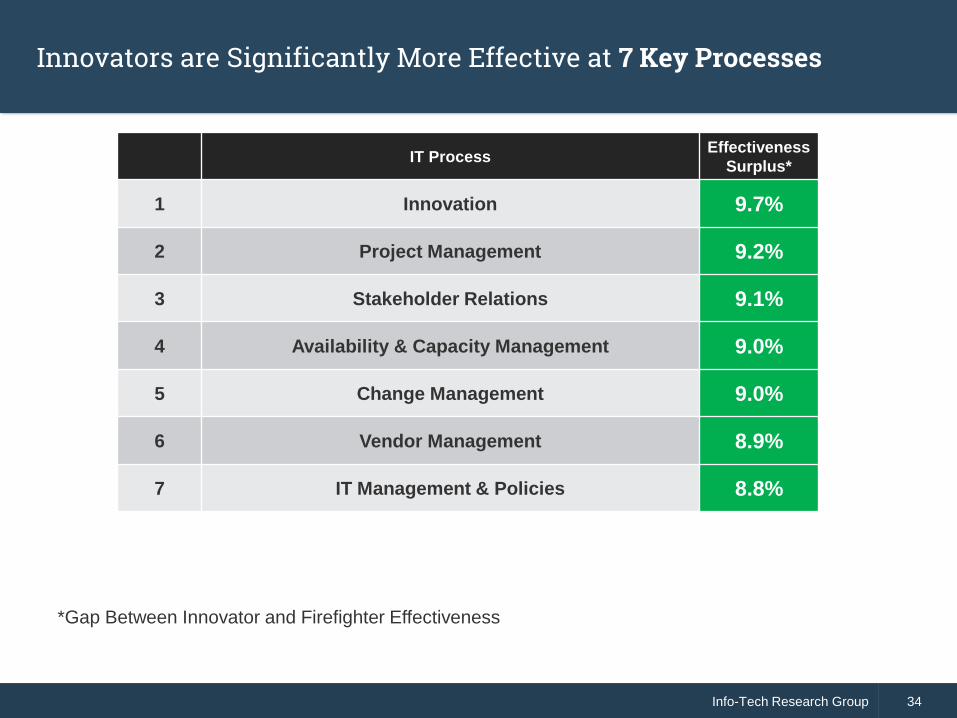
Innovators are Significantly More Effective at 7 Key Processes
IT ProcessEffectiveness
Surplus*
1 Innovation 9.7%
2 Project Management 9.2%
3 Stakeholder Relations 9.1%
4 Availability & Capacity Management 9.0%
5 Change Management 9.0%
6 Vendor Management 8.9%
7 IT Management & Policies 8.8%
*Gap Between Innovator and Firefighter Effectiveness
Info-Tech Research Group 35Info-Tech Research Group 35
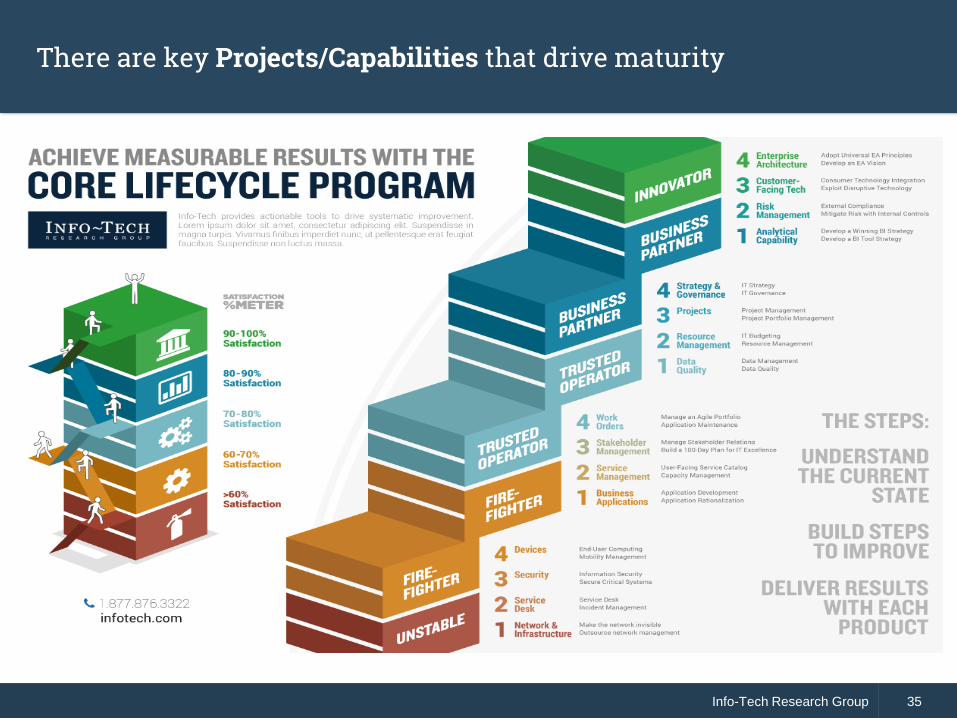
There are key Projects/Capabilities that drive maturity
Info-Tech Research Group 36Info-Tech Research Group 36
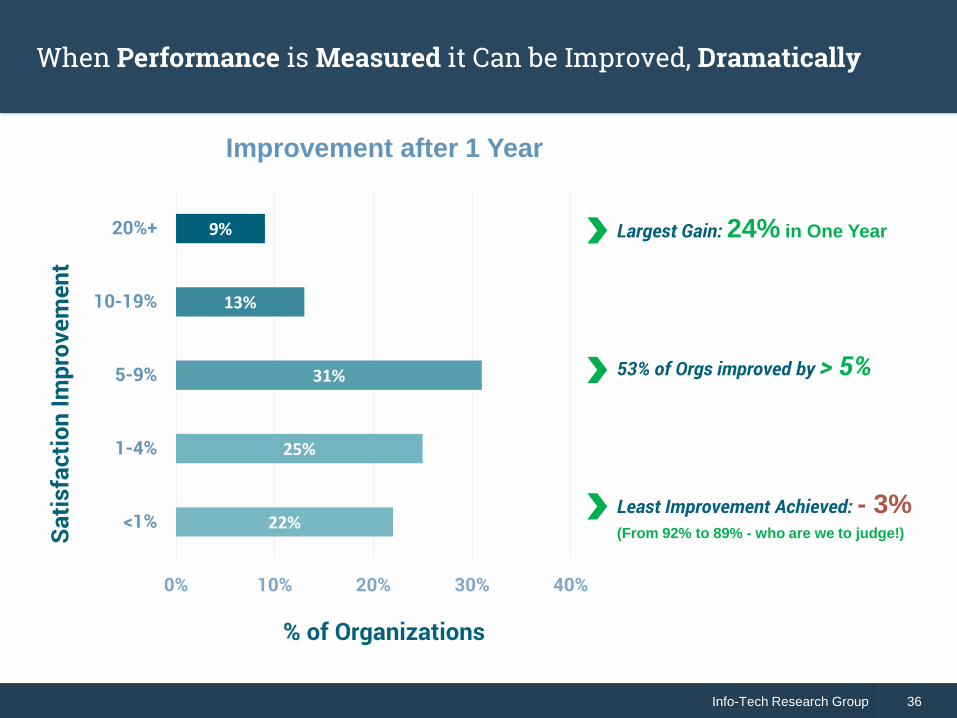
When Performance is Measured it Can be Improved, Dramatically
22%
25%
31%
13%
9%
0% 10% 20% 30% 40%
<1%
1-4%
5-9%
10-19%
20%+
% of Organizations
Satis
fact
ion
Impr
ovem
ent
Improvement after 1 Year
Largest Gain: 24% in One Year
53% of Orgs improved by > 5%
Least Improvement Achieved: - 3%(From 92% to 89% - who are we to judge!)
Info-Tech Research Group 37Info-Tech Research Group 37
A few Last Thoughts
• Challenge yourself and your team on how to Change
the conversation from “cost” to “value”
• Leverage tools, standards, and Data to accelerate
decision making
• You can’t do it alone – understand your team and their
capabilities – bring them to the level you need
• Be relentless – dedication, discipline and drive are
more important to success than anything you can buy