acceptance testing and quality control of … · aapm report no. 93 acceptance testing and quality...
TRANSCRIPT

AAPM REPORT NO. 93
Acceptance Testing and Quality Controlof Photostimulable Storage Phosphor Imaging Systems
Report of AAPM Task Group 10
October 2006
© 2006 by American Association of Physicists in Medicine
DISCLAIMER: This publication is based on sources and information believed to be reliable, but the AAPM and the editors disclaim any warranty or
liability based on or relating to the contentsof this publication.
The AAPM does not endorse any products, manufacturers, or suppliers. Nothing in this
publication should be interpreted as implying such endorsement.

DISCLAIMER: This publication is based on sources and information believed to be reliable, but the AAPM, the editors, and the publisher disclaim any warranty or liability based on or relating to
the contents of this publication.
The AAPM does not endorse any products, manufacturers, or suppliers. Nothing in this publication should be interpreted as implying such endorsement.
ISBN-13: 978-1-888340-64-8ISBN-10: 978-1-888340-64-9
ISSN: 0271-7344
© 2006 by American Association of Physicists in Medicine
All rights reserved. No part of this publication may be reproduced, stored in a retrieval system, or transmitted in any form or by any means (electronic, mechanical, photocopying, recording, or
otherwise) without the prior written permission of the publisher.
Published byAmerican Association of Physicists in Medicine
One Physics EllipseCollege Park, MD 20740-3846

AAPM REPORT NO. 93
Acceptance Testing and Quality Controlof Photostimulable Storage Phosphor Imaging Systems
Report of AAPM Task Group 10
Task Group Members:J. Anthony Seibert (Chair) Terese M. BoguckiTed CionaWalter Huda Andrew KarellasJohn R. MercierEhsan Samei S. Jeff ShepardBrent K. StewartKeith J. StraussOrhan H. Suleiman Doug TuckerRobert A. UzenoffJohn Conrad Weiser Charles E. Willis

This page intentionally left blank.

v
Abstract ............................................................................................................................ ix
1. Introduction.............................................................................................................. 1
2. System Overview .................................................................................................... 12.1 PSP Image Acquisition....................................................................................... 12.2 PSP Detector Characteristics.............................................................................. 3
2.2.1 Doping and Absorption Process ............................................................. 32.2.2 Fading.................................................................................................... 52.2.3 Stimulation and Emission....................................................................... 5
2.3 The Readout Process .......................................................................................... 62.3.1 Point-scan Laser Readout....................................................................... 62.3.2 Dual-side Laser Readout........................................................................ 82.3.3 Line-scan Laser Readout ....................................................................... 82.3.4 Residual Signal Erasure ......................................................................... 92.3.5 Detection and Conversion of the PSL Signal .......................................... 92.3.6 Digitization............................................................................................ 112.3.7 Image Pre-Processing............................................................................. 11
2.4 Detector Characteristic Response ....................................................................... 12
3. Processing the Raw PSP Image ........................................................................... 133.1 Readout Parameters............................................................................................ 14
3.1.1 Wanted vs. Unwanted Image Signals ...................................................... 143.1.2 Partitioned Pattern and Exposure Field Recognition............................... 143.1.3 Histogram Analysis................................................................................ 14
3.2 Image Grayscale Adjustments ............................................................................ 153.2.1 Contrast Processing................................................................................ 163.2.2 Frequency Processing............................................................................. 17
3.3 Other Image Processing ..................................................................................... 19
4. Image Demographics and Exposure Indicators ................................................ 194.1 Demographics and Processing Parameters .......................................................... 194.2 Exposure Indicators............................................................................................ 19
4.2.1 Fuji Systems........................................................................................... 204.2.2 Kodak Systems ...................................................................................... 214.2.3 Agfa Systems ......................................................................................... 214.2.4 Konica Systems...................................................................................... 22
4.3 Exposure Concerns When Using PSP Systems ................................................... 22
5. PSP System Image Characteristics ..................................................................... 235.1 Spatial Resolution............................................................................................... 23
CONTENTS

vi
5.2 Contrast Resolution ............................................................................................ 255.3 Detective Quantum Efficiency (DQE) ................................................................ 265.4 Image Display .................................................................................................... 27
6. Generic Functional Specifications of PSP Systems......................................... 296.1 Phosphor Detectors and Cassettes ...................................................................... 296.2 PSP Detector Throughput................................................................................... 296.3 Spatial Resolution............................................................................................... 306.4 Contrast Resolution ............................................................................................ 306.5 Dynamic Range ................................................................................................. 316.6 Desirable Specifications and Features................................................................. 32
6.6.1 Phosphor Plates, Cassettes, Grids, Identification Terminals.................... 326.6.2 Output Hard-Copy Image Characteristics .............................................. 326.6.3 Incident Exposure Examination; Other Data Fields................................ 326.6.4 Image Processing Functionality.............................................................. 326.6.5 Patient Demographics and Film Marker Positioning ............................... 336.6.6 PSP System Interfaces to RIS, HIS, and PACS....................................... 336.6.7 Quality Control Phantom; QC Workstation and Software ...................... 336.6.8 Service Contracts, Preventive Maintenance, Warranty,
and Siting Requirements ........................................................................ 346.6.9 Application Training for Technologists, Radiologists, Physicists,
Clinical Engineers ................................................................................. 34
7. Clinical Implementation Issues ............................................................................ 347.1 Expectations and Realities ................................................................................. 347.2 Technical Concerns ............................................................................................ 357.3 X-ray Scatter and Grid Selection ........................................................................ 367.4 Radiation Exposure ............................................................................................ 377.5 Phototimer Calibration....................................................................................... 377.6 PSP System Interfaces to PACS .......................................................................... 387.7 Technologist Training ......................................................................................... 387.8 Radiologist Acceptance ...................................................................................... 38
8. Acceptance Testing8.1 Preliminary Communication with Vendor Engineer/Specialist ............................ 398.2 Preparations and Initial Adjustments for Acceptance Test Measurements ........... 39
8.2.1 Customization of Alphanumeric Data Recording ................................... 408.2.2 Adjustment of the Hard-Copy Recording Device ................................... 408.2.3 Film Processor and Laser Printer Tests .................................................. 408.2.4 Laser Printer Calibration and LUT Parameters...................................... 408.2.5 Image Workstation Display Monitor Calibration/Resolution Tests ........... 418.2.6 Evaluation of PSP System Interfaces: RIS and PACS ............................. 418.2.7 Characterization of the X-ray Beam....................................................... 42
8.3 Tools and Equipment Required for Acceptance Evaluation................................. 428.4 Specific Testing Procedures ................................................................................ 42
8.4.1 Component Inventory............................................................................. 458.4.2 Imaging Plate Dark Noise and Uniformity ............................................. 45
CONTENTS

vii
8.4.3 Exposure Indicator Calibration Accuracy............................................... 478.4.4 System Linearity and Autoranging Response.......................................... 498.4.5 Laser Beam Function............................................................................. 498.4.6 Limiting Resolution and Resolution Uniformity...................................... 518.4.7 Noise and Low-Contrast Resolution ....................................................... 528.4.8 Spatial Distance Accuracy ..................................................................... 548.4.9 Erasure Thoroughness............................................................................ 558.4.10 Aliasing/Grid Response ......................................................................... 568.4.11 IP Throughput ....................................................................................... 568.4.12 Acceptance Criteria and Quantitative Relationships ............................... 588.4.13 Image Processing: LUT Transforms and Frequency Enhancement.......... 58
9. Artifacts .................................................................................................................... 589.1 Image Artifacts .................................................................................................. 589.2 Software Artifacts .............................................................................................. 599.3 Object Artifacts.................................................................................................. 609.4 Film Artifacts .................................................................................................... 60
10. Quality Control and Periodic Maintenance ........................................................ 6110.1 Daily Tests (Technologist) .................................................................................. 6110.2 Monthly Tests (Technologist).............................................................................. 6110.3 Quarterly Tests (Technologist) ............................................................................ 6110.4 Annually and After Major Repair/Calibration (Physicist) ................................... 62
11. Conclusions ............................................................................................................. 62
Appendix A. Manufacturer Contact Information ....................................................... 63
Appendix B. Sample Acceptance Testing and Quality Control Forms ................. 63
References....................................................................................................................... 64
CONTENTS

This page intentionally left blank.

ix
Photostimulable phosphor (PSP) imaging, also commonly known as computed radiography(CR), employs reusable imaging plates and associated hardware and software to acquire and todisplay digital projection radiographs. Procedures to guide the diagnostic radiological physicistin the evaluation and continuous quality improvement of PSP imaging practice are the specificgoal of this task group report. This document includes an overview of a typical PSP imaging sys-tem, functional specifications, testing methodology, and a bibliography. The main body of thereport includes a description of generic, non-invasive tests that are applicable to a variety of PSPunits. Since the inception of the task group, technological advances have changed the scope ofits original goals. In particular, when the task group was initially formed, film was the chief dis-play medium, and video display monitors and associated analysis software were not widelyavailable. Also noted are the significant advances of “direct radiography,” which includes thedirect acquisition and readout of projection radiographs without physical handling of a PSPimaging plate. The user of this information should realize that technological change is constant,and many of the tests described in this document might not be applicable with the current stateof the art. In these situations, the user is encouraged to consult the manufacturer, the AmericanAssociation of Physicists in Medicine (AAPM), or other pertinent contemporary sources foradditional information.
ABSTRACT

This page intentionally left blank.
1
1. INTRODUCTION
The primary purpose of this document is to guide the clinical medical physicist in the accept-ance testing of photostimulable phosphor (PSP) imaging systems. PSP imaging devices (modali-ties) are known by a number of names including (most commonly) computed radiography (CR),storage phosphor imaging, photostimulable storage phosphor imaging, digital storage phos-phor imaging, and digital luminescence radiography. PSP images are readily integrated into apicture archiving and communication system (PACS) via widely implemented communicationsstandards including Digital Imaging and Communications in Medicine (DICOM)1 and HealthLevel 7 (HL7).2 The tests described herein are appropriate for PSP systems in either integratedor stand-alone applications. Digital imaging technology is rapidly evolving, and this effort rep-resents the state of technology as of its writing. Proper application of this guide involves supple-menting it with current literature and specific manufacturer’s technical data.
A secondary purpose is to provide a consolidated source of information regarding devicefunctionality, testing, and clinical practice of PSP imaging. This document provides the physicistwith a means to conduct initial acceptance testing, to interpret results, and to establish baselineperformance. A subset of these tests can be extended to routine quality control (QC).
2. SYSTEM OVERVIEW
The basic principles and operating characteristics of PSP systems are covered in this section,including acquisition methods, PSP detector characteristics, the readout process, and the detec-tor characteristic response. Detailed information on the physics of computed radiography isavailable from the review article by Rowlands.3
2.1 PSP Image AcquisitionThe photostimulable phosphor (PSP) stores absorbed x-ray energy in crystal structure “traps,”and is sometimes referred to as a “storage” phosphor. This trapped energy can be released ifstimulated by additional light energy of the proper wavelength by the process of photostimulatedluminescence (PSL). Acquisition and display of the PSP image can be considered in five gener-alized steps, illustrated in Figure 1.
The unexposed PSP detector, commonly known as an imaging plate (IP), is placed in acassette with a similar form factor and appearance of a screen-film cassette. X-ray geometry andimaging techniques are also similar to screen-film acquisition. During the exposure, x-rays aretransmitted through the patient and are absorbed by the IP. Energy deposited in the PSP materialcauses local electrons to be elevated from an equilibrium (ground state) energy level to a stable“trap” known as an “F-center.” This is the unobservable “electronic” latent image, whereby thenumber of electrons trapped is proportional to the number of x-ray photons incident on the IP.The exposed IP in step 1 of Figure 1 must be read out to produce the x-ray image. In step 2, thecassette is placed in the reader where the IP is extracted and raster-scanned with a highly focusedand intense laser light of low energy (~2 eV). Trapped electrons in the PSP matrix are stimulatedby the laser energy, and a significant fraction return to the lowest energy level within the phosphor,with a simultaneous release of PSL of higher energy (~3 eV). The intensity of PSL, proportionalto the number of released electrons, is optically filtered from the laser light and captured by alight guide assembly in close proximity to the IP. A photomultiplier tube (PMT) at the light guideoutput converts and amplifies the PSL into a corresponding output voltage.
ACCEPTANCE TESTING /QC OF PSP IMAGING SYSTEMS

2
Subsequent digitization using an analog-to-digital converter (ADC) produces a corre-sponding digital number at a specific location in the digital image matrix determined by thesynchronization of the laser beam and IP location. Residual latent image information is erasedusing an intense light (consisting of wavelengths that remove electrons in traps without stimu-lating further electron trapping), and the IP is reinserted into the cassette for reuse. Image pre-processing takes place in step 3, to correct for static light guide sensitivity variations and fixednoise patterns, so that the imaged object is faithfully reproduced and scaled to a normalizedrange as “raw” image data. Wide dynamic range response of the PSP detector requires imagerecognition, scaling, and contrast enhancement to optimize the image characteristics and sig-nal-to-noise ratio (SNR) of the “processed” image data in step 4. Display of the digital imagein step 5 uses look-up-table (LUT) transformations to properly render the digital image codevalues into corresponding grayscale brightness variations for soft-copy monitors and opticaldensity (OD) values for hard-copy film. In terms of acquisition, the PSP system closely emu-lates the conventional screen-film detector paradigm. There are, however, several important dif-ferences relative to screen-film detectors to realize the full advantage of PSP imagingcapabilities, including collimation and position of the object on the detector, variable (selec-table) detector speed, sensitivity to x-ray scatter, importance of optimal image processing, andimage artifacts, among other issues.
Comparison to other digital radiography devices: Digital (direct) radiography (DR)devices are based upon the detection of the transmitted x-ray fluence through a patient using an“active” large field-of-view (FOV) detector, in which the x-ray energy is captured and convertedto a latent image in the form of locally deposited charge. The latent image is converted directlyto a digital image dataset without further system interaction by the operator. These devices haveadvantages in quick turnaround for image display; however, the systems are rather expensive,
AAPM REPORT NO. 93
Figure 1. PSP Image acquisition and processing can be divided into five separate steps: (1) Image acquisitioninvolves exposing the patient with a study-specific x-ray technique and recording the transmitted x-ray flux withthe PSP detector. (2) The resultant latent image is extracted via the reader device using laser stimulation andrecording the PSL intensity. (3) Image pre-processing involves correcting systematic variations in the extractionprocess and determining the range of pertinent information with subsequent adjustment of digital values to a nor-malized output range. (4) Image post-processing translates the digital values of the raw digital image to render agrayscale and frequency enhancement appropriate for the anatomy and study. (5) The output image is displayedon a calibrated image monitor for presentation.

3
most are not portable, and they sometimes do not have the flexibility to achieve appropriatepatient positioning for views that are relatively easy for screen-film and PSP detectors.4,5
Nevertheless, digital imaging devices are becoming less functionally distinct, as there are “cas-setteless” PSP systems that emulate DR productivity, and a DR detector that demonstratesportable imaging capability usually associated with PSP systems. Similar function and commoncharacteristics of PSP and DR systems allow the application of many procedures described inthis document for acceptance testing and quality control for DR systems. There are also attrib-utes for any digital system that require manufacturer-specific tests and criteria to determine andverify optimal operation.
2.2 PSP Detector Characteristics PSP detectors are based on the principle of photostimulated luminescence.6–9 When an x-rayphoton deposits energy in a PSP material, three different physical processes account for energyconversion. Fluorescence is the prompt release of energy in the form of light. This process is thebasis of conventional radiographic intensification screens. IPs also emit fluorescence in sufficientquantity to expose conventional radiographic film.10,11 This, however, is not the intended methodof imaging. PSP materials store a significant fraction of the deposited energy in crystal structuredefects, thus the synonym storage phosphors. This stored energy constitutes the latent image.Over time, the latent image fades spontaneously by the process of phosphorescence. If stimu-lated by light of the proper wavelength, the process of stimulated luminescence can release aportion of the trapped energy immediately. The emitted light constitutes the signal for creatingthe digital image.
Many compounds possess the property of PSL; however, few have characteristics desir-able for radiography, namely a stimulation-absorption peak at a wavelength produced by com-mon lasers, a stimulated emission peak readily absorbed by common PMT input phosphors, andretention of the latent image without significant signal loss due to phosphorescence.12 The com-pounds that most closely meet these requirements are alkali-earth halides. Commercial products(as of 2004) have been introduced based on RbCl, BaFBr:Eu2+, BaF(BrI):Eu2+, BaFI:Eu2+, andBaSrFBr:Eu2+.* A typical PSP detector is layered on an opaque substrate, as illustrated in Figure2A. A PSP detector with an optically transparent base allowing extraction of the PSL light fromboth sides when stimulated is now clinically available13 as shown in Figure 2B, and a structuredphosphor is under investigation, comprising CsBr (cesium bromine)14,15 as artistically illustratedin Figure 2C. These latter two implementations show great promise in improving detection effi-ciency and image information transfer, resulting from improved detection efficiency and conver-sion efficiency.3 In general, the PSP compounds, their formulation, and structural characteristicsare tuned for a given manufacturer and often function optimally only with a specific reader;imaging plates are generally not interchangeable between readers.
2.2.1 Doping and Absorption Process
Trace amounts of Eu2+ impurities are added to the PSP to alter its structure and physical proper-ties. The trace impurity, also called an activator, replaces the alkali earth in the crystal, forminga luminescence center. Ionization by absorption of x-rays (or ultraviolet [UV] radiation) formselectron/hole pairs in the PSP crystal. An electron/hole pair raises Eu2+ to an excited state, Eu3+.
ACCEPTANCE TESTING /QC OF PSP IMAGING SYSTEMS
*Ba: barium; Br: bromine; Cl: chlorine; Eu: europium; F: fluorine; I: iodine; Rb: rubidium; Sr: strontium

4
Eu3+ produces visible light when it returns to the ground state, Eu2+. Stored energy (in the formof trapped electrons) forms the latent image. There are currently two major theories for the PSPenergy absorption process and subsequent formation of luminescence centers. These include abimolecular recombination model8 and a photostimulated luminescence complex (PSLC) model9
shown in Figure 3. Physical processes occurring in BaFBr:Eu2+ using the latter model appears toclosely approximate the experimental findings. In this model, the PSLC is a metastable complexat higher energy (“F-center”) in close proximity to an Eu3+-Eu2+ recombination center. X-raysabsorbed in the PSP induce the formation of “holes” and “electrons,” which activate an “inac-tive PSLC” by being captured by an F-center, or form an active PSLC by formation and/orrecombination of “exitons” explained by “F-center physics”.9 In either theoretical description,the numbers of active PSLCs created (number of electrons trapped in the metastable site) areproportional to the x-rays locally absorbed in the phosphor.
X-ray absorption efficiency of BaFBr:Eu is compared to Gd2O2S:Tb (rare-earth screens)for typical thicknesses of material encountered, as shown by attenuation curves illustrated inFigure 4. Between 35 to 50 keV, the BaFBr phosphor has higher x-ray absorption per unit massthickness due to the lower K-edge absorption of barium; however, below and above this range,the gadolinium rare-earth phosphor is superior. A typical incident x-ray beam on the conven-tional PSP often requires greater exposure to achieve similar image quantum statistics comparedto a 400-speed rare-earth detector. In addition, the high absorption probability of x-rays below
AAPM REPORT NO. 93
Figure 2. Cross-sectional views of the (a) generic, (b) dual-side readout, and (c) structured PSP detectors.Often, the opaque support will have a reflective layer to increase the PSL intensity.
Figure 3. An energy diagram of the excitation and PSL processes in a BaFBr:Eu2+ phosphor (von Seggern etal.9). Incident x-rays form an “electron” latent image in a metastable “F” center site that can be stimulated with alow-energy laser beam (~2.0 eV), producing the desired luminescent signals (~3.0 eV). τ is a constant represent-ing the decay times for the specific indicated processes discussed in the text.

5
50 keV, where a significant fraction of lower energy scattered x-rays occur, results in a greatersensitivity to scatter compared to the rare-earth absorber. The PSP detector is often mentionedas a “scatter sponge” in this context.16
2.2.2 Fading
Fading of the trapped signal will occur exponentially over time, through spontaneous phospho-rescence. A typical imaging plate will lose about 25% of the stored signal between 10 minutesto 8 hours after an exposure, and more slowly afterwards.17 Fading introduces uncertainties inoutput signal that can be controlled by introducing a fixed delay between exposure and readoutto allow decay of the “prompt” phosphorescence of the stored signal. After about 10 minutes, thelatent image fades more slowly.
2.2.3 Stimulation and Emission
The “electronic” latent image imprinted on the exposed BaFBr:Eu phosphor corresponds to theactivated PLSCs (F-centers), whose local population of electrons is directly proportional to theincident x-ray fluence for a wide range of exposures, typically exceeding 10,000 to 1 (four ordersof exposure magnitude). Stimulation of the Eu3+-F-center complex and release of the stored elec-trons requires a minimum energy of ~2 eV, most easily deposited by a highly focused laser lightsource of a specific wavelength. HeNe (helium-neon, λ�633 nm) and “diode” (λ ≅ 680 nm) lasersources are most often used, with the latter becoming much more prominent. The incident laserenergy excites electrons in the local F-center sites of the phosphor. According to von Seggern,9
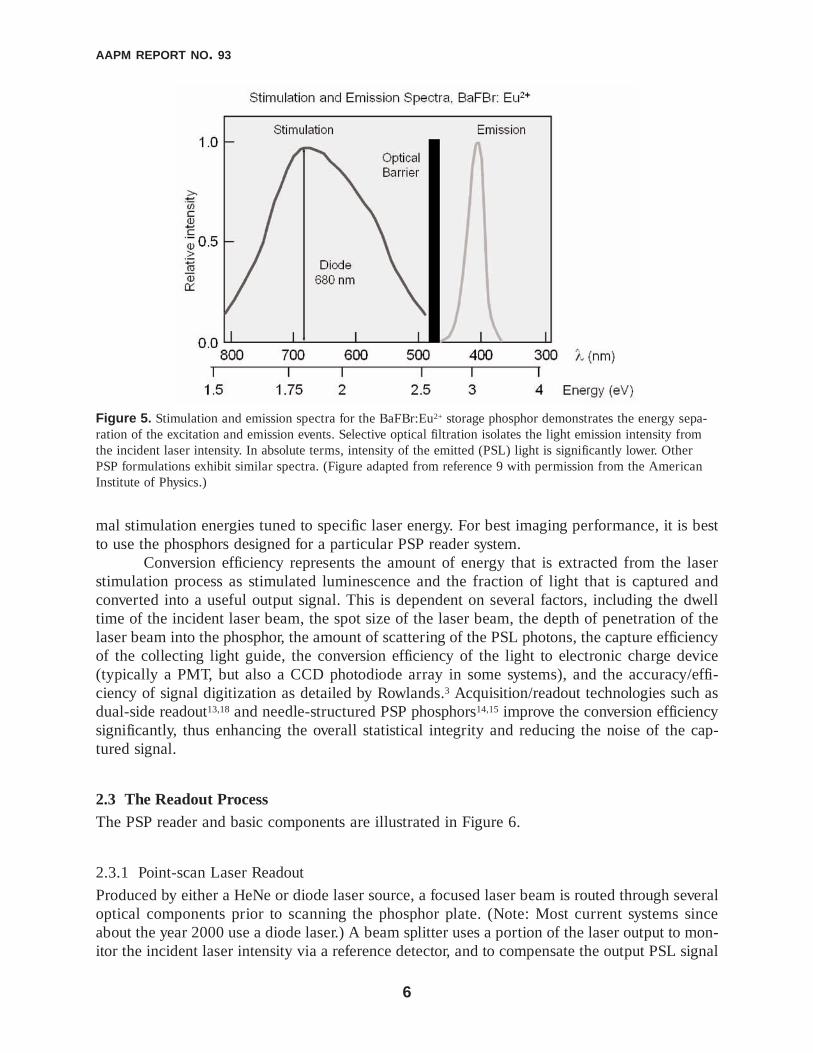
two subsequent energy pathways within the phosphor matrix are possible: (1) to return to the F-center site without escape, or (2) to “tunnel” to an adjacent Eu3+ complex. The latter event ismore probable, where the electron cascades to an intermediate energy state with the release of anon-light-emitting “phonon” (mechanical energy release). A light photon of 3 eV (λ ≅ 410 nm)immediately follows as the electron drops through the energy level of the Eu3+ complex to themore stable Eu2+ energy level. Figure 5 shows a plot of the energy spectra of the laser-inducedelectron stimulation and subsequent light emission. Different phosphor formulations have opti-
ACCEPTANCE TESTING /QC OF PSP IMAGING SYSTEMS
Figure 4. The photon absorption fractions of PSP and rare-earth x-ray phosphors are plotted as a function ofenergy. Phosphor thicknesses are representative of a standard 400-speed conventional screen, a “standard resolu-tion” PSP detector (100 mg/cm2), and a CsI phosphor commonly used in indirect thin-film transistor (TFT) arrayand optically coupled, charge-coupled device (CCD) camera DR systems.
6
mal stimulation energies tuned to specific laser energy. For best imaging performance, it is bestto use the phosphors designed for a particular PSP reader system.
Conversion efficiency represents the amount of energy that is extracted from the laserstimulation process as stimulated luminescence and the fraction of light that is captured andconverted into a useful output signal. This is dependent on several factors, including the dwelltime of the incident laser beam, the spot size of the laser beam, the depth of penetration of thelaser beam into the phosphor, the amount of scattering of the PSL photons, the capture efficiencyof the collecting light guide, the conversion efficiency of the light to electronic charge device(typically a PMT, but also a CCD photodiode array in some systems), and the accuracy/effi-ciency of signal digitization as detailed by Rowlands.3 Acquisition/readout technologies such asdual-side readout13,18 and needle-structured PSP phosphors14,15 improve the conversion efficiencysignificantly, thus enhancing the overall statistical integrity and reducing the noise of the cap-tured signal.
2.3 The Readout ProcessThe PSP reader and basic components are illustrated in Figure 6.
2.3.1 Point-scan Laser Readout
Produced by either a HeNe or diode laser source, a focused laser beam is routed through severaloptical components prior to scanning the phosphor plate. (Note: Most current systems sinceabout the year 2000 use a diode laser.) A beam splitter uses a portion of the laser output to mon-itor the incident laser intensity via a reference detector, and to compensate the output PSL signal
AAPM REPORT NO. 93
Figure 5. Stimulation and emission spectra for the BaFBr:Eu2+ storage phosphor demonstrates the energy sepa-ration of the excitation and emission events. Selective optical filtration isolates the light emission intensity fromthe incident laser intensity. In absolute terms, intensity of the emitted (PSL) light is significantly lower. OtherPSP formulations exhibit similar spectra. (Figure adapted from reference 9 with permission from the AmericanInstitute of Physics.)

7
intensity for incident power fluctuations.19 The major portion of the laser energy reflects off ascanning device (rotating polygonal mirror or oscillating flat reflector), through an optical filter,shutter, and lens assembly. To maintain a constant focus and linear sweeping velocity across thePSP plate, the beam passes through an f-θ lens to a stationary mirror (typically a cylindrical andflat mirror combination). Assuming a Gaussian beam profile, the laser beam irradiance varieswith radial distance r from the center, as I(r) � I0 exp(–2r2/r1
2), where r1 is the radial extent thatthe irradiance has dropped to 1/e2 of its value on the beam axis, I0, (e � 2.71828…). This isa measure of the effective laser beam diameter. Typical laser “spot sizes” range from 50 µm to200 µm and several sizes in between, depending on the manufacturer and reader as measured atthe surface of the IP.
The speed of the laser beam across the phosphor plate is limited by the luminescent sig-nal decay time constant (~0.7 to 0.8 µs for BaFBr:Eu2+) following excitation3 to maintain spatialresolution. Laser beam power determines the fraction of the electrons released from the F-centers,the fraction of phosphorescent lag, and the amount of residual signal. Higher laser power canrelease more trapped electrons, but the trade-off is a loss of spatial resolution caused byincreased laser penetration depth and wider spread of the stimulated light in the phosphor layer.Signal decay lag (afterglow) causes blur in the scan direction, and results in loss of high-frequencyresponse near the Nyquist frequency. At the end of the scanned line, the laser beam is retracedto the start and repeated.
Translation of the IP through the optical stage occurs continuously at a speed to ensurean “effective” sample size is equal in both the laser scan and plate sub-scan dimensions. Thisimposes an upper limit to spatial resolution in both dimensions.19 Scanning and plate translationcontinues in a raster fashion over the total phosphor area. Scan direction, laser scan direction,
ACCEPTANCE TESTING /QC OF PSP IMAGING SYSTEMS
Figure 6. Major components of a PSP reader (point-scan, laser flying spot) include the stimulating laser source,a beam splitter, oscillating beam deflector, f-θ lens, cylindrical reflecting mirror, light collection guide, photo-multiplier tube (PMT), and light erasure stage. The IP is translated in a continuous motion through the laser beamscan by pinch rollers. All component functions are synchronized by digital computers. In some readers, multiplePMTs are used for capturing the signal. The erasure stage removes residual signals, and the IP is returned to the cassette.

8
or fast-scan direction are equivalent terminology referring to the direction of the laser beam.Slow-scan, sub-scan, or translation direction refer to the phosphor plate travel direction. Thetypical scanning time is chiefly limited by the laser scan speed; for a 35�43 cm imaging plate,the time varies by manufacturer, reader type, and laser resolution. In general, a scan time rangeof ~30 to 60 seconds is specified by most manufacturers. Newer phosphor formulations with lesssignal decay lag (e.g., BaFI:Eu � ~0.6 µs)3 allows a faster scan speed without loss of resolutionin the laser scan direction. IP readout geometry for a point-scan PSP reader is shown in Figure 7.
2.3.2 Dual-side Laser Readout
In 2001, a “dual-side” IP was introduced to acquire both reflected and transmitted PSL from astimulating point laser source, with two light guides positioned on either side of the detector (seeFigure 2). In this configuration, a larger fraction of stimulated light is captured, and with opti-mized frequency weighting of the reflected and transmitted signals,13,18 a higher SNR is achiev-able than with the conventional single-sided readout, and good spatial resolution is maintained.As for comparison of detective quantum efficiency, enhancement of 40% to 50% has beenreported,20,21 which ultimately leads to improved dose efficiency and equivalent radiographicspeed, or better SNR (as a selectable trade-off). Dual-side readout was initially produced for aprototype digital mammography detector, but is now being used for conventional PSP applica-tions on readers with two light guides, in conjunction with the transparent base IP.
2.3.3 Line-scan Laser Readout
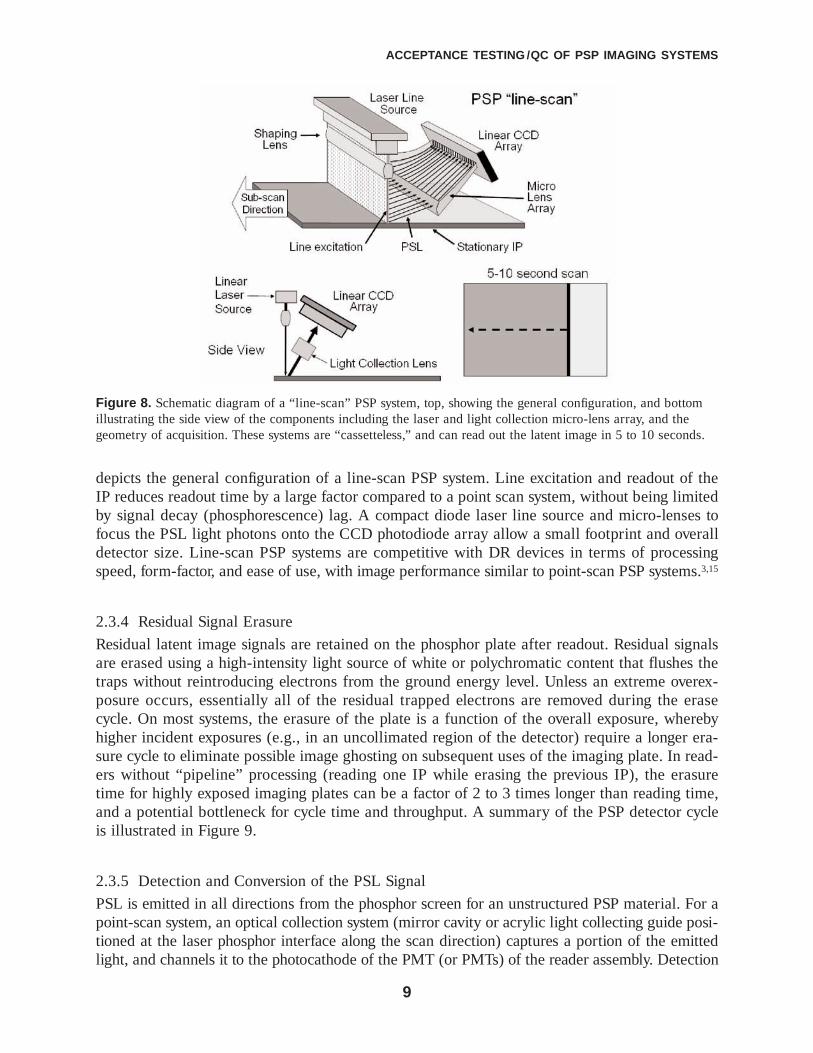
PSP systems based upon a laser line source coupled to an array of CCD photosensors were firstclinically introduced in late 2003. These systems can read the latent image on a PSP plate in 5to 10 seconds for a large FOV (35�43 cm) detector.22,23 The schematic diagram in Figure 8
AAPM REPORT NO. 93
Figure 7. (a) Beam profile of laser of diameter d. (b) Diagram of the raster-scan of the phosphor detector indi-cates the fast-scan (laser scan) direction and the sub-scan (plate translation) direction. Note the slightly skewedangle of the readout lines relative to the edge of the phosphor plate, due to the simultaneous laser beam scanningand plate translation.
(a) (b)
9
depicts the general configuration of a line-scan PSP system. Line excitation and readout of theIP reduces readout time by a large factor compared to a point scan system, without being limitedby signal decay (phosphorescence) lag. A compact diode laser line source and micro-lenses tofocus the PSL light photons onto the CCD photodiode array allow a small footprint and overalldetector size. Line-scan PSP systems are competitive with DR devices in terms of processingspeed, form-factor, and ease of use, with image performance similar to point-scan PSP systems.3,15
2.3.4 Residual Signal Erasure
Residual latent image signals are retained on the phosphor plate after readout. Residual signalsare erased using a high-intensity light source of white or polychromatic content that flushes thetraps without reintroducing electrons from the ground energy level. Unless an extreme overex-posure occurs, essentially all of the residual trapped electrons are removed during the erasecycle. On most systems, the erasure of the plate is a function of the overall exposure, wherebyhigher incident exposures (e.g., in an uncollimated region of the detector) require a longer era-sure cycle to eliminate possible image ghosting on subsequent uses of the imaging plate. In read-ers without “pipeline” processing (reading one IP while erasing the previous IP), the erasuretime for highly exposed imaging plates can be a factor of 2 to 3 times longer than reading time,and a potential bottleneck for cycle time and throughput. A summary of the PSP detector cycleis illustrated in Figure 9.
2.3.5 Detection and Conversion of the PSL Signal
PSL is emitted in all directions from the phosphor screen for an unstructured PSP material. For apoint-scan system, an optical collection system (mirror cavity or acrylic light collecting guide posi-tioned at the laser phosphor interface along the scan direction) captures a portion of the emittedlight, and channels it to the photocathode of the PMT (or PMTs) of the reader assembly. Detection
ACCEPTANCE TESTING /QC OF PSP IMAGING SYSTEMS
Figure 8. Schematic diagram of a “line-scan” PSP system, top, showing the general configuration, and bottomillustrating the side view of the components including the laser and light collection micro-lens array, and thegeometry of acquisition. These systems are “cassetteless,” and can read out the latent image in 5 to 10 seconds.

10
sensitivity of the photocathode material is matched to the wavelength of the PSL (e.g., ~400 nm),and the light intensity releases a proportional number of photoelectrons. The electrons are acceler-ated and amplified by a cascading process through a series of dynodes within the PMT. Gain (andthus detector sensitivity) is internally adjusted by setting the dynode voltage to obtain a predefinedtarget average output current for a given incident x-ray exposure typical of clinical images. (Insome systems, the gain can be set by software controls.) An integration time for collecting the PSLsignals is dependent on the laser scan speed and sampling pitch. Electronic dynamic range (mini-mum to maximum signal output) of the PMT is much greater than for the phosphor plate, and lightintensity variations that correspond to incident radiation exposure respond linearly over a range of10,000 or “four orders of magnitude” relative to the smallest useful signal.
Digitization of the output signal requires the identification of a minimum and maximumsignal range, since most clinically relevant transmitted exposure variations occur over a dynamicrange of 100 to 400. In early versions of PSP readers, a low energy laser pre-scan coarsely sam-pled the exposed PSP detector and determined the useful exposure range. The gain of the PMTwas then adjusted (increased or decreased) to digitize the PSL over a predetermined intensityrange during the high-energy laser scan. In most current systems, the PMT amplifier is pread-justed to be sensitive to the PSL resulting from an exposure range corresponding over a range of2.58�10–9 C/kg (0.01 mR) to 2.58�10–5 C/kg (100 mR). This is equivalent to incident airkerma of 0.09 to 900 µGy. In addition, most manufacturers have the ability to set the sensitivityand the exposure dynamic range over a predefined range (for instance, a range for general radi-ography and a range for mammography).
In line-scan systems, the laser line source and the PSL emitter lens array localize theexcitation and emission events on the IP,23 focusing the output onto a CCD light-sensitive arrayfor electronic conversion and digitization. CCD arrays do not have an exposure dynamic rangeas wide as a PMT, which can be a limiting factor with systems using this technology.Information on spatial resolution, dynamic range, amplification, and signal pre-processing ofthese systems is not yet available.
AAPM REPORT NO. 93
Figure 9. The phosphor plate cycle is depicted above. (a) An unexposed plate comprises the PSP material lay-ered on a base support and protected by a thin, transparent coating. (b) Exposure to x-rays creates latent imagecenters of electrons semistable energy traps in the crystal structure. (c) Latent image processing is accomplishedwith a raster-scanned laser beam. Trapped electrons are released from the luminescent centers and produce lightthat is collected by a light guide assembly and directed to a PMT. (d) Residual trapped electrons are removedwith a high-intensity light source, and (e) the plate is returned to the cassette for reuse.
11
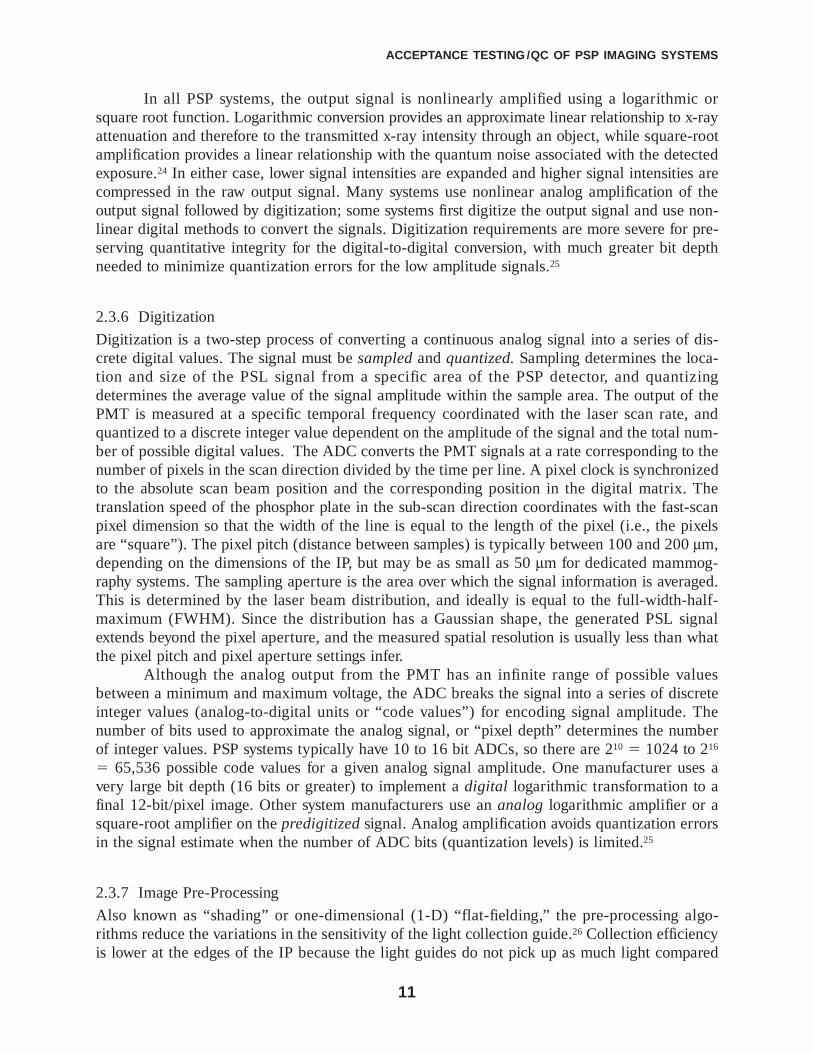
In all PSP systems, the output signal is nonlinearly amplified using a logarithmic orsquare root function. Logarithmic conversion provides an approximate linear relationship to x-rayattenuation and therefore to the transmitted x-ray intensity through an object, while square-rootamplification provides a linear relationship with the quantum noise associated with the detectedexposure.24 In either case, lower signal intensities are expanded and higher signal intensities arecompressed in the raw output signal. Many systems use nonlinear analog amplification of theoutput signal followed by digitization; some systems first digitize the output signal and use non-linear digital methods to convert the signals. Digitization requirements are more severe for pre-serving quantitative integrity for the digital-to-digital conversion, with much greater bit depthneeded to minimize quantization errors for the low amplitude signals.25
2.3.6 Digitization
Digitization is a two-step process of converting a continuous analog signal into a series of dis-crete digital values. The signal must be sampled and quantized. Sampling determines the loca-tion and size of the PSL signal from a specific area of the PSP detector, and quantizingdetermines the average value of the signal amplitude within the sample area. The output of thePMT is measured at a specific temporal frequency coordinated with the laser scan rate, andquantized to a discrete integer value dependent on the amplitude of the signal and the total num-ber of possible digital values. The ADC converts the PMT signals at a rate corresponding to thenumber of pixels in the scan direction divided by the time per line. A pixel clock is synchronizedto the absolute scan beam position and the corresponding position in the digital matrix. Thetranslation speed of the phosphor plate in the sub-scan direction coordinates with the fast-scanpixel dimension so that the width of the line is equal to the length of the pixel (i.e., the pixelsare “square”). The pixel pitch (distance between samples) is typically between 100 and 200 µm,depending on the dimensions of the IP, but may be as small as 50 µm for dedicated mammog-raphy systems. The sampling aperture is the area over which the signal information is averaged.This is determined by the laser beam distribution, and ideally is equal to the full-width-half-maximum (FWHM). Since the distribution has a Gaussian shape, the generated PSL signalextends beyond the pixel aperture, and the measured spatial resolution is usually less than whatthe pixel pitch and pixel aperture settings infer.
Although the analog output from the PMT has an infinite range of possible valuesbetween a minimum and maximum voltage, the ADC breaks the signal into a series of discreteinteger values (analog-to-digital units or “code values”) for encoding signal amplitude. Thenumber of bits used to approximate the analog signal, or “pixel depth” determines the numberof integer values. PSP systems typically have 10 to 16 bit ADCs, so there are 210 � 1024 to 216
� 65,536 possible code values for a given analog signal amplitude. One manufacturer uses avery large bit depth (16 bits or greater) to implement a digital logarithmic transformation to afinal 12-bit/pixel image. Other system manufacturers use an analog logarithmic amplifier or asquare-root amplifier on the predigitized signal. Analog amplification avoids quantization errorsin the signal estimate when the number of ADC bits (quantization levels) is limited.25
2.3.7 Image Pre-Processing
Also known as “shading” or one-dimensional (1-D) “flat-fielding,” the pre-processing algo-rithms reduce the variations in the sensitivity of the light collection guide.26 Collection efficiencyis lower at the edges of the IP because the light guides do not pick up as much light compared
ACCEPTANCE TESTING /QC OF PSP IMAGING SYSTEMS

12
to the center, as light diffuses in all directions. There also may be positionally dependent varia-tions in the light collection guide sensitivity that cause low-frequency patterns. Each manufac-turer has methods to measure and correct these nonuniformities. A basic correction scheme isillustrated in Figure 10A, indicating the measured profile, the “shading corrected” profile, andthe resultant shading corrected image. Note that this is implemented in the fast-scan directiononly. Dust or dirt on the light collection guide is easily visible as a linear artifact on the outputimage. These particles should be cleaned from the light guide surface, and not be present duringa shading calibration, as this will lead to a different artifact in all subsequently processedimages. A similar signal variation correction method is employed for line-scan PSP systems, butbecause the detector is in a fixed, unchanging geometry, a two-dimensional (2-D) flat field canbe performed. This procedure can correct spatial variations in the translation direction as well.A 2-D flat-field correction matrix is created from a series of uniform exposures on the detectorby averaging, normalizing the mean image, and inverting the response. Corrections are appliedby taking the product of the flat-field image with the uncorrected raw image.26 In both 1-D shad-ing and 2-D flat-field corrections, the shading/flat-field matrices are also noisy (although thenoise is reduced significantly with signal averaging). So, correcting a noisy patient image with anoisy correction image actually results in a greater output noise; however, the correction effec-tively removes the lower frequency spectrum variations and generally improves image quality.
2.4 Detector Characteristic ResponseA linear, wide latitude response to variations in incident exposure is characteristic of the phos-phor plate, while film is optimally sensitive to a restricted range of exposures. Figure 11 illus-trates the characteristic curve response of a typical PSP detector to a 400-speed screen-filmsystem. For screen-film detectors, which serve as both the acquisition and the display medium,it is necessary to tune the detector (film) contrast and radiographic speed to a narrow exposurerange to achieve images with optimal contrast and minimal noise characteristics. PSP (and DR)
AAPM REPORT NO. 93
(a) (b)
Figure 10. (a) The “shading correction” pre-processing step corrects for large and small area variations in lightguide sensitivity performance by measuring the response of a known uniform field, producing a normalized,inverted response, and applying it to a specific image. (b) Typical pre and post “shading correction” processingshows the ability of the correction to reduce the nonuniformity in the scan direction, but not in the perpendiculardirection (the plate translation direction), where lower intensity values on the right side of the image are due tothe “heel effect” of the x-ray tube for a mammography application. (Reproduced from reference 26 by permissionof the Radiological Society of North America (RSNA), Oak Brook, IL.)

13
detectors are not constrained by the same requirements because the acquisition and displayevents occur separately, and compensation for under- and overexposures is possible by appropri-ate amplification of the digital data. However, identification of useful signal range must beaccomplished prior to the auto-ranging and contrast enhancement of the output image. In addi-tion, since under- or overexposed images can be “masked” by the system, a method to trackexposures on an image-by-image basis is necessary to recognize those situations that exceed thedesired or target exposure range so that action can be taken to resolve any problems. Of partic-ular note is the broad range of over-exposure as shown in Figure 11, which can lead to “dosecreep” (a subtle or gradual and potentially unnoticed increase in exposure when using digitaldetectors)27 and excessive radiation dose to the patient. Exposure ranges marked “useless” rep-resent average incident exposures that produce a significant fraction of signals over the imageeither so small as to be dominated by quantum noise, or so extreme as to be saturated. In eithercase, amplification adjustments cannot be made to extract any pertinent image information.
3. PROCESSING THE RAW PSP IMAGE
The characteristic response of the PSP detector has a slope of 1 over its dynamic range as shownby the log/log trace in Figure 11 (unlike the gradient of the screen-film response which has aslope typically greater than 3 over a very limited latitude). This wide latitude response translatesto low radiographic (display) contrast if the full IP sensitivity range is matched to the luminancerange of most medical displays. Identification of the pertinent information contained in the rawimage is necessary so that only the useful signals relevant to clinical diagnosis are contrastenhanced, with the remainder ignored, otherwise the display dynamic range is occupied byunwanted signals and the image presentation will be suboptimal.
ACCEPTANCE TESTING /QC OF PSP IMAGING SYSTEMS
Figure 11. The characteristic response of a 400-speed rare-earth screen-film (solid S-shaped curve) and thePSP detector (dashed curve) are compared. Double arrows roughly indicate the exposure ranges characterized asunderexposed, correct, or overexposed. “Useless” areas depict system responses that do not contain informationuseful for diagnosis either due to excessive quantum noise or saturation of the PSL mapped to digital number.

14
3.1 Readout Parameters
3.1.1 Wanted vs. Unwanted Image Signals
In conventional screen-film radiography, the x-ray technologist adjusts the exposure technique toput the desired range of image signals on the linear portion of the H&D (Hurter & Driffield)curve. The image signals from x-rays outside of the object yet on the detector fall into the shoul-der (high-exposure range) of the curve, and the image signals beyond the edges of the collima-tors fall into the toe (low-exposure range). The PSP system must similarly encode the usefulimage signal (values of interest, or VOIs), to provide maximum contrast sensitivity through look-up-table adjustments of the digital values (VOI LUTs). Just as the radiographic technique, colli-mation, and image detector cassette size are selected for the specific anatomic view, the PSPreadout algorithms must make adjustments to the digital image specific to the anatomy.
3.1.2 Partitioned Pattern and Exposure Field Recognition
The first task is to determine the number and orientation of views in the raw digital data on theexposed detector (segmentation). While multiple views on a single cassette are good practice inconventional radiography, it is a potential complication for PSP radiography. Recommended is asingle view per imaging plate in a PACS environment, although there are some vendors that candistinguish multiple images on a single IP and apply independent image processing and patientdemographic information. Within an exposure field, it is important for the PSP reader to distin-guish the useful region of the image by locating the collimation edges. Some PSP systems fur-ther segment the image by defining the edges of the anatomic region. Once the useful imagecontent is correctly located, the PSP system disregards the image information beyond the colli-mator boundaries when performing further analysis.
3.1.3 Histogram Analysis
A method for determining the useful signal range for most PSP systems requires the construc-tion of a grayscale histogram of the image, a graph of pixel value on the x-axis and frequencyof occurrence on the y-axis (i.e., a spectrum of pixel values). The general shape of a histogramis dependent on the anatomy and the radiographic techniques employed for the image acquisi-tion. Many PSP readers employ a histogram analysis algorithm to identify and classify the val-ues that correspond to bone, soft tissue, skin, contrast media, collimation, unattenuated x-rays,and other signals. This allows the discrimination of the useful and unimportant areas of theimage so that the image grayscale range can be applied to the anatomical information and prop-erly rendered. An example of a chest-specific histogram is shown in Figure 12.
The result of histogram analysis allows the normalization of raw image data for standardconditions of speed, contrast, and latitude. Rescaling and contrast enhancements are optimizedto render the appropriate image grayscale characteristics for the specific patient examination.Each manufacturer implements a specific method for this remapping procedure. With some sys-tems, the latent image information is identified, logarithmically or square-root amplified, andresampled over a smaller range of digital values to minimize quantization errors. However, anyerrors in identification of the exposure range can be irreversible and require reacquisition of theimage. Other systems digitize the full dynamic range of the PSL signal with a large ADC bitdepth (e.g., greater than 16 bits) and then apply remapping algorithms to the digital data. In
AAPM REPORT NO. 93

15
either case, the pertinent image information on the phosphor plate must be identified for subse-quent grayscale and/or frequency processing, as the shape and information content of the histo-gram affects the processing of the image. An example of identifying and linearly amplifying theimage signal, also known as autoranging, is described in Figure 13 for two exposure scenarios.In each case, the proper output range of digital values is obtained and produces “scaled” imagedata.
Because histogram shapes are anatomy and examination dependent, improper identifica-tion of the histogram minimum and maximum useful values can result in significant errors inimage data scaling. For example, if one acquires a chest image but uses processing algorithmstuned for extremities, a potential misidentification of the proper histogram range can lead tounpredictable and suboptimal results.
3.2 Image Grayscale AdjustmentsPSP images are matrices of digital pixel values that are readily manipulated to produce alterna-tive image presentations. Three broad categories of processing include image contrast enhance-ment, spatial frequency modification, and other special image algorithm implementations.
To process images, PSP systems’ manufacturers provide computer hardware and soft-ware, much of which is proprietary. Some third-party vendors provide similar functionality forremote processing of PSP image data. Selection and optimization of processing parameters is anontrivial task that potentially requires “many thousands of man-hours by highly skilled staff.”28
A common problem is that the range of processing parameters far exceeds clinically usefulvalues and can lead to gross “over-processing” artifacts. Modification of processing parametersmust not be undertaken casually, and should be performed in conjunction with the applicationspecialist with the consultation of the radiologists affected for optimization to the extent possible.
ACCEPTANCE TESTING /QC OF PSP IMAGING SYSTEMS
Figure 12. A chest histogram illustrates the various components of the frequency distribution of pixel valueswithin the active area of the image, corresponding to anatomical variations. In this example, the digital values aredirectly related to the attenuation, similar to a screen-film image, by using a reverse LUT that inverts the digitalrepresentation of the collected PSL.

16
3.2.1 Contrast Processing
Because of small differences in attenuation of the human body and wide latitude of the PSPdetector, there is very little inherent contrast in the raw image. To increase the visibility ofanatomic detail, manufacturers provide contrast-processing software. The purpose of contrastprocessing is to create an image dataset with contrast similar to conventional screen-film images(at least as a starting point), or to enhance the conspicuity of desirable features. This type of pro-cessing is also referred to as gradation processing, tone scaling, and contrast enhancement bythe various vendors.
There are several different methods employed for contrast processing. The most commonand simple technique remaps individual pixel values according to system-applied LUTs to mimicthe response of film contrast (Figure 14). A global modification of the contrast curve producesdifferent local contrast from identical features at different grayscale levels. Each PSP systemmanufacturer has proprietary algorithms for applying contrast enhancement. Unacceptableimage quality is often due to inappropriate processing even though the original “raw” image datais acquired properly.
A second type of contrast processing modifies contrast by performing operations on fil-tered versions of the original image and reconstructing an enhanced version of the original.There are several variants of “multiscale, multifrequency” processing, the details of which areobtainable from the respective manufacturer documentation.28,30–32 These advanced processingalgorithms provide an ability to reduce dynamic range and allow contrast and spatial frequencyenhancement across the image.
AAPM REPORT NO. 93
Figure 13. Autoranging of incident exposure into a corresponding digital number range is accomplished by analyzing the image histogram (lower left). Minimum and maximum values of the histogram (white curve, representing correct exposure) are mapped to minimum and maximum digital values using a 10-bit output LUT.Overexposure shifts the histogram distribution to a higher range (black curve), but the shape remains the same.The amplitude gain (digital or analog) is adjusted to map the pertinent data to a similar output range.

17
3.2.2 Frequency Processing
One purpose of digital image processing is to enhance the conspicuity of features within theimage. Frequency processing enhances features characterized by specific spatial frequency con-tent and weighting. Several techniques exist, the most common of which is blurred-mask sub-traction.33,34 Early users of PSP systems routinely printed an image twice on a single film usingdifferent presentations, one presentation designed to mimic the appearance of a conventionalscreen-film combination, and the other with significant amounts of “edge-enhancement.” Thispractice is no longer routine, as image presentation is now most often performed with softcopydisplay.
Blurred-mask subtraction is a simple technique that blurs the original image with a con-volution kernel of selected extent. Convolution is a process by which the kernel and the pixel val-ues are multiplied by their corresponding values, added together, and then normalized by thesummed value of the kernel. This value is the new central value of the “filtered” image. Forexample, a 3�3 kernel of all values equal to 1 has a normalization value of 9, and the productof the kernel values with the image are summed, divided by 9, and placed in the output image atthe center pixel at same row and column position. The kernel is applied to each pixel locationand surround in the original image to produce a low-pass filtered image. Characteristics of thekernel (weighting and extent) affect the characteristics of the frequency bandpass.25 In the mask-subtraction process, the blurred image (of lower spatial frequency content) is subtracted fromthe original, producing a difference image containing predominantly high-frequency content.The difference image is multiplied by a constant to increase or decrease the bandpass amplitude,and then is added to the original image, producing the edge-enhanced image (Figure 15).
Multifrequency enhancement processing is now common, whereby the image is decom-posed into distinct frequency ranges, typically achieved by using multiple convolution kernels ofvariable extent,30 Laplacian pyramid decomposition,31 wavelet decomposition techniques,31 or
ACCEPTANCE TESTING /QC OF PSP IMAGING SYSTEMS
Figure 14. Grayscale conversion of the input (scaled, raw) digital values into output values occurs via a LUTtransformation. Depicted above is a LUT that converts 12-bit input data into 10-bit output data. Image appear-ance (contrast) is also modified. Curve (1) inverts image contrast; curve (2) produces very narrow latitude andhigh-contrast output image; curve (3) has less contrast enhancement; curve (4) linearly passes the original datawith unchanged contrast. (Adapted from a Fuji technical report, reference 29).

18
other methods.32 Each frequency bandpass range from the original image is independentlyweighted, normalized, and summed to reconstitute the final enhanced output image, extendingboth contrast and spatial resolution enhancement simultaneously across all image scales andgray levels. A simple example of the methodology is illustrated in Figure 16.
Generalized image grayscale enhancement and frequency processing examples of a PSPimage are illustrated in Figure 17.
AAPM REPORT NO. 93
Figure 15. Edge enhancement example. (a) The original image frequency response (solid line) shows a monoto-nically decreasing signal modulation for higher frequency content. (b) A convolution filter blurs and reduces thehigh-frequency response (a low-pass filter). (c) The result of subtracting the blurred image from the original pro-duces a bandpass response, dependent on the convolution kernel extent. (d) The scaled difference image is addedback to the original and boosts the mid- to high-frequency range in the output (filtered) image.
Figure 16. Multiscale (frequency) processing divides the image into frequency ranges that are independentlyprocessed and recombined to create the enhanced output image. Sub-images shown above are depicted with thesame spatial extent, although in actuality they are of different “size.”
(a) (b) (c) (d)

19
3.3 Other Image Processing.Manufacturers have developed special processing software to address specific PSP applications.These include but are not limited to dual energy subtraction,35–41 tomographic artifact suppres-sion,29 and scoliosis image acquisition and image stitching.15,42,43
“Disease-specific” image processing44–46 to assist in the diagnosis of particular findingsby making anatomic structures associated with disease more conspicuous by either enhancingthe object or reducing the background are being introduced on all PSP and DR systems, typi-cally as options. Computer-aided diagnosis/detection algorithms are used in conjunction withdigital images to assist the radiologist. These algorithms depend on the quantitative accuracy ofthe data provided, and therefore require calibration of the PSP system.
4. IMAGE DEMOGRAPHICS AND EXPOSURE INDICATORS
4.1 Demographics and Processing ParametersIt is very important to understand and to be able to decode the information available on the hard-copy film or the soft-copy image. The manufacturer’s user manual should contain pertinentinformation regarding pixel dimension, image magnification/reduction factors, type of LUTs,frequency enhancement settings, latitude of the image data, and incident exposure information,among other vendor-specific factors. For soft-copy images, information is available in theDICOM header, and should be mapped to the image overlay on the PACS workstation (a PACS-dependent feature). Re-sellers will “brand” their own demographics, notations, processingparameters, or limit features, even though a PSP system is manufactured by another companythat may sell the identical hardware in a different configuration. The user should not assume thatthe information or capabilities are identical.
4.2 Exposure IndicatorsThe PSP system provides consistent OD or image grayscale output values for under- or overex-posures on account of the wide latitude response and algorithms that scale the signal to a pre-determined output range. More problematic are the overexposures, which can extend over asignificant range (see Figure 11). Inappropriate radiographic techniques can easily be overlooked
ACCEPTANCE TESTING /QC OF PSP IMAGING SYSTEMS
(a) (b) (c) (d)
Figure 17. Examples of chest images demonstrating the flexibility of PSP systems and the variable contrastenhancement available. (a) Original “raw” chest image without contrast enhancement. (b) Contrast enhancementapplied. (c) “Black-bone” or reversed contrast—often helpful in identifying tube placement. (d) Edge-enhancedimage.

20
or hidden. Therefore, an indicator of the average incident exposure on the IP is important to ver-ify proper radiographic technique. Each PSP manufacturer has a specific method for providingthis information. For instance, systems made by Fuji report a Sensitivity number, which isinversely proportional to the incident exposure. Kodak systems provide an Exposure Index,which is directly proportional to the logarithm of the exposure. Agfa products provide an indi-cator called lgM, whose value also varies in proportion to the logarithm of exposure. Konica sys-tems provide an incident exposure indicator called REX (relative exposure). These (and other)relative exposure indicators are dependent on the energy absorbed in the detector and amplitudeof PSL released during processing. Thus, energy dependence and phosphorescence decay (delayin processing) will have an influence on the exposure index response. Morphological segmenta-tion and histogram analysis also affect the exposure indicator, and inappropriately applied pro-cessing algorithms can lead to similar variability in the reported exposure index.
For all digital systems, the exposure to the IP varies across the image when imaging anobject, and it is impossible to represent the exposure by any single scalar value, even if calibratedto an absolute exposure metric. In fact, all of the exposure indices represent some statistic (e.g.,mean or median) in some region identified on the IP. Therefore, it is important to recognize theexposure indices as only an estimate of the incident exposure on the detector, not an absolutevalue. In addition, exposure indices vary with kVp (peak kilovoltage) and beam filtration result-ing from differential attenuation/absorption by the IP. Familiarity with the specific methods usedby a given manufacturer are necessary for understanding the exposure index values, associatingthose values with an equivalent “speed” of the detector, and determining appropriate calibrationmethods.
4.2.1 Fuji Systems
Fuji PSP systems use a sensitivity number29 to provide an estimate of the incident exposureon the IP transmitted through the object. Under normal processing conditions for the standardresolution (ST) plates, the system sensitivity number for nonfiltered 80 kVp beam is calibratedto give:
AAPM REPORT NO. 93
S ≅ 200
exposure (mR)
A low (high) incident exposure with a low (high) PSL signal (determined from histogram analy-sis) requires increased (decreased) signal amplification to obtain an optimal signal range for dig-itization. The amount of amplification is indirectly indicated by the system sensitivity value,based on the exposure histogram shape. Computer algorithms identify the anatomically specifichistogram shape; determine the minimum, maximum, and median values; and then map themedian value to the center of the output range by adjusting the amplification as noted above.Two algorithms on the Fuji system include the automatic mode, which uses the whole area of theimage for segmentation and histogram evaluation, and the semiautomatic mode, which evaluatesa specific region within the image (e.g., a 10�10 cm2 central area). The automatic mode alsodetermines the latitude of the exposure based upon the range of the minimum to maximum his-togram points, whereas the semiautomatic mode uses a predetermined latitude range. A thirdselection is the fixed sensitivity mode, where the user sets the sensitivity of the reader when

21
reading the IP. In this mode, the system responds similarly to a screen-film detector, and requiresappropriate selection of radiographic technique.
4.2.2 Kodak Systems
Kodak PSP systems use an exposure index (EI),19,47 a value directly proportional to the averagelog incident exposure on the plate, and is calculated as:
EI ≅ 1000 � log(exposure in MR) � 2000
An exposure of 1 mR (80 kVp, 0.5 mm Cu, 1 mm Al filtration) results in an EI of 2000. Anexposure of 10 mR leads to an EI of 3000, and an exposure of 0.1 mR will result in a value of1000 for a calibrated system. Doubling the screen exposure results in an increase of 300 in theEI value; therefore, the units of EI are “kilobels” (analogous to decibels, commonly used inengineering). When using a high-resolution PSP detector (“HR” imaging plates), the EI has alower range, resulting from less IP attenuation.
4.2.3 Agfa Systems
Agfa PSP systems utilize an exposure indicator called “lgM,” which is the logarithm of themedian exposure value of the raw histogram.48,49 Every Agfa PSP examination is assigned aSpeed Class, and the system compensates for exposure variations of a factor of 4 around theintended speed. The lgM value indicates the actual exposure to the IP by a mathematical rela-tionship to the Scanned Average Level (SAL), which is just the average grayscale value. A 2.2mR (20 µGy) exposure to the IP using 75 kVp and 1.5 mm added Cu developed with a SpeedClass of 200 results in an SAL of 1800. As a result of square-root amplification of the PMT out-put, the characteristic response of SAL with Speed Class of 200 is as follows:
SAL200 � 1214 � [exposure (mR)].
The SAL value increases with the square root of the Speed Class, S, such that
SAL(S) � SAL200 � (S/200)0.5.
Grayscale values are remapped to a logarithmic scale of exposure, where 4095 equals 3.2768and zero is undefined. The relationship between lgM and SAL is given by
lgM � 3.2768 – log[(4095/SAL)2].
Combining these three equations and simplifying, an exact relationship between lgM and expo-sure is revealed:
exposure (mR) � [(2276/S) � (10(lgM – 3.2768))].
ACCEPTANCE TESTING /QC OF PSP IMAGING SYSTEMS
22
A change of 0.3 in the numerical value of lgM corresponds to a change in exposure by a factorof 2. Although the absolute numerical value of lgM depends on Speed Class, the relative changebetween lgM and exposure is valid regardless of Speed Class. Therefore, lgM is expressed in“lgE” units, which correspond to bels (B).
This relative exposure paradigm is incorporated into dose monitoring software that is anoption on Agfa PSP systems. For each examination, view, and cassette size, an average value oflgM is either calculated over 50 exams or established manually. For each subsequent examina-tion of that type, view, and cassette size, the lgM value is compared to the nominal lgM. Thedose offset is reported both numerically and in the form of a thermometer graphic. The nomi-nal lgM values and average statistics for the last 100 exams of each type can be printed or madeavailable in electronic form.
4.2.4 Konica Systems
Konica REX values48 are generated from an exposure paradigm defined as follows:
S � QR � E1/E,
where QR is the preset quantization range, E1 is the plate exposure in mR that produces a digi-tal value of 1535, and E is the average exposure in the region of the plate used for the calcula-tion of S. For a QR of 200, the system is calibrated to provide the 1535 code value with anexposure of 1 mR at 80 kVp to the IP. Thus, a 1 mR exposure yields an S of 200 � (1/1) � 200,and 2 mR yields an S of 100.
The manufacturers are universally basing their “target” exposures on an incident expo-sure of 1 mR to the IP (even though energy dependence varies), which is close to a “200-speed-equivalent” class detector. This is likely due to the recognition of less absorption efficiency of thePSP IP relative to a 400-speed screen-film detector (by about one-half) and the need to achievea similar SNR on the image relative to the screen-film image. Another point is the difference inthe beam quality used for calibration by the manufacturers. There is a strong dependence onkVp and filtration for consistency of the exposure indices for all systems. An effort to standard-ize the methods for exposure index calibration for all DR devices is needed and is currentlybeing undertaken by the AAPM.50
4.3 Exposure Concerns When Using PSP SystemsThe exposure indicator estimate of the incident exposure to the PSP detector is sensitive to seg-mentation algorithms, anatomical menu or histogram selected, amount of collimation (or lackthereof), effective energy of the beam (kVp, filtration), positioning of the patient relative to thephosphor, the presence of high-density objects in the field of view (e.g., prosthetic implants), thesource-to-image distance, and the delay between exposure and readout, among other factors.Because the PSP system provides a nearly optimal display of the anatomical information inde-pendent of exposure, this number is an important aspect of quality assurance, patient care, andtraining issues. The optimal exposure range for clinical imaging procedures such as chest imag-ing requires an x-ray technique corresponding to a ~200-speed screen-film detector system,based upon the empirical analysis of images and characteristics of the PSP image acquisitionprocess.27,51 For extremities, a higher exposure should be considered (e.g., 50 to 100 speed, similar
AAPM REPORT NO. 93
23
to extremity screen-film cassettes), while for pediatric imaging a lower exposure is recom-mended (e.g., 400 speed or faster, depending on the radiologist’s concern for dose and toleranceof quantum mottle in the image). Underexposed PSP images are identified by increased quan-tum mottle due to insufficient x-ray photons and subsequent amplification that reduces SNR andcontrast resolution. In selected examinations, radiation exposures can be reduced when the sig-nal is sufficient in the presence of increased noise (e.g., nasogastric tube placement,27 scoliosisfollow-up examinations43).
More problematic are overexposures, due to the large dynamic range of the “overexpo-sure” region (see Figure 11), the inability to easily detect the overexposure (the image looksgreat), and the potential for complacency on the part of both the technologist and the radiologistin accepting these images without understanding the disservice to good patient care and properradiation safety. Visual cues and information on each printed film or soft-copy image should beavailable to alert radiologists and technologists that the exposures are outside “normal” limits.Optimal radiographic techniques for PSP detectors might differ from screen-film detectors, par-ticularly for the kVp setting because of the inherent differences in the phosphor composition anddigital post-processing of the image.52 In general, the recommended kVp setting for PSP detec-tors is slightly higher than screen-film for imaging small thicknesses (e.g., extremities, youngpediatric patients). For instance, instead of 60 to 65 kVp, the use of 5 to 10 kVp higher (65 to75 kVp) will lower patient dose (only with a commensurate decrease in the mAs for the sameincident x-ray fluence on the detector) but will not significantly affect the processed imagecontrast. Similarly, for imaging large thicknesses in which the screen-film technique is typically100 kVp or higher (e.g., adult chest), a suggested corresponding technique for PSP detectors is5 to 15 kVp less. This is chiefly due to the poorer absorption of the phosphor compared to thescreen-film phosphor at higher effective energies. A suggested kVp for an adult chest image is100 to 110 kVp, compared to 120 to 130 kVp for a corresponding screen-film image. These aregeneral recommendations only, and specific techniques must be determined on a case-by-casebasis, preferably with the feedback from a radiologist.
Technologists should be advised to adjust manual radiographic techniques for grid andno-grid examinations by taking account of the grid Bucky factor. It is very easy to become com-placent and use a grid technique when the grid is not used, particularly for portable exams, pro-ducing a needless overexposure by a factor of 2 to 3. Continuous training, in-services, oversight,and feedback are recommended to ensure proper use and radiographic technique with PSPdetectors.
5. PSP SYSTEM IMAGE CHARACTERISTICS
5.1 Spatial ResolutionLimiting high contrast resolution in PSP radiography is determined by several factors: physicallimits imposed by the composition and thickness of the phosphor plate, the size of the laser spot,temporal lag of the PSL, and light scattering within the phosphor contribute to the modulationand loss of the “pre-sampled” signal. The finite diameter of the laser spot and the spread of PSL,particularly at depth, contribute to unsharpness, as shown in Figure 18. Pixel size, typicallybetween 100 and 200 µm, determines the maximum spatial resolution of the system, up to phys-ical limits imposed by the composition of the IP and the size of the laser spot. Digital samplingconfines the accurately depicted spatial frequencies to a maximum called the Nyquist frequency,
ACCEPTANCE TESTING /QC OF PSP IMAGING SYSTEMS

24
equal to the inverse of twice the pixel length, (2∆x)–1. Unlike conventional screen-film cassettes,smaller phosphor plates will sometimes provide better limiting resolution than larger plates whenthe number of samples is constant, independent of the IP dimension (more often in newer sys-tems, the sampling pitch is constant, and any changes in output resolution or matrix size isdependent on system configuration settings). Resolution sharpness can be increased with the useof a thinner phosphor layer using high-resolution PSP detectors (see Figure 19); however, lowerdetection efficiency requires a higher radiation dose. Phosphorescence lag causes the spatial res-olution in the fast-scan direction to be slightly less than that in the sub-scan direction.
AAPM REPORT NO. 93
Figure 18. The effective area of the phosphor simultaneously stimulated by the laser is determined by the inci-dent laser diameter, laser light spread within the phosphor, and the distribution of the PSL collected by the lightguide assembly. This spread reduces the modulation of higher frequency signals. (Adapted from reference 17,page 746, fig. 15.)
Figure 19. Typical results for pre-sampled MTF curves with PSP detectors are illustrated. The curves on the leftare for standard resolution (thick phosphor) and on the right for high resolution (thin phosphor). Solid and dashedlines distinguish the scan and sub-scan MTFs, respectively. (Adapted from reference 52).
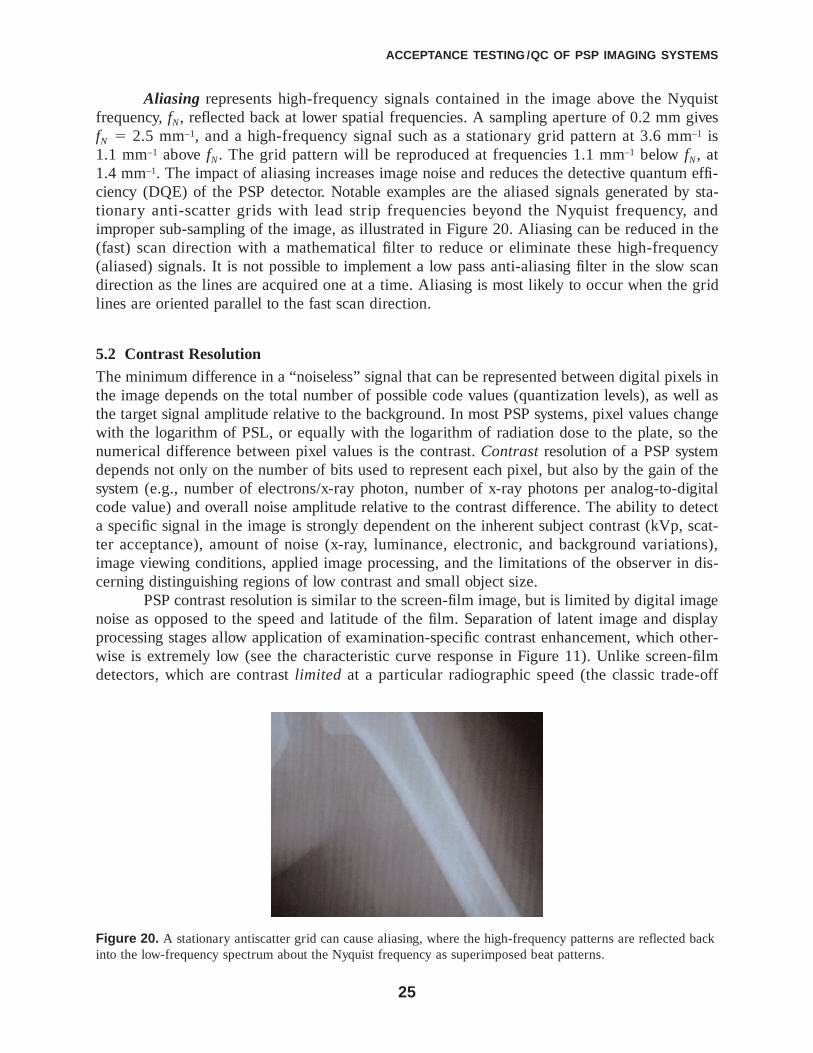
25
Aliasing represents high-frequency signals contained in the image above the Nyquistfrequency, fN, reflected back at lower spatial frequencies. A sampling aperture of 0.2 mm givesfN � 2.5 mm–1, and a high-frequency signal such as a stationary grid pattern at 3.6 mm–1 is1.1 mm–1 above fN. The grid pattern will be reproduced at frequencies 1.1 mm–1 below fN, at1.4 mm–1. The impact of aliasing increases image noise and reduces the detective quantum effi-ciency (DQE) of the PSP detector. Notable examples are the aliased signals generated by sta-tionary anti-scatter grids with lead strip frequencies beyond the Nyquist frequency, andimproper sub-sampling of the image, as illustrated in Figure 20. Aliasing can be reduced in the(fast) scan direction with a mathematical filter to reduce or eliminate these high-frequency(aliased) signals. It is not possible to implement a low pass anti-aliasing filter in the slow scandirection as the lines are acquired one at a time. Aliasing is most likely to occur when the gridlines are oriented parallel to the fast scan direction.
5.2 Contrast ResolutionThe minimum difference in a “noiseless” signal that can be represented between digital pixels inthe image depends on the total number of possible code values (quantization levels), as well asthe target signal amplitude relative to the background. In most PSP systems, pixel values changewith the logarithm of PSL, or equally with the logarithm of radiation dose to the plate, so thenumerical difference between pixel values is the contrast. Contrast resolution of a PSP systemdepends not only on the number of bits used to represent each pixel, but also by the gain of thesystem (e.g., number of electrons/x-ray photon, number of x-ray photons per analog-to-digitalcode value) and overall noise amplitude relative to the contrast difference. The ability to detecta specific signal in the image is strongly dependent on the inherent subject contrast (kVp, scat-ter acceptance), amount of noise (x-ray, luminance, electronic, and background variations),image viewing conditions, applied image processing, and the limitations of the observer in dis-cerning distinguishing regions of low contrast and small object size.
PSP contrast resolution is similar to the screen-film image, but is limited by digital imagenoise as opposed to the speed and latitude of the film. Separation of latent image and displayprocessing stages allow application of examination-specific contrast enhancement, which other-wise is extremely low (see the characteristic curve response in Figure 11). Unlike screen-filmdetectors, which are contrast limited at a particular radiographic speed (the classic trade-off
ACCEPTANCE TESTING /QC OF PSP IMAGING SYSTEMS
Figure 20. A stationary antiscatter grid can cause aliasing, where the high-frequency patterns are reflected backinto the low-frequency spectrum about the Nyquist frequency as superimposed beat patterns.

26
between detector latitude and film contrast), the PSP image contrast is noise limited. The ran-dom variation of absorbed x-rays in the PSP detector determines the quantum noise component.Stimulated luminance variations during the readout process contribute significant variations inthe output signal. Electronic noise sources cause a further variation in the output signal.Quantization noise adds inaccuracies in the determination of the discrete digital signal ampli-tude values, dependent upon the bit depth of the ADC, typically 10 to 12 bits in current systems.To approximate the typical image noise in a 400-speed film (and thus achieve similar contrastsensitivity), the PSP detector (using standard resolution plates) requires a higher x-ray photonflux by about a factor of 2 times (e.g., a 200-speed system).27 Lower detection efficiency of thephosphor plate relative to a typical rare-earth dual-screen cassette is the chief cause. In addition,edge enhancement processing may influence the appearance of noise.
5.3 Detective Quantum Efficiency (DQE)The DQE describes the efficiency of information transfer from the transmitted x-ray fluence onthe detector to the output image used for diagnosis with respect to spatial frequency. It isdependent on the quantum detection efficiency (QDE) of the image detector and the conversionefficiency (CE) and associated noise with each stage involved in creating the final image. Thisincludes the number of trapped electrons per absorbed x-ray photon, noise in the stimulation andemission of the latent image, noise in the conversion to an electronic signal, noise associatedwith the digitization, and noise occurring in the final output image presentation. An estimate ofthe large area, zero frequency DQE of a storage phosphor has been formulated as:53,54
AAPM REPORT NO. 93
DQEX
CV E CV el CV S gPSP
abs=+ ( )[ ] + ( )[ ] + ( )[ ]+ < >1 1 1 −−1
where: Xabs � fraction of incident x-ray photons absorbed in the phosphor layer,CV(E) � coefficient of variation of the x-ray energy absorbed in the phosphor layer,CV(el) � coefficient of variation in the number of trapped electrons for a given
absorbed energy,CV(S) � coefficient of variation of the light signal emerging from the phosphor for a
given number of trapped electrons, and<g> � the average number of photoelectrons detected at the photomultiplier per
absorbed x-ray (the large-area response function).
The energy dependence of Xabs is plotted in Figure 4. CV(E) depends on the overlap of the spec-trum with the k-edge of barium and the fraction of K characteristic x-ray escape. For an 80 kVpx-ray beam transmitted through the patient, a value of ~0.15 has been estimated for the coeffi-cient of variation of energy absorption in the phosphor layer. Hundreds of electrons are trappedin the phosphor F-centers per absorbed x-ray photon, making CV(el) relatively small (<0.05).On the other hand, the variation of stimulating laser light with depth in the phosphor and a sim-ilar variation of emission light with depth makes the luminance noise value CV(S) quite high,estimated to be on the order of 0.8.23 Large-area gain in the phosphor, <g>, is ~10, and resultsin the value in the denominator of the DQE expression ≅ 2. Thus, the DQE(0) can be estimatedas approximately 1/2 Xabs . At 80 kVp with a typical transmitted x-ray spectrum through apatient, DQE(0) ≅ 0.25 for standard resolution and DQE(0) ≅ 0.13 for high-resolution phosphor

27
plates. These values approximate the published findings of Dobbins52 and Hillen.55 Values ofDQE( f ) has been thoroughly investigated for several generations of storage phosphor imagingplates,52,56 showing a slow, but steady improvement in the development of phosphor plate tech-nology and subsequent detection efficiency as a function of spatial frequency. Recent introduc-tions of dual-side readout13,18 and structured phosphor technologies14,22 for PSP detectors havedemonstrated great improvement in the DQE, approaching that of flat-panel detectors.20,21
In a digital system with sufficient bit depth and resolution, increased SNR can beobtained by simply increasing the radiation exposure to the detector up to a saturation level or toa point where other noise sources begin to dominate, but the cost is increased exposure to thepatient. Quantitative detector analysis can determine system performance using objective meas-urements. The pre-sampled modulation transfer function, MTF( f ), is a measure of the detectorobject transfer efficiency as a function of spatial frequency (the signal). The noise power spec-trum, NPS( f ), is a measure of the noise characteristics of the detector (the noise). When scaledby a conversion constant, a ratio of MTF2( f ) to NPS( f ) generates the noise equivalent quanta,NEQ( f ), as a function of spatial frequency. This is an estimate of the equivalent number of x-ray photons per unit area (usually mm2) that the detector effectively uses. With increasing inci-dent exposure, the NEQ( f ) similarly increases to a point where the system saturates and/or othernoise sources dominate, after which NEQ( f ) decreases. At a given spatial frequency, the meas-ured NEQ( f ) represents the output signal to noise ratio, SNR2
out.The DQE is the ratio of the noise equivalent quanta to the actual number of quanta as a
function of spatial frequency: DQE( f ) � NEQ( f ) / q. The incident radiation flux, q, is the num-ber of x-ray photons incident on the detector per unit area (usually expressed in mm2) deter-mined from computer simulations from a known x-ray source, kVp, mAs, and beam quality(half-value layer [HVL]).57 DQE is also calculated as: SNR2
out / SNR2in . A perfect detector sys-
tem has a DQE( f ) of 100% at all spatial frequencies. X-ray detector systems lose efficiency oversmaller areas (at high spatial frequency) because of the inability of the detector to efficientlycapture x-ray information and/or have additive noise such as electronic amplification noise, pixeldrop-out, or phosphor “structure” noise (among other sources), all of which can mask the truesignals. Some digital detectors can use the incident radiation more effectively, and thus canreduce the exposure to the patient for a given SNR. In general, DQE( f ) measurements for digi-tal detectors range from less than 10% to as high as 80% for large-area objects (low spatial fre-quency range). The actual DQE depends on the detector design and x-ray conver tercharacteristics. For high spatial frequencies (detail information) the DQE drops to the pointwhere the system can no longer retain the identity of a small-area input signal. To be useful, it isimportant to determine the incident exposure range over which the DQE is quoted because somesystems operate more effectively over a given exposure range (e.g., mammography requiresmuch more radiation exposure than conventional imaging). Knowledge of the DQE, NEQ, NPS,and MTF for PSP radiography allows objective comparisons that can assist in the determinationof appropriate and reasonable performance for a particular imaging application. With that beingsaid, measurement of the NPS and MTF is beyond the scope of the clinical acceptance testingof a PSP system.
5.4 Image DisplayManufacturers design image processing parameters that assume the shape of the LUT to beapplied by the display device. In a networked environment, it is important to confirm that the
ACCEPTANCE TESTING /QC OF PSP IMAGING SYSTEMS
28
display device, be it a printer, or a PACS workstation, is applying the same LUT as the PSP sys-tem vendor expects.
Cathode ray tube (CRT) and flat-panel monitors are used for “soft-copy” display. Theaccuracy of grayscale rendition is crucial, from the QC workstation of the technologist to theinterpretation monitor for the radiologist or referring physician, to ensure the optimal transfer ofimage information. Monitors are often the weak link in the overall digital acquisition and displaysystem. Specific calibration procedures have now become standardized, as documented inDICOM PS3.14, the Grayscale Standard Display Function (GSDF).58 This standard is basedupon the perceptually linear response of the human observer, and the ability to change the dig-ital driving levels of a monitor to ensure that the grayscale that is rendered follows that response.Acceptance testing and quality control are specified in the AAPM Task Group 18 document ondisplay monitor specifications, measurements, and quality control.59 An increased emphasis onthe acceptance testing and quality control of display devices and viewing conditions is necessaryto ensure optimal image rendition, as any x-ray imaging system is only as good as its weakestlink. The report of AAPM Task Group 18 describes functional characteristics, acceptance test-ing, and quality control of display technologies for medical imaging applications. It is extremelyimportant to ensure the proper operation of the display devices as part of the overall qualityassurance and quality control program.
Laser film printers convert the digital images to film images to mimic the conventionalscreen-film paradigm, where the film is transilluminated for viewing. With some PSP systems, theimage size must be reduced (demagnified) by a variable amount, depending upon the phosphorplate size and output film format. Hard-copy presentation of the PSP image commits the user toa single rendering, obviating a major advantage of digital display processing. In order to providetwo different grayscale/edge enhancement renderings, the image size may be further reduced toaccommodate two images on a single film. This two-on-one format requires a reduction to 50%of the 35 � 43 cm (14 � 17 in.) FOV on small-format PSP films (~26 � 36 cm). Size reductionscomplicate direct measurements on film and make comparisons of films with size differencesmore difficult. Full field of view printing is available on 35 � 43 cm format film, with samplingmatrices up to approximately 7000 � 8600 pixels (by one manufacturer) to provide high spatialresolution typically of 5 to 10 line pairs per millimeter (lp/mm) over the full FOV. In networkedlaser printers, large film printing is available for a range of digital matrix sizes by interpolationand extrapolation of the digital image data. Slight size reductions of 5% may occur with manylaser printers in this large format to accommodate a border around the film, an important detailto know when size measurements are made from the film, for example in orthopedics.
Printer calibration requires matching of the grayscale appearance of the image on thedisplay with that on the film. Conventional methods involve working with the printer manufac-turer to use predesigned LUTs specific to a particular PSP device to produce similar looks. Analternate approach is to use DICOM presentation values (p-values), on a printer calibrated to theDICOM standard, that adhere to the standard and that through the use of appropriate DICOM-compliant LUTs can be matched to display devices operating at much lower maximum lumi-nance levels. In addition to this, CRT phosphors and liquid crystal display (LCD) backlightsproduce different colors and CRTs have different phosphorescence lag when changing images.
The adverse effect of high ambient light levels on the appearance of the image is moreproblematic with a soft-copy display device than with a transilluminated film because of thelower luminance of these devices. Steps to control ambient lighting in the QC console area mustbe taken. While this situation is complex, DICOM PS3.14 provides methods to address the dif-ferences in luminance levels.
AAPM REPORT NO. 93

29
6. GENERIC FUNCTIONAL SPECIFICATIONS OF PSP SYSTEMS
It is highly recommended to communicate with marketing specialists and system engineers todetermine the up-to-date capabilities/specifications of a particular PSP system prior to purchase,installation, and testing. A specific system configuration can significantly affect how the physi-cist conducts acceptance tests. Functional specifications related to “typical” capabilities/specifi-cations are listed based upon a review of vendor literature.
6.1 Phosphor Detectors and CassettesSeveral detector and cassette sizes are available for PSP systems. The most popular sizesinclude 35 � 43 cm (14 � 17 in.), 35 � 35 cm (14 � 14 in.), 24 � 30 cm (10 � 12 in.), 24 � 24 cm (10 � 10 in.) and 18 � 24 cm (8 � 10 in.). Special size cassettes (e.g., 20 � 20cm) and those needed for specialized applications (e.g., scoliosis, long FOV, and dentalpanorex x-ray) are also available as options from certain manufacturers. The time requiredreading the phosphor plate is dependent on the plate size. Larger sizes usually take longer toread, and decrease overall system throughput. Spatial resolution can also be affected by phos-phor plate size. The dependence of spatial resolution is highly manufacturer-dependent, and issometimes related to the IP dimensions. Configuration of output spatial sampling and matrixsize may also differ from the intrinsic resolution, with larger resolution elements and smallermatrices often used for large FOV detectors, providing adequate resolution and detail for theparticular studies. Plate inventory should be sufficient to eliminate delays due to accessibility ofplates, and not by the throughput of the PSP reader. Related to the second item, it is highly rec-ommended to have two or more PSP systems in busy work environments for redundancy in theevent of system malfunctions or scheduled downtime. Standard resolution and high-resolutionimage detectors are available from the manufacturers, and should be considered for use relativeto the imaging application. A trade-off of detection efficiency for slightly better spatial resolu-tion requires approximately three times more exposure with the high-resolution detector toachieve an equivalent SNR.19 (See section 6.3.)
6.2 PSP Detector Throughput Throughput is defined as the average time from the insertion of an imaging plate/cassette to thetime it can be reused. A range of ~30 up to ~200 IPs per hour are specified by the various man-ufacturers for laser point scan systems, depending on the equipment and options purchased. PSLdecay time is the major limit to the throughput speed, although in some systems plate handlingand erasure requirements can add substantial time for the transit of a plate through the reader.Some PSP systems have internal stackers or external automatic handling capabilities to allow theuser to accomplish other functions without having to wait for the total readout process. Multipleplate readers take advantage of “pipeline-processing” and simultaneous reading and erasing toprovide an average higher throughput than “one-plate” readers. Line-scan systems provide evenhigher throughput but are typically part of a detector device slaved to a specific purpose, e.g.,chest stand or under-table Bucky device. In terms of enhanced efficiency, line-scan systems fromthe various manufacturers are expected to increase in use, replacing systems that would other-wise use a cassetteless point-scan system.22,23,28
ACCEPTANCE TESTING /QC OF PSP IMAGING SYSTEMS

30
6.3 Spatial ResolutionSpatial resolution is chiefly dependent on the reading and recording laser sampling pitch over agiven FOV (phosphor plate size), which determines pixel size. Many PSP reader systems utilizea laser beam with an effective 100-µm diameter spot size on the phosphor, but there are varia-tions from this value. The output sampling pitch is determined by the element length and thenumber of elements across the detector. In some cases, the element length is larger for largerdetectors with the number of elements remaining the same. PSP detector characteristics includ-ing phosphor coating thickness, protective coating layer thickness, finite laser beam dimensions,and light scatter in the phosphor, as well as frequency response of electrical circuits will deter-mine limiting spatial resolution potentially greater than that expected from resolution elementsize. In general, limiting spatial resolution (<5% MTF) ranges between 2.5 to 5 lp/mm (0.2 mmto 0.1 mm object detail), which is less than a 400-speed screen-film resolution capability ofabout 4 lp/mm (0.125 mm object detail) at 20% MTF.60 Resolution of 10 lp/mm, equivalent to0.05-mm detector element length is available with some PSP systems that are designed for mam-mography and high-resolution radiography.
There are several generations of PSP detectors with different physical and performancecharacteristics available from the manufacturers. “Standard-resolution” and “high-resolution”plates that can be used in the same PSP reader are provided by some manufacturers. The formeris typically used for all applications in general radiography, while the latter is used for extremi-ties and proposed mammography applications. The thickness of the standard-resolution plates isapproximately two times greater than that of the high-resolution plates. As with screen-filmdetectors, there is a trade-off of QDE and contrast resolution for spatial resolution for a specificexposure. To achieve standard- or high-resolution output, the sampling pitch and laser spot sizeare often changed. Information of resolution factors, MTF measurements, and DQE measure-ments are in the literature.17,52
Soft-copy display devices also influence spatial resolution of the displayed radiograph.CRT and LCD monitors can be the limiting factor for displaying image matrices, depending onthe FOV, the bandwidth and number of television lines of the monitor, or the number of pixel ele-ments. Images with a larger matrix size than the display can support require pixel averagingwith a corresponding loss of detail. One-to-one image pixel to display pixel mapping is neces-sary for achieving true intrinsic spatial resolution on the output display, which often requires aportion of the image to be displayed at one time, thus sacrificing the FOV of the whole image.With image panning, the whole image can be investigated at the intrinsic resolution limit of thedetector.
6.4 Contrast ResolutionOptimally tuned PSP systems with low electronic noise will have contrast resolution chieflydetermined by image acquisition techniques (kVp, antiscatter grid, geometry, etc.), processingparameters (display gradient, frequency processing, noise filtering), and DQE of the PSP phos-phor. Image information thus acquired without post-processing is termed “raw data” and repre-sents grayscale values that correspond to the PSL emitted from the screen. These images aretotally unacceptable to the human viewer, due to the lack of display contrast that is achieved bydata ranging and post-processing, two crucial steps for optimizing contrast resolution.
A major equipment issue is the bit depth of the pixel, which determines the number ofdiscrete gray levels that encode the contrast differences. Ten bits has been shown to be sufficient
AAPM REPORT NO. 93
31
for film recording,17 and most soft-copy monitors (either CRT or LCD) use a signal derived froman 8-bit range of values. In most PSP acquisition systems, 12 or more bits are used for the ini-tial digitization, the number of which is vendor specific. Regardless of the acquisition bit depth,there is a potential to lose image information if scaling algorithms and/or histogram analysis areimproperly applied, or if the display medium (hard or soft copy) has inadequate or noncalibratedgray-level display capabilities. Contrast resolution is dependent on the incident exposure; thedynamic range; the signal derived from attenuation differences; and the noise defined by thequantum, electronic, quantization, and detector variable response uncertainties. The signal isdependent on the beam quality and effective attenuation coefficient of the objects in the beampath. The noise should be chiefly dependent on x-ray quantum statistics over the clinically rele-vant exposure range, where the greatest contribution to the statistical uncertainty is the x-rayscontributing to image formation. This requires that the PSP detector/reader be optimized to haveother noise sources significantly smaller that quantum noise. A minimally acceptable SNR levelallows contrast enhancement through image post-processing without excessive amplification ofthe noise.
In terms of image output, two alternatives for display of processed images include “forpresentation” and “for processing.” For presentation images, use a “burned-in” LUT applied bythe modality workstation that defines the useful exposure range determined by the “autorang-ing” function and contrast enhancement over the region. Information below or above the pre-defined range is lost due to thresholding or saturation. “For processing” images have the fulldynamic range information content maintained, and a nonlinear (e.g., sigmoid-shaped curve)value-of-interest look-up-table (VOI LUT) provides the conversion of raw data to display ofcontrast enhanced data on-the-fly,61 and allows the user to adjust the display window outside ofthe boundaries set by autoranging algorithms. In a PACS environment this allows one to over-come mistakes in the initial analysis of the histogram data or by user input errors in selectingthe correct examination algorithms. A PACS-aware “for processing” image capability with VOILUT is necessary to use this capability; otherwise the images will appear very flat and washed-out. Without VOI LUT or vendor-specific enhancement, “for presentation” data should be sentto the PACS.
6.5 Dynamic RangeThe incident exposure sensitivity of the PSP detector typically extends from 0.01 mR up to 100mR (a range of about 10,000 or 104, determined by the amplifier settings of the PMT). In somesystems, a “high gain” setting can reduce the lowest detectable exposure to 0.001 mR.Logarithmic amplification is applied in many systems, partially to compress the dynamic rangeof the exposure-luminance response curve, and to use the limited output integer range moreeffectively. (Note: In some systems, “square-root” amplification is used in lieu of log amplifica-tion. See section 2.3.6, Digitization.) Intrinsic detector contrast is low, and is not clinically opti-mal for a human viewer. (“Four decades” of dynamic range is attributed because of thistremendous exposure response; however, rarely are four decades of dynamic range required ordesired for diagnostic radiology applications.) The range of exposures containing the usefulimage information is identified with image analysis of the digital distribution on the raw image,usually by histogram analysis. Examination-specific algorithms evaluate the distribution andshape of the resultant histogram, followed by contrast enhancement to mimic screen-filmresponse in “for presentation” images tuned for radiologist preference. However, for images sub-mitted to a computer viewer, preferred is the unprocessed or “for processing” output.
ACCEPTANCE TESTING /QC OF PSP IMAGING SYSTEMS

32
6.6 Desirable Specifications and Features
6.6.1 Phosphor Plates, Cassettes, Grids, Identification Terminals
The number of phosphor plates and cassettes should meet 1.5 times the peak simultaneousdemand for imaging services, for all IP sizes. Usually, only a minimal number of IPs is providedin the basic CR reader package. Stationary, low-frequency grids can be problematic with digi-tally sampled images, including PSP systems. High-frequency grids of 55 lines/cm (140lines/in.) up to 70 lines/cm (178 lines/inch) and multi-hole grids are available to alleviate prob-lems with aliasing and moiré patterns, particularly in the slow-scan direction, and should beconsidered as part of the system purchase. Cassette identification (ID) terminals electronicallycorrelate the patient to the cassette, and provide the examination-specific processing instruc-tions. ID terminals placed in convenient, strategic locations in the work environment are impor-tant to avoid workflow bottlenecks and throughput problems. In addition, ID terminals and PSPreaders within a specific locale should be locally networked to allow any identified IP to beprocessed by any reader for redundancy and increased throughput.
6.6.2 Output Hard-Copy Image Characteristics
Output image format of 1:1 magnification for all image sizes (18 � 24 cm through 35 � 43 cm)should be requested. Many laser printers reduce the actual image size by up to 5% (95% of“true” size that would be achieved on a screen-film detector). Distance calibration marks onthe side of the films should also be included. Laser printers calibrated for DICOM GSDF pres-entation state are preferred, and PSP image review workstations that send presentation values(“p-values”) to the printer will avoid the modality-specific LUTs that are part of a vendor’slaser printer setup.61 If GSDF calibration is specifically not available, it is prudent to requestuser-adjustable printer LUTs to match grayscale appearance on the soft-copy monitor.
6.6.3 Incident Exposure Estimation; Other Data Fields
Incident exposure estimates for PSP image acquisitions are extremely important, should beincluded on the image demographics as a requirement, and preferably tracked in a database forlong-term analysis of trends. In addition, other performance indices and database functionsshould be considered, including display of extremely high or low exposures, number of exposurecycles of each IP (to track longevity), and processing parameters applied to the image, amongother data fields.
6.6.4 Image Processing Functionality
Specific image processing capabilities should be listed. These include simple window/leveladjustments, nonlinear adjustments to mimic screen-film response, reverse contrast mapping,edge enhancement, dynamic range control, and fill-in “surround” of unexposed areas (e.g., tofill in the unexposed areas of the resultant image with dark or opaque boundaries—crucial forpediatric newborn studies and small objects). The ability to implement user-defined functions inaddition to the built-in functions is desirable. All image processing should be compatible withdisplays and printers that conform to DICOM PS3.14 and use the GSDF calibration and presen-tation state.
AAPM REPORT NO. 93
33
6.6.5 Patient Demographics and Film Marker Positioning
Systems should have the flexibility of allowing specific institutional, patient, phosphor plate, andtechnologist identification with a user-selectable font type/size and position on the image. Imageprocessing parameters, exposure index, image magnification or minification, image reversal, andpositioning markers should be available.
6.6.6 PSP System Interfaces to RIS, HIS, and PACS
In a PACS environment, insist upon DICOM Modality Work List (MWL) for the ID terminal oruser workstation at the acquisition device, which is most often provided by a PACS “broker”(interacting via HL7 with the Radiology Information System/Hospital Information System[RIS/HIS] and DICOM with the PACS). A list of scheduled patients and patient demographicdata allows easy and efficient identification of the exposed IP/cassette (keystroke entries areoften the cause of broken studies on the PACS) by tagging the patient and exam information inthe DICOM image header. Room and patient scheduling can be achieved through “scheduledworkflow profiles” described in the Integrating the Healthcare Enterprise (IHE) guidelines.62–68
Newer DICOM elements such as performed procedure step, VOI LUTs, and presentation statecapabilities1 are components that the PSP and PACS vendors should both implement (at the timeof publication these capabilities are not universal). A DICOM conformance statement for thePSP reader, PACS broker, QC workstation, laser printer, and other peripherals is necessary toverify desired functionality and information transfer from the PSP system to the PACS and otherpertinent peripherals.69 Proprietary data delivered in “private tags” (odd numbered elements)and desirable optional information in the DICOM header should be specified in the negotiationsfor the equipment as these items are often inaccessible otherwise. Knowledgeable PACS andinformatics expert assistance is helpful for such complicated issues. There are also capable third-party vendors providing functional interfaces between PACS and PSP systems.
6.6.7 Quality Control Phantom; QC Workstation and Software
The vendor/manufacturer should provide a quality control phantom and evaluation program withthe PSP system or systems. This is often an option at additional cost for the hardware and soft-ware, but it is necessary for the user, and is highly recommended. Spatial resolution, contrast res-olution, exposure uniformity, exposure linearity, and distance measurement accuracy are thetests that can provide trend analysis and reliably demonstrate compliance and failure. Ideally, athird-party phantom, specifically designed for “generic” PSP acquisition performance and imagequality should be specified in addition to the manufacturer-specific phantom at larger, multiven-dor sites. The QC/image review workstation allows verification of patient positioning, image ori-entation, and proper grayscale rendition. Monitor calibration is crucial to maintain consistentappearance at the PSP review workstation as well as the PACS and other soft-copy display work-stations. This can be achieved by implementing DICOM PS.14 GSDF.58 Luminance (≥171 cd/m2
[candela per square meters]) and luminance ratios (≥100:1) as well as low room illuminance<20 lux (sometimes difficult to achieve) should meet the recommendations of AAPM TG-18.70
Ideally, the technologist workstation should have capabilities meeting the minimal standards of aprimary diagnostic review station with luminance ≥250 cd/m2 and luminance ratio ≥250:1, par-ticularly for systems in which the image contrast is adjusted by the user. Image monitors, partic-ularly LCD, should be carefully inspected to ensure minimal angular dependence, particularlyin the vertical direction (from top to bottom), as image appearance can drastically change with
ACCEPTANCE TESTING /QC OF PSP IMAGING SYSTEMS

34
viewing angle, which causes unintended variations in window/level settings by technologists ofvarious heights. The QC workstation should have software tools to assist in measuring systemperformance. Manual and automated quantitative tools such as region of interest (ROI) pixel val-ues, ROI standard deviations, contrast-to-noise ratios and maximum SNRs for QC image testsare desirable. Periodic results cataloged in a database and plotted versus time (daily, weekly, andmonthly) provides trend analysis and performance indices to show compliance failures, and canindicate the need for preventive maintenance prior to a problem being manifested.
6.6.8 Service Contracts, Preventive Maintenance, Warranty, and Siting Requirements
Hardware/software upgrades, phosphor detector/cassette longevity, and system extended war-ranty considerations should be part of the maintenance contract. This includes approved third-party service or in-house radiological engineering support/training as primary responders ifdesired. Site preparation issues include details about required power, air conditioning/filtering,equipment footprint, configuration of the PSP readers, preliminary schematic drawings, etc. Thewarranty terms should specify the expected on-site response time, and time to guaranteed reso-lution of any reported maintenance issue. Penalty clauses for failure to meet expected levels ofservice and maintenance should be specified.
6.6.9 Application Training for Technologists, Radiologists, Physicists, Clinical Engineers
Specific reference to applications training should be indicated, even when the vendor has a stan-dard level of applications training with the sale of the equipment. A minimum of 1-week, on-sitetraining is recommended for technologists (include work shift hours as necessary). This shouldbe followed by a subsequent week of refresher assistance approximately 1 to 2 months after theinitial training. Often, a super-tech is specified for advanced training at the manufacturer’s facil-ity. Radiologists should interact with the application specialist during the initial startup of thesystem to implement specific image processing algorithms appropriate for each examination.Physicists should be aware of processing algorithm tuning functions and be instructed on pro-cessing variables, effects on image appearance, and adjustment procedures. Hospital engineeringstaff should be trained for simple preventive maintenance tasks and error recovery issues. Inaddition, these individuals should also have the option of attending a training program designedfor preventive maintenance and in-depth system repairs, particularly in the absence of a war-ranty agreement.
7. CLINICAL IMPLEMENTATION ISSUES
7.1 Expectations and RealitiesThe benefits anticipated by the introduction of PSP systems into clinical practice depend on theintended role. When PSP radiography is introduced as a replacement for screen-film as a detec-tor, the user expects to benefit from the improved consistency and decreased repeat rate whencompared to conventional radiography. When PSP radiography is introduced to provide flexibil-ity in the presentation of the image, the user expects to benefit from the ability to reprocess thedigital image. When PSP radiography is introduced in order to replace film with a digitalarchive, the user expects to benefit from the convenience of storing images in electronic form.
AAPM REPORT NO. 93

35
When PSP radiography is introduced to replace film with a digital image distribution and displaysystem, the user expects to rely on PSP images exclusively for acquisition of ordinary radi-ographic examinations.
The clinical acceptance of PSP radiography depends in part on perceptions of compar-isons with conventional screen-film for similar tasks. A benefit of PSP radiography over screen-film is the ability to modify the appearance of the digital image to enhance conspicuity ofclinical features. However, there is no universal agreement on the optimal set of processing val-ues for an examination. The effects of display processing depend on radiographic technique, andtoo much “processing” can generate undesirable results. The ability for a knowledgeable opera-tor to modify processing defaults introduces a configuration management problem: for consis-tency, it is important to assure that the same processing defaults are loaded in all PSP machinesand identification terminals. Differences in processing methods between manufacturers meanthat PSP images produced by identical radiographic technique with the same subject may nothave the same appearance with PSP systems of different vendors. Comparison examinations overtime should have the same image processing parameters to assist consistent clinical diagnosis.
7.2 Technical ConcernsBecause the first step in processing the PSP image is to locate the exposure field and ignore sig-nals outside the field, patient positioning, x-ray beam collimation, and convergence of the lightfield and x-ray field are more critical than in screen-film imaging. Generally, the anatomy ofinterest should be centered on the IP, collimation should be used to reduce the amount of beamthat is unattenuated by the subject; collimation should be symmetric and parallel to the edgesof the cassette. When an image is acquired without collimation borders on one side of the IP,the finding routine will often fail to recognize the correct borders and produce an unrealistichistogram, and cause scaling errors. Sometimes the anatomy of interest cannot always be cen-tered on the IP and collimation cannot be symmetric or parallel, for example, elbows. Currenttechnology (year 2000 and beyond) PSP systems are more tolerant for such cases. Additionally,it is prudent to acquire only one image per phosphor plate, but there are some systems that caneffectively deal with multiple exposures. When one considers the potential for confusing thePSP reader with multiple images per plate, and a somewhat better spatial resolution for smallercassettes, it is advised to project a single view on the smallest cassette possible, especially forextremity exams emphasizing bone rather than soft tissue. If digital images are to be viewedon a soft-copy device, separate images can be manipulated independently, unlike multipleimages on a single detector (display). If multiple views are to be used, it is helpful to place onlysimilar views on a given detector. The PSP reader algorithms may be able to segregate theviews for histogram analysis, but appropriate display processing selected for one view must beapplied to all.
Unlike screen-film radiography, the size of the cassette selected can have a pronouncedinfluence on the image resolution, particularly for older PSP readers, where the output matrix isfixed and the spatial sampling is adjusted to fit the detector dimension. Newer systems with fixedspatial sampling have an image matrix size that varies according to the imaging plate dimension,and spatial resolution is independent of the detector size. In some cases, the output image sentto the PACS is reduced by pixel averaging the acquired image at the image QC workstation. Forinstance, a 35 � 43 cm image with 100 µm sampling (3500 � 4300) is often converted to200 µm (1750 � 2150), which reduces resolution by a factor of 2 but reduces image size by afactor of 4. There is another effect for hard-copy films, depending on the format of the laser
ACCEPTANCE TESTING /QC OF PSP IMAGING SYSTEMS

36
printer and the size of the films: the images acquired with the smaller cassettes may be presentedat 100% magnification, while those from the largest cassette may be presented in reduced size.
IPs of different generations differ in their x-ray capture and light-generating characteris-tics, thus the PSP reader should be calibrated specifically for a single detector type. Some detec-tors may not be appropriate for a particular PSP reader model because of laser lightcharacteristics or hardware configurations. It is important to recognize that, while the manufac-turer may only be supplying the current generation IP, there may be IPs of other generations incirculation. Clinical operation with mixed generations of detectors should be avoided unless itcan be shown that variability in the outcome image quality is essentially unaffected.
7.3 X-ray Scatter and Grid SelectionThe lower k-edge of the PSP detector using BaFBr(Eu) (k-edge of Ba at 37 keV) may confer agreater sensitivity to scatter than screen-film. Early versions of PSP cassettes did not have ade-quate backscatter control, which in turn contributed to the formation of artifacts.16 Apprehensionabout scatter has caused some practitioners to recommend scatter reduction grids for all bedsideexams without regard to patient thickness.
The selection of an appropriate fixed grid for the PSP detector is problematic. There is nouniversal agreement about what grid type, focused, parallel, or crosshatch; what grid ratio; inter-space material; or grid frequency to use. The general-purpose 103-line-per-inch grid presents aperiodic signal of about 2 line-pairs per mm (4 lines/mm). Since grids are not truly sinusoidal,higher frequency components beyond the fundamental frequency are present, well beyond theNyquist frequency limit imposed by the detector aperture and sampling pitch. These higher fre-quency signals can be aliased, causing an appearance of lower frequency grid lines and moiré pat-terns superimposed on the image, particularly in the slow-scan direction, as “anti-aliasing” signalprocessing filters cannot be applied. In general, therefore, grid lines should be oriented perpendi-cular to the scan direction to reduce aliasing. Some manufacturers are recommending high-fre-quency stationary grids, which are more expensive and difficult to use clinically. At higherfrequency, higher ratio grids are required to get equivalent scatter cleanup compared to lower fre-quency grids, which also have a higher bucky factor (dose penalty).71 However, in certain situa-tions, grid cutoff is more significant a problem than aliasing. For instance, in applications such asbedside radiography, grid cutoff (absorption of primary radiation) caused by tilted grids can beproblematic, particularly for cross-wise imaging of the chest, resulting in very poor image quality.Decubitus grids (grids with lead strips parallel to the short dimension of the grid) can be very use-ful in reducing grid cutoff for these cross-wise image acquisitions, as positioning of the cassetteand grid cap is less critical in the cranial-caudal direction in these situations. In addition, histogramanalysis can yield different results with and without grids. Specific menu selections (or processingalgorithms) must be considered for grid and non-grid exams to produce optimal results.
Display of a reduced size PSP image on a monitor that eliminates pixel data (e.g., elim-inating every other pixel and every other row, instead of downsize averaging) generates moiréartifacts of variable frequency with fixed grids. This is particularly noticeable on thumbnail orreduced size images used by the technologist. Only by displaying the full size image do themoiré artifacts disappear; therefore in these cases it is important to instruct the technologists ofthis possibility. Grid use in bedside radiography is a particular problem with length-wise chestimaging, where grid cutoff can easily occur when the grid is slightly tilted relative to the x-raybeam central axis. Linear grids oriented in the short axis direction are less vulnerable to the gridcutoff and should be considered for use.
AAPM REPORT NO. 93
37
7.4 Radiation ExposureCurrent PSP systems tend to require more radiation to produce images of equivalent qualitycompared to 400-speed rare-earth screen-film systems in common use today. PSP systems aremuch more tolerant of inappropriate technique than screen-film, and are capable of producinga diagnostic quality image under conditions of under- and over-exposure that would necessi-tate a repeated examination using screen-film. In other words, in the hands of an experienceduser, PSP imaging allows the choice of exposure. Tolerance of inappropriate exposure factorswith PSP radiography is a double-edged sword: under- and overexposures are not obvious fromthe appearance of the normalized PSP image. Instead of a light or dark film, reliance onderived indices of exposure based on the results of the normalization process is necessary tomonitor effective detector speed, and indirectly patient radiation exposure. These indices dif-fer among manufacturers and are greatly affected by readout and display processing charac-teristics of the PSP device. There should be a thorough understanding of the exposureindicators and how they relate to estimated (equivalent) detector speed and patient dose (sim-ilar to the way estimates for screen-film detectors are determined) as explained in sections 4.2and 4.3. From a radiation management prospective, it is critical to report the exposure indexwith the image in any clinical practice of PSP radiography. A method for periodic monitoringof the incident exposure indicator to identify undesirable trends of inappropriate technique(particularly the overexposures, which are more difficult to identify by visual inspection of theimage) is essential. The exposure index should be protected from alteration, and audit logs arehighly recommended. These capabilities may or may not be available on current systems,depending on the specific equipment and manufacturer, but are considerations for future pur-chase requirements.
7.5 Phototimer CalibrationIn most clinical situations, the primary method of exposure factor control is the phototimer,also known as the automatic exposure control (AEC). Traditionally, phototimers have beendesigned to provide constant optical densities for a variety of kV and attenuation combinations.This requires that the exposure to the image detector be controlled in a manner that is appro-priate for the energy response of the detector in use. It is important to recognize that theresponse of a PSP detector is different from most conventional screen-film detectors. When set-ting up a phototimer station for use with a PSP device, the goal should be to produce a constantpixel value for a variety of kV and attenuation combinations. This goal can be met by severalmethods. (1) If possible, disable the auto ranging during phototimer calibration. Under theseconditions, the PSP response (pixel value) can be related to the detector absorbed dose.Phototimer calibration can then proceed in a manner identical to screen-film systems usingpixel value (or hard-copy OD when using a laser printer) as the output variable to be adjusted.(2) Calibrate the exposure index response according to manufacturer recommendations (kVp,filtration, etc.). Use the exposure index value as the means to adjust the sensitivity of the pho-totimer through repeated exposures and measurements of the IPs until the desired exposureindex value is achieved.48 A calibration device introduced in 2004 to perform this type ofmeasurement electronically by emulating the characteristics of the PSP phosphor, monitoringthe PSL intensity, and providing an equivalent exposure index value is under study.72 (3) Patient(phantom) exit exposure can be used as the output variable to be controlled. Calibration of thesystem using an SNR criterion can be followed.73
ACCEPTANCE TESTING /QC OF PSP IMAGING SYSTEMS
38
7.6 PSP System Interfaces to PACSPSP systems are the foundation for digital projection imaging in the clinical environment.Interfacing a PSP system involves several components, in addition to the PSP reader:
(1) Image workstation and processing module contains interfaces to the RadiologyInformation System (the RIS is a database of patient and examination information,and also provides scheduling capabilities) and to the picture archiving and commu-nications system (the PACS is the repository and electronic distribution system forthe digital images generated by the PSP system). With current technology, the ded-icated workstation accepts images from the PSP reader using the vendor’s propri-etary formatting, applies appropriate image processing, and tags the images with thepatient demographic information and image formatting, size, and bit depth informa-tion among other descriptors.
(2) Modality work list interfaces to the RIS and PACS generate information for thetechnologist indicating the scheduled examination. These interfaces are often facili-tated by a PACS “broker,” a general-purpose product that interprets the HL72 com-munication data stream from the RIS and produces DICOM Modality Work List(MWL) communication at the ID terminal or workstation to directly input patientdemographics associated with the image and examination information. MWL allowsthe technologist to choose the patient to be imaged by name, accession number (anumber generated by the RIS that explicitly points to a specific examination), ormedical record number, among other indicators.
(3) The DICOM interface to the PACS provides the communications link between thePSP reader, the PSP workstation, the PACS database, and the PACS archive. Theinterface specifies the digital format of the image information, the unique studyinformation regarding the patient and examination criteria, instructions on commu-nication between the PSP workstation and the PACS archive, and other details thatare beyond the scope of this document. During initial installation it is imperativethat these interfaces be thoroughly checked against specifications and expectations(e.g., DICOM conformance statements) to ensure the functionality of the system ina PACS environment.
7.7 Technologist TrainingWhen PSP radiography is introduced into a conventional radiography operation, initial technol-ogist training is essential.74 The technologist must understand the importance of selecting theproper examination, must learn to recognize a new set of artifacts, and must have some ideahow to correct inferior images.75 Appropriate actions with PSP systems are often anti-intuitiveto technologists well versed in screen-film radiography. As personnel changes occur, provisionsfor repeated training should be made, because many personnel will come from a film-basedexperience.
7.8 Radiologist AcceptanceThere are several factors adversely affecting radiologist acceptance of PSP radiography relativeto screen-film imaging: (1) Until recently, radiologists were trained to discern clinical features on
AAPM REPORT NO. 93
39
film; (2) the American College of Radiology (ACR) teaching file is composed entirely of screen-film images; and (3) for American Board of Radiology (ABR) certification they must demon-strate proficiency at examining screen-film images. PSP images have a different appearance fromscreen-film; however, when optimally adjusted, PSP systems provide image quality similar tooptimal screen-film technology, and also give the ability to interface directly into a digital imagenetwork/PACS environment. To ensure optimal adjustments and image quality, acceptance test-ing and periodic quality control should be implemented.
8. ACCEPTANCE TESTING
Acceptance tests of the PSP system are a first and crucial step toward clinical implementation.Verification of proper function, adherence to functional specifications as published by the man-ufacturer, documentation of reports, demonstration of personnel training, and establishment of astandard for subsequent quality control tests compose the rationale for these procedures. Severalreferences regarding PSP system acceptance testing are available in the literature.56,76–83 The ref-erence by Samei et al.56 uses an early draft of this task group document and provides suggestedcriteria and tests for quantitative assessment of PSP systems. Also available are spreadsheetsauthored by Dr. Samei84 that can be used by the physicist to input data, to analyze results, and todefine acceptance criteria as suggested herein, or to define criteria that the physicist can deter-mine independently. Most of the tests described in this task group document are directly appli-cable to cassette-based, “point-scan” PSP systems. With technological advances, dual-sidereadout, “cassetteless” PSP systems, and “line-scan systems” are now in the clinical environ-ment. Adaptation to these systems is straightforward, with only minor changes required in thedescribed tests.
8.1 Preliminary Communication with Vendor Engineer/SpecialistPrior to initiating the acceptance test procedures, an outline of the specific tests to be accom-plished should be provided to the service engineer during installation. Perusal of applicationsmanuals and other documentation that provides information about the PSP system, instructionsfor use, and system specifications are extremely important. An itemized list of the components,peripherals, and options delivered with the system should be available. Communication with theservice engineer, applications personnel, and sales representative is extremely helpful in gettingknowledge about the system, its capabilities, and options.
8.2 Preparations and Initial Adjustments for Acceptance Test MeasurementsThere are a number of adjustments and calibrations that must occur on the PSP unit prior toacceptance tests and clinical service.77 These adjustments are typically vendor specific, andshould be accomplished in concert with the service engineer at the beginning of the acceptancetesting procedures. DICOM conformance statement agreements and MWL functionality(RIS/PACS broker interface via HL7 communication) should be verified for proper operation.PSP acceptance tests do not explicitly describe the tests for the hard-copy laser printer and soft-copy display components, which are also extremely important.
ACCEPTANCE TESTING /QC OF PSP IMAGING SYSTEMS

40
8.2.1 Customization of Alphanumeric Data Recording
Demographic information to be listed on each printed film or displayed image should bereviewed and checked for accuracy. Information includes, but is not limited to, hospitalname, machine identification, display processing parameters, exposure index information,date, and time.
8.2.2 Adjustment of the Hard-Copy Recording Device
In situations where primary diagnosis is performed with hard-copy laser films generated fromthe acquired digital data, the following steps must be checked to ensure proper operation.
(1) The film image is properly positioned on the film.
(2) Shading variations caused by non-uniformities in the laser-light intensity across thefilm are minimal.
(3) Processor chemistry is maintained at an optimal level.
(4) Internal laser calibration is within tolerance limits specified by the vendor.
There will typically be system-generated test scans available to assist in the verification ofthese parameters. In the absence of an appropriate internal test scan, a test pattern (such asTG18-QC70 or SMPTE*85) may be printed from a PACS workstation to verify printer calibra-tion stability.
8.2.3 Film Processor and Laser Printer Tests
A film processor audit requires the verification of proper chemistry activity, replenishment lev-els, developer temperature, and lack of processor-generated artifacts for wet-chemistry systems.The film processor should be evaluated according to the manufacturer’s quality assurance rec-ommendations as well as methods outlined in the literature.86–88 The film processor chemistryand the developer temperature influence the OD values of the printed films. It is advisable toindependently test processor performance with sensitometric strip methods on a daily toweekly basis, depending on system use. This will allow any potential problems with the filmprocessor to be uniquely identified and separated from those caused by the PSP system hard-ware misadjustment.
Dry-laser systems are rapidly supplanting wet-chemistry systems in the clinical environ-ment. These self-processing systems do not generate any chemical waste, as the film undergoesinternal “self-processing.”89 Stability of the dry laser systems and a lack of chemical waste dis-posal are distinct advantages over wet laser systems, even though the film costs may be some-what higher.90
8.2.4 Laser Printer Calibration and LUT Parameters
Laser printer calibration is typically performed with a built-in sensitometer to render a range ofOD steps that are measured with a calibrated densitometer. In some printers, the densitometer isalso part of the unit and allows automatic calibration adjustment. With acceptance testing, the
AAPM REPORT NO. 93
*Society of Motion Picture and Television Engineers.
41
laser printer should be tested in a “manual” mode using a calibrated densitometer with the laser-generated sensitometry strip and compared to the “automatic” methods. Should the values falloutside the recommended density ranges as specified by the manufacturer (typical values areDmin�0.03; low density of ~0.45�0.07; mid density of ~1.20�0.15; high density of ~2.20�0.15),a correction (calibration) algorithm should be invoked on the film laser printer (often under theguidance of the service engineer) and the test repeated. For a second failure, a request for repairshould be initiated prior to doing other acceptance tests. In certain situations, the laser printercan compensate for variations of film processor chemistry or malfunction that ultimately leadsto a catastrophic failure (particularly with wet-chemistry laser printers). It is important, there-fore, to determine the degree of compensation implemented by the laser subsystem when atall possible.
Ensuring consistent image appearance on the film image and on the image display worksta-tion has historically been a difficult process, requiring numerous printer LUTs resident on the laserprinter system that are designed for specific modalities, manufacturers, and image presentations, allof which must be specifically chosen on a case-by-case basis. The physicist must verify that theappropriate image presentation is obtained with a printer LUT that closely matches the appearanceof information content on a calibrated PSP workstation monitor (see section 8.2.5), which oftenrequires interaction with the printer manufacturer for selection and adjustment. In a PACS environ-ment, the best method of ensuring consistent image presentation is to calibrate all printers (and dis-play monitors) to the DICOM grayscale standard display function (GSDF),61,91 and directly usepresentation p-values to drive the printer and to render grayscale values in a consistent manner.
8.2.5 Image Workstation Display Monitor Calibration/Resolution Tests
In a soft-copy environment, display workstations are a critical link in the overall image qualityverification of a PSP system. A short list of items that should be evaluated initially and fre-quently via QC tests are:
• Adjustment of monitor performance by calibrating the monitor to the DICOMgrayscale standard display function (GSDF) and verifying performance by followingthe AAPM TG 18 document59,70
• Calibration of the display LUT and its conformance with DICOM PS3.1492
• Determination of high contrast spatial resolution, both centrally and peripherally
• Determination of geometric distortion, particularly in the periphery of the image
• Evaluation of luminance output with a luminance meter
• Evaluation of room lighting conditions with a luminance meter.
Hardware and software tools to perform these tests should be specified in the original purchaseagreement to be delivered with the system. This is an area critically important to image displayand evaluation of the PSP system. Specific recommendations for soft-copy display acceptancetesting and quality control are provided in AAPM task group 18 documentation.59,70
8.2.6 Evaluation of PSP System Interfaces: RIS and PACS
Prior to specific acceptance tests, the interfaces to the RIS for DICOM Modality Work List(MWL) and PACS for image storage and electronic distribution should be tested. Communication
ACCEPTANCE TESTING /QC OF PSP IMAGING SYSTEMS
42
with the installation engineer and/or applications specialist during installation and configurationof the system is the best way to verify the interfaces. Correct transfer of patient demographicinformation, date of birth, accession number, medical record number, examination type, referringphysician, site description, date, time, and other informational items must be verified in the meta-data contained in the DICOM header. Although the majority of manufacturers use the CR infor-mation object definition (IOD), it is superseded by the DICOM “DX” IOD, with a richerdescription of the image details and many more mandatory elements than the “CR” IOD.93 Imageinformation sent to the PACS should have appropriate image processing (e.g., “For Presentation”)or raw, non-processed “For Processing” image data), proper default window/level information andgrayscale rendition (e.g., “value of interest (VOI) LUT”), correct image size and orientation (assent from the local workstations), appropriate transfer speed, and other details as specified in thepurchase agreement. This involves cooperation with personnel who oversee other aspects of thePACS, including Information Systems and PACS managers as appropriate.
8.2.7 Characterization of the X-ray Beam
X-ray beam characterization and reproducibility is important for testing sensitivity, linearity, anduniformity of PSP system response. A beam produced by a high-frequency generator system ispreferred because of its excellent stability and accuracy. For general-purpose PSP systems, astandard 80-kVp beam should be used. Most manufacturers recommend the addition of 0.5 to1.0 mm Cu to the beam in order to simulate the removal of lower energy photons by the patientin the transmitted x-ray beam, and to make the beams from different x-ray systems more con-sistent. Consult the specific manufacturers’ recommendations for beam filtration; if a differentbeam filtration is used, ensure that the system initially meets the specifications of the manufac-turer in terms of calibration points before recalibrating the unit. (Note: AAPM TG 116 is rec-ommending the use of a sandwich filter of 1 mm Al, 1 mm Cu, 1 mm Al).51 An identical beam,or nearly identical beam, should be a part of all subsequent QC testing and performance moni-toring of the PSP system. Also, at the time of acceptance testing, identification of several imagedetectors to be set aside and safeguarded for the technologist’s and physicist’s sole use in QCtesting is highly recommended. For specialty PSP systems, more appropriate beams should becharacterized and used (e.g., 110 to 120 kVp for a dedicated chest PSP system, and 25 kVp fora dedicated mammography PSP system), with appropriate added filtration (at the discretion ofthe physicist).
Sensitivity and linearity tests should challenge PSP system response under conditionsrepresentative of the clinical environment. To assist reproducibility, a filter of 1 mm Cu � 1 mmAl is recommended for general diagnostic CR. The filter should be placed at the collimator withthe copper side facing the x-ray tube. Image uniformity tests may be conducted with or withoutthe filter.
8.3 Tools and Equipment Required for Acceptance EvaluationTable 1 lists the minimum requirements of tools and equipment for acceptance evaluation.
8.4 Specific Testing ProceduresRecommended acceptance tests are listed in Table 2.
AAPM REPORT NO. 93
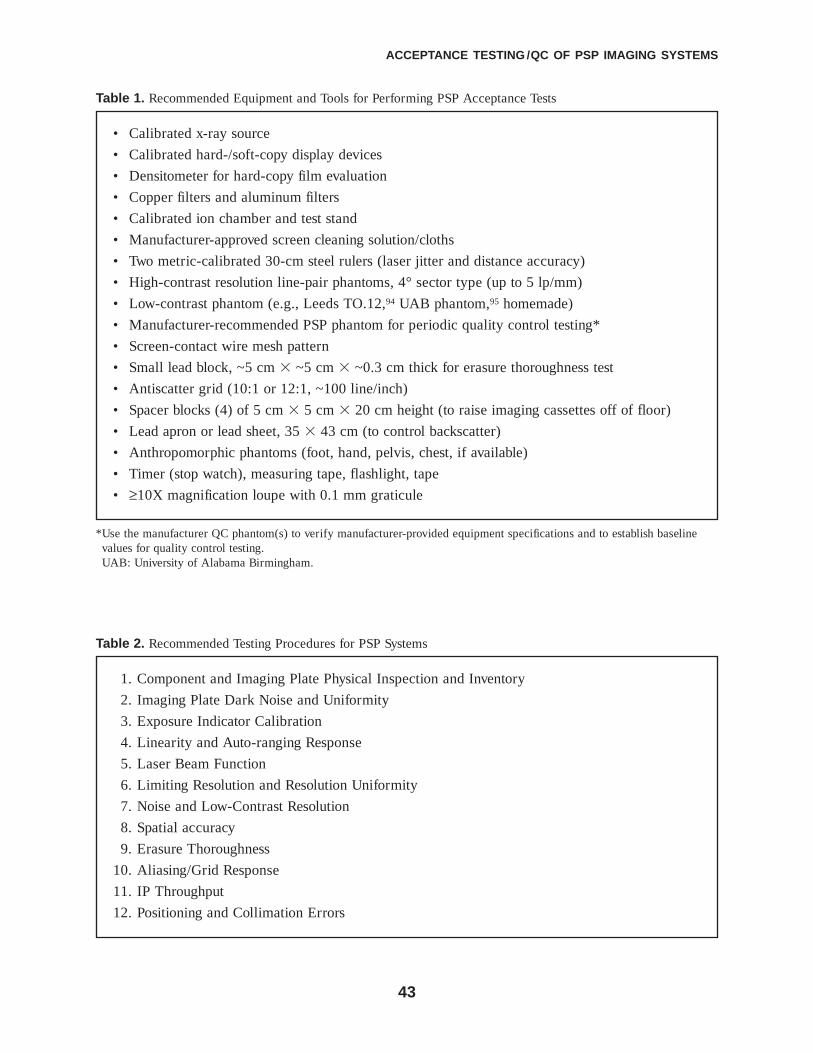
43
• Calibrated x-ray source
• Calibrated hard-/soft-copy display devices
• Densitometer for hard-copy film evaluation
• Copper filters and aluminum filters
• Calibrated ion chamber and test stand
• Manufacturer-approved screen cleaning solution/cloths
• Two metric-calibrated 30-cm steel rulers (laser jitter and distance accuracy)
• High-contrast resolution line-pair phantoms, 4° sector type (up to 5 lp/mm)
• Low-contrast phantom (e.g., Leeds TO.12,94 UAB phantom,95 homemade)
• Manufacturer-recommended PSP phantom for periodic quality control testing*
• Screen-contact wire mesh pattern
• Small lead block, ~5 cm � ~5 cm � ~0.3 cm thick for erasure thoroughness test
• Antiscatter grid (10:1 or 12:1, ~100 line/inch)
• Spacer blocks (4) of 5 cm � 5 cm � 20 cm height (to raise imaging cassettes off of floor)
• Lead apron or lead sheet, 35 � 43 cm (to control backscatter)
• Anthropomorphic phantoms (foot, hand, pelvis, chest, if available)
• Timer (stop watch), measuring tape, flashlight, tape
• ≥10X magnification loupe with 0.1 mm graticule
ACCEPTANCE TESTING /QC OF PSP IMAGING SYSTEMS
Table 1. Recommended Equipment and Tools for Performing PSP Acceptance Tests
1. Component and Imaging Plate Physical Inspection and Inventory
2. Imaging Plate Dark Noise and Uniformity
3. Exposure Indicator Calibration
4. Linearity and Auto-ranging Response
5. Laser Beam Function
6. Limiting Resolution and Resolution Uniformity
7. Noise and Low-Contrast Resolution
8. Spatial accuracy
9. Erasure Thoroughness
10. Aliasing/Grid Response
11. IP Throughput
12. Positioning and Collimation Errors
Table 2. Recommended Testing Procedures for PSP Systems
*Use the manufacturer QC phantom(s) to verify manufacturer-provided equipment specifications and to establish baselinevalues for quality control testing.
*UAB: University of Alabama Birmingham.

44
Many of these tests require x-ray exposure to the IP in a known and reproducible man-ner. A recommended setup is illustrated in Figure 21. A calibrated x-ray source with repro-ducible output should be employed and a source-image distance (SID) of at least 180 cm (tominimize beam divergence and heel effect variations) is desirable, with the central axis centeredto the IP. Recommended is the use of a lead attenuator (lead apron or lead sheet) to minimizebackscatter and spacers on which the IPs are above the floor at the 180-cm distance. X-ray tubecollimators should be adjusted with at least a 5-cm margin outside of the IP. Measurement of theoutput exposure is first determined along the central axis of the x-ray beam free-in-air, above theIP, at about 125-cm source-chamber distance (SCD), and corrected by inverse square falloff todetermine the incident exposure on the IP. Adjustment of the kVp and mA (with any additionaladded filtration, as required) to achieve a known exposure is then determined. Check initialreproducibility with five exposures; the coefficient of variation (COV) should be less than 0.05,otherwise use a more reproducible x-ray tube/generator. The chamber is moved to the peripheryof the field (in the beam but outside the central area of the IP), and five repeat exposures are madeto give an “off-axis ratio” measurement relative to the central position. Ensure the COV < 0.05,and use the ratio to correct for the exposures along the central axis. Measured exposure valuesat the periphery of the field are converted to incident exposure to the IP as:
Central IP exposure � measured peripheral exposure � (SID/SCD)2 � off-axis ratio.
AAPM REPORT NO. 93
Figure 21. Recommended acquisition geometry for exposing PSP IPs. See text for details on ion chamber position.The SCD of 127 cm is arbitrary (gives a reasonable distance from the focal spot and the detector) and results inan inverse square correction factor of 0.50.
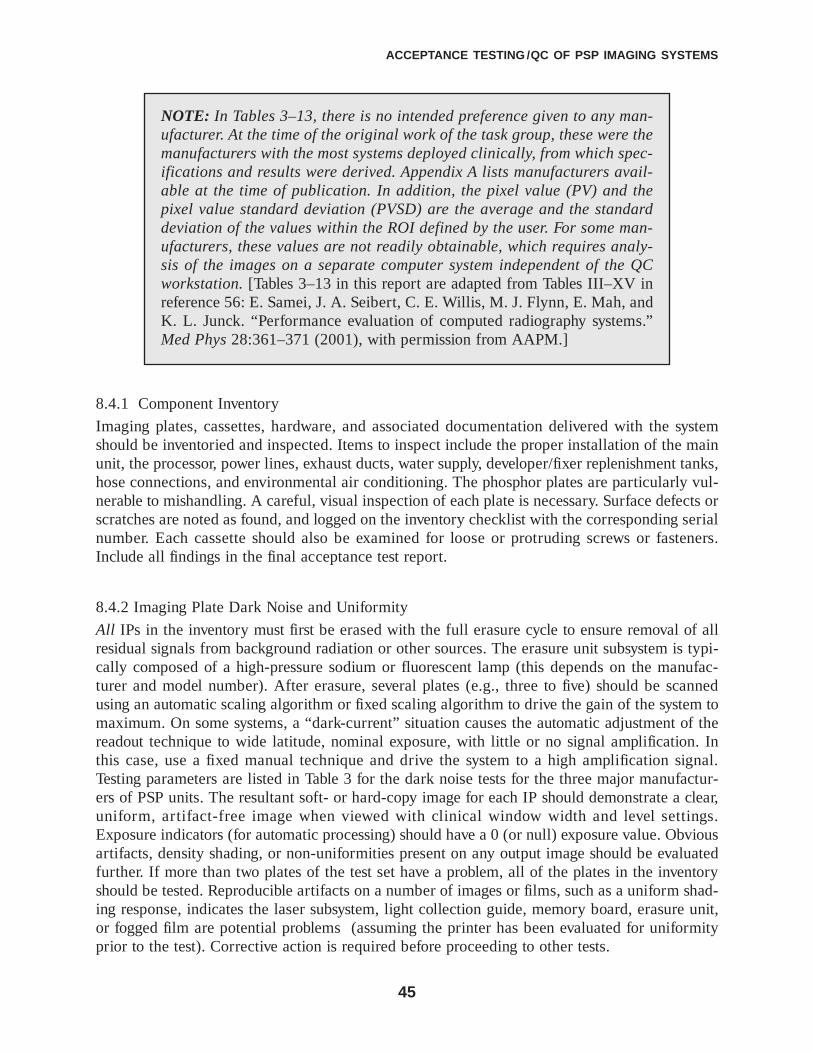
45
8.4.1 Component Inventory
Imaging plates, cassettes, hardware, and associated documentation delivered with the systemshould be inventoried and inspected. Items to inspect include the proper installation of the mainunit, the processor, power lines, exhaust ducts, water supply, developer/fixer replenishment tanks,hose connections, and environmental air conditioning. The phosphor plates are particularly vul-nerable to mishandling. A careful, visual inspection of each plate is necessary. Surface defects orscratches are noted as found, and logged on the inventory checklist with the corresponding serialnumber. Each cassette should also be examined for loose or protruding screws or fasteners.Include all findings in the final acceptance test report.
8.4.2 Imaging Plate Dark Noise and Uniformity
All IPs in the inventory must first be erased with the full erasure cycle to ensure removal of allresidual signals from background radiation or other sources. The erasure unit subsystem is typi-cally composed of a high-pressure sodium or fluorescent lamp (this depends on the manufac-turer and model number). After erasure, several plates (e.g., three to five) should be scannedusing an automatic scaling algorithm or fixed scaling algorithm to drive the gain of the system tomaximum. On some systems, a “dark-current” situation causes the automatic adjustment of thereadout technique to wide latitude, nominal exposure, with little or no signal amplification. Inthis case, use a fixed manual technique and drive the system to a high amplification signal.Testing parameters are listed in Table 3 for the dark noise tests for the three major manufactur-ers of PSP units. The resultant soft- or hard-copy image for each IP should demonstrate a clear,uniform, artifact-free image when viewed with clinical window width and level settings.Exposure indicators (for automatic processing) should have a 0 (or null) exposure value. Obviousartifacts, density shading, or non-uniformities present on any output image should be evaluatedfurther. If more than two plates of the test set have a problem, all of the plates in the inventoryshould be tested. Reproducible artifacts on a number of images or films, such as a uniform shad-ing response, indicates the laser subsystem, light collection guide, memory board, erasure unit,or fogged film are potential problems (assuming the printer has been evaluated for uniformityprior to the test). Corrective action is required before proceeding to other tests.
ACCEPTANCE TESTING /QC OF PSP IMAGING SYSTEMS
NOTE: In Tables 3–13, there is no intended preference given to any man-ufacturer. At the time of the original work of the task group, these were themanufacturers with the most systems deployed clinically, from which spec-ifications and results were derived. Appendix A lists manufacturers avail-able at the time of publication. In addition, the pixel value (PV) and thepixel value standard deviation (PVSD) are the average and the standarddeviation of the values within the ROI defined by the user. For some man-ufacturers, these values are not readily obtainable, which requires analy-sis of the images on a separate computer system independent of the QCworkstation. [Tables 3–13 in this report are adapted from Tables III–XV inreference 56: E. Samei, J. A. Seibert, C. E. Willis, M. J. Flynn, E. Mah, andK. L. Junck. “Performance evaluation of computed radiography systems.”Med Phys 28:361–371 (2001), with permission from AAPM.]

46
Image uniformity verifies appropriate response of the IPs to a high incident exposure(~10 mR, 80 kVp, 0.5 mm Cu and 1 mm Al, 180 cm SID) to reveal variations in x-ray response.Make certain that the high exposure does not saturate the ADC response (i.e., all pixels have themaximum value, for example, 4095). If so, repeat with an incrementally lower exposure until anappropriate image is obtained. Each cassette/phosphor plate in the inventory is centered to thex-ray beam and uniformly exposed. A reproducible geometry and plate orientation must bemaintained. If significant heel effect variation is present, two sequential half exposures with thecassette orientation rotated by 180° are necessary. This test is applied to all IPs in the inventory.Table 4 provides guidance for specific tests; consult the manufacturer for specific settings foracquisition and processing.
For film output (hard-copy), optical densities are measured in the center of each quadrantof the film and in the center position to determine absolute density and spatial uniformity.Central film density is acceptable if within �0.10 OD of the programmed OD value (usually1.20). Spatial uniformity is acceptable when all measured OD values are within ~10% of theaverage OD. For soft-copy evaluation of the images on a workstation, the average digital valueof each ROI should be within 10% of the global average. Standard deviation should also be sim-ilar in each of the five ROIs.
AAPM REPORT NO. 93
Agfa Fuji Kodak
Exposure No exposure to IP. Use freshly erased IPs.
Processing System diagnosis flat field, Test/sensitivity (L � 1), Pattern
speed class � 200 fixed EDR (S � 10,000)
Image post- None Linear Raw data, no processing Musica parameters � 0.0 (GA � 1.0, GT � A, edge enhance-
Sensitometry � linear RE � 0.0) ment settings,window � 512,level � exposure index
Measurements lgM, PV, PVSD, scan PV and PVSD Exposure Index average level (SAL) (EI), PV, PVSD
Qualitative Uniform image, no Uniform image, no Uniform image, criteria artifacts artifacts no artifacts, except
profile bands in IP direction
Quantitative lgM < 0.28 PV < 280 or PV > 744 EIGP < 80criteria SAL < 130 for inverse grayscale EIHR < 380ROI over PV < 350 PVSD < 4 PVGP < 8080% of image PVSD < 5 PVHR < 80
PVSD < 4
Note: PV � average pixel value; PVSD � average pixel value standard deviation within the defined region of interest; HR �High resolution IP, GP � general purpose IP for the Kodak PSP, EDR � exposure data recognizer. [Adapted from Table III inreference 56 with permission from AAPM.]
Table 3. Testing and Acceptance Criteria for Dark Noise Evaluation

47
For either hard-copy or soft-copy image evaluation, all images should be examined forbanding, black or white spots, and streaks. Scan line dropouts are detectable as lucent straightlines and represent dust/dirt particles on the pickup light guide, a fairly common artifact.“Unique” artifacts are usually traced to the IP in question, while artifacts appearing consistentlyon several or all images are likely due to the equipment (reader or writer components of the sys-tem). For artifacts identified to a specific IP, initiate plate cleaning followed by primary erasure,and then retest. If the problem(s) still exist(s), the IP should be removed from service. In thecase of a consistent variation in OD shading across the film, exposure of the same plate in 180°orientations will cancel any possible variations due to the x-ray tube heel effect. If the shadingvariation still persists after this action, the service engineer should implement a shading correc-tion calibration. The presence of image artifacts indicates suboptimal performance and necessi-tates corrective action by service personnel.
8.4.3 Exposure Indicator Calibration Accuracy
The exposure indicator is a method to determine a surrogate measure of the PSP detector equiv-alent radiographic speed for a given exposure. Incident exposure to the plate of ~1 mR is used toestablish “exposure index” accuracy. A time delay between the exposure and readout (e.g., 10
ACCEPTANCE TESTING /QC OF PSP IMAGING SYSTEMS
Agfa Fuji Kodak
Exposure Use 10 mR incident exposure at 80 kVp with 0.5 mm Cu and 1 mm Al filtration and180 cm SID.
Processing System diagnosis flat field, Test/sensitivity (L � 1), Patternspeed class � 200 Semi EDR
Image post- None Linear Raw data, no edgeprocessing Musica parameters � 0.0 (GA � 1.0, GT � A, enhancement settings,
Sensitometry � linear RE � 0.0) Window � 512, Level � exposureindex
Measurements PV and PVSD PV and PVSD PV and PVSD
Screen to Standard deviation of lgM Standard deviation/mean Standard deviation of screen (LMSD) and mean/standard sensitivity (SD/Ss) and Exposure Index variation deviation of PV among screens mean/standard deviation among screens
(PVs and PVSDs) of PV among screens (EISDs)(PVs and PVSDs)
Qualitative Uniform image without any visible artifacts with window/level adjustmentscriteria
Quantitative PVSD < 25 single screen PVSD < 20 single screen PVSD < 20 single criteria LMSDs < 0.02 SD/Ss < 5% screenROI over 80% PVSDs < 25 PVSDs < 20 EISDs < 20of image
[Adapted from Table IV in reference 56 with permission from AAPM.]
Table 4. Testing and Acceptance Criteria for IP Uniformity Response

48
minutes) is required by some manufacturers to reduce variation in phosphorescence lag, whileothers do not have such a requirement. The task group consensus recommends a 10-minutedelay. Additionally, there is no standardization of beam quality between manufacturers, as eachhas a specific kVp and tube filtration that are required for their system calibration (consult withthe specific manufacturer for recommendations). A standard x-ray beam filtration with 0.5 mmCu and 1 mm Al is recommended by the task group, as variations in exposure index are reducedwith a more filtered beam.82 More recently, AAPM TG 116 on standardization of dose index fordigital radiography (in progress, October 2005)50 has specified an attenuation filter of 1 mm Al,1 mm Cu, 1 mm Al in a sandwich configuration for pre-hardening the indecent beam used forExposure Index calibration. Ultimately (and hopefully within the next several years), establish-ment of a standardized method to estimate the incident exposure and system speed for a speci-fied beam quality will occur for all DR systems. Table 5 lists testing and acceptance criteria forexposure indicator accuracy.
AAPM REPORT NO. 93
Agfa Fuji Kodak
Exposure: 1 mR @ 75 kVp, 1 mR @ 80 kVp, 1 mR @ 80 kVp,Manufacturer 1.5 mm Cu filtration, no filtration, 0.5 mm Cu + specified no delay to readout 10 minutes to readout 1 mm Al, 15
minutes to readout
Processing System diagnosis flat field, Test/sensitivity (L � 1), Patternspeed class � 200 semi EDR
Image post- Noneprocessing Musica parameters � 0.0
Measurements lgM and lgM normalized to Sensitivity and sensitivity Exposure index 1 mR screen exposure normalized to 1 mR (EI) and exposure (lgM1 mR) using exposure to the screen index normalized lgM1 mR � lgM – log(exp), (S1 mR) using to 1 mR exposure SAL normalized to 1 mR S1 mR � Sexposure to the screen screen exposure (SAL1 mR) (EI1 mR) using as SAL1 mR � SAL/(exp)0.5 EI1 mR � EI –1000 �
log(exposure)
Qualitative Nonecriteria
Quantitative lgM1 mR 2.2 < �0.045, S1 mR 200 < �20, EI1 mR 2000 < �45, criteria single screen single screen single screen
lgM1 mR 2.2 < �0.023, S1 mR 200 < �10, EI1 mR 2000 < �23, all screens averaged all screens averaged all screens averagedSAL1 mR 1192 < �60, singleSAL1 mR 1192 < �30, all screens averaged
[Adapted from Table V in reference 56 with permission from AAPM.]
Table 5. Testing and Acceptance Criteria for Exposure Indicator Accuracy

49
8.4.4 System Linearity and Autoranging Response
This test determines the response of the detector and readout systems to at least three decades ofexposure variation (1000 times difference). A calibrated radiographic x-ray tube with repro-ducible output (kV accuracy better than �5% and exposure output accuracy �2%) and acqui-sition geometry/detector orientation must be maintained. Suggested techniques are 80 kVp, 180cm SID, and 0.5 mm Cu � 1 mm Al filtration, with the beam collimated just outside the totaldetector area. (The aluminum filter is placed towards the detector and eliminates any possiblecharacteristic radiation emanating from the copper.) Determine radiographic techniques to pro-vide incident exposures of approximately 0.1, 1.0, and 10 mR. On some PSP readers, a 10-mRexposure may saturate the ADC. If so, incrementally reduce this exposure until a nonsaturatedresult is achieved. Actual incident exposure should be measured with a calibrated ionizationchamber free-in-air (no backscatter) and calculated to the surface of the PSP detector. For eachincident exposure, acquire three independent images, and use a fixed delay time of 10 minutesbetween exposure and processing.
Table 6 lists the processing, measurements, and evaluation criteria. If using hard-copyfilm as the output, the relationship between pixel value and OD should be established beforehandusing an electronic test pattern, and then should be incorporated as a transformation in the quan-titative analysis of the results. Because the beam filtration does not conform to the Agfa and Fujirecommendations, the lgM and S numbers might not give the exact calibrated exposure indica-tor response expected. An option is to use the manufacturer’s recommended filtration, as this isa relative test. In some cases without filtration, however, it is difficult to achieve low incidentexposures (e.g., 0.1 mR) at the specified geometry. Repeat the process a total of three times (atotal of nine images), being careful to use the same PSP detector for a specific incident exposuremeasurement. Calculated exposure values should be within �20% of the actual incident expo-sure for any single detector and within �10% for the average. Qualitative image noise charac-teristics in the resultant film images should be inversely related to incident exposure. ResultantOD of each film should be within �0.1 OD of the programmed value. Quantitative evaluation ofthe image properties on a computer workstation should verify a consistent average digital num-ber independent of exposure, and a decrease in relative noise (increase in signal to noise) withincreased exposure. The quantum-limited operation range is determined by plotting the standarddeviation of the noise relative to the log incident exposure and determining the linear fit of theline with a slope of 0.5. Deviations from a straight-line response and a slope not equal to 0.5indicate other noise sources that are interfering with the quantum-limited operation of the PSPsystem.
8.4.5 Laser Beam Function
Laser beam scan line integrity, beam jitter, signal dropout, and focus are evaluated in this test.Use a radiographic technique of ~60 kVp, 180 cm SID, and mAs to deliver an incident exposureof ~5 mR. Place the steel ruler on a 35 � 43 cm (14 � 17 in.) centered on the cassette andnearly perpendicular to, approximately 5° from the laser beam scan lines. Table 7 summarizesthe exposure conditions, IP processing/post processing details, and the qualitative/quantitativecriteria to determine adequate system function.
Laser beam jitter (inconsistent gray-level output caused by timing errors with the loca-tion of the beam or synchronization with the ADC) is evaluated by examining the edge of theruler on the image. Ruler edges should be straight and continuous over the full length of thehard-copy or soft-copy image. Scan lines in light to dark transitions along the ruler edge that do
ACCEPTANCE TESTING /QC OF PSP IMAGING SYSTEMS

50
AAPM REPORT NO. 93
Agfa Fuji Kodak
Exposure Use approximate 0.1, 1.0, and 10 mR incident exposures at 80 kVp with 0.5 mm condition Cu and 1 mm Al filtration (or the manufacturer’s recommended filtration for
exposure index value calibration) and 180 cm SID. Use a consistent delay timebetween exposure and readout.
IP processing System diagnosis flat field, Test/avg 4.0; Semi EDR Patternspeed class � 200 & Fix EDR � 200;
repeat using test/contrast with same EDR parameters
Image post- None Linear Raw data and no edge processing Musica parameters � 0.0 GA � 1.0, GT � A, enhancement settings
RE � 0.0
Measurements lgM, avg pixel value (PV), For semi EDR, Exposure index (EI) and scan avg level (SAL) over correlation coefficient and avg pixel value 80% of image area. (CC) of a linear fit to (PV) within 80% of Slopes and correlation log(S) vs. log (E) plot. the image area.coefficients (CCs) of linear For fixed EDR, avg pixel Slope and correlation fits to log(SAL) vs. log(E), value (PV) within 80% coefficient (CC) of a PV vs. log(E), and lgM vs. of the image area, slope linear fit to EI vs. log(E). and correlation coefficient log(E) and PV vs.
(CC) of a linear fit to log(E) plots.PV vs. log(E).
Qualitative SAL vs. exposure on a For semi EDR, slope The plot of EI and criteria linear-log plot should result and correlation, sensitivity PV vs. exposure on a
in a straight line. vs. exposure on a log-log linear-log scale should plot should result in a result in straight lines.straight line.For fixed EDR, to PV vs. exposure on a linear-log plot should result in a straight line.
Quantitative SlopelgM – 1 < �0.1 SlopeS + 1 < �0.1 SlopeEI/1000 – 1 criteria SlopeSAL/0.5 – 0.1 < �0.1 SlopePV/256 – 1 < �0.1 < �0.1
SlopePV/1250 – 0.1 < �0.1 (Avg 4)a SlopePV/1000 – 1 CCs > 0.95 SlopePV/511 – 1 < �0.1 < �0.1
(Con)a CCs > 0.95CCs > 0.95
a In some Fuji systems, an inverse relationship exists between PV and log(E), and the polarity of the equation should bereversed.
[Adapted from Table VI in reference 56 with permission from AAPM.]
Table 6. Testing and Acceptance Criteria for Linearity and Autoranging Response

51
not form the linear ruler edge indicate a timing error, or laser beam modulation problem. Viewthe image scan lines with a 5� (or greater magnification) in various areas across the image tocheck for uniform spacing.
8.4.6 Limiting Resolution and Resolution Uniformity
Spatial resolution tests include measurement of the central and peripheral limiting resolution foreach IP size and type (standard and high resolution) along the scan and sub-scan directions.Place three line pair patterns (or as available) on the IP, two along the scan and sub-scan direc-tions, and a third at 45°. Expose each to ~5 mR using 60 kVp and unfiltered beam at 180-cmSID. To determine consistency of the resolution response across the IP, use a fine wire mesh pat-tern (e.g., mammography screen-film contact tool). Table 8 summarizes the exposure conditions,processing, and evaluation of the results.
Use a readout/processing algorithm to enhance radiographic contrast without significantedge enhancement. For a soft-copy display device, zoom the digital image to the intrinsic reso-lution limit, and adjust window/level for best visualization of the object. Both central andperipheral resolution should indicate a response close to the maximum resolution specified forthe individual combination of reading sampling rate and phosphor type. Often, the resolution inthe scan direction will be less than the resolution in the sub-scan direction due to the PSP lagresponse and/or the implementation of an anti-aliasing filter algorithm, which results in blurringof the signals. If the spatial resolution is not within 10% of that indicated in the manufacturer’sspecifications for either the vertical or horizontal directions, corrective action should be initiated.Measured resolution can exceed the theoretical sampled resolution limit if the test pattern is
ACCEPTANCE TESTING /QC OF PSP IMAGING SYSTEMS
Agfa Fuji Kodak
Exposure Place a steel ruler perpendicular to the laser scan direction. Use 5 mR incident condition exposure at 60 kVp with no added filtration.
IP processing System diagnosis flat field, Test/sensitivity Patternspeed class � 200 Semi EDR
Image post- None Linear Raw data and no edge processing Musica parameters � 0.0 GA � 1.0, GT � A, enhancement settings
Sensitometry � linear RE � 0.0 Window � 512Level � exposure index
Measurements Examine edges of ruler on soft-copy display using 5 to 10� magnification; if on film,use 10� magnification loupe; if any jitter present, obtain jitter dimension with work-station measurement or ROI tool.
Qualitative Ruler edges should be straight and continuous without under- or overshoot of scan criteria lines in light to dark transitions.
Quantitative There should not be more than occasional �1 pixel jitters over the ruler edges.criteria
[Adapted from Table VII in reference 56 with permission from AAPM.]
Table 7. Testing and Acceptance Criteria for Laser Beam Function

52
positioned at a diagonal to the x-y matrix. In this case, the “effective” sampling (pixel) pitch ofthe resolution pattern is smaller by the sine of the angle (e.g., 0.707 for 45° angle), thus exceed-ing the actual limiting vertical or horizontal resolution. These tests are subjective and prone toerror, but are usually sufficient for verification of appropriate spatial resolution response. Notethat a potential problem with the use of a bar phantom is the possibility that the high-frequencybars will be represented at a lower frequency due to aliasing. The observer may believe that thebars are seen correctly, when in fact they are not, which can lead to an erroneous estimate oflimiting resolution. A more comprehensive and quantitative evaluation of a PSP system isachieved by measuring the modulation transfer function (MTF).96 Many manufacturers areimplementing MTF measurements in their periodic QC packages (software and hardware).97
8.4.7 Noise and Low-Contrast Resolution
Contrast resolution should be limited by quantum statistics (random variations in the number ofx-rays absorbed in the IP) in a well-designed system. A specific low-contrast phantom (or adesign) was not determined by the task group, but a calibrated low-contrast test object such asthe Leeds phantom designed for computed radiography83,94 or the UAB low-contrast phantom95
are appropriate for use, as are others. For the Leeds phantom setup, 75 kVp with 1 mm addedCu filtration is used with a standard clinical acquisition protocol (e.g., contact imaging with agrid; PSP cassette placed in a table bucky, etc.). In Table 9, acquisition procedures for the LeedsTO.12 is listed. Three individual images are acquired with incident exposures to the imagingplate of ~0.5 mR, ~1.0 mR, and ~5 mR.
AAPM REPORT NO. 93
Agfa Fuji Kodak
Exposure Use a 5 mR incident exposure with an unfiltered 60 kVp beam at 180 cm SID. High condition contrast resolution test patterns measure central resolution of the IP. The mesh
pattern measures resolution uniformity across the IP.
IP processing System diagnosis flat field, Test/sensitivity Patternspeed class � 200 Semi EDR
Image post- None Linear Raw data and no edge processing Musica parameters � 0.0 GA � 1.0, GT � A, enhancement settings
Sensitometry � linear RE � 0.0 Window � 512Level � exposure index
Measurements Maximum spatial resolutions perceived in each direction (Rhor, Rver, R45°) using ~10�magnified view of images with narrow window. On film, verification with 10� loupe.
Qualitative Wire mesh image should be uniform and free of any blurring across the image.criteria
Quantitative Rhor / fNyquist > 0.9criteria Rver / fNyquist > 0.9
R45° / (1.41 fNyquist) > 0.9
[Adapted from Table VIII in reference 56 with permission from AAPM.]
Table 8. Testing and Acceptance Criteria for Resolution and Resolution Uniformity
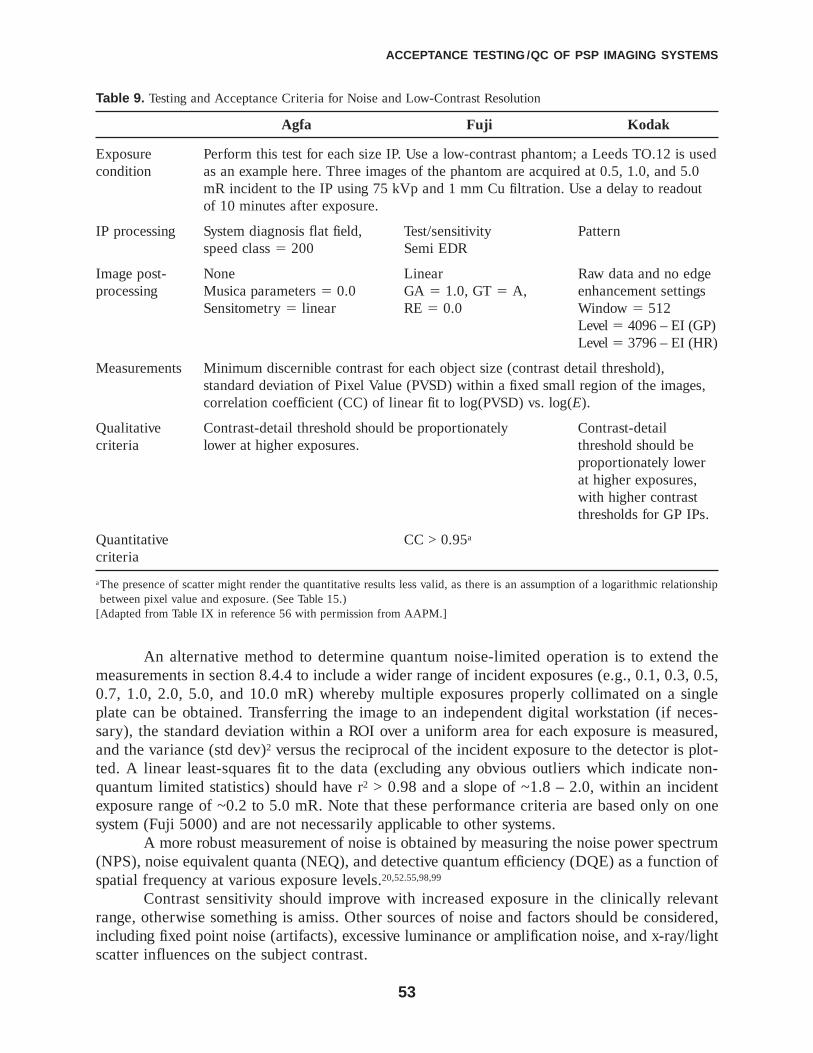
53
An alternative method to determine quantum noise-limited operation is to extend themeasurements in section 8.4.4 to include a wider range of incident exposures (e.g., 0.1, 0.3, 0.5,0.7, 1.0, 2.0, 5.0, and 10.0 mR) whereby multiple exposures properly collimated on a singleplate can be obtained. Transferring the image to an independent digital workstation (if neces-sary), the standard deviation within a ROI over a uniform area for each exposure is measured,and the variance (std dev)2 versus the reciprocal of the incident exposure to the detector is plot-ted. A linear least-squares fit to the data (excluding any obvious outliers which indicate non-quantum limited statistics) should have r2 > 0.98 and a slope of ~1.8 – 2.0, within an incidentexposure range of ~0.2 to 5.0 mR. Note that these performance criteria are based only on onesystem (Fuji 5000) and are not necessarily applicable to other systems.
A more robust measurement of noise is obtained by measuring the noise power spectrum(NPS), noise equivalent quanta (NEQ), and detective quantum efficiency (DQE) as a function ofspatial frequency at various exposure levels.20,52.55,98,99
Contrast sensitivity should improve with increased exposure in the clinically relevantrange, otherwise something is amiss. Other sources of noise and factors should be considered,including fixed point noise (artifacts), excessive luminance or amplification noise, and x-ray/lightscatter influences on the subject contrast.
ACCEPTANCE TESTING /QC OF PSP IMAGING SYSTEMS
Agfa Fuji Kodak
Exposure Perform this test for each size IP. Use a low-contrast phantom; a Leeds TO.12 is used condition as an example here. Three images of the phantom are acquired at 0.5, 1.0, and 5.0
mR incident to the IP using 75 kVp and 1 mm Cu filtration. Use a delay to readoutof 10 minutes after exposure.
IP processing System diagnosis flat field, Test/sensitivity Patternspeed class � 200 Semi EDR
Image post- None Linear Raw data and no edge processing Musica parameters � 0.0 GA � 1.0, GT � A, enhancement settings
Sensitometry � linear RE � 0.0 Window � 512Level � 4096 – EI (GP)Level � 3796 – EI (HR)
Measurements Minimum discernible contrast for each object size (contrast detail threshold), standard deviation of Pixel Value (PVSD) within a fixed small region of the images,correlation coefficient (CC) of linear fit to log(PVSD) vs. log(E).
Qualitative Contrast-detail threshold should be proportionately Contrast-detail criteria lower at higher exposures. threshold should be
proportionately lowerat higher exposures,with higher contrastthresholds for GP IPs.
Quantitative CC > 0.95a
criteria
aThe presence of scatter might render the quantitative results less valid, as there is an assumption of a logarithmic relationshipbetween pixel value and exposure. (See Table 15.)
[Adapted from Table IX in reference 56 with permission from AAPM.]
Table 9. Testing and Acceptance Criteria for Noise and Low-Contrast Resolution
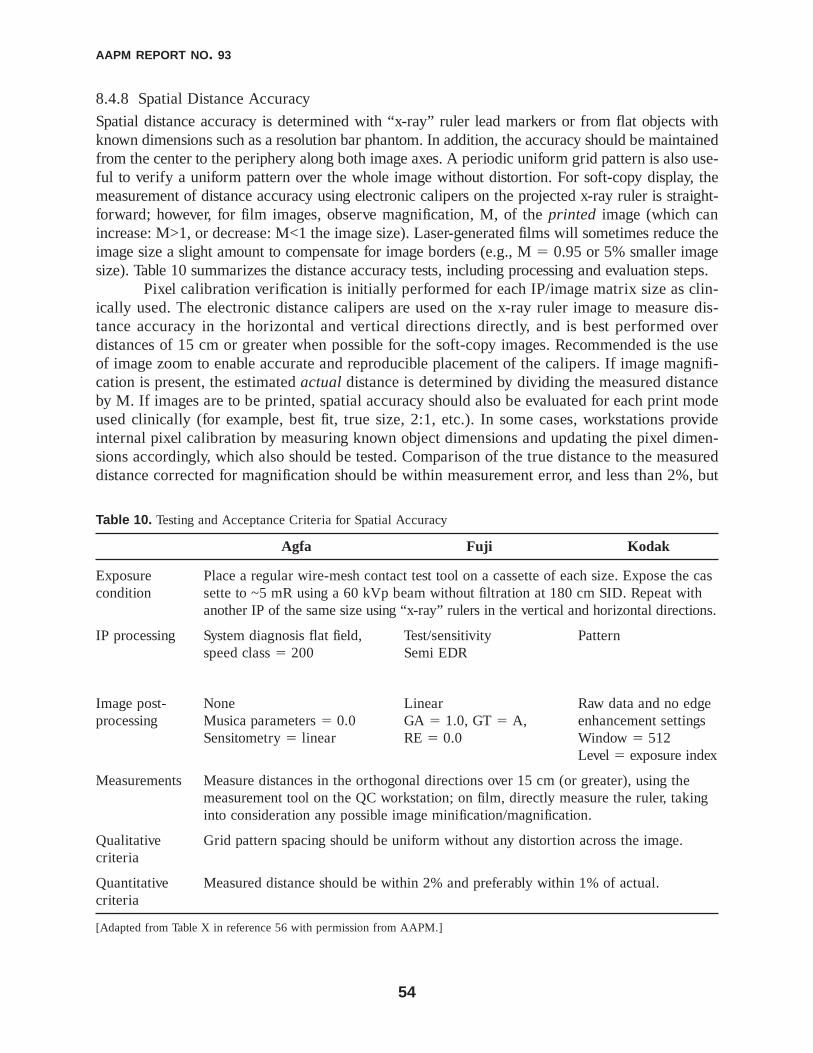
54
8.4.8 Spatial Distance Accuracy
Spatial distance accuracy is determined with “x-ray” ruler lead markers or from flat objects withknown dimensions such as a resolution bar phantom. In addition, the accuracy should be maintainedfrom the center to the periphery along both image axes. A periodic uniform grid pattern is also use-ful to verify a uniform pattern over the whole image without distortion. For soft-copy display, themeasurement of distance accuracy using electronic calipers on the projected x-ray ruler is straight-forward; however, for film images, observe magnification, M, of the printed image (which canincrease: M>1, or decrease: M<1 the image size). Laser-generated films will sometimes reduce theimage size a slight amount to compensate for image borders (e.g., M � 0.95 or 5% smaller imagesize). Table 10 summarizes the distance accuracy tests, including processing and evaluation steps.
Pixel calibration verification is initially performed for each IP/image matrix size as clin-ically used. The electronic distance calipers are used on the x-ray ruler image to measure dis-tance accuracy in the horizontal and vertical directions directly, and is best performed overdistances of 15 cm or greater when possible for the soft-copy images. Recommended is the useof image zoom to enable accurate and reproducible placement of the calipers. If image magnifi-cation is present, the estimated actual distance is determined by dividing the measured distanceby M. If images are to be printed, spatial accuracy should also be evaluated for each print modeused clinically (for example, best fit, true size, 2:1, etc.). In some cases, workstations provideinternal pixel calibration by measuring known object dimensions and updating the pixel dimen-sions accordingly, which also should be tested. Comparison of the true distance to the measureddistance corrected for magnification should be within measurement error, and less than 2%, but
AAPM REPORT NO. 93
Agfa Fuji Kodak
Exposure Place a regular wire-mesh contact test tool on a cassette of each size. Expose the cascondition sette to ~5 mR using a 60 kVp beam without filtration at 180 cm SID. Repeat with
another IP of the same size using “x-ray” rulers in the vertical and horizontal directions.
IP processing System diagnosis flat field, Test/sensitivity Patternspeed class � 200 Semi EDR
Image post- None Linear Raw data and no edge processing Musica parameters � 0.0 GA � 1.0, GT � A, enhancement settings
Sensitometry � linear RE � 0.0 Window � 512Level � exposure index
Measurements Measure distances in the orthogonal directions over 15 cm (or greater), using themeasurement tool on the QC workstation; on film, directly measure the ruler, takinginto consideration any possible image minification/magnification.
Qualitative Grid pattern spacing should be uniform without any distortion across the image.criteria
Quantitative Measured distance should be within 2% and preferably within 1% of actual.criteria
[Adapted from Table X in reference 56 with permission from AAPM.]
Table 10. Testing and Acceptance Criteria for Spatial Accuracy

55
preferably less than 1% in both directions. Where possible, the use of a larger distance (e.g.,25 to 30 cm) reduces the percentage of the measurement errors. For a global assessment of dis-tance accuracy, qualitatively (or quantitatively) examine the grid image and verify uniform gridpattern spacing without distortion.
8.4.9 Erasure Thoroughness
The ability to reuse the IP without residual signals from previous overexposures is important,and the erasure test evaluates the ability of the read/erase cycle to remove ghosting artifactsunder severe exposure conditions as described in Table 11. If improperly or insufficiently erased,image artifacts superimposed on subsequent images can mimic disease processes. In the case of
ACCEPTANCE TESTING /QC OF PSP IMAGING SYSTEMS
Agfa Fuji Kodak
Exposure Place a lead block at the center of a 35�43 cm cassette and fully expose to ~50 mR condition with a 60 kVp beam (no added filtration) at 180 cm SID. Process the IP, and expose
a second time to 1 mR without the lead object and the collimator positioned in 5 cmon each side of the IP. Process the IP, and then reprocess one more time using “darknoise” settings for the quantitative test. Three images total are used in this test.
IP processing System diagnosis flat field, Test/sensitivity Patternspeed class � 200 Semi EDR, first 2 images;
for 3rd processing, use test/sensitivity (L � 1), fixed EDR (S � 10,000)
Image post- None Linear Raw data and no edge processing Musica parameters � 0.0 GA � 1.0, GT � A, enhancement settings,
Sensitometry � linear RE � 0.0 Level � EI,Window setting default or Window setting default Window setting equivalent to 1 log(E) unit or equivalent to 1 log(E) defaultor equivalent
unit to 1 log(E) unit
Measurements lgM, avg pixel value (PV), Avg pixel value (PV) and Exposure index (EI), and standard deviation (PVSD) standard deviation (PVSD) avg pixel value (PV), and scan average level (SAL) within 80% of the 3rd and its standard within 80% of the 3rd image image area. deviation within 80% area. of the 3rd image area.
Qualitative Absence of a ghost image of the lead block in the 2nd imagea.criteria
Quantitative lgM � 0.28 PV < 280b EIGP < 80,criteria SAL < 130 PVSD < 4 EIHR < 380(determined PV < 630 PVGP < 80,from analysis PVSD < 5 PVHR < 80of 3rd image) PVSD < 4
aIn some systems the erasure time is configurable (e.g., Agfa).bFor an inverse relationship between PV and log(E), PV should be greater than 744.[Adapted from Table XI in reference 56 with permission from AAPM.]
Table 11. Testing and Acceptance Criteria for Erasure Thoroughness

56
severe overexposure, an IP could possibly require several primary “erasures” and a rest intervalto totally remove the residual signals.
This test is performed with high overexposure (open field) and underexposure (under alead block) exposing an IP to an incident exposure of ~50 mR. After processing and cycling theIP, a second, clinically relevant incident exposure of ~1 mR is acquired without the lead blockand with the collimator field positioned inward 5 cm on each side. The second exposed IP isprocessed using the normal processing cycle, followed by direct reinsertion into the reader andprocessing with the “dark noise” settings, for a total of three output images. Absence of a ghostimage of the lead block object in the second image demonstrates acceptable erasure thorough-ness. The third image should not contain digital image values above that specified in Table 11.
8.4.10 Aliasing/Grid Response
Moiré patterns are aliased signals that manifest as lower frequency “beat” patterns superim-posed on the image, and are most often caused by the projection of the bar patterns of an anti-scatter grid. They are caused by high-frequency repeating patterns insufficiently sampled duringthe digitization process, occurring during the acquisition or during image manipulation and/orsub-sampling of the digital image matrix to fully fit the larger image matrix on a display thatsupports only a smaller matrix size. Stationary, low-frequency grids can readily produce analiased pattern when the grid strips are aligned parallel to the scan or the plate translation direc-tion; in fact, patterns are less readily manifested in the scan direction because of the applicationof “anti-aliasing” frequency filters applied to the scan line information. Aliasing artifacts causedby display sub-sampling can be distinguished by their changing appearance as the image size onthe display changes. This is a consequence of inappropriate downsizing (instead of pixel averag-ing), where the high-frequency signals are maintained and aliased on the display.
The aliasing test should be performed for each type and size of IP in common use. Table 12lists the exposure conditions for this test. Comparing the response with and without a grid allowsthe determination of potential grid problems. Moiré patterns should not be visible with grid linesperpendicular to scan direction (the preferred orientation of the grid), while grids of relativelylow frequency (<50 lines/cm) will likely produce an aliasing pattern in the direction parallel tothe scan direction. For moving grids, moiré patterns should not be visible in either direction.High-frequency stationary grids (e.g., >70 lines/cm) should have minimal aliasing (except per-haps for high-resolution systems dedicated to mammography applications).
8.4.11 IP Throughput
A feature that is particularly relevant to PSP system cost is the speed of IP processing andthroughput. High-speed systems have external stackers or auto-load capabilities that allow thetechnologist to insert multiple cassettes and allow the system to scan and process the IPs auto-matically. This has an advantage in workflow as well as “pipelining” that allows the reader toextract the latent image and erase a previously scanned IP at the same time.
This test can be accomplished in conjunction with section 8.4.3. Table 13 describes themethodology and acceptable results based upon evaluation of a small number of cassettes andtime needed to read and display the output image. The use of four cassettes slightly underesti-mates the IP throughput of the system in “stacker” readers because the first IP does not achievethe pipelining benefit of subsequent IPs. Pipelined processing realizes an increased throughputfor several screens in the stacker, so the time for one processed image (display and film output)
AAPM REPORT NO. 93
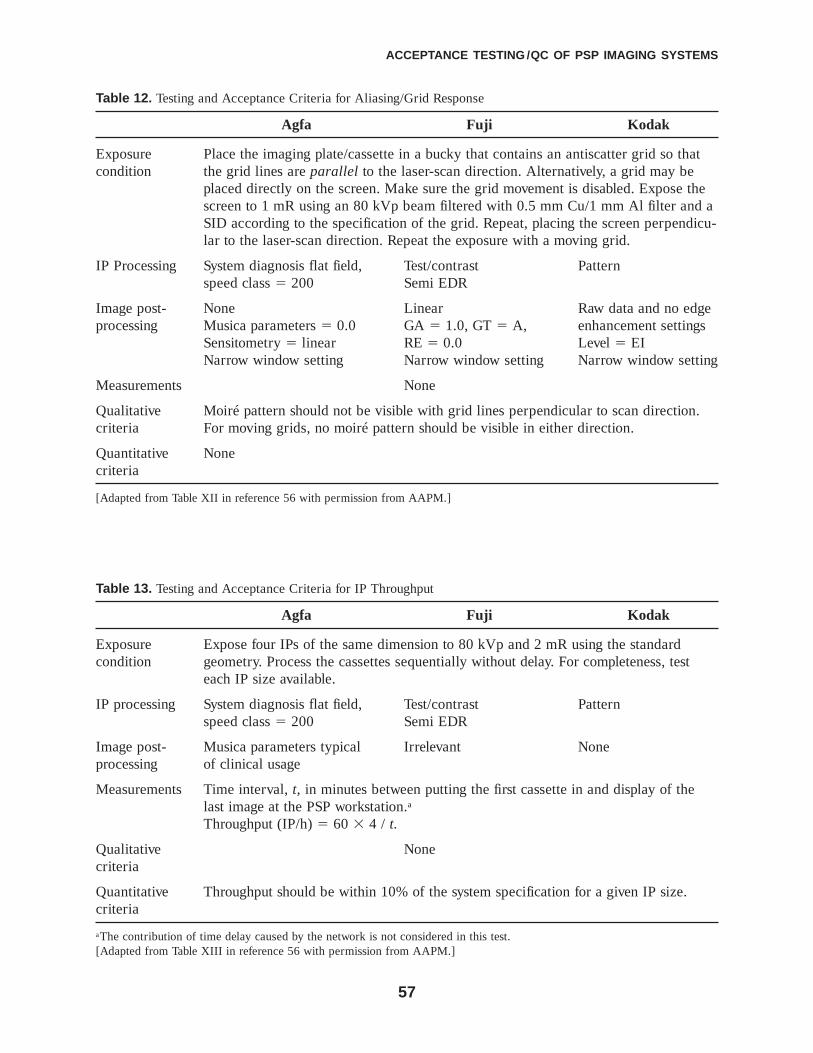
57
ACCEPTANCE TESTING /QC OF PSP IMAGING SYSTEMS
Agfa Fuji Kodak
Exposure Place the imaging plate/cassette in a bucky that contains an antiscatter grid so that condition the grid lines are parallel to the laser-scan direction. Alternatively, a grid may be
placed directly on the screen. Make sure the grid movement is disabled. Expose thescreen to 1 mR using an 80 kVp beam filtered with 0.5 mm Cu/1 mm Al filter and aSID according to the specification of the grid. Repeat, placing the screen perpendicu-lar to the laser-scan direction. Repeat the exposure with a moving grid.
IP Processing System diagnosis flat field, Test/contrast Patternspeed class � 200 Semi EDR
Image post- None Linear Raw data and no edge processing Musica parameters � 0.0 GA � 1.0, GT � A, enhancement settings
Sensitometry � linear RE � 0.0 Level � EINarrow window setting Narrow window setting Narrow window setting
Measurements None
Qualitative Moiré pattern should not be visible with grid lines perpendicular to scan direction. criteria For moving grids, no moiré pattern should be visible in either direction.
Quantitative Nonecriteria
[Adapted from Table XII in reference 56 with permission from AAPM.]
Table 12. Testing and Acceptance Criteria for Aliasing/Grid Response
Agfa Fuji Kodak
Exposure Expose four IPs of the same dimension to 80 kVp and 2 mR using the standard condition geometry. Process the cassettes sequentially without delay. For completeness, test
each IP size available.
IP processing System diagnosis flat field, Test/contrast Patternspeed class � 200 Semi EDR
Image post- Musica parameters typical Irrelevant Noneprocessing of clinical usage
Measurements Time interval, t, in minutes between putting the first cassette in and display of thelast image at the PSP workstation.a
Throughput (IP/h) � 60 � 4 / t.
Qualitative Nonecriteria
Quantitative Throughput should be within 10% of the system specification for a given IP size.criteria
aThe contribution of time delay caused by the network is not considered in this test.[Adapted from Table XIII in reference 56 with permission from AAPM.]
Table 13. Testing and Acceptance Criteria for IP Throughput

58
will be longer than the average time for a series of screens. Throughput should be within 10%of the published specifications (unless other exceptions are made in the purchase agreement). Ifthe test does not achieve the claimed throughput, a repeat of the procedure with 10 IPs willintroduce minor error. In a clinical situation, the maximum throughput might not be achievedbecause of excessively overexposed plates (e.g., uncollimated regions in a high-exposure exam)in which the erasure stage of the PSP process can be the limiting step. This is particularly truefor sequential, single slot PSP readers.
8.4.12 Acceptance Criteria and Quantitative Relationships
Table 14 describes unified acceptance criteria by expressing signal levels and standard deviationsin terms of corresponding exposure levels.56 Table 15 describes the relationship between incidentexposure, the corresponding pixel value under specific processing conditions, and the incidentexposure to exposure index value.
8.4.13 Image Processing: LUT Transforms and Frequency Enhancement
The intent is to verify the proper function of the algorithms provided by the manufacturersregarding specific image processing and user selected adjustments for clinical applications forcontrast and frequency enhancement. Images of the low-contrast phantom, an aluminum stepwedge, and high-resolution test phantom can demonstrate the effects of the image processingparameters and their impact on image quality as a first-pass test; however, there is no substitutefor manipulation of clinical images.
Review of clinical images and collaboration with the radiologists to adjust image pro-cessing parameters to their liking is important. Vendor PSP imaging specialists should be avail-able after completion of the equipment installation to assist in the optimization of examalgorithms on a case-by-case basis, and to train technologists, physicists, and radiologists in theoperation of the PSP system, including minor image processing algorithm adjustments by thephysicist and/or interested QC technologist. Default processing variables/parameters should beverified with published standard values for all examination codes. Unique situations requiringspecific settings such as a grid versus no grid examination should be undertaken as well.
9. ARTIFACTS
9.1 Image ArtifactsArtifacts on images can originate from the hardware (e.g., x-ray system, grid, PSP reader, PSPdetector), software (e.g., glitches, algorithms), or the object (e.g., positioning, motion, etc.).99–103
Hardware artifacts arise from the image plate, the image reader, the hard-copy printer, or theprocessor. Most common are IP defects that are temporary and are likely due to dust, dirt, orphantom (non-erased) images. These artifacts can be easily corrected by screen cleaning and/orplate erasure. Permanent IP artifacts can be traced to scratches or screen aging—replacementwill likely be necessary. The image reader can malfunction causing skipped scan lines and/ordistorted images. Laser power will diminish over time to a point beyond correction (lifetime isestimated to be years, depending on daily use), necessitating replacement of the laser subsystem.Dust particles on the galvanometer/polygonal deflection mirror or on the light collection device
AAPM REPORT NO. 93

59
can be manifested as image dropout artifacts. Laser hard-copy printer misalignment and/or filmconveyor malfunction can cause an uneven scan line distribution, image distortion, or shading,among a myriad of potential problems. Film processor artifacts should be considered as well.
9.2 Software ArtifactsImproper selection of processing menus resulting in incorrect histogram normalization, dynamicrange scaling, and output film density are the major causes of software artifacts. The histogramanalysis function may incorrectly identify the pixel values of interest in the image. Causes
ACCEPTANCE TESTING /QC OF PSP IMAGING SYSTEMS
Characteristics Quantity of Interest Acceptable Tolerance
Dark noise Average signal and its standard deviation within 80% of the E < 0.012 mRimage area σE / E < 1%
Uniformity Signal standard deviation within 80% of the image area, σE < 5%and the standard deviation of the average screen signal among screens
Exposure The exposure indicator response expressed in terms of Emeasured � 1�10%calibration exposure to 1 mR entrance exposure
Linearity and The slope of the system response (expressed in terms of Slope � 1�10%autoranging logarithm of exposure) vs. logarithm of actual exposure Correlation
coefficient > 0.95
Laser beam Jitter dimension in pixels Occasional jitters function < �1 pixel
Limiting Maximum discernible spatial frequencies of a high-contrast Rscan / fNyquist > 0.9resolution line-pair along scan, sub-scan, and 45° axes Rsub-scan / fNyquist > 0.9
R45° / (1.41 fNyquist) > 0.9
Noise and A linear fit of system noise (expressed in terms of logarithm Correlation coefficient low-contrast of corresponding σE / E to logarithm of actual exposure > 0.95resolution
Spatial The difference between the measured (dm ) and actual (dm – d0)/ d0 < 2%accuracy distances (d0) in orthogonal directions
Erasure Average signal and its standard deviation within 80% of the E < 0.012 mRthoroughness reread/unexposed image σE / E < 1%
Aliasing/grid No quantitative tolerance levelsresponse
IP throughput Measured throughput in screens per hours (Tm ) and the (T0 – Tm ) / T0 < 10%specified throughput (T0)
[Adapted from Table XIV in reference 56 with permission from AAPM.]
Table 14. PSP Response Tolerance Levels for “Uniform” Acceptance Criteria. All signal levels and standard deviations are expressed in terms of corresponding exposure (E) values deducedfrom those quantities.
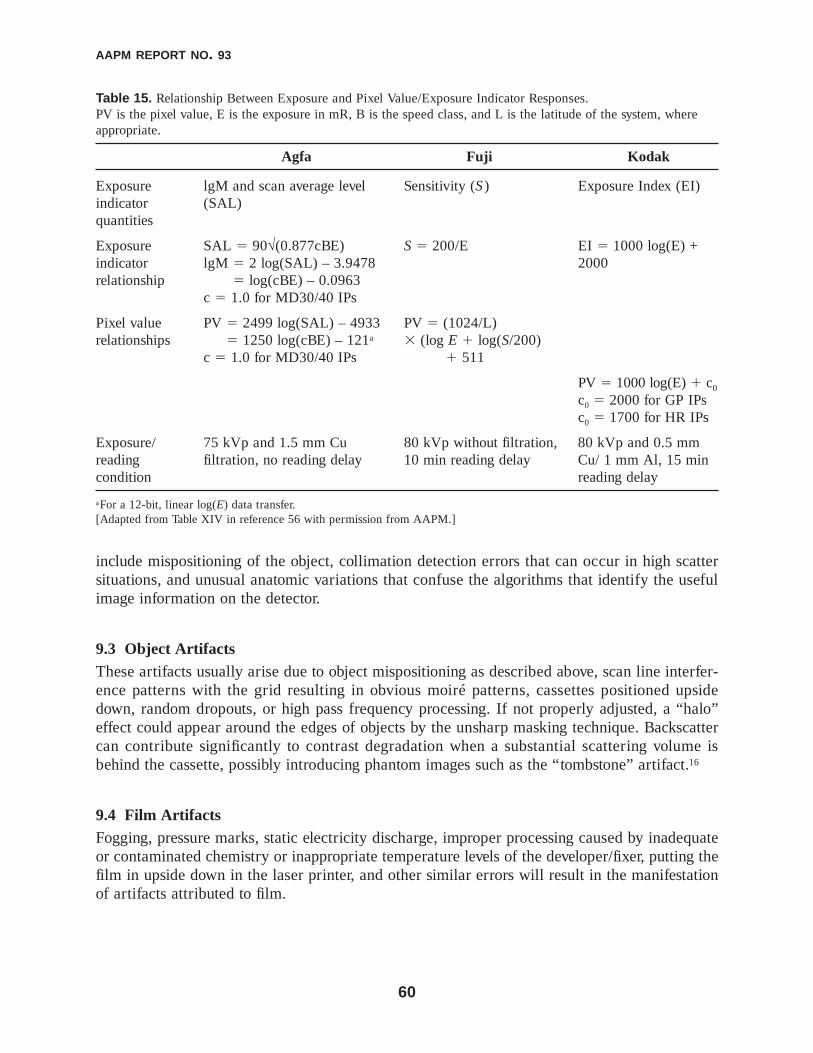
60
include mispositioning of the object, collimation detection errors that can occur in high scattersituations, and unusual anatomic variations that confuse the algorithms that identify the usefulimage information on the detector.
9.3 Object Artifacts These artifacts usually arise due to object mispositioning as described above, scan line interfer-ence patterns with the grid resulting in obvious moiré patterns, cassettes positioned upsidedown, random dropouts, or high pass frequency processing. If not properly adjusted, a “halo”effect could appear around the edges of objects by the unsharp masking technique. Backscattercan contribute significantly to contrast degradation when a substantial scattering volume isbehind the cassette, possibly introducing phantom images such as the “tombstone” artifact.16
9.4 Film ArtifactsFogging, pressure marks, static electricity discharge, improper processing caused by inadequateor contaminated chemistry or inappropriate temperature levels of the developer/fixer, putting thefilm in upside down in the laser printer, and other similar errors will result in the manifestationof artifacts attributed to film.
AAPM REPORT NO. 93
Agfa Fuji Kodak
Exposure lgM and scan average level Sensitivity (S ) Exposure Index (EI)indicator (SAL)quantities
Exposure SAL � 90√(0.877cBE) S � 200/E EI � 1000 log(E) + indicator lgM � 2 log(SAL) – 3.9478 2000relationship lgM � log(cBE) – 0.0963
c � 1.0 for MD30/40 IPs
Pixel value PV � 2499 log(SAL) – 4933 PV � (1024/L) relationships PV � 1250 log(cBE) – 121a � (log E � log(S/200)
c � 1.0 for MD30/40 IPs � 511
PV � 1000 log(E) � c0
c0 � 2000 for GP IPsc0 � 1700 for HR IPs
Exposure/ 75 kVp and 1.5 mm Cu 80 kVp without filtration, 80 kVp and 0.5 mm reading filtration, no reading delay 10 min reading delay Cu/ 1 mm Al, 15 min condition reading delay
aFor a 12-bit, linear log(E) data transfer.[Adapted from Table XIV in reference 56 with permission from AAPM.]
Table 15. Relationship Between Exposure and Pixel Value/Exposure Indicator Responses. PV is the pixel value, E is the exposure in mR, B is the speed class, and L is the latitude of the system, whereappropriate.

61
10. QUALITY CONTROL AND PERIODIC MAINTENANCE
Periodic QC testing is necessary for checking system performance and maintaining optimumimage quality. Daily, monthly, quarterly, and annual procedures are recommended as part of anongoing QC program. In most cases, except for major problems and yearly tests, an assignedtechnologist can perform most of the tasks. A QC phantom specifically designed for PSP radi-ography should be purchased with the system (they are often optional items). In addition, auto-mated QC methods for system checks, monitor maintenance/setup, and adjustments should berequested from the manufacturers. Database management tools and spreadsheets are very pow-erful quantitative and graphical analyzers of pertinent system performance, and can assist in theidentification of problem areas. The following is a suggested QC and performance evaluationschedule that may be used as a guideline, in addition to any routine QC activities and preventivemaintenance program recommended by the manufacturer of the individual PSP system.Depending on the specific PSP system characteristics and resources available, some tests may beunnecessary, or frequencies may be adjusted.
10.1 Daily Tests (Technologist)
1. Inspect system operation and verify operational status.
2. Create laser-generated sensitometry strip and measure film densities (if applicable).
3. Erase cassettes before use, if unsure of status.
4. When performing image QC, look for dust particles, scratches, and mechanical frictionmarks in the images. If present, immediately remove the corresponding cassette/IP andclean as necessary according to the manufacturer’s instructions. Remove IPs thatcannot adequately be cleaned from the inventory. Ensure all images are QC’ed andverified. Check status of network queue and send images as necessary to PACS.
10.2 Monthly Tests (Technologist)
1. Erase all plates in the inventory (particularly those that are infrequently used), andperform spot checks on randomly chosen plates, testing according to methodsdescribed in Table 3 to ensure low Dark Noise.
2. Acquire QC phantom image and implement QC measurements (vendor specific,hopefully automated). Verify performance levels; store results in database file. Note:This QC evaluation might be useful on a more frequent (weekly) basis, depending onease of use or as recommended by the PSP manufacturer for routine QC.
3. Verify calibration of PSP QC workstations, using a simple qualitative SMPTE videotest pattern85 and/or the methodology of AAPM TG-18 for monitor quality control.70
10.3 Quarterly Tests (Technologist)
1. A cleaning program for all cassettes and imaging plates is necessary; inspect, cleanthe imaging plates with approved cleaner by manufacturer, erase and put back intoinventory. Note: The cleaning frequency depends on the specific conditions at the
ACCEPTANCE TESTING /QC OF PSP IMAGING SYSTEMS
62
site, and can be as frequent as once per week in particular environments, or asinfrequent as once per year.
2. Perform qualitative and quantitative QC phantom analysis, including resolution,contrast/noise, laser jitter, and exposure indicator accuracy.
3. Review image retake rate; determine causes of unacceptable PSP images.
4. Review QC exposure indicator database; determine cause of under/overexposures,implement corrective action; generate quarterly reports.
10.4 Annually and After Major Repair/Calibration (Physicist)
1. Inspection/evaluation of image quality; spot check image processing algorithms forappropriateness.
2. Acceptance test procedures to verify and/or re-establish baseline values. Use com-plete inspection and verification procedures.
3. Review technologist QC activities and reports; evaluate retake activity, patient expo-sure trends, QC records, and service history of the equipment.
In addition to the periodic testing, all inspections should be done on an “as needed” basis, par-ticularly for hardware/software changes and significant repairs/changes to the equipment. Thedesignated QC technologist, physicist, and service personnel should participate in the preventivemaintenance and QC program. Invasive adjustments or corrections of the PSP system should bedone only with “vendor-approved” personnel, and with the knowledge of the technologists,physicist, and other service personnel responsible for quality control.
11. CONCLUSIONS
Computed radiography using PSP detectors is becoming more widespread and clinically impor-tant, as the replacement of screen-film detectors continues. The “cassette-based” x-ray acquisi-tion and general radiographic technique methods are in many ways similar to screen-film;however the considerable differences must also be recognized. A large number of setup param-eters, inappropriate use of exposure menus, system hardware or software malfunctions, platedamage, excessive quantum mottle, and patient positioning details are among a host of potentialissues that differ from screen-film experiences. Technologist and radiologist training mustaddress the unique attributes and image acquisition rules (collimation, autoranging, image pro-cessing), as well as continuing education of PSP radiography. As proliferation of systems andmanufacturers occur, unique characteristics, controls, and testing procedures must be consid-ered, in addition to the “generic” operational aspects of PSP and PSL. The acceptance test andQC procedures of a PSP system are reasonably straightforward and relatively easy to evaluate.Widespread use of such systems is occurring rapidly and the technology is evolving. Acceptancetest and QC procedures must advance as well to ensure and maintain optimal image quality. Thisreport provides a reasonable starting point.
AAPM REPORT NO. 93

63
APPENDIX A. MANUFACTURER CONTACT INFORMATION
Manufacturers of PSP system products; web addresses (not inclusive; as of October 2005). Eachof the vendors has specific protocols developed for their systems; in many cases, these are pat-terned after the AAPM Task Group 10 documentation. In the early stages of document formula-tion, these protocols were part of the appendices, but due to the rapid change in technology andequipment, were removed. This information should be directly obtainable from the vendors byrequesting the information regarding acceptance testing and quality control of the PSP equipment.
• FujiFilm Medical Systems USA, Inc.http://www.fujimed.com/
• Eastman Kodakhttp://www.kodak.com/global/en/health/productsByType/cr/crProduct.jhtml
• Agfahttp://www.agfa.com/healthcare
• Konicahttp://konicaminolta.us
• Orex (purchased by Kodak)http://www.orex-cr.com
• iCRco (Cobrascan)http://www.icrcompany.com
• ALARA, Inc.http://www.alara.com
• Other manufacturer original equipment manufacturer branding of PSP system products– Philips Medical Systems– Siemens Medical Systems– General Electric Healthcare– Toshiba Medical Systems.
APPENDIX B. AVAILABLE ACCEPTANCE TESTING AND QUALITY CONTROL FORMS
Ehsan Samei Microsoft® Excel® SpreadsheetsDownloadable spreadsheets that provide objective criteria for many of the Task Group 10recommended tests are available at: http://deckard.mc.duke.edu~samei/files, for specifictesting of Fuji, Agfa, and Kodak PSP systems. It is prudent to consult the manufacturer forthe latest specifications of the equipment.
ACCEPTANCE TESTING /QC OF PSP IMAGING SYSTEMS

64
REFERENCES
1. Digital Imaging and Communications in Medicine (DICOM). http://www.nema.org. Rosslyn, VA: NationalElectrical Manufacturers Association (NEMA). (2004).
2. Health Level 7 (HL7) Standard http://www.hl7.org. Health Level 7, Inc., 3300 Washtenaw Ave., Suite 227,Ann Arbor, MI 48104. (2004)
3. J. A. Rowlands. “The physics of computed radiography.” Phys Med Biol 47:123–166 (2002).4. K. P. Andriole. “Productivity and cost assessment of computed radiography, digital radiography, and
screen-film for outpatient chest examinations.” J Digit Imaging 15:161–169 (2002).5. K. P. Andriole, D. M. Luth, and R. G. Gould. “Workflow assessment of digital versus computed radiogra-
phy and screen-film in the outpatient environment.” J Digit Imaging 15 (Suppl 1):124–126 (2002).6. D. M. Deleeuw, T. Kovats, and S. P. Herko. “Kinetics of photostimulated luminescence in BaFBr-Eu.” JES.
J Electrochem Soc 134:491–493 (1987).7. K. Takahashi, Y. Shibahara, and J. Miyahara. “Photostimulated luminescence (PSL) and color-centers in
BaFCl-Eu2+, BaFBr-Eu2+, BaFI-Eu2+ phosphors.” JES J Electrochem Soc 130:C245–C245 (1983).8. K. Takahashi, K. Kohda, J. Miyahara, Y. Kanemitsu, K. Amitani, and S. Shionoya. “Mechanism of photo-
stimulated luminescence in BaFCl-Eu-2+, BaFBr-Eu-2+ phosphors.” J Lumin 31(2):266-268 (1984).9. H. von Seggern, T. Voight, W. Knupfer, and G. Lange. “Physical model of photostimulated luminescence of
x-ray irradiated BaFBr:Eu.” J Appl Phys 64:1405–1412 (1988).10. A. J. Wilson and O. C. West. “Single exposure conventional and computed radiography. The hybrid cassette
revisited.” Invest Radiol 28:409–412 (1993).11. H. MacMahon, S. Sanada, K. Doi, M. Giger, X. W. Xu, F. F. Yin, S. M. Montner, and M. Carlin. “Direct
comparison of conventional and computed radiography with a dual-image recording technique.”Radiographics 11:259–268 (1991).
12. G. Luckey. Apparatus and Methods for Producing Images Corresponding to Patterns of High EnergyRadiation. U. S. Patent No. 3859527. (1975).
13. S. Arakawa, W. Itoh, K. Kohda, and T. Suzuki. “Novel computed radiography system with improved imagequality by detection of emissions from both sides of an imaging plate.” Proc SPIE 3659:572–581 (1999).
14. P. J. Leblans, L. Struye, and P. Willens. “New needle crystalline CR detector.” Proc SPIE 4320:59–67(2001).
15. R. Schaetzing. “Management of pediatric radiation dose using Agfa computed radiography.” PediatrRadiol 34(Suppl 3):S207–S214 (2004).
16. D. M. Tucker, M. Souto, and G. T. Barnes. “Scatter in computed radiography.” Radiology 188:271–274(1993).
17. H. Kato. “Photostimulable Phosphor Radiography: Design Considerations” in Specification, AcceptanceTesting and Quality Control of Diagnostic X-ray Imaging Equipment, edited by J. A. Seibert, G. T.Barnes, and R. G. Gould. AAPM Medical Physics Monograph No. 20. Woodbury, NY: American Instituteof Physics, Inc., pp. 731–770, 1994.
18. S. Arakawa, H. Yasuda, K. Kohda, and T. Suzuki. “Improvement of image quality in CR mammography bydetection of emissions from dual sides of an imaging plate.” Proc SPIE 3977:590–600 (2000).
19. T. Bogucki, D. Trauernicht, and T. Kocher. Characteristics of a Storage Phosphor System for MedicalImaging. Kodak Health Sciences Division. Rochester, NY: Eastman Kodak Company (1995).
20. J. A. Seibert, J. M. Boone III, V. N. Cooper, and K. K. Lindfors. “Cassette-based digital mammography.”Technol Cancer Res Treat 3:413–427 (2004).
21. K. A. Fetterly and B. A. Schueler. “Performance evaluation of a ‘dual-side read’ dedicated mammographycomputed radiography system.” Med Phys 30:1843–1854 (2003).
22. R. Schaetzing, R. Fasbender, and P. Kersten. “New high-speed scanning technique for computed radiogra-phy.” Proc SPIE 4682:511–520 (2002).
23. S. Arakawa, T. Hiroaki, H. Kuwabara, T. Suzuki, and T. Hagiwara. “Compact high-speed computed radi-ography (CR) system using a linear CCD with a large-area photodiode (PD) and dual transfer lines.” ProcSPIE 5030:778–787 (2004).
24. M. J. Flynn. “Processing Digital Radiographs of Specific Body Parts” in Advances in DigitalRadiography: Categorical Course in Diagnostic Radiology Physics, edited by E. Samei and M. Flynn.Oak Brook, IL: Radiological Society of North America (RSNA), 2003.
AAPM REPORT NO. 93

65
25. J. A. Seibert. “Digital Image Processing Basics” in A Categorical Course in Physics: Physical andTechnical Aspects of Angiography and Interventional Radiology, edited by S. Balter and T. B. Shope. OakBrook, IL: Radiological Society of North America (RSNA), pp. 123–142, 1995.
26. J. A. Seibert. “Digital Radiographic Image Presentation: Preprocessing Methods” in Advances in DigitalRadiography: Categorical Course in Diagnostic Radiology Physics, edited by E. Samei and M. J. Flynn.Oak Brook, IL: Radiological Society of North America (RSNA), pp. 63–70, 2003.
27. J. A. Seibert, D. K. Shelton, and E. H. Moore. “Computed radiography x-ray exposure trends.” AcadRadiol 3:313–318 (1996).
28. P. Vuylsteke, P. Dewaele, and E. Schoeters. “Optimizing Computed Radiography Imaging Performance” inThe Expanding Role of Medical Physics in Diagnostic Imaging, edited by G. D. Frey and P. Sprawls.AAPM Medical Physics Monograph No. 23. Madison, WI: Advanced Medical Publishing, pp. 107–151,1997.
29. “Automatic Setting Functions for Image Density and Range in the FCR System.” Computed Radiography,Technical Review No. 3. Tokyo: Fuji Photo Film Co. Ltd. (1993).
30. M. Ogoda, K. Hishinuma, M. Yamada, and K. Shimura. “Unsharp masking technique using multiresolutionanalysis for computed radiography image enhancement.” J Digit Imaging 10:185–189 (1997).
31. P. Vuylsteke and E. Schoeters. “Multiscale image contrast amplification (MUSICA).” Proc SPIE2167:551–560 (1994).
32. R. Van Metter and D. Foos. “Enhanced latitude for digital projection radiography.” Proc SPIE3658:468–483 (1999).
33. A. W. Templeton, L. H. Wetzel, L. T. Cook, L. A. Harrison, D. A. Eckard, W. H. Anderson, and K. S.Hensley. “Enhancement of storage phosphor plate images: A C-language program.” J Digit Imaging5:59–63 (1992).
34. “Fuji Technical Review on Image Processing.” Computed Radiography, Technical Review No. 3. Tokyo:Fuji Photo Film Co. Ltd. (1993).
35. R. E. Alvarez, J. A. Seibert, and S. K. Thompson. “Comparison of dual energy detector system perform-ance.” Med Phys 31:556–565 (2004).
36. D. L. Ergun, C. A. Mistretta, D. E. Brown, R. T. Bystrianyk, W. K. Sze, F. Kelcz, and D. P. Naidich.“Single-exposure dual-energy computed radiography: Improved detection and processing.” Radiology174:243–249 (1990).
37. W. Ito, K. Shimura, N. Nakajima, M. Ishida, and H. Kato. “Improvement of detection in computed radiog-raphy by new single-exposure dual-energy subtraction.” J Digit Imaging 6:42–47 (1993).
38. F. Kelcz, F. E. Zink, W. W. Peppler, D. G. Kruger, D. L. Ergun, and C. A. Mistretta. “Conventional chestradiography vs dual-energy computed radiography in the detection and characterization of pulmonary nod-ules.” AJR Am J Roentgenol 162:271–278 (1994).
39. S. Kido, H. Nakamura, W. Ito, K. Shimura, and H. Kato. “Computerized detection of pulmonary nodulesby single-exposure dual-energy computed radiography of the chest (part 1).” Eur J Radiol 44:198–204(2002).
40. S. Kido, K. Kuriyama, C. Kuroda, H. Nakamura, W. Ito, K. Shimura, and H. Kato. “Detection of simulatedpulmonary nodules by single-exposure dual-energy computed radiography of the chest: effect of a com-puter-aided diagnosis system (part 2).” Eur J Radiol 44:205–209 (2002).
41. B. K. Stewart and H. K. Huang. “Single-exposure dual-energy computed radiography.” Med Phys17:866–875 (1990).
42. A. Jonsson, K. Jonsson, K. Eklund, G. Holje, and H. Pettersson. “Computed radiography in scoliosis.Diagnostic information and radiation dose.” Acta Radiol 36:429–433 (1995).
43. J. A. Kalmar, J. P. Jones, and C. R. Merritt. “Low-dose radiography of scoliosis in children. A comparisonof methods.” Spine 19:818–823 (1994).
44. K. P. Andriole, R. G. Gould, and W. R. Webb. “Finding-specific display presets for computed radiographysoft-copy reading.” J Digit Imaging 12:3–5 (1999).
45. E. L. Siegel and B. I. Reiner. “Challenges associated with the incorporation of digital radiography into apicture archival and communication system.” J Digit Imaging 12:6–8 (1999).
46. J. Xuan, T. Adali, Y. Wang, and E. Siegel. “Automatic detection of foreign objects in computed radiogra-phy.” J Biomed Opt 5:425–431 (2000).
ACCEPTANCE TESTING /QC OF PSP IMAGING SYSTEMS

66
47. W. Huda, L. N. Rill, and A. P. Bruner. “Relative speeds of Kodak computed radiography phosphors andscreen-film systems.” Med Phys 24:1621–1628 (1997).
48. L. W. Goldman. “Speed Values, AEC Performance Evaluation, and Quality Control” in Specifications,Performance Evaluation, and Quality Assurance of Radiographic and Fluoroscopic Systems in theDigital Era, edited by L. W. Goldman and M. V. Yester. Madison, WI: Medical Physics Publishing, pp. 271–297, 2004.
49. C. E. Willis. “Strategies for dose reduction in ordinary radiographic examinations using CR and DR.”Pediatr Radiol 34:S196-S200 (2004).
50. S. J. Shepard and et al. “Standardization of Exposure Indices for Digital Radiography; AAPM Task Group116.” DR Exposure Index Task Group report in progress. (2005).
51. W. Huda, R. M. Slone, C. J. Belden, J. L. Williams, W. A. Cumming, and C. K. Palmer. “Mottle on com-puted radiographs of the chest in pediatric patients.” Radiology 199:249–252 (1996).
52. J. T. Dobbins III, D. L. Ergun, L. Rutz, D. A. Hinshaw, H. Blume, and D. C. Clark. “DQE(f) of four gen-erations of computed radiography acquisition devices.” Med Phys 22:1581–1593 (1995).
53. G. T. Barnes. “Digital X Ray Image Capture with Image Intensifier and Storage Phosphor Plates: ImagingPrinciples, Performance and Limitations” in Digital Imaging, edited by J. Trueblood and W. Hendee.Proceedings of the 1993 AAPM Summer School, Medical Physics Monograph No. 22. Madison, WI:Medical Physics Publishing, pp. 23–48, 1993.
54. A. R. Lubinsky, B. R. Whiting, and J. F. Owen. “Storage phosphor system for computed radiography:Optical effects and detective quantum efficiency (DQE).” Proc SPIE 767:167–177 (1987).
55. W. Hillen, U. Schiebel, and T. Zaengel. “Imaging performance of a digital storage phosphor system.” MedPhys 14:744–751 (1987).
56. E. Samei, J. A. Seibert, C. E. Willis, M. J. Flynn, E. Mah, and K. L. Junck. “Performance evaluation ofcomputed radiography systems.” Med Phys 28:361–371 (2001).
57. J. M. Boone and J. A. Seibert. “An accurate method for computer-generating tungsten anode x-ray spec-tra from 30 to 140 kV.” Med Phys 24:1661–1670 (1997).
58. Digital Imaging and Communications in Medicine (DICOM) Part 14: Grayscale Standard DisplayFunction. http://medical.nema.org/dicom/2003/03_14PU.pdf. Rosslyn, VA: National Electr icalManufacturers Association (NEMA) (2003).
59. E. Samei et al. Assessment of Display Performance for Medical Imaging Systems: AAPM Task Group 18report. Draft (2004).
60. P. C. Bunch. “Performance characteristics of high-MTF screen film systems.” Proc SPIE 2163:14–35(1994).
61. D. Clunie. “DICOM Softcopy Presentation State Storage and Print Presentation LUT.” http://www.dclunie.com/papers/spie_mi_nema_softcopy.pdf. (2005).
62. D. S. Channin. “M:I-2 and IHE: Integrating the healthcare enterprise, year 2.” Radiographics20:1261–1262 (2000).
63. D. S. Channin, E. L. Siegel, C. Carr, and J. Sensmeier. “Integrating the healthcare enterprise: A primer.Part 5. The future of IHE.” Radiographics 21:1605–1608 (2001).
64. D. S. Channin, C. Parisot, V. Wanchoo, A. Leontiev, and E. L. Siegel. “Integrating the healthcare enter-prise: A primer: Part 3. What does IHE do for ME?” Radiographics 21:1351–1358 (2001).
65. D. S. Channin. “Integrating the healthcare enterprise: A primer. Part 2. Seven brides for seven brothers:The IHE integration profiles.” Radiographics 21:1343–1350 (2001).
66. D. S. Channin. “Integrating the healthcare enterprise: A primer. Part 6: The fellowship of IHE: Year 4additions and extensions.” Radiographics 22:1555–1560 (2002).
67. M. Henderson, F. M. Behlen, C. Parisot, E. L. Siegel, and D. S. Channin. “Integrating the healthcare enter-prise: A primer. Part 4. The role of existing standards in IHE.” Radiographics 21:1597–1603 (2001).
68. S. M. Moore. “Using the IHE scheduled work flow integration profile to drive modality efficiency.”Radiographics 23:523-529 (2003).
69. M. Oskin, J. A. Seibert, and R. L. Kennedy. “Diagnostics and Acceptance Testing for DICOM Networks”in Practical Digital Imaging and PACS, edited by J. A. Seibert, L. J. Filipow, and K. P. Andriole. AAPMMedical Physics Monograph No. 25. Madison, WI: Medical Physics Publishing, pp. 317–350, 1999.
70. E. Samei, A. Badano, D. Chakraborty, K. Compton, C. Cornelius, K. Corrigan, M. J. Flynn, B.Hemminger, N. Hangiandreou, J. Johnson, D. M. Moxley-Stevens, W. Pavlicek, H. Roehrig, L. Rutz, J.
AAPM REPORT NO. 93

67
Shepard, R. A. Uzenoff, J. Wang, and C. E. Willis. “Assessment of display performance for medical imag-ing systems: Executive summary of AAPM TG18 report.” Med Phys 32:1205–1225 (2005). Full reportavailable as AAPM On-line Report No. O3 (2005).
71. H. P. Chan and K. Doi. “Investigation of the performance of antiscatter grids: Monte Carlo simulationstudies.” Phys Med Biol 27:785–803 (1982).
72. D. Gelskey and R. LaFrance. “RadChek: Electronic device to calibrate AEC phototimer for CR.”Unpublished. (2004).
73. E. G. Christodoulou, M. M. Goodsitt, H. P. Chan, and T. W. Hepburn. “Phototimer setup for CR imaging.”Med Phys 27:2652–2658 (2000).
74. L. J. Cesar. “Computed radiography: Its impact on radiographers.” Radiol Technol 68:225–232 (1997).75. D. S. Artz. “Computed radiography for the radiological technologist.” Semin Roentgenol 32:12–24 (1997).76. A. Workman, A. R. Cowen, and D. S. Brettle. “Physical evaluation of computed radiography as a mam-
mographic x-ray imaging system.” Br J Radiol 67:988–996 (1994).77. C. E. Willis, J. Weiser, R. G. Leckie, J. R. Romlein, and G. Norton. “Optimization and quality control of
computed radiography.” Proc SPIE 2164:178–185 (1994).78. J. E. Tucker, M. Contreras, R. J. Wider, M. G. Radvany, A. K. Chacko, and R. B. Shah. “Photostimulable
storage phosphor image acquisition: Evaluation of three commercially available state-of-the-art systems.” J Digit Imaging 12:54–58 (1999).
79. J. A. Seibert. “Photostimulable Phosphor Acceptance Testing” in Specification, Acceptance Testing andQuality Control of Diagnostic X-ray Imaging Systems, edited by J. A. Seibert, G. T. Barnes, and R. G.Gould. AAPM Medical Physics Monograph No. 20. Woodbury, NY: American Institute of Physics, Inc.,pp. 771–800, 1994.
80. S. M. Kengyelics, J. H. Launders, and A. R. Cowen. “Physical imaging performance of a compact com-puted radiography acquisition device.” Med Phys 25:354–360 (1998).
81. H. Jafroudi, D. Steller, M. Freedman, and S. K. Mun. “Quality control of storage phosphor digital radiog-raphy systems.” Proc SPIE 2432:563–577 (1995).
82. W. Huda, M. Arreola, and Z. Jing. “Computed radiography acceptance testing.” Proc SPIE 2432:512–521(1995).
83. A. R. Cowen, A. Workman, and J. S. Price. “Physical aspects of photostimulable phosphor computed radi-ography.” Br J Radiol 66:332–345 (1993).
84. E. Samei. Excel Spreadsheets for Acceptance Testing Criteria. http://deckard.mc.duke.edu/~samei/files.(2001).
85. J. E. Gray. “Use of the SMPTE test pattern in picture archiving and communication systems.” J DigitImaging 5:54–58 (1992).
86. A. Haus and S. Jaskulski. The Basics of Film Processing in Medical Imaging. Madison, WI: MedicalPhysics Publishing, 1997.
87. S. J. Shepard, P. P. Lin et al. AAPM Report No. 74: Quality Control in Diagnostic Radiology. Report ofTask Group 12, Diagnostic X-ray Imaging Committee. Madison, WI: Medical Physics Publishing (2002).
88. L. K. Wagner and S. Dinwiddie. “Acceptance Testing and QC of Film Transport and Processing Systems”in Specification, Acceptance Testing and Quality Control of Diagnostic X-ray Imaging Equipment, editedby J. A. Seibert, G. T. Barnes, and R. G. Gould. AAPM Medical Physics Monograph No. 20. Woodbury,NY: American Institute of Physics, Inc., pp. 413–428, 1994.
89. J. A. Seibert. “Film Recording Printers” in Quality Assurance: Meeting the Challenge in the DigitalMedical Enterprise, edited by B. I. Reiner, E. L. Siegel, and J. A. Carrino. Great Falls, VA: Society forComputer Applications in Radiology, pp. 93–110, 2002.
90. S. J. Shepard, S. K. Thompson, K. T. Krugh, S. Venable, and R. Munden. “Design and implementation ofa robust high availability DICOM print network in a large multimodality clinical environment.” Proc SPIE4685:263–269 (2002).
91. S. K. Thompson, C. E. Willis, K. T. Krugh, S. J. Shepard, and K. W. McEnery. “Implementing the DICOMGrayscale Standard Display Function for mixed hard- and soft-copy operations.” J Digit Imaging 15(Suppl 1):27–32 (2002).
92. S. J. Shepard. “DICOM Basics for Radiographic and Fluoroscopic Systems” in Specifications,Performance Evaluation, and Quality Assurance of Radiographic and Fluoroscopic Systems in theDigital Era, edited by L. W. Goldman and M. V. Yester. AAPM Medical Physics Monograph No. 30.Madison, WI: Medical Physics Publishing, pp. 125–141, 2004.
ACCEPTANCE TESTING /QC OF PSP IMAGING SYSTEMS

68
93. D. Clunie. “Designing and implementing a PACS-aware DICOM image object for digital x-ray, mammog-raphy, and intraoral applications.” Proc SPIE 3662:83–89 (1999).
94. J. McArdle. Leeds X-ray Test Objects for Computed Radiography. Instruction Manual. Leeds, England:FAXIL: Medical Physics (1990).
95. A. J. Wagner, G. T. Barnes, and X. Z. Wu. “Assessing fluoroscopic contrast resolution: A practical andquantitative test tool.” Med Phys 18:894–899 (1991).
96. E. Samei, M. J. Flynn, and D. A. Reimann. “A method for measuring the presampled MTF of digital radi-ographic systems using an edge test device.” Med Phys 25:102–113 (1998).
97. J. Seibert and L. Goldman. “DR QC workshop.” Digital Radiography QC Workshop at AAPM AnnualMeeting, Seattle, WA, July 2005. Med Phys 32(6):2141 (2005).
98. E. Samei and M. J. Flynn. “An experimental comparison of detector performance for computed radiogra-phy systems.” Med Phys 29:447–459 (2002).
99. M. J. Flynn and E. Samei. “Experimental comparison of noise and resolution for 2k and 4k storage phos-phor radiography systems.” Med Phys 26:1612–1623 (1999).
100. L. J. Cesar, B. A. Schueler, F. E. Zink, T. R. Daly, J. P. Taubel, and L. L. Jorgenson. “Artefacts found incomputed radiography.” Br J Radiol 74:195–202 (2001).
101. J. W. Oestmann, M. Prokop, C. M. Schaefer, and M. Galanski. “Hardware and software artifacts in storagephosphor radiography.” Radiographics 11:795–805 (1991).
102. S. L. Solomon, R. G. Jost, H. S. Glazer, S. S. Sagel, D. J. Anderson, and P. L. Molina. “Artifacts in com-puted radiography.” AJR Am J Roentgenol 157:181–185 (1991).
103. C. E. Willis, S. K. Thompson, and S. J. Shepard. “Artifacts and misadventures in digital radiology.” ApplRadiol 33(1):11–17 (2004).
AAPM REPORT NO. 93