access for ells 2.0 interpretive guide for score reports
TRANSCRIPT
ACCESS for ELLs 2.0 Interpretive Guide for Score Reports
Kindergarten–Grade 12Spring 2016

© 2016 Board of Regents of the University of Wisconsin System, on behalf of WIDA. ACCESS for ELLs 2.0 Interpretive Guide for Score Reports (“Interpretive Guide”) may not be reproduced, modified, or distributed without prior written permission from WIDA. This Interpretive Guide is for your personal, noncommercial use only. Fair use of this Interpretive Guide includes reproduction for the purpose of training or teaching (including multiple copies for lesson planning).
Version 1.1 Revised March 17, 2016

1
ContentsIntroduction .........................................................................................................................................3About the Assessment ...........................................................................................................................3Organization of This Guide ..................................................................................................................3
Part I: ACCESS for ELLs 2.0 Scores...............................................................................................4Description of ACCESS for ELLs 2.0 Grade Level Clusters .................................................................4ACCESS for ELLs 2.0 Online Test versus Paper Test ............................................................................5ACCESS for ELLs 2.0 Scores (Grades 1–12) ........................................................................................5 Raw Scores ........................................................................................................................................6 Scale Scores .......................................................................................................................................6 Proficiency Level Scores .....................................................................................................................7 Composite Scores ..............................................................................................................................7 Composite Scale Scores .....................................................................................................................8Special Notes Regarding ACCESS for ELLs 2.0 Scores .......................................................................10 Score Caps ......................................................................................................................................10 NA Notation ...................................................................................................................................10 Incomplete Tests ..............................................................................................................................10Confidence Bands Depicting Standard Error of Measurement ............................................................11
Part II: Kindergarten ACCESS for ELLs 2.0 Scores ................................................................... 13Differences between Kindergarten Scores and Grades 1–12 Scores .....................................................13 Limited Scale Score Range ..............................................................................................................13 Two Types of Proficiency Level Scores .............................................................................................13 Rationale for two Proficiency Levels ................................................................................................14
Part III: ACCESS for ELLs 2.0 Score Reports ............................................................................. 16Introduction .......................................................................................................................................16 Suggestions on How to Use ACCESS for ELLs 2.0 Scores ...............................................................17 Can Do Descriptors ........................................................................................................................18Individual Student Report ..................................................................................................................19 About This Report ...........................................................................................................................19 Report at a Glance ...........................................................................................................................19 How to Use This Report ..................................................................................................................20 Speaking and Writing Interpretive Rubrics ......................................................................................23 Speaking and Writing Scoring Scales ...............................................................................................23Kindergarten Individual Student Report ............................................................................................24 About This Report ...........................................................................................................................24 Report at a Glance ...........................................................................................................................24 How to Use This Report ..................................................................................................................26
2
Parent/Guardian Report (Kindergarten only) .....................................................................................27 About This Report ...........................................................................................................................27 Report at a Glance ...........................................................................................................................27 How to Use This Report ..................................................................................................................27Student Roster Report ........................................................................................................................29 About This Report ...........................................................................................................................29 Report at a Glance ...........................................................................................................................29 How to Use This Report ..................................................................................................................31School Frequency Report ...................................................................................................................33 About This Report ...........................................................................................................................33 Report at a Glance ...........................................................................................................................33 How to Use This Report ..................................................................................................................33District Frequency Report ..................................................................................................................35 About This Report ...........................................................................................................................35 Report at a Glance ...........................................................................................................................35 How to Use This Report ..................................................................................................................35
Appendix A: WIDA Performance Level Definitions ...........................................................................38Appendix B: List of Available Languages ............................................................................................40Appendix C: Sample Parent/Guardian Letter......................................................................................42Appendix D: WIDA Interpretive Rubrics ...........................................................................................43Appendix E: WIDA Scoring Scales .....................................................................................................45
3
IntroductionWelcome to the ACCESS for ELLs 2.0 Interpretive Guide for Score Reports, 2016. The aim of the Interpretive Guide is to assist stakeholders in understanding the scores reported for ACCESS for ELLs 2.0 test takers.
About the AssessmentACCESS for ELLs 2.0, a large-scale language proficiency test for K–12 students, is one component of WIDA’s comprehensive, standards-driven system designed to improve the teaching and learning for English language learners (ELLs). The test was developed in partnership with the Center for Applied Linguistics. In 2015–16 ACCESS for ELLs 2.0 was delivered online for the first time. Prior to this year, the test had been available only as a paper and pencil assessment.
The purpose of ACCESS for ELLs 2.0 is to monitor student progress in English language proficiency (ELP) on a yearly basis and to serve as a criterion to aid in determining when ELLs have attained language proficiency comparable to that of their English-proficient peers. The test is carefully designed to be representative of the social and academic language demands within a school setting as exemplified in the WIDA English Language Development (ELD) Standards (2004, 2007, 2012).
WIDA Technical Report #1, Development and Field Test of ACCESS for ELLs (2006), provides extensive information on the conceptualization of the assessment, from its anchor in the ELD Standards through each developmental phase. It details the procedures for standard setting, which determined the cut scores for the six language proficiency levels. Annual Technical Report #4 explains how grade-level cluster cut scores were converted to grade-specific cut scores in 2007, which is how proficiency level scores are now reported. To obtain a copy of these reports, please visit the WIDA website: www.wida.us.
The high quality of ACCESS for ELLs 2.0’s technical properties ensures that the test is a reliable and valid measure of English language proficiency. Therefore, WIDA is confident that the information contained in the score reports is an accurate reflection of the students’ English language proficiency at a given point in time.
Organization of This GuidePart I addresses the types of scores reported by ACCESS for ELLs 2.0 for students in Grades 1–12. These students may take the test entirely online, entirely using paper booklets, or take the test online while completing the writing domain by hand. Unless stated otherwise, statements about the test and score reports refer to all methods of test delivery and student response.
Part II addresses Kindergarten ACCESS for ELLs 2.0, which remains paper-based. Almost all of the information included about Grades 1–12 also applies to Kindergarten, but Kindergarten reports differ in a few ways. Therefore, those working with Kindergarten scores should review both Part I and Part II.
Part III provides examples of each type of score report. Along with each sample, detailed information is offered on the meaning and the use of the data in the reports.
ACCESS for ELLs 2.0 scores should be considered one of multiple criteria used in educational decision making.

4
Part I: ACCESS for ELLs 2.0 ScoresThis section provides detailed information about the types of scores generated by ACCESS for ELLs 2.0.
Description of ACCESS for ELLs 2.0 Grade Level ClustersACCESS for ELLs 2.0 is a secure, large-scale ELP test anchored in the WIDA ELD Standards. Test forms are broken down into grade-level clusters:
Format Grade-Level Clusters
Online K, 1, 2–3, 4–5, 6–8, 9–12
Paper K, 1, 2, 3, 4–5, 6–8, 9–12
For more information about the Kindergarten test, see page 15.
ACCESS for ELLs 2.0 uses multiple choice questions and constructed response performance-based tasks to assess the four domains of Listening, Reading, Writing, and Speaking. Different methods are used to score these four domains.
• Listening and Reading are machine scored by Data Recognition Corporation (DRC). • For Grade levels 1–12, Writing is assessed through a set of performance-based tasks. Whether
keyboarded or handwritten, student responses are centrally scored by trained raters at DRC, using the WIDA Writing Scoring Scale; see page 23.
• For Grade levels 1–12, Speaking is assessed through a set of performance-based tasks and the method used to score Speaking depends on the administration mode. Responses from students taking the online test are captured by the computer and sent to be scored centrally at DRC. Responses from students taking the paper-based Speaking test are scored locally by the Test Administrator. Both the online and paper tests assess speaking through a scripted exchange that allows students to demonstrate proficiency at the different WIDA English language proficiency levels. Both the online and paper Speaking tests are rated using the same WIDA Speaking Scoring Scale; see page 23.

5
ACCESS for ELLs 2.0 Online Test versus Paper TestACCESS for ELLs 2.0 may be administered online or as a paper-based test. Both formats generate the same types of scores. Therefore, this document does not go into much detail about how the tests differ, but in brief:
Online Test Paper Test
The grade level clusters are 1, 2–3, 4–5, 6–8, and 9–12.
The grade level clusters are 1, 2, 3, 4–5, 6–8, and 9–12.
The adaptive Listening and Reading tests are administered first, and the student’s performance determines his or her tier placement for Speaking and Writing.
Teachers must select which tier of the test to give to each of their students prior to the start of the test.
Writing tests are scored centrally; keyboarded responses are sent automatically to be scored, and handwritten responses need to be mailed.
Handwritten responses are mailed in and the Writing tests are scored centrally.
For the Speaking test, students speak into a headset to record their answers, which are centrally scored.
The paper-based Speaking test is administered and scored locally.
ACCESS for ELLs 2.0 Scores (Grades 1–12)An individual student’s results on ACCESS for ELLs are reported as scale scores and as English language proficiency level scores for each of the four language domains:
• Listening• Speaking• Reading• Writing
Scale scores and proficiency levels are also reported for four different combinations of language domains. These combinations are known as composite scores, and include the following:
• Oral Language (Listening and Speaking)• Literacy (Reading and Writing)• Comprehension (Listening and Reading)• Overall Composite Score (a combination of all four language domains)
6
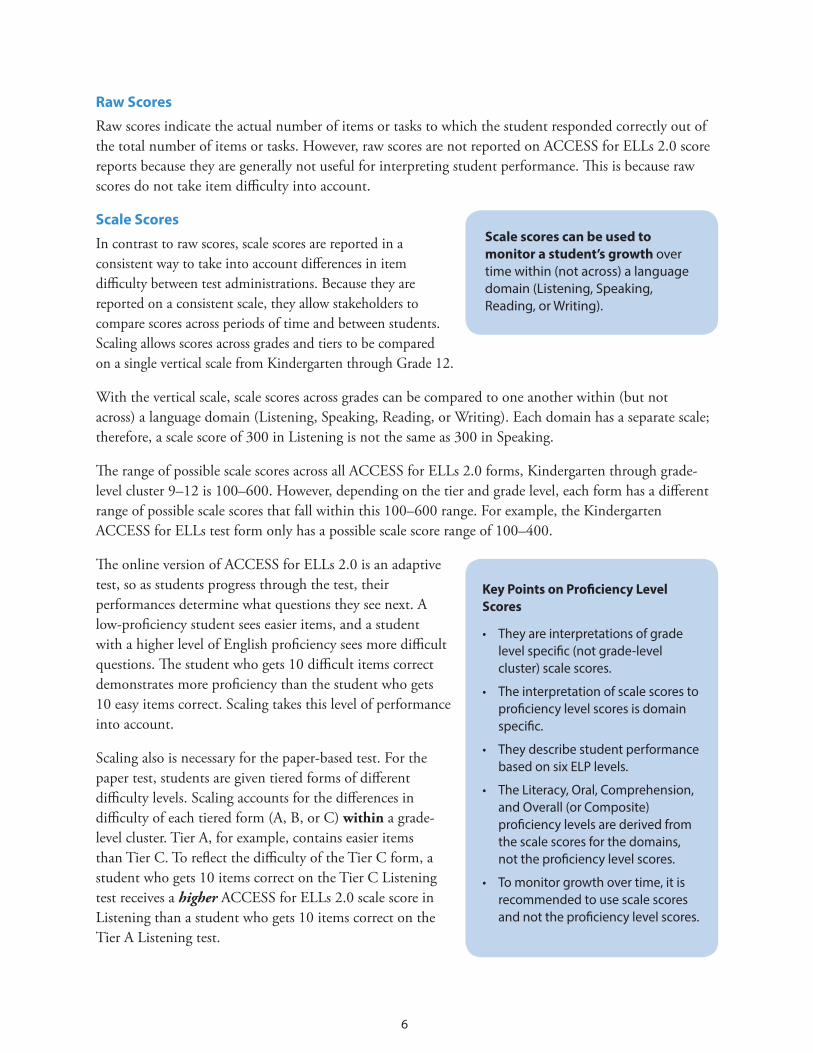
Raw Scores
Raw scores indicate the actual number of items or tasks to which the student responded correctly out of the total number of items or tasks. However, raw scores are not reported on ACCESS for ELLs 2.0 score reports because they are generally not useful for interpreting student performance. This is because raw scores do not take item difficulty into account.
Scale Scores
In contrast to raw scores, scale scores are reported in a consistent way to take into account differences in item difficulty between test administrations. Because they are reported on a consistent scale, they allow stakeholders to compare scores across periods of time and between students. Scaling allows scores across grades and tiers to be compared on a single vertical scale from Kindergarten through Grade 12.
With the vertical scale, scale scores across grades can be compared to one another within (but not across) a language domain (Listening, Speaking, Reading, or Writing). Each domain has a separate scale; therefore, a scale score of 300 in Listening is not the same as 300 in Speaking.
The range of possible scale scores across all ACCESS for ELLs 2.0 forms, Kindergarten through grade-level cluster 9–12 is 100–600. However, depending on the tier and grade level, each form has a different range of possible scale scores that fall within this 100–600 range. For example, the Kindergarten ACCESS for ELLs test form only has a possible scale score range of 100–400.
The online version of ACCESS for ELLs 2.0 is an adaptive test, so as students progress through the test, their performances determine what questions they see next. A low-proficiency student sees easier items, and a student with a higher level of English proficiency sees more difficult questions. The student who gets 10 difficult items correct demonstrates more proficiency than the student who gets 10 easy items correct. Scaling takes this level of performance into account.
Scaling also is necessary for the paper-based test. For the paper test, students are given tiered forms of different difficulty levels. Scaling accounts for the differences in difficulty of each tiered form (A, B, or C) within a grade-level cluster. Tier A, for example, contains easier items than Tier C. To reflect the difficulty of the Tier C form, a student who gets 10 items correct on the Tier C Listening test receives a higher ACCESS for ELLs 2.0 scale score in Listening than a student who gets 10 items correct on the Tier A Listening test.
Key Points on Proficiency Level Scores
• They are interpretations of grade level specific (not grade-level cluster) scale scores.
• The interpretation of scale scores to proficiency level scores is domain specific.
• They describe student performance based on six ELP levels.
• The Literacy, Oral, Comprehension, and Overall (or Composite) proficiency levels are derived from the scale scores for the domains, not the proficiency level scores.
• To monitor growth over time, it is recommended to use scale scores and not the proficiency level scores.
Scale scores can be used to monitor a student’s growth over time within (not across) a language domain (Listening, Speaking, Reading, or Writing).

7
Scaling also accounts for the differences in difficulty of the test forms across grade-level clusters. This means that a student taking the grade-level cluster 4–5 Tier B Reading test who gets all items correct receives a lower scale score in Reading than a student who gets all items correct on the Grade-level Cluster 6–8 Tier B Reading test. The 4–5 student receives a scale score of 446 while the 6–8 student receives a scale score of 462 in the Reading domain.
Proficiency Level Scores
The proficiency level scores are interpretive scores. That is, they provide stakeholders with an interpretation of the scale scores. They help stakeholders understand what the numeric score means in terms of the language skills of the student. They describe student performance in terms of the six WIDA English language proficiency levels: (1–Entering, 2–Emerging, 3–Developing, 4–Expanding, 5–Bridging, 6–Reaching).
Proficiency level scores are presented as whole numbers followed by a decimal. The whole number indicates the student’s language proficiency level as based on the WIDA ELD Standards. The decimal indicates the proportion within the proficiency level range that the student’s scale score represents, rounded to the nearest tenth.
The interpretation of scale scores to proficiency level scores is grade specific, not grade-level cluster specific. For example, a Reading scale score of 303 for a fifth grade student is interpreted as Level 2.0. The same scale score for a fourth grader results in Level 2.5, and for a third grade student that scale score results in Level 3.1.
Each domain reports a separate score; therefore, the same scale score in Listening and Reading does not become the same proficiency level score. For example, for a sixth grade student in grade-level cluster 6–8, a scale score of 380 for Listening becomes a proficiency level score of 5.0, while a scale score of 380 for Reading becomes a proficiency level score of 5.9.
Composite Scores
Students receive four different composite scores derived from a combination of weighted language domain scores. The four composite scores are Oral Language, Literacy, Comprehension, and Overall score.
Composite scores are compensatory. Compensatory means that a high score in one language domain could inflate the composite score, compensating for a low score in another language domain; conversely, a low score in a language domain could bring down the composite.
Only students that complete all domains of ACCESS for ELLS 2.0 will receive the four composite scores.
Composite scores should be used with caution after careful consideration of their compensatory nature. Attention must be given to the individual language domain scores that comprise the composite score as well as their weights.
The same Overall Scale Score for two students can reflect two very different profiles. For example, one student may be very strong in Listening and Reading, but weaker in Speaking and Writing, while another student with the same Overall Scale Score is strong in Reading and Writing, but weaker in Listening and Speaking. A student’s individual performance in each language domain provides a more comprehensive and realistic profile than that from a single overall score.
8
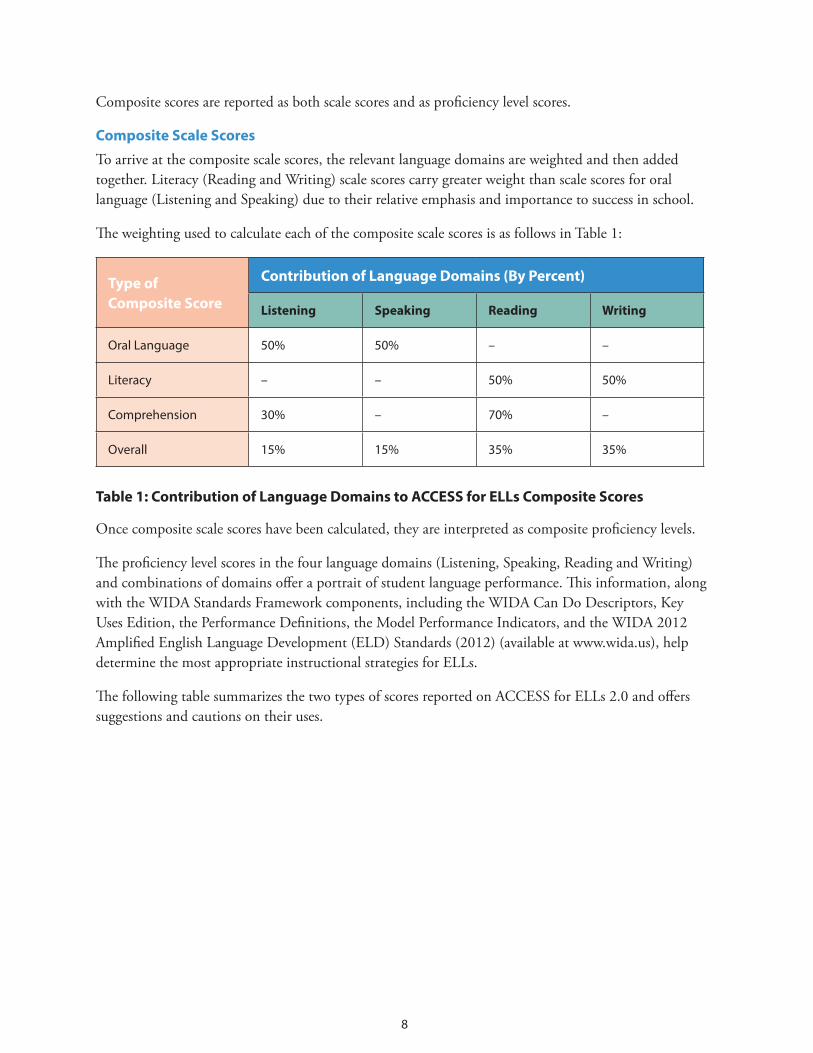
Composite scores are reported as both scale scores and as proficiency level scores.
Composite Scale Scores
To arrive at the composite scale scores, the relevant language domains are weighted and then added together. Literacy (Reading and Writing) scale scores carry greater weight than scale scores for oral language (Listening and Speaking) due to their relative emphasis and importance to success in school.
The weighting used to calculate each of the composite scale scores is as follows in Table 1:
Type of Composite Score
Contribution of Language Domains (By Percent)
Listening Speaking Reading Writing
Oral Language 50% 50% – –
Literacy – – 50% 50%
Comprehension 30% – 70% –
Overall 15% 15% 35% 35%
Table 1: Contribution of Language Domains to ACCESS for ELLs Composite Scores
Once composite scale scores have been calculated, they are interpreted as composite proficiency levels.
The proficiency level scores in the four language domains (Listening, Speaking, Reading and Writing) and combinations of domains offer a portrait of student language performance. This information, along with the WIDA Standards Framework components, including the WIDA Can Do Descriptors, Key Uses Edition, the Performance Definitions, the Model Performance Indicators, and the WIDA 2012 Amplified English Language Development (ELD) Standards (2012) (available at www.wida.us), help determine the most appropriate instructional strategies for ELLs.
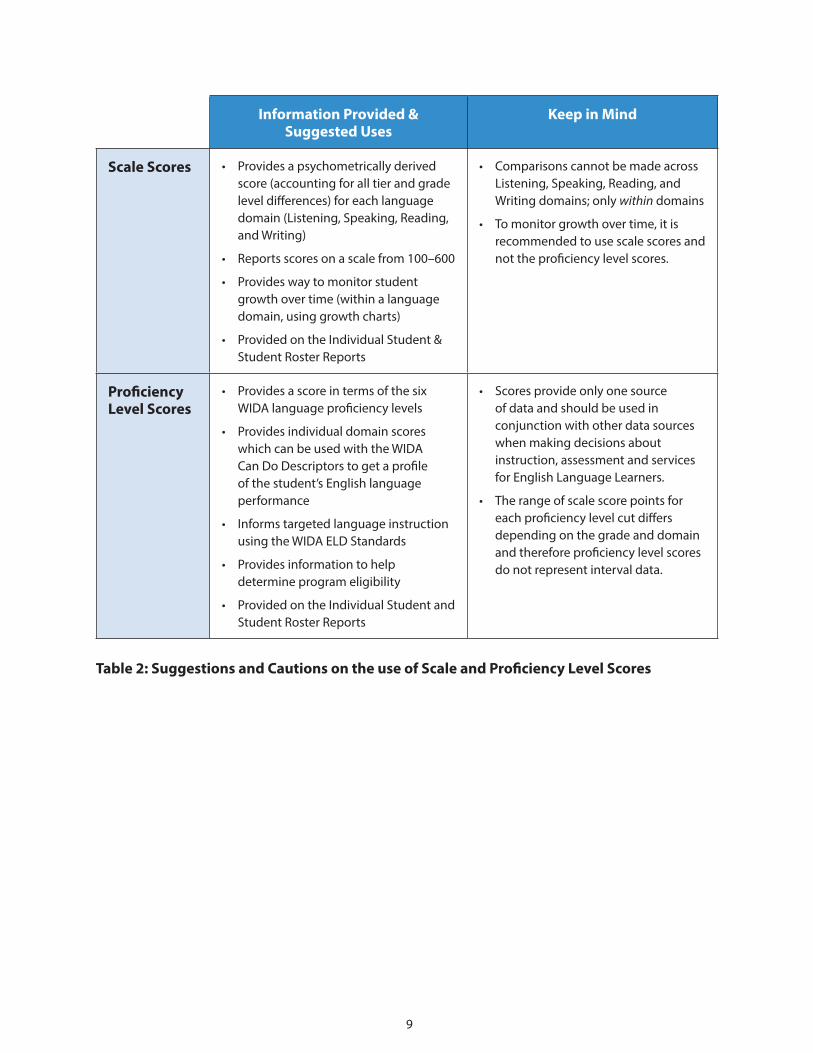
The following table summarizes the two types of scores reported on ACCESS for ELLs 2.0 and offers suggestions and cautions on their uses.
9
Information Provided & Suggested Uses
Keep in Mind
Scale Scores • Provides a psychometrically derived score (accounting for all tier and grade level differences) for each language domain (Listening, Speaking, Reading, and Writing)
• Reports scores on a scale from 100–600
• Provides way to monitor student growth over time (within a language domain, using growth charts)
• Provided on the Individual Student & Student Roster Reports
• Comparisons cannot be made across Listening, Speaking, Reading, and Writing domains; only within domains
• To monitor growth over time, it is recommended to use scale scores and not the proficiency level scores.
Proficiency Level Scores
• Provides a score in terms of the six WIDA language proficiency levels
• Provides individual domain scores which can be used with the WIDA Can Do Descriptors to get a profile of the student’s English language performance
• Informs targeted language instruction using the WIDA ELD Standards
• Provides information to help determine program eligibility
• Provided on the Individual Student and Student Roster Reports
• Scores provide only one source of data and should be used in conjunction with other data sources when making decisions about instruction, assessment and services for English Language Learners.
• The range of scale score points for each proficiency level cut differs depending on the grade and domain and therefore proficiency level scores do not represent interval data.
Table 2: Suggestions and Cautions on the use of Scale and Proficiency Level Scores

10
Special Notes Regarding ACCESS for ELLs 2.0 ScoresScore Caps
Scores for the language domains of Listening and Reading (and subsequently the Comprehension composite) on the paper test are capped for the Tier A and Tier B forms of ACCESS for ELLs 2.0. Placing a cap on the tier means that students cannot receive a proficiency level score above 4.0 for Tier A and above 5.0 for Tier B. Scale scores at the upper end are collapsed so that students who correctly answer most or all of the items on Tier A or Tier B do not receive a scale score that would equate to a proficiency level score above 4.0 and 5.0 respectively. As a consequence of capping scores for Listening and Reading, students who take Tier A or Tier B forms are less likely to receive an Overall Score above proficiency level 4.0 or 5.0, respectively.
Listening and Reading scores for the online test are not capped, because these domains of the online test are adaptive, meaning that as the student navigates though the test content, the test items presented become easier or more difficult based on the student’s performance on previous items. Students will be placed into the appropriate Tier for Speaking and Writing based on their performance on the Listening and Reading domains. Students who test online may be placed into a Pre-A Tier for Speaking. The Pre-A Speaking test is a special test form that has been developed for newcomers with minimal ability to produce spoken English. It is a shortened and simplified Speaking test, and as such, scores are capped at Proficiency Level 1.
NA Notation
If a report shows a notation of NA for a language domain or domains, it means that the student was not tested for that language domain(s).
Composite or overall scores are not computed if any language domain score is missing. For example, if a student is unable to participate in the Speaking part of the test, the student receives NA for Speaking, Oral Language, and the Overall Score. Similarly, a student who has a non-scoring code marked for Reading receives NA for Reading, Literacy, Comprehension, and the Overall Score.
Incomplete Tests
If an ACCESS for ELLs 2.0 test booklet is returned to DRC with completed demographic information, either on a Pre-ID label or bubbled in, it is scanned and scored. If a whole domain of the test is left blank, and none of the non-scoring codes are marked on the booklet, DRC assumes that the student has attempted the domain. Consequently, the student receives the lowest possible score for the blank domain(s) for the designated grade level. These same scoring criteria apply to the online test. If the student has logged in to the online test but not answered any of the questions, the student is awarded the lowest possible score for that domain.
11
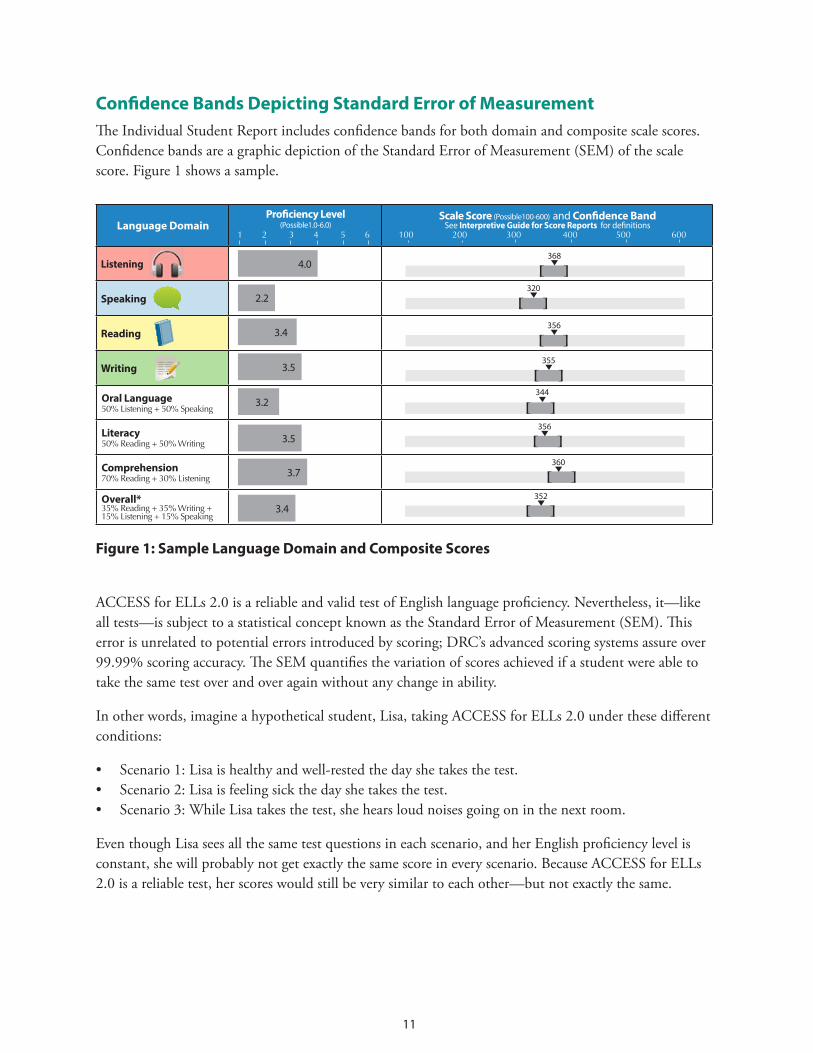
Confidence Bands Depicting Standard Error of Measurement The Individual Student Report includes confidence bands for both domain and composite scale scores. Confidence bands are a graphic depiction of the Standard Error of Measurement (SEM) of the scale score. Figure 1 shows a sample.
Figure 1: Sample Language Domain and Composite Scores
ACCESS for ELLs 2.0 is a reliable and valid test of English language proficiency. Nevertheless, it—like all tests—is subject to a statistical concept known as the Standard Error of Measurement (SEM). This error is unrelated to potential errors introduced by scoring; DRC’s advanced scoring systems assure over 99.99% scoring accuracy. The SEM quantifies the variation of scores achieved if a student were able to take the same test over and over again without any change in ability.
In other words, imagine a hypothetical student, Lisa, taking ACCESS for ELLs 2.0 under these different conditions:
• Scenario 1: Lisa is healthy and well-rested the day she takes the test.• Scenario 2: Lisa is feeling sick the day she takes the test.• Scenario 3: While Lisa takes the test, she hears loud noises going on in the next room.
Even though Lisa sees all the same test questions in each scenario, and her English proficiency level is constant, she will probably not get exactly the same score in every scenario. Because ACCESS for ELLs 2.0 is a reliable test, her scores would still be very similar to each other—but not exactly the same.
Language DomainProficiency Level
(Possible1.0-6.0)Scale Score (Possible100-600) and Confidence Band
See Interpretive Guide for Score Reports for definitions
Listening
Speaking
Reading
Writing
Oral Language50% Listening + 50% Speaking
Literacy50% Reading + 50% Writing
Comprehension70% Reading + 30% Listening
Overall*35% Reading + 35% Writing + 15% Listening + 15% Speaking
*Overall score is calculated only when all four domains have been assessed. NA: Not available
Domain Proficiency Level Students at this level generally can…
Listening 4
understand oral language in English related to specific topics in school and can participate in class discussions, for example:
• Exchange information and ideas with others• Connect people and events based on oral information
Speaking 2
communicate ideas and information orally in English using language that contains short sentences and everyday words and phrases, for example:
• Share about what, when, or where something happened• Compare objects, people, pictures, events
Reading 3
understand written language related to common topics in school and can participate in class discussions, for example:
• Classify main ideas and examples in written information• Identify main information that tells who, what, when or where something happened
Writing 3communicate in writing in English using language related to common topics in school, for example:
• Describe familiar issues and events • Create stories or short narratives
A1 A2 A3 P1 P2 (P3)
356
344
355
356
320
368
360
352
[ ]
[ ]
[ ]
[ ]
[ ]
[ ]
[ ]
[ ]4.0
3.4
3.5
2.2
3.2
3.5
3.4
3.7
For details regarding the scores on this report, refer to the Interpretive Guide for Score Reports at www.wida.us/scorereport
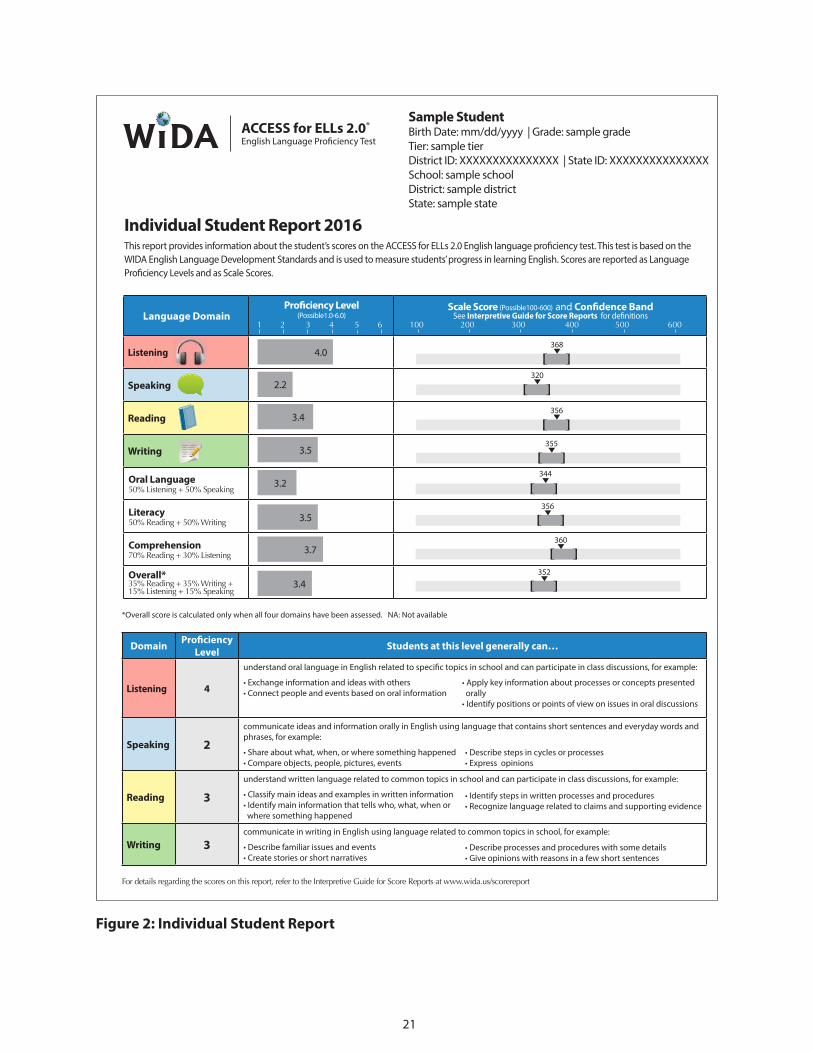
Individual Student Report 2016 This report provides information about the student’s scores on the ACCESS for ELLs 2.0 English language proficiency test. This test is based on the WIDA English Language Development Standards and is used to measure students’ progress in learning English. Scores are reported as Language Proficiency Levels and as Scale Scores.
ACCESS for ELLs 2.0® English Language Proficiency Test
Sample Student Birth Date: mm/dd/yyyy | Grade: sample gradeTier: sample tierDistrict ID: XXXXXXXXXXXXXXX | State ID: XXXXXXXXXXXXXXXSchool: sample schoolDistrict: sample district State: sample state
100 200 300 400 500 6001 2 3 4 5 6
• Describe steps in cycles or processes • Express opinions
• Apply key information about processes or concepts presented orally
• Identify positions or points of view on issues in oral discussions
• Identify steps in written processes and procedures• Recognize language related to claims and supporting evidence
• Describe processes and procedures with some details• Give opinions with reasons in a few short sentences

12
Therefore, ACCESS for ELLs 2.0 uses the SEM, which quantifies this variation. Applying the SEM, confidence bands are calculated to show a range of scores—so even if Lisa took the test under one of the other scenarios, her score would still fall in that range.
In the ACCESS for ELLs 2.0 score report, confidence bands are placed around the student’s score as a graphical representation of the SEM. These bands, which correspond to scale scores and not proficiency level scores, illustrate a student’s possible range of language proficiency based on his or her test score with a 95% probability of accuracy.
The SEMs for domain scores and the SEMs for composite scores are estimated differently. For domain scores, the SEMs are computed based on modern test theory using conditional SEMs; that is, each score on a domain test form (e.g., Reading, Grades 4–5, Tier A) has a different estimated SEM. For composite scores, the SEMs are estimated based on classical test theory and each composite score (e.g., Literacy, Grades 4–5) has the same SEM.
Confidence bands are important, as they remind test users that a single test score represents a range of possible outcomes and should never be interpreted as the only possible outcome.
Statistically speaking, the confidence bands, such as those used for ACCESS for ELLs 2.0, assure that there is a 95% probability that the student’s average score, if he or she were to take the test over and over again, is within the Confidence Band reported on the score report.
13
Part II: Kindergarten ACCESS for ELLs 2.0 Scores Most of the information about ACCESS for ELLs 2.0 applies to all students in Grades K–12. However, Kindergarten scores are reported and interpreted differently. This is because the kind of preliteracy that is developmentally appropriate for Kindergarten students is not fully comparable with the literacy and language of the other grades.
The original WIDA English Language Proficiency Standards (2004) guided the initial development of ACCESS for ELLs. The 2004 Edition of the standards described model performance indicators (MPI) for a K–2 grade-level cluster. The second edition of the WIDA English Language Proficiency Standards (2007) separated Kindergarten from Grades 1–2 and instead placed it within a Kindergarten set of MPIs. The 2007 Edition of the Standards were used to develop the current Kindergarten ACCESS test which was introduced in the 2008–09 school year. The ACCESS for ELLs Kindergarten assessment remains a paper-based, face-to-face test.
The Kindergarten test form is individually administered and adaptive. Additional features embedded in the test design make it developmentally appropriate for this age group.
• Reading and Writing items allow students to demonstrate preliteracy skills that many Kindergarteners are still in the process of acquiring.
• Rather than including a wide variety of themes and topics as the different domains are assessed, tasks for all four domains were developed around just two unifying themes, a narrative text and an expository text. This minimizes the number of cognitive leaps a student has to make within each test domain.
• Many items involve the use of manipulative cards to engage the students in familiar types of activities.
All of these characteristics were designed to help create a developmentally appropriate instrument.
Differences between Kindergarten Scores and Grades 1–12 ScoresLimited Scale Score Range
While the entire range of possible scale scores for the entire battery of ACCESS for ELLs 2.0 forms (K–12) is 100–600, the possible scale score range specifically for the Kindergarten ACCESS test form is 100–400.
Two Types of Proficiency Level Scores
Two types of individualized reports are created for Kindergarten students. The Individual Student Report contains two proficiency level interpretations for teachers. One is for instructional purposes (marked by the prefix “K”). The other is for accountability purposes, and can be used as a baseline to monitor growth over time. The difference between the two is explained further on page 24, where a sample Kindergarten Individual Student Report can be viewed.
Two proficiency level interpretations are provided for Kindergarten ACCESS, one for instructional purposes and the other for accountability purposes. The instructional scores will be marked by the prefix K, for example, K2.8.

14
The other kind of Kindergarten report is designed for Parents/Guardians. It is further explained on page 27.
Rationale for two Proficiency Levels
The Model Performance Indicators (MPIs – see the 2012 Amplified WIDA Standards) for Kindergarten are more developmentally appropriate for Kindergarten students because they place more emphasis on preliteracy skills at lower proficiency levels. Only at the higher proficiency levels were students actually demonstrating the ability to read and write, marking the start of their journey to develop academic English language proficiency.
Therefore, a Kindergarten student getting a high raw score is still not demonstrating the same literacy level or command of a range of topics and themes as a student in the other grades. Scale scores work by mapping the performances of student in all grades onto the same scale. Because the Kindergarten test does not cover all the same skills as Grades 1–12, it does not make use of the full scale. That is why the possible scale score range for Kindergarten is 100–400.
Most decisions about students use the overall composite proficiency level, in which literacy skills are weighted heavily. While WIDA always advocates the use of multiple criteria for high-stakes decision-making, it is reasonable to acknowledge that test scores play an important role. Since there is a lack of research on how well preliteracy skills predict ELLs’ future performance in school, the instructional cut scores established in the Kindergarten ACCESS standards setting study, particularly for Reading and Writing, may not be adequate predictors of future academic success. If they were to be used as criteria for exit from support services, this could lead to many Kindergarten students being placed out of English language support services without sufficient evidence that they are ready to continue building their literacy skills without such support. Thus, after reviewing the impact of applying the current operational cut scores that are along the same scale as Grades 1–12, the WIDA Consortium Board decided that these cuts scores should remain in effect to inform program design and instruction and that a separate set of cut scores should be used for accountability purposes.
The instructional proficiency levels are based on interpretations of the Kindergarten standards and take into account preliteracy skills. Teachers may use these scores to plan instruction for their ELL students.
The accountability scores can be used as a baseline to monitor growth over time.

15
The following table graphically illustrates the relationship between the instructional proficiency levels and the accountability proficiency levels for the domain of Writing. The accountability levels are superimposed on the instructional levels, with a scale score range of 100–600 (please note that while all grades on ACCESS share a common scale, scale scores on Kindergarten ACCESS do not exceed a score of 400).
Accountability Proficiency Level
1 2 3 4 5 6
Instructional Proficiency Level
K1 K2 K3 K4 K5 K6
Scale Score 100 400
Table 3: Comparing Accountability and Instructional Proficiency Levels for Kindergarten Writing
It can be seen that a student would have to be rated as a high K3 in order to place into accountability Proficiency Level 2. This is because in Grades 1–2, even at the lowest proficiency level (1.0), the MPIs assume that the student can do some basic writing, at least copying, and at Level 2.0, that the student is writing at least at the word level. However, in the Kindergarten MPIs, Levels K1.0, K2.0 and K3.0 tend to show a progression of “prewriting” activities. At Level K1.0, the student is generally drawing, at Level K2.0, the student is generally copying, often only at the level of letters (rather than words). At Level K3.0, the child may be copying at the word level.
Therefore, the instructional proficiency levels are based on interpretations of the Kindergarten ELD standards, in which the first three levels describe preliteracy writing skills such as tracing and copying, all of which are subsumed under Proficiency Level 1 in the Grade-level Cluster 1–2 Standards.
Because it may be easier to conceptualize the differences between the two types of proficiency level interpretations when viewing what the score reports actually look like, examples and further clarifications and suggestions begin on page 24.

16
Part III: ACCESS for ELLs 2.0 Score Reports
IntroductionThis section details the information contained in each of the ACCESS for ELLs 2.0 score reports and explains potential use of the data in various contexts. Table 4 summarizes the target audience or stakeholders for each score report and the types of information available from the test. Along with the score reports, teachers and administrators are encouraged to interpret ELL’s performance by referring to the WIDA ELD Standards (2004, 2007, 2012) and Can Do Descriptors.
Score Report Audience or Stakeholder Types of Information Potential Uses
Individual Student
• Students• Parents/Guardians• Teachers• School Teams
Individual student’s scores for each language domain, and four composites: Oral Language, Literacy, Comprehension, and Overall Score.
Reported scores:• scale scores • confidence bands • language proficiency levels
This report is available in multiple languages through DRC’s WIDA AMS system.
Share with parents at parent/teacher conferences
Share with all teachers who work with ELLs in order to inform classroom instruction and assessment
Parent/ Guardian (Kindergarten only)
• Students• Parents/Guardians• Teachers• School Teams
Proficiency levels for each language domain and composite score. This report is available in multiple languages through DRC’s WIDA AMS system.
Share with parents at parent/teacher conferences
Kindergarten Individual Student
• Teachers• Administrators• School Teams
Individual student’s scores for each language domain and composite score.
Reported scores:• scale scores • confidence bands • proficiency level for accountability
purposes• proficiency level for instructional
purposes
Share with all teachers who work with ELLs in order to inform classroom instruction and assessment

17
Score Report Audience or Stakeholder Types of Information Potential Uses
Student Roster • Teachers• Program
Coordinators/ Directors
• Administrators
Scale scores and language proficiency levels for each language domain and composite score by school, grade, student, tier, and grade-level cluster
Share with grade level teams of teachers to inform classroom instruction and assessment
School Frequency
• Program Coordinators/ Directors
• Administrators
Number of students and percent of total tested at each proficiency level for each language domain and composite score for a single grade within a school
Share with all building staff, use to inform building level programmatic decisions
District Frequency
• Program Coordinators/ Directors
• Administrators• Boards of
Education
Number of students and percent of total tested at each proficiency level for each language domain and composite score.
Share with district staff, use to inform district level programmatic decisions
Table 4: ACCESS for ELLs 2.0 Score Reports, Audiences, Types of Information, and Potential Uses
Suggestions on How to Use ACCESS for ELLs 2.0 ScoresThe Interpretive Guide for Score Reports, 2016, is a resource for all member states in the WIDA Consortium. As the Consortium is currently comprised of multiple member states, this guide presents overarching suggestions with broad applicability. It is intended to assist stakeholders familiar with the test in interpreting the scores and using the information to help describe the English language proficiency of their ELLs. Individual member states are welcome to supplement this information.
ACCESS for ELLs 2.0 is an English language proficiency (ELP) test that is a representation of the WIDA ELD Standards. As such, stakeholders should note that ACCESS for ELLs 2.0 is a standards-referenced assessment. Stakeholders should take time to discuss the meaning of the results in relation to the standards and how the results affect the services, curriculum, instruction, and classroom assessment of ELLs.
Before examining data in the score reports, teachers and administrators should familiarize themselves with the WIDA Performance Definitions and Can Do Descriptors, Key Uses Edition. The Performance Definitions are in Appendix A. The Can Do Descriptors are on the WIDA website. A more detailed discussion of the Can Do Descriptors is in the next section.
18
The following are suggestions for disseminating ACCESS for ELLs 2.0 score results:
• Target certain reports to specific stakeholders. Perhaps add a rationale for state or local policies or procedures that are being contemplated, formulated, or implemented based on test results. Provide a state specific context that will help administrators and teachers understand the meaning and significance of the reports.
• Offer professional development opportunities to the various stakeholders impacted by the results to help them better understand scores and how to use them. For teachers, in particular, ensure that the test results are referenced to the ELD Standards. For purposes of interpreting the scores and information, present examples of reports of students/schools (with their identities withheld) for discussion.
• Summarize or consolidate the suggestions for using the information from each score report to target specific audiences. In the case of the Individual Student Report, any additional information accompanying the report should be parent friendly and translated into your state’s major languages.
• Examine different configurations of the data in the reports (by language domain and combinations of language domains, including the overall score) for individual and groups of students (such as by grade or tier) to develop a statewide, district or school plan for organizing services for ELLs for the upcoming school year.
• Archive copies of the guide along with copies of the score reports so that new personnel can become familiar with data from ACCESS for ELLs 2.0.
Can Do Descriptors The Can Do Descriptors, Key Use Edition provide examples of what students can do at various levels of English language proficiency in Listening, Speaking, Reading, and Writing. The descriptors inform the use of ACCESS for ELLs 2.0 scores as they may assist teachers and administrators in interpreting the meaning of the scores. Educators should be using the Can Do Descriptors in conjunction with the other components of the WIDA Standards Framework including Performance Definitions and Model Performance Indicators along with the previous edition of the Can Do Descriptors.
The Can Do Descriptors are organized by grade-level bands: K, 1, 2–3, 4–5, 6–8, and 9–12 and correspond to those in ACCESS for ELLs 2.0. Within each grade-level band, the descriptors are organized by Key Use: Recount, Explain, Argue, and Discuss and within each Key Use, there are examples across WIDA’s six levels of language proficiency.
The WIDA ELD Standards as well as the Can Do Descriptors, Key Uses Edition can be found on the WIDA Consortium website at www.wida.us.
19
Individual Student Report
About This ReportThe Individual Student Report contains detailed information about the performance of a single student within Grades 1–12. Its primary users are students, parents/guardians, teachers, and school teams.
The Individual Student Report is provided in English. Translations of the report are available in 46 additional languages through DRC’s WIDA AMS system. The translated report should accompany (not replace) the official report in English. The list of languages and the Spanish translation are included in Appendix B.
Communication with the student’s parents/guardians is important. Whenever possible, send a letter in the family’s native language along with the Individual Student Reports in English. A sample letter is provided in Appendix C.
Report at a GlanceDemographic Information about the Student
Identifying information is located at the top right of the score report. This consists of the student’s name (last, first, and middle initial), date of birth, grade, and test tier, as well as state and district identification numbers, school, district, and state.
Student’s English Language Proficiency Level by Language Domains
Results of ACCESS for ELLs 2.0 are reported by test section.
ACCESS for ELLs 2.0 assesses language in four domains (Listening, Speaking, Reading, Writing). In the score report, each language domain is represented by a label, icon, and visual display of the results.
The four domain scores are followed by the four composite scores (Oral Language, Literacy, Comprehension, Overall Score). In the score report, each composite score is represented by a label, a breakdown of how individual domains are used to calculate it, and a visual display of the results.
The proficiency level is presented both graphically and as a whole number followed by a decimal. The shaded bar of the graph reflects the exact position of the student’s performance on the six point ELP scale. The whole number reflects a student’s ELP level (1–Entering, 2–Emerging, 3–Developing, 4–Expanding, 5–Bridging, and 6–Reaching) in accord with the WIDA ELD Standards. ELLs who obtain Level 6, Reaching, have moved through the entire second language continuum, as defined by the test.
The decimal indicates the proportion within the proficiency level range that the student’s scale score represents, rounded to the nearest tenth. For example, a proficiency level score of 3.5 is half way between the 3.0 and 4.0 cut scores.
To the right of the proficiency level is the reported scale score and resultant confidence band. The confidence band reflects the Standard Error of Measurement (SEM) of the scale score, a statistical calculation of a student’s likelihood of scoring within a particular range of scores if he or she were to take

20
the same test repeatedly without any change in ability. Confidence bands are important because they remind test users that a single test score represents a range of possible outcomes and should never be interpreted as the only possible outcome.
If a student does not complete one or more language domain(s), NA (Not Available) is inserted in that language domain as well as all applicable composite scores, including the Overall Score.
As discussed in Part I of this document, students with identical Overall Scores may have very different profiles in terms of their oral language and literacy development.
Description of English Language Proficiency Levels
The Individual Student Report provides information about the proficiency levels obtained by the student and describes what many students at the reported proficiency level may be expected to be able to do in English. For example, if the student received a proficiency level score of 2.2 for Speaking, his or her report will include a description of the type of spoken language he or she may be expected to be able to produce.
Figure 2 shows a sample Individual Student Report.
How to Use This ReportFor Parents/Guardians
• This report gives information on a student’s English language proficiency, the language needed to access content and succeed in school; it does not give information on a student’s academic achievement or knowledge of the content areas. It provides family members and students (and other stakeholders) with a graphic representation of the extent to which an ELL listens, speaks, reads, and writes English. It also provides information on a student’s Oral Language, Literacy, Comprehension and Overall Score based on the WIDA ELD Standards.
• The report shows how much English a student has acquired in each language domain as indicated by the levels of English language proficiency.
• Oral language development (listening and speaking) contributes to literacy (reading and writing) development. Generally, the acquisition of oral language outpaces that of literacy. Likewise, acquisition of receptive language (listening and reading), generally proceeds at a faster rate than that for productive language (speaking and writing). Of the four language domains, Writing is usually the last for ELLs to master.
• The students’ foundation in their home or primary language is a predictor of their English language development. Those who have strong literacy backgrounds in their native language will most likely acquire literacy in English at a quicker pace than those students who do not. Therefore, for some students, gains in their English language proficiency may be explained by their performance in their primary language.
• The Individual Student Report describes one indicator of a student’s English language proficiency—the extent to which the student has acquired listening, speaking, reading, and writing—that is reflective of an ELP test given on an annual basis. School work and local assessment throughout the year provide evidence from additional sources of a student’s English language development.
21
Language DomainProficiency Level
(Possible1.0-6.0)Scale Score (Possible100-600) and Confidence Band
See Interpretive Guide for Score Reports for definitions
Listening
Speaking
Reading
Writing
Oral Language50% Listening + 50% Speaking
Literacy50% Reading + 50% Writing
Comprehension70% Reading + 30% Listening
Overall*35% Reading + 35% Writing + 15% Listening + 15% Speaking
*Overall score is calculated only when all four domains have been assessed. NA: Not available
Domain Proficiency Level Students at this level generally can…
Listening 4
understand oral language in English related to specific topics in school and can participate in class discussions, for example:
• Exchange information and ideas with others• Connect people and events based on oral information
Speaking 2
communicate ideas and information orally in English using language that contains short sentences and everyday words and phrases, for example:
• Share about what, when, or where something happened• Compare objects, people, pictures, events
Reading 3
understand written language related to common topics in school and can participate in class discussions, for example:
• Classify main ideas and examples in written information• Identify main information that tells who, what, when or where something happened
Writing 3communicate in writing in English using language related to common topics in school, for example:
• Describe familiar issues and events • Create stories or short narratives
A1 A2 A3 P1 P2 (P3)
356
344
355
356
320
368
360
352
[ ]
[ ]
[ ]
[ ]
[ ]
[ ]
[ ]
[ ]4.0
3.4
3.5
2.2
3.2
3.5
3.4
3.7
For details regarding the scores on this report, refer to the Interpretive Guide for Score Reports at www.wida.us/scorereport
Individual Student Report 2016 This report provides information about the student’s scores on the ACCESS for ELLs 2.0 English language proficiency test. This test is based on the WIDA English Language Development Standards and is used to measure students’ progress in learning English. Scores are reported as Language Proficiency Levels and as Scale Scores.
ACCESS for ELLs 2.0® English Language Proficiency Test
Sample Student Birth Date: mm/dd/yyyy | Grade: sample gradeTier: sample tierDistrict ID: XXXXXXXXXXXXXXX | State ID: XXXXXXXXXXXXXXXSchool: sample schoolDistrict: sample district State: sample state
100 200 300 400 500 6001 2 3 4 5 6
• Describe steps in cycles or processes • Express opinions
• Apply key information about processes or concepts presented orally
• Identify positions or points of view on issues in oral discussions
• Identify steps in written processes and procedures• Recognize language related to claims and supporting evidence
• Describe processes and procedures with some details• Give opinions with reasons in a few short sentences
Figure 2: Individual Student Report
22
• A baseline is established the first time a student takes a test. To determine year to year progress of a student’s English language proficiency, reports of results from ACCESS for ELLs 2.0 for two consecutive years need to be compared. Three or more consecutive years of results from ACCESS for ELLs 2.0 establish ELP trend data for that student.
• Share information from the report with family members, such as at parent conferences or family nights, or during home visits. The Can Do Descriptors that describe the expectations of ELLs at each level of English language proficiency may be a helpful tool to share with family members (and they are available in Spanish). Teachers might explain the results from ACCESS for ELLs 2.0 by showing what their student “can do” in each language domain.
• Information from the Individual Student Report may be useful in meetings at school (for example, for Pre-referral Teams, School Improvement, or local Boards of Education), when family members are present, in explaining a student’s English language proficiency. To the extent feasible, family members should receive the Individual Student Report in their native language and in English (available at www.wida.us).
For Teachers
• Data generated from ACCESS for ELLs 2.0 are based on the WIDA ELD Standards. The results, by being standards-referenced, help inform curriculum, instruction, and assessment of ELLs. This information, along with the Can Do Descriptors of expected student performance at each level of English language proficiency, is a starting point for teacher planning and collaboration.
• The Overall Score is a single number that is a summary of a student’s global language proficiency. It is compensatory. As such, high scores in some language domains may raise low scores in other domains. Students with the same Overall Score may have different ELP profiles. Therefore, a student’s performance in individual domains should be examined to determine the relative strength of each language domain and its contribution to the varying composites (Oral Language, Literacy, and Comprehension).
• The scale scores and proficiency levels yield a profile of a student’s English language proficiency. The individual components of the profile may serve as the basis for differentiating instruction and assessment. As there is a strong relationship between scores on ACCESS for ELLs 2.0 and the WIDA ELD Standards, ideas for differentiation for the varying levels of language proficiency can be taken from the standards’ strands of model performance indicators.
• No single score or language proficiency level, including the Overall Score (Composite) and its corresponding proficiency level, should be used as the sole determiner for making decisions regarding a student’s English language proficiency.
• Sharing student information from score reports is encouraged for all educators who work with ELLs. This information may be useful in serving as one criterion for entry and exit decisions, determining the extent and type of language service, suggesting placement in classes, or curriculum planning.
• The data in the reports need to be contextualized to be meaningful; that is, to the extent possible, include both previous test scores and demographic information on the students when presenting the results. In addition, when disseminating information on the students’ productive language, refer to criteria in the Speaking and Writing Rubrics. In addition, the Can Do Descriptors may help further explain student expectations at each level of English language proficiency.

23
• As each language domain has its own scale, comparisons cannot be made across Listening, Speaking, Reading, and Writing based on scale scores. For example, a scale score of 425 in Listening is not indicative of the same language proficiency level as that for the identical scale score in Speaking. In contrast, the proficiency levels (as scale score interpretations) may be used to make comparisons across domains.
• A student’s progress or growth in English language proficiency can only be determined when two consecutive years of data are available.
Speaking and Writing Interpretive RubricsTwo interpretive rubrics are useful in interpreting performance-based information in this score report. They are the WIDA Speaking Rubric and the WIDA Writing Rubric (see Appendix D).
These rubrics may be used to help interpret the ACCESS for ELLs 2.0 Speaking and Writing scores and also to help inform instructional practices. The interpretive rubrics provide detailed information on the types of spoken and written language proficiency students may be expected to exhibit, based on their reported proficiency levels.
For example, the Sentence Level descriptions of the rubric address language forms and conventions. One characteristic of Level 2 (Emerging) is “repetitive sentence and phrasal patterns and formulaic grammatical structures used in social and instructional situations or across content areas.” Students at this level of proficiency may benefit from classroom activities which focus on improving their ability to use a wider range of written phrases and structures.
However, these rubrics are not used for operational scoring of the Speaking and Writing domains.
Speaking and Writing Scoring ScalesFor operational scoring, raters use the Speaking Scoring Scale and the Writing Scoring Scale (see Appendix E). The scoring scales are derived from the interpretive rubrics. The differences between the interpretive rubrics and the scoring scales may seem subtle but are in fact important.
The scoring scales are designed to be as straightforward as possible for use in operational scoring, with the goal of maximizing rater reliability. For this reason, the scoring scales present less detailed descriptions of student performance than within the the interpretive rubrics. The aim of the scoring scales is to retain the detail that is most important for raters to reliably score a student speaking or writing performance. These scales are for operational scoring only and should not be used to interpret test scores or inform classroom instruction.
Interpretive Rubrics Scoring Scales
Used by teachers to understand scores and incorporate them into instruction.
Used by trained raters to assign scores operationally.

24
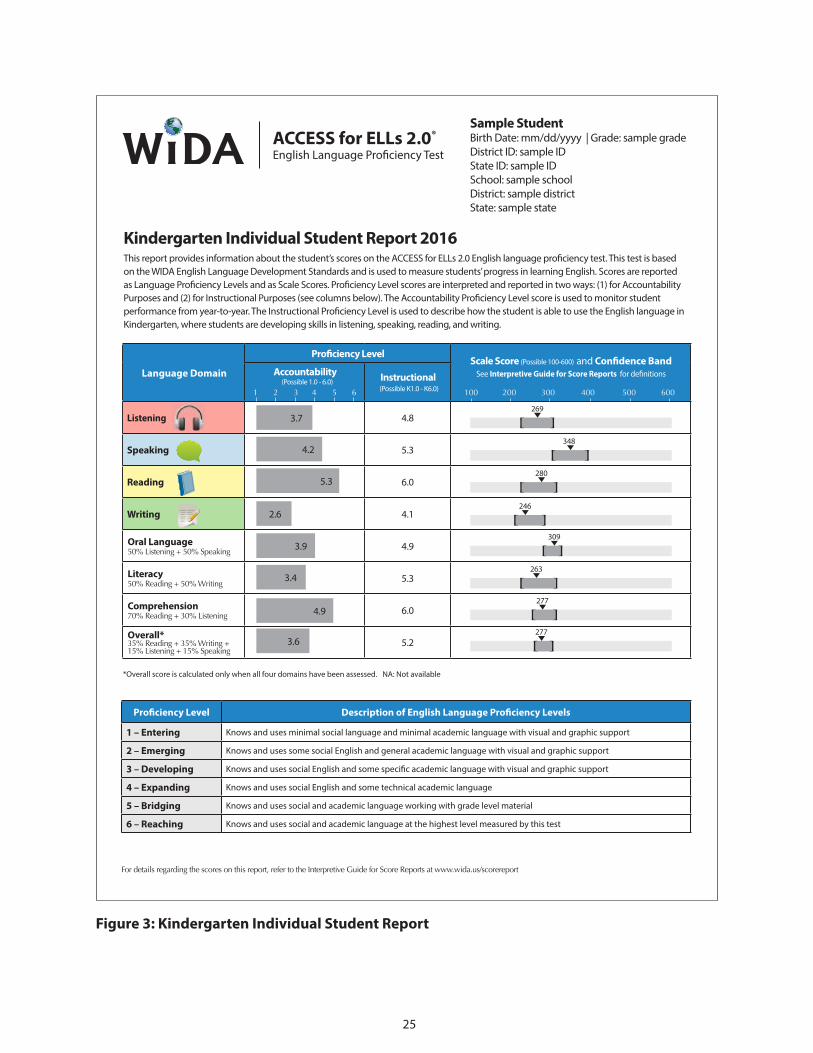
Kindergarten Individual Student Report
About This ReportThe Kindergarten Individual Student Report contains detailed information about the performance of a single kindergarten student. Its primary users are teachers, administrators, and school teams.
Report at a GlanceThe Kindergarten Individual Student Report is identical in layout and content to the Individual Score Report for Grades 1–12 as described above, save for one key difference: for Kindergarten, two proficiency level interpretations are provided.
Proficiency Level Scores—Accountability Purposes
The accountability proficiency levels are interpretations of the scale scores. They are indicated by a shaded bar that reflects the exact position of the student on the six point ELP scale and a whole number followed by a decimal. The decimal indicates the proportion within the proficiency level range that the student’s scale score represents, rounded to the nearest tenth. For example, a proficiency level score of 3.5 is half way between the 3.0 and 4.0 cut scores.
The accountability proficiency levels for Kindergarten are on the same scale and have the same meaning as proficiency level scores for Grades 1–12. They may also be compared to a school or district’s Kindergarten proficiency level scores from previous years.
When proficiency level scores (rather than scale scores) are used for accountability purposes, including charting student progress over time, scores from the Kindergarten year serve as the baseline data. By starting with the Kindergarten accountability proficiency level, schools and districts will be able to chart student progress over time. If the instructional score was used for this purpose, it might look as though many students lost English language proficiency between Kindergarten and first grade, due to the higher literacy demands on the Grades 1–12 assessments.
Proficiency Level Scores—Instructional Purposes
Like the accountability proficiency levels, the instructional proficiency levels—denoted by a prefix “K,”—are also interpretations of the scale scores.
The instructional proficiency levels appear to the right of the accountability proficiency levels. To help differentiate them, the instructional proficiency levels appear as a numeral only, without a shaded bar graph.
Instructional proficiency levels do not have the same meaning as proficiency level scores for Grades 1–12. This is because they are based on the Kindergarten Model Performance Indicators, which progress from preliteracy skills at the lower levels to more advanced reading and writing tasks as students approach academic language proficiency.
25
Language Domain
Proficiency LevelScale Score (Possible 100-600) and Confidence Band
See Interpretive Guide for Score Reports for definitionsAccountability (Possible 1.0 - 6.0) Instructional
(Possible K1.0 - K6.0)
Listening 4.8
Speaking 5.3
Reading 6.0
Writing 4.1
Oral Language50% Listening + 50% Speaking 4.9
Literacy50% Reading + 50% Writing 5.3
Comprehension70% Reading + 30% Listening 6.0
Overall* 35% Reading + 35% Writing + 15% Listening + 15% Speaking
5.2
*Overall score is calculated only when all four domains have been assessed. NA: Not available
Proficiency Level Description of English Language Proficiency Levels
1 – Entering Knows and uses minimal social language and minimal academic language with visual and graphic support
2 – Emerging Knows and uses some social English and general academic language with visual and graphic support
3 – Developing Knows and uses social English and some specific academic language with visual and graphic support
4 – Expanding Knows and uses social English and some technical academic language
5 – Bridging Knows and uses social and academic language working with grade level material
6 – Reaching Knows and uses social and academic language at the highest level measured by this test
1 2 3 4 5 6
Kindergarten Individual Student Report 2016 This report provides information about the student’s scores on the ACCESS for ELLs 2.0 English language proficiency test. This test is based on the WIDA English Language Development Standards and is used to measure students’ progress in learning English. Scores are reported as Language Proficiency Levels and as Scale Scores. Proficiency Level scores are interpreted and reported in two ways: (1) for Accountability Purposes and (2) for Instructional Purposes (see columns below). The Accountability Proficiency Level score is used to monitor student performance from year-to-year. The Instructional Proficiency Level is used to describe how the student is able to use the English language in Kindergarten, where students are developing skills in listening, speaking, reading, and writing.
269
348
280
246
309
263
277
277
[ ]
[ ]
[ ]
[ ]
[ ]
[ ]
[ ]
[ ]
ACCESS for ELLs 2.0® English Language Proficiency Test
3.7
5.3
4.2
3.9
3.4
3.6
2.6
4.9
For details regarding the scores on this report, refer to the Interpretive Guide for Score Reports at www.wida.us/scorereport
100 200 300 400 500 600
Sample Student Birth Date: mm/dd/yyyy | Grade: sample gradeDistrict ID: sample ID State ID: sample IDSchool: sample schoolDistrict: sample district State: sample state
Figure 3: Kindergarten Individual Student Report

26
For teachers, the most important information to be gleaned from test results is how individual students are performing in relation to standards developed with their age and grade level in mind. The instructional proficiency level scores provide this information about Kindergarteners, so they can be used along with the WIDA ELD Standards or Can Do Descriptors to help teachers create lessons geared toward and intended to advance a student’s level of language proficiency.
Figure 3 shows a sample Kindergarten Individual Student Report.
How to Use This Report• The Description of English Language Proficiency Levels at the bottom of the report provides a brief
summary of all six proficiency levels. This will help educators put the proficiency level attained by their students in context.
• Educators who work with Kindergarten ELL students can find that suggested uses of information in the Individual Student Report for Grades 1–12 (on page 20) also apply to Kindergarten students.
• To determine which of the proficiency levels to look at, think about whether the intended use has to do with instruction in individual classrooms and what individual students can work on (instructional proficiency levels) or whether the intent is to form some kind of comparison—to the proficiency levels attained by students in other grades, for example, or to compare a single student’s gains in proficiency from one year to the next. In that case, accountability proficiency levels would be more appropriate.
• For schools deciding where to place students in first grade, the important question is whether a student can be expected to succeed without English language support. The accountability proficiency level score can help guide ELL support decisions for first grade teachers. This score mathematically accounts for the fact that Kindergarten ACCESS measures preliteracy as well as early literacy, and therefore must be lower to protect the ELL placement status of students who may appear to have high levels of English language proficiency according to the instructional scores, but who have yet to fully develop literacy skills, a process that may require support. The accountability scores will be a useful starting point for discussions between Kindergarten and Grade 1 teachers about where students should be placed for the next school year or if they can be exited from ELL support at the end of Kindergarten. Remember, test scores should never be used as the only criterion for high-stakes decision-making. Rather, WIDA recommends the use of multiple criteria including teacher judgment.
27
Parent/Guardian Report (Kindergarten only)
About This ReportThe Parent/Guardian Report contains detailed information about the performance of a single Kindergarten student. Its primary users are students and parents or guardians.
Report at a GlanceThe Parent/Guardian Report is very similar in layout and content to the Individual Student Report for Grades 1–12 as described earlier. Like it, the Parent/Guardian Report contains just one proficiency level score, the one reported to educators as the accountability score.
The Parent/Guardian Report does not include scale scores or confidence bands. Rather, it simply gives each of the student’s proficiency levels both as a number and as a shaded bar.
Figure 4 shows a sample Parent/Guardian Report.
How to Use This Report• The Description of English Language Proficiency Levels at the bottom of the report provides a brief
summary of all six proficiency levels. This will help parents put the proficiency level attained by their children in context. The Parent/Guardian Report also places the formulae used to calculate the composite scores at the bottom of the page.
• Earlier in the document, a number of strategies were introduced when communicating with parents or guardians regarding the Individual Student Report for Grades 1–12. Suggestions included accompanying the score report with a sample letter for parents (see Appendix B) and other tips for communicating the data in the report to parents or guardians (see page 22). These strategies will also help communicate the information in the Kindergarten Parent/Guardian Report.

28
Student’s English Language Proficiency Level
Test Section 1 – Entering 2 – Emerging 3 – Developing 4 – Expanding 5 – Bridging
6– Reaching
Listening
Speaking
Reading
Writing
Oral LanguageA
(Listening and Speaking)
LiteracyB
(Reading and Writing)
ComprehensionC
(Listening and Reading)
OverallD (Listening, Speaking, Reading, and Writing)
Proficiency Level Description of English Language Proficiency Levels
1 – Entering Knows and uses minimal social language and minimal academic language with visual and graphic support
2 – Emerging Knows and uses some social English and general academic language with visual and graphic support
3 – Developing Knows and uses social English and some specific academic language with visual and graphic support
4 – Expanding Knows and uses social English and some technical academic language
5 – Bridging Knows and uses social and academic language working with grade level material
6 – Reaching Knows and uses social and academic language at the highest level measured by this test
Other Information
Test Section Is Blank – If the student was absent for this Section of the testA – Oral Language = 50% Listening + 50% Speaking – will be blank if student was absent for one or both of the SectionsB – Literacy = 50% Reading + 50% Writing – will be blank if student was absent for one or both of the SectionsC – Comprehension Score = 70% Reading + 30% Listening - will be blank if student was absent for one or both of the
SectionsD – Overall Score = 35% Reading + 35% Writing + 15% Listening + 15% Speaking - will be blank if student was absent for
one or more of the Sections
District: Student:
School: State ID: District ID:
Grade: Birth Date:
Report Purpose: This report gives information about your child’s level of social and academic English language proficiency. Social language is used to communicate for everyday purposes. Academic language is used to communicate the content of language arts, mathematics, science, and social studies.
Parent/Guardian Report 2016
K-PG-RPT
ACCESS for ELLs 2.0® English Language Proficiency Test
Figure 4: Blank Parent/Guardian Report

29
Student Roster Report
About This ReportThe Student Roster Report contains information on a group of students within a single school and grade. It provides scale scores for individual students on each language domain and composite score are provided, identical to those in the Individual Student Report. Its intended users are teachers, program coordinators/directors, and administrators.
Report at a GlanceThe only information from the Individual Student Report that does not carry over to the Student Roster Report is the confidence bands. The information is also presented more compactly. The table format allows the performances of multiple individuals to be viewed at once.
Demographic Information
The top of the report shows the district, school, and grade. Student names and their state IDs are listed along the left, followed by tier and grade-level cluster.
• Tier: ACCESS for ELLs 2.0 has three forms within a grade-level cluster (except Kindergarten). Tier refers to the form of the test administered that roughly corresponds to a student’s position along the second language acquisition continuum: Tier A (Beginning); Tier B (Intermediate); or Tier C (Advanced).
• Cluster: ACCESS for ELLs 2.0 is divided into grade-level clusters that mirror those of the ELD Standards (see page 4). While the Individual Student Report includes information on the student’s grade and tier, the Student Roster Report also includes grade-level cluster.
Scale Scores
Scale scores for individual students on each language domain (Listening, Speaking, Reading, and Writing) and composite score (Oral Language, Literacy, Comprehension, and Overall Score) are provided. They are identical to those in the Individual Student Report.
Proficiency Levels
Each scale score is interpreted into an ELP level, presented as a whole number and a decimal. The whole number indicates the student’s ELP level as based on the WIDA ELD Standards (1–Entering, 2–Emerging, 3–Developing, 4–Expanding, 5–Bridging, and 6–Reaching). The decimal indicates the proportion within the proficiency level range that the student’s scale score represents, rounded to the nearest tenth. For example, a student at language proficiency level 4.5 has a scale score that falls half way between the cut points for Level 4 and for Level 5.
Figure 5 shows a sample Student Roster Report.

30
ACC
ESS
for E
LLs
2.0®
Engl
ish
Lang
uage
Pro
ficie
ncy
Test
Dist
rict:
Scho
ol:
Gra
de:
Stud
ent R
oste
r Rep
ort –
201
6ST
UDEN
T NAM
E ST
ATE S
TUDE
NT ID
Tier
Clus
ter
Liste
ning
Spea
king
Read
ing
Writ
ing
Oral
Lang
uage
ALit
erac
yBCo
mpr
ehen
sionC
Over
all S
core
D
Scale
Sc
ore
Prof
Le
vel
Scale
Sc
ore
Prof
Le
vel
Scale
Sc
ore
Prof
Le
vel
Scale
Sc
ore
Prof
Le
vel
Scale
Sc
ore
Prof
Le
vel
Scale
Sc
ore
Prof
Le
vel
Scale
Sc
ore
Prof
Le
vel
Scale
Sc
ore
Prof
Le
vel
A –
Ora
l Lan
guag
e =
50%
Lis
teni
ng +
50%
Spe
akin
g B
– Li
tera
cy =
50%
Rea
ding
+ 5
0% W
ritin
gO
vera
ll Sc
ores
are
com
pute
d w
hen
all 4
dom
ains
hav
e be
en c
ompl
eted
N
A –
Not
Available
= St
uden
t Boo
klet
is m
arke
d w
ith a
Non
-Sco
ring
Code
of
C –
Com
preh
ensi
on =
70%
Rea
ding
+ 3
0% L
iste
ning
Abs
ent,
Inva
lidat
e, D
eclin
ed o
r Def
erre
d Sp
ecia
l Edu
catio
n/50
4 D
– O
vera
ll Sc
ore
= 35
% R
eadi
ng +
35%
Writ
ing
+ 15
% L
iste
ning
+ 1
5% S
peak
ing
Figure 5: Blank Student Roster Report
31
How to Use This Report • As ACCESS for ELLs 2.0 is standards-referenced, any comparison should be made between students
in relation to the standards. It is not intended for teachers or administrators to make comparisons between students or grades.
• School or district administrators, including coordinators or directors of language services, principals and assistant superintendents may examine the scores from each language domain within a tier and grade-level cluster to detect any patterns in student performance. Here are some questions to ask: • What are the similarities and differences in student performance for individual and combined
language domains within a grade and tier?• To what extent are differences attributed to students’ second language development, the design
or delivery of instructional services, or other factors? • Are these differences justifiable or explainable, such as having students enrolled in dual language
programs or having a recent influx of new ELLs?• How might we begin to address these differences using the ELD Standards?
Although these questions may not be easily answered, if there are sizable differences between Listening, Speaking, and Reading in comparison with Writing among groups of students, for example, then further investigation may be warranted.
• This report has both a general estimate of a student’s range of English language proficiency as well as a student’s actual scores and proficiency levels. The general estimate is represented by the tier.
• ACCESS for ELLs 2.0 scale scores form a vertical scale across tiers and grade-level clusters. Each language domain score and composite score are independent and have their own vertical scale. The range of possible scale scores for the entire battery of ACCESS for ELLs 2.0 forms, Kindergarten through grade-level cluster 9–12 is 100–600.
• Some ACCESS for ELLs 2.0 test takers are newcomers, students with limited or interrupted formal schooling, or ELLs whose initial literacy development is in their native language. The proficiency of these students may cluster toward the bottom of the scale. The majority of students fall mid-range along the English language proficiency level scale. At the upper end are those students who have progressed through the continuum of second language acquisition and are approaching the “Reaching” level of English language proficiency.
• In making year-to-year comparisons about students, it might be useful to show gains in both scale scores and language proficiency levels (using numerals and decimals). As there are five levels (with Level 6 meaning the student has completed the continuum), the distance between each proficiency level represents a range of approximately 20%. Therefore, there may be some students who progress within a language proficiency level without crossing over to the next highest one; these gains may want to be captured.
• By having tier, scale score, and language proficiency levels for students by grade and grade-level cluster, the information in this report may be useful in developing school and district improvement plans for ELLs. These data provide a snapshot of the performance of the students at one point in time. (The Individual Student Report has more detailed, individual student information.)
32
• As the Student Roster Report lists all students by tier and grade-level cluster, it may be used as a starting point for grouping students for support services, according to their Overall Score or by their profiles according to language domains. In many elementary schools, for example, students are grouped homogeneously for reading, so that score may be one indicator weighted in the selection process.
• This score report may be useful in examining the profiles of students who are within potential range of exiting support services and to consider what other data sources are needed to make that decision. Conversely, for profiles of other student groups, student results may trigger some ideas for professional development of teachers serving ELLs for the upcoming year.

33
School Frequency Report
About This ReportThe School Frequency Report provides information about the number and percent of tested students to attain each proficiency level within one school and grade. This broader view contrasts with Individual Student Report and Student Roster Report, which both provide information about students at the level of the individual test taker. This report’s primary audience includes program coordinators/directors and administrators.
Report at a GlanceThe six levels of English language proficiency with their brief definitions form the vertical axis of this table. Then, each language domain and combination of domains is divided into two columns. The first column reports how many students scored at each language proficiency level. The second column shows the same group, but as a percentage of the total number of students in that grade tested by the school.
The School Frequency Report provides the highest and lowest scale scores reported in the four language domains for ELLs tested in the stated grade of the specified school. The lowest possible scale score is 100 for Kindergarten; the highest possible scale score is 600, although scale scores over 500 are rare. The difference between the highest and lowest score is the range of performance.
The shaded row at the bottom left-hand side of the page relates the total number of ELLs tested on ACCESS for ELLs 2.0 in the stated grade of the specified school.
Figure 6 shows a sample School Frequency Report.
How to Use This Report• Use the information contained in the report to gain a sense of the school-wide effort in educating
ELLs. Compare results of ELLs with those of proficient English students, in particular, former ELLs who are being monitored as well as other linguistically and culturally diverse students. Use multiple data sources, including performance on their state academic achievement tests, to see if there is any crossover.
• The results should not be generalized unless there are relatively large numbers of students. In low incidence schools, these numbers might be quite small; in urban areas, the numbers of students might be substantially larger.
• Use both the numbers of students at each language proficiency level and the corresponding percents of total tested. If numbers are low, the percents may appear distorted if shown in isolation.
• Information provided in this report may have to be further contextualized to be meaningful; numbers alone cannot explain why the distribution of students assigned to language proficiency levels falls as it does. For example, there may be a rather large proportion of ELLs at the lower end of the continuum in all language domains. The reasons for these results may not be evident unless student demographics and educational history are considered. Perhaps the school recently received new students with limited exposure to English. Perhaps the students in this grade have high degrees of mobility and have not had continuous, uninterrupted schooling.
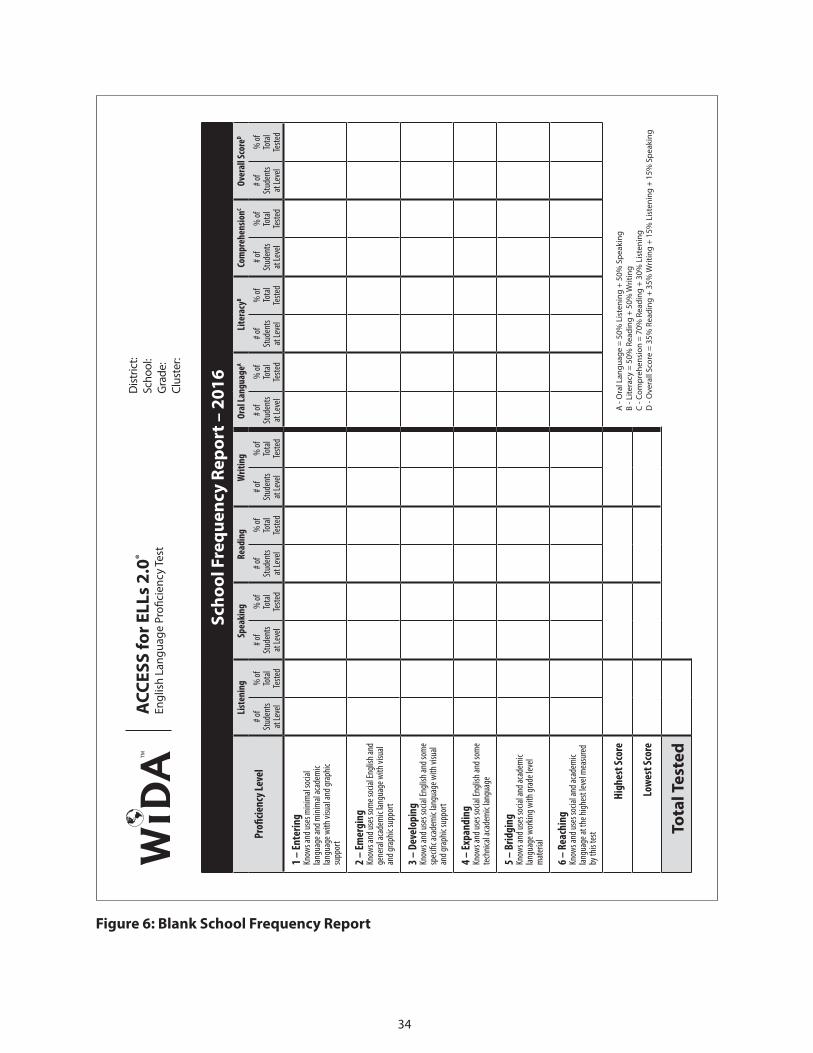
34
Figure 6: Blank School Frequency Report
ACC
ESS
for E
LLs
2.0®
Engl
ish
Lang
uage
Pro
ficie
ncy
Test
Dist
rict:
Scho
ol:
Gra
de:
Clus
ter:
Scho
ol F
requ
ency
Rep
ort –
201
6
Profi
cienc
y Lev
el
Liste
ning
Spea
king
Read
ing
Writ
ing
Oral
Lang
uage
ALit
erac
yBCo
mpr
ehen
sionC
Over
all S
core
D
# of
Stud
ents
at Le
vel
% of
To
tal
Teste
d
# of
Stud
ents
at Le
vel
% of
To
tal
Teste
d
# of
Stud
ents
at Le
vel
% of
To
tal
Teste
d
# of
Stud
ents
at Le
vel
% of
To
tal
Teste
d
# of
Stud
ents
at Le
vel
% of
To
tal
Teste
d
# of
Stud
ents
at Le
vel
% of
To
tal
Teste
d
# of
Stud
ents
at Le
vel
% of
To
tal
Teste
d
# of
Stud
ents
at Le
vel
% of
To
tal
Teste
d
1 – En
terin
gKn
ows a
nd us
es m
inim
al so
cial
langu
age a
nd m
inim
al ac
adem
ic lan
guag
e with
visu
al an
d gra
phic
supp
ort
2 – Em
ergi
ngKn
ows a
nd us
es so
me s
ocial
Engli
sh an
d ge
nera
l aca
dem
ic lan
guag
e with
visu
al an
d gra
phic
supp
ort
3 – D
evel
opin
gKn
ows a
nd us
es so
cial E
nglis
h and
som
e sp
ecifi
c aca
dem
ic lan
guag
e with
visu
al an
d gra
phic
supp
ort
4 – Ex
pand
ing
Know
s and
uses
socia
l Eng
lish a
nd so
me
tech
nical
acad
emic
langu
age
5 – B
ridgi
ngKn
ows a
nd us
es so
cial a
nd ac
adem
ic lan
guag
e wor
king w
ith gr
ade l
evel
mat
erial
6 – R
each
ing
Know
s and
uses
socia
l and
acad
emic
langu
age a
t the
high
est l
evel
mea
sure
d by
this
test
High
est S
core
Lowe
st Sc
ore
Tota
l Tes
ted
A -
Ora
l Lan
guag
e =
50%
Lis
teni
ng +
50%
Spe
akin
g B
- Lite
racy
= 5
0% R
eadi
ng +
50%
Writ
ing
C - C
ompr
ehen
sion
= 7
0% R
eadi
ng +
30%
Lis
teni
ngD
- O
vera
ll Sc
ore
= 35
% R
eadi
ng +
35%
Writ
ing
+ 15
% L
iste
ning
+ 1
5% S
peak
ing

35
District Frequency Report
About This ReportThe presentation of information in this report is identical to that of the School Frequency Report except the numbers and percents refer to ELLs in a stated grade of a specified district rather than a school. Therefore, the descriptions of the features of this report are repeated from those previously stated. This report’s primary audience includes program coordinators/directors, administrators, and boards of education.
Report at a GlanceThe presentation of information in this report is identical to that of the School Frequency Report except the numbers and percents refer to ELLs in a stated grade of a specified district rather than a school. Therefore, the descriptions of the features of this report are repeated from those previously stated.
The six levels of English language proficiency with their brief definitions form the vertical axis of this table. Then, each language domain and combination of domains is divided into two columns. The first column reports how many students scored at each language proficiency level. The second column shows the same group, but as a percentage of the total number of students in that grade tested by the district.
The District Frequency Report provides the highest and lowest scale scores reported in the four language domains for ELLs tested in the stated grade of the specified district. The lowest possible scale score is 100 for Kindergarten; the highest possible scale score is 600, although scale scores over 500 are rare. The difference between the highest and lowest score is the range of performance.
The shaded row at the bottom left-hand side of the page relates the total number of ELLs tested on ACCESS for ELLs 2.0 in the stated grade of the specified district.
Figure 7 shows a sample District Frequency Report.
How to Use This Report• This report provides a glimpse of the performance of all ELLs across language domains and
combination of domains in a district at the time of testing.• Information in this report may be useful in planning, developing, or restructuring language
services for ELLs at a district level. Variation in students’ language proficiency across individual and combined language domains may help shape their type and amount of support. In some states, students’ native language is also a component of support that is to be taken into account in program design
• As with the School Frequency Report, this report may be used in conjunction with the Student Roster Report to better explain student performance. The distribution of students along the six English language proficiency levels, to some extent, is a function of the tier that was administered. For example, as students in Tier A are considered “Beginners,” they should not be expected to, nor will they be able to score at the highest levels of English language proficiency. In contrast, those students in Tier C received the most challenging items representative of the higher levels of English language proficiency.

36
Figure 7: Blank District Frequency Report
ACC
ESS
for E
LLs
2.0®
Engl
ish
Lang
uage
Pro
ficie
ncy
Test
Dist
rict:
Gra
de:
Clus
ter:
Dis
tric
t Fre
quen
cy R
epor
t – 2
016
Profi
cienc
y Lev
el
Liste
ning
Spea
king
Read
ing
Writ
ing
Oral
Lang
uage
ALit
erac
yBCo
mpr
ehen
sionC
Over
all S
core
D
# of
Stud
ents
at Le
vel
% of
To
tal
Teste
d
# of
Stud
ents
at Le
vel
% of
To
tal
Teste
d
# of
Stud
ents
at Le
vel
% of
To
tal
Teste
d
# of
Stud
ents
at Le
vel
% of
To
tal
Teste
d
# of
Stud
ents
at Le
vel
% of
To
tal
Teste
d
# of
Stud
ents
at Le
vel
% of
To
tal
Teste
d
# of
Stud
ents
at Le
vel
% of
To
tal
Teste
d
# of
Stud
ents
at Le
vel
% of
To
tal
Teste
d
1 – En
terin
gKn
ows a
nd us
es m
inim
al so
cial
langu
age a
nd m
inim
al ac
adem
ic lan
guag
e with
visu
al an
d gra
phic
supp
ort
2 – Em
ergi
ngKn
ows a
nd us
es so
me s
ocial
Engli
sh an
d ge
nera
l aca
dem
ic lan
guag
e with
visu
al an
d gra
phic
supp
ort
3 – D
evel
opin
gKn
ows a
nd us
es so
cial E
nglis
h and
som
e sp
ecifi
c aca
dem
ic lan
guag
e with
visu
al an
d gra
phic
supp
ort
4 – Ex
pand
ing
Know
s and
uses
socia
l Eng
lish a
nd so
me
tech
nical
acad
emic
langu
age
5 – B
ridgi
ngKn
ows a
nd us
es so
cial a
nd ac
adem
ic lan
guag
e wor
king w
ith gr
ade l
evel
mat
erial
6 – R
each
ing
Know
s and
uses
socia
l and
acad
emic
langu
age a
t the
high
est l
evel
mea
sure
d by
this
test
High
est S
core
Lowe
st Sc
ore
Tota
l Tes
ted
A -
Ora
l Lan
guag
e =
50%
Lis
teni
ng +
50%
Spe
akin
g B
- Lite
racy
= 5
0% R
eadi
ng +
50%
Writ
ing
C - C
ompr
ehen
sion
= 7
0% R
eadi
ng +
30%
Lis
teni
ngD
- O
vera
ll Sc
ore
= 35
% R
eadi
ng +
35%
Writ
ing
+ 15
% L
iste
ning
+ 1
5% S
peak
ing

37
• Just as in the School Frequency Report, information provided in this report may have to be further contextualized to be meaningful. A description of the students in terms of their language, cultural, and experiential backgrounds would provide a fuller portrait of a district’s ELLs.
• For purposes of communicating information to various stakeholders, such as local Boards of Education or community groups, the data may be graphically displayed in the form of a histogram. The numbers of students or percent of total tested could serve as the vertical axis and the language domains and combination of domains could form the horizontal axis. Each language level could then be color-coded and positioned under the corresponding language domains.
• In the same vein, differences in performance of students by grade from year to year on ACCESS for ELLs 2.0 may be graphically displayed. To interpret the results more accurately, it is important to note the percent of matched pairs of groups of students; that is, how many ELLs in one year remained in the program and district the next year.

38
Appendix A: WIDA Performance Level Definitions
Figure A-1: WIDA Performance Definitions Listening and Reading, Grades K–12
Wit
hin
soci
ocul
tura
l con
text
s fo
r pro
cess
ing
lang
uage
…
Dis
cour
se D
imen
sion
Sent
ence
Dim
ensi
onW
ord/
Phra
se D
imen
sion
Ling
uist
ic C
ompl
exit
yLa
ngua
ge F
orm
s an
d Co
nven
tion
sVo
cabu
lary
Usa
ge
Leve
l 6 -
Reac
hing
Lan
guag
e th
at m
eets
all c
riter
ia th
roug
h Le
vel 5
, Brid
ging
At e
ach
grad
e, to
war
d th
e en
d of
a g
iven
leve
l of E
nglis
h la
ngua
ge p
rofic
ienc
y, an
d w
ith in
struc
tiona
l sup
port
, Eng
lish
lang
uage
lear
ners
will
pro
cess
…
Leve
l 5Br
idgi
ng
• R
ich
desc
riptiv
e di
scou
rse
with
com
plex
se
nten
ces
• C
ohes
ive
and
orga
nize
d re
late
d id
eas
• C
ompo
und,
com
plex
gra
mm
atic
al
cons
truc
tions
(e.g
., m
ultip
le p
hras
es a
nd
clau
ses)
• A
broa
d ra
nge
of se
nten
ce p
atte
rns
char
acte
ristic
of p
artic
ular
con
tent
are
as
• Te
chni
cal a
nd a
bstr
act c
onte
nt-a
rea
la
ngua
ge•
Wor
ds a
nd e
xpre
ssio
ns w
ith sh
ades
of
mea
ning
acr
oss c
onte
nt a
reas
Leve
l 4Ex
pand
ing
• C
onne
cted
disc
ours
e w
ith a
var
iety
of
sent
ence
s•
Expa
nded
rela
ted
idea
s
• A
varie
ty o
f com
plex
gra
mm
atic
al
cons
truc
tions
• Se
nten
ce p
atte
rns c
hara
cter
istic
of p
artic
ular
co
nten
t are
as
• Sp
ecifi
c an
d so
me
tech
nica
l con
tent
-are
a la
ngua
ge•
Wor
ds o
r exp
ress
ions
with
mul
tiple
m
eani
ngs a
cros
s con
tent
are
as
Leve
l 3D
evel
opin
g
• D
iscou
rse
with
a se
ries o
f ext
ende
d se
nten
ces
• Re
late
d id
eas
• C
ompo
und
and
som
e co
mpl
ex (e
.g.,
noun
ph
rase
, ver
b ph
rase
, pre
posit
iona
l phr
ase)
gr
amm
atic
al c
onstr
uctio
ns•
Sent
ence
pat
tern
s acr
oss c
onte
nt a
reas
• Sp
ecifi
c co
nten
t lan
guag
e, in
clud
ing
expr
essio
ns•
Wor
ds a
nd e
xpre
ssio
ns w
ith c
omm
on
collo
catio
ns a
nd id
iom
s acr
oss c
onte
nt a
reas
Leve
l 2Em
ergi
ng
• M
ultip
le re
late
d sim
ple
sent
ence
s•
An id
ea w
ith d
etai
ls•
Com
poun
d gr
amm
atic
al c
onstr
uctio
ns•
Repe
titiv
e ph
rasa
l and
sent
ence
pat
tern
s ac
ross
con
tent
are
as
• G
ener
al c
onte
nt w
ords
and
exp
ress
ions
, in
clud
ing
cogn
ates
• So
cial
and
instr
uctio
nal w
ords
and
ex
pres
sions
acr
oss c
onte
nt a
reas
Leve
l 1En
teri
ng
• Si
ngle
stat
emen
ts or
que
stion
s•
An id
ea w
ithin
wor
ds, p
hras
es, o
r chu
nks o
f la
ngua
ge
• Si
mpl
e gr
amm
atic
al c
onstr
uctio
ns (e
.g.,
com
man
ds, W
h- q
uesti
ons,
decl
arat
ives
)•
Com
mon
soci
al a
nd in
struc
tiona
l for
ms a
nd
patte
rns
• G
ener
al c
onte
nt-r
elat
ed w
ords
• Ev
eryd
ay so
cial
and
instr
uctio
nal w
ords
and
ex
pres
sions
WID
A P
erfo
rman
ce D
efini
tion
s - L
iste
ning
and
Rea
ding
Gra
des
K-12

39
WIDA Performance Definitions Speaking and Writing, Grades K–12
Wit
hin
soci
ocul
tura
l con
text
s fo
r lan
guag
e us
e…
Dis
cour
se D
imen
sion
Sent
ence
Dim
ensi
onW
ord/
Phra
se D
imen
sion
Ling
uist
ic C
ompl
exit
yLa
ngua
ge F
orm
s an
d Co
nven
tion
sVo
cabu
lary
Usa
ge
Leve
l 6 -
Reac
hing
Lan
guag
e th
at m
eets
all c
riter
ia th
roug
h Le
vel 5
, Brid
ging
At e
ach
grad
e, to
war
d th
e en
d of
a g
iven
leve
l of E
nglis
h la
ngua
ge p
rofic
ienc
y, an
d w
ith in
struc
tiona
l sup
port
, Eng
lish
lang
uage
lear
ners
will
pro
duce
…
Leve
l 5Br
idgi
ng
• M
ultip
le, c
ompl
ex se
nten
ces
• O
rgan
ized,
coh
esiv
e, a
nd c
oher
ent
expr
essio
n of
idea
s
• A
varie
ty o
f gra
mm
atic
al st
ruct
ures
mat
ched
to
pur
pose
• A
broa
d ra
nge
of se
nten
ce p
atte
rns
char
acte
ristic
of p
artic
ular
con
tent
are
as
• Te
chni
cal a
nd a
bstr
act c
onte
nt-a
rea
lang
uage
, in
clud
ing
cont
ent-s
peci
fic c
ollo
catio
ns•
Wor
ds a
nd e
xpre
ssio
ns w
ith p
reci
se m
eani
ng
acro
ss c
onte
nt a
reas
Leve
l 4Ex
pand
ing
• Sh
ort,
expa
nded
, and
som
e co
mpl
ex
sent
ence
s•
Org
anize
d ex
pres
sion
of id
eas w
ith
emer
ging
coh
esio
n
• A
varie
ty o
f gra
mm
atic
al st
ruct
ures
• Se
nten
ce p
atte
rns c
hara
cter
istic
of p
artic
ular
co
nten
t are
as
• Sp
ecifi
c an
d so
me
tech
nica
l con
tent
-are
a la
ngua
ge•
Wor
ds a
nd e
xpre
ssio
ns w
ith e
xpre
ssiv
e m
eani
ng th
roug
h us
e of
col
loca
tions
and
id
iom
s acr
oss c
onte
nt a
reas
Leve
l 3D
evel
opin
g
• Sh
ort a
nd so
me
expa
nded
sent
ence
s with
em
ergi
ng c
ompl
exity
• Ex
pand
ed e
xpre
ssio
n of
one
idea
or
emer
ging
exp
ress
ion
of m
ultip
le re
late
d id
eas
• Re
petit
ive
gram
mat
ical
stru
ctur
es w
ith
occa
siona
l var
iatio
n•
Sent
ence
pat
tern
s acr
oss c
onte
nt a
reas
• Sp
ecifi
c co
nten
t lan
guag
e, in
clud
ing
cogn
ates
an
d ex
pres
sions
• W
ords
or e
xpre
ssio
ns w
ith m
ultip
le m
eani
ngs
used
acr
oss c
onte
nt a
reas
Leve
l 2Em
ergi
ng
• Ph
rase
s or s
hort
sent
ence
s•
Emer
ging
exp
ress
ion
of id
eas
• Fo
rmul
aic
gram
mat
ical
stru
ctur
es•
Repe
titiv
e ph
rasa
l and
sent
ence
pat
tern
s ac
ross
con
tent
are
as
• G
ener
al c
onte
nt w
ords
and
exp
ress
ions
• So
cial
and
instr
uctio
nal w
ords
and
ex
pres
sions
acr
oss c
onte
nt a
reas
Leve
l 1En
teri
ng
• W
ords
, phr
ases
, or c
hunk
s of l
angu
age
• Si
ngle
wor
ds u
sed
to re
pres
ent i
deas
• Ph
rase
-leve
l gra
mm
atic
al st
ruct
ures
• Ph
rasa
l pat
tern
s ass
ocia
ted
with
com
mon
so
cial
and
instr
uctio
nal s
ituat
ions
• G
ener
al c
onte
nt-r
elat
ed w
ords
• Ev
eryd
ay so
cial
, ins
truc
tiona
l and
som
e co
nten
t-rel
ated
wor
ds
WID
A P
erfo
rman
ce D
efini
tion
s - S
peak
ing
and
Wri
ting
Gra
des
K-12
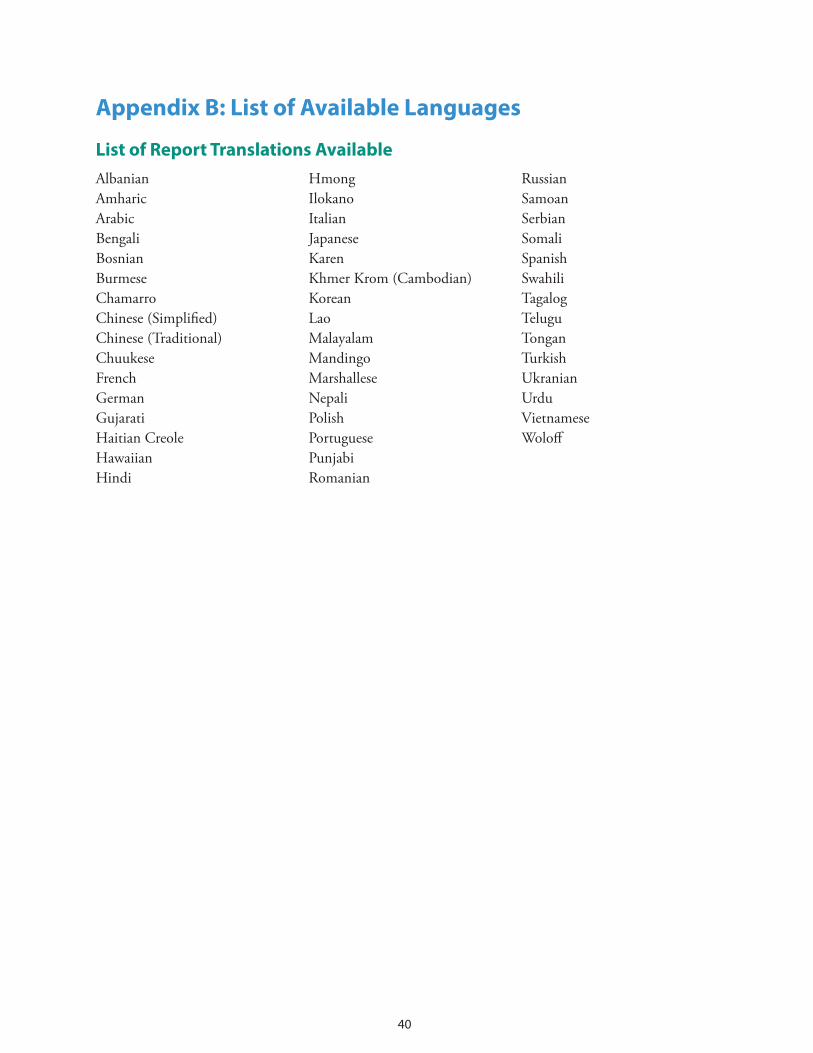
40
Appendix B: List of Available Languages
List of Report Translations AvailableAlbanianAmharicArabicBengaliBosnianBurmeseChamarroChinese (Simplified)Chinese (Traditional)ChuukeseFrenchGermanGujaratiHaitian CreoleHawaiianHindi
HmongIlokanoItalianJapaneseKarenKhmer Krom (Cambodian)KoreanLaoMalayalamMandingoMarshalleseNepaliPolishPortuguesePunjabiRomanian
RussianSamoanSerbianSomaliSpanish SwahiliTagalogTeluguTonganTurkishUkranianUrduVietnameseWoloff
41
Figure B-1: Blank Individual Student Report (Spanish)
Forma de lenguajeNivel de desempeño lingüístico
(Posible 1.0-6.0)Escala de puntaje (Posible 100-600) e Intervalo de confianza
Consulte la Guía de interpretación de los informes de puntuaciones si desea obtener definiciones
Escuchar
Hablar
Leer
Escribir
Lenguaje oral50% escuchar + 50% hablar
Capacidad de leer y escribir50% leer + 50% escribir
Comprender70% leer + 30% escuchar
Puntaje global*35% leer + 35% escribir + 15% escuchar + 15% hablar
*El puntaje global se calcula solamente después de evaluar las cuatro formas de lenguaje. NA (por sus siglas en inglés): No disponible
Forma de lenguaje
Nivel de desempeño lingüístico
En este nivel, los alumnos generalmente pueden hacer lo siguiente:
Escuchar
Hablar
Leer
Escribir
100 200 300 400 500 6001 2 3 4 5 6
Sum-ISR-SPAN
ACCESS for ELLs 2.0® Prueba de desempeño lingüístico en inglés
Informe individual del estudiante 2016 Este informe brinda información sobre el nivel de desarrollo del alumno en la prueba de desempeño lingüístico en inglés ACCESS for ELLs 2.0. Esta prueba se basa en los estándares de desarrollo del idioma inglés de WIDA y se emplea para medir el progreso de los alumnos en el aprendizaje del inglés. Los resultados se informan como Niveles de desempeño lingüístico del idioma y como Escalas de puntaje.
Si desea obtener detalles sobre los resultados en este informe, consulte la Guía de interpretación de los informes de puntuaciones en www.wida.us/scorereport
Fecha de nacimiento: Nivel: ID del distrito: Escuela: Distrito: Estado:
| Grado:
| ID estatal:

42
Appendix C: Sample Parent/Guardian Letter
Figure C-1: Sample Parent/Guardian Letter
Dear Parent or Guardian,
This past year, all ELLs in Kindergarten through Grade 12 took ACCESS for ELLs 2.0. The purpose of the test is to find out how much English your child has learned. We will use this information to help your child improve in listening, speaking, reading, and writing English each year.
Here are your child’s results on ACCESS for ELLs 2.0. The score report tells you about your child’s English using proficiency levels. These levels go from 1 (Entering) to 6 (Reaching). This information is for you to review and keep.
If you have any questions about how your child did on this test, please contact your child’s teacher, principal, or me.
Sincerely,
_________________________________ (School ELL coordinator, principal, or teacher)

43
Figure D-1: WIDA Writing Interpretive Rubric
Revised Writing Rubric of the WIDA™ Consortium Grades 1-12
Discourse Level Sentence Level Word/Phrase Level
Linguistic Complexity Language Forms and Conventions Vocabulary Usage
Level 6Reaching
Text is fully comprehensible and appropriate to purpose, situation, and audience; comparable to the writing of English proficient students meeting college- and career-readiness standards; and includes:
• extended connected text (single or multiple paragraphs) that is organized and shows tight cohesion in the precise expression of ideas
• clear evidence of consistency in conveying an appropriate perspective, register, and genre
• a full range of sentence patterns and grammatical structures matched to content area topics
• consistent use of appropriate conventions to convey meaning, including for effect
• consistent usage of just the right word or expression in just the right context related to content area topics
• facility with precise vocabulary usage in general, specific, or technical language
Level 5Bridging
Text is comprehensible and related to purpose; generally comparable to the writing of English proficient peers; and includes:
• extended connected text (single or multiple paragraphs) that is organized and shows a cohesive and coherent expression of ideas
• clear evidence of conveying an appropriate perspective, register, and genre
• a broad range of sentence patterns and grammatical structures matched to the content area topic
•nearly consistent use of appropriate conventions to convey meaning, including for effect
•usage of technical and abstract content-area words and expressions as appropriate
•usage of words and expressions with precise meaning related to content area topics as appropriate
•vocabulary usage that fulfills the writing purpose
Level 4Expanding
Text is generally comprehensible at all times; approaches comparability to the writing of English proficient peers; and includes:
• connected text (sentences or paragraphs) that shows an organized expression of ideas with emerging cohesion
• some evidence of conveying an appropriate perspective, register, and genre
• a range of sentence patterns and grammatical structurescharacteristic of the content area
•generally consistent use of appropriate conventions to convey meaning
•usage of specific and some technical content-area words and expressions as appropriate
•usage of words and expressions with multiple meanings or common collocations and idioms across content areas as appropriate
•vocabulary usage that generally fulfills the writing purpose
Level 3Developing
Original text is generally comprehensible (though comprehensibility may from time to time be compromised in more complex original text) and includes:
• text that shows developing organization in the expression of an expanded idea or multiple related ideas
• evidence of a developing sense of perspective, register, and genre
• a developing range of sentence patterns and grammatical structures common to content areas
•developing use of conventions to convey meaning
•usage of some specific content words and expressions as appropriate
•usage of common cognates, words, or expressions related to content areas as appropriate
•vocabulary usage that attempts to fulfill the writing purpose
Level 2Emerging
Some original text and text adapted from model or source text is generally comprehensible (though comprehensibility may often be compromised in attempts at more complex original text) and includes:
• text that shows emerging expression of an idea or ideas and may demonstrate some attempt at organization
• some amount of text that may be copied or adapted
• repetitive sentence and phrasal patterns and formulaic grammatical structures used in social and instructional situations or across content areas
•variable use of conventions
•usage of general content words and expressions•usage of social and instructional words and
expressions across content areas •possible usage of general vocabulary where
more specific language is needed
Level 1Entering
Text that is copied or adapted from model or source text is generally comprehensible (though comprehensibility may be significantly compromised in original text) and includes:
• language that represents an idea or ideas•varying amounts of text that may be
copied • adapted text that may contain some
original language
•words, chunks of language, or simple phrasal patterns associated with common social and instructional situations
•possible use of some conventions
•usage of highest frequency general content-related words
•usage of everyday social and instructional words and expressions
Appendix D: WIDA Interpretive Rubrics
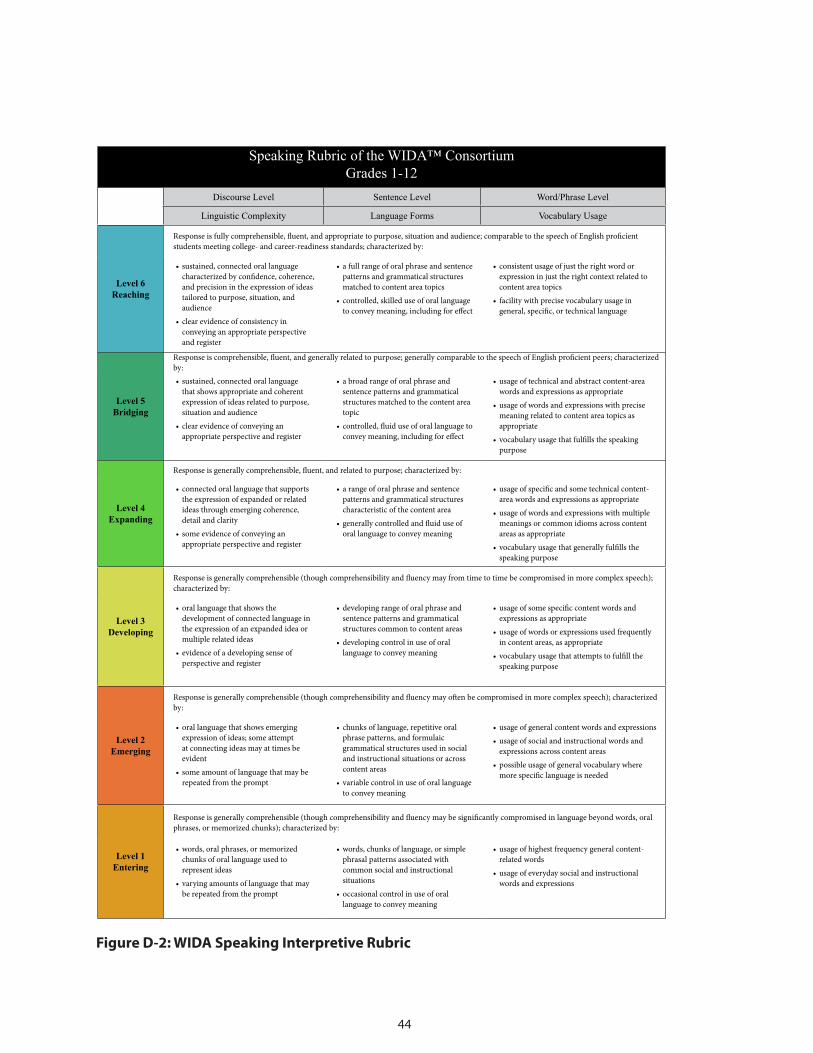
44
Figure D-2: WIDA Speaking Interpretive Rubric
Speaking Rubric of the WIDA™ ConsortiumGrades 1-12
Discourse Level Sentence Level Word/Phrase Level
Linguistic Complexity Language Forms Vocabulary Usage
Level 6Reaching
Response is fully comprehensible, fluent, and appropriate to purpose, situation and audience; comparable to the speech of English proficient students meeting college- and career-readiness standards; characterized by:
• sustained, connected oral language characterized by confidence, coherence, and precision in the expression of ideas tailored to purpose, situation, and audience
• clear evidence of consistency in conveying an appropriate perspective and register
• a full range of oral phrase and sentence patterns and grammatical structures matched to content area topics
• controlled, skilled use of oral language to convey meaning, including for effect
• consistent usage of just the right word or expression in just the right context related to content area topics
• facility with precise vocabulary usage in general, specific, or technical language
Level 5Bridging
Response is comprehensible, fluent, and generally related to purpose; generally comparable to the speech of English proficient peers; characterized by:• sustained, connected oral language
that shows appropriate and coherent expression of ideas related to purpose, situation and audience
• clear evidence of conveying an appropriate perspective and register
• a broad range of oral phrase and sentence patterns and grammatical structures matched to the content area topic
• controlled, fluid use of oral language to convey meaning, including for effect
• usage of technical and abstract content-area words and expressions as appropriate
• usage of words and expressions with precise meaning related to content area topics as appropriate
• vocabulary usage that fulfills the speaking purpose
Level 4Expanding
Response is generally comprehensible, fluent, and related to purpose; characterized by:
• connected oral language that supports the expression of expanded or related ideas through emerging coherence, detail and clarity
• some evidence of conveying an appropriate perspective and register
• a range of oral phrase and sentence patterns and grammatical structures characteristic of the content area
• generally controlled and fluid use of oral language to convey meaning
• usage of specific and some technical content-area words and expressions as appropriate
• usage of words and expressions with multiple meanings or common idioms across content areas as appropriate
• vocabulary usage that generally fulfills the speaking purpose
Level 3Developing
Response is generally comprehensible (though comprehensibility and fluency may from time to time be compromised in more complex speech); characterized by:
• oral language that shows the development of connected language in the expression of an expanded idea or multiple related ideas
• evidence of a developing sense of perspective and register
• developing range of oral phrase and sentence patterns and grammatical structures common to content areas
• developing control in use of oral language to convey meaning
• usage of some specific content words and expressions as appropriate
• usage of words or expressions used frequently in content areas, as appropriate
• vocabulary usage that attempts to fulfill the speaking purpose
Level 2Emerging
Response is generally comprehensible (though comprehensibility and fluency may often be compromised in more complex speech); characterized by:
• oral language that shows emerging expression of ideas; some attempt at connecting ideas may at times be evident
• some amount of language that may be repeated from the prompt
• chunks of language, repetitive oral phrase patterns, and formulaic grammatical structures used in social and instructional situations or across content areas
• variable control in use of oral language to convey meaning
• usage of general content words and expressions• usage of social and instructional words and
expressions across content areas • possible usage of general vocabulary where
more specific language is needed
Level 1Entering
Response is generally comprehensible (though comprehensibility and fluency may be significantly compromised in language beyond words, oral phrases, or memorized chunks); characterized by:
• words, oral phrases, or memorized chunks of oral language used to represent ideas
• varying amounts of language that may be repeated from the prompt
• words, chunks of language, or simple phrasal patterns associated with common social and instructional situations
• occasional control in use of oral language to convey meaning
• usage of highest frequency general content-related words
• usage of everyday social and instructional words and expressions

45
Figure E-1: WIDA Speaking Test Scoring Scale
Appendix E: WIDA Scoring Scales
ACCESS for ELLs 2.0 Speaking Scoring ScaleScore point Response characteristics
Exemplary use of oral language to provide an elaborated response
• Language use comparable to or going beyond the model in sophistication• Clear, automatic, and fluent delivery• Precise and appropriate word choice
Strong use of oral language to provide a detailed response
• Language use approaching that of model in sophistication, though not as rich• Clear delivery• Appropriate word choice
Adequate use of oral language to provide a satisfactory response
• Language use not as sophisticated as that of model• Generally comprehensible use of oral language• Adequate word choice
Attempted use of oral language to provide a response in English
• Language use does not support an adequate response• Comprehensibility may be compromised• Word choice may not be fully adequate
No response (in English) • Does not respond (in English)
Scoring processes
Select the score point that best describes the overall response relative to the qualities of the model• Check to ensure each bullet point is met• If not, check one level below
Scoring notes & rules
• For P1 tasks, assign a score of Adequate and above if the response includes more than one word in English. This includes an article plus noun (e.g., “a chair”), and words repeated verbatim from the model.
• For P3 and P5 tasks, students may take up and use language from the model and should not be penalized for this. This is particularly relevant for personal-preference tasks.
• At all task levels, simply repeating or reading all or part of the task question should be scored Attempted.
• At all task levels, responses of “I don’t know” should be scored Attempted.
Off-task response: The response shows no understanding of or interaction with the prompt. It may answer another, unrelated task. A response that is entirely off task receives a score of Attempted.
Off-topic response: The response shows a misinterpretation of the instructions. An off-topic response is related to the prompt, but does not address it. (Note that this does not refer to task completion—for example, if a student is asked for 3 reasons and gives 1, this should be scored based on language use and is not considered off topic.) The maximum score for an off-topic response is Adequate. If any part of the response is on topic, the entire response is scored as on topic.
For scoring use only
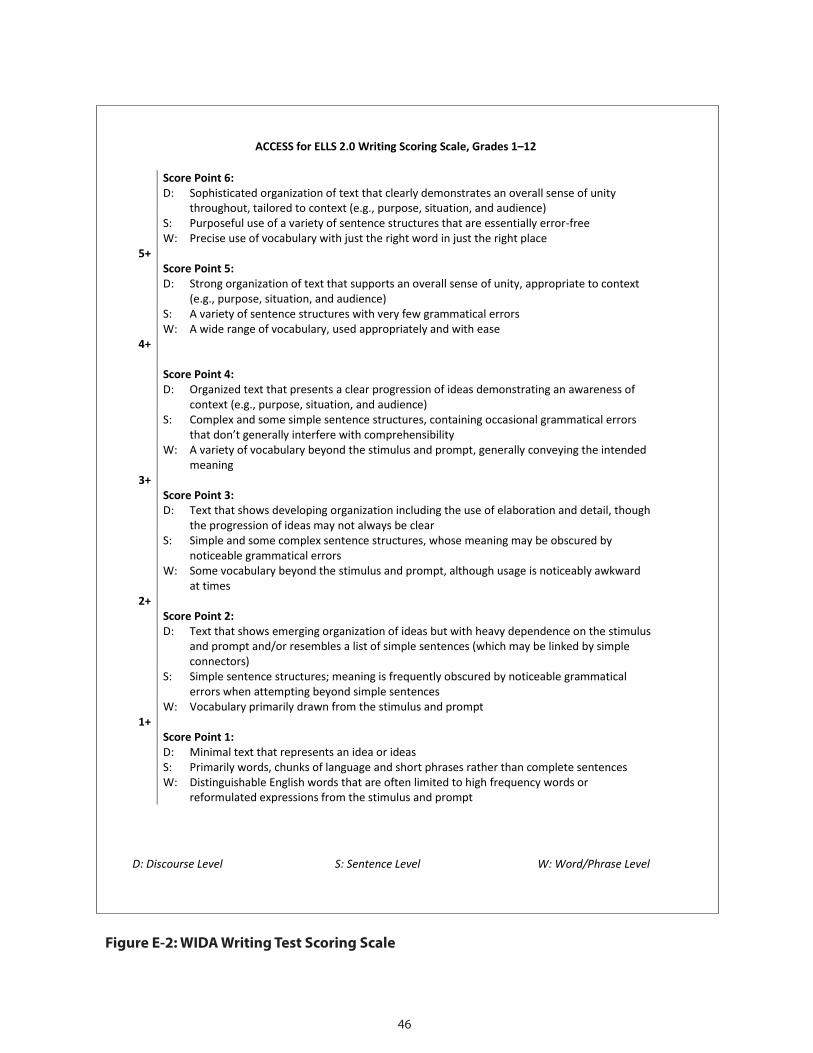
46
Figure E-2: WIDA Writing Test Scoring Scale
For scoring ACCESS for ELLs 2.0 and the WIDA Screener only 8/20/2015
D: Discourse Level S: Sentence Level W: Word/Phrase Level Note: This scoring scale is only for scoring ACCESS for ELLs 2.0 and the WIDA Screener. For interpreting ACCESS for ELLs 2.0 results and for evaluating classroom writing tasks, see the Interpretive Rubric for Writing.
ACCESS for ELLS 2.0 Writing Scoring Scale, Grades 1–12
Score Point 6: D: Sophisticated organization of text that clearly demonstrates an overall sense of unity
throughout, tailored to context (e.g., purpose, situation, and audience) S: Purposeful use of a variety of sentence structures that are essentially error-free W: Precise use of vocabulary with just the right word in just the right place
5+ Score Point 5: D: Strong organization of text that supports an overall sense of unity, appropriate to context
(e.g., purpose, situation, and audience) S: A variety of sentence structures with very few grammatical errors W: A wide range of vocabulary, used appropriately and with ease
4+
Score Point 4: D: Organized text that presents a clear progression of ideas demonstrating an awareness of
context (e.g., purpose, situation, and audience) S: Complex and some simple sentence structures, containing occasional grammatical errors
that don’t generally interfere with comprehensibility W: A variety of vocabulary beyond the stimulus and prompt, generally conveying the intended
meaning 3+
Score Point 3: D: Text that shows developing organization including the use of elaboration and detail, though
the progression of ideas may not always be clear S: Simple and some complex sentence structures, whose meaning may be obscured by
noticeable grammatical errors W: Some vocabulary beyond the stimulus and prompt, although usage is noticeably awkward
at times 2+
Score Point 2: D: Text that shows emerging organization of ideas but with heavy dependence on the stimulus
and prompt and/or resembles a list of simple sentences (which may be linked by simple connectors)
S: Simple sentence structures; meaning is frequently obscured by noticeable grammatical errors when attempting beyond simple sentences
W: Vocabulary primarily drawn from the stimulus and prompt 1+
Score Point 1: D: Minimal text that represents an idea or ideas S: Primarily words, chunks of language and short phrases rather than complete sentences W: Distinguishable English words that are often limited to high frequency words or
reformulated expressions from the stimulus and prompt

©2016 Board of Regents of the University of Wisconsin System, on behalf of WIDA
www.wida.us