access to capital and credit for small businesses in ... · access to capital and credit for small...
TRANSCRIPT

Access to Capital and Credit For Small Businesses in Appalachia
April 2007
Appalachian Regional Commission Prepared by: National Community Reinvestment Coalition

2
You can view and download this report by visiting www.arc.gov or www.ncrc.org. For more information about the report, please contact either Gregory Bischak of the Appalachian Regional Commission (202-884-7790, [email protected]) or Josh Silver of the National Community Reinvestment Coalition (202-464-2708, [email protected]) The authors wish to thank the Appalachian Regional Commission for providing the funding for the report. Appalachian Regional Commission 1666 Connecticut Avenue, NW, Suite 700 Washington, DC 20009-1068 The Appalachian Regional Commission’s mission is to be an advocate for and partner with the people of Appalachia to create opportunities for self-sustaining economic development and improved quality of life. National Community Reinvestment Coalition 1727 15th St. NW, Suite 900 Washington, DC 20005 NCRC’s mission is to increase fair and equal access to credit, capital, and banking services and products because discrimination is illegal, unjust, and detrimental to the economic growth of underserved communities in the United States and around the world. NCRC seeks to support, create, and implement long-term solutions, which include providing tools and strategies for building community and individual economic well-being. We would like to thank Josh Silver for his role as principal investigator and Milena Kornyl for her comprehensive quantitative analysis. We would like to thank our subcontractor, the Woodstock Institute and Geoff Smith for their timely and high quality work on this project. We also thank the Appalachian Regional Commission for their funding of this report. We thank ARC staff, in particular, Greg Bischak for his technical expertise and peer review regarding the econometrics, Ray Daffner for his vision in making this project possible, and William Grant for his expertise regarding the alternative financial institutions part of the report. © 2007 by the Appalachian Regional Commission and the National Community Reinvestment Coalition Reproduction of this document is permitted and encouraged, with credit given to the Appalachian Regional Commission and the National Community Reinvestment Coalition.
3
Table of Contents Executive Summary…………………………………………………………………... 4
Policy Options and Overview of Motivation and Methodology of Study 6
Socioeconomic Profile of Small Businesses and Lending in Appalachia…………….. 12
Mid-Size Banks and Government Backed Lending: Serving Communities and
Businesses Most in Need of Credit?..............................................................................
39
Literature Review……………………………………………………………………...
Regression Analysis of Small Business Lending in Appalachia……………………...
53
67
Assessing the Impact of CRA on Community Development Lending for Affordable
Housing and Small Business in Appalachia…………………………………………..
91
Alternative Financial Institutions in Appalachia……………………………………... 111
Conclusion……………………………………………………………………………. 142
Bibliography………………………………………………………………………….. 163
Appendices: Appendix Tables 1 to 41………...……………………………………… 165
4
Executive Summary The Appalachian Regional Commission (ARC) contracted with the National Community Reinvestment Coalition (NCRC) to conduct this study as part of ARC’s effort to develop Appalachia through increasing access to credit and capital for small businesses. Heightened capital flows to small businesses would bolster the economic development of the region by creating jobs, diversifying the economy, and further developing an entrepreneurial class in Appalachia. This study found that banks have committed substantial amounts of community development financing to the region and are responding well to the credit needs of Appalachian small businesses in minority communities. The study recommends that stakeholders work together to close remaining credit gaps and needs in Appalachia. Mid-size community banks were particularly responsive to the needs of small businesses in lower income and distressed rural communities in Appalachia. These lending institutions demonstrate that small business lending is profitable and rewarding for banks. The challenge for stakeholders is to encourage all lending institutions to expand upon profitable lending opportunities and to further finance an infrastructure for supporting small business and economic development. The study used a number of databases including the Community Reinvestment Act (CRA) data on small business lending, data on bank branching obtained from the Federal Deposit Insurance Corporation, data from CRA exams, and data on Community Development Financial Institutions (CDFIs). The data also included U.S. Census data on population trends and Dun and Bradstreet data on the characteristics of small businesses. Based upon the report’s findings, policy options are presented to address financing gaps in non-metropolitan areas and distressed counties, and among small businesses. This policy options focus on three broad areas:
• Providing support and incentives for the development of bank branches and the growth of the community banking sector in non-metropolitan and distressed counties;
• Increasing the capitalization and sustainability of Community Development Financial Institutions operating in the region, particularly loan funds and development venture capital funds; and
• Ensuring the continued efficacy and impact of the CRA program and examinations.
Many of these recommendations can be implemented by ARC working together with stakeholders in the Appalachian region. These stakeholders include state agencies, elected officials, lending institutions, federal regulatory agencies, the U.S. Department of Treasury, financial intermediaries, public finance markets, Federal Home Loan Banks, development organizations, and the Federal Reserve Banks.

5
Findings The reasons for an optimistic assessment of the ability of the Region to close identified capital and credit gaps include a favorable comparison between Appalachia and the nation on some indicators of lending. In addition, Appalachia has a lending infrastructure that includes about 227 banks and savings and loans with more than $500 billion in assets, and a sector of alternative lending institutions featuring over 100 community development financial institutions (CDFIs). The Community Reinvestment Act (CRA) has had a substantial impact in leveraging increases in community development lending and investing in the Appalachian Region. This study finds that banks and thrifts headquartered in Appalachia issued about $5.4 billion in lending and investing for affordable housing, small business development, and economic revitalization each CRA exam cycle (about 2.5 years). In addition, the small business loan-to-deposit ratio for Appalachia was 35% higher than national levels. And, in contrast to most other regions in the country, small business lending was higher in counties with greater minority populations in Appalachia. Some additional positive indicators include:
• Small and mid-sized banks in Appalachia (with assets less then $1 billion) were particularly oriented to the needs of small businesses in distressed and rural areas, having a higher market share of loans in economically distressed and rural counties.
• Small business lending was higher in the Region in counties with higher levels of bank branches.
Within Appalachia, small business lending was less accessible in non-metropolitan counties and counties experiencing economic distress. In addition, the smallest businesses with revenues under $1 million and businesses in low- and moderate-income communities experienced the least access to credit. In order to narrow differences in access to small business lending within Appalachia, concerted and persistent stakeholder efforts must be undertaken over a multi-year time period. Increasing access to small business lending would build the small business sector, create wealth, and stimulate job creation and economic development in Appalachia. Additional challenges include:
• Non-metropolitan and distressed counties had considerably smaller shares of bank assets, which translated into non-metropolitan and distressed counties receiving less community development financing than metropolitan counties.
• A relatively small amount of community development financing was devoted to small business development when compared to housing activities.
This study also reviewed the role of alternative financial institutions in the Region, including Revolving Loan Funds (RLFs), microenterprise lending programs, community
6
development credit unions and development venture capital funds. Overall, these community development financial institutions placed a strong emphasis on business lending, but were not financed by banks to the same extent as their national peers. Instead, these institutions relied to a much greater degree on capital from government sources. Related findings include:
• Appalachian community development credit unions and venture capital funds were more self-sufficient than their national peers, while Appalachian community development loan funds and RLFs had lower self-sufficiency rates than the national averages.
• ARC RLFs demonstrated declining deal flow while showing an increase in participation in individual loan transactions.
• No Small Business Administration (SBA) 504 loans were originated to minority- or women-owned businesses in Appalachian distressed counties.
This study updates the report commissioned by ARC in 1998 and conducted by Mt. Auburn Associations entitled Capital and Credit Needs in the Appalachian Region. Key findings of the Mt. Auburn report included that “insufficient financing appears to have a serious impact on the investment decisions of about one in five established companies,” and that small firms with less than 10 employees had higher levels of unmet funding needs than their larger counterparts. In addition, significant gaps were found in the provision of equity capital to growing firms in the Region. Policy Options Based upon the report’s findings, the following policy options are presented to increase access to credit and capital in non-metropolitan areas and distressed counties, and among small businesses. A number of these recommendations can be implemented by ARC working together with stakeholders in the Appalachian region. These stakeholders include state agencies, elected officials, lending institutions, federal regulatory agencies, the U.S. Department of Treasury, financial intermediaries, public finance markets, Federal Home Loan Banks, community development organizations, and the Federal Reserve Banks.
• Increase Branch presence, particularly in non-metropolitan areas and distressed counties – Since lending is higher in counties with higher number of branches, building bank branches, particularly in non-metropolitan and distressed counties, should be regarded as an important part of an economic development program. ARC, state agencies, and lending institutions should investigate New York State’s Banking Development District (BDD) Program. Begun in 1998, the BDD program offers partial property tax exemptions and encourages local public deposits for banks opening branches in geographical areas in need of banking services.1
1 See http://www.banking.state.ny.us/pr980226.htm and http://www.banking.state.ny.us/pr050810.htm. Last accessed July 3, 2006.

7
• Growth of the Community Banking Sector – Mid-size banks with assets between $250 million to $1 billion played important roles in small business financing, and focused their lending in non-metropolitan and distressed counties. Stakeholders should ensure that the mid-size and smaller bank sector remain viable and vibrant. Incentives could be developed to support existing mid-sized banks, or encourage the formation of new banking institutions in underserved areas. For example, the Federal Home Loan Bank System should consider additional advances and other incentives to support the small business lending of mid-size banks. Currently, the Federal Home Loan Bank of Pittsburgh operates a Banking on Business (BOB) program that provides financing for bank loans that would not otherwise be made due to insufficient cash flow from the small business. Since its inception, BOB has provided $20.5 million in funding, creating and retaining 3,500 jobs.2 Likewise, the Federal Home Loan Bank of Atlanta runs the Economic Development Program that helps provide financing to small businesses.3
• Increase levels of community development financing for small business
development – Banks located in Appalachia devoted significantly higher levels of community development lending and investing for affordable housing than small business development. This finding does not mean that community development financing levels for affordable housing should go down so that levels for small businesses can go up. Instead, it suggests that banks should be encouraged to increase their overall levels of community development financing and devote substantial portions of the increases towards small business development.
• Support alternative financial institutions - Alternative financial institutions such as
Community Development Financial Institutions (CDFIs) are important for increasing access to small business lending. Therefore, policy options include:
- Expand sources of debt and investment capital for community development loan funds and venture capital funds. Appalachian Community Development Financial Institutions (CDFIs) and other community development financing entities need to expand their funding base. Community development loan funds and venture capital funds in the Region are heavily reliant on government sources for debt and investment capital. ARC can develop relationships with potential investors and regulatory agencies to encourage increased investment within Appalachia, including partnerships with financial intermediaries, participation in public secondary markets, and use of tax credit financings.
- Appalachian loan funds must increase operational self sufficiency. Appalachian loan funds, both RLFs and microenterprise funds, should
2 See http://www.fhlb-pgh.com/housing-and-community/real-life-stories/banking-on-business.html, last accessed December 21, 2006. 3 http://www.fhlbatl.com/fhlb_content.cfm?lev1=5cis&lev2=bcedp&lev3=2edp, last accessed December 21, 2006.

8
increase levels of self sufficiency by reducing operating costs or increasing revenues.
- Increase depth of product offerings by community development lenders. To reach the smallest businesses with less than $1 million in revenues, the Appalachian community development lenders should increase their financing products beyond gap financing. These new products would target the smaller businesses that the banks currently have difficulty servicing.
- Continue to grow capacity of Appalachian development venture capital funds. Available literature shows that there remains a significant gap in access to equity financing in non-metropolitan markets. ARC’s efforts to develop regional equity investment funds are important in bridging this gap and increasing regional entrepreneurship levels.
• Maintain Integrity of CRA Exams and Data – The federal regulatory agencies have
implemented new CRA exams for mid-size banks. Stakeholders should ensure that the integrity of CRA exams is preserved so that mid-size banks maintain and increase their levels of community development financing in Appalachia. In 2005, federal regulators also deleted the small business loan data reporting requirements for mid-size banks. Federal regulators should consider ways to continue to collect this data so that future studies can systematically examine the lending patterns of mid-size banks. Mid-size banks should continue to be encouraged to voluntarily report the data as many chose to do for the 2005 data submissions. While data collection imposes costs, the benefits can exceed those costs. The data can document positive trends and highlight new opportunities as revealed by this study. Moreover, data reporting motivates banks to maintain and increase their lending levels to small businesses.
• Encourage Small Business Administration (SBA)-guaranteed lending to Minority-
Owned Businesses – The SBA should investigate ways to increase SBA-guaranteed lending to minority-owned businesses and in minority counties. It is possible that the relatively low levels of SBA-guaranteed loans to minority-owned businesses or businesses in minority counties were due to the relatively high levels of conventional lending to these businesses. Alternatively, it is possible that there are still certain types of credit needs that are not being filled by the conventional lending, opening up new opportunities for SBA-guaranteed lending.
• Financial Counseling and Technical Assistance for Small Businesses – The study
found that lending was higher in counties with higher portions of small businesses with the lowest risk credit scores. This suggests that lending will increase to small businesses overall if small businesses improved their credit scores. High quality financial counseling efforts are therefore important in Appalachia as a means to improve the credit scores of small businesses. In addition, technical assistance should be provided to improve the knowledge and skill level of small business entrepreneurs regarding cash flow, understanding financials, business planning and

9
taxation issues. ARC, state officials, lending institutions, and community organizations should work together to intensify financial counseling directed towards small businesses in Appalachia.
• Better Understanding of Lending in Minority Counties in Appalachia – The report’s
finding about higher levels of lending in counties with higher levels of minorities was a surprising and positive finding. Future research should be conducted to more fully understand why lending is unusually successful in reaching firms in counties with high levels of minorities in Appalachia. Lessons from this research should be applied to other regions of the country since the literature overall suggests serious barriers in access to small business lending for minority-owned firms.
Overview of the Background, Motivation and Methodology for the Study The Appalachian Regional Commission (ARC) contracted with the National Community Reinvestment Coalition (NCRC) to conduct this study as part of ARC’s effort to develop Appalachia through increasing access to credit and capital for small businesses. ARC is a federal-state partnership established in 1965 by the Appalachian Regional Development Act to promote economic and social development of the Appalachian Region. The Act, as amended in 2002, defines the Region as 410 counties comprising all of West Virginia and parts of Alabama, Georgia, Kentucky, Maryland, Mississippi, New York, North Carolina, Ohio, Pennsylvania, South Carolina, Tennessee, and Virginia—an area of 200,000 square miles and about 22.9 million people. For 41 years, the Commission has funded a wide range of programs in the Region, including highway corridors; community water and sewer facilities and other physical infrastructure; health, education, and human resource development; and economic development programs. The rationale for ARC’s Area Development program is to provide the basic building blocks that will enable Appalachian communities to create opportunities for self-sustaining economic development and improved quality of life. ARC goals particularly relevant for this study include increasing job opportunities and per capita income in Appalachia to reach parity with the nation, and strengthening the capacity of the people of Appalachia to compete in the global economy.
Small business growth and development is integral to the efforts of ARC to increase employment and competitiveness. In Appalachia, primary metals sectors, such as steel, have lost over 20,000 jobs since 1994. Many of these losses have resulted from import penetration and plant relocations overseas. The Appalachian apparel industry has lost 110,000 jobs since 1994, and the textile industry has lost 83,000. Over the last decade, one out of five jobs lost in textiles nationally occurred in Appalachia, and one out of three jobs lost in apparels occurred in Appalachia.
In the face of large economic forces, ARC has been remarkably successful in channeling economic development investments. ARC’s investments have reduced the region's poverty rate by one-half, from 31 percent to 13 percent. Likewise, ARC has helped to lessen the

10
per capita income gap between Appalachia and the rest of the U.S from 22 percent below the national average to 18 percent. This study provides critical insights into how and why ARC should leverage additional investments for small business development and growth.
The NCRC study updates the report commissioned by ARC in 1998 and conducted by Mt. Auburn Associations entitled Capital and Credit Needs in the Appalachian Region. The Mt. Auburn study motivated a follow-up study focusing on bank financing because one of the key findings of the Mt. Auburn study was that “Appalachian businesses are heavily dependent on the banking industry for financing.” In addition, the Mt. Auburn study identified significant credit needs as “insufficient financing appears to have a serious impact on the investment decisions of about one in five established companies.” Further, the Mt. Auburn study indicated that small firms with less than 10 employees had higher levels of unmet funding needs than their larger counterparts.
The Mt. Auburn study broke important ground through its use of surveys of Appalachian small businesses. The study did not benefit, however, from publicly available data on CRA small business lending. The CRA data for the year 1996 first became available in summer of 1997 when the Mt. Auburn study was well underway. In addition, researchers became much more familiar with the strengths and weaknesses of the database over the next several years. Thus, this study provides an important update to the Mt. Auburn report by utilizing the small business lending data and probing to what extent the unmet credit needs overall and for very small businesses still exist in Appalachia.
Since the Mt. Auburn study, new trends and challenges confront Appalachia. The heightened pace of globalization, consolidation in the banking industry, the high cost of energy, and rising interest rates pose significant challenges as well as new opportunities for business development. Changes in the Community Reinvestment Act (CRA) and federal economic development programs likewise present a series of challenges and opportunities. For example, the federal New Markets Tax Credit program promises to provide a significant amount of resources for development in Appalachia. The program authorizes the Department of Treasury to provide tax credits of 39% on up to $15 billion of private investments in low-income areas for business development activities and small business lending. Nonprofit and private sector entities in Appalachia are just beginning to take advantage of this new program.
NCRC’s study was able to consider the impact on small business lending of a number of these large economic changes such as consolidation in the banking industry and the growing use of credit scoring in small business lending. However, future studies will be needed to further evaluate the impact on access to credit of changes in federal programs and banking regulations as well as globalization and other economic structural adjustments.
Methodology
This report employed a number of datasets and created datasets for the quantitative analysis. For the analysis of small business lending trends, NCRC used the publicly available data on CRA small business lending. This data was combined with U.S. Census

11
data on population demographics and Dun and Bradstreet data on business demographics and credit scores. In addition, data was obtained from the Small Business Administration (SBA) on SBA lending programs. Branch and deposit data was obtained from the web page of the Federal Deposit Insurance Corporation (FDIC). The section of the report analyzing community development lending and investing created a database consisting of data pulled from CRA exams of banks and thrifts located in Appalachia. Finally, the chapter on alternative financial institutions used data collected by public agencies, ARC, and trade associations of Community Development Financial Institutions (CDFIs).
The CRA small business lending data analysis used the year 2003. A longitudinal data analysis was not employed because changes in the definitions of loans in the CRA small business data had a significant impact on annual loan volumes. In addition, the number of lenders required to report the data has changed. It is recommended that ARC commission a future study, using the CRA small business data as one of the resources. Such a study should carefully assess the influence of changes in the database on similarities and differences in lending patterns found in this current study and the future one. A similar caveat applies to the CRA exam analysis. The most recent CRA exam was used for each lender in this study. A future study can assess if levels of community development financing by banks increased or decreased by using the subsequent exams for each lender headquartered in Appalachia.

12
Socioeconomic Profile of Small Businesses and Lending in Appalachia
This chapter will first describe economic conditions in Appalachia. Appalachian region
characteristics will also be described in reference to the nation. Population and business
demographics are discussed, followed by a description of small business lending data.
After reviewing national data, the chapter explores state level data, scrutinizing the
differences and similarities among the 13 states in Appalachia. The chapter then describes
trends on a county and census tract level. Here, the analysis separately considers
metropolitan (MSA) and non-metropolitan (NonMSA) counties, distressed and non-
distressed countries, and low- and moderate- income (LMI) census tracts.
The data in this chapter describe the number of small non-farm businesses, small business
(SB) loans originated to various types of small businesses as well as the distribution of
small businesses by sector, number of employees and legal status. NCRC calculated
several indicators that assess access to credit by small businesses in Appalachian Region.
The lending data used in this chapter is publicly reported small business loan data per the
requirements of the Community Reinvestment Act (CRA) regulations. The lending data is
for the year 2003. Census data and small business demographic data from Dun and
Bradstreet were also used. NCRC used CRA Wiz, produced by PCI Services, Inc., to
analyze the small business data and the demographic data.
Demographics and Economic Conditions
Economic Conditions
The Appalachian region includes 410 counties, comprising all of West Virginia and parts
of twelve other states. It extends more than 1,000 miles from the southern New York to
northeast Mississippi, and is home to over 23 million people. Despite recent progress,
Appalachia still does not enjoy the same economic vitality and living conditions as the rest
of the country. The region continues to battle economic distress, concentrated areas of high
poverty, unemployment, low income, poor health, educational disparities, and population

13
out-migration that are among the worst in the nation. Increased global competition and
technological change have resulted in job losses and restructuring in many key
Appalachian industries. Employment losses in non-durable goods and manufacturing and
resource-based industries have been severe and disproportionately impacted much of the
region. Some of these declines have been offset by employment growth in service sectors,
but service sector average wages are often considerably lower than those in the goods
producing sectors.
A number of industrial sectors have been hit hard by job loss. Primary metals sectors, such
as steel, have lost over 20,000 jobs since 1994. Many of these losses have resulted from
import penetration and plant relocations overseas. The Appalachian apparel industry has
lost 110,000 jobs since 1994, and the textile industry has lost 83,000. Over the last decade,
one out of five jobs lost in textiles nationally occurred in Appalachia, and one out of three
jobs lost in apparels occurred in Appalachia. An estimated one-third of the apparel losses
and one-half of the textile losses are due to imports or plant relocations to other countries.
Appalachian coal-mining employment has fallen from 101,500 workers in 1987 to 46,000
in 2003, largely because of productivity gains.
Within Appalachia, sub-regions confront unique challenges. Northern Appalachia, with its
large population base and mature industrial base, must enhance the global competitiveness
of its existing firms and stimulate new business creation to offset the impact of downsizing.
Central Appalachia, once dominated by coal and tobacco, is struggling to diversify its
economy. Southern Appalachia, influenced by its nearby large urban centers, strives to
link its development to these engines of growth, and to cope with trade-related job
displacement in labor-intensive manufacturing sectors.4
The context of sizable job loss and sub-regional economic development challenges informs
the analysis of this report. Small business development is a key strategy to diversify into
new industries. And access to credit and capital is integral to expanding small businesses
in Appalachia.
4 Appalachian Regional Commission, FY 2006 Performance Budget Justification, http://www.arc.gov/index.do?nodeId=100.

14
Population by Race
The great majority of Appalachia’s population is white. In total, the white population
constituted about 88% of the region’s population, African-Americans were 8.2% and
Hispanics were only 2% of the total population (see Appendix Table 1 and Figure 1).
Overall, minorities constituted 12.2% of total population. Predictably, the percent of the
minority population in metropolitan areas was higher than in rural areas at 14.4% and
9.25%, respectively. The percent of minorities in distressed and non-distressed counties
were close to each other at around 12.5%. Finally, there were 371 counties where less than
20% of population was minority, 41 counties with the percentage of the minority
population between 20% and 50%, and only 6 counties where minority population
constituted more than 50% of the total population.
The percentage of African-Americans and Hispanics in Appalachia was lower than in the
Nation. African-Americas were 12.1% of the nation’s population while they were 8.2% of
Appalachia’s population. Hispanics were 12.6% of the nation’s population but just 2% of
Appalachia’s population. Moreover, the difference between the percent of minorities for
Appalachia and Nation is higher for MSA areas (around 19 percentage points) when
compared to NonMSA areas (about 9 percentage points). For the nation, 34% of the
population in metropolitan areas was minority compared to 14.4% for Appalachian
metropolitan areas. In addition, 18% of population in non-metropolitan areas in the nation
National Demographics Population by Race*
Hispanic13 %
W hit e6 9 %
Ot her6 %
A f r ican- A merican12 %
African-American Hispanic White Other
* 2000 Census
Appalachia Demographics Population by Race*
A frican-A merican
8%
H ispanic2%
White88%
Other2%
African-American Hispanic White Other
* 2000 Census
Figure 1
Source: Appendix Table 1 – rows Nation Total and Appalachia Total.
15
was minorities and only 9.25% of non-metropolitan population in Appalachia was
minorities (see Appendix Table 1).
Business Demographics
Comparison of Appalachian and National Business Demographics
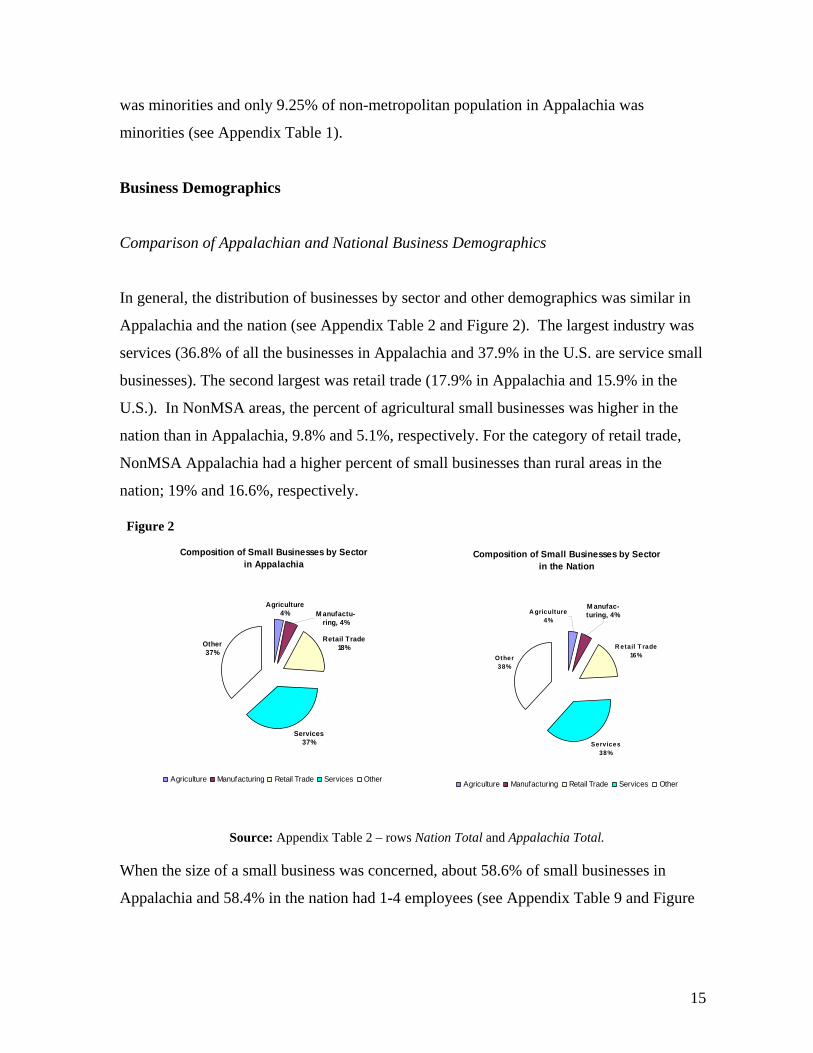
In general, the distribution of businesses by sector and other demographics was similar in
Appalachia and the nation (see Appendix Table 2 and Figure 2). The largest industry was
services (36.8% of all the businesses in Appalachia and 37.9% in the U.S. are service small
businesses). The second largest was retail trade (17.9% in Appalachia and 15.9% in the
U.S.). In NonMSA areas, the percent of agricultural small businesses was higher in the
nation than in Appalachia, 9.8% and 5.1%, respectively. For the category of retail trade,
NonMSA Appalachia had a higher percent of small businesses than rural areas in the
nation; 19% and 16.6%, respectively.
When the size of a small business was concerned, about 58.6% of small businesses in
Appalachia and 58.4% in the nation had 1-4 employees (see Appendix Table 9 and Figure
Composition of Small Businesses by Sector in the Nation
R etail T rade16%
Services38%
Other38%
M anufac-turing, 4%A griculture
4%
Agriculture Manufacturing Retail Trade Services Other
Composition of Small Businesses by Sector in Appalachia
Agriculture4%
Retail Trade18%
Services37%
Other37%
M anufactu-ring, 4%
Agriculture Manufacturing Retail Trade Services Other
Figure 2
Source: Appendix Table 2 – rows Nation Total and Appalachia Total.

16
3). The distribution in larger size categories was also similar when comparing Appalachia
to the nation.
Composition of Small Businesses by Firm Size in Appalachia and Nation
58.6%
10.2%5.7% 4.1% 2.7%
18.7%
58.4%
9.5%5.6% 4.0% 2.6%
20.0%
0.0%
10.0%
20.0%
30.0%
40.0%
50.0%
60.0%
70.0%
80.0%
90.0%
100.0%
1 - 4 Employees 5 - 9 Employees 10 - 19 Employees 20 - 49 Employees 50+ Employees # Employees NotKnown
Perc
ent o
f Bus
ines
ses
Appalachia Nation
In addition, a significant amount of small businesses nationwide and in Appalachia lack
legal status information; 44.9% and 45.1%, respectively. When removing businesses with
legal status unknown, Appendix Table 4 and Figure 4 show the percent of sole ownerships
was higher in Appalachia than the nation (49.1% versus 45.8%) and the percent of
corporations was lower in Appalachia (44.7% versus 48.3%).
Composition of Small Businesses by Legal Status in Appalachia and Nation
49.1%
6.2%
44.7%45.8%
6.0%
48.3%
0%10%20%30%40%50%60%70%80%90%
100%
Sole Ownership Partnership Corporation
Perc
ent o
f Bus
ines
ses
Appalachia Nation
Figure 4
Figure 3
Source: Appendix Table 3 – rows Nation Total and Appalachia Total.
Source: Appendix Table 4 – rows Nation Total and Appalachia Total.
17
Sectoral Distribution within Appalachia
Appendix Table 5 represents information on the number of businesses in each sector by
state. The Appalachian region had a large service industry: the percent of service small
businesses was 36.8% of the total number of small businesses. The second largest sphere
was retail trade (17.9%) and third largest was construction at 8.6% of all small businesses.
There were not many outliers in terms of the sector structure among Appalachian states. In
other words, each state had approximately the same percent of small businesses in each
sector. Only in Ohio the percent of agricultural small businesses was much higher than the
aggregate for the region, 7.9% versus 3.7%. One of the possible explanations could be that
Ohio Appalachian counties were located in less mountainous areas than the rest of the
Region. In contrast, since a number of West Virginia counties were mountainous, the
percent of mining small businesses there was higher than for Appalachia in total, 0.9%
versus 0.3%.
The analysis also compared the sectoral distribution of small businesses in MSA and
NonMSA counties (see Appendix Table 6a). Overall, the percentages were rather close
except for agricultural and services. In particular, the percent of agricultural small
businesses was higher in NonMSA than MSA counties (5.1% versus 2.9%) and the percent
of service sector small businesses was higher for MSA than NonMSA counties (38.1%
versus 34.7%). The analysis of the sectoral distribution of small businesses in distressed
and non-distressed counties revealed interesting differences (see Appendix Table 6b). In
distressed counties, the percent of mining small businesses was higher and percent of
construction and finance small businesses was lower. Also, the percent of transportation
and retail small businesses was higher in distressed counties compared to non-distressed
counties (5.8% versus 3.9% for transportation and 20.2% versus 17.8% for retail trade).
Distribution of Businesses by Number of Employees
Appendix Table 7 examines the distribution of small businesses by the number of
employees. The smallest businesses, with the number of employees from 1 to 4, comprised

18
the largest portion of all the small businesses in the Appalachian region (more than 58% of
all small businesses). The second largest category was small businesses with 5 to 9
employees (10.2%). The larger small businesses with number of employees exceeding 10
comprised only 12.5% of total number of small businesses. A similar composition of small
businesses by number of employees was observed in each state.
The composition of small businesses by number of employees in MSAs versus NonMSAs
and distressed versus non-distressed counties shows that percentages of small businesses by
size were close in each of these geographical areas (see Appendix Table 8).
Legal Status of Small Businesses
Appendix Table 9 illustrates the distribution of small businesses by legal status in each
state. The data revealed that almost half of all small businesses (45% in Appalachia) did
not provide information on the legal status of their businesses. To adjust for the large
number of businesses with legal status unknown, this category was excluded from the
analysis and the tables.
Of reporting small businesses, sole ownerships and corporations constituted respectively,
49.1% and 44.7%, of small businesses in Appalachia. Partnerships comprised only 6.2% of
all the small businesses. There were some outliers in this distribution on a state level. The
percent of sole ownerships in Georgia and South Carolina (43.7% and 44.3%, respectively)
was lower than for Appalachia in total (49.1%). On the other hand, the percent of
corporations in those states (51.4% for Georgia and 49.9% for South Carolina) was higher
than the regional total of 44.7%. In addition, the percent of sole ownerships in Ohio
(55.2%) was higher and the percent of corporations (38.7%) was lower than the
Appalachian total.
Comparison of MSA and NonMSA regions shows that percent of sole ownerships in
NonMSA counties was higher than in MSA counties by almost 7 percentage points (see
Appendix Table 10a). In addition, the same pattern can be observed when distressed

19
counties were compared to non-distressed; the portion of sole ownerships was higher in
distressed counties by 2.7 percentage points (see Appendix Table 10b). This phenomenon
can be possibly explained by a greater portion of local businesses versus franchises in rural
and distressed counties. The higher share of sole ownerships in Appalachia as a whole and
in rural and distressed counties might reflect an entrepreneurship of necessity; that is,
Appalachian residents may establish small businesses because of the paucity of wage and
salary jobs.
Lending Analysis
This section provides an extensive analysis of small business lending trends in the
Appalachian region. A descriptive lending analysis becomes richer when keeping in mind
the demographics of the small businesses. As discussed above, the demographic
composition of small businesses was similar for the nation and Appalachia. Like the
nation, the largest percentages of small businesses in Appalachia were in the services and
retail sectors. Similar to the nation, almost 60 percent of the small businesses in
Appalachia had just 1 to 4 employees. Unlike the nation, however, a slightly larger portion
of Appalachian businesses were sole ownerships as opposed to corporations. Overall, the
data reflected lending to very small businesses with just under half of the small businesses
in Appalachia in the services and retail sectors. The small business lending data was for
the year 2003.
Comparison to the Nation
Like business demographic indicators, lending indicators overall for Appalachia were close
to the respective indicators for the nation. Appendix Table 11 and Figure 5 show that
41.7% of small businesses nationwide received small business loans whereas the figure for
Appalachia was 41.4% during 2003. For small business (SB) loans to small businesses
with revenues less than $1 million, the indicators were 25.3% for the nation and 28.4% for
Appalachia. Almost 41% of Appalachian NonMSA small businesses received SB loans

20
and 39.5% of national NonMSA small businesses received loans. For MSA areas, these
indicators were 42.2% for the nation and 41.7% for Appalachia.
The percentage point difference in the ratio of loans to small businesses between MSA and
NonMSA areas for the nation was higher (around 3 percentage points) than for Appalachia
(less than 1 percentage point). For the nation, 42.2% of the businesses in MSAs received
loans whereas 39.5% of the businesses in NonMSA areas received loans. For Appalachia,
41.7% of small businesses received loans in MSA areas and 40.9% of small businesses
received loans in NonMSAs.
Deposit and branching information is presented in Appendix Table 12. It demonstrates that
the small business loan-to-deposit ratio was higher for Appalachia (7%) than for the Nation
(5.2%). The ratio was also higher for Appalachian MSA and NonMSA counties. For
example, the loan-to-deposit ratio in Appalachian NonMSA counties was 7.2% and was
5.8% for NonMSA areas in the Nation.
Branches were more accessible in Appalachian MSAs than national MSAs, but were less
accessible in Appalachian NonMSAs than national NonMSAs. Access to branches is
measured by the number of persons per branch. A higher number of persons per branch
41.4% 41.7%
0%
10%
20%
30%
40%
50%
60%
70%
80%
90%
100%
Appalachia Nation
Percent of Small Businesses Receiving Loans
28.4%25.3%
0%
10%
20%
30%
40%
50%
60%
70%
80%
90%
100%
Appalachia Nation
Percent of Small Businesses with Less than $1 million in Revenues Receiving Loans
Figure 5
Source: Appendix Table 11 – rows Nation Total and Appalachia Total and columns # SB Loans/#SB and # SB loans to SB with =<1mln) / #SB (<$1mln).

21
generally indicate that branches are less accessible since one branch has to serve a larger
population. The number of persons per branch in total was higher for the Nation (3,244)
than for Appalachia (2,896). The same pattern could be observed for MSAs. In contrast,
for NonMSA counties, the number of persons per branch was higher in Appalachia by
more than 500 people during 2003.
When examining small business lending per branch, national MSAs were served better than
Appalachian MSAs but Appalachian NonMSAs were served better than national
NonMSAs. The number of small business loans per branch was significantly higher for the
nation as a whole than for Appalachia. The number of loans per branch was 85.6 for the
nation and 63.6 for Appalachia. For MSA counties, these figures were 98 and 67.8,
respectively. However, for NonMSA counties the number of SB loans per branch was
higher for Appalachia (57.5) than for the whole nation (53.2) (see Figure 6).
Number of Small Business Loans per Branch
98.0
57.567.8
53.2
0
20
40
60
80
100
Metro Areas Rural Areas
Appalachia Nation
Appalachia also compared favorably to the nation when considering small business lending
by minority level of county (see Appendix Table 13). Appalachia contains 371 counties in
which the minority level is between 0 and 20% of the population; 41 counties contain 20%
to 50% minorities. Only 6 counties have a minority level above 50% and all of them are
Figure 6
Source: Appendix Table 12 – column SB Loans/# branches and rows MSA (Nation and Appalachia) and NonMSA (Nation and Appalachia)

22
distressed counties5. NCRC found that for Appalachia, higher levels of minorities were
associated with higher loans-to-SB ratios, meaning that in minority counties a higher
percentage of small businesses received loans. In Appalachian counties with less than 20
percent minorities, the loan to small business ratio was 39.4 percent while in counties with
20 to 50 percent minorities, the ratio was substantially higher at 51.4 percent in 2003. In
counties with more than 50 percent minorities, the ratio was 53.4 percent. Map 1 below
shows that the loans-to-SB ratio was usually higher in counties with substantial minority
populations than the regional loans-to-SB ratio. In addition, the difference between the
ratios for counties with low minority level and high minority levels was also favorable for
the counties with more minorities when considering loans to small businesses with less
than $1million in revenues.
5 For the descriptive analysis part of the report NCRC treated eight cities in Virginia as “county equivalent” even though they lost this status. So, the total number of counties is 418. However, this treatment of Virginia geographical areas does not influence the report’s findings as verified through sensitivity analysis.

23
24
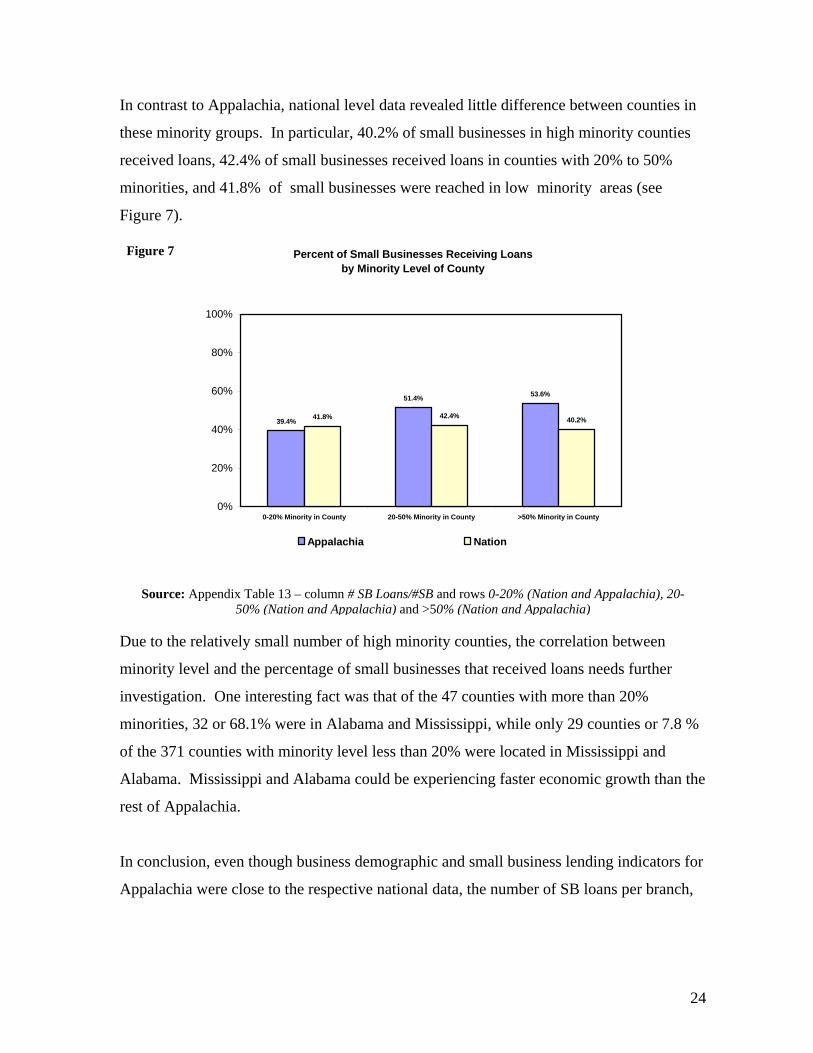
In contrast to Appalachia, national level data revealed little difference between counties in
these minority groups. In particular, 40.2% of small businesses in high minority counties
received loans, 42.4% of small businesses received loans in counties with 20% to 50%
minorities, and 41.8% of small businesses were reached in low minority areas (see
Figure 7).
Percent of Small Businesses Receiving Loans by Minority Level of County
39.4%
51.4% 53.6%
41.8% 42.4% 40.2%
0%
20%
40%
60%
80%
100%
0-20% Minority in County 20-50% Minority in County >50% Minority in County
Appalachia Nation
Due to the relatively small number of high minority counties, the correlation between
minority level and the percentage of small businesses that received loans needs further
investigation. One interesting fact was that of the 47 counties with more than 20%
minorities, 32 or 68.1% were in Alabama and Mississippi, while only 29 counties or 7.8 %
of the 371 counties with minority level less than 20% were located in Mississippi and
Alabama. Mississippi and Alabama could be experiencing faster economic growth than the
rest of Appalachia.
In conclusion, even though business demographic and small business lending indicators for
Appalachia were close to the respective national data, the number of SB loans per branch,
Figure 7
Source: Appendix Table 13 – column # SB Loans/#SB and rows 0-20% (Nation and Appalachia), 20-50% (Nation and Appalachia) and >50% (Nation and Appalachia)

25
SB loan-to-deposit ratio and number of persons per branch were significantly different.6 In
terms of the number of branches per people, NonMSA Appalachian counties appeared
underserved compared to the nation whereas MSA Appalachian areas outperformed
national MSA areas. However, in terms of SB loans per branch, Appalachian NonMSA
areas outperformed national NonMSA areas. In addition, SB loan-to-deposit ratios were
higher in Appalachia than the nation. On some macro indicators of small business lending,
Appalachia appeared to compare favorably to the nation. But differences in meeting small
business credit needs emerged within Appalachia (as detailed below).
State Level Analysis
Detailed analysis on a state level focuses on branching, deposit and loan information for
Appalachian counties aggregated by state and examined in various dimensions.
Appendix Table 14 reveals that 41.4% of small businesses received loans in Appalachia.
The Appendix Table and Figure 8 also illustrate that in the Appalachian portion of 7 states
the ratio was higher than the regional total and in Appalachian portion of 6 states the ratio
was lower than the regional total. In particular, the three states with the lowest ratios were
Kentucky (32.5%), West Virginia (32.9%), and Pennsylvania (33.7%); and the three states
with the highest ratios were Mississippi (58.1%), Alabama (56.1%), and Maryland (49%)
during 2003.
6 The descriptive analysis in this chapter does not control for per capita differences or other economic and demographic differences. The regression analysis below controls for a number of economic and demographic characteristics.

26
Percent of Small Businesses Receiving Loans
32% 33% 34%38% 38% 40% 41%
44% 45% 47% 48% 49%
56% 58%
0%
10%
20%
30%
40%
50%
60%
70%
80%
90%
100%
KY WV PA NY OH VA
Appalac
hia TN SC GA NC MD AL MS
Examining the ratio of the number of loans to small businesses with less than $1million in
revenues shows that a few states switched positions (see Appendix Table 14). The three
states where the ratio was the highest were Mississippi (66.2%), Alabama (40.8%), and
Georgia (33.9%). The lowest ratios were in Pennsylvania (20.8%), West Virginia (21.4%),
and Ohio (22.6%).
Overall, in Appalachia only 28.4% of small businesses with revenues less than $1 million
received small business loans in 2003. In other words, small businesses with revenues
under $1 million received fewer loans relative to all small businesses combined (41.4% of
all small businesses received loans versus 28.4% for small businesses with less than $1
million in revenues).
Another ratio worthy of examination is SB loans under $100,000 divided by the number of
small businesses because loans under $100,000 are typically needed by smaller businesses.
The patterns for the ratio between the number of SB loans of less than $100,000 and
number of SBs were similar to the trends for the total number of SB loans. The three states
with the highest ratios were Mississippi (52.5%), Alabama (49.5%) and Maryland (44.8%).
Figure 8
Source: Appendix Table 14 – column # SB Loans/#SB
27
The lowest ratios were in Kentucky (30%), West Virginia (30.1%) and Pennsylvania
(31.1%).
The ratio of SB loans to deposits is yet another measure of lending activity. Georgia,
Mississippi and Alabama had the highest loan-to-deposit ratios, 11.3%, 10.5% and 9.6%,
respectively. On the other hand, the lowest ratios were in Kentucky (4.4%), Pennsylvania
(4.7%) and Virginia (4.8%).
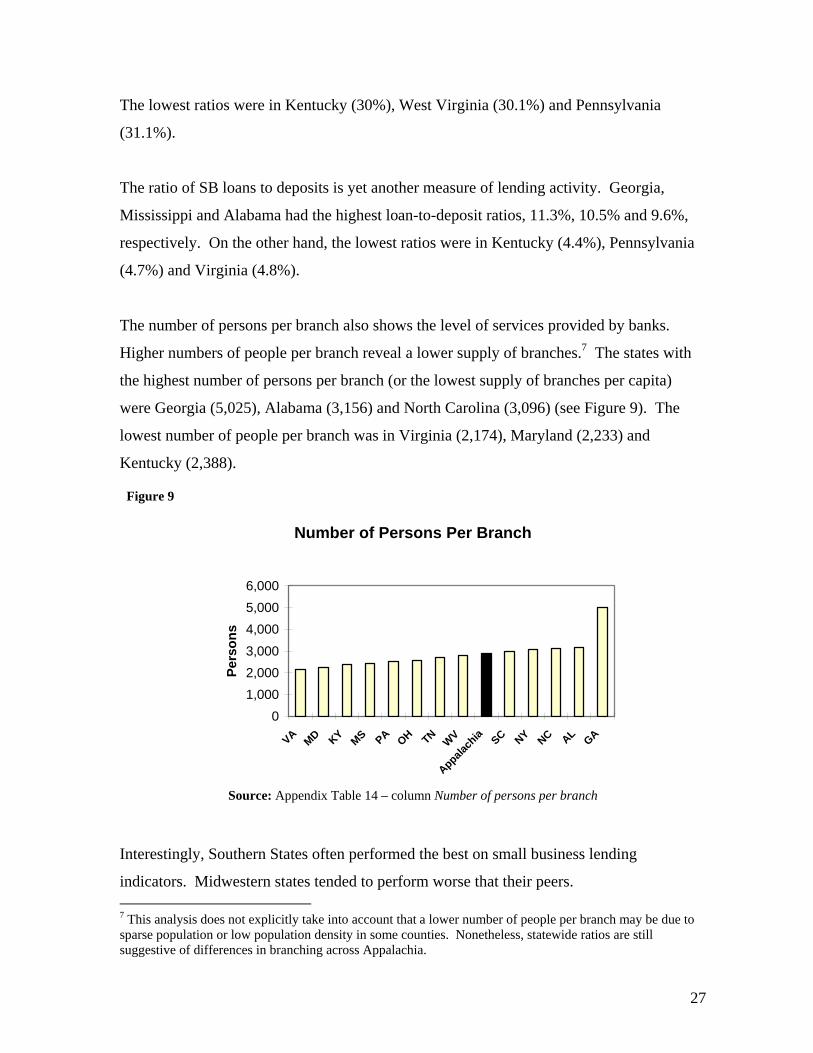
The number of persons per branch also shows the level of services provided by banks.
Higher numbers of people per branch reveal a lower supply of branches.7 The states with
the highest number of persons per branch (or the lowest supply of branches per capita)
were Georgia (5,025), Alabama (3,156) and North Carolina (3,096) (see Figure 9). The
lowest number of people per branch was in Virginia (2,174), Maryland (2,233) and
Kentucky (2,388).
Number of Persons Per Branch
01,0002,0003,0004,0005,0006,000
VA MD KY MS PA OH TN WV
Appalach
ia SC NY NC AL GA
Pers
ons
Interestingly, Southern States often performed the best on small business lending
indicators. Midwestern states tended to perform worse that their peers. 7 This analysis does not explicitly take into account that a lower number of people per branch may be due to sparse population or low population density in some counties. Nonetheless, statewide ratios are still suggestive of differences in branching across Appalachia.
Figure 9
Source: Appendix Table 14 – column Number of persons per branch

28
States by Metropolitan and Non-Metropolitan Areas
The MSA/NonMSA analysis presented in Appendix Table 15 shows that lenders served
businesses better in MSAs than NonMSA counties. For the region in total, the ratios were
close; 41.7% of the businesses in MSAs received loans and 41% of the businesses in
NonMSAs received loans. In nine states, however, the ratio of loans per small businesses
was higher in MSAs than NonMSAs. For example, in Alabama 58.6% of businesses
received loans in MSA counties and 48.6% of small businesses received loans in NonMSA
counties. Likewise, 37 percent of the small businesses received loans in MSAs while 31.2
percent of the businesses received loans in NonMSA counties in Kentucky. In contrast, in
Georgia, New York and Pennsylvania, the percent of small businesses that received SB
loans in MSA counties was lower than in NonMSA counties. In Georgia, 50.6% of small
businesses in NonMSA counties received loans and only 44.7% of small businesses
received loans in MSAs. Map 2 and Table 1 below display lending trends in MSA and
NonMSA counties.
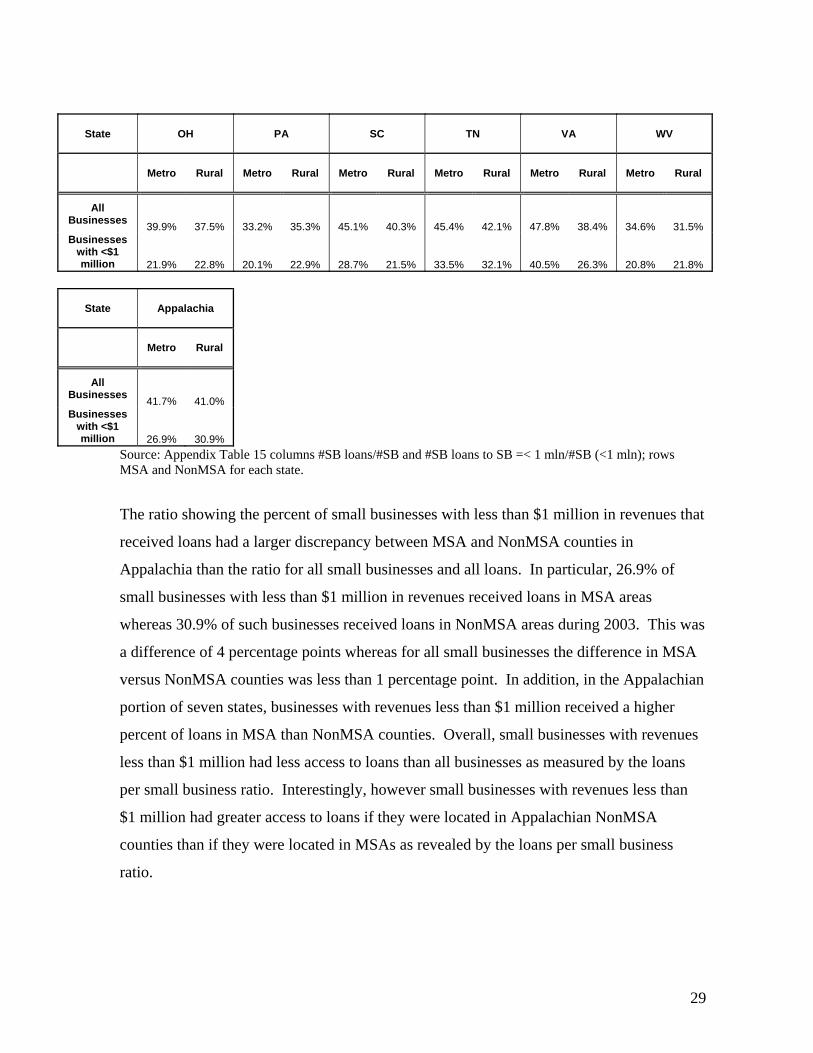
Percent of Small Businesses Receiving Loans in Metro and Rural Areas for Each State
State AL GA KY MD MS NC NY
Metro Rural Metro Rural Metro Rural Metro Rural Rural Metro Rural Metro Rural
All Businesses 58.6% 48.6% 44.7% 50.6% 37.0% 31.2% 49.1% 48.8% 55.5% 48.3% 47.0% 38.1% 38.7%
Businesses with <$1 million
41.8% 38.0% 27.8% 46.5% 27.3% 22.7% 27.0% 31.5% 55.8% 29.1% 30.8% 20.4% 24.7%
Table 1
29
State OH PA SC TN VA WV
Metro Rural Metro Rural Metro Rural Metro Rural Metro Rural Metro Rural
All Businesses 39.9% 37.5% 33.2% 35.3% 45.1% 40.3% 45.4% 42.1% 47.8% 38.4% 34.6% 31.5% Businesses
with <$1 million 21.9% 22.8% 20.1% 22.9% 28.7% 21.5% 33.5% 32.1% 40.5% 26.3% 20.8% 21.8%
State Appalachia
Metro Rural
All Businesses 41.7% 41.0% Businesses
with <$1 million 26.9% 30.9%
Source: Appendix Table 15 columns #SB loans/#SB and #SB loans to SB =< 1 mln/#SB (<1 mln); rows MSA and NonMSA for each state.
The ratio showing the percent of small businesses with less than $1 million in revenues that
received loans had a larger discrepancy between MSA and NonMSA counties in
Appalachia than the ratio for all small businesses and all loans. In particular, 26.9% of
small businesses with less than $1 million in revenues received loans in MSA areas
whereas 30.9% of such businesses received loans in NonMSA areas during 2003. This was
a difference of 4 percentage points whereas for all small businesses the difference in MSA
versus NonMSA counties was less than 1 percentage point. In addition, in the Appalachian
portion of seven states, businesses with revenues less than $1 million received a higher
percent of loans in MSA than NonMSA counties. Overall, small businesses with revenues
less than $1 million had less access to loans than all businesses as measured by the loans
per small business ratio. Interestingly, however small businesses with revenues less than
$1 million had greater access to loans if they were located in Appalachian NonMSA
counties than if they were located in MSAs as revealed by the loans per small business
ratio.

30

31
Distressed and Non-Distressed Counties
Appendix Table 16 and Table 2 show lending patterns for distressed and non-distressed
counties.8 Overall, the percent of small businesses that received SB loans was higher for
non-distressed counties -- 32.1% of the businesses in distressed counties as opposed to
41.9% for non-distressed counties. Map 3 below clearly displays the lower loan to small
business ratios for distressed counties. Similarly, for non-distressed counties 28.5% of
small businesses with less than $1 million in revenues received loans and 26.7% of these
businesses received loans in distressed counties. As for the loans of less than $100,000,
38% of small businesses received these loans in non-distressed counties and 29.9% in
distressed counties.
Percent of Small Businesses Receiving Loans in Distressed and Non-Distressed Counties
% of Loans
to Small Businesses
% of Loans to Smallest
Businesses* % of Loans less than $100,000
Distressed 32.12% 26.71% 29.90% Non-distressed 41.91% 28.51% 38.01% * "Smallest Businesses" are businesses with less than $1 million in Revenues, Source: Appendix Table 16, columns #SB loans/#SB
8 For FY 2005, the Appalachian Regional Commission defines distressed counties as those counties that have a three-year average unemployment rate that is at least 1.5 times the U.S. average of 4.8 percent; a per capita market income (less transfer payments) that is two-thirds or less of the U.S. average of $26,309; and a poverty rate that is at least 1.5 times the U.S. average of 12.4 percent; OR they have 2 times the U.S. poverty rate and qualify on the unemployment or income indicator.
The U.S. average and the distressed county level for each indicator are as follows:
U.S. Average Distressed County Three-Year Average Unemployment Rate (2000-2002) 4.8% 7.3% or more Per Capita Market Income Less Transfer Payments (2001) $26,309 $17,627 or less Poverty Rate (2000) 12.4% 18.6% or more Data Sources: Unemployment data: U.S. Department of Labor, Bureau of Labor Statistics, 2000-2002 Income data: U.S. Department of Commerce, Bureau of Economic Analysis, 2001 Poverty data: U.S. Department of Commerce, Bureau of the Census, 2000
Table 2

32

33
Census Tract Level Analysis
This section presents analysis of small business lending trends on a census tract level. In
particular, an examination is conducted of lending trends in low- and moderate- income
(LMI) census tracts in MSA counties compared to NonMSA counties. In addition, lending
in LMI census tracts located in distressed counties is compared to lending in LMI census
tracts in non-distressed counties.
Appendix Table 17 represents lending trends in low- and moderate- income census tracts in
each state and compares them to lending in all census tracts. Overall, in each state, the
percent of small businesses that received SB loans was higher in all census tracts combined
than in LMI census tracts. For the Appalachian region 41.4% of the businesses in all tracts
received loans but just 35.4% of the businesses in LMI tracts received loans during 2003
(see Figure 10). The difference in the ratio for all tracts and LMI tracts was 6 percentage
points. The three states in which the difference in the ratios was the largest between all
tracts and LMI tracts were Virginia (11.3% percentage points), Ohio (7 percentage points)
and South Carolina (6.9 percentage points). The smallest difference in the ratio was for
West Virginia (2.4 percentage points), Maryland (2.9 percentage points) and Alabama (3.2
percentage points).
41.40%35.39%
0%
10%
20%
30%
40%
50%
60%
70%
80%
90%
100%
All Census Tracts LMI Census Tracts
Percent of Small Businesses Receiving Loans by Income Category of Census Tract
35.39%
23.63%
0%
10%
20%
30%
40%
50%
60%
70%
80%
90%
100%
All Businesses Businesses with Revenues<$1 million
Percent of Small Businesses Receiving Loans in Low- and Moderate- Income Census Tracts
Figure 10
Source: Appendix Table 17 – row Total Appalachia and columns All Census Tracts (# SB Loans/#SB) and LMI Census Tracts (# SB Loans/#SB and number # SB loans to SB with =<1mln / #SB (<$1mln)

34
Small businesses with revenues under $1 million tend to receive the fewest loans as
reflected by the loans to small business ratio. The ratio of loans to small businesses was
usually considerably smaller for loans to businesses with less than $1 million in revenues
than for loans to all small businesses. In particular, for LMI census tracts, 35.4% of all
small businesses and only 23.6% of small businesses with less than $1 million in revenues
received loans (see Figure 10). The three states with the largest difference between these
ratios in LMI census tracts were Maryland (18.8 percentage points), North Carolina (18.4
percentage points) and South Carolina (14.8 percentage points). The smallest difference
was observed in Virginia (6.5 percentage points), Mississippi (7.9 percentage points) and
Kentucky (9.3 percentage points). Interestingly, Mississippi was the only state in which
the loan to small business ratio in LMI tracts was more favorable for small businesses with
revenues under $1 million than all small businesses (see Appendix Table 17).
Another measure of lending is comparing the portion of SB loans in LMI areas against the
portion of small businesses in LMI census tracts. For each state the portion of small
businesses in LMI census tracts was higher than percent of SB loans located in these census
tracts. For the region as a whole 17.7% of all the SB loans were made in LMI census
tracts, however, the percent of small businesses located in these census tracts was 20.7%.
In other words, the portion of loans in LMI areas was 3 percentage points less than the
portion of small businesses in LMI tracts. The three states doing the best on this measure
were Mississippi, North Carolina and Alabama with 0.8, 0.9, and 1.3 percentage points
difference, respectively. The largest difference between the portion of small businesses in
LMI census tracts in a county and portion of small business loans made in LMI areas was
in Kentucky (5.9 percentage points), Virginia (5.5 percentage points) and Ohio (5.1
percentage points). In lending to LMI tracts, no sub-region did consistently better or
worse. In contrast, the Southern region tends to perform better on overall measures of
small business lending.

35
Census Tract Data Compared to County Data on Distressed and Metropolitan Status
Appendix Table 18 represents small business lending ratios in LMI census tracts and all the
census tracts of Appalachia comparing indicators for distressed and non-distressed counties
and MSA and NonMSA counties.
As mentioned above there were more SB loans per small business in non-distressed
counties than in distressed counties as well as in MSA counties versus NonMSA counties.
However, the difference between the ratios for MSA and Non-MSA counties was lower
than the disparity between distressed and non-distressed counties. In contrast, the
difference between MSAs and NonMSAs in lending to LMI tracts was larger than the
difference between distressed and non-distressed counties. In MSA counties 36.9% of
small businesses in LMI census tracts received loans and 41.7% of small businesses located
in all census tracts combined received loans during 2003. For NonMSAs, 31.8% of
businesses located in LMI areas received loans and 41% of businesses located in all census
tracts combined received loans (see Table 3). The difference between LMI census tracts
and all census tracts combined was higher in NonMSA areas, 8.2 percentage points, than in
MSA counties, 4.8 percentage points.
Percent of Small Businesses Receiving Loans in Distressed/Non-Distressed and Metro/Rural Counties
by Income Level of Census Tracts All Census
Tracts LMI Census
Tracts Distressed Counties 32.12% 26.25% Non-Distressed Counties 41.91% 36.53% Metro Areas 41.65% 36.88% Rural Areas 40.98% 31.77%
Source: Appendix Table 18, columns All Tracts and LMI Tracts, #Loans/#SB
For distressed counties, 26.3% of small businesses located in LMI census tracts received
loans and 32.1% of businesses in all census tracts received loans. For non-distressed
counties, 36.5% of LMI census tracts businesses received loans whereas 41.9% of all small
Table 3

36
businesses received loans (see Table 3). Contrary to MSA and NonMSA counties, the
difference between lending in LMI census tracts and all census tracts combined in
distressed counties was closer to the difference between LMI and all tracts in non-
distressed counties -- 5.9 and 5.4 percentage points, respectively.
On another measure of performance - the difference between the portion of businesses
located in LMI census tracts and the portion of loans made in those tracts – distressed
counties did not fare as well when compared to non-distressed counties. The difference
between the percent of businesses located in LMI census tracts and percent of loans in LMI
tracts was 8.1 percentage points in distressed counties but just 2.5 percentage points in non-
distressed counties. In other words, 44 percent of the businesses in distressed counties
were in LMI tracts, but these businesses received just 36 percent of the loans in distressed
counties. On the other hand, 19.5 percent of the businesses in non-distressed counties were
in LMI tracts and they received 17 percent of the small business loans in non-distressed
counties during 2003. In contrast, the difference between the portion of businesses and the
portion of loans in LMI tracts was narrower between MSA and NonMSA counties. For
MSA counties, the difference was 2.7 percentage points whereas the difference for
NonMSA areas was 3.6 percentage points.
Overall, it is reasonable to assert that differences in lending were sharper for businesses in
LMI tracts in distressed counties than for businesses in LMI tracts in non-metropolitan
counties. When observing the loan to small business ratio, the small businesses in LMI
tracts in non-metropolitan counties appeared to have less access to loans than the
businesses in distressed counties. But this observation is made in the context of lower
levels of lending in distressed counties than non-metropolitan counties, meaning that the
differences across income level of tract will be less pronounced when comparing lending in
distressed and non-distressed counties than when comparing lending across metropolitan
and non-metropolitan counties. Given that lower lending levels probably blunt the
differences in the small business to loan ratio in distressed counties compared to non-
distressed counties, the indicator of the portion of loans compared to the portion of small
businesses becomes more important. This indicator suggests less access to loans for small

37
businesses in LMI tracts in distressed counties relative to small businesses in non-
metropolitan counties.
Conclusions
This chapter examined population and small business demographic trends on a national
level and in Appalachia. Within Appalachia, this chapter compared small business
demographic trends across states. The lending analysis then proceeded in a similar manner
– national comparisons were first discussed followed by state, county, and then census tract
analyses.
While Appalachia comprised fewer minorities than the nation as a whole, small business
demographics were remarkably similar. The two largest small business sectors in the
nation and in Appalachia were services and retail. Similarly, almost 60 percent of the small
businesses in Appalachia and the nation were very small, consisting of 1 to 4 employees.
The legal status of the firms was somewhat but not dramatically different between the
United States and Appalachia. The portion of sole ownerships was greater in Appalachia
than the United States by about 3 percentage points and the portion of corporations was
higher in the United States than Appalachia by about 3 percentage points. Within
Appalachia, the composition of small businesses was similar across states and counties
with some notable exceptions. For instance, the percent of agricultural small businesses
was higher in non-metropolitan areas while the percent of service sector business was
higher in metropolitan areas in Appalachia. Also, the percent of sole ownerships was
higher in non-metropolitan areas than metropolitan areas in Appalachia.
Since the small business demographics appeared relatively similar for the nation compared
to Appalachia, it is consistent that lending trends were similar in Appalachia and the nation.
For example, about 41 percent of the businesses in the nation and Appalachia received
loans in 2003. In addition, Appalachia compared favorably against the nation on some
lending indicators. Appalachia compared favorably against the nation when considering
small business loan-to-deposit ratios and small business lending in minority counties. The

38
nation performed better when considering the number of small loans per branch in all
counties, but Appalachia outperformed the nation on this indicator in non-metropolitan
counties.
Within Appalachia, striking differences emerged in access to credit. When considering the
ratio of loans to small businesses, loans to deposits and persons per branch, the Appalachia
parts of southern states tended to have the best performance while the Midwest states
lagged.
On a county level, small businesses in non-metropolitan counties and in distressed counties
had less access to loans when considering loans-to-small business ratios for businesses of
all sizes and when considering loans to small business ratio for businesses with revenues of
less than $1 million. In addition, small businesses with revenues of less than $1 million
had the least access to credit than small businesses of all sizes. Interestingly, however,
small businesses with revenues of less than $1 million were served better in non-
metropolitan areas than metropolitan areas when examining the loans per small business
ratio.
The differences in access to lending were also sharper when comparing distressed and non-
distressed counties than when comparing non-metropolitan to metropolitan counties.
Within counties, businesses in low- and moderate-income tracts experienced the least
access to loans on a number of indicators.
39
Mid-Size Banks and Government Backed Lending: Serving
Communities and Businesses Most in Need of Credit?
The extensive research literature review in this report suggests that smaller banks specialize
in making loans to small businesses. To test this proposition, this chapter looked at the
lending activities of mid-size lenders with revenues between $250 million and $1 billion.
The sample used in this chapter contained the lending records of 123 mid-size banks and
thrifts headquartered in Appalachia that had 1,120 branches.9 It would be desirable to
scrutinize the lending activities of even smaller banks, however, banks with assets of less
than $250 million do not report small business loans per the requirements of the
Community Reinvestment Act (CRA) regulations.
In addition to describing the lending patterns of small banks, this chapter examines the
lending patterns of loans with government-backing. The Small Business Administration
(SBA) provided NCRC with data on government-backed lending on a county level for the
year 2003, which is also the year for the CRA small business lending data analyzed in this
study. The data presented in this chapter reflects the lending activity of the major SBA
program, the SBA 7(a) program. The SBA web page describes the 7(a) program as the
primary business loan program designed to provide access to credit for small businesses
who “might not be eligible for business loans through normal lending channels.” The 7(a)
loans can be used for most purposes ranging from working capital, equipment, land and
building acquisition, and debt refinancing. SBA 7(a) loans have a typical duration of 10
years for working capital and up to 25 years for fixed assets. Traditional banks and thrifts
make the 7(a) loans while the SBA issues the loan guarantees.10
9 NCRC identified the mid-size banks and thrifts headquarted in Appalachia by using the FDIC database Statistics on Depository Institutions available via http://www2.fdic.gov/sdi/index.asp. The CRA small business lending data of these institutions was then used to tabulate their lending levels by county. 10 See description of the SBA 7(a) program on http://www.sba.gov/financing/sbaloan/snapshot.html. Last visited on May 6, 2006.

40
Mid-Size Banks
While it may appear that mid-size banks had a small role in the lending market, their
presence was larger in non-metropolitan counties, distressed counties, and in counties with
high numbers of minorities. Mid-size banks therefore had an important role in serving the
hardest to reach small businesses in Appalachia.
In the Appalachian region, the mid-size banks issued 45,887 of the 530,309 CRA-reported
small business loans during 2003. The mid-size bank market share of loans was 8.7% (see
Appendix Table 19 and Figure 11). In other words, mid-size banks issued 8.7% of all loans
in Appalachia. Mid-size banks exceeded their overall Appalachian market share in the
Appalachian portion of seven states: Alabama, Georgia, Kentucky, Maryland, Mississippi,
Tennessee, and Virginia. They had high market shares of 15.2% of the loans in Maryland
and 22.3% of the loans in Virginia. Their lowest market share was in South Carolina (of
1.8%).
Mid-Size Bank Market Share of Loans in Each State
1.8% 2.1%6.6% 7.3% 7.4% 8.3% 8.7% 10.0% 10.0% 10.0% 11.1%
14.6% 15.2%22.3%
0%
20%
40%
60%
80%
100%
SC WV NY PA NC OH
Appalach
ia AL TN GA KY MS MD VAPerc
ent o
f Loa
ns M
ade
by M
id-S
ize
Ban
ks
The states in which the mid-size bank market share of loans was high were also states in
which their market share of deposits and branches was also high as displayed in Appendix
Table 20. For example, in Maryland, the high mid-size bank market share of loans
appeared to be correlated with a high market share of deposits (37.7%) and branches
Figure 11
Source: Appendix Table 19 – column Mid-size Banks' Market Share
41
(39.7%). A similar relationship between relatively high mid-size bank loan, deposit, and
branch market share was present in Virginia and Mississippi. As suggested by the
literature, mid-size banks’ success in Appalachian lending markets hinges on their branches
and deposit gathering activity. This is evidence of relationship lending featuring direct
contact with and in-depth knowledge of small businesses utilizing mid-size bank branches.
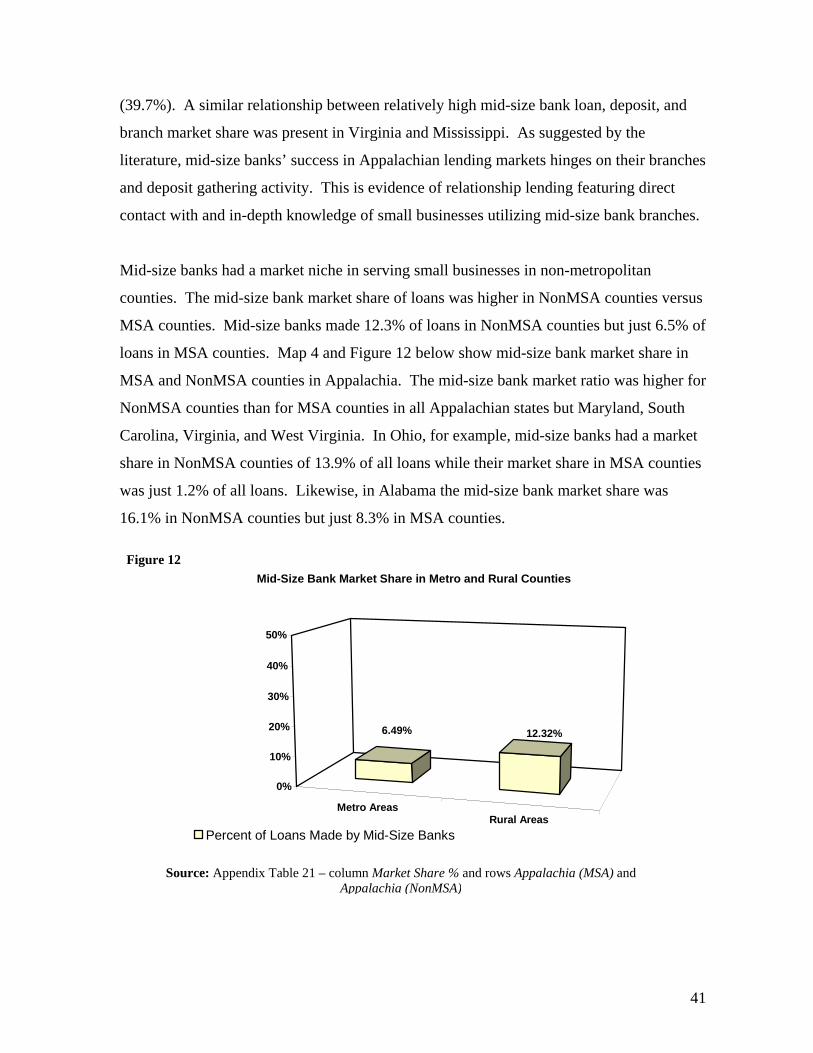
Mid-size banks had a market niche in serving small businesses in non-metropolitan
counties. The mid-size bank market share of loans was higher in NonMSA counties versus
MSA counties. Mid-size banks made 12.3% of loans in NonMSA counties but just 6.5% of
loans in MSA counties. Map 4 and Figure 12 below show mid-size bank market share in
MSA and NonMSA counties in Appalachia. The mid-size bank market ratio was higher for
NonMSA counties than for MSA counties in all Appalachian states but Maryland, South
Carolina, Virginia, and West Virginia. In Ohio, for example, mid-size banks had a market
share in NonMSA counties of 13.9% of all loans while their market share in MSA counties
was just 1.2% of all loans. Likewise, in Alabama the mid-size bank market share was
16.1% in NonMSA counties but just 8.3% in MSA counties.
Metro AreasRural Areas
6.49% 12.32%
0%
10%
20%
30%
40%
50%
Mid-Size Bank Market Share in Metro and Rural Counties
Percent of Loans Made by Mid-Size Banks
Figure 12
Source: Appendix Table 21 – column Market Share % and rows Appalachia (MSA) and Appalachia (NonMSA)

42
Mid-size banks also reached a higher percentage of small businesses in NonMSA counties
than MSA counties. Mid-size banks issued loans to 5% of small businesses in NonMSA
counties and 2.7% of small businesses located in MSA counties during 2003. The pattern
of serving a higher percentage of small businesses in NonMSA counties held for 8 of the
13 Appalachian states. For instance, mid-size banks made loans to 7.3% of the small
businesses in NonMSA counties in Georgia and 3.4% of the small businesses in MSA
counties in the Peach state. Similarly, mid-size banks issued loans to 4% of the small
businesses in NonMSA counties in Pennsylvania and 2% of the small businesses in the
MSA counties in the Keystone state.
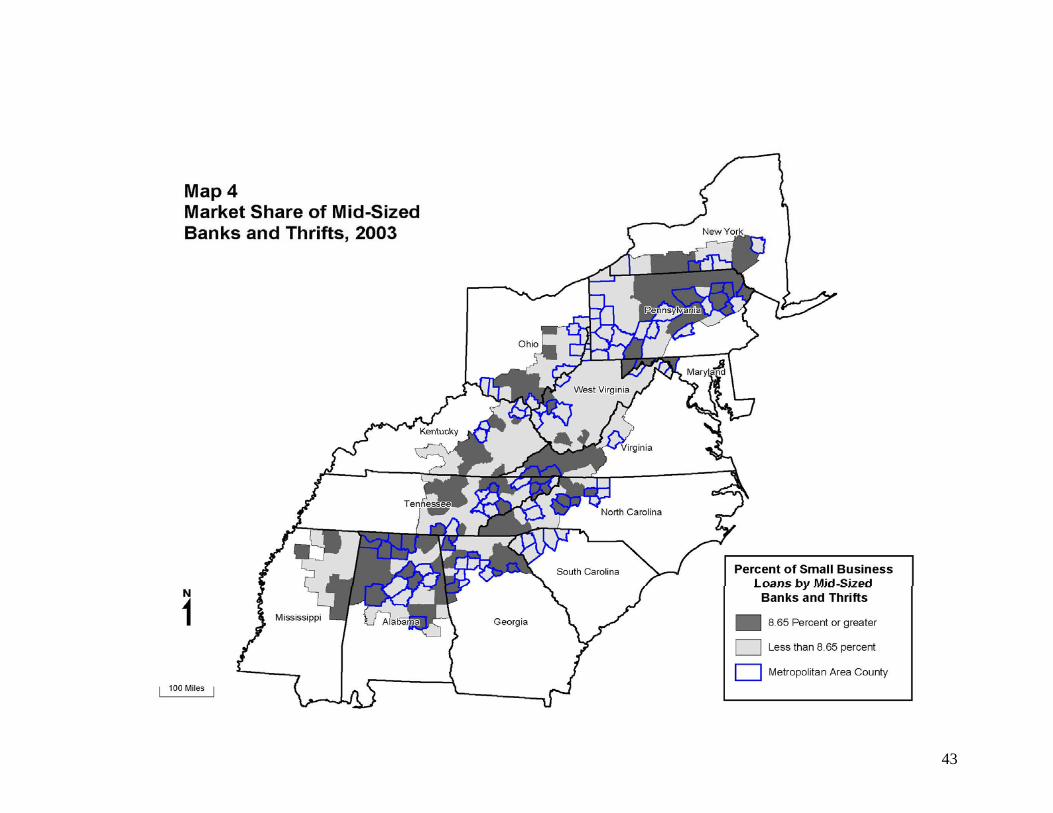
43

44
Just as with non-metropolitan counties, mid-size banks had a larger presence in the lending
market in distressed counties than in non-distressed counties (see Appendix Table 22).
Mid-size banks had a market share of 14.7% of the loans in distressed counties and a
market share of 8.4% in non-distressed counties (see Map 5 and Figure 13 for a pictorial
display of mid-size bank market share in distressed and non-distressed counties).
Interestingly, the mid-size bank median market share in non-distressed counties (4.6%) was
higher than their median market share (1.8%) in distressed counties. Mid-size bank
average market share in distressed and non-distressed counties did not differ by that much.
The discrepancy between overall market share and median market share was probably
explained by the dispersion of mid-size bank lending. While mid-size banks had a smaller
median market share of loans in distressed counties than non-distressed counties, mid-size
banks probably dispersed loans over a greater number of distressed counties than non-
distressed counties in absolute terms or relative to other banks, enabling them to have an
overall market share of loans that was larger in distressed than non-distressed counties.
Non-DistressedCounties
Distressed Counties
8.40%14.67%
0%
10%
20%
30%
40%
50%
Mid-size Bank Market Share in Distressed and Non-Distressed Counties
Percent of Loans Made by Mid-size Banks
Likewise, the percent of small businesses receiving loans from mid-size banks in distressed
areas (4.7%) was higher than the percent of small businesses located in non-distressed
areas (3.5%). This statistic reinforces the finding that mid-size banks concentrated their
lending in distressed counties relative to non-distressed counties.
Figure 13
Source: Appendix Table 22 – column Mid-size Banks' Market Share, number of loans and rows Total- Non-distressed and Total-Distressed

45

46
Mid-size banks appeared to be particularly active in counties with more than 50%
minorities (see Appendix Table 23). The market share of loans made by mid-size banks in
substantially minority counties (minority level >50%) was 28.6% whereas in counties with
less than 20% minorities, mid-size banks issued less than 10% of all small business loans.
The mid-size bank median market share of 10.7% in substantially minority counties was
also much higher than the mid-size bank median market share of 4.2% in counties with less
than 20% minorities. In contrast, mid-size banks had their lowest overall market share of
6.7% in counties with between 20% to 50% minorities.
The analysis in this chapter supports the thesis that mid-size banks were particularly
responsive to the credit needs of small businesses. Overall mid-size bank market share of
loans was greater in NonMSA counties than MSA counties, in distressed counties than
non-distressed counties, and in substantially minority counties than non-minority counties.
Some of the data were not completely consistent with the thesis that mid-size banks had a
niche in traditionally underserved markets. For example, median mid-size bank market
share was lower in distressed than non-distressed counties. But overall mid-size bank
market share in distressed counties was larger in non-distressed counties, most likely due to
a greater dispersion of mid-size bank loans in distressed than non-distressed counties. In
addition, while mid-size bank market share was particularly high in counties with more
than 50 percent minorities, it was lower in counties with 20 to 50 percent minorities than in
counties with less than 20 percent minorities. Mid-size banks in Appalachia were more
successful overall in serving non-metropolitan and/or distressed counties than they were in
serving counties with a moderate to heavy minority population (between 20 to 50 percent
minorities).
SBA 7(a) Loan Program
The SBA loan program had a small presence in the Appalachian and national lending
market. Overall in Appalachia, the 7(a) program had not succeeded in penetrating the
minority small business loan market. One possible explanation was that Appalachian
banks active in the minority community are not heavy users of the 7(a) program. In

47
contrast to its performance in minority markets, the data suggests that the SBA program
had succeeded in penetrating non-metropolitan counties.
Appendix Table 24 shows that the SBA 7(a) program accounted for 4,260 loans in
Appalachia during 2003, or just 0.8% of all loans in the region. Interestingly, the SBA
market share of loan dollars was higher than their market share when considering the
number of loans. The SBA loan program accounted for 2.4% of the loan dollars issued in
Appalachia during 2003. The higher SBA market share when considering loan dollars was
probably due to credit card lending driving down the average dollar amount for non-
government backed loans.
SBA-guaranteed lending did not appear to have a regional pattern. The SBA market share
was not concentrated in any particular sub-region in Appalachia during 2003. The highest
number of SBA-guaranteed loans (2,620 loans) was in Pennsylvania and the lowest was in
Virginia (28 loans). After Pennsylvania, the next highest totals for SBA-guaranteed
lending occurred in Georgia (372 loans), West Virginia (207 loans), and New York (200
loans). The states with the lowest totals besides Virginia were Maryland (35 loans),
Mississippi (49 loans), and Kentucky (66 loans).
The SBA program did not quite reach minorities in proportion to their population in
Appalachia or the nation. While the SBA program did well in serving Asian businesses, it
had the most difficulty in serving African-Americans in proportion to the African-
American population. In the Appalachian region, 9.7% of the SBA 7(a) program loans in
2003 were made to minorities while minorities constituted 12.7% of population. Across
the country, 27.8% of the SBA-guaranteed loans served minorities, but minorities
constituted 31% of the population (see Figure 14).

48
Minorities Share of SBA 7(a) Program Loans Compared to Percent of Population
in Appalachia and Nation
12.71%
30.87%
9.72%
27.79%
0%5%
10%15%20%25%30%35%40%45%50%
Appalachia Nation
% of Population- Minorities % of Loans to Minorities
The SBA program would have served an even lower level of minorities were it not for its
success in reaching Asian-owned businesses. In Appalachia, Asians were less than 1% of
the population, and 5.5% of the SBA 7(a) loans were issued to Asians. Likewise, Asians
across the country enjoyed a greater percentage of SBA-guaranteed loans than their
percentage of their population. Asians constituted 3.6% of the nation’s population and
received 13% of the SBA 7(a) loans during 2003.
The SBA program was not nearly as successful in serving African-Americans as Asians.
The mismatch between the percent of small business loans and the percent of their
population was particularly striking in Appalachia and across the country. In Appalachia,
African-Americans were 8.3% of the population but received 2% of the SBA 7(a) loans
during 2003. On a national level, African-Americans constituted 12.1% of the population
but were issued just 5.4% of the SBA 7(a) loans (see Figure 15). The situation was similar
for Hispanics, but Hispanics did not comprise a large portion of the population in
Appalachia. Hispanics were 2.2% of the Appalachian population and received just 1.2% of
Figure 14
Source: Appendix Table 24 – columns % Minority pop and % of loans, number and rows Total for Appalachia and Total for Nation

49
the SBA-guaranteed loans. Across the country, Hispanics were 12.6% of the population
and were issued just 8.3% of the SBA 7(a) loans.
African-American Share of SBA 7(a) Program Loans Compared to Percent of Population
in Appalachia and Nation
8.26%12.10%
2.09%5.39%
0%
10%
20%
30%
40%
50%
Appalachia Nation
% of Population- African-Americans % of Loans to African-Americ
In the Appalachian portion of states with a considerable minority population, the disparities
in SBA 7(a)-guaranteed lending to African-Americans were pronounced. For example,
21.4% of the population in Alabama was African-American but African-American
businesses received just 4.4% of the SBA 7(a) loans during 2003. Similarly wide
differences occurred in Mississippi, North Carolina, and South Carolina. In Georgia, the
SBA 7(a) program exhibited a disparity in reaching Hispanics in proportion to their
population. Almost 7% of Georgia’s population was Hispanic, but Hispanic-owned
businesses received 3% of the SBA 7(a) loans.
The performance of the SBA program in serving women-owned businesses in Appalachia
matched its performance on a national level. In Appalachia, 20.3% of SBA-guaranteed
loans in 2003 were made to women owned small businesses, which was very close to the
nationwide indicator of 21.3%.
Figure 15
Source: Appendix Table 24 – columns % Afr-Amer pop and % of loans, number and rows Total for Appalachia and Total for Nation
50
Appendix Table 25 illustrates that minority-owned businesses in Appalachia had greater
access to SBA-guaranteed loans if they were located in MSA counties as opposed to
NonMSA counties. Almost 29% of the SBA-guaranteed loans were issued to minorities in
MSA counties but just 7% of the loans were issued to minorities in NonMSA counties in
Appalachia during 2003. The difference for Asians was large. About 19% of the SBA 7(a)
loans were issued to Asian-owned businesses in MSA counties and just 3.5% of the loans
were received by Asian-owned businesses in NonMSA counties during 2003 in
Appalachia. The difference in the portion for African-American businesses was also
substantial; African-American businesses received 6.5% of the SBA 7(a) loans in MSA
counties but just 1.5% in NonMSA counties.
In contrast to the SBA lending patterns to MSA and NonMSA counties, minority-owned
businesses had about as much access to 7(a) loans in distressed as in non-distressed
counties. In non-distressed counties, lenders using the SBA program issued 9.8% of
guaranteed loans to minority-owned businesses. In distressed counties, lenders using the
SBA program offered 8.4% of SBA-guaranteed loans to minority-owned businesses in
Appalachia during 2003. The pattern was quite different across the country; minorities in
distressed counties received a much higher portion of SBA loans than minority-owned
businesses in non-distressed counties. This differential access was driven by the much
higher percentage of Hispanic businesses in distressed counties receiving SBA 7(a) loans
than Hispanic businesses in non-distressed counties across the country. Appalachia did not
have a sizeable Hispanic population, and hence did not exhibit this lending pattern to
Hispanics.
The SBA program was more successful in penetrating NonMSA counties than minority
markets during 2003 in Appalachia. In NonMSA counties, the SBA 7(a) program achieved
a market share of loans of 1% whereas in MSA counties its market share was .34%. Unlike
the market share differences in MSA and NonMSA counties, the SBA program did not
have a greater market share in distressed than non-distressed counties. In addition, other
data indicate that the SBA 7(a) program may not be as successful in distressed counties as
in non-distressed counties. Lenders using the program made 22.3 loans in distressed

51
counties per 10,000 businesses and 68.3 loans per 10,000 businesses in non-distressed
counties (see Table 4).
SBA 7(a) Loans per 10,000 Businesses, 2003-2004
Appalachia
Distressed Counties
Non-distressed Counties
All all USA
All Loans 22.33 68.27 66.2 78.83 Minority owned
businesses 1.17 7.57 7.28 21.62
Women owned 4.33 14.44 13.99 17.02
When considering SBA 7(a) loans per 10,000 businesses on a county level, the data suggest
that the SBA program was not as successful in guaranteeing lending in Appalachia as it
was across the country. In Appalachia, lenders using the 7(a) program issued 66.2 loans
per 10,000 small businesses while they issued 78.9 loans per 10,000 small businesses
across the country. In addition, lenders using the SBA 7(a) program issued just 7.3 loans to
minority-owned businesses per 10,000 businesses in Appalachian counties but 21.6 loans to
minority-owned businesses per 10,000 businesses in counties across the country. For
women-owned small businesses, the ratios were 14 in Appalachia and 17 across the
country.11
Conclusion
Mid-size banks generally performed according to expectations. Their lending was
relatively concentrated in non-metropolitan counties and distressed counties in contrast to
larger banks. They also had a greater market share in substantially minority counties with
11 To generate the data for loans per 10,000 businesses, this report combined 2003 and 2004 SBA 7(a) loan data. Above the report used SBA 7(a) loan data for the year 2003 only.
Table 4
52
populations that were more than 50% minority but had their smallest market share in
counties with 20% to 50% minorities.
The SBA 7(a) program had a higher degree of success in serving small businesses in non-
metropolitan counties than in counties with substantial minority populations. SBA-backed
lending was not offered in proportion to the minority population in either the nation or
Appalachia. SBA-guaranteed lending had a higher market presence in non-metropolitan
counties than metropolitan counties. However, SBA-guaranteed lending served a smaller
percentage of minority-owned businesses in non-metropolitan than metropolitan counties.
The SBA program also did not guarantee as many loans per small businesses in Appalachia
as it did across the country. In sum, it appears that mid-size banks were more consistently
oriented towards traditionally underserved populations while the performance of the SBA
7(a) program was mixed in its success of reaching traditionally underserved markets.

53
Literature Review
Introduction
An extensive literature on small business lending has examined the impacts of restructuring
in the financial industry on banks’ capacities to satisfy credit needs of small businesses.
This inquiry is important since small businesses represent one of the most vulnerable yet
critical parts of the national economy. Accordingly, this chapter will explore the lending
techniques and specializations of small and large banks. As the industry consolidates and
banks become larger, on average, is the industry as a whole still able to meet the variety of
credit needs of small businesses? Alternatively, do small businesses now experience less
access to some types of lending in which smaller banks excelled? The impacts of
consolidation will also be assessed by a review studies that have explored whether small or
large banks are more likely to practice discrimination in small business lending. In
addition, the review discusses lending patterns in rural areas, given the prevalence of rural
areas in the Appalachian region. Finally, the literature review contributes to the report’s
regression analysis in the next chapter by providing insights into the variables to use in the
regression analysis.
Banking consolidation has been at the center of attention for several years due to the large
number of mergers and acquisitions. In June 2002, the portion of total industry assets held
by the largest 50 bank holding companies constituted 70 percent whereas in June 1997 this
figure was 52 percent (Ou, 2005). At the same time number of small banks with the assets
under $500 million decreased from 8,647 in 1997 to 7,208 in 2002. Hence, researchers
have given prominent attention to the impacts of bank consolidation in small business
lending.
Bank consolidation remains a complex and controversial issue. Some researchers argue
that it is not efficient for large banks to provide small business loans as these loans are
associated with relationship financing involving detailed and individualized attention to
small business borrowers. On the other hand, other research indicates that large banks have

54
dramatically increased their small business lending as they have adopted credit scoring and
have achieved economies of scale in small business lending. While large banks have
undoubtedly increased their small business lending, it is not clear that they have the ability
to satisfy all credit needs, particularly the needs for larger loans and lines of credit
associated with the relationship lending of small banks. In fact in recent years, large bank
credit card lending, which is a type of transactional lending, has increased dramatically.
Credit card lending has surged to such an extent that average loan amounts ($32,400 in
2004) made to small businesses with revenues greater than $1 million were actually smaller
than average loan amounts ($42,600) made to the smallest businesses with revenues under
$1 million12. The larger small businesses are receiving a greater portion of credit card
loans than the smallest small businesses.
The increase in credit card lending and the rise of credit scoring lending by large banks
begs the question of whether the range of credit needs of the smallest businesses are being
adequately met. In this era of consolidation, are the smallest businesses receiving an
adequate supply of larger loans and sufficient access to lines of credit, which are more
often associated with smaller banks?13 On the other end of the scale, are the smallest
businesses receiving an adequate supply of credit card lending and small loans; although
large banks are increasing credit card lending is the credit card lending reaching the
smallest of the small businesses?
Relationship and Transactional Lending
In general, researchers agree on the typologies of lending techniques used by large and
small banks. They distinguish between financial statement lending, asset-based lending,
credit scoring, and relationship lending. (Mitchell, 2004). The first three represent
“transactional” lending as they are based on the “hard” or objective information about a
12 FFIEC. Reports – Findings from Analysis of Nationwide Summary Statistics for 2004 Community Reinvestment Act Data Fact Sheet (August 2005). http://www.ffiec.gov/hmcrpr/cra_fs04.htm 13 Smaller banks have legal limits on the size of their small business loans (Berger, Rosen, Udell, 2001) The reference to larger loans made by smaller banks refers to non-credit card loans (credit card loans are usually in amounts of $10,000 or less) and/or loans in amounts greater than $100,000. Credit scoring used by large banks are usually applied to loans in amounts of $100,000.
55
borrower. For underwriting purposes, asset-based lending uses information about the
accounts receivable, inventory, and other forms of collateral. Credit scoring is based on the
owner’s history of using credit. Financial statement lending is rarely used for small
business lending as it looks at the audited financial statement of companies that have an
access to public credit market. In contrast, relationship lending, is based on “soft”
information about the potential borrower. In other words, banks rely on the subjective
information about a borrower that they received out of the lasting relationships rather than
on financial condition of the borrowers. Another indication of relationship lending as
reported by Cavalluzzo, Cavalluzzo, and Wolken (2001) is that 84 percent of the loans
received by small businesses came from lending institutions located in the same city. The
median distance between the firm and the lender was just three miles.
Allen Berger (1999) defines three conditions that should be met for relationship-based
finance to occur. First, information other than data from financial statements, collateral
and other public resources is collected. Second, the information is collected via continuous
communication between the lender and the small business, the customers of the small
business, and local community. Third, the information is confidential and can be used only
for making further lending decisions.
Relationship lending is mainly associated with small banks whereas transactional lending is
typically employed by large banks. Berger and Udell (2001) say that banks employing
relationship lending should delegate more authority to loan officers than those that use
objective information. Small banks are better equipped to delegate authority than larger
ones; smaller banks have considerably fewer loan officers, making it easier for smaller
banks to control, trust, and rely upon the quality of loan officers’ decisions. Relationship
lending is therefore typically done in lower volumes than transactional lending at large
banks. Using automated technology such as credit scoring, transactional lending benefits
from economies of scale. Large transactional lenders serve relatively high number of
customers, enabling them to lower costs per borrower by spreading fixed costs over a large
customer base.

56
Cole, Goldberg, and White provide detailed analysis of differences between relationship,
“character”, and transactional, “by-the-number,” lending. They found that large banks
mostly use “by-the-number” approach and small banks use “character” information which
is based on pre-existing relationships between the bank and a borrower. Using the National
Survey of Small Business Finances, Cole, et al. classify small banks as those with assets
under $1 billion and large banks as those with assets above $1 billion. Cole’s regression
analyses appear to confirm the different lending approaches of small and large banks. For
example, higher debt-to-asset ratios increase the likelihood that large banks will not
approve small business loans whereas small banks are not influenced by debt-to-asset
ratios. Cole et al. hypothesize that small banks possess superior non-financial information
about their customers and are thus able to make decisions not based purely on the numbers.
In the same vein, small banks are more likely to approve loans to small business customers
that have deposits at their banks while large banks are indifferent to deposit relationships.
It appears that small banks are able to better utilize the experience and information gained
through the deposit relationship than large banks.
Impacts of Consolidation
A definitive answer regarding the impacts of consolidation on small business lending will
probably never be reached. It is quite likely that the economic, institutional, and regulatory
context in which mergers occur determine their influence on the level of lending in
communities. Reviewing the literature, Hancook, Peek, and Wilcox (2005) hint at the
possibilities of different outcomes. In a study in the late 1990’s, for example, Berger found
that merged banks reduce their small business lending, but that other lenders in the
community increased their lending in response, often replacing the lost lending of the
merged banks. Similarly in the late 1990’s, Peek and Rosengren (1998) concluded that the
small business lending behavior of the merged bank resembled the behavior of the
acquiring bank instead of the acquired bank. So if the acquiring bank had conducted less
small business lending, the newly merged bank was likely to reduce its level of small
business lending. Other studies showed that mergers of smaller banks actually increased
small business lending while mergers of larger banks had little effect.

57
While the impacts of bank mergers are likely to be influenced differently by economic and
market characteristics, Hancock, Peek and Wilcox (2005) identify important institutional
characteristics that are likely to have more uniform impacts at least for larger banks.
Hancock, Peek, and Wilcox distinguish between acquisition of banks and merger of bank
charters. When a bank holding company (BHC) acquires another BHC, the acquiring BHC
can either absorb the acquired BHC’s banks completely or let the acquired bank(s) continue
lending as a separate entities. In other words, the acquiring BHC can let the acquired
bank(s) remain as a separately chartered institutions or it can merge the banks and
eliminate the charter of the acquired bank(s). To assess the impacts of acquisitions versus
mergers (of bank charters), the study looked at small business lending patterns of the 50
largest bank holding companies excluding credit card lenders. The authors used annual
data for the period of 1997-2002.
A major finding is that small business lending remains the same after acquisitions not
involving mergers of charters. However, acquisitions involving mergers of separately
chartered banks result in declines of small business lending. Researchers used natural log
of total assets, log of acquired assets, and the Herfindahl-Hirschman Index (HHI) as
explanatory, independent, variables. The HHI measured concentration of assets within the
holding company; the higher the HHI, fewer banks within the holding company control
more of the holding company’s assets.
Estimated coefficients for the log of change of asset size of banks are negative and
statistically significant for each model at the 5% level. In addition, estimated coefficients
of the HHI on gross amount of originations and purchases are statistically significant and
have negative values. Thus, internal growth of assets and increasing concentration of
assets through merger of bank charters has a significantly negative impact on small
business lending. In contrast, external growth through acquisitions does not affect small
business lending. The estimated coefficients for the log of acquired assets were not
statistically significant at 5% level. Among the top 50 BHCs in the country, Hancock et al.
conclude that larger BHCs (in terms of asset size) tend to reduce their small business

58
lending. In addition, the reduction is more pronounced when acquiring BHCs merge banks
than when the banks are allowed to operate as separately chartered institutions.
Frame, Srinivasan, and Woosley (2001) reinforce the conclusion of Hancock et al. by
finding that the share of small business loans in a bank holding company’s portfolio
increases with the number of subsidiary banks. Frame et al. hypothesize that a subsidiary
bank structure is associated with decentralized decision-making in which relationship
lending is employed.
Maintaining that large banks increase lines of credit to small businesses, Berger, Rosen,
and Udell (2001) come to different conclusions than a substantial portion of the literature.
They find that large banks in markets in which large banks are dominant are more likely to
increase their line of credit lending to small businesses than smaller banks in markets
dominated by smaller banks. The one exception to this is line of credit lending in amounts
less than $100,000; smaller banks are more likely to make these line of credits available to
small businesses than larger banks. They attribute their findings to different methodology
from the standard literature.
The few studies that examine the impacts of mergers on small business lending in low- and
moderate-income tracts generally find that mergers and acquisitions decrease small
business lending in these tracts. Reviewing the literature, Immergluck and Smith (2001)
state that Samolyk and Richardson (2001) find that banks involved in mergers have smaller
growth rates of lending in low- and moderate-income tracts than banks not involved in
mergers. From 1996 to 1998, the merging banks’ share of small business loans in low- and
moderate-income tracts was 13.6 percentage points lower than banks not involved in
mergers.
Interestingly and importantly, the Immergluck and Smith (2001) review reports that
merging banks tend not to decrease their lending in low- and moderate-income census
tracts in geographical areas covered by their CRA exams; the decrease in lending in low-
and moderate-income tracts occurs in areas outside the scope of the CRA exams.

59
Buttressing the finding of CRA’s impact is a conclusion in the Frame, Srinivasan, and
Woosley study. This study finds that the share of small business lending in a bank’s
portfolio increases as the percent of recently acquired assets increase. Frame et al. suggest
that the positive impact of recently acquired assets is the result of CRA motivating large
banking institutions to negotiate CRA pledges with community groups to boost their home
and small business lending. In other work related to home lending, Bostic and Robinson
have found that banks, in fact, increase their home mortgage lending to low-income and
minority borrowers in geographical areas covered by banks’ CRA agreements and CRA
exams. Regulatory enforcement via CRA exams and the merger application process can
mitigate decreases in lending as a result of mergers and in some cases may actually
increase lending after mergers.
Credit Scoring
As was mentioned above, credit scoring is one of the techniques employed by transactional
lending. Credit scoring has the potential to mitigate adverse impacts mergers by enabling
large banks to boost their number of loans. Credit scoring is a process of assigning a score
to a borrower based on the previous financial behavior of the borrower. A study conducted
by Frame, Srinivasan and Woosley (2001) explores how credit scoring influences large
banks’ tendency to engage in small business lending. They use data on 99 large banks
received through a phone survey. Results showed that 100% of scoring banks used the
credit scoring system to issue loans under $100,000, and 74% used it for loans under
$250,000. Only 21% of banks scored larger loans. Regression results demonstrate that
credit scoring leads to an increase in the portfolio share of small business loans under
$100,000 by 8.4% or about $4 billion per institution. Frame, Padhi, and Woosley (2001)
also found that large banks using credit scoring increased their loans in low- and moderate-
income tracts to a much greater extent than in higher-income tracts.
Another study that looked at the role of credit scoring was conducted by Berger, Frame,
and Miller (2002). They compared “marginal” and “nonmarginal” borrowers. A
“marginal” borrower is a borrower whose credit approval depends on use of credit scoring;

60
and a “nonmarginal” borrower is a borrower who will get her credit approved regardless of
usage of credit scoring. Credit scoring for small business loans under $100,000 lead to an
increase in credit availability. Interest rates on loans increase as credit scoring is used.
Berger et al. suggest that interest rates increase because credit scoring has increased the
number of risky borrowers receiving loans and these borrowers are appropriately charged
higher prices. However, for larger loans ($100,000 to $250,000) the use of credit scoring
does not have a significant effect on credit availability. Indeed, only a few banks in the
sample used credit scoring for loans over $100,000.
While the research suggests that potential decreases in small business lending as a result of
consolidation may be compensated by using credit scoring, it seems apparent that credit
scoring has its limits. At this point, the industry is not employing credit scoring for loans in
amounts greater than $100,000. As long as this remains the case, credit scoring may not be
effective for boosting lending of larger dollar amounts when mergers depress lending of
banks. Moreover, the Berger et al. study shows that credit scoring increases interest rates
for riskier borrowers, per expectations that riskier borrowers are charged higher prices.
However, there is likely to be a segment of riskier borrowers for which credit scoring may
lead to either extremely high interest rates or loan denials (due to insufficient credit history,
for example). These borrowers depend on relationship lending. If mergers in a particular
geographical area decrease small bank relationship lending to a great extent, then mergers
could very well decrease access to credit for the hardest to serve borrowers.
Branches, Credit Scoring, and Mergers
Bank branches are generally found to boost small business lending. Frame, Srinivasan, and
Woosley report that the number of bank branches increases the share of small business
loans in a bank’s portfolio. They also report that branch networks are associated with
centralized decision-making networks and increased use of credit scoring by large banks.
For relationship lending as well, branches are important because they increase customer
contact. Immergluck and Smith (2001) report that their research in Chicago reveals that
banks with the highest percentage of their branches in low- and moderate-income (LMI)
61
census tracts make the highest percentage of their loans in these tracts while banks with the
lowest percentage of branches in LMI tracts make the lowest percentage of their loans in
LMI tracts. Squires and O’Connor (1999) came to similar conclusions in Milwaukee.
Immergluck and Smith review research showing that mergers of banks with branches
within the same zip code resulted in less per capita growth in branches within lower income
areas. Mergers of banks with branch presence in the same metropolitan area also result in
fewer branches in low-income zip codes. By decreasing access to branches in low- and
moderate-income areas, in-market mergers will lead to less lending in low- and moderate-
income areas, given the strong relationship between branches and lending.
Discrimination
Researchers distinguish between statistical and prejudicial discrimination. Statistical
discrimination reflects measurement problems whereas prejudicial involves unjust lending
practices. The research generally concludes that while prejudicial discrimination may not
be widespread, it occurs in certain loan markets and to certain borrowers. Mitchell and
Pearce (2004) using data from 1998 SSBF employ a new approach in that they examine
possible discrimination in relationship versus transaction lending and by lender type
(banks and non-bank finance companies). They state that many researchers regard line of
credit lending as “quintessential” relationship loans since line of credit lending represents a
sustained commitment on the part of the bank to make periodic loans to borrowers over a
specified time period. Only banks with close relationships with businesses are likely to
engage in line of credit lending according to observers. Accordingly, line of credit lending
is classified in regression equations as “relationship” loans while “one-shot” deals or
transaction loans are commercial mortgages, motor vehicle loans, equipment loans, and
capital leases. The authors use data from the 1998 Survey of Small Business Finances
(SSBF) that is conducted at five year intervals for the Federal Reserve. Mitchell and
Pearce construct variables that reflect the degree of market concentration (as measured by
the HHI index) and variables that capture characteristics of the small businesses including
gender, ethnicity, creditworthiness, history of bankruptcy, and asset levels.
62
Mitchell and Pearce find that African-American and Hispanic business owners are less
likely to have bank transaction loans than whites after controlling for market and business
characteristics, but that there is no statistically significant difference in the likelihood of
receiving a bank line of credit (relationship lending). Also, minorities are more likely to
have transaction loans from non-banks. In line with the observation that discrimination is
not uniform, the authors could not detect discrimination against Asians and females. The
counter-intuitive finding that minorities are less likely to receive transaction loans suggests
that smaller banks employing relationship lending may remain an important source of
lending for minorities. Moreover, the trend for large banks to engage in transaction lending
may decrease, not increase access to credit for minorities. Cole et al. also found that
smaller banks are more likely to make loans to African-Americans than large banks with
assets above $1 billion.
Cavaluzzo, Cavaluzzo and Wolken (2001) assess the interplay of discrimination and
market concentration. In the seminal Economics of Discrimination, Gary Becker
hypothesized that discrimination is more likely in highly concentrated markets lacking
significant competition. In less competitive markets, firms can get away with
discrimination while in more competitive markets the discriminating firms are likely to lose
out in the competitive race against firms more willing to hire or serve minorities.
Supplementing data from the 1993 National Survey of Small Business Finances with
creditworthiness data obtained from Dun and Bradstreet, Cavaluzzo, Cavaluzzo and
Wolken examined the connection between demographic characteristics of small business
borrowers, market concentration, and the ability to access credit.
A series of regression analyses revealed that increases in market concentration as measured
by HHI indices result in African-Americans and females being more likely to experience
denials of loan applications. Additionally, results show that African-Americans and
females are more likely to have unmet credit needs (as measured by a fear to apply because
of possibilities of discrimination or actual rejection) when market concentration increases.
Finally, a one percentage increase in concentration as measured by an HHI index causes an
11.40 basis point increase in the price of a line of credit for Hispanic small businesses.

63
Cavaluzzo, Cavaluzzo, and Wolken test the rigor of their model. They conclude that
regression results stand up since there is no correlation between market concentration and
borrowers’ credit scores, meaning that financial institutions do not change their credit
score policy when market concentration changes. Overall, the report concludes that gender
and race discrimination cannot be omitted when assessing differences in credit application
and denial rates. Moreover, their study suggests that consolidation and increasing market
concentration can exacerbate discriminatory behavior.
Demand for Small Business Credit
The literature spends much time scrutinizing the relationships among consolidation,
discrimination, and lending techniques. The literature on the nature of demand for loans by
small business is considerably thinner. An indirect means for assessing the demand for
credit is documenting the types of loans used by businesses of different sizes.
The SBA report, Financing Patterns of Small Firms: Findings from the 1998 Survey of
Small Business Finance, provides detail on the types of credit used by type of small
businesses. The SBA report categorizes traditional loans as line of credits, mortgage,
vehicle, equipment, and leasing loans. Nontraditional loans include loans from owners of
the small businesses themselves and credit cards (business and personal). The report
indicates that around 80% of all the small businesses participating in the survey used loans
at the end of 1998. In addition, the majority (71%) of small businesses used nontraditional
credits, and only 55% utilized traditional loans. The single largest source of credit was
from banks; 38% of the surveyed businesses used banks. In contrast, owners’ loans and
finance companies’ loans were 14.2% and 13.3% of all loans received by small businesses,
respectively. The study also shows that the smallest firms (1-4 employees) do not usually
borrow from commercial banks (only 17% to 31 % of these small firms borrowed from
banks) whereas 53-77% of larger small firms used credit offered by commercial banks.

64
In terms of total debt outstanding as of the end of 1998, lines of credit and mortgage loans
were the two most important types of loans used by small businesses. Mortgage loans,
lines of credit, owner’s loans, equipment and vehicle loans accounted for 31%, 30%, 8%,
and 5%, respectively of total debt outstanding.
Small businesses are not heavy users of loans. Only 15% had more than two loans
outstanding, 25% had only one loan, and about 47% of small firm had no loans
outstanding. However, the portion of small businesses using credit jumps with the increase
of firm size. In addition, smaller firms increasingly use nontraditional types of credit such
as owners’ loans, personal credit cards, and sometimes home equity lines for business
purposes. Minority-owned firms are also less likely to use credit than non-minority owned
firms.
Bitler, Robb and Wolken (2001) compared the use of credit by small businesses over time
by comparing the 1998 and 1993 Surveys of Small Business Finance. Over the 1993 and
1998 surveys, the percent of small businesses using vehicle loans, equipment and “other”
loans decreased. The portion of small businesses utilizing capital leases remained the same
while the portion of firms using credit lines and mortgages increased. Credit usage and
availability depends on the firm’s age; the portion of young firms (less than 5 years old)
that receive credit lines, loans, or leases is smaller than the percentage of older firms.
Along the same lines, Haynes, Ou, and Berney, using the 1993 NSSBF data, found that
large banks are more likely to lend money to larger and older small businesses.
Reporting on the supply of credit to different categories of businesses most likely under-
states the needs of small businesses for credit. A significant number of small businesses
that desire credit do not apply because they fear rejection. Cavaluzzo et al. (2001) found
that almost half of all small businesses in the 1998 SSBF desired credit but half of these
firms did not apply because they feared rejection. Of those that feared denial and did not
apply, black females feared the most (86.3%) and only 45.7% of white males feared denial.
Because of large-scale fear of rejection, patterns of lending do not necessarily indicate that
credit needs of various types of small businesses are satisfied. While the SSBF data reveals
65
that larger, older, and non-minority firms are most likely to use credit, it is quite plausible
that smaller, younger, and minority firms are not receiving the credit they need because of
real and perceived obstacles in access to credit.
Credit Demand in Rural Markets
Just like assessing overall credit demand, documentation of credit demand in rural areas is
sparse. The USDA study’s Credit in Rural America examines access for credit in rural
areas of the U.S. Firstly, the report indicates that data collection is fraught with difficulties.
In particular, it states that researchers usually must rely on limited survey data that usually
shows that borrowers in rural areas are satisfied with their credit or obtaining loans is not a
priority for them. While the report suggests that financial institutions provide necessary
loans for rural communities, the report documents differences between operations of banks
in urban and rural areas and emphasizes lack of competition in rural markets. This leads to
unmet needs for credit in some communities. The study also reveals that while farm
sectors and housing are well served, credit needs for rural development projects and non-
farm businesses need additional attention.
The 1998 Mt. Auburn Associates report, Capital and Credit Needs in the Appalachian
Region, conducted for the Appalachian Research Commission is one of the few attempts to
comprehensively measure credit needs in a predominantly rural region. Mt. Auburn
Associates measured and assessed demand for small business credit through a series of
telephone interviews of 200 small businesses with more than 5 employees located in
Appalachia. Overall, for the surveyed businesses, the types of financing most frequently
sought were revolving lines of credit (sought by 36 percent of the applicants), equipment
loans (32 percent), equipment leases (25 percent), and fixed rate mortgages (25 percent).
Medium-term working capital and short-term working capital was sought by 18 and 16
percent of respondents, respectively. The most frequently sought loan size amount was for
$10,000 to $49,000, generally for equipment loans and leases, working capital loans, and
revolving credit lines. Larger amounts of $100,000 to $499,000 were generally used for
commercial mortgages, working capital and revolving credit lines. Mt. Auburn found that

66
survey respondents from non-metropolitan counties were less likely to seek financing for
their business than respondents from metropolitan counties. While smaller and larger
businesses demanded similar types of credit and capital, twice as many smaller firms under
5 employees (18 percent as opposed to 8 percent) anticipated having difficulties obtaining
financing over the next two or three years.
Implications
Consolidation presents contradictory influences on small business lending. On the one
hand, larger banks, through the use of credit scoring, have increased lending to small
businesses. On the other hand, the literature suggests that in certain economic and
institutional circumstances, consolidation will decrease small business lending, particularly
when acquiring bank holding companies merge separate bank charters. Banks in
concentrated markets appear more likely to discriminate, surprisingly in the provision of
transactional lending. Branch presence is important for reaching low- and moderate-
income communities; when mergers result in branch closures in low- and moderate-income
or minority communities, the result is likely to be less small business lending.
We will further investigate the impacts of consolidation and the lending patterns of large
and small banks in Appalachia. The statistical analysis in the next chapter will attempt to
shed light on how responsive small and large banks are to credit needs of the smallest
businesses, the influence of bank consolidation and demographic characteristics on small
business lending, and the role of bank branches on small business lending.

67
Regression Analysis of Small Business Lending in Appalachia
Introduction
Drawing on the insights gathered from the literature review, this chapter will test the
influence of bank consolidation, credit scoring, the number of branches, the minority
population share, median household income, metropolitan and distressed county status, and
small business firm size in three econometric models to analyze lending outcomes for all
lenders, mid-size banks and SBA lenders. The chapter will assess the impact on lending
levels of demographic and economic factors such as income levels, the portion of
minorities on a county level, and the metropolitan/non-metropolitan and distressed/non-
distressed status of counties. The chapter will also examine the impact of firm size of the
small business sector on lending such as the number of businesses with four or fewer
employees. In addition, NCRC was able to secure data from Dun and Bradstreet on the
credit scores of small businesses on a county level for Appalachia. The chapter will
therefore add an examination of the impacts of creditworthiness on the level of lending.
Finally, the chapter will scrutinize the effect on lending of banking characteristics on a
county level including the level of concentration and the number of branches.
One of the significant inquiries for the regression analysis is probing the extent to which
banks of various asset sizes respond to the credit needs of the smallest businesses in
Appalachia as well as businesses in distressed counties. The literature suggests that smaller
institutions with assets under $1 billion will be more responsive to the needs of the smallest
businesses. Accordingly, NCRC will assess the impacts of demographic and economic
factors on mid-size bank lending. In addition, NCRC has obtained SBA loan data, and
will determine if SBA lending patterns resemble those of the smaller or larger banks
making non-government backed loans. The literature is surprisingly silent on patterns of
SBA lending so an econometric analysis of SBA lending represents value added.
This chapter has developed models for the three different types of lenders. These three
models have the following dependent variables: 1) lending by all lenders of all asset sizes

68
reporting CRA small business loan data, 2) lending by mid-size banks with assets between
$250 million and $1 billion, and 3) SBA lending.
For each model, the chapter will describe an expectation or hypothesis of the impacts of
various demographic, economic and structural variables. For example, it will describe the
expected impact of the metropolitan or non-metropolitan status of a county on the level of
lending. In some cases, additional descriptive analysis will further illustrate the
expectations of how the variable will impact lending. In other cases, references will be
made back to previous chapters in describing the expectations of the variable’s impact.
After describing the expectations for each of the variables, NCRC will review the actual
impact of each variable and explain whether the actual impact matched our expectations.
NCRC tested for collinearity and heteroskedasticity; the models were free from these
problems. The data for our regressions were on a county level. A number of researchers
use national surveys sponsored by the Federal Reserve that contain data on a firm level.
Researchers are also starting to use the CRA small business loan data on a county or census
tract level. NCRC’s models were based on county level data due to the availability of
concentration indices on a county level, credit score data on a county level, and because
counties were relatively small in terms of population in many cases in Appalachia.
Data for the year of 2003 was used for this study. NCRC opted against longitudinal
analysis because the CRA small business data has experienced definitional changes (for
example, reporting of renewals changed) over the years. The Appalachian region was in a
weak recovery in 2003, which must be kept in mind when examining the results of the data
analysis.
Below is a description of the variables used in each model, the expectations of the
variables’ impacts per the literature review and descriptive data analysis, and results of the
regressions. For each model, we developed two versions: a core model that contained
demographic, economic and banking variables and a full model that included business
demographic variables. In developing the models, NCRC had also tested introducing one
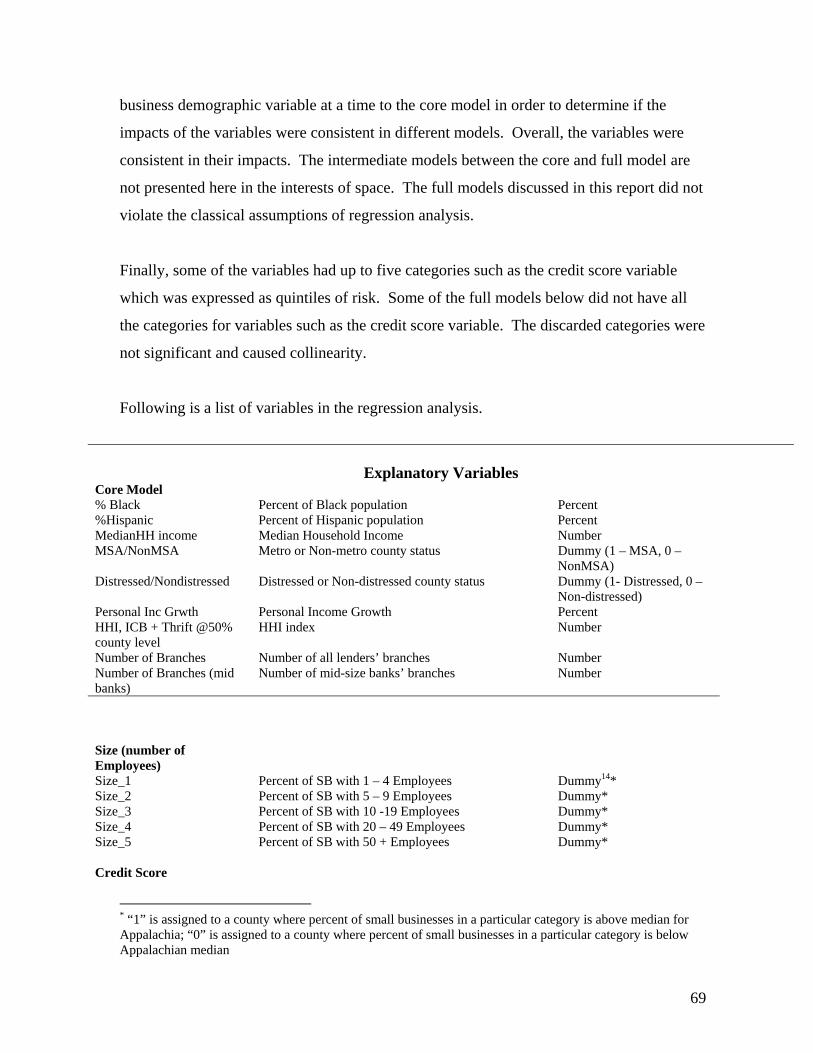
69
business demographic variable at a time to the core model in order to determine if the
impacts of the variables were consistent in different models. Overall, the variables were
consistent in their impacts. The intermediate models between the core and full model are
not presented here in the interests of space. The full models discussed in this report did not
violate the classical assumptions of regression analysis.
Finally, some of the variables had up to five categories such as the credit score variable
which was expressed as quintiles of risk. Some of the full models below did not have all
the categories for variables such as the credit score variable. The discarded categories were
not significant and caused collinearity.
Following is a list of variables in the regression analysis.
Explanatory Variables Core Model % Black Percent of Black population Percent %Hispanic Percent of Hispanic population Percent MedianHH income Median Household Income Number MSA/NonMSA Metro or Non-metro county status Dummy (1 – MSA, 0 –
NonMSA) Distressed/Nondistressed Personal Inc Grwth
Distressed or Non-distressed county status Personal Income Growth
Dummy (1- Distressed, 0 – Non-distressed) Percent
HHI, ICB + Thrift @50% county level
HHI index Number
Number of Branches Number of all lenders’ branches Number Number of Branches (mid banks)
Number of mid-size banks’ branches Number
Size (number of Employees)
Size_1 Percent of SB with 1 – 4 Employees Dummy14* Size_2 Percent of SB with 5 – 9 Employees Dummy* Size_3 Percent of SB with 10 -19 Employees Dummy* Size_4 Percent of SB with 20 – 49 Employees Dummy* Size_5 Percent of SB with 50 + Employees Dummy* Credit Score
* “1” is assigned to a county where percent of small businesses in a particular category is above median for Appalachia; “0” is assigned to a county where percent of small businesses in a particular category is below Appalachian median

70
CS1 Low risk small businesses in terms of credit score Dummy* CS2 Moderate risk small businesses in terms of credit
score. Dummy*
CS3 Medium risk small businesses in terms of credit score.
Dummy*
CS4 High risk small businesses in terms of credit score. Dummy* CS5 Very high risk small businesses in terms of credit
score. Dummy*
Dependent Variables
All lenders Log#SBL Logarithm of the number of Small Business Loans
made by all lenders Number
Mid-size banks LogMid-sizebankloans Logarithm of the number of small business loans
made by mid-size banks Number
SBA 7a Program 7a prg loans Number of loans made through the SBA 7a Program Number
Model 1 – All Lenders (see Appendix Table 31)
Metropolitan Statistical Area/Non-Metropolitan Statistical Area (MSA/NonMSA)
Expectation: The numbers of lenders and small businesses are greater in metropolitan
areas; supportive infrastructure such as counseling agencies, law firms, appraisal firms, and
other entities needed for lending are in greater supply in metropolitan areas. All else equal,
the number of small business loans should be greater in metropolitan areas. In addition, the
descriptive analysis above also suggested that the loans-to-small business ratio was greater
in MSA than NonMSA counties in the Appalachian portion of nine states.
Results: In the core model, the MSA/Non MSA variable was significant with more lending
occurring in MSAs. However, in the full model with credit score and size of business
variables, the MSA/NonMSA variable was insignificant. Expectations were partially
matched in the core model but not in the full model. Perhaps other factors such as small
business demographic variables rather than the metropolitan status of the county have a
stronger influence on lending levels.
71
Distressed/Non-Distressed Counties
Expectation: NCRC’s descriptive analysis suggests that lending levels are lower in
distressed counties. Distressed counties have higher levels of poverty and unemployment,
and overall economic conditions that are less conducive to small business lending.
Results: The results are consistent with the expectations. In each model this variable was
significant and had a negative sign.
Minority Level in County (Percent Black and Percent Hispanic Variables)
Expectation: The literature suggests that discrimination against minority owned businesses
is a serious possibility that cannot be dismissed. In Appalachia, however, the descriptive
analysis above suggested that lending was higher as the minority level in a county was
greater. It is possible that a regional characteristic could be increasing lending to minority-
owned businesses and/or counties with a substantial minority population in Appalachia. In
contrast, minority-owned businesses in other parts of the country do not fare as well in
access to credit as discussed in the analysis above.
Results: Results contradicted the findings in the literature but were consistent with the
descriptive analysis above. In particular, in the core and full models minority variables
were statistically significant and had positive signs, which indicated that lending was
higher as the minority population in a county was higher. This can have the following
explanation: in Southern Appalachia, the highest growth areas are the counties north of
Atlanta, Georgia where there has also been the highest growth in the Hispanic population,
so there should be a positive and direct association with the number of business loans,
although this could be an indirect effect induced by the regional growth trend. However,
an income growth variable was introduced in the model (see below), suggesting that the
level of Hispanics in a county is having a positive and independent impact in small
business lending levels in Appalachia.
72
Deal-flow considerations may explain the increase in lending associated in predominantly
African-American counties. Lending to African-American businesses may be higher in
substantially African-American counties because the high concentration of African-
American businesses in those counties increases the likelihood that African-American
businesses will receive loans. Again, African-American small business owners’ experience
in Appalachia is likely to be different than their experience in other parts of the country.
A report of the Minority Business Development Agency15 found that minority-owned
businesses grew dramatically, at 35%, between 1997 and 2002 whereas the total number of
firms grew only 10%. In particular, African-American-owned firms grew 45% and
Hispanic-owned firms at 31%. It is possible that the percent of the African-American and
Hispanic population is a proxy for the minority-owned businesses. If this is the case, the
relationship between number of small business loans in a county and minority population is
expected to be positive.
Median Household Income
Expectation: NCRC’s descriptive analysis revealed that lending was lower in low- and
moderate-income census tracts. We therefore expect that lending will be higher as the
median household income of a county is greater.
Results: Consistent with the expectations. Each model showed that the median household
income variable was significant and had a positive sign indicating that lending levels were
higher in counties with higher median income levels.
Level of Concentration (HHI Index)
Expectation: NCRC obtained from the Federal Reserve Board data on the level of
concentration in each county in Appalachia. The Herfindahl-Hirschman (HHI) index
15 The State of Minority Business Enterprises: A Preliminary Overview of the 2002 Survey of Business Owners, Minority Business Development Agency of the U.S. Department of Commerce, September, 2005.

73
measures the level of concentration. The literature contains a lengthy discussion on the
impacts of consolidation; it appears that markets dominated by larger firms are likely to
experience drop-offs in lending. The descriptive analysis in Appendix Table 26 appears to
support this hypothesis. In Appalachian counties with below median HHI, the median
number of small business loans was 1,120. In counties with above median, HHI, the
median number of loans was 287 (see Appendix Table 26).
Results: The results were consistent with the expectations. The HHI index variable was
statistically significant in each model and had a negative sign which indicated that higher
levels of bank concentration in a county led to lower levels of small business lending.
Branches
Expectation: Existing studies suggest that banks make more small business loans as they
increase their number of branches in a community. NCRC’s descriptive analysis was
consistent with previous studies. The median number of branches in Appalachian counties
was 11 according to Appendix Table 27. In counties with above median number of
branches, the median number of loans by all banks was 1,287. In counties with below
median number of branches, the median number of loans was 235.
Results: Consistent with the expectations. The number of branches variable was significant
in each model and had a positive sign suggesting that banks had higher levels of lending to
small businesses when they had more branches in the area.
Income Growth
Expectation: This variable measures the change in personal income on a county level.
First, all incomes of persons residing in a county are summed. Second, the income growth
variable is derived by computing the percentage increase or decrease between the aggregate
personal income level in 2003 and the income level of 1998. As income levels increase, it
is expected that lending levels would also increase.
74
Results: The results were partially consistent with the expectations. Aggregate income
growth was associated in a statistically significant manner with higher levels of small
business lending in the core model. The sign was positive in the full model but the
coefficient was not statistically significant. NCRC had also anticipated that the income
growth variable would have made the minority variables insignificant because counties
experiencing fast income growth tended to be Appalachian counties with high minority
levels. However, introducing the income growth variable did not impact the significance of
the minority variable.
Size - Number of Employees in Small Business
Expectation: The literature reports that the smallest businesses (those with 1 to 4
employees) were the least likely to borrow. NCRC’s initial hypothesis was that the
regression analysis would show that lending levels were lower in counties with above
median percentage of these businesses. The descriptive data analysis in Appendix Table 28
appeared to provide support for our hypothesis. In counties with below median
percentages (60 percent) of small firms with 1 to 4 employees, banks made a median of 717
loans; in counties with above median percentages, banks made 473 loans.
In the next two categories of employment size (5 to 9 employees and 10 to 19 employees),
all banks had a greater median number of loans in counties with above median percent of
firms in these employment sizes. For instance, in counties with an above median percent of
firms with 10 to 19 employees, banks issued a median of 817 loans while in counties with a
below median percent of firms in this category, banks made a median of 465 loans.
Lending patterns were mirror opposites for the next two categories of firm size (20 to 49
employees and 50 and above). The median number of total loans was considerable higher
by about 100 loans in counties with below median percent of firms with 20 to 49
employees than in counties with above median percent of these firms. In contrast, the
median number of loans from all banks was about 400 loans greater in counties with above
75
median percent of firms with greater than 50 employees than in counties with below
median percent of these firms. Banks appeared to make much greater numbers of small
business loans in counties with above median percent of firms with greater than 50
employees but fewer loans in counties with above median percent of firms with 20 to 49
employees. Not too much should be read into this yet, because the median percentages of
these firms per county were relatively small (3.95% for firms with 20 to 49 employees and
2.44% for firms with greater than 50 employees). But further research may find that
something is going on – perhaps the largest firms are supporting their smaller business
counterparts with subcontracts to a greater extent in counties with above median number of
these firms. The subcontracting could then stimulate more loan demand.
Overall, the descriptive data analysis suggests that less lending occurs when there was
above median percentages of the smallest firms (1 to 4 employees) than when there was an
above median percentage of the largest firms.
Results: In the full model, the variable for businesses with 10-19 employees was significant
in determining small business lending volumes. In particular, lenders had higher levels of
lending as the number of these businesses was greater in a county. This was somewhat
consistent with our hypothesis and descriptive data analysis. While all lenders did not have
lower levels of lending in counties with a high number of the smallest businesses per our
hypothesis, lenders made more loans when the small businesses of larger employee sizes
were present in greater numbers. In particular, the regression analysis was consistent with
the descriptive data analysis, which suggested that banks would have higher lending levels
in counties with above median numbers of firms with 10 to 19 employees.
Credit Score
Expectation: The literature suggests that credit scoring has allowed larger, transaction
based lenders to make more loans to small businesses. In contrast, smaller lenders tend not
use credit scores, meaning that their lending levels are unaffected by credit scores. A
number of studies report that smaller lenders employ the relationship model in which

76
underwriting decisions are more qualitative in nature and depend on the lender’s
knowledge of the character and reputation of local small businesses. NCRC obtained Dun
and Bradstreet (D&B) credit score data to test these propositions.
D&B’s commercial code credit score predicts the likelihood that a company will pay its
bills in a severely delinquent manner (90 days past due), or obtain legal relief from
creditors, or cease operations over the next year without paying all outstanding loan
amounts. The score ranges from 101 to 670, with 101 representing the highest risk of
serious delinquency and 670 representing the lowest risk. The credit score data can also be
expressed as quintiles of risk, with 1 representing the lowest risk and 5 representing the
highest risk of serious delinquency. On a county level, the D&B data reveals how many
businesses are in each quintile of risk. D&B uses a sample from its database of 16 million
small businesses to develop credit scores based upon demographic characteristics of the
small businesses, public records, payment performance, and financial ratios (such as
liquidity and efficiency ratios).16
Appendix Table 29 shows the largest portion of small businesses in Appalachia was in the
credit score category of low risk scores. Moreover, the differences among the distribution
of businesses in categories of credit scores were not as large as would be expected. The
table shows that 26% of all Appalachian small businesses had the low risk credit scores,
17.2% had moderate risk, 13.7% had medium risk, 23.6% had high risk, and 18.7% had
very high risk scores.
Considering categories of counties, the largest differences occurred among the distribution
of businesses with low risk and very high risk credit scores. The portion of businesses with
low risk credit scores in non-distressed counties was about 3 percentage points greater than
the portion of businesses with low risk credit scores in distressed counties. Likewise, the
portion of businesses with low risk credit scores was about 5 percentage points greater in
MSA counties than NonMSA counties. On the other end of the scale, the portion of
16 D&B Risk Management Solutions, Understanding the D&B Commercial Credit Score, Copyright 2002, D&B, Inc.

77
businesses with very high risk scores was about 2.5 percentage points greater in NonMSA
counties than MSA counties. The difference between the portion of businesses with very
high risk scores in non-distressed and distressed counties was just under 1 percentage point.
In sum, only the difference in the distribution of businesses with low risk scores between
MSA and NonMSA counties was particularly striking. The difference in the distribution of
very high risk scores was not large among the categories of counties. Thus, it is plausible
that credit score distribution and the metropolitan/non-metropolitan or distressed/non-
distressed status of counties were not correlated or interacting with each other.
The data suggests that banks, including larger ones, were using credit scoring and had
lower small business lending levels in counties with higher portions of higher risk scores
(high risk is represented as low scores in D&B’s scoring system, see above). According to
Appendix Table 30, in counties with above median portions of low risk scores, the median
loan level was 877 loans. In contrast, the median loan level was 382 loans in counties with
below median portion of low risk scores. Starting with the second lowest risk category
(moderate risk) and continuing through the other quintiles of risk, the median lending
levels were larger in below median portions of the risk category and were smaller in above
median portions of the risk category. For example, in counties with below median portions
of moderate risk scores, the median number of loans was 734. In counties with above
median portions of moderate risk scores, the median number of loans was 440.
It is therefore to be expected that lending would be higher in counties populated by small
businesses with low risk credit scores and would be lower in counties populated by
businesses with high and very high risk credit scores.
Results: The full model showed that only the low risk category was significant and had the
expected sign. Banks had higher lending levels in counties with high numbers of the
lowest risk businesses. Interestingly, banks did not have statistically significant lower
levels of lending in counties with above median portions of higher risk scores. Despite the
insignificance, the signs were in the expected direction; that is, lending would be lower if
78
the variables had been significant. The results suggest that banks were most sensitive to
higher portions of low risk businesses, with significantly higher levels of lending in
counties with above median portions of these businesses. This was consistent with
expectations. The lack of significant impacts of the other credit score quintiles did not
necessarily refute the initial expectations. The initial expectations would be refuted
completely only if lending was higher as greater portions of higher risk businesses were
present.
Model 2 – Mid-Size Banks (see Appendix Table 32)
Metropolitan Statistical Area/Non-Metropolitan Statistical Area (MSA/NonMSA)
Expectation: The descriptive data analysis above showed that mid-size banks made a
greater number of their loans in NonMSA counties and had a higher market share of loans
in NonMSA counties than MSA counties. However, the median number of mid-size bank
loans was greater in MSA than NonMSA counties. Mid-size banks probably dispersed
more of their loans over a greater number of NonMSA counties than other banks. But on a
per county basis, it is to be expected that mid-size banks would be making fewer loans in
NonMSA counties than MSA counties.
Results: The results show that the MSA/NonMSA variable was not significant in either the
core or the full model. Just as with all banks, it appears that MSA/NonMSA status did not
have a statistically significant impact on lending. This finding was somewhat contrary to
initial expectations, but suggests that in and of itself, MSA/NonMSA status did not exert a
large influence on lending for mid-size or other banks.
Distressed/Non-Distressed Counties
Expectation: Mid-size banks had a higher market share of loans in distressed than non-
distressed counties. But just like other banks, mid-size banks had a lower median number
of loans in distressed than non-distressed counties. Perhaps, mid-size banks did not lower

79
their lending to the same extent as other banks in distressed counties, thereby accounting
for their larger market share in distressed counties. Nevertheless, the lower median number
of loans in distressed counties suggests that mid-size bank lending would be lower in
distressed counties.
Results: In the core model, the distressed/non-distressed variable was significant and
negative. This was consistent with initial observations, meaning that lending was lower in
distressed counties. In the full model, however, the distressed/non-distressed variable
became insignificant. In contrast, the distressed/non-distressed variable was significant and
negative for all lenders in the full model. Two effects may be occurring here that cancel
each other out. On the one hand, mid-size banks may indeed have a niche in distressed
counties, which would boost their market share of loans in distressed counties. On the other
hand, distressed economic conditions in distressed counties may lower lending levels of
banks in general.
Minority Level in County (Percent Black and Percent Hispanic Variables)
Expectation: The literature reports that smaller and mid-size banks with assets below $1
billion are more likely to make loans to minority-owned businesses. It is possible that this
could also apply to counties with high levels of minorities, suggesting that the minority
level of a county may be a positive and statistically significant variable. However, the
descriptive data analysis suggested that mid-size bank market share of loans was actually
the lowest in counties with 20% to 50% minorities although mid-size banks had a higher
median number of loans in counties with 20% to 50% minorities than in counties with less
than 20% minorities. Although the descriptive data was mixed, the initial expectations
were that mid-size banks would have lending patterns similar to other banks; that is,
lending levels would be higher in counties with more minorities.
Results: The impact of the percent African-American and Hispanic variables were
consistent with expectations in the full model and core model. Race variables were
80
significant and had positive signs; this implied that mid-size bank lending was higher in
counties with higher levels of minority population.
Median Household Income
Expectation: The expectation for this variable was the same as for all lenders; namely
lending would be higher as median household income was greater in a county.
Results: The core model was consistent with expectations but with a coefficient that was
very small. The full model was not consistent with expectations because the variable was
statistically insignificant.
Concentration
Expectation: Some theories suggest that smaller banks perceive opportunities in more
concentrated markets as customers become dissatisfied with services offered by
oligopolies. These theories suggest that lending by mid-size banks would be higher in
concentrated markets. The descriptive data, however, in Appendix Table 26 reveals that
mid-size banks made a median number of 8 loans in counties with above median levels of
HHI and 66 loans in counties with below median levels of HHI. The median mid-size bank
market share of loans was also lower in counties with above median levels of HHI and
higher in counties with below median levels of HHI. Overall, the descriptive data analysis
suggests that mid-size banks would make less loans in Appalachian counties with higher
concentration levels.
Results: The level of concentration was associated with lower mid-size bank lending in the
core model, and was consistent with initial expectations. In contrast, the level of
concentration was insignificant in the full model. It did not appear that mid-size banks
were seizing competitive opportunities by offering more loans in concentrated markets,
however, higher levels of concentration were not associated with less mid-size bank
lending as it was for other lenders.
81
Income Growth Variable
Expectation: Just as with other lenders, it was expected that mid-size banks would increase
their lending as income growth surged over time in a county.
Results: The income growth variable was positive and statistically significant in the core
model but became statistically insignificant in the full model.
Number of Branches of Mid-Size Banks
Expectation: Mid-size banks appeared to thrive in counties with above median number of
mid-size bank branches. Their market share of loans was 2.1 percent and 5.3 percent in
counties with below median number of branches and in counties with above median
number of branches, respectively, as displayed in Appendix Table 27.17 The median
number of loans was 6 loans in counties with below median number of branches and 95
loans in counties with above median number of branches. We thus expected lending to be
higher in counties with greater number of mid-size bank branches.
Results: The results were consistent with the expectations. Mid-size bank lending was
higher as the number of mid-size bank branches was greater in a county in both the core
and full models.
Number of Employees in Small Business
Expectation: The literature dwells on the “relationship” lending of mid-sized banks which
is geared to serving the smallest businesses. We expected to see greater numbers of loans
by mid-size banks in counties with greater numbers of firms with 1 to 4 employees and 5 to
9 employees. The descriptive analysis suggests that mid-size banks may have a market
17 NCRC used the FDIC database, Summary of Deposits, to identify branches located in Appalachian counties and to identify branches of mid-size banks headquartered in Appalachia. See http://www2.fdic.gov/sod/index.asp for this database.

82
niche with the firms with 5 to 9 employees. Their median market share of loans was one
percentage point higher in counties with above median percent of firms with 5 to 9
employees than in counties with below median percent of these firms (see Appendix Table
28). Moreover, the median number of loans in counties with below median number of
firms with 5 to 9 employees was 13. In contrast, the median number of loans in counties
with above median number of firms with 5 to 9 employees was 37.
Results: The results were not consistent with the descriptive statistics. None of the size
categories of businesses, including the number of businesses with 5 to 9 employees, had a
statistically significant impact on lending. The sign on the coefficient for the 5 to 9
employee variable was in the expected direction (positive) while the signs for the other size
categories were negative.
Credit Score
Expectation: The literature, as discussed above, finds that credit scoring is not a statistically
significant factor in mid-size bank lending and underwriting. Mid-size banks often employ
relationship lending in which first-hand knowledge of local small businesses replace the
quantitative analysis and/or credit scoring as the means for making loans to small
businesses. In contrast, larger banks engage in transactional lending that mostly rely upon
credit scoring and other quantitative techniques for underwriting and issuing loans
(Mitchell, 2004 and Berger and Udell, 2001).
The descriptive analysis reveals that mid-size banks’ lending patterns were similar to other
banks when considering credit score. As shown in Appendix Table 30, mid-size banks had
a higher median number of loans (37) in counties with above median levels of businesses
with low risk credit scores, but they had lower median number of loans (13) in counties
with below median number of low risk scores. The patterns were reversed for mid-size
banks in the other risk categories; that is the number of loans was lower with above median
number of businesses in the higher risk categories. Notwithstanding the descriptive data

83
analysis, we are going to rely on the extensive literature and expect the credit scoring
variables to be statistically insignificant.
Results: The results were consistent with the expectations. The credit score variable was
not statistically significant. Mid-size banks’ lending levels were not affected by the
distribution of credit scores on a county level in Appalachia. Mid-size banks appeared to
be applying the relationship model of lending.
Model 3 – SBA Loans (see Appendix Table 33)
Overall, the expectations for SBA lending were similar to mid-size bank lending because of
the possibility that the “relationship” model of lending was employed to a large extent in
SBA lending. This section will report on the results for each variable.
Metropolitan Statistical Area/Non-Metropolitan Statistical Area (MSA/NonMSA)
Expectation: The descriptive data analysis revealed that the SBA 7(a) program had a
higher market share of loans in NonMSA than MSA counties. Accordingly, the initial
expectation was that SBA 7(a) loans would be higher in NonMSA counties.
Results: In the core model and full models, the variable capturing metropolitan/non-
metropolitan status of a county was negative and statistically significant, meaning that SBA
7(a)-guaranteed lending actually was lower in metropolitan counties. This finding was
different from all banks and mid-size banks. It suggests a focus of SBA 7(a)-guaranteed
lending in Appalachian non-metropolitan areas that was distinct and significant from a
policy perspective.
Distressed/Non-Distressed Counties
Expectation: The descriptive data analysis found that the SBA 7(a) program’s market share
of loans did not differ that much in distressed or non-distressed counties. Therefore, it

84
would be expected that the distressed/non-distressed status of the county would not have
much of an impact on SBA 7(a)-guaranteed lending. As stated above, the SBA 7(a)
program focuses on small businesses who “might not be eligible for business loans through
normal lending channels.” A program goal of this nature could include targeting
economically distressed areas for small business loans, but the SBA 7(a) program
description on the SBA website does not include information on whether geographical
targets have been established for the program.
Results: This variable was not significant in any of the models, whereas it was significant
and negative for all lenders. The result for SBA-guaranteed lending was the same as for
mid-size banks, meaning that mid-size bank lending and SBA-guaranteed lending may not
be negatively influenced by distressed counties in contrast to lending conducted by all
banks.
Minority Level in County (Percent Black and Percent Hispanic Variables)
Expectation: The descriptive analysis above documented that SBA 7(a)-guaranteed
lending did not reach minority-owned businesses in proportion to the minority population
either nationally or in Appalachia. Accordingly, it was expected that larger portions of the
African-American or Hispanic population would result in lower levels of SBA 7(a)-
guaranteed lending.
Results: In the core and full models, the variable capturing the portion of the African-
American population was negative and statistically significant. The Hispanic population
variable was negative in sign but not statistically significant in the models. The findings
for the African-American and Hispanic variables contrasted with all lenders and mid-size
banks; for all lenders and mid-size lenders, loan volumes were higher in counties with
greater numbers of minorities.

85
Median Household Income
Expectation: The SBA program intends to target small businesses who would not otherwise
receive loans. Given this orientation, the initial expectation would be that SBA-guaranteed
lending was less likely than non-government backed lenders to be higher in counties with
higher median income levels.
Results: The results were consistent with the expectations. The median household income
variable was insignificant in the core and full models. Income levels in a county did not
influence SBA-guaranteed lending.
Concentration
Expectation: The descriptive statistics in Appendix Table 26 reveal that the number of
median SBA loans was lower in counties with above median HHI and was higher in
counties with below median HHI. It was therefore expected that SBA-guaranteed lending
would be lower in counties with higher levels of banking industry concentration.
Results: Partially contrary to expectations, the core model showed that SBA-guaranteed
lending was higher when the concentration level was higher. In the full model, the
concentration variable was not statistically significant. Overall, this was a positive finding
in that SBA-guaranteed lending may not be as sensitive as non-guaranteed lending to
higher levels of concentration on a county level. In contrast to SBA-guaranteed lending,
the full model for all lenders revealed lower levels of lending as HHI was higher on a
county level.
Income Growth
Expectations: Counties experiencing higher levels of personal income growth also probably
experienced higher levels of small business formation and growth. It would be expected
that SBA-guaranteed lending would be higher in counties experiencing faster rates of

86
income growth. This could even include poorer counties, as long as the income growth
was fast in these counties.
Results: Contrary to expectations, the income growth variable did not have a statistically
significant impact on SBA 7(a)-guaranteed lending.
Branches
Expectation: The descriptive data analysis in Appendix Table 27 reveals that median and
average levels of SBA-guaranteed lending were higher in counties with above median
number of branches and lower in counties with below median number of branches. Thus,
the expectation was that SBA-guaranteed lending would be higher in counties with greater
number of branches.
Result: In the core and full models, the number of SBA-guaranteed loans was higher in
counties with greater number of branches. This finding was consistent with the
expectations.
Number of Employees in Small Business
Expectation: The descriptive data analysis in Appendix Table 28 does not provide good
clues regarding expectations of SBA-guaranteed lending to businesses of various sizes. In
all the business size categories (except for firms with more than 50 employees), the SBA
7(a) program guaranteed a greater average number of loans in counties with below median
number of firms in the particular size category than loans in counties with above median
number of firms. Based on the purpose of the 7(a) program, it would be expected that
SBA-guaranteed lending would be higher in counties with greater number of smaller
businesses.
Results: In the full model, the variable for small businesses with 5-9 employees was
significant and negative in sign. The variable for small businesses with 1 to 4 employees

87
was statistically insignificant as was the variable for small business with 10 to 19
employees. SBA-guaranteed lending was not lower in counties with higher numbers of the
smallest businesses (1 to 4 employees), but was lower in counties with greater portions of
businesses with 5 to 9 employees. Perhaps, SBA-guaranteed lending was more focused
than all lenders on the smallest firms with 1 to 4 employees since: 1) the 1 to 4 employee
variable was the only variable in the 7(a) model that was not negative in sign, and (2) the
only statistically significant variable for the all lender model was the variable for firms with
10 to 19 employees.
Credit Score
Expectation: The intent of the SBA 7(a) program would suggest that SBA-guaranteed
lending would be higher in counties with greater portions of moderate risk and high risk
small businesses. The descriptive data analysis in Appendix Table 30, however, suggests
that the 7(a) program guaranteed more loans in counties with higher numbers of lower risk
business and fewer loans in counties with higher risk businesses. Since the intent of the
program was not consistent with the data analysis, the initial expectation will split the
difference between the program’s purpose and the descriptive data. The initial expectation
was that credit score distributions would not significantly impact the level of SBA-
guaranteed lending on a county level.
Results: The full model showed SBA 7(a)-guaranteed lending was higher in counties with
greater numbers of businesses in all credit risk quintiles except the moderate risk quintile.
In other words, SBA-guaranteed lending basically remained unaffected by differences in
the distribution of credit scores in counties. Since SBA-guaranteed lending was not lower
in counties with the highest portion of medium or high risk businesses, the SBA program
appeared to be serving its purpose in Appalachia by serving (and not avoiding) higher risk
businesses.

88
Discarded Variables
This report discarded a few of the variables on business characteristics from the equations
due to collinearity problems. It is nevertheless worthwhile to briefly discuss these
variables as initial expectations were that they would influence the levels of lending in
Appalachia.
Sector of Small Business
Expectation: The sector of small businesses appeared to be an important control variable
for regressions. For example, the median percentage of services businesses in a county was
34.8 percent and the median percentage of retail businesses was 18.9 percent. The median
number of loans in counties with above median percentages of services businesses was 470
loans higher than in counties with below median percentages of services firms (see
Appendix Table 34). In contrast, the median number of loans was reversed in the case of
retail firms, with a much higher median of loans in counties with below median
percentages of retail firms.
Results: In the great majority of the equations, the sector variable was insignificant and
created collinearity problems. Two versions of the variable were tried. In the first version,
demographic data on the number of small businesses in each sector were employed. In the
second version, data from Economic Research Service from the United States Department
of Agriculture that characterizes county-wide dependence on a given sector was employed.
Ownership of Small Business
Expectation: Dun and Bradstreet’s description of their credit scores states that corporations
are considered less risky than sole ownerships. Thus, an initial hypothesis was that small
business lending was less in counties with below median percentages of corporations and
above median percentages of sole ownership firms. The descriptive data suggested this
was the case. The median percentage of sole ownerships in a county was 30.6 percent. All

89
banks made 842 loans in counties with below median percentages of sole ownerships, and
434 loans in counties with above median percentages of sole ownerships (see Appendix
Table 35). In contrast, lending was higher when the number of corporations in a county
was greater.
Results: Variables that measured sole ownerships and corporations as a percent of small
businesses created collinearity problems. This was solved by introducing a composite
ownership variable which was a ratio of the sum of sole ownerships and partnerships
divided by the percent of corporations in a county. However, this variable was not
significant, motivating us to delete it from the equations.
Conclusion
The regression analysis produced significant findings of factors accounting for lending
levels. One of these significant findings was that higher numbers of bank branches result
in more small business loans for banks of all sizes and for SBA 7(a)-guaranteed lending.
Furthermore, lower lending levels occurred in distressed counties than non-distressed
counties. Sensible policies would be to encourage bank branch building in Appalachia and
to pursue economic development in distressed counties. When counties move from
distressed to non-distressed status, more small business lending would occur.
An important finding was that counties with higher levels of minorities had higher levels of
small business loans in Appalachia. In contrast, counties with higher levels of bank
consolidation and concentration had lower levels of lending. In addition, counties with the
highest numbers of businesses with low risk credit scores had higher levels of loans.
As predicted by the literature, mid-size banks exhibited lending patterns that reflected
relationship lending. The level of mid-size bank lending on a county level was unaffected
by the distribution of credit scores. In addition, the distribution of small businesses by
employee size did not impact mid-size bank lending unlike lending by all banks which was
higher in counties with a higher portion of businesses with 10 to 19 employees. Also, levels

90
of concentration did not impact mid-size bank lending whereas lending by all lenders was
lower in counties with higher levels of concentration.
The SBA 7(a) program also exhibited distinct lending patterns. It was the only type of
lending that was lower in MSA counties relative to NonMSA counties in Appalachia. This
suggested a non-metropolitan focus by the SBA program in Appalachia. A worrisome
finding, however, was that the SBA program was the only type of lending that was not
higher in counties with greater portions of African-Americans and Hispanics.

91
Assessing the Impact of CRA on Community Development Lending for
Affordable Housing and Small Business in Appalachia Introduction
The Community Reinvestment Act (CRA) of 1977 imposes upon banks and thrifts an
affirmative and continuing obligation to meet the credit needs of communities in which
they are chartered, including low- and moderate-income communities. Four federal
financial supervisory agencies enforce CRA and conduct periodic CRA exams about once
every two or three years for banks with assets above $250 million. CRA exams assess the
level of loans, investments, and services banks with assets above $250 million provide to
low- and moderate-income communities.18 Banks receive CRA ratings for their overall
performance as well as their performance in each state and multi-state metropolitan
statistical area (MSA) in which they have branches. Banks and thrifts have strong
incentives to increase their levels of lending, investing, and services to low- and moderate-
income communities. Low CRA ratings can result in negative publicity and/or delay bank
applications for federal agency approval to merge with another institution or open
additional bank branches.
This chapter will assess the impacts CRA has had on increasing certain types of lending
and investing for affordable housing and small business by banks located in Appalachian
counties. The chapter will use CRA exams of banks headquartered in Appalachia during
the time period of 2001 through 2004 to document levels of financing for affordable
housing and small business development. So far the report has been devoted to examining
access to lending for individual small businesses. In this chapter, the report scrutinizes the
level of community development financing. Community development lending and
investing provides the financing that builds the infrastructure and support systems of small
18 As of September 2005, the CRA exam structure was different for mid-size banks with assets between $250 million and $1 billion and for large banks with assets above $1 billion. The exams for these two types of banks, however, had the same test structure (separate lending, investment, and services tests) during the time period examined by this report. Below, the chapter describes the test structure in more detail. This chapter looked at the most recent CRA exams of banks headquartered in Appalachia; the great majority of exams were conducted during 2001 through 2004. Only about 1 percent of the exams were conducted during 2005.
92
businesses. For example, community development financing would support the
development of small business incubators and Rural Business Investment Corporations
(RBICs). This chapter therefore rounds out the analysis of serving the credit and capital
needs of small businesses. The chapter supplements the previous analysis of lending to
individual small businesses with an analysis of financing the necessary infrastructure and
support systems of small business development.
CRA exams for banks with assets greater than $250 million include sections that assess a
bank’s level of community development lending and investments. Community
development lending and investing include financing for low- and moderate-income rental
and homeowner units as well as for small business incubators and equity vehicles for small
businesses. The purpose of comparing levels of financing affordable housing and small
business is to provide the Appalachian Regional Commission with a new and unique
database of bank financing for these important needs.
This exercise also seeks to reveal the levels at which banks finance affordable housing and
small business and whether a relatively small amount of financing for one of these
activities suggests that more bank financing is required. The chapter will also assess if
CRA has influenced banks to increase their level of bank branching in Appalachian
counties. Finally, the CRA regulations have recently changed. The chapter will contain a
brief description of the new CRA regulations for mid-size banks with assets between $250
million to $1 billion and offer insights into whether the new regulations and exams will
impact the level of community development lending and investing.
Description of Sample Size of Banks and Thrifts
NCRC selected banks in Appalachia that had greater than $250 million in assets as of year-
end 2004, as listed by databases available on the Federal Financial Institutions Examination
Council (http://www.ffiec.gov) web page. Banks and thrifts with assets above $250 million
in assets have more comprehensive CRA exams that scrutinize their lending, investment,
and service activities. In particular, NCRC was interested in the community development

93
lending and investment activities of these banks. At the end of 2004, 227 banks and thrifts
located in Appalachian counties had assets of more than $250 million. NCRC was able to
find the CRA exams for 220 of these institutions. In the seven remaining cases, the CRA
exams could not be tracked down due to a number of possibilities including changes in
charter types, the age of the institution (new or de novo banks may not have been examined
yet), or mergers and acquisitions making it difficult to track name changes to the
institutions.
At the time of their most recent CRA exam, 78 of the 220 banks had less than $250 million
in assets and were examined by regulators using the “small bank” CRA exam. The small
bank CRA exam focuses on lending activities. The remaining 142 banks were examined
using the “large bank” examination that encompasses lending, investments, and services.
The banks with assets less than $250 million at the time of their CRA exam were still
included in the NCRC database and analysis.19 Specifically, these banks were included in
the examination of bank branching patterns, but were not included in the part of the
analysis that considered the levels of community development lending and investing.
Four federal supervisory agencies conduct CRA exams. The Federal Deposit Insurance
Corporation (FDIC) and the Federal Reserve Board (FRB) conduct CRA exams for
institutions charted by state governments. The Office of the Comptroller of the Currency
(OCC) and Office of Thrift Supervision (OTS) perform CRA exams for institutions charted
by the federal government.
19 NCRC thought it was important to capture the banks that had assets over $250 million at year end 2004, but had assets less than that amount in their most recent CRA exam. The next CRA exams of these institutions will be more comprehensive. In addition, their branching patterns could still be assessed. Finally, the small bank CRA exam provides “bonus” points if small banks engage in community development lending and investing. We wanted to see how often small banks in Appalachia took advantage of the bonus point option and engaged in community development and lending.

94
The regulatory agency break down for banks in the sample is as follows:
All Banks Small Banks Large Banks
FDIC 51.8% 57.7% 48.6% FRB 15.0% 9.0% 18.3% OCC 25.5% 25.6% 24.4% OTS 7.7% 7.7% 7.7% Sample Size 220 78 142
The majority of banks and thrifts in our sample were state-chartered institutions as the
FDIC and FRB examined 51.8 percent and 15 percent of the institutions, respectively. The
OCC examined a quarter of the banks. Only 7.7 percent of the lenders were federally
chartered thrifts that were examined by the OTS.
The great majority of CRA exams in the NCRC sample were relatively recent. More than
90 percent of the CRA exams for the large bank sample were from 2002, 2003, and 2004
(23.2%, 36.6% and 31.7%, respectively). CRA Exams from 2001 and earlier made up 7%
of the sample, and exams from 2005 accounted for 1.4%.
Bank Location by State, Metropolitan Area and County
Appalachian counties in Pennsylvania accounted for 42 institutions in the sample or almost
30 percent of the sample. Appalachian counties in Alabama had 20 banks or 14 percent of
the lenders in the sample and Appalachian counties in Tennessee had 10 institutions or 7
percent of the lenders in the sample.
Of the sample of large banks, the break-down by state is as follows:
Count Percentage AL 20 14.1% GA 14 9.9% KY 5 3.5% MD 4 2.8% MS 6 4.2% NC 8 5.6% NY 8 5.6% OH 9 6.3%

95
PA 42 29.6% SC 2 1.4% TN 10 7.0% VA 7 4.9% WV 7 4.9% Total 142 100%
Slightly more than half of the banks and thrifts with assets above $250 million as of year
end 2004 were located in metropolitan statistical areas (MSAs) in Appalachia. One
hundred seventeen banks were located in MSAs and 103 banks were located in non-
metropolitan counties in Appalachia (see Appendix Table 36a). The asset sizes of the
banks located in MSAs were considerably larger; banks located in the MSAs had combined
assets of $420.6 billion versus $73.3 billion for assets of banks located in non-metropolitan
counties (see Appendix Table 36c). Only 11 banks with combined assets of $4.3 billion
were headquarted in distressed counties in Appalachia.
Banks headquartered in Appalachia represent a significant financial resource for
responding to credit and capital needs of small businesses, but planning needs to be
undertaken to leverage increased amounts of bank financing delivered equitably throughout
the region. The imbalance of considerably more bank assets in MSAs is not surprising, but
can perhaps be mitigated by CRA assessment area procedures. It is unlikely, for example,
that the 117 banks located in metropolitan areas have declared only metropolitan areas as
their official CRA assessment areas in which they undergo CRA exams. Many of these
banks may also have non-metropolitan areas designated as assessment areas. ARC officials
and local economic development officials may want to undertake a targeted review of CRA
exams of MSA-located banks to ensure that non-metropolitan counties are included as
assessment areas, especially counties designated as distressed counties.
The other phenomena regarding asset sizes that is important for planning purposes is the
relatively “small” size of banks located in Appalachia. The average asset value of banks
and thrifts in the NCRC sample located in Appalachian counties as of year end 2004 was
$2.2 billion but the median asset size was $364 million (see Appendix Table 36a and
Appendix Table 36b). In other words, a large number of banks and thrift fell into the asset
category of $250 million to $1 billion, an asset category considered to be “intermediate”

96
small banks by the federal financial supervisory agencies. Intermediate small banks may
have more difficulties undertaking large-scale community development financing projects
such as significant Low-Income Housing Tax Credit deals or high volumes of equity
investments in small businesses. These banks, however, may be receptive to a consortia
approach or investing in CDFIs or Revolving Loan Funds to benefit a specific area within
Appalachia in cases in which large scale financing is needed.
The Level of Community Development Investment and Lending for Affordable Housing and Small Business
Banks and thrifts in NCRC’s sample (located in Appalachian counties and with assets of
more than $250 million as of year end 2004) made about $3.53 billion and $1.9 billion in
community development lending and investing, respectively, during a time period of
approximately once every 2.5 years (which was the average time period evaluated by CRA
exams in the sample) (see Appendix Table 37c).20 In other words, lenders in the NCRC
sample made about $5.43 billion in community development lending and investing every
2.5 years.21 This figure of more than $5 billion represents a significant financial resource
for economic development in Appalachia. It is all the more impressive when considering it
does not include dollar totals of loans to individual small businesses and homeowners.
Instead, the $5 billion reflects the amount available for community development projects
such as large scale housing developments or small business incubators that benefit
neighborhoods or even entire rural counties in Appalachia.
Banks located in metropolitan areas made considerably higher levels of total community
development loans and investments than banks located in non-metropolitan areas in
Appalachia. Banks located in metropolitan areas issued a total of $3.27 billion in
20 The average time period for which CRA data on lending and investments was considered on the exams in the NCRC sample was 30.8 months. This average number of months for large bank CRA exams was 32.7 months, and the average for small banks was 26.8 months. The median values were 32 and 24 months, respectively. The prior period investments have been subtracted from the total community development lending and investment totals. 21 This total does not include outstanding investments and loans from previous time periods not made during the most recent CRA exam cycle. The total prior period investments include $16 million for community development lending and $215 million in community development investing.

97
community development loans on their most recent CRA exams while banks located in
non-metropolitan areas made a total of $264 million in community development loans (see
Appendix Table 37c and Figure 16). Likewise, banks located in metropolitan areas made a
total of $1.7 billion in community development investments and banks in non-metropolitan
counties issued $206 million in community development investments. This does not
necessarily translate into much fewer community development loans and investments for
non-metropolitan areas since banks located in metropolitan areas most likely have included
non-metropolitan counties as part of their assessment areas or geographical areas
scrutinized on their CRA exams. But even after taking into account the non-MSA
assessment areas of MSA headquartered banks, non-MSA areas most likely receive
considerably less bank community development lending and investing.
It is also likely the case that the total community development investment and lending
disparities among banks headquartered in metropolitan and non-metropolitan areas are
being driven by a few very large banks. The median community development lending and
investment figures still showed that banks headquartered in metropolitan areas issued
higher levels of community development financing but the differences narrowed
considerably. Banks located in metropolitan areas issued a median community
Community Development Lending in Metro and Rural Areas
Metro Areas, $3,269,832,196
Rural Areas, $264,387,608
Community Development Investment in Metro and Rural Areas
Metro Areas, $1,696,854,929
Rural Areas, $205,892,899
Figure 16
Source: Appendix Table 37 c. Total Values – row CD Lending and CD Investment and columns Rural Areas and Metro Areas

98
development lending level of $1.811 million as opposed to the $1.585 million made by
banks located in non-metropolitan counties (see Appendix Table 37b). Banks
headquartered in metropolitan areas issued a median level of $1.461 in investments while
banks in rural counties made a median level of $848,000 in investments.
NCRC attempted to break down the total community development lending and investing
figures into sub-totals for housing and small business development. This endeavor was
more successful for community development investing as opposed to lending. CRA exams
vary in the level of specific detail they provide on community development financing.
Some exams provide much detail on every community development project financed by
banks while others reveal only total amounts of community development lending or
investing. For whatever reason, the level of detail was greater for community development
investments than lending (perhaps because investments were considered under a separate
test for banks with assets greater than $250 million while community development lending
was considered as part of a lending test). The total amount of community development
lending for all banks in the NCRC sample was $3.53 billion with $3.1 billion that could not
be classified as supporting housing or small businesses (see Appendix Table 37c). In
contrast, most of the investment dollars could be classified as either supporting affordable
housing or small businesses. The total amount of community development investment was
$1.9 billion with $707 million that could not be classified as supporting affordable housing
or small businesses.
Considering the amount of community development lending and investments that could be
classified suggests that the level of bank community development financing supporting
affordable housing is higher than that for small businesses. In total, all banks and thrifts in
NCRC’s sample made $297 million in community development loans that financed
affordable housing versus $117 million in community development loans for small
businesses in Appalachia (see Appendix Table 37c and Figure 17).

99
Similarly, banks and thrifts in NCRC’s sample issued $807 million in investments for
affordable housing as opposed to $174 million in investments for small businesses in
Appalachia during the time period of the most recent CRA exams for the banks and thrifts
in NCRC’s sample. Examining average or median community development loan and
investment levels per bank for affordable housing and small businesses yielded similar
disparities in favor of affordable housing. This analysis is not intended to suggest that
community development financing levels for affordable housing should go down so that
levels for small businesses can go up. Instead, it suggests that banks could be encouraged
to increase their overall levels of community development financing and small business
development.
Examples of Small Business Financing
Some examples of innovative community development financing illustrate that CRA has
motivated important financing for small business development and expansion in
Appalachia. For instance, Union State Bank in Alabama with $257 million in assets made
a construction loan of $1,800,100 for a childcare facility in a moderate income area. The
day care provided its services to all citizens in the area; however, it offered a discounted
rate to low- income individuals. The CRA exam for United Bank in Parkersburg, West
Virginia stated that this bank maintained a $2.2 million equity investment in a small
Community Development Loans by Purpose: Housing and Small Business
Housing, $297,397,431
Small Business,
$117,271,479
Community Development Investments by Purpose: Housing and Small Business
Housing, $807,413,830
Small Business, $174,107,733
Figure 17
Source: Appendix Table 37 c. Total Values – rows CD Lending (Housing and Small Business) and CD Investment (Housing and Small Business) and column All Banks

100
business investment company (SBIC). The SBIC focused on businesses located throughout
West Virginia. Finally, S&T Bank, a Pennsylvania-based bank with $2.2 billion in assets,
invested almost $300,000 in a federal preservation tax credit project, according to its CRA
exam. The project involved an investment in a commercial office building in a moderate-
income census tract.
Relationships Among CRA Ratings, Community Development Investment and Lending Levels
NCRC’s sample revealed that banks with higher ratings or grades on their investment and
lending tests had higher levels of community development investments and lending. While
this finding would appear to be intuitive, it is nevertheless important since it indicates that
if banks are encouraged to perform well on their CRA exams, then the level of community
development financing will increase in Appalachia. Banks can receive one of five ratings
on their lending or investment tests: Outstanding, High Satisfactory, Low Satisfactory,
Needs to Improve, and Substantial Noncompliance.
Substantial differences in investment levels were present for Appalachian banks with
various ratings on their investment test. The median community development investment
level for the 20 banks with Outstanding ratings was $17.3 million and was $2 million for
the 41 banks with a High Satisfactory ratings on their Investment Test (see Appendix Table
38b and Figure 18). Median investment levels drop precipitously for banks with lower
ratings. The 62 banks with Low Satisfactory ratings had median investment levels of
$858,388 and the 18 banks with Needs-to-Improve ratings had median investment levels of
just $84,994.

101
Median Community Development Investments by CRA Rating
$84,995$858,388
$2,003,915
$17,250,000
$0
$2,000,000
$4,000,000
$6,000,000
$8,000,000
$10,000,000
$12,000,000
$14,000,000
$16,000,000
$18,000,000
$20,000,000
Needs to Improve Low Satisfactory High Satisfactory Outstanding
Banks with various ratings also had significantly different ratios of community
development investment to assets. Banks with Outstanding ratings on the Investment Test
had average ratios of community development to assets of .84% (see Appendix Table 38a).
In other words, the average dollar amount of community development investments was less
than 1 percent of bank assets or .84% of bank assets. Banks with High Satisfactory ratings
had ratios of community development investment to assets of .56%. Banks with the lowest
ratings had much lower ratios.
The differences among the mean community development investments to assets ratio were
statistically significant for a number of the ratings categories. The difference between
.56% for banks with High Satisfactory ratings and .22% for banks with Low Satisfactory
ratings was statistically significant (see Appendix Table 38a). The difference between
.22% for banks with Low Satisfactory ratings and .07% for banks with Needs-to-Improve
ratings was also statistically significant. Interestingly, only the differences between banks
with Outstanding and High Satisfactory ratings were not statistically significant.
Figure 18
Source: Appendix Table 38 b. Median Values – row CD Investment
102
A sensible objective is to motivate as many Appalachian headquartered banks as possible
to strive for a High Satisfactory or Outstanding ratings on their investment tests since banks
with these ratings were making statistically significant higher dollar number of investments
in Appalachia than banks with lower ratings. Many banks desire higher ratings on CRA
exams to enhance their public reputation and demonstrate solid CRA performance to the
public and their regulatory agencies.22 If stakeholders (nonprofit organizations, public
agencies, CDFIs, and others) present enticing opportunities, partnerships, and/or programs
for increasing levels of investments, a number of banks will seize these opportunities as a
means of bolstering their CRA ratings and increasing their level of profitable community
development investments.
The community development lending levels were also substantially different for banks with
various ratings on the lending test. Banks with Outstanding ratings on the lending test had
a median community development lending level of $2.6 million (see Appendix Table 39b).
Just going down one notch in the ratings to High Satisfactory resulted in considerably less
community development lending. Banks with High Satisfactory ratings on the lending test
had a median community development lending level of $1.8 million, about $700,000 less
than banks with Outstanding ratings. The difference was even more dramatic between
banks with High Satisfactory and Low Satisfactory ratings. The median community
development lending dollar amount of banks with Low Satisfactory ratings was $654,300,
about one quarter the amount of banks with High Satisfactory ratings (see Appendix Table
39b and Figure 19).
22 The federal regulatory agencies consider CRA performance and ratings when banks submit applications to merge and open branches. Solid CRA performance, consistent CRA performance on all the component tests, and high ratings increase the chances of expeditious approval of bank applications.

103
Median Community Development Lending by CRA Rating
$654,300
$1,826,682
$2,588,500
$0
$500,000
$1,000,000
$1,500,000
$2,000,000
$2,500,000
$3,000,000
Low Satisfactory High Satisfactory Outstanding
The community development lending to asset ratios were substantially different for banks
with various ratings on the lending test but they were not statistically significant. The
community development lending to asset ratios were .96%, .54% and .33% for banks with
Outstanding, High Satisfactory, and Low Satisfactory ratings on the lending test,
respectively (see Appendix Table 39a). One possible reason for the lack of statistical
significance is that the lending test includes a number of other components besides
community development lending. In contrast, the investment test is solely focused on
community development investing. Despite the lack of statistical significance, the absolute
dollar amounts and ratios for community development lending differed greatly among
banks with various ratings on the lending test. Again, the objective should be to motivate
banks to achieve High Satisfactory and Outstanding ratings on the lending test in order to
maximize the amount of community development lending in Appalachia.
Lastly, small bank CRA exams did not provide much of an impetus for banks to engage in
community development lending and investing. As stated above, small banks with assets
under $250 million can receive bonus points for community development financing. Only
two small banks out of 78 small banks in the sample had information on community
Figure 19
Source: Appendix Table 39 b. Median Values – row CD Lending

104
development investments included on their CRA exam. Seven small banks in the sample
had information on community development lending included on their CRA exam.
The Level of Bank Branches in Appalachia
CRA exams include an analysis of bank branching patterns as a component of the CRA
service test. The service test includes the number and percent of branches by income level
of census tract. The branching data in this chapter differed from the branching data
presented in other chapters in that the data here were from CRA exams whereas the
branching data in the other chapters were from the FDIC web page.23 The objective in this
section of the chapter was to describe branching patterns in detail for banks of various asset
sizes and to assess if CRA service test ratings reflected differences in branch penetration in
low- and moderate-income areas. Since branches had a significantly positive impact on the
level of lending as discussed in the regression chapter, it is important to see if CRA exams
are motivating banks to place more branches in low- and moderate-income areas.
The CRA exam data suggested overall differences in branching by category of counties and
confirmed the analysis above that showed a relative shortfall of branches in NonMSA
counties. The CRA exam sample included 7,662 branches; 7,244 branches were owned by
large banks while small banks controlled 418 branches (see Appendix Table 36c). Almost
1,500 branches were located in low- and moderate-income census tracts. Banks
headquarted in MSAs had 5,956 branches while banks located in NonMSAs had just 1,706
branches.24 Interestingly, the median number of branches was 10 branches located in both
MSA and NonMSA counties. The reason for the disparities was the larger banks with
higher average assets in MSA areas. The average number of branches in the two county
categories was quite different: 54 for MSA counties and 17 for NonMSA counties.
23 The previous data on branching from the FDIC was from http://www2.fdic.gov/sod/index.asp and http://www2.fdic.gov/sdi/index.asp. 24 The differences in distressed and non-distressed counties are not discussed because a small sample, just 8 banks, were headquarted in distressed counties. The CRA exam data for branching in distressed counties is contained in the tables.

105
Banks with Low Satisfactory ratings on the service test did not place branches in
proportion to the portion of census tracts that were low- and moderate-income (LMI) in
Appalachian counties. Overall, the banks with different ratings did not differ that much in
the average percent of branches they placed in LMI census tracts. Banks with Outstanding
ratings on the service test located 19.4 percent of their branches in LMI tracts while the
branch distribution in LMI tracts was 19.2 percent and 16.7 percent, respectively, for banks
with High Satisfactory and Low Satisfactory ratings, respectively (see Appendix Table
40a).
The variations in performance became apparent when calculating the difference in the
percent of branches in LMI tracts and the percent of tracts that were LMI. For banks with
Low Satisfactory ratings, the portion of branches in LMI tracts was 5.9 percentage points
less than the portion of tracts that were LMI (see Appendix Table 40a). In contrast, for
banks with Outstanding and High Satisfactory ratings, there was no difference in the
percentages of branches in LMI tracts and the percentages of tracts that were LMI.
Interestingly, the differences on this measure for banks with High Satisfactory and Low
Satisfactory were not statistically significant. Just as was found on the lending test, the
differences in performance on this measure may not be statistically significant because the
service test includes a number of components. However, the differences appear to be
substantial, and point to the desirability of motivating banks to score well on the service
test.
The Future in CRA Performance
The federal banking agencies recently changed the CRA exam format for mid-size banks
with assets between $250 to $1 billion in assets (the change occurred after the time period
in this study).25 Instead of a separate lending, investment and service test, the new mid-size
25 The federal banking agencies changed the CRA regulation in August of 2005 and then adopted new Questions and Answers on the CRA regulation in March of 2006. See the Federal Register, Vol. 70, No. 147, August 2, 2005, pp.44256-44270, and the Federal Register on Friday, March 10, 2006 Volume 71, No. 47, page 12424. The Office of Thrift Supervision (OTS) made different changes to its CRA regulation over several months starting in the summer of 2004. This report does not discuss the OTS changes because of the

106
bank exam will include a lending test and a community development test. The community
development test will assess community development lending, investments and services.
The new exam format raises a series of questions including whether the tests will be as
rigorous and whether levels of community development lending and investing will increase
or decrease in Appalachia.
The new exam for mid-size banks is highly significant for Appalachia. The great majority
of banks located in Appalachia were mid-size banks in NCRC’s sample. Mid-size banks
with assets between $250 million to $1 billion totaled 136 banks in Appalachia while banks
with assets above $1 billion dollars totaled just 40 banks. Small banks with assets less than
$250 million were 44 of the Appalachian banks. Since the great majority of Appalachian
banks now have new CRA exams, it is important that the exams remain rigorous.
Because NCRC found substantial differences in community development lending and
investment levels and branching levels for banks and thrifts with different ratings, it
appears that the current three tests of the large bank exam are effective in identifying
quantitative differences in performance and awarding banks ratings that reflect these
differences. Nationally and especially in Appalachia, the regulatory agencies must ensure
that the new mid-size bank exam format is as effective as the previous large bank exam in
motivating and rewarding mid-size banks and thrifts to offer community development
loans, investments, and services.
A vital element of migrating to the new exams is to establish expectations that banks must
be expected to maintain and improve upon their overall level of community development
(CD) investing and lending. Federal agencies should make clear, for example, that banks
will receive lower ratings if they dramatically decrease their combined levels of CD
lending and investing in the first round of the new CRA exams. The preamble to the new
CRA regulations for mid-size banks included a quote stating that the federal banking
agencies “do not intend to suggest that a bank may simply ignore one or more categories of
small number of federally chartered thrifts in Appalachia and because there is a possibility that the OTS may be changing its CRA regulations again.
107
community development or arbitrarily decrease the level of such activities.” This
guideline, reinforced recently in the Interagency Question and Answer document, must be
implemented in a manner that ensures that community development lending and investing
do not decrease, especially in a region like Appalachia that depends on mid-size banks.
The new community development test for mid-size banks does not have an explicit
criterion for bank branching. It is not clear, for example, if the new exams will carefully
scrutinize the number and percent of bank branches in LMI census tracts. Since substantial
differences of bank branching in LMI tracts exist for banks with different CRA ratings, it is
critically important that the new tests also have rigorous measuring mechanisms for
assessing bank branching in LMI communities. The new Question and Answer document
states that “the presence of branches located in low- and moderate-income geographies will
help to demonstrate the availability of banking services to low- and moderate-income
individuals.”26 This is the closet that the regulatory agencies will come for a specific
branching criterion on the new mid-size bank exam. It is an improvement over earlier
language. Hopefully, it will be interpreted to mean that mid-size banks will still be
assessed by the number and percent of branches in low- and moderate-income areas.
The report found that banks located in metropolitan areas had much higher levels of
community development financing than banks located in non-metropolitan areas. The
regulatory agencies also amended the CRA regulations to provide CRA points for
community development financing in rural middle-income census tracts located in
distressed and underserved counties. It is possible that community development financing
may increase in non-metropolitan and distressed counties as a result of these newly eligible
census tracts.
Community development financing directed to middle-income tracts in distressed rural
counties may indeed be beneficial but must be considered in the overall economic context
of the rural community. On the one hand, a county may be quite distressed economically
and have high poverty rates, meaning that a middle-income tract still has low absolute
26 Federal Register citation, March 2006 on the Interagency Question and Answers, op. cit.
108
income levels. In rural areas, CRA defines income levels based on a statewide median
income for rural counties. This means that middle-income as defined as 80 to 120% of area
median income could still be low in absolute terms. In cases in which middle-income
represents low absolute income levels, community development directed to middle-income
census tracts benefits these particular tracts and could have beneficial effects in
surrounding low- and moderate-income tracts.
On the other hand, a middle-income tract in a distressed county could have a reasonably
high absolute income level in a state in which the median income level of rural counties is
also relatively high. Or the middle-income tract itself could simply have a high median
income level, regardless of the rural statewide median income level. In these instances,
community development financing in the middle-income tract in a distressed county would
still count on CRA exams. However, CRA examiners should also ensure that a bank is
financing community development activities in low- and moderate-income census tracts as
well. The recently revised Interagency Question and Answer document on CRA indicates
that addressing credit needs in distressed rural counties includes financing projects in low-
and moderate-income areas. This Question and Answer was added to prevent the
possibilities of a disproportionate amount of community development financing flowing to
middle-income census tracts, particularly those that have relatively high absolute income
levels.
Finally, the sample revealed that the largest share of community development lending and
investments went towards meeting affordable housing goals. Affordable housing
community development investments are often in the form of mortgage-backed securities
(MBS), which while a qualified investment, are neither innovative nor complex. In
addition, examiners should ensure that banks are not churning MBS investments. In other
words, one bank will buy a MBS right before their CRA exam, and then sell the securities
to another bank that is preparing for its CRA exam. Investing in MBS serves a community
development need only if churning is prohibited. Also, the new community test should
reward mid-size banks for pursuing a diversified portfolio of community development

109
investments and loans, including affordable housing, small business and economic
development, and other initiatives to support low- and moderate-income areas.
Conclusion
This chapter reviewed CRA exams of banks headquartered in Appalachia in order to
quantify banks’ level of community development lending, investing, and branching. The
chapter focused on community development lending and investing that supports small
business development.
The chapter detailed bank headquarter location and asset distribution in Appalachia.
Almost 30 percent of the Appalachian banks were located in Pennsylvania with the next
highest portion (14 percent in Alabama). While the numbers of banks located in MSAs and
NonMSAs were similar, banks located in MSAs had combined assets of $420.6 billion
versus $73.3 billion for banks in NonMSA counties (see Appendix Table 36c). Of the
more than $5 billion in community development lending and investing that occurs during
the CRA exam cycle, the great majority of it was financed by banks located in MSAs. This
does not mean that NonMSA counties are starved of community development financing
since banks located in MSA counties likely have CRA assessment areas extending into
NonMSA counties. However, the disparities in community development lending and
investment by metropolitan status of county are possibly significant. Further study should
investigate if banks headquartered in MSAs have assessment areas extending into
NonMSA counties and if the banks located in MSAs offer significant amounts of
community development financing in NonMSAs.
The chapter found an imbalance in the amount of community development lending and
investments devoted to affordable housing and small business development. For example,
the chapter documented about $807 million in affordable housing investments as opposed
to $174 million in small business investments (see Appendix Table 37c). Banks located in
Appalachia should be encouraged to increase their overall level of community development
financing and devote a significant portion of that increase to small business development.
110
Lastly, the chapter revealed that banks with different CRA exam ratings actually did have
substantial differences in their levels of community development investments, loans and
branches. This has important policy implications in the context of the new CRA exam for
mid-size banks, which constituted a majority of the banks located in Appalachia. The
chapter concluded with observations of how to ensure that the new CRA exams for mid-
size banks were as rigorous as the old exams.

111
Alternative Financial Institutions in Appalachia Previous chapters have discussed trends in the financial services industry that affect access
to capital for small business development in Appalachia, particularly in distressed and
underserved markets. As the financial services industry modernizes and becomes
increasingly consolidated, there are concerns that access to capital may be threatened in
lower-income markets where small business borrowers often have marginal credit or
limited business histories. Improvements in technology allow for much more streamlined,
cost-effective underwriting, and consolidation leads to increasingly centralized decision-
making. As decision making becomes more standardized and less relationship oriented,
businesses owners without strong credit or capital, particularly those in disinvested or
underserved markets, may have difficulty accessing necessary capital for starting or
growing their businesses. In recent decades, a diverse network of non-bank financial
institutions has grown and attempted to fill such gaps in access to credit.
This chapter examines the presence of regional development finance institutions and other
intermediary business development lenders in Appalachia. Such intermediaries are often
loan funds which are typically operated by a mix of public, private, non-profit, or for-profit
organizations and receive capital from sources such as mainstream financial institutions;
federal, state, and local government agencies; and foundations. This section uses a variety
of data sources to analyze the presence of different types of such institutions in the region,
focusing on community development financial institutions (CDFIs), government-backed
revolving loan funds (RLFs), development venture capital funds, and SBA lending
intermediaries.27
27 In the following chapter we make a distinction between community development financial institutions (CDFIs) and revolving loan funds (RLFs). In broad terms, we consider a CDFI an institution whose primary mission is providing community development finance and technical assistance to underserved and distressed markets. RLFs also provide loans and technical assistance to businesses in underserved markets, but, frequently, RLFs are a small part of a larger quasi-government organization whose mission is to promote regional economic development. As such their primary mission is not providing community development finance. The analysis in this chapter uses data from the CDFI industry and from ARC on their RLF lending pool. While there is a modest degree of overlap between institutions in the two data sets, we feel that differences in organizational mission and available data warrant two distinct sections.

112
Community Development Financial Institutions (CDFIs)
The current Community Development Financial Institution (CDFI) industry emerged over
decades as public and private sector players responded to the difficulties that many
distressed markets, such as minority, lower-income, and rural communities, experienced in
accessing mainstream financial services. CDFIs are niche financial institutions whose
mission is to provide targeted financial services such as retail bank accounts, affordable
housing finance, and small business capital to disinvested areas. In addition to such
products, CDFIs also place a strong emphasis on building the capacity of the markets they
serve through providing high levels of hands on financial literacy training, housing
counseling, and entrepreneurial technical assistance.
The CDFI industry is made up of a diverse set of institutions that to varying degrees
provide a mix of financial products and services and capacity building to distressed
communities. The four basic types of CDFIs are community development banks, credit
unions, loan funds, and development venture capital funds.
Community development banks and credit unions are regulated financial institutions with
the ability to take deposits and offer loan products. Community development banks are
for-profit entities whose focus is to provide targeted lending and investment geared towards
the redevelopment of distressed communities. The main source of capital for community
development banks is deposits received from individuals and institutions and government
grants and investments. Community development credit unions (CDCUs) are non-profit
cooperatives that provide affordable financial services to individuals without traditional
bank accounts and help these individuals develop assets. CDCUs specialize in providing
low-cost deposit accounts in communities not served by mainstream financial institutions
and often extend credit at more flexible terms. CDCUs are primarily capitalized by
member deposits, but also receive capital investments from other sources such as
mainstream financial institutions. CDCUs offer consumer loans, vehicle loans, mortgages,
and small business loans to distressed markets and often lead the way in product

113
innovation. CDCUs were the among the first institutions to offer low-cost, short term
consumer loan products to compete with high cost payday lending operations.
Community development loan funds are not depository institutions, but are non-profit
organizations that leverage investments by outside sources such as banks, foundations,
corporations, and government agencies to provide lending for small business development,
housing, microenterprise, or community facilities in distressed markets. Community
development venture capital funds are for-profit entities who also leverage investments
from outside sources to provide equity investments or equity-like loans for business
development in distressed communities.
In its early years, the growing CDFI industry was primarily capitalized with government or
foundation resources, but changes in government policy and the financial services industry
have led to shifts in the sources of financial support for CDFIs. Mainstream financial
institution participation was limited and typically involved investing in loan pools for
affordable housing development and mortgage lending. The Community Reinvestment Act
(CRA) changed the nature of financial industry support of the CDFIs. CRA was passed in
1977 to promote lending and investment by depository financial institutions in low- and
moderate-income markets. In its early years, however, CRA’s effectiveness was limited
largely by weak regulatory enforcement. Substantial changes to the CRA regulation in
1995 altered the way banks were monitored for their community reinvestment
performance. As related to CDFIs, the updated CRA regulation added specific components
that examined banks for their levels of community development lending and investments
and grants. This change served as incentive for banks and thrifts to provide low-cost loans
and investments to CDFIs who were able to leverage these resources to finance activities
that mainstream institutions found too risky to finance directly. CRA has often been
credited with spurring the rapid growth of the CDFI industry in the 1990s which saw the
establishment of the more new CDFIs than any other decade.28
28 The CDFI Data Project. 2005. Providing Capital, Building Communities, Creating Impact.

114
The federal government also established the CDFI Fund in 1994 under the Department of
Treasury. It provides financial grants and technical assistance awards to CDFIs and
implements the Bank Enterprise Award (BEA) program which rewards banks and thrifts
who are active in supporting the CDFI industry. The CDFI Fund also implements the New
Markets Tax Credit Program which provides tax credit allocations for community
development entities to use in attracting investment in lower-income communities.
The CDFI industry has faced significant challenges recently. Sources of funding have been
a particular concern. Government funding for CDFIs from sources such as the CDFI Fund
and the SBA have been consistently threatened in recent federal budgets. Foundation
support, a traditionally strong source of funding for the CDFI industry, has waned in recent
years. Additionally, as mentioned in previous chapters, the Community Reinvestment Act
has been weakened. Changes implemented by federal banking regulators put less emphasis
on the importance of critical community development loans and investments for many mid-
sized banks. The increasingly complex and global financial services industry now requires
that CDFIs increase their level of sophistication in accessing capital markets and financing
projects. In many markets, CDFIs now compete with the community development
corporations of major banks for the best projects.29 There has also been a growing
emphasis from funders to document impact created by their investment.
CDFIs in Appalachia
The Appalachian region has a diverse set of development finance intermediaries. The
following section takes a closer look at the CDFI industry in Appalachia.
An analysis of the membership lists of the major trade associations that represent different
types of CDFIs gives a sense of the nature of the CDFI industry in Appalachia.30 Table 5
29 Moy, Kirsten and Alan Okagaki. July 2001. “Changing Capital Markets and Their Implications for Community Development Finance.” Capital Xchange. Brookings Institution. Washington D.C. 30 The major CDFI trade associations surveyed were Association for Enterprise Opportunity, Community Development Venture Capital Alliance, National Federation of Community Development Credit Unions, National Community Capital Association, National Community Investment Fund, and the CDFI Fund. This list is not comprehensive of all development finance intermediaries. There are many small revolving loan funds or loan funds that are for-profit or government or quasi-government agencies who are not members of these associations. These institutions will be discussed in subsequent sections of this chapter.

115
shows CDFIs located in the region by state31 and type of CDFI. There are over 100 CDFIs
active in the region. Appalachian Pennsylvania has 29 CDFIs while West Virginia has 14
and Alabama has 11. At the other end of the spectrum, Appalachian South Carolina has no
CDFIs and Georgia, Maryland, and Mississippi each have one. Of note, there are no
community development banks in the region, although there are 26 community
development credit unions. Appalachian Alabama has a high concentration of CDCUs
where seven of the area’s 11 CDFIs are CDCUs. The most prevalent type of CDFI in
Appalachia are loan funds with a total of 71. Pennsylvania has the most loan funds with
21. Kentucky and Tennessee each have high concentrations of loan funds where nine of
ten and eight of ten CDFIs respectively are loan funds. Finally, in Appalachia there are 10
institutions set up specifically for community development venture capital investment.
Table 5. Appalachian CDFIs by State and Type32
Credit Loan VentureState Total CD Banks Unions Funds FundsAlabama 11 0 7 4 0Georgia 1 0 0 1 0Kentucky 10 0 1 9 0Maryland 1 0 0 0 1Mississippi 1 0 0 1 0New York 10 0 3 5 2North Carolina 9 0 1 6 2Ohio 5 0 1 3 1Pennsylvania 29 0 7 21 1South Carolina 0 0 0 0 0Tennessee 10 0 2 8 0Virginia 6 0 1 4 1West Virginia 14 0 3 9 2Total 107 0 26 71 10
Community development loan funds offer a diverse array of products and services. Loan
funds broadly serve four sectors: microenterprise, small business development, housing,
and community facilities. Microenterprise lenders target very small firms, typically those
with fewer than five employees, for loans of less than $35,000. These lenders often target
minority, women-owned, and start-up businesses and provide high levels of technical
31The region represented is only that part of each state within the Appalachian Regional Commission boundaries. 32 CDFIs were taken from the association membership lists or known sources of funding. Credit Unions were members of the National Federation of Community Development Credit Unions (NFCDCU) . Microlenders were members of the Association of Enterprise Opportunity (AEO) or were a registered SBA microlending intermediary. Loan funds were members of National Community Capital Association (NCCA). Venture capital funds were members of the Community Development Venture Capital Alliance (CDVCA) or received venture capital funding from the Appalachian Regional Commission.

116
assistance. Other loan funds target larger or more established businesses in distressed
markets and provide a mix of loan and equity products with the primary goal of creating or
retaining regional jobs. In addition to standard debt products, these loan funds many also
operate venture capital funds that provide equity investment to rapidly growing small or
mid-sized businesses in distressed communities. Funds that target housing can provide a
variety of financing to developers of affordable housing or mortgages to lower-income
households for homeownership, home improvement, or refinancing out of troubled loans.
Loan funds who specialize in community facilities make funding available for child care
centers, clinics, or other types of community service organizations. Analysis of results
from the CDFI Data Project Survey show that 58 percent of loan funds participating in the
survey served multiple sectors.33
The 71 community development loan funds in Appalachia have a strong emphasis on
business lending. Table 6 categorizes the services offered by Appalachian loan funds as
microlending, small business, housing, community facilities. A category has also been
added for loan funds who offer equity-like venture capital financing for business
development in addition to an array of other products.34 Over 70 percent of Appalachian
loan funds offer some type of microfinance product, while 35 percent of loan funds make
larger small business loans. Just under 27 percent of Appalachian loan funds provide
housing finance, while only two loan funds specifically state they do lending for
community services such as daycare and health facilities. Within the region, four loan
funds operate venture capital investment firms as well as offering an array of other small
business lending services. These four loan funds are in addition to the ten stand-alone
development venture capital firms identified above in Table 5.
33 CDFI Data Project. Providing Capital, Building Communities, Creating Impact 34 Information on services offered is based on a January 2006 analysis by the authors’ of trade association and loan fund web sites.
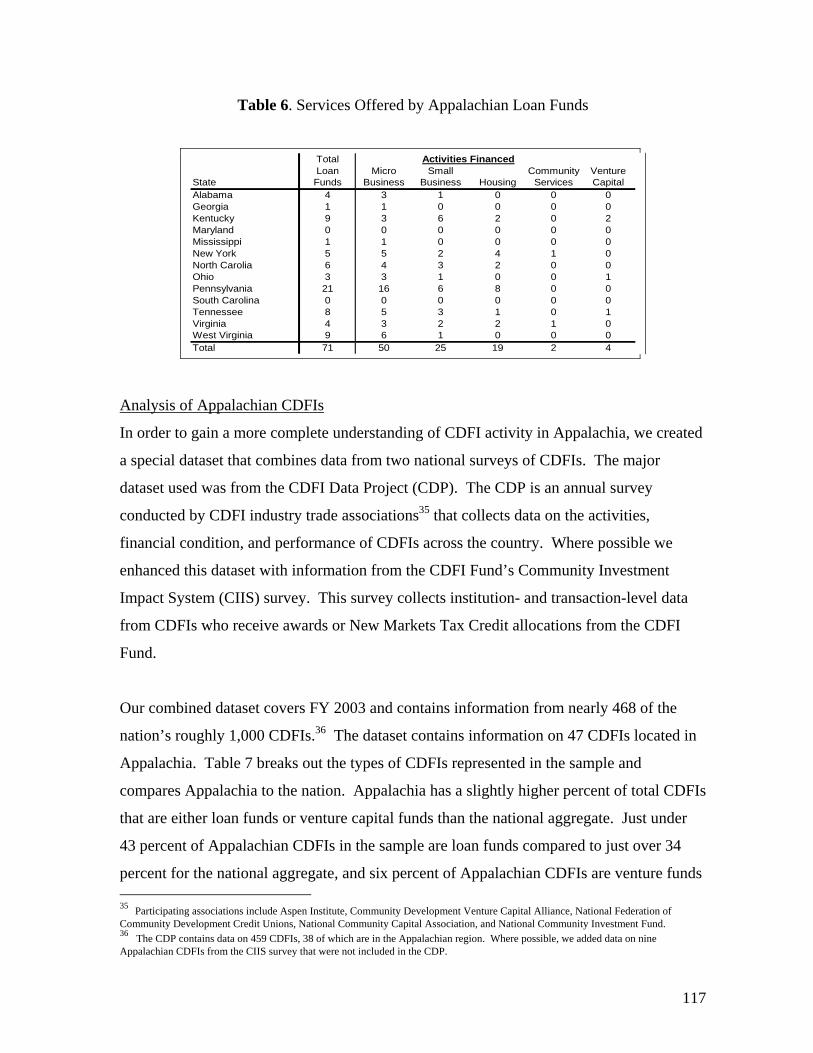
117
Table 6. Services Offered by Appalachian Loan Funds
TotalLoan Micro Small Community Venture
State Funds Business Business Housing Services CapitalAlabama 4 3 1 0 0 0Georgia 1 1 0 0 0 0Kentucky 9 3 6 2 0 2Maryland 0 0 0 0 0 0Mississippi 1 1 0 0 0 0New York 5 5 2 4 1 0North Carolia 6 4 3 2 0 0Ohio 3 3 1 0 0 1Pennsylvania 21 16 6 8 0 0South Carolina 0 0 0 0 0 0Tennessee 8 5 3 1 0 1Virginia 4 3 2 2 1 0West Virginia 9 6 1 0 0 0Total 71 50 25 19 2 4
Activities Financed
Analysis of Appalachian CDFIs
In order to gain a more complete understanding of CDFI activity in Appalachia, we created
a special dataset that combines data from two national surveys of CDFIs. The major
dataset used was from the CDFI Data Project (CDP). The CDP is an annual survey
conducted by CDFI industry trade associations35 that collects data on the activities,
financial condition, and performance of CDFIs across the country. Where possible we
enhanced this dataset with information from the CDFI Fund’s Community Investment
Impact System (CIIS) survey. This survey collects institution- and transaction-level data
from CDFIs who receive awards or New Markets Tax Credit allocations from the CDFI
Fund.
Our combined dataset covers FY 2003 and contains information from nearly 468 of the
nation’s roughly 1,000 CDFIs.36 The dataset contains information on 47 CDFIs located in
Appalachia. Table 7 breaks out the types of CDFIs represented in the sample and
compares Appalachia to the nation. Appalachia has a slightly higher percent of total CDFIs
that are either loan funds or venture capital funds than the national aggregate. Just under
43 percent of Appalachian CDFIs in the sample are loan funds compared to just over 34
percent for the national aggregate, and six percent of Appalachian CDFIs are venture funds 35 Participating associations include Aspen Institute, Community Development Venture Capital Alliance, National Federation of Community Development Credit Unions, National Community Capital Association, and National Community Investment Fund. 36 The CDP contains data on 459 CDFIs, 38 of which are in the Appalachian region. Where possible, we added data on nine Appalachian CDFIs from the CIIS survey that were not included in the CDP.

118
compared to just under 5 percent nationally. Appalachia has a smaller share of CDFIs that
are credit unions than the nation. Just under 57 percent of national CDFI sample are credit
unions compared to 51 percent for Appalachia. There are no community development
banks in Appalachia.
Table 7. Types of CDFIs Represented in Combined Dataset, FY 2003
Appalachia NationalCDCUs 51.1% 56.6%CD Banks 0.0% 4.3%CD Loan Funds 42.6% 34.4%CD Venture Funds 6.4% 4.7%Total CDFIs 47 468
The Appalachian CDFI industry is less mature than the national industry. Although
Appalachia is home to many well established and influential community development
finance intermediaries such as Kentucky Highlands Investment Corporation, the regional
industry has developed much more recently than the national industry. Figure 20 shows
that just under half of all CDFIs in Appalachia were established after 1990 compared to just
under 38 percent for national CDFIs. Community development loan funds and venture
capital funds have experienced tremendous growth since 1990. Just under 60 percent of
national loan funds have been established since 1990 compared to nearly 73 percent of
Appalachian loan funds. Nationally, over 90 percent of community development venture
capital funds were established post 1990. Of the two Appalachian venture capital funds in
data set, one was established after 1990.

119
Figure 20. Percent of CDFIs established after 1990
40.0%
21.2%
59.9%
90.5%
37.8%
0.0%
37.5%
72.7%
50.0% 48.6%
0.0%
10.0%
20.0%
30.0%
40.0%
50.0%
60.0%
70.0%
80.0%
90.0%
100.0%
Banks CU Loan Funds Venture Total
National CDFIs Appalachia CDFIs
Appalachian CDFIs serve predominantly rural markets. Table 8 shows that in FY
2003 the activity of national CDFIs was fairly evenly distributed between major urban,
minor urban, and rural markets while Appalachian CDFI clients were predominantly
located in rural markets. On average, just under 50 percent of Appalachian CDFI clients
were in rural areas compared to just under 34 percent for national CDFIs. Conversely, an
average of less than 20 percent of Appalachian CDFI clients were from major urban areas37
compared to nearly 38 percent for national CDFIs. On average, 31 percent of Appalachian
CDFI clients were in minor urban areas. This reflects the rural character of the region and
is consistent with the CDFI mission of targeting underserved markets. Research has
consistently shown that rural business owners have difficulty accessing capital due to
limited supply and a lack of experience accessing capital markets.38
37 The CDP defines a “major urban” area as a metropolitan area with a population over 1 million. In Appalachia, the two “major urban” areas are Pittsburgh and Birmingham. “Minor urban” areas are those metropolitan areas with less than 1 million in population. Rural areas are all non-metro areas. 38 Markley, Deborah and Don Macke. March 2002. “Capital for Rural Entrepreneurs” Center for Rural Entrepreneurship. Monograph 7.

120
Table 8. Average Percent of Clients Located in Different Geography Types, FY2003
Appalachia National
Major Urban 19.4% 37.9%Minor Urban 31.4% 28.4%Rural 49.3% 33.7%Total CDFIs Reporting 25 273
Appalachian CDFIs are active lenders. When controlling for asset class, Appalachian
CDFIs had similar portfolio characteristics when compared to national CDFIs. Table 9
classifies CDFIs into four asset size categories and compares Appalachian CDFIs to
similarly sized national institutions.39 In three of the four asset classes, Appalachian
CDFIs, on average, closed fewer loans in FY2003 than their national counterparts, but also
made larger average loans and on average had a larger portfolios of outstanding loans. For
example, the three Appalachian CDFIs with assets between $10 and $30 million closed an
average of 259 loans in FY2003 compared to an average of 367 loans closed by national
CDFIs of similar size. However, the average dollar amount of the loans closed in FY2003
by Appalachian CDFIs of this size was slightly larger than national CDFIs at $5.2 million
compared to $5.1 million. Additionally, Appalachian CDFIs with assets between $10 and
$30 million had average portfolios of outstanding loans of $13.6 million compared to $9.9
million for similarly sized national CDFIs. This indicates that while Appalachian CDFIs
may have smaller annual deal flow than similarly sized national counterparts, they are still
active lenders who participate in larger projects or take a more substantial stake in projects.
Table 9. Average CDFI Portfolio Characteristics by Asset Category, FY2003
Averages ARC National ARC National ARC National ARC NationalLoans Closed 56 62 228 215 259 367 975 1,632$$ Loans Closed $272,527 $162,776 $1,344,519 $1,396,601 5,208,393 $5,101,214 17,878,528 14,595,684Assets $574,901 $521,895 $4,181,312 $4,266,619 20,551,788 $16,668,958 51,766,384 46,239,734Portfolio Outstanding $324,708 $222,969 $2,464,277 $2,528,346 13,625,475 $9,894,197 36,245,748 26,761,531CDFIs 14 120 16 195 3 60 3 36
<$1M $1M-$10M $10M-$30M $30M-$70M
Appalachian CDFIs placed a heavy emphasis on lending for business development.
Tables 10 and 11 examine the types of CDFI financing outstanding in terms of loans and 39 We limited out asset categories to institution below $70 million because the largest Appalachian CDFI is at $64 in assets.
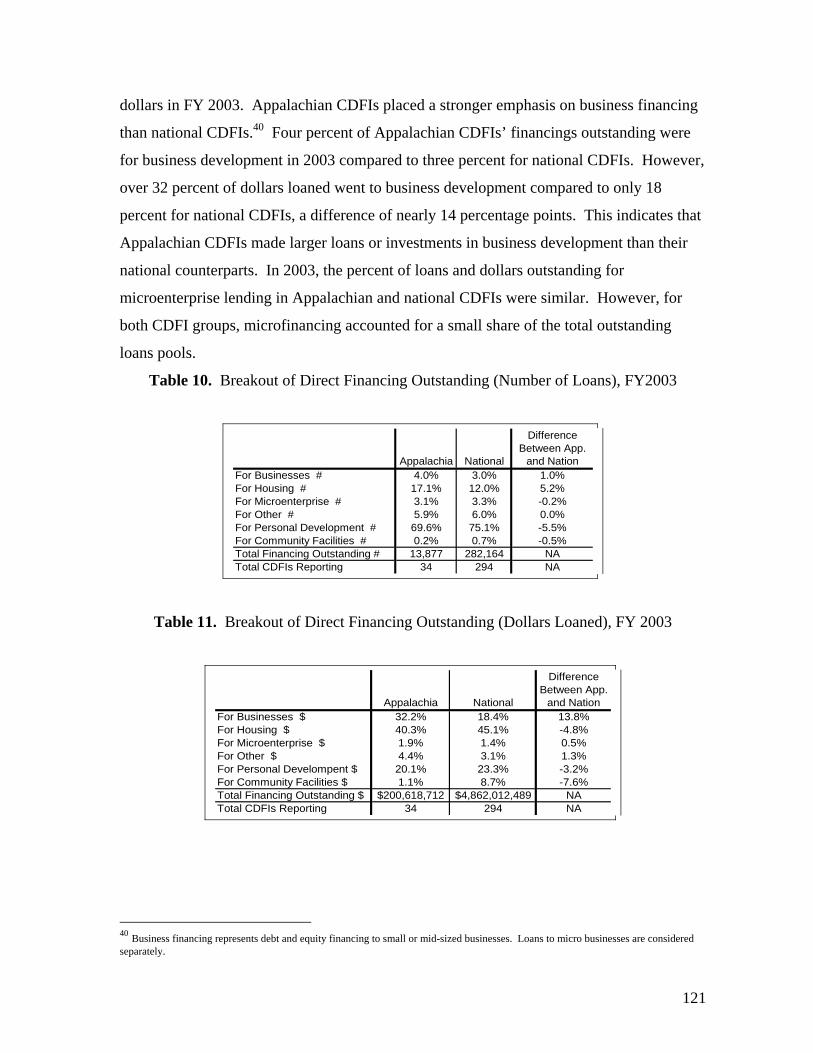
121
dollars in FY 2003. Appalachian CDFIs placed a stronger emphasis on business financing
than national CDFIs.40 Four percent of Appalachian CDFIs’ financings outstanding were
for business development in 2003 compared to three percent for national CDFIs. However,
over 32 percent of dollars loaned went to business development compared to only 18
percent for national CDFIs, a difference of nearly 14 percentage points. This indicates that
Appalachian CDFIs made larger loans or investments in business development than their
national counterparts. In 2003, the percent of loans and dollars outstanding for
microenterprise lending in Appalachian and national CDFIs were similar. However, for
both CDFI groups, microfinancing accounted for a small share of the total outstanding
loans pools.
Table 10. Breakout of Direct Financing Outstanding (Number of Loans), FY2003
DifferenceBetween App.
Appalachia National and NationFor Businesses # 4.0% 3.0% 1.0%For Housing # 17.1% 12.0% 5.2%For Microenterprise # 3.1% 3.3% -0.2%For Other # 5.9% 6.0% 0.0%For Personal Development # 69.6% 75.1% -5.5%For Community Facilities # 0.2% 0.7% -0.5%Total Financing Outstanding # 13,877 282,164 NATotal CDFIs Reporting 34 294 NA
Table 11. Breakout of Direct Financing Outstanding (Dollars Loaned), FY 2003
DifferenceBetween App.
Appalachia National and NationFor Businesses $ 32.2% 18.4% 13.8%For Housing $ 40.3% 45.1% -4.8%For Microenterprise $ 1.9% 1.4% 0.5%For Other $ 4.4% 3.1% 1.3%For Personal Develompent $ 20.1% 23.3% -3.2%For Community Facilities $ 1.1% 8.7% -7.6%Total Financing Outstanding $ $200,618,712 $4,862,012,489 NATotal CDFIs Reporting 34 294 NA
40 Business financing represents debt and equity financing to small or mid-sized businesses. Loans to micro businesses are considered separately.

122
Appalachian CDFIs’ emphasized lending to larger businesses and assist more jobs per
loan.41 In FY 2003, less than 39 percent of businesses financed by Appalachian CDFIs
were microbusinesses compared to over 77 percent for national CDFIs (Table 12).
Therefore over 61 percent of the businesses financed by Appalachian CDFIs were larger
enterprises. By focusing on financing larger businesses, Appalachian CDFIs reported
being able to create or retain over 3,300 jobs in the region in FY 2003. This averages to
over 11 jobs assisted per business financed. By comparison, national CDFIs, report
assisting 2.8 jobs per business financed. Jobs assisted are not necessarily new jobs created,
but rather a combination of jobs created and jobs retained over a given period.
Table 12. Types of Businesses Financed and Job Outputs, FY2003
Appalachia NationalTotal Businesses Financed 292 8,366Micro Businesses Financed 113 6,477Share Micro 38.7% 77.4%
Total Jobs Assisted 3,315 23,022Jobs Assisted per Business Financed 11.35 2.75CDFIs Reporting 21 168
Appalachian CDFIs were heavily reliant on the government funding for debt or
investment capital. As mentioned previously, CDFIs receive debt or investment capital
from a variety of sources such as depository and non-depository financial institutions;
federal, state, and local governments; and foundations. CDFIs are typically heavily
dependent on external sources of lending capital. Table 13 breaks out sources of capital by
type of CDFI in FY 2003. Individual deposits comprised the majority of debt capital for
both Appalachian and national credit unions.
41 The CDFI Data Project defines a microbusiness as firm with five or fewer employees or one receiving a loan for $35,000 or less. A larger business as one that has greater than five employees or one that received financing greater than $35,000 for the purpose of expansion, working capital, equipment purchase/rental, or commercial real estate development or improvement.
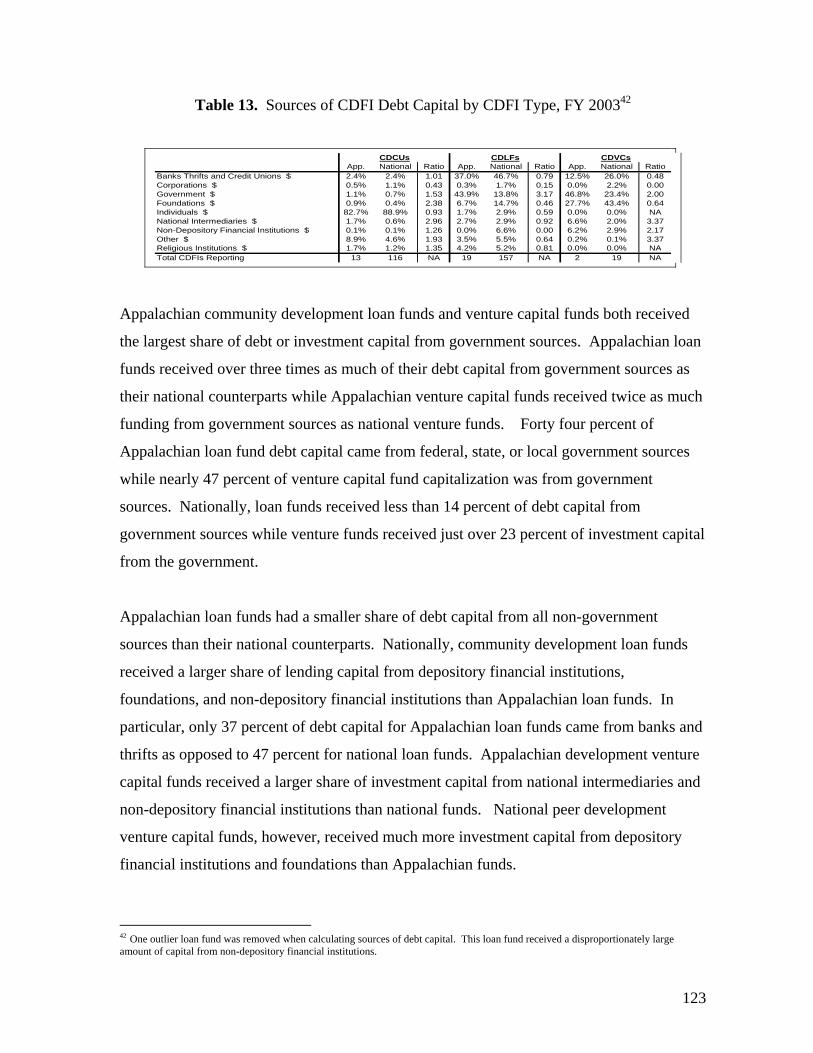
123
Table 13. Sources of CDFI Debt Capital by CDFI Type, FY 200342
App. National Ratio App. National Ratio App. National RatioBanks Thrifts and Credit Unions $ 2.4% 2.4% 1.01 37.0% 46.7% 0.79 12.5% 26.0% 0.48Corporations $ 0.5% 1.1% 0.43 0.3% 1.7% 0.15 0.0% 2.2% 0.00Government $ 1.1% 0.7% 1.53 43.9% 13.8% 3.17 46.8% 23.4% 2.00Foundations $ 0.9% 0.4% 2.38 6.7% 14.7% 0.46 27.7% 43.4% 0.64Individuals $ 82.7% 88.9% 0.93 1.7% 2.9% 0.59 0.0% 0.0% NANational Intermediaries $ 1.7% 0.6% 2.96 2.7% 2.9% 0.92 6.6% 2.0% 3.37Non-Depository Financial Institutions $ 0.1% 0.1% 1.26 0.0% 6.6% 0.00 6.2% 2.9% 2.17Other $ 8.9% 4.6% 1.93 3.5% 5.5% 0.64 0.2% 0.1% 3.37Religious Institutions $ 1.7% 1.2% 1.35 4.2% 5.2% 0.81 0.0% 0.0% NATotal CDFIs Reporting 13 116 NA 19 157 NA 2 19 NA
CDCUs CDLFs CDVCs
Appalachian community development loan funds and venture capital funds both received
the largest share of debt or investment capital from government sources. Appalachian loan
funds received over three times as much of their debt capital from government sources as
their national counterparts while Appalachian venture capital funds received twice as much
funding from government sources as national venture funds. Forty four percent of
Appalachian loan fund debt capital came from federal, state, or local government sources
while nearly 47 percent of venture capital fund capitalization was from government
sources. Nationally, loan funds received less than 14 percent of debt capital from
government sources while venture funds received just over 23 percent of investment capital
from the government.
Appalachian loan funds had a smaller share of debt capital from all non-government
sources than their national counterparts. Nationally, community development loan funds
received a larger share of lending capital from depository financial institutions,
foundations, and non-depository financial institutions than Appalachian loan funds. In
particular, only 37 percent of debt capital for Appalachian loan funds came from banks and
thrifts as opposed to 47 percent for national loan funds. Appalachian development venture
capital funds received a larger share of investment capital from national intermediaries and
non-depository financial institutions than national funds. National peer development
venture capital funds, however, received much more investment capital from depository
financial institutions and foundations than Appalachian funds.
42 One outlier loan fund was removed when calculating sources of debt capital. This loan fund received a disproportionately large amount of capital from non-depository financial institutions.

124
Appalachian loan funds should diversify their sources of debt capital. As mentioned
previously, funding for CDFIs has consistently been threatened in recent federal budgets.
Government sources along with regulated financial institutions accounted for 81 percent of
Appalachian community loan fund lending capital. These same sources accounted for
roughly than 60 percent national community development loan fund lending capital. This
heavy dependence on government and financial institution resources may make
Appalachian loan funds more vulnerable to changes in government funding cycles or bank
investment in community development than their national counterparts. As mentioned
previously, however, Appalachian loan funds received limited funding from foundations
and no debt capital from non-depository financial institutions, while these are second and
fourth largest sources of capital for national community development loan funds.
Appalachian CDCUs and CDVCs have higher levels of self-sufficiency than national
peers. Given the scarcity of funding sources and the intense competition for available
capital, one of the key concerns of the CDFI industry today is improving self sufficiency.
One way to measure self sufficiency is to look at the percent of an institution’s expenses
that can be covered by earned revenue (i.e. revenue generated through lines of business and
not grants or investments). A ratio of earned revenue to total expenses of 1.0 or greater
indicates that an institution could support itself on earned revenue alone. Figure 21
compares the self-sufficiency of Appalachian and national CDFIs by type in FY 2003. The
average self sufficiency ratio of Appalachian CDFIs was .56 compared to .77 of the
national aggregate. However, this aggregate number masks the fact that Appalachian credit
unions and venture capital funds had higher self-sufficiency ratios than their national
counterparts. In FY 2003, Appalachian community development credit unions had a self
sufficiency ratio of .88 and Appalachian community development venture capital funds had
a self sufficiency ratio of .68. Both of these numbers were well above national averages of
.62 and .44 for credit unions and venture capital funds respectively.

125
Figure 21. Self Sufficiency Ratios by CDFI Type, FY2003
0.620.65
0.44
0.77
0.88
0.35
0.68
0.56
0
0.1
0.2
0.3
0.4
0.5
0.6
0.7
0.8
0.9
1
Credit Unions Loan Funds Venture Funds All CDFIs
National CDFIs Appalachian CDFIs
Appalachian community development loan funds lagged national numbers in the
ability to support themselves through earned revenue. Unlike community development
credit unions and venture capital funds, Appalachian community development loan funds
had a low levels of self sufficiency. Figure 21 shows that regional community
development loan funds had a self-sufficiency ratio of .35 indicating that only 35 percent of
total expenses could be covered by earned revenue. This number is well below that of
national loan funds. This low level of self-sufficiency paired with the heavy reliance that
Appalachian loan funds have on government sources for debt capital, should raise some
concerns about the long term viability of Appalachian community development loan funds.
Revolving Loan Funds
Revolving loan funds (RLFs) are pools of capital provided by the public and private sectors
for the purpose promoting economic development in distressed and underserved markets.
RLFs are among the oldest types of development finance intermediary. Federal
government agencies began funding revolving loan pools in the mid-1960s in response to

126
losses in jobs, tax revenue, and private investment in many urban and rural markets.43
RLFs are typically capitalized by grants from federal, state, and local governments. Loans
are made to business owners in distressed markets, usually at interest rates below the
market rate. As the loan principal and interest are paid back to the RLF, funds are available
to be re-loaned. Borrowers who receive RLF loans are often able to leverage these loans to
access additional capital from private market sources. One of the main social impact goals
of RLFs is job creation and retention.
The Appalachian region is rich in RLFs. An analysis of loan funds receiving federal grants
show that over 190 exist in the region. The three main federal agencies who fund revolving
loan funds targeted towards economic development are the US Department of Agriculture
(USDA), the Economic Development Administration (EDA) and the Appalachian Regional
Commission (ARC). Through its Intermediary Relending Program (IRP), Business
Enterprise Grant Program, Economic Development Grant Programs the USDA has
provided grants to 146 RLFs in Appalachia. The EDA has provided grants to 59 RLFs in
Appalachia through its revolving loan fund program. Since 1977, the Appalachian
Regional Commission has provided grants to 38 RLFs in the region. ARC loan funds will
be discussed in more detail below. Map 6 illustrates the number of loan funds who
received grants from the USDA, EDA, and ARC by state in Appalachia. In addition to
federally funded RLFs, there are numerous revolving loan funds capitalized through state
and local funds not included in this analysis.
43 National Council on Urban Economic Development. October 1995. Revolving Loan Funds: Recycling Capital for Business Development. Washington D.C.

127

128
ARC revolving loan funds have been active lenders in the region since inception. ARC
made the first grant in its revolving loan fund program in 1977. Since that date, the 38
ARC capitalized loan funds have made 1,570 loans for over $104 million. Only one loan
fund that has received an ARC grant has failed to make a loan. The median loan fund
received its first ARC grant in 1993. ARC loan funds have made a median of 25.5 total
loans and loaned a median of nearly $1.8 million. As of the first quarter of 2006, the
median loan fund had 10 loans outstanding and a median of just over $607,000 in loans
outstanding. On average, ARC loan funds had over $845,000 in loans outstanding and
over $200,000 in funds available to lend for an average loan pool size of just over $1
million. The pool of ARC grantees had, on average, 19.3 percent of their funds available to
lend. In aggregate, ARC loan funds have written off 3.8 percent of dollars loaned. The
highest percent of loans written off was 12.6 percent. Eleven of the 38 ARC loan funds
had zero write-offs. These write off numbers are comparable to industry averages for rural
loan funds. A survey of rural EDA RLFs indicates a 5.5 percent of loans were written off
with 28 percent of loan funds surveyed having no write offs. 44
The average deal flow of ARC revolving loan funds has declined since 2000, but their
level of participation in deals has increased. Figure 22 tracks average number of loans
by ARC RLFs over a seven year period starting in 2000. It shows that the average number
of loans originated by ARC-funded RLFs has declined since 2000 when an average of over
four loans were originated per fund. This number declined to a low of 2.6 loans per fund in
2005. In 2006, ARC RLFs made an average of 3.4 loans per fund.45 This level of annual
deal flow somewhat lags industry benchmarks. A 2002 analysis of rural EDA revolving
loan funds found average deal flow of 6.1 loans per year.46 However one important
distinction to consider when examining the deal flow of ARC-funded RLFs is that they are
gap lenders that provide the portion of debt in a project financing package that a bank will
not. It is very rare that an ARC-funded RLF would make a loan without a bank also
providing project financing with the bank almost always acting as the primary lender.
44 National Association of Economic Development Organizations Research Foundation. March 2003. Organizations that Manage Loan Funds Create Rural Jobs Efficiently. Washington D.C 45 RLF lending data for 2006 is annualized using data through April 2006. 46 National Association of Economic Development Organizations Research Foundation. March 2003. Organizations that Manage Loan Funds Create Rural Jobs Efficiently. Washington D.C.
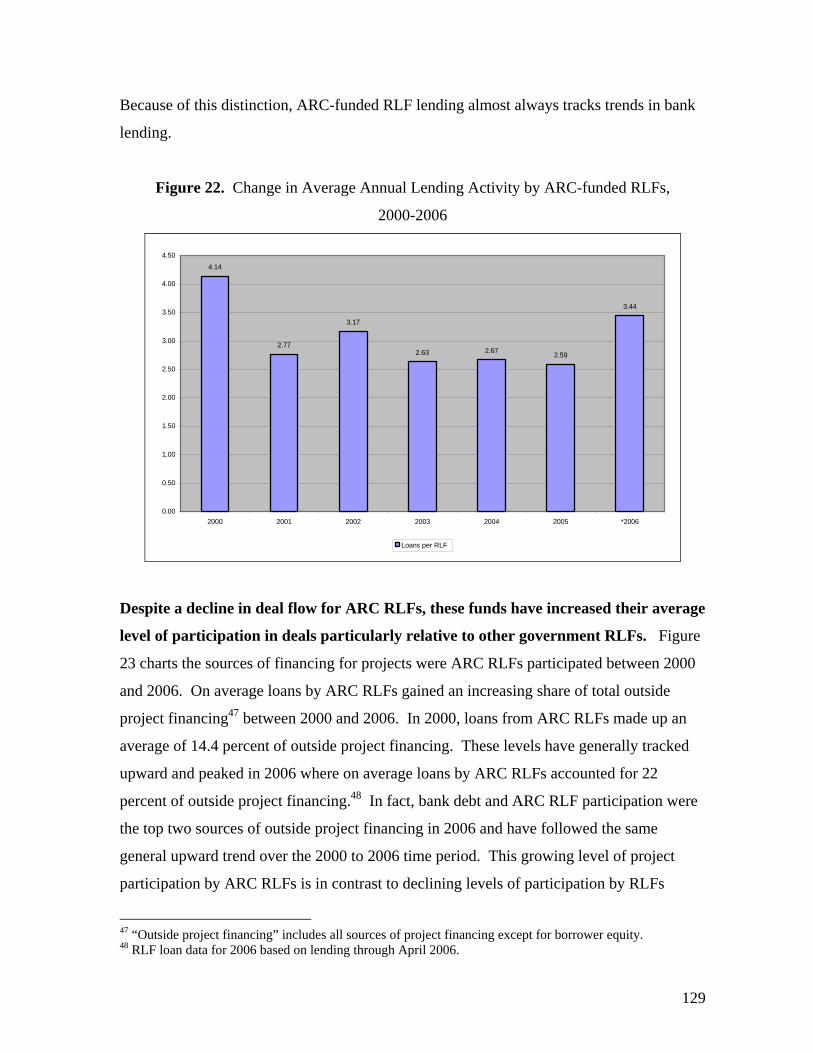
129
Because of this distinction, ARC-funded RLF lending almost always tracks trends in bank
lending.
Figure 22. Change in Average Annual Lending Activity by ARC-funded RLFs,
2000-2006
4.14
2.77
3.17
2.63 2.67 2.59
3.44
0.00
0.50
1.00
1.50
2.00
2.50
3.00
3.50
4.00
4.50
2000 2001 2002 2003 2004 2005 *2006
Loans per RLF
Despite a decline in deal flow for ARC RLFs, these funds have increased their average
level of participation in deals particularly relative to other government RLFs. Figure
23 charts the sources of financing for projects were ARC RLFs participated between 2000
and 2006. On average loans by ARC RLFs gained an increasing share of total outside
project financing47 between 2000 and 2006. In 2000, loans from ARC RLFs made up an
average of 14.4 percent of outside project financing. These levels have generally tracked
upward and peaked in 2006 where on average loans by ARC RLFs accounted for 22
percent of outside project financing.48 In fact, bank debt and ARC RLF participation were
the top two sources of outside project financing in 2006 and have followed the same
general upward trend over the 2000 to 2006 time period. This growing level of project
participation by ARC RLFs is in contrast to declining levels of participation by RLFs
47 “Outside project financing” includes all sources of project financing except for borrower equity. 48 RLF loan data for 2006 based on lending through April 2006.

130
funded by other government agencies. In 2000 loans by RLFs funded by other government
agencies were the second largest source of outside project financing making up nearly 38
percent of total outside project funds. These numbers declined through 2006 when loans
by other federally funded RLFs made up 13.5 percent of total outside project financing.
This indicates that despite declining deal flow, ARC RLFs have been able to play an
increasingly significant role in projects where they choose to be active.
Figure 23. Change in Percent Contribution to Total Outside Project Funding by Financing Type, 2000-2006
22.0%
37.8%
13.5%
47.5%
53.7%
62.6%
8.5%
1.9%
14.4% 14.6% 13.4% 19.7%17.0%
16.9%
23.1%24.2%23.9%22.2%
26.3%
51.5%54.0%
49.7%50.2%
0.3% 4.7%6.7%10.2%9.5%
0.0%
10.0%
20.0%
30.0%
40.0%
50.0%
60.0%
70.0%
2000 2001 2002 2003 2004 2005 *2006
ARC RLF Other Gov RLF Bank Debt Other Debt and Non-Debt
The lending of 38 ARC capitalized revolving loan funds have created or retained a
substantial number of jobs in the region.49 A fundamental goal of RLF lending is the
creation or retention of local employment. Between 2002 and the first quarter of 2006,
loans from ARC capitalized revolving loan funds helped create over 3,600 jobs and retain
over 8,300 jobs in the region. The number of jobs created increased from 920 to 968 and
the number of jobs retained increased from 1,365 to 2,761. All but one of the 38 ARC loan
49 “Jobs created” represent new jobs that did not exist at a firm prior to receiving financing. “Jobs retained” represent jobs that existed prior to financing and remained after financing. There is a debate about the use of “jobs retained” statistics to measure the impact of RLF lending. Some feel that it is difficult to directly tie the retention of existing jobs to RLF financing and that these numbers are used to inflate the impact of RLF lending. Others feel that it is important to measure the number of jobs influenced by RLF loans whether or not the loan was directly responsible for the retention of a specific job.
131
funds reported influencing at least one job. On average, ARC RLFs influenced an average
of 315 jobs during this period. The median number of RLF jobs influenced was 263. The
number of RLF jobs influenced ranged from 4 to 1,452.
Figure 24 charts the change in jobs created and retained per loan by ARC RLFs between
2002 and first quarter 2006. In 2002, ARC RLFs influenced 26.1 jobs per loan and loaned
$3,254 per job. In 2005, ARC RLFs influenced 48.4 jobs per loan and loaned $1,797 per
job influenced. Between 2002 and 2005, the number of jobs retained per loan increased
from 15.7 to 35.9 jobs retained per loan. Over this same period, the number of jobs created
per loan increased from 10.6 to 12.6. The efficiency of ARC RLFs at influencing local
employment is on par with or exceeded other government funded RLF pools. An analysis
of rural EDA RLFs conducted by the National Association of Development Organizations
(NADO) showed that they on average created or saved 16 jobs per loan with 20 percent of
rural RLFs creating or saving more than 30 jobs per loan. The same analysis showed that
each job created or retained cost the loan fund $4,502.50 The increased ability of ARC loan
funds to affect job retention and creation may be tied to the growing level of participation
ARC RLFs are taking in projects they finance.
50 National Association of Economic Development Organizations Research Foundation. March 2003. Organizations that Manage Loan Funds Create Rural Jobs Efficiently. Washington D.C.

132
Figure 24. Jobs created and retained per loan, 2002-2006 YTD
15.718.1
31.135.9
29.7
10.611.2
10.9
12.6
6.1
0.0
10.0
20.0
30.0
40.0
50.0
60.0
2002 2003 2004 2005 2006*
Jobs Retained per Loan Jobs Created per Loan
On a state by state basis, loan funds in Pennsylvania impacted the most regional jobs,
but Kentucky and West Virginia funds created and retained jobs at the highest rate.
Table 14 breaks out the state-by-state impact of ARC RLFs. Pennsylvania loan funds
impacted 567 jobs per fund between 2002 and 2006 1Q. However, loan funds in
Kentucky were the most efficient at impacting jobs by influencing nearly 110 jobs per loan
and costing roughly $700 per job over this period. West Virginia funds were also efficient,
influencing nearly 50 jobs per loan and costing less than $1,300 per job. On average, ARC
loan funds created nearly 315 jobs per fund and influenced 32 jobs per loan at a cost of
under $2,700 per job.

133
Table 14. Jobs Impacted by ARC RLF Lending by State, 2002-2006 1Q
Jobs Impacted Jobs Impacted Dollars LoanedARC Per RLF Per RLF Loan Per Job Impacted
State RLFs 2002-2006 1Q 2002-2006 1Q 2002-2006 1QAlabama 3 67.3 22.4 $2,129Georgia 1 151.5 25.3 $7,789Kentucky 3 401.7 109.5 $704Maryland 1 172.0 21.5 $3,756Mississippi 4 216.3 18.4 $4,473North Carolina 1 37.0 12.3 $10,270New York 5 230.8 25.1 $3,049Ohio 4 107.8 13.1 $5,102Pennsylvania 8 567.4 44.5 $1,854South Carolina 3 506.3 20.8 $5,448West Virginia 5 336.2 49.4 $1,277
ARC Total 38 314.6 32.1 $2,669
Community Development Venture Capital Funds
A significant and growing subset of the CDFI industry are community development
venture capital funds (CDVCs). These institutions specialize in providing equity or equity-
like investments to businesses in distressed or underserved communities. Such equity
products differ from the more traditional loan products offered by banks and many
community development loan funds and are a significant driver of business growth. An
expanding business needs significant capital to grow, but may not have a regular cash flow
that would allow the firm to repay a substantial monthly debt service. Venture capital
firms provide such businesses with a direct infusion of cash in exchange for a share of
ownership. Such investments provide firms with the necessary capital to grow as well as
the increased participation and expertise of the venture capital firm who are typically
specialists in a given industry. CDVCs differ from traditional venture capital firms in their
focus on financing businesses in distressed communities.
Access to traditional venture capital has been limited by industry type and firm location.
Venture capital firms typically focus on financing a small number of high growth industries
often in high technology sectors. More traditional sectors of the economy such as
manufacturing are slower growth industries and rarely benefit from venture capital
134
financing. Additionally, venture capital financing is highly geographically concentrated.
States with high concentrations of technology firms are regions that have benefited most
from venture financing. A report from the Community Development Venture Capital
Alliance (CDVCA) shows that between 1991 and 2000, over 65 percent of all venture
capital financing went to five states (California, Massachusetts, New York, Texas, and
Colorado) with well established technology sectors.51 In additional to high levels of
concentration in a few states, traditional venture capital financing also has a very strong
urban focus. A rule of thumb is that venture capital firms rarely invest in companies more
than a two hour drive away giving a distinct disadvantage to more geographically dispersed
non-metropolitan firms. The same report by CDCVA shows that of all firms receiving
investment from traditional venture capital firms in 2001, over 98 percent were in
metropolitan counties while less than two percent were in semi-rural counties and none
were in rural areas.
In Appalachia, the dearth of available equity capital was identified in a report produced by
Mt. Auburn Associates for the Appalachian Regional Commission (ARC). The report
identified gaps in capital needs for regional entrepreneurs. While a small subset of firms in
the region sought some type of equity or risk capital, these firms had substantial difficulty
in obtaining it.52 Limited access to equity capital can affect the ability of the region to
develop, attract, or retain small- or mid-sized firms in high growth industries. The report
recommended that ARC invest in socially oriented venture funds.
In response to this recommendation, ARC began an entrepreneurship initiative that focused
on promoting the growth of CDVCs in the Appalachian region. To this end, ARC initiated
a partnership building effort through a series of conferences focused on access to equity
capital in rural markets that brought together foundations, financial institutions, and
economic development organizations. ARC also worked with the Community
Development Venture Capital Alliance to enhance the capacities of area CDVC
51 Schmidt, Brian. May 2003. “Assessing the Availability of Traditional Venture Capital in the U.S.: A Preliminary Analysis.” Community Development Venture Capital Alliance: New York, NY. 52 Mt. Auburn Associates. February 1998. Capital and Credit Needs in the Appalachia Region. Appalachian Regional Commission: Washington, DC.

135
management teams. Additionally, as of October 2004, ARC had granted $4.4 million to 13
CDVCs (11 active funds) in seven states in the region. These funds have a total
capitalization of $96 million and have invested $13.6 million in 59 regional businesses.
These investments have created over 1,000 jobs in the region.53
The previous analysis of CDFIs in Appalachia identified some key issues in CDVC sources
of capitalization and levels of self-sufficiency. Appalachian CDVCs received twice as
much funding from government sources as national CDVCs, while national CDVCs were
more heavily capitalized by depository financial institutions and foundations than
Appalachian funds (see Appendix Table 9). This indicates there may be opportunity for
Appalachian CDVCs to diversify into these sources of investment capital. Additionally,
the above analysis showed that Appalachian CDVCs had a higher level of self-sufficiency
that their national counterparts. Appalachian CDVCs had a .68 self sufficiency ratio
compared to .44 for national CDVCs. This means that Appalachian CDVCs could support
68 percent of their operating expenses through earned revenue. While this is not the
optimal level of 1.0 or greater, it shows that Appalachian CDVCs perform at a high level
relative to national peers.
SBA Loan Programs
The U.S. Small Business Administration administers a number of programs to help
businesses in underserved markets access necessary capital. The SBA’s 7(a) program has
been discussed previously. This section takes a closer look at two programs that require
the presence of an intermediary: the SBA Microloan Program and the 504/CDC Loan
Program.
The SBA Microloan program makes funds available to non-profit community-based
intermediaries for the purpose of making very small loans (under $35,000) to businesses.
These loans are intended to go to very small firms and target business owners who
traditionally have difficulty accessing capital such as start-up businesses and minority- and
53 Source: Internal ARC data on Development Venture Capital Funds in Appalachia.

136
women-owned firms. The SBA disperses funds to community based, non-profit lending
intermediaries. These intermediaries make all credit decisions and have some discretion
over loan terms. In recent federal budgets, funding for the SBA Microloan program has
been eliminated only to be later returned. The future of the program remains uncertain.54
SBA microlending intermediaries are effective at serving distressed counties, but have
difficulty reaching minority-owned businesses. Table 15 shows the number of
microloans per 10,000 businesses and per 10,000 microbusiness (fewer than 5 employees)
in 2003-2004. The analysis shows that in Appalachia distressed counties have high levels
of SBA-guaranteed microlending compared to non-distressed counties. Distressed counties
received 10.1 microloans per 10,000 microbusinesses compared to 5.6 per microloans per
10,000 microbusinesses in non-distressed counties. Overall, Appalachia had high levels of
SBA-guaranteed microlending. The region had 6.1 loans per 10,000 microbusinesses
compared to 4.6 per 10,000 microbusinesses nationally. In distressed counties, start-up
businesses and those that are majority women owned received loans at levels comparable
to the rest of the region and nation. Minority-owned businesses, however, seem to have
more limited access to microfinance, particularly in distressed counties. Only 8.3 percent
of microloans in distressed counties went to minority-owned businesses compared to 21.3
percent in the region and 50 percent for the nation. Map 7 shows microlending in the
region and plots the locations of intermediaries serving Appalachia. The highest levels of
microlending appear in parts of central Appalachia, particularly in parts of Virginia,
Kentucky, and North Carolina. New York also has high levels of microlending.
Businesses in the southern part of Appalachia would appear to have more limited access to
SBA-guaranteed microfinance with many parts of the region having zero microloans.
54 Bernard, Tara Siegel. April 25, 2006. “Microloans are Again a Point of Budget Dispute.” American Banker.

137
Table 15. SBA Micro Lending Activity in Appalachia, 2003-2004
Distressed Non-DistressedCounties Counties All USA
Loans per 10,000 Micro Business (1-4 employees) 10.1 6.0 6.1 4.6All Businesses 6.0 3.5 3.6 2.7Percent loans made to:Start-ups 36.1% 43.8% 43.2% 43.5%Minority-Owned Business 8.3% 22.4% 21.3% 50.0%Majority Woman-Owned Business 41.7% 38.8% 39.0% 44.9%
Appalachia
The SBA 504 loan program provides long term financing for large fixed costs such as a
land acquisition, construction, infrastructure improvements or large equipment. Loans
through the 504 program are structured to require a private lender to be senior lien holder
and to finance up to 50 percent of a project. A Certified Development Company (CDC)
serves as junior lien holder for up to 40 percent of the project cost. The CDC loan is
guaranteed 100 percent by the SBA. The business is required to produce at least 10 percent
of project costs. Generally, businesses are required to create or retain at least one job per
$50,000 guaranteed by the SBA Use of the 504 loan program varies widely regionally. In
many regions of the country the product is not well known. Smaller community banks
have constraints on the size of loans they can make. The loan fees are high, and some
lenders feel that the SBA paperwork and approval process slows down deals.55
55 Office of the Controller of the Currency. February 2006. “SBA 504 Loan Program: Small Businesses’ Window to Wall Street” Community Development Insights. Washington D.C.
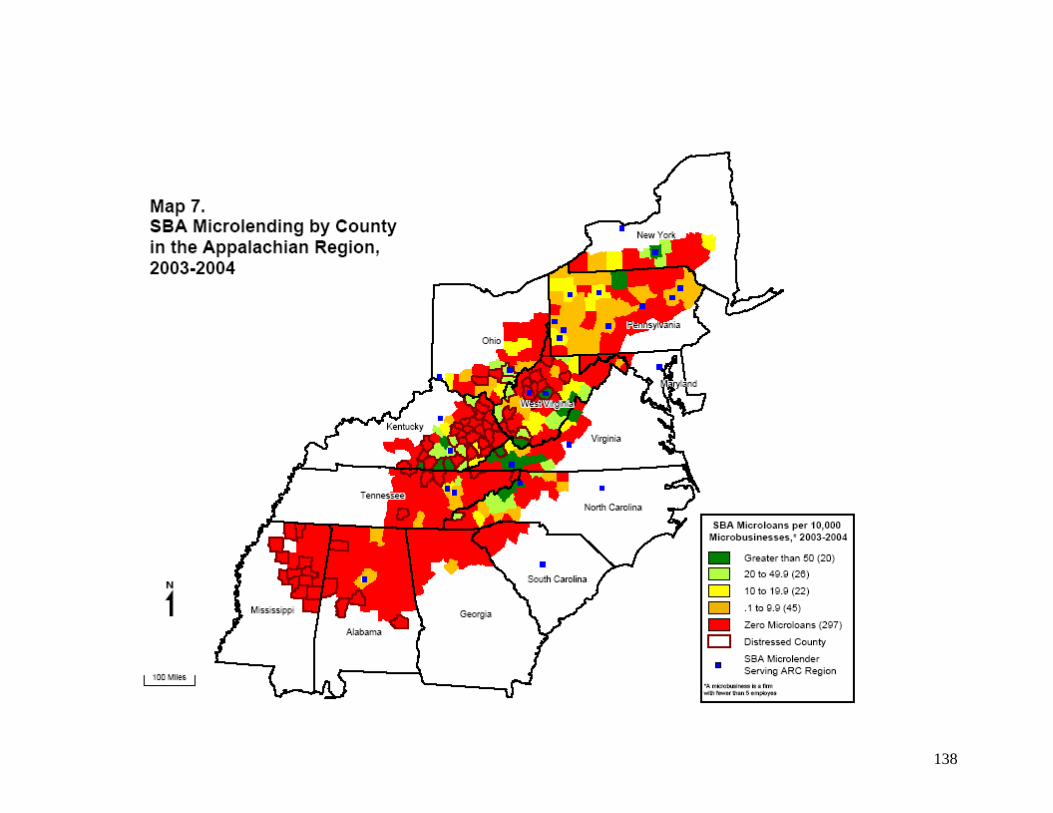
138

139
There were few SBA 504 loans to distressed counties and minority and women-owned
businesses received no 504 loans in 2003-2004. Table 16 shows that 504-guaranteed
lending levels in Appalachia lags national averages except in lending to majority women-
owned businesses. Within Appalachia, lending in distressed counties substantially lags that
in non-distressed counties. Distressed counties received 1.2 504 loans per 10,000 business
compared to 4.1 for the region. Although minority- and majority-women owned businesses
in non-distressed Appalachian counties had access to 504-guaranteed lending on par with
or well above national averages, similar businesses in distressed counties received no 504
loans. Map 8 illustrates levels of 504 lending in the region. Unlike microlending, southern
Appalachia has high levels of 504 lending, particularly in Alabama, Georgia, and South
Carolina with the lowest levels of 504 lending seen in Virginia, West Virginia, and
Kentucky.
Table 16. SBA 504 Lending Activity in Appalachia, 2003-2004
Distressed Non-DistressedCounties Counties All USA
504 Loans per 10,000 Businesses 1.17 4.27 4.13 8.14Percent of Loans to:Minority-Owned Business 0.0% 21.4% 21.1% 21.9%Majority Woman-Owned Business 0.0% 35.1% 34.6% 16.9%
Appalachia

140
141
Conclusion
CDFIs
The community development financial institution industry in Appalachia is less mature
than the national industry. Appalachian CDFIs largely target rural markets for their
lending. Appalachian CDFIs lend at levels on par with national counterparts of similar
size, but have a much stronger emphasis on lending for small and mid-sized businesses
development. Financing larger businesses with greater than five employees has allowed
Appalachian CDFIs to impact substantially more jobs than national CDFIs. Appalachian
community development loan funds and venture capital funds have a strong reliance on
capital from government sources. Appalachian loan funds also have low levels of self-
sufficiency, particularly when compared to national counterparts.
RLFs
Although revolving loan funds who received grant money from the Appalachian Regional
Commission have smaller deal flow than some national indicators, they report being able to
influence a substantial number of jobs in the region. The efficiency at which ARC RLFs
influence jobs has increased over time, surpassing industry numbers in jobs created per
loan and the dollars loaned per job influenced.
SBA Intermediaries
SBA microlending intermediaries are effective at lending in Appalachian distressed
counties, but substantially lag in terms of lending to minority-owned businesses in
distressed counties. SBA 504 lending in Appalachia substantially lags national averages.
Of particular concern is the fact the zero 504 loans were made to minority- or women-
owned firms in Appalachian distressed counties.

142
Conclusion
The Appalachian Regional Commission (ARC) contracted with the National Community
Reinvestment Coalition (NCRC) to conduct this study as part of ARC’s effort to develop
Appalachia through increasing access to credit and capital for small businesses.
Heightened capital flows to small businesses would bolster the economic development of
the region by creating jobs, diversifying the economy, and further developing an
entrepreneurial class in Appalachia. This study found that banks have committed
substantial amounts of community development financing to the region and are responding
well to the credit needs of Appalachian small businesses in minority communities. The
study recommends that stakeholders work together to close remaining credit gaps and
needs in Appalachia.
Mid-size community banks were particularly responsive to the needs of small businesses in
lower income and distressed rural communities in Appalachia. These lending institutions
demonstrate that small business lending is profitable and rewarding for banks. The
challenge for stakeholders is to encourage all lending institutions to expand upon profitable
lending opportunities and to further finance an infrastructure for supporting small business
and economic development.
This study is cautiously optimistic that stakeholders can work together to close remaining
credit gaps. The reasons for optimism include a favorable comparison between Appalachia
and the nation on some indicators of lending. In addition, Appalachia has a lending
infrastructure that includes about 227 banks and savings and loans with more than $500
billion in assets, and a sector of alternative lending institutions featuring over 100
community development financial institutions (CDFIs) and 190 revolving loan funds
(RLFs).
The Community Reinvestment Act (CRA) has had a substantial impact in leveraging
increases in community development lending and investing in the Appalachian Region.
This study finds that banks and thrifts headquartered in Appalachia issued about $5.4

143
billion in lending and investing for affordable housing, small business development, and
economic revitalization each CRA exam cycle (about 2.5 years). In addition, small
business lending exhibited a positively unique and puzzling trend in Appalachia. In
contrast to most other regions in the country, small business lending was higher where the
minority population was higher on a county level in Appalachia.
Despite signs of progress, differences in small business lending within Appalachia must be
overcome by concerted and persistent efforts undertaken over a multi-year time period.
Within Appalachia, small business lending is less accessible in non-metropolitan counties
and counties experiencing economic distress. In addition, the smallest businesses with
revenues under $1 million and businesses in low- and moderate-income communities
experience the least access to credit. A series of policy initiatives are needed for
overcoming the unequal access to credit including a program of branch building in
underserved and non-metropolitan counties, the preservation of a community banking
sector of mid-size banks, an intensified focus of Small Business Administration (SBA)-
guaranteed lending in counties with high levels of minorities, and the vigorous application
of the Community Reinvestment Act (CRA) to address the need for small business
development in non-metropolitan and distressed counties.
The NCRC study updates the report commissioned by ARC in 1998 and conducted by Mt.
Auburn Associations entitled Capital and Credit Needs in the Appalachian Region. The
Mt. Auburn study motivated a follow-up study focusing on bank financing because one of
the key findings of the Mt. Auburn study was that “Appalachian businesses are heavily
dependent on the banking industry for financing.” In addition, the Mt. Auburn study
identified significant credit needs as “insufficient financing appears to have a serious
impact on the investment decisions of about one in five established companies.” Further,
the Mt. Auburn study indicated that small firms with less than 10 employees had higher
levels of unmet funding needs than their larger counterparts.
The Mt. Auburn study broke important ground through its use of surveys of Appalachian
small businesses. The study did not benefit, however, from publicly available data on CRA
small business lending. The CRA data for the year 1996 first became available in summer
144
of 1997 when the Mt. Auburn study was well underway. In addition, researchers became
much more familiar with the strengths and weaknesses of the database over the next several
years. Thus, this study provides an important update to the Mt. Auburn report by utilizing
the small business lending data and probing to what extent the unmet credit needs overall
and for very small businesses still exist in Appalachia.
Since the Mt. Auburn study, new trends and challenges confront Appalachia. The
heightened pace of globalization, consolidation in the banking industry, the high cost of
energy, and rising interest rates pose significant challenges as well as new opportunities for
business development. Changes in the Community Reinvestment Act (CRA) and federal
economic development programs likewise present a series of challenges and opportunities.
For example, the federal New Markets Tax Credit program promises to provide a
significant amount of resources for development in Appalachia. The program authorizes
the Department of Treasury to provide tax credits of 39% on up to $15 billion of private
investments in low-income areas for business development activities and small business
lending. Nonprofit and private sector entities in Appalachia are just beginning to take
advantage of this new program.
NCRC’s study was able to consider the impact on small business lending of a number of
these large economic changes such as consolidation in the banking industry and the
growing use of credit scoring in small business lending. However, future studies will be
needed to further evaluate the impact on access to credit of changes in federal programs
and banking regulations as well as globalization and other economic structural adjustments.
Methodology and Findings
This report employed a number of datasets and created datasets for the quantitative
analysis. For the analysis of small business lending trends, NCRC used the publicly
available data on CRA small business lending. This data was combined with U.S. Census
data on population demographics and Dun and Bradstreet data on business demographics
and credit scores. In addition, data was obtained from the Small Business Administration
(SBA) on SBA lending programs. Branch and deposit data was obtained from the web

145
page of the Federal Deposit Insurance Corporation (FDIC). The section of the report
analyzing community development lending and investing created a database consisting of
data pulled from CRA exams of banks and thrifts located in Appalachia. Finally, the
chapter on alternative financial institutions used data collected by public agencies, ARC,
and trade associations of Community Development Financial Institutions (CDFIs).
The CRA small business lending data analysis used the year 2003. A longitudinal data
analysis was not employed because changes in the definitions of loans in the CRA small
business data had a significant impact on annual loan volumes. In addition, the number of
lenders required to report the data has changed. It is recommended that ARC commission a
future study, using the CRA small business data as one of the resources. Such a study
should carefully assess the influence of changes in the database on similarities and
differences in lending patterns found in this current study and the future one. A similar
caveat applies to the CRA exam analysis. The most recent CRA exam was used for each
lender in this study. A future study can assess if levels of community development
financing by banks increased or decreased by using the subsequent exams for each lender
headquartered in Appalachia.
The major findings in this report include:
Appalachia Compared to the Nation
Small business demographics in the nation and in Appalachia were remarkably similar.
The two largest small business sectors in the nation and in Appalachia were services and
retail. Similarly, almost 60 percent of the small businesses in Appalachia and the nation
were very small, consisting of 1 to 4 employees.
Appalachia compares favorably against the nation on some lending indicators. Appalachia
compares favorably against the nation when considering small business loan-to-deposit
ratios and small business lending in minority counties. The small business loan-to-deposit
ratio for Appalachia was 7% in contrast to 5.2% for the nation, or 35% higher in
146
Appalachia than the nation. In addition, banks made loans to 39.4% of the businesses in
counties in which less than 20% of the population is minority in Appalachia, which was
similar to national loan penetration rates of 41% for these counties. However, in counties
in which more than 20% of the population is minority, banks made loans to 51.4% of the
businesses in Appalachia, compared to national loan penetration rates of 42%. The lending
levels within high minority population counties were 22% higher in Appalachia than the
nation.
Nationally, banks provided significantly more small loans per branch than did banks in
Appalachia, but Appalachian banks provided more loans per branch in non-metropolitan
counties. In 2003, banks across the country originated 85.6 loans per branch, which was
35% higher then the 63.6 loans per branch for banks in Appalachia. But for non-
metropolitan counties, banks loaned at higher levels in Appalachia. Banks in Appalachian
non-metropolitan counties provided 57.5 loans per branch, which was 8% higher then the
53.2 loans per branch for similar counties in the nation.
Trends within Appalachia
Within Appalachia, businesses in low- and moderate-income census tracts and businesses
with revenues under $1 million experienced particular difficulties accessing credit. In
2003, 14% fewer businesses in low- and moderate-income census tracts received loans as
compared to businesses throughout the region (35.4% compared to 41% for the region). In
addition, only 23.6% of the small businesses with less than $1 million in revenues located
in low- and moderate-income tracts received loans, which was 43% below lending levels
for the Region as a whole.
Banks have more difficulty serving non-metropolitan and distressed counties than
metropolitan and non-distressed counties. In the Appalachian portion of nine states, the
ratio of loans per small business was lower in non-metropolitan counties than metropolitan
counties. For example, in Alabama, 58.6% of the businesses received loans in
metropolitan counties while 48.6% of the businesses received loans in non-metropolitan

147
areas during 2003. In addition, just 32.1% of the small businesses in distressed counties
obtained small business loans in contrast to 41.9% of the businesses in non-distressed
counties (Distressed counties have higher unemployment, higher poverty rates, and lower
income levels).
Banking industry structure impacts access to credit for small businesses in Appalachia. It
is more likely that small businesses will receive loans in counties in which banks compete
vigorously for customers by building and maintaining branches than in counties dominated
by fewer banks that are less concerned with their branch presence. The study finds that
small business lending was higher in counties with higher levels of bank branches. In
counties with above median number of branches, the median number of loans by all banks
was 1,287. In counties with below median number of branches, the median number of
loans was 235. In contrast, overall lending was lower in counties with higher levels of
bank concentration or consolidation. In Appalachian counties with below median levels of
concentration (as measured by the Herfindahl-Hirschman index), the median number of
small business loans was 1,120. In counties with above median levels of concentration, the
median number of small business loans was 287 during 2003.
The econometric analysis in the report reaffirmed the finding that lending in Appalachian
counties was higher in counties with higher numbers of minorities. The federal
government reports that minority-owned firms are expanding at a rapid clip across the
country. Perhaps the rapid growth contributes to more lending in counties with high
minority populations in Appalachia. Perhaps counties with greater diversity have more
robust economies. This dynamic needs further exploration since it appears to be unique to
Appalachia, and is a strength that can be built upon by stakeholders in Appalachia.
Role of Small and Mid-Size Banks
Another asset in Appalachia is its significant sector of small and mid-size banks. The
literature suggests that small and mid-size banks are particularly oriented to the needs of

148
small businesses in underserved communities. This study tends to confirm the distinct
lending focus of smaller banks in Appalachia. The findings from the study include:
Banks with assets between $250 million to $1 billion (mid-sized banks) had a higher
percentage of total loans in non-metropolitan counties (12.3% of all loans) than
metropolitan counties (6.5% of all loans) during 2003. Mid-size banks also had a higher
market share of loans in distressed counties (14.7% of all loans) than non-distressed
counties (8.4% of all loans) during 2003.
In contrast to their loan penetration in non-metropolitan and distressed counties, mid-size
banks were not as uniformly successful in counties with significant numbers of minorities.
Mid-size banks made almost 30% of the loans in counties with more than 50% minorities
but had their lowest market share of 6.7% of the loans in counties with 20% to 50%
minorities. Mid-size banks therefore had mixed success reaching minority counties in
Appalachia during 2003.
As predicted in the literature, mid-size banks did not base their lending in Appalachia on
the distribution of small business credit scores on a county level whereas all banks had
higher levels of lending in counties with the greatest portions of low risk businesses. In
addition, mid-size bank lending levels were not dependent on the size of small businesses
whereas all banks had higher levels of lending in counties with a greater portion of
businesses with 10 to 19 employees. This suggests that mid-size banks may be more
oriented to the smaller businesses that may not have established credit histories. The mid-
size banking sector in Applalachia is therefore an important sector to start-ups and smaller
businesses seeking to grow and expand.
Trends in Small Business Administration (SBA) Lending
The major lending program of the Small Business Administration (SBA) was more
successful in reaching non-metropolitan counties than minority small businesses during
2003. In Appalachia, African-Americans were 8.3% of the population but were issued just

149
2.1% of the SBA 7(a) loans. SBA-guaranteed lending fared better in serving non-
metropolitan counties as the SBA 7(a) market share of loans was higher in non-
metropolitan counties than metropolitan counties during 2003.
In contrast to overall lending, SBA 7(a)-guaranteed lending was not higher in counties with
greater portions of minorities. It is possible that the relatively low levels of SBA-
guaranteed loans to minority-owned businesses or businesses in minority counties were due
to relatively high levels of conventional lending to these businesses. In contrast to the
findings for minorities, SBA-guaranteed lending exhibited more of a focus on non-
metropolitan counties.
Role of the Community Reinvestment Act
In addition to measuring how many home and small business loans banks and thrifts make
to low- and moderate-income borrowers, the Community Reinvestment Act (CRA) exams
scrutinize banks’ level of financing for affordable housing, and small business and
community development. NCRC’s study found substantial levels of community
development financing in Appalachia due to CRA.
Banks and thrifts in Appalachia made about $3.52 billion and $1.69 billion in community
development lending and investing during a time period of approximately once every 2.5
years (which is the average time period evaluated by CRA exams in the study). In other
words, lenders made about $5.4 billion in community development lending and investing
every 2.5 years. This figure of more than $5 billion represents a significant financial
resource for economic development in Appalachia.
Banks with higher ratings on CRA exams were found to have substantially higher levels of
community development lending, investing and branches in low- and moderate-income
communities. Through the rating system, CRA exams are providing motivation and public
recognition for banks to increase their level of community development financing in
Appalachia.

150
Despite the overall benefits of CRA, disparities remain in community development
financing. Non-metropolitan and distressed counties had considerably smaller shares of
bank assets. Banks located in the metropolitan counties had combined assets of $420.6
billion (117 banks) versus $73.3 billion for assets of banks located in non-metropolitan
counties (103 banks). Only 11 banks with combined assets of $4.3 billion were
headquartered in distressed counties in Appalachia. The substantial differences in bank
assets translated into non-metropolitan and distressed counties receiving less community
development financing than metropolitan counties.
Despite the large total dollar amount for community development financing, relatively
fewer dollars were devoted to small business development. In total, all banks and thrifts in
Appalachia made $297 million in community development loans that financed affordable
housing versus $117 million in community development loans for small businesses in
Appalachia. Similarly, banks and thrifts issued $807 million in investments for affordable
housing as opposed to $174 million in investments for small businesses in Appalachia.
Role of Alternative Financial Institutions in Appalachia
This report also examined the characteristics and abilities of alternative financial
institutions in financing small businesses in Appalachia. Alternative financial institutions
consist of Community Development Financial Institutions (CDFIs), community
development credit unions, loan funds and others that specialize in serving hard-to-reach
populations and small businesses. The report documents that alternative financial
institutions were effective in serving Appalachian small businesses and in creating and
preserving jobs. At the same time, they did not serve the smallest of the small businesses
to the same extent as their national peers. This study also documents that mainstream
banks had difficulties serving the smallest businesses with revenues under $1 million; thus
alternative financial institutions have a gap to fill that perhaps they are not filling as much
as they could. Also, alternative financial institutions in Appalachia were not financed by
banks to the same extent as their national peers. This suggests that CRA has a role to play

151
in encouraging mainstream banks to increase their levels of debt and equity financing for
small businesses directly and through the alternative financial institutions.
The community development financial institution (CDFI) industry is made up of a diverse
set of institutions that specialize in providing a mix of financial products and services to
distressed communities. There were over 100 CDFIs in the Appalachian region. Seventy-
one of these were community development loan funds. Appalachian loan funds had a
strong emphasis on business lending with over 70 percent offering a microfinance product
for very small enterprises (typically five or fewer employees) and 35 percent offering loan
products for larger businesses (typically greater than five employees). In the region,
Pennsylvania had the largest number of loan funds with 21. Kentucky and Tennessee also
had high concentrations of loan funds. Finally, in Appalachia there were 10 institutions set
up specifically for community development venture capital investment.
Appalachian CDFIs predominantly focused on rural markets and had been established
more recently than counterparts in the national industry. Appalachian CDFIs loaned at
levels on par with national counterparts of similar size. Appalachian CDFIs had lower loan
levels by number of loans, but loaned more in terms of dollars and had larger outstanding
loan pools.
Appalachian CDFIs were successful in reaching small businesses but were not as
successful in serving the smallest of the small businesses with less then five employees. In
FY 2003, over 32 percent of Appalachian CDFI loan dollars outstanding were dedicated to
small or mid-sized business development compared to only 18 percent for national CDFIs,
a difference of nearly 14 percentage points. Additionally, in FY 2003, over 61 percent of
the businesses financed by Appalachian CDFIs were enterprises56 with more than five
employees compared to 23 percent for national CDFIs who focused more heavily on
financing micro businesses (with under five employees).
56 The CDFI Data Project defines a larger business as one that has greater than five employees or one that received financing greater than $35,000 for the purpose of expansion, working capital, equipment purchase/rental, or commercial real estate development or improvement. A microbusiness would be a firm with five or fewer employees or one receiving a loan for $35,000 or less.

152
Financing businesses with greater than five employees allowed Appalachian CDFIs to
impact more jobs. By focusing on financing businesses with greater than five employees,
Appalachian CDFIs reported being able to create or retain over 3,300 jobs in the region in
FY 2003. Appalachian CDFIs reported assisting over 11 jobs per business financed. By
comparison, national CDFIs, assisted 2.8 jobs per business financed.
Appalachian CDFIs, particularly loan funds, had a heavy dependence on government
funding and received less bank financing. Forty four percent of Appalachian loan fund
debt capital came from federal, state, or local government sources while nearly 47 percent
of venture capital fund capitalization was from government sources. Nationally, loan funds
received less than 14 percent of debt capital from government sources while venture funds
received just over 23 percent. Therefore, Appalachian loan funds received over three times
as much of their debt capital from government sources as their national counterparts while
Appalachian venture capital funds received twice as much funding from government
sources as national venture funds. At the same time, Appalachian loan funds received 37
percent of their debt capital from banks while national loan funds obtained 47 percent of
their debt capital from banks.
Appalachian community development credit unions and venture capital funds were more
self-sufficient than their national peers while Appalachian community development loan
funds had lower self-sufficiency rates than the national averages. In FY 2003,
Appalachian community development credit unions had a self sufficiency ratio of .88 and
Appalachian community development venture capital funds had a self sufficiency ratio of
.68. Both of these numbers were well above national averages in their respective
industries. In contrast, Appalachian community development loan funds had a very low
self-sufficiency ratio of .35 indicating that only 35 percent of total expenses could be
covered by earned revenue. This number was well below that of national loan funds which
had self-sufficiency rates of .65.
Within the sector of alternative financial institutions, ARC supported revolving loan funds
were performing admirably. ARC funded revolving loan funds had declining deal flow,

153
but had taken a more active position in the projects in which they participate. The average
number of loans originated by ARC-funded RLFs had declined since 2000 when an
average of over four loans were originated per fund. This number declined to low of 2.6
loans per fund in 2005, but grew somewhat in 2006 where the average increased to 3.4
loans per fund.
Despite this decline in deal flow, ARC RLFs had increased their average level of
participation in deals particularly relative to other government-funded RLFs. Between
2000 and 2006, the percent of outside project financing tied to ARC RLF lending increased
from 14.4 percent to over 22 percent. This growing level of project participation by ARC
RLFs was in contrast to declining levels of participation by RLFs funded by other
government agencies. Loans through RLFs funded by other government agencies
contributed nearly 38 percent of total outside project financing in 2000, but this number
declined to less than 13.5 percent by 2006.
ARC funded RLFs had been effective at influencing job creation and retention in the
region. Between 2002 and the first quarter of 2006, loans from ARC capitalized revolving
loan funds helped create over 3,600 jobs and retain over 8,300 jobs in the region. In 2002,
ARC RLFs influenced 26.1 jobs per loan and loaned $3,254 per job influenced. In 2005,
ARC RLFs influenced 48.4 jobs per loan and loaned $1,797 per job influenced. This
means that ARC RLFs were influencing more jobs per loan, but spending less per job
influenced.
The Appalachian Regional Commission has worked to improve access to equity capital in
the region. In response to lack of available equity capital in Appalachia, ARC began an
entrepreneurship initiative that focused on promoting the growth of community
development venture capital funds in the region. To this end, ARC initiated a partnership
building effort through a series of conferences focused on access to equity capital in rural
markets that brought together foundations, financial institutions, and economic
development organizations. ARC also worked with the Community Development Venture
Capital Alliance to enhance the capacities of area CDVC management teams.

154
Additionally, as of October 2004, ARC had granted $4.4 million to 13 CDVCs (11 active
funds) in seven states in the region. These funds had a total capitalization of $96 million
and have invested $13.6 million in 59 regional businesses creating over 1,000 jobs in the
region.
SBA programs using alternative financial institutions recorded mixed success. SBA
funded microlenders were effective at lending to distressed markets, but SBA microlending
and 504 lenders provided only limited support to minority businesses in distressed
counties. In Appalachia, distressed counties received 10.1 SBA microloans per 10,000
microbusinesses compared to 6.0 per 10,000 microbusinesses in non-distressed counties.
However, minority owned businesses in distressed counties received far fewer microloans
than did other businesses throughout the region. Additionally, no SBA 504 loans were
originated to minority- or women-owned businesses in Appalachian distressed counties,
while over 20 percent of SBA 504 loans were originated to minority or women-owned
businesses through the rest of the region.
Data Limitations
The CRA small business data has limitations that must be kept in mind when conducting
research. Firstly, the definition of a loan origination changed over the years. The
regulatory agencies allowed banks to count one loan renewal for a small business borrower
as an origination in a given year. This means that if a sizable number of borrowers of a
particular bank refinanced in one year as opposed to another year, the annual loan volume
of a particular bank can fluctuate dramatically. When NCRC was starting this report, the
yearly loan volume of all banks and thrifts in a couple of test cases (New York and West
Virginia) fluctuated substantially. Because the definition of a loan origination caused a
significant amount of this fluctuation, NCRC and ARC decided against a time series
analysis. Nevertheless, it is acknowledged that a one-year snapshot limits the descriptive
and statistical data analysis.

155
A second data limitation is that the CRA small business data does not include the race and
gender of the small business owner unlike the SBA data. It is therefore not possible to
compare SBA and CRA small business lending patterns to women- and minority-owned
small businesses. A third data limitation, as discussed above, was the elimination of the
requirement for mid-size banks to collect and publicly report their CRA small business
data.
A fourth issue that may be related to a data limitation was the lack of a relationship in the
regression equations between lending levels and sector of small businesses. Small
businesses in different sectors such as retail as opposed to heavy machinery have needs for
different types of loans. This report tried various versions of a small business sector
variable but did not generate any statistically significant results for that variable. If we had
more data on the type or purpose of the loans (such as loans for establishing stable cash
flow as opposed to purchasing new equipment), the sector variable may have become
significant. A future study should attempt to procure more detail on the purpose of the loan
and/or perhaps experiment with specifying various dollar amounts of loans.
A fifth issue related to data limitations and time constraints is a full investigation of the use
of credit scoring by in-market versus out-of-market banks and financial institutions. The
report investigated the use of credit scoring by mid-size banks with branches located in
Appalachia but did not expand this inquiry to scrutinize the use of credit scoring by all
banks with branches within Appalachia versus lenders lacking a branch presence in
Appalachia. This is an area worthy of additional investigation to determine if the use of
credit scoring corresponds to branch presence as well as the asset size of a bank.
Another constraint regarding time series analysis involves the CRA exam analysis. NCRC
conducted an analysis using the most recent CRA exam for each bank and thrift in the
sample. If resources had permitted, the study could have considered bank lending and
investing over two CRA exams (the most recent exam and the previous exam). That would
have permitted the study to assess trends over time in different categories of counties. For
example, the study found that the levels of community development lending and investing

156
in non-metropolitan areas were lower than the levels of community development financing
in metropolitan areas. Nevertheless, the study cannot comment upon whether levels of
community development financing in non-metropolitan areas had been increasing over
time since the study did not use the most recent and previous CRA exams for the banks and
thrifts headquartered in Appalachia. It is possible that levels of community development
lending and financing have been increasing in non-metropolitan areas due to the increased
attention CRA received in the late 1990s and into the 21st century. Future studies will be
able to pick up this important analysis commenced by the NCRC study.
Policy Options
Based upon the report’s findings, the following policy options are offered to increase
access to credit and capital in non-metropolitan areas, distressed counties, and among small
businesses with revenues under $1 million. A number of these recommendations can be
implemented by ARC working together with stakeholders in the Appalachian region.
These stakeholders include state agencies, elected officials, lending institutions, Federal
Home Loan Banks, federal regulatory agencies, the U.S. Department of Treasury, financial
intermediaries, public finance markets, development organizations, and the Federal
Reserve Banks:
Increase Branch Presence, particularly in non-metropolitan areas and distressed counties
– The report found that lending is higher in counties with higher number of branches.
Building bank branches, particularly in non-metropolitan and distressed counties, should be
regarded as an important part of an economic development program. Public and private
sector stakeholders should work together on a branch building program. Banks have been
expanding their branch networks in the last 3 or 4 years; the challenge is to build branches
in minority and low- and moderate-income communities. ARC, state agencies, and lending
institutions should investigate New York State’s Banking Development District (BDD)
Program. Begun in 1998, the BDD program offers partial property tax exemptions for
branches opening in geographical areas in need of banking services. Local governments
can also agree to earn below market rates of return on Certificates of Deposits in these

157
branches. The New York State Banking Department reports significant increases in
banking services including 256 loans per BDD branch and financial education services
delivered out of these branches.57
Growth of a Community Banking Sector – Since mid-size banks with assets between $250
million to $1 billion played important roles in small business financing, stakeholders
therefore should ensure that the mid-size and smaller bank sector remain viable and
vibrant. Incentives could be developed to support existing mid-sized banks, or encourage
the formation of new banking institutions in underserved areas. For example, the Federal
Home Loan Bank System should consider additional advances and other incentives to
support the small business lending of mid-size banks. Currently, the Federal Home Loan
Bank of Pittsburgh operates a Banking on Business (BOB) program that provides financing
for bank loans that would not otherwise be made due to insufficient cash flow from the
small business. Since its inception, BOB has provided $20.5 million in funding, creating
and retaining 3,500 jobs.58 Likewise, the Federal Home Loan Bank of Atlanta runs the
Economic Development Program that helps provide financing to small businesses.59 ARC
could also work to stimulate the formation of development banks in the Region. In
addition, the New York State program for expanding branches mentioned above could
serve as a model and be especially adapted for mid-size banks headquartered in
Appalachia. Finally, private sector incentives and investments for mid-size banks can play
an important role in the preservation and expansion of the community banking sector.
Increase levels of community development financing for small business development –
The report found banks located in Appalachia devoted significantly higher levels of
community development lending and investing for affordable housing than small business
development. This finding does not mean that community development financing levels
for affordable housing should go down so that levels for small businesses can go up.
57 See http://www.banking.state.ny.us/pr980226.htm and http://www.banking.state.ny.us/pr050810.htm. Last accessed July 3, 2006. 58 See http://www.fhlb-pgh.com/housing-and-community/real-life-stories/banking-on-business.html, last accessed December 21, 2006. 59 http://www.fhlbatl.com/fhlb_content.cfm?lev1=5cis&lev2=bcedp&lev3=2edp, last accessed December 21, 2006.

158
Instead, it suggests that banks should be encouraged to increase their overall levels of
community development financing and then could devote substantial portions of the
increases towards small business development. Stakeholders including ARC, state
agencies, and lending institutions should work together to expand community development
financing for small business development and support.
Diversify sources of debt and investment capital for community development loan funds
and venture capital funds. Appalachian CDFIs need to diversify their funding base.
Community development loan funds and venture capital funds are heavily reliant on
government sources for debt and investment capital. These same institutions, however, lag
national counterparts in accessing capital from depository financial institutions, non-
depository financial institutions, and foundations in the case of loan funds and depository
financial institutions and foundations in the case of development venture capital funds.
ARC can develop relationships with potential investors and regulatory agencies to
encourage increased investment within Appalachia, including partnerships with financial
intermediaries such as the Community Reinvestment Fund, participation in public
secondary markets, and continue efforts to utilize tax credit financings such as the New
Markets Tax Credit program. Additionally, ARC should review other potential barriers to
diversifying CDFI capitalization such as product offerings and loan pricing and structuring.
Finally, CRA should be used to encourage banks to provide more financing to alternative
financial institutions.
Appalachian loan funds must increase operational self sufficiency. Appalachian loan
funds, both Revolving Loan Funds and microenterprise funds, must increase levels of self
sufficiency by reducing operating costs or increasing revenues. Costs can be reduced
through consolidation of back office operations, a growing trend among national CDFIs.
Costs could also be reduced by undertaking joint marketing efforts among independent
loan funds. Operating revenues could be increased by increasing loan volume. This would
likely require increased levels of capitalization or access to new financing through
intermediaries.

159
Continue to grow capacity of Appalachian development venture capital funds. Available
literature shows that there remains a significant gap in access to equity financing in non-
metropolitan markets. ARC’s efforts to develop regional equity investment funds are
important in bridging this gap and increasing regional entrepreneurship levels. ARC
should continue to seed these investment funds, but also continue to build the capacity of
regional fund managers and develop networks and relationships with key investment
partners outside the region to reduce the reliance of Appalachian venture capital funds on
government investment. ARC should also closely monitor the performance of these funds
as they mature.
Maintain Integrity of CRA exams – Maintaining CRA exam integrity is important since
substantially different levels of community development financing were recorded by banks
with different CRA ratings. Most banks headquarted in Appalachia are banks with $250
million to $1 billion in assets. The federal regulatory agencies have implemented new
CRA exams for these mid-size banks. Stakeholders must ensure that the new CRA exams
require these mid-size banks to maintain and increase their levels of community
development financing in Appalachia. In addition, the regulatory agencies recently
amended the CRA regulations to provide CRA points for community development
financing in rural middle-income census tracts located in distressed and underserved
counties. Stakeholders should monitor CRA exams to ensure that rural low- and moderate-
income areas as well as middle-income areas receive community development financing.
In addition, stakeholders should ensure that metropolitan-based banks are also serving rural
areas. Finally, more detailed data on the purposes of community development financing is
needed on CRA exams to assess if the financing is responding to community needs. NCRC
found that much more detail was available on the purposes (whether for housing or small
business development) of community development investments than lending.
Congressional oversight and hearings regarding CRA exam quality would also bolster the
integrity of CRA exams.
Restoration of Small Business Lending Data for Mid-Size Banks –The study finds positive
and important findings of the lending patterns of mid-size banks. In 2005, federal

160
regulators deleted the small business loan data reporting requirements for banks and thrifts
with assets between $250 million and $1 billion in assets. It is counterproductive to
eliminate this data because studies in future years will not be able to carefully examine the
lending patterns of mid-size banks and fully and accurately assess their role in Appalachia.
Federal regulators should consider ways to continue to collect this important economic
data. In addition, federal regulators and Congress should consider requiring banks and
thrifts to report upon the race and gender of the small business borrower. Lending to
minority- and women-owned businesses would likely increase just as lending to minority
and women homebuyers increased because the Home Mortgage Disclosure Act (HMDA)
was amended in 1988 to require the reporting of race and gender of the borrower. Finally,
the regulatory agencies need to establish stability in the definitions of loan originations and
other aspects of the small business data so that time series analysis can become possible. It
would also be preferable to require separate reporting of loan originations and
renewals/refinances as is done with HMDA data.
While data collection imposes costs, the benefits can exceed those costs. The data can
document positive trends and highlight new opportunities as revealed by this study.
Moreover, data reporting motivates banks to maintain and increase their lending levels to
small businesses.
Encourage Small Business Administration (SBA-guaranteed lending to Minority-Owned
Businesses – The SBA should investigate ways to increase SBA-guaranteed lending to
minority-owned businesses and in minority counties. It is possible that the relatively low
levels of SBA-guaranteed loans to minority-owned businesses or businesses in minority
counties were due to relatively high levels of conventional lending to these businesses.
Also, there may be fewer lenders in minority counties that use SBA products.
Alternatively, it is possible that there are still certain types of credit needs that are not being
satisfied by the conventional lending, opening up new opportunities for the SBA-
guaranteed lending. In Appalachia, the counties with high levels of minorities are in
Mississippi, Alabama, Georgia, South Carolina, and North Carolina. SBA regional offices
in those states should work with ARC, state officials, lending institutions, nonprofit
161
counseling organizations, and other stakeholders to investigate credit needs and see if it is
possible to increase SBA-guaranteed lending in minority counties and to minority-owned
businesses.
Increase SBA microloans to minority-owned businesses and SBA 504 lending in distressed
counties, particularly to minority- and women-owned businesses. No SBA 504 loans were
originated to women or minority-owned businesses in distressed counties, and, overall,
distressed counties saw very low levels of 504 lending. In contrast, SBA microloans
reached distressed counties but were not as successful in reaching minority-owned
businesses in distressed counties. ARC should investigate possible barriers to 504 lending
in distressed counties and access for minority-owned businesses to microloans in distressed
counties. It is possible that lenders in distressed counties are unfamiliar with the 504
product or are discouraged due to concerns about the length of underwriting or program
fees. Also, if smaller banks in distressed counties are unable to make 504 loan deals, it
may be necessary to recruit larger institutions to participate in these loans if demand exists.
Financial Counseling and Technical Assistance for Small Businesses – Lending was higher
in counties with higher portions of small businesses with the lowest risk credit scores. This
suggests that lending will increase to small businesses overall if small businesses improved
their credit scores. High quality financial counseling efforts are therefore important in
Appalachia as a means to improve the credit scores of small businesses. In addition,
technical assistance should be provided to improve the knowledge and skill level of the
small business entrepreneurs regarding cash flow, understanding financials, business
planning and taxation issues. ARC, state officials, lending institutions, and community
organizations should work together to intensify financial counseling directed towards small
businesses in Appalachia.
Better Understanding of Lending in Minority Counties in Appalachia – The report’s
finding about higher levels of lending in counties with higher levels of minorities was a
surprising and positive finding. Future research should be conducted to more fully
understand why lending is unusually successful in reaching firms in counties with high

162
levels of minorities in Appalachia. Lessons from this research should be applied to other
regions of the country since the literature overall suggests serious barriers in access to
small business lending for minority-owned firms.
163
Bibliography
Berger, A. N. and G.F. Udell. Small Business Credit Availability and Relationship
Lending: The Importance of Bank Organizational Structure. FEDS Working Paper No.
2001-36. September 2001.
Berger, A.N. The “Big Picture” about Relationship-Based Finance. Discussion Comments.
ed.: Business Access to Capital and Credit (Federal Reserve System Research
Conference, March 8, 1999).
Berger, A.N., R.J. Rosen and G.F. Udell. The Effect of Market Size Structure on
Competition: The Case of Small Business Lending. Federal Reserve Bank of Chicago.
October 2001.
Berger, A.N., W.S. Frame and N.H. Miller. Credit Scoring and the Availability, Price, and
Risk of Small Business Credit. Federal Reserve Bank of Atlanta. April 2002.
Bitler, M.P., A.M. Robb and J.D. Wolken. Financial Services Used by Small Businesses:
Evidence from the 1998 Survey of Small Business Finances. Federal Reserve Bulletin.
April 2001.
Blanchflower, D.G., P.B. Levine, and D.J. Zimmerman. Discrimination in the Small
Business Credit Market. National Bureau of Economic Research. December 1998.
Capital and Credit Needs in the Appalachian Region. Mt. Auburn Associates. February
1998.
Cavaluzzo, K.S., L.C.Cavaluzzo and J.D. Wolken. Competition, Small Business Financing,
and Discrimination: Evidence From a New Survey. Journal of Business. January 2002,
vol. 75, no.4
Cole, R.A., L.G. Goldberg, and L.J. White. Cookie-Cutter versus Character: the Micro
Structure of Small Business Lending by Large and Small Banks, in J.L. Blanton, A.
Williams, and S.L.W. Rhine, ed.: Business Access to Capital and Credit (Federal
Reserve System Research Conference, March 8, 1999).
Credit in Rural America. USDA/Economic Research Service.
Financing Patterns of Small Firms: Findings from the 1998 Survey of Small Business
Finance. SBA Office of Advocacy. September 2003.

164
Frame, W. S., M. Padhi and L.W. Woosley. The Effect of Credit Scoring on Small Business
Lending in Low- and Moderate-Income Areas. FRB Atlanta Working Paper No. 2001-
6. April 2001.
Frame, W.S., A. Srinivasan and L. Woosley. The Effects of Credit Scoring on Small
Business Lending. Journal of Money, Credit, and Banking. Vol. 33, No. 3. August 2001
Hancock, D., J. Peek and J.A. Wilcox. The Effects of Mergers and Acquisitions on SB
Lending by Large Banks. SBA. March 2005
Haynes, G.W., C. Ou and R. Berney. Small Business Borrowing from Large and Small
Banks in J.L. Blanton, A. Williams, and S.L.W. Rhine, ed.: Business Access to Capital
and Credit (Federal Reserve System Research Conference, March 8, 1999)
Immergluck, D. and G. Smith. Bigger, Faster…But Better? How Changes in the Financial
Services Industry Affect Small Business Lending in Urban Areas. Woodstock Institute.
September 2001
Mitchell, K. and D.K. Pearce. Availability of Financing to Small Firms using the Survey of
Small Business Finance. SBA. May 2005
Ou, C. Banking consolidation and Small business lending: a Review of Recent Research.
SBA. March 2005
Peek, J., and E.S. Rosengren. Bank consolidation and small business lending: It’s not just
bank size that matters. Journal of Banking and Finance, 22. pages 799-819. 1998.
Samolyk, K.A. and C.A. Richardson. The Impact of Bank Consolidation on CRA Business
Lending. Federal Reserve Bank of Chicago. pages 320-339. April 2001.
Squires, G.D. and S. O’Connor. Access to Capital: Milwaukee’s Continuing Small Business
Lending Gaps. University of Wisconsin-Milwaukee. 1999
The State of Minority Business Enterprises: A Preliminary Overview of the 2002 Survey of
Business Owners, Minority Business Development Agency of the U.S. Department of
Commerce, September, 2005.

165
Appendices