accessibility and sas® visual analytics viewers: which...
TRANSCRIPT

1
Paper SAS655-2017
Accessibility and SAS® Visual Analytics Viewers: Which Report Viewer is Best for Your Users' Needs?
Jesse Sookne, Kristin Barker, Joe Sumpter, and Lavanya Mandavilli, SAS Institute Inc., Cary, NC
ABSTRACT
Many organizations that use SAS® Visual Analytics must conform with accessibility requirements such as Section 508, the Americans with Disabilities Act, and the Accessibility for Ontarians with Disabilities Act. SAS Visual Analytics provides a number of different ways to view reports, including the SAS® Report Viewer and SAS® Mobile BI native apps for Apple iOS and Google Android. Each of these options has its own strengths and weaknesses when it comes to accessibility—a one-size-fits-all approach is unlikely to work well for the people in your audience who have disabilities. This paper provides a comprehensive assessment of the latest versions of all SAS Visual Analytics report viewers, using the Web Content Accessibility Guidelines (WCAG) version 2.0 as a benchmark to evaluate accessibility. You can use this paper to direct the end users of your reports to the viewer that best meets their individual needs.
INTRODUCTION SAS strives to make all of its products accessible to people with disabilities, so that everyone can access and benefit from the power of analytics. This paper describes the accessibility of SAS Visual Analytics Viewer (for the web) and SAS Mobile BI native apps for mobile devices. It makes recommendations that you can use to choose the best viewer for your needs, or to direct your users with disabilities to the viewer that best meets their needs.
If you are a SAS Visual Analytics system administrator or report creator, your users might already have asked you whether the reports you deliver are accessible to people with disabilities. And if not, you’re likely to be asked this question in the future, as there are many people around the world with disabilities – probably including some of your users or customers, especially if your organization serves the general public. In the United States alone, around 19% of the population has some form of disability. (United States Census Bureau)
Users with disabilities are a diverse group with diverse needs. For example, the needs of a user with photosensitive epilepsy, who could have a seizure if rapidly flashing content is shown on screen, are quite different from the needs of a person with Parkinson’s disease, who might not be able to use a mouse, and must accomplish tasks using just the keyboard. When you consider your users’ needs and suggest the report viewer most appropriate for them, your users will be able to benefit from the insights in your reports, avoid frustration, and be more satisfied with their experience.
SAS is committed to accessibility. SAS continually strives to improve accessibility of SAS Visual Analytics Viewer (for the web) and SAS Mobile BI (for mobile devices). This paper provides a
snapshot of the accessibility of these products at the time it was written. Continuous and ongoing improvements in accessibility will over time close many of the accessibility gaps
identified in this paper.
2
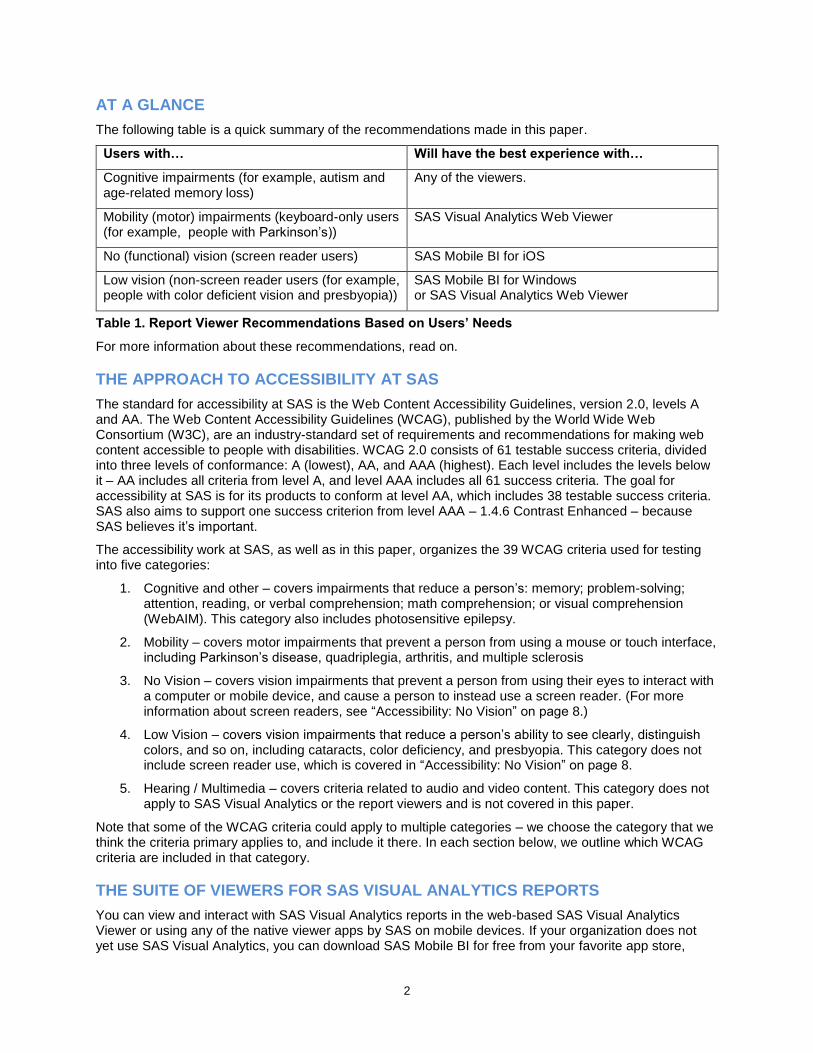
AT A GLANCE
The following table is a quick summary of the recommendations made in this paper.
Users with… Will have the best experience with…
Cognitive impairments (for example, autism and age-related memory loss)
Any of the viewers.
Mobility (motor) impairments (keyboard-only users (for example, people with Parkinson’s))
SAS Visual Analytics Web Viewer
No (functional) vision (screen reader users) SAS Mobile BI for iOS
Low vision (non-screen reader users (for example, people with color deficient vision and presbyopia))
SAS Mobile BI for Windows or SAS Visual Analytics Web Viewer
Table 1. Report Viewer Recommendations Based on Users’ Needs
For more information about these recommendations, read on.
THE APPROACH TO ACCESSIBILITY AT SAS
The standard for accessibility at SAS is the Web Content Accessibility Guidelines, version 2.0, levels A and AA. The Web Content Accessibility Guidelines (WCAG), published by the World Wide Web Consortium (W3C), are an industry-standard set of requirements and recommendations for making web content accessible to people with disabilities. WCAG 2.0 consists of 61 testable success criteria, divided into three levels of conformance: A (lowest), AA, and AAA (highest). Each level includes the levels below it – AA includes all criteria from level A, and level AAA includes all 61 success criteria. The goal for accessibility at SAS is for its products to conform at level AA, which includes 38 testable success criteria. SAS also aims to support one success criterion from level AAA – 1.4.6 Contrast Enhanced – because SAS believes it’s important.
The accessibility work at SAS, as well as in this paper, organizes the 39 WCAG criteria used for testing into five categories:
1. Cognitive and other – covers impairments that reduce a person’s: memory; problem-solving; attention, reading, or verbal comprehension; math comprehension; or visual comprehension (WebAIM). This category also includes photosensitive epilepsy.
2. Mobility – covers motor impairments that prevent a person from using a mouse or touch interface, including Parkinson’s disease, quadriplegia, arthritis, and multiple sclerosis
3. No Vision – covers vision impairments that prevent a person from using their eyes to interact with a computer or mobile device, and cause a person to instead use a screen reader. (For more information about screen readers, see “Accessibility: No Vision” on page 8.)
4. Low Vision – covers vision impairments that reduce a person’s ability to see clearly, distinguish colors, and so on, including cataracts, color deficiency, and presbyopia. This category does not include screen reader use, which is covered in “Accessibility: No Vision” on page 8.
5. Hearing / Multimedia – covers criteria related to audio and video content. This category does not apply to SAS Visual Analytics or the report viewers and is not covered in this paper.
Note that some of the WCAG criteria could apply to multiple categories – we choose the category that we think the criteria primary applies to, and include it there. In each section below, we outline which WCAG criteria are included in that category.
THE SUITE OF VIEWERS FOR SAS VISUAL ANALYTICS REPORTS
You can view and interact with SAS Visual Analytics reports in the web-based SAS Visual Analytics Viewer or using any of the native viewer apps by SAS on mobile devices. If your organization does not yet use SAS Visual Analytics, you can download SAS Mobile BI for free from your favorite app store,
3
install it on your mobile device, open the sample reports, and try it yourself. If your organization already uses SAS Visual Analytics, you can use all of the report viewers with your own reports, at no additional cost.
We tested each of these viewers for accessibility using WCAG 2.0 AA as our guide:
SAS Visual Analytics Viewer 7.4: the web-based HTML5 report viewer used for viewing SAS Visual Analytics reports in a web browser.
SAS Mobile BI for iOS (version 8.13): a native app for iOS devices including iPads and iPhones.
SAS Mobile BI for Android (version 8.13): a native app for Android devices including tablets, phablets, and mobile phones.
SAS Mobile BI for Windows (version 7.32): a native app for Windows 10 devices including tablets, laptops, and desktops.
To test SAS Visual Analytics Viewer, we used the Chrome web browser, version 56, running on Windows 7. We used JAWS version 18 for our screen reader testing.
To test SAS Mobile Bi for iOS, we used an iPad Air 2 running iOS version 10.2.1. We used the built-in VoiceOver screen reader for testing.
To test SAS Mobile BI on Android, we used a Nexus 9 tablet running stock Android 7.1. We used TalkBack version 5.1.0 for screen reader testing.
To test SAS Mobile BI for Windows, we used a Lenovo Yoga 3 laptop running Windows 10. We used JAWS 18 for screen reader testing.
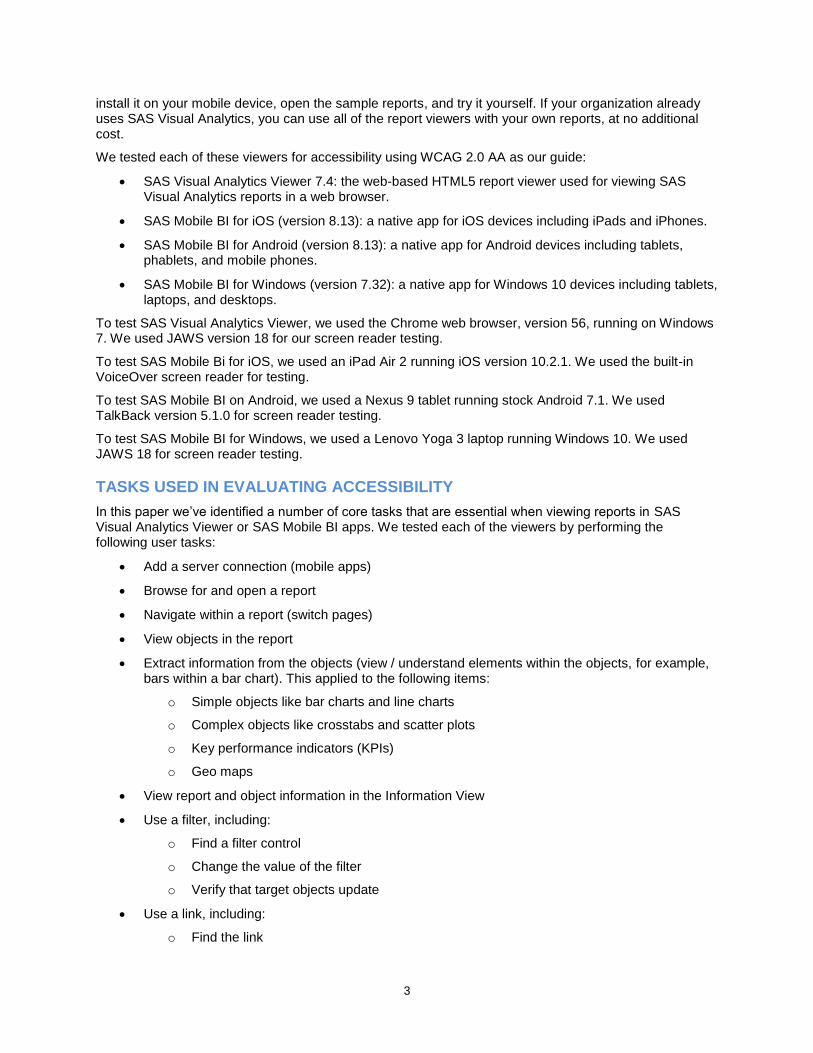
TASKS USED IN EVALUATING ACCESSIBILITY
In this paper we’ve identified a number of core tasks that are essential when viewing reports in SAS Visual Analytics Viewer or SAS Mobile BI apps. We tested each of the viewers by performing the following user tasks:
Add a server connection (mobile apps)
Browse for and open a report
Navigate within a report (switch pages)
View objects in the report
Extract information from the objects (view / understand elements within the objects, for example, bars within a bar chart). This applied to the following items:
o Simple objects like bar charts and line charts
o Complex objects like crosstabs and scatter plots
o Key performance indicators (KPIs)
o Geo maps
View report and object information in the Information View
Use a filter, including:
o Find a filter control
o Change the value of the filter
o Verify that target objects update
Use a link, including:
o Find the link
4
o Follow (activate) the link
o Return to the original location
Export data shown in a report object to an Excel spreadsheet (SAS Visual Analytics Viewer only)
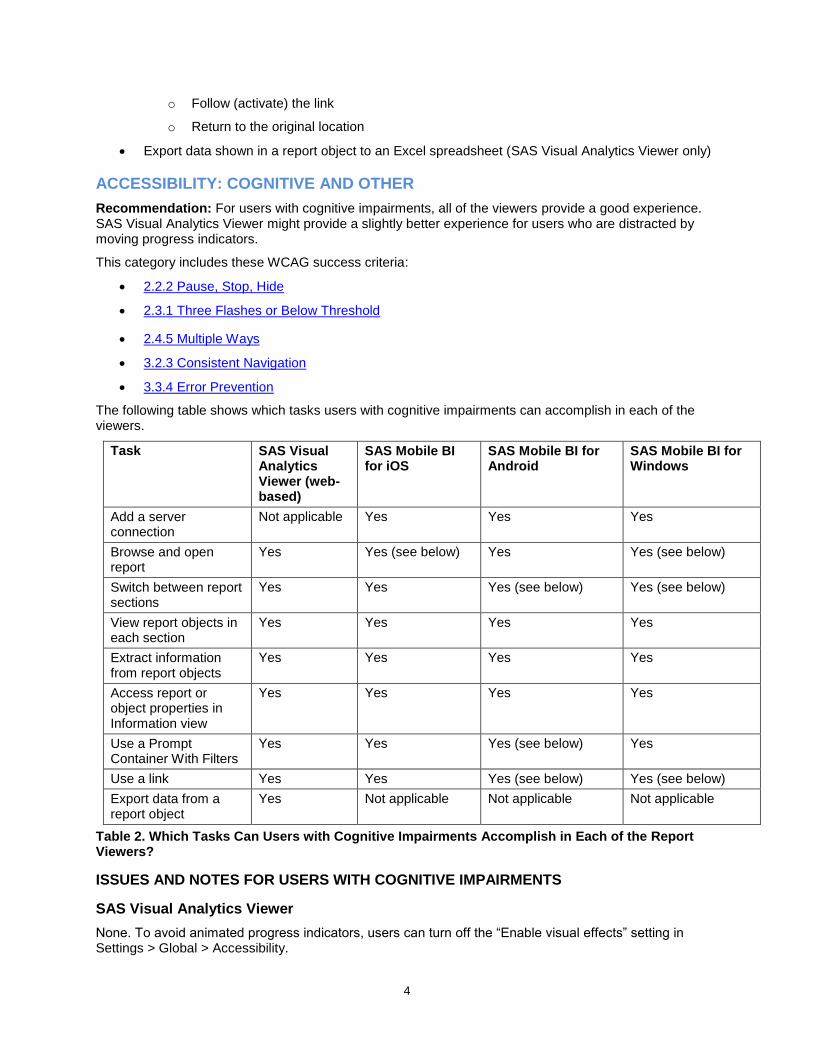
ACCESSIBILITY: COGNITIVE AND OTHER
Recommendation: For users with cognitive impairments, all of the viewers provide a good experience. SAS Visual Analytics Viewer might provide a slightly better experience for users who are distracted by moving progress indicators.
This category includes these WCAG success criteria:
2.2.2 Pause, Stop, Hide
2.3.1 Three Flashes or Below Threshold
2.4.5 Multiple Ways
3.2.3 Consistent Navigation
3.3.4 Error Prevention
The following table shows which tasks users with cognitive impairments can accomplish in each of the viewers.
Task SAS Visual Analytics Viewer (web-based)
SAS Mobile BI for iOS
SAS Mobile BI for Android
SAS Mobile BI for Windows
Add a server connection
Not applicable Yes Yes Yes
Browse and open report
Yes Yes (see below) Yes Yes (see below)
Switch between report sections
Yes Yes Yes (see below) Yes (see below)
View report objects in each section
Yes Yes Yes Yes
Extract information from report objects
Yes Yes Yes Yes
Access report or object properties in Information view
Yes Yes Yes Yes
Use a Prompt Container With Filters
Yes Yes Yes (see below) Yes
Use a link Yes Yes Yes (see below) Yes (see below)
Export data from a report object
Yes Not applicable Not applicable Not applicable
Table 2. Which Tasks Can Users with Cognitive Impairments Accomplish in Each of the Report Viewers?
ISSUES AND NOTES FOR USERS WITH COGNITIVE IMPAIRMENTS
SAS Visual Analytics Viewer
None. To avoid animated progress indicators, users can turn off the “Enable visual effects” setting in Settings > Global > Accessibility.

5
SAS Mobile BI for iOS
In Subscription view, while subscribing to a report, animated spinning progress indicators appear. These might be distracting.
SAS Mobile BI for Android
When subscribing to a report, an animated progress indicator appears and constantly moves. This happens both in the subscribe window and on the home screen. There is no way for users to stop this animation, which might be distracting.
Within reports, spinning animations appear over objects while their content loads or when it updates. This can occur when initially opening a report, switching sections within a report, changing the value of a filter, or following a link. There is no way for users to disable or stop these animations, which might be distracting.
SAS Mobile BI for Windows
When subscribing to a report, if the user returns to the home screen, an animated progress indicator appears and constantly moves. There is no way for users to stop this animation, which might be distracting.
When navigating from folder to folder, animated spinners indicate an operation is in progress as the folder contents load. There is no way for users to stop these animations, which might be distracting.
Within reports, spinning animations appear over objects while their content loads. This can occur when initially opening a report, switching sections within a report, or following a link. There is no way for users to disable or stop these animations.
ACCESSIBILITY: MOBILITY
Recommendation: For users with mobility (motor) impairments, SAS Visual Analytics Viewer, the web-based viewer, provides the best experience. Keyboard-only use is not yet fully supported by SAS Mobile BI for Android and Windows. The iOS operating system does not provide support for keyboard-only usage, without also enabling either VoiceOver or Switch Control, which alter the way the operating system responds to keyboard input.
This category includes these WCAG success criteria:
2.1.1 Keyboard
2.1.2 No Keyboard Trap
2.2.1 Timing Adjustable
2.4.1 Bypass blocks
2.4.3 Focus order2.4.7 Focus Visible
3.2.1 On Focus
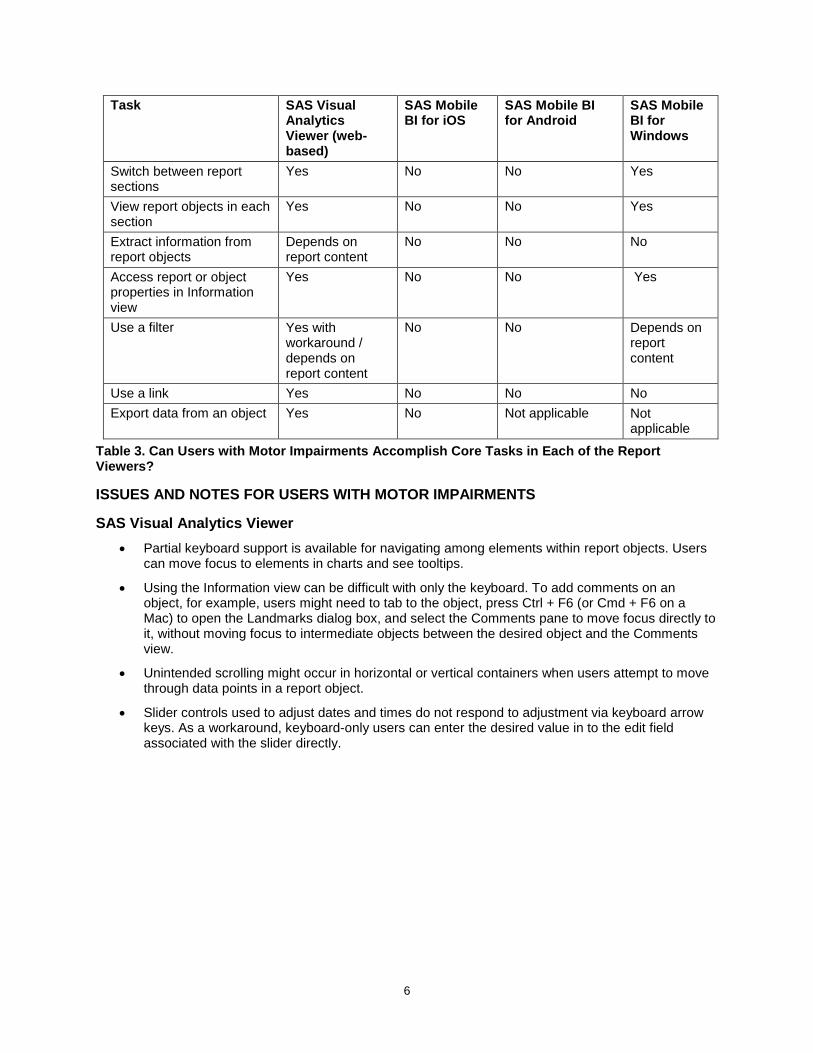
The following table shows which tasks keyboard-only users can accomplish in each of the viewers.
Task SAS Visual Analytics Viewer (web-based)
SAS Mobile BI for iOS
SAS Mobile BI for Android
SAS Mobile BI for Windows
Add a server connection Not applicable No No Yes
Browse and open report Yes No No Yes
6
Task SAS Visual Analytics Viewer (web-based)
SAS Mobile BI for iOS
SAS Mobile BI for Android
SAS Mobile BI for Windows
Switch between report sections
Yes No No Yes
View report objects in each section
Yes No No Yes
Extract information from report objects
Depends on report content
No No No
Access report or object properties in Information view
Yes No No Yes
Use a filter Yes with workaround / depends on report content
No No Depends on report content
Use a link Yes No No No
Export data from an object Yes No Not applicable Not applicable
Table 3. Can Users with Motor Impairments Accomplish Core Tasks in Each of the Report Viewers?
ISSUES AND NOTES FOR USERS WITH MOTOR IMPAIRMENTS
SAS Visual Analytics Viewer
Partial keyboard support is available for navigating among elements within report objects. Users can move focus to elements in charts and see tooltips.
Using the Information view can be difficult with only the keyboard. To add comments on an object, for example, users might need to tab to the object, press Ctrl + F6 (or Cmd + F6 on a Mac) to open the Landmarks dialog box, and select the Comments pane to move focus directly to it, without moving focus to intermediate objects between the desired object and the Comments view.
Unintended scrolling might occur in horizontal or vertical containers when users attempt to move through data points in a report object.
Slider controls used to adjust dates and times do not respond to adjustment via keyboard arrow keys. As a workaround, keyboard-only users can enter the desired value in to the edit field associated with the slider directly.
7
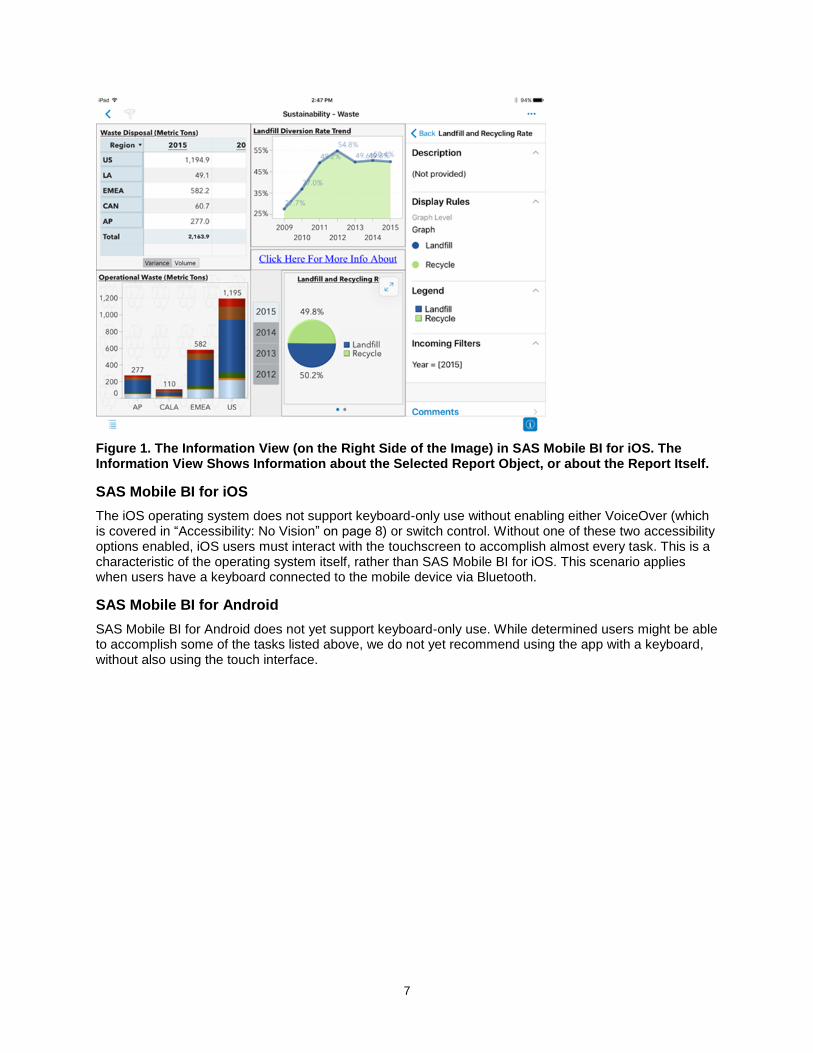
Figure 1. The Information View (on the Right Side of the Image) in SAS Mobile BI for iOS. The Information View Shows Information about the Selected Report Object, or about the Report Itself.
SAS Mobile BI for iOS
The iOS operating system does not support keyboard-only use without enabling either VoiceOver (which is covered in “Accessibility: No Vision” on page 8) or switch control. Without one of these two accessibility options enabled, iOS users must interact with the touchscreen to accomplish almost every task. This is a characteristic of the operating system itself, rather than SAS Mobile BI for iOS. This scenario applies when users have a keyboard connected to the mobile device via Bluetooth.
SAS Mobile BI for Android
SAS Mobile BI for Android does not yet support keyboard-only use. While determined users might be able to accomplish some of the tasks listed above, we do not yet recommend using the app with a keyboard, without also using the touch interface.
8
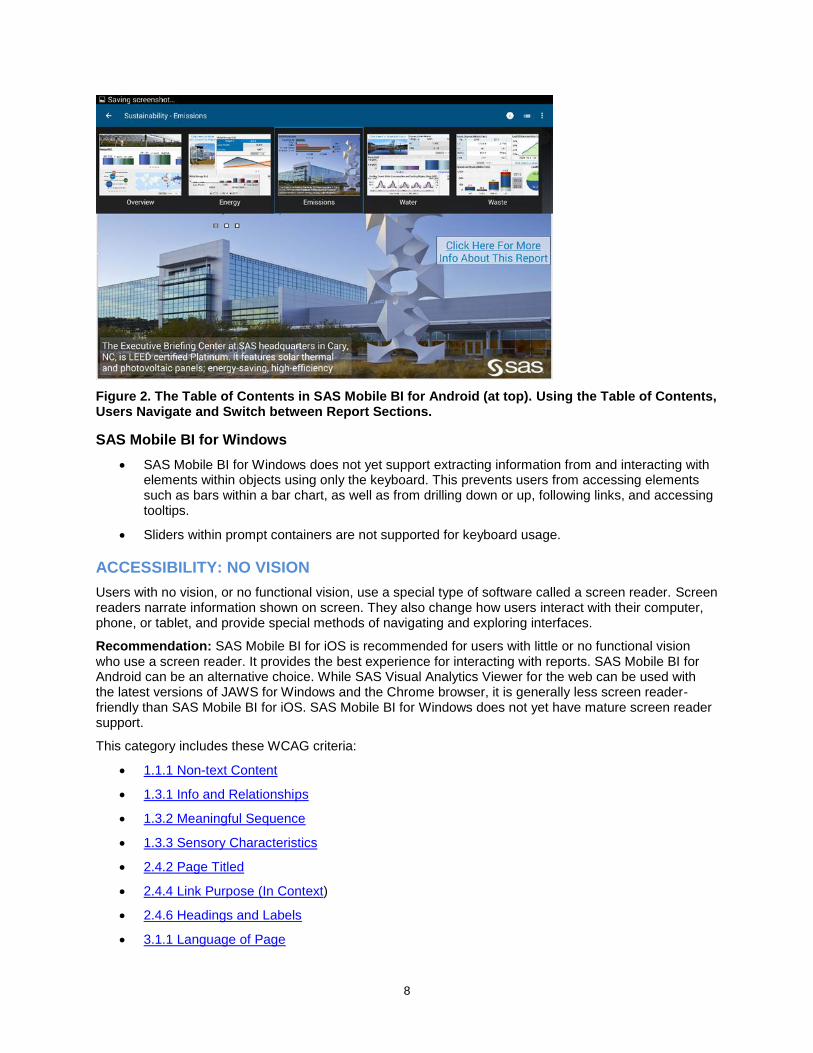
Figure 2. The Table of Contents in SAS Mobile BI for Android (at top). Using the Table of Contents, Users Navigate and Switch between Report Sections.
SAS Mobile BI for Windows
SAS Mobile BI for Windows does not yet support extracting information from and interacting with elements within objects using only the keyboard. This prevents users from accessing elements such as bars within a bar chart, as well as from drilling down or up, following links, and accessing tooltips.
Sliders within prompt containers are not supported for keyboard usage.
ACCESSIBILITY: NO VISION
Users with no vision, or no functional vision, use a special type of software called a screen reader. Screen readers narrate information shown on screen. They also change how users interact with their computer, phone, or tablet, and provide special methods of navigating and exploring interfaces.
Recommendation: SAS Mobile BI for iOS is recommended for users with little or no functional vision who use a screen reader. It provides the best experience for interacting with reports. SAS Mobile BI for Android can be an alternative choice. While SAS Visual Analytics Viewer for the web can be used with the latest versions of JAWS for Windows and the Chrome browser, it is generally less screen reader-friendly than SAS Mobile BI for iOS. SAS Mobile BI for Windows does not yet have mature screen reader support.
This category includes these WCAG criteria:
1.1.1 Non-text Content
1.3.1 Info and Relationships
1.3.2 Meaningful Sequence
1.3.3 Sensory Characteristics
2.4.2 Page Titled
2.4.4 Link Purpose (In Context)
2.4.6 Headings and Labels
3.1.1 Language of Page

9
3.1.2 Language of Parts
3.2.2 On Input
3.2.4 Consistent Identification
3.3.1 Error Identification
3.3.2 Labels and Instructions
3.3.3 Error Suggestion
4.1.1 Parsing
4.1.2 Name, Role, Value
The following table shows which tasks screen reader users can accomplish in each of the viewers.
Task SAS Visual Analytics Viewer (web-based)
SAS Mobile BI for iOS
SAS Mobile BI for Android
SAS Mobile BI for Windows
Add a server connection Not applicable Yes with workaround
No No
Browse and open report Yes with workaround
Yes with workaround
No No
Switch between report sections
Yes with workaround
Yes No No
View report objects in each section
Yes Yes No No
Extract information from report objects
Yes with workaround / depends on report content
Yes with workaround / depends on report content
No No
Access report or object properties in Information view
No Yes No No
Use a filter Yes with workaround
Yes with workaround
No No
Use a link Yes with workaround
Yes with workaround / depends on report content
No No
Export data from an object Yes with workaround
Not applicable Not applicable Not applicable
Table 4. Which Tasks Can Users with No Functional Vision (Screen Reader Users) Accomplish in Each of the Report Viewers?
ISSUES AND NOTES FOR USERS WITH NO FUNCTIONAL VISION
SAS Visual Analytics Viewer
Here are some key exceptions to accessibility for no vision users that apply to SAS Visual Analytics Viewer:
The lang= attribute is missing on logon and logoff pages. This might cause screen readers to announce the contents of these pages incorrectly if a non-English locale, operating system, or screen reader is used.

10
The recent reports list on the landing page is not screen reader-accessible. Screen reader users can browse for reports, though the structure of the browse dialog box might be somewhat confusing.
JAWS announces incorrect hints on how to interact with section tabs, and to switch sections in a report. With the virtual PC cursor off, users should press the arrow keys to move focus from tab to tab and press the spacebar to select a tab and switch to that section.
Screen reader users cannot yet access elements within report objects in SAS Visual Analytics Viewer itself. While this paper was being written, SAS was in the process of adding basic support for screen reader users to access report objects. SAS plans to include this support in future releases. In addition, while this paper was being written, SAS released the SAS Graphics Accelerator – a major step forward in making charts and graphs accessible. This release included a technical preview of integration between SAS Visual Analytics Viewer and SAS Graphics Accelerator. Users can now explore simple SAS Visual Analytics charts and graphs using sound. See the Looking Forward section later in this paper for more information.
Users cannot perceive relationships between elements within report objects via a screen reader. For example, screen reader users will not be able to distinguish a bar in one group from a bar in another group within a bar chart.
Selecting an object and reading its properties (in the Information view) with a screen reader, though not impossible, is difficult. JAWS users can tab to the Information button (after all report objects in the tab order), activate it, and then shift-tab back to the desired report object to move focus to it, which will display its properties. Then, using the Virtual PC cursor, JAWS users can move forward until they come to the properties of the selected object. This might be difficult enough that many screen reader users will not be able to follow these steps.
Names, labels, or instructions for some filter controls might be incorrect. For example, JAWS gives incorrect interaction hints for Button Bar controls. To interact with a Button Bar (announced as a segmented button by JAWS), with the Virtual PC cursor off, tab to the control. Use arrow keys to move focus from one segment to another. Use spacebar to select or deselect a segment.
Screen reader users might have difficulty using Slider controls. Sliders might not be labeled in a way that makes them easy to understand, and some sliders might not respond well to adjusting the value using arrow keys. Screen reader users might find it easier to enter values directly by using the edit fields included in sliders. In order to find these edit fields, it might be necessary to tab past them, and then shift-tab back to them. Tabbing past the slider and shift-tabbing back through it might help.
When filters values are changed such that objects update, screen reader users are typically informed via an announcement of the number of objects that were updated. This message will not occur if filters are within a prompt container, so screen reader users might not realize that objects have updated.
It might be difficult for screen reader users to understand the list of options present in a drop-down list component used as a filter, because screen readers might repeat option names multiple times.
The name of the Back button (in the report toolbar, above the report objects) doesn't clearly describe its purpose after you follow a section link. The button takes users back to the section they were viewing before they followed the link. The name of the button is just the report name, plus the name of the previously viewed section, which might be confusing.
Presentation is used to convey the structure of the breadcrumb that appears in report objects when you drill down into a hierarchy.
Screen reader users are not notified (that is, don't hear confirmation) of drill down or drill up actions.
11
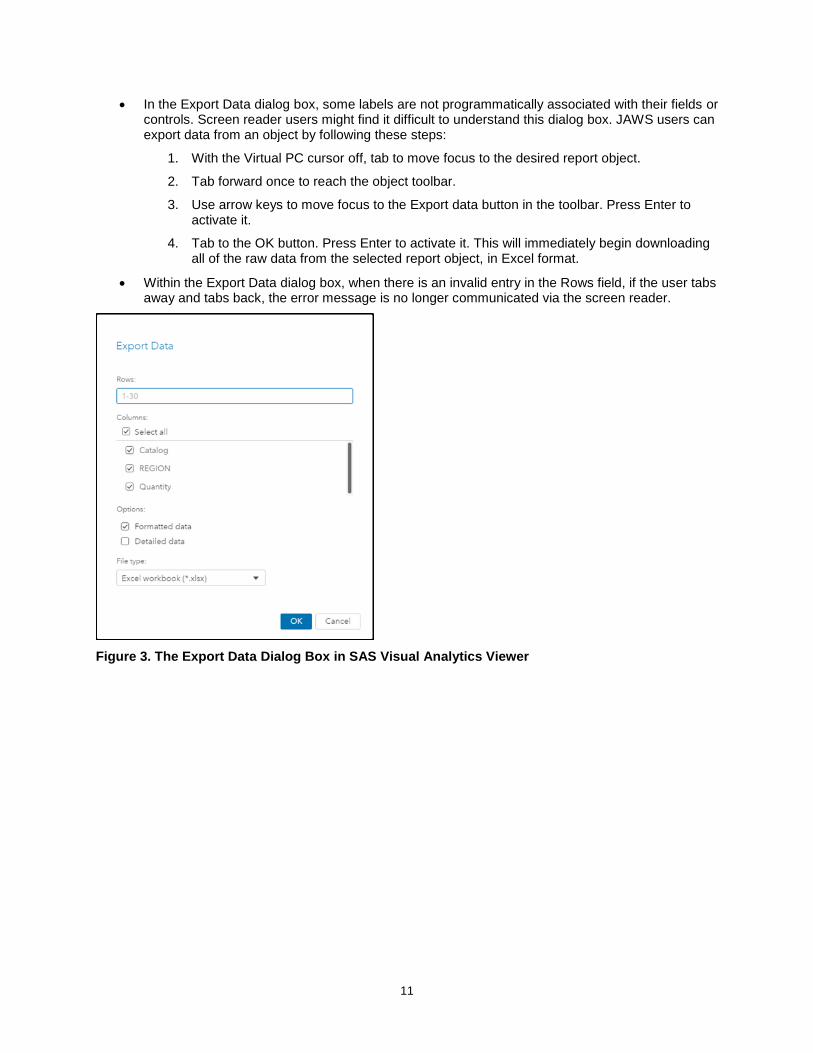
In the Export Data dialog box, some labels are not programmatically associated with their fields or controls. Screen reader users might find it difficult to understand this dialog box. JAWS users can export data from an object by following these steps:
1. With the Virtual PC cursor off, tab to move focus to the desired report object.
2. Tab forward once to reach the object toolbar.
3. Use arrow keys to move focus to the Export data button in the toolbar. Press Enter to activate it.
4. Tab to the OK button. Press Enter to activate it. This will immediately begin downloading all of the raw data from the selected report object, in Excel format.
Within the Export Data dialog box, when there is an invalid entry in the Rows field, if the user tabs away and tabs back, the error message is no longer communicated via the screen reader.
Figure 3. The Export Data Dialog Box in SAS Visual Analytics Viewer
12
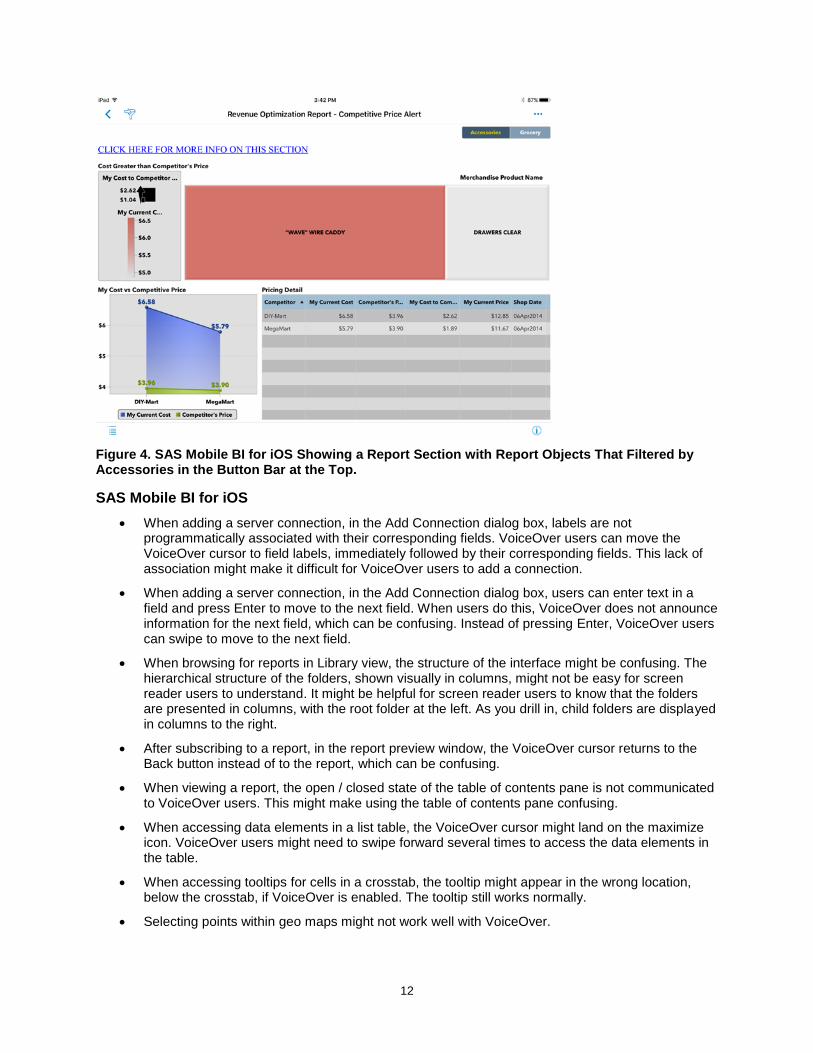
Figure 4. SAS Mobile BI for iOS Showing a Report Section with Report Objects That Filtered by Accessories in the Button Bar at the Top.
SAS Mobile BI for iOS
When adding a server connection, in the Add Connection dialog box, labels are not programmatically associated with their corresponding fields. VoiceOver users can move the VoiceOver cursor to field labels, immediately followed by their corresponding fields. This lack of association might make it difficult for VoiceOver users to add a connection.
When adding a server connection, in the Add Connection dialog box, users can enter text in a field and press Enter to move to the next field. When users do this, VoiceOver does not announce information for the next field, which can be confusing. Instead of pressing Enter, VoiceOver users can swipe to move to the next field.
When browsing for reports in Library view, the structure of the interface might be confusing. The hierarchical structure of the folders, shown visually in columns, might not be easy for screen reader users to understand. It might be helpful for screen reader users to know that the folders are presented in columns, with the root folder at the left. As you drill in, child folders are displayed in columns to the right.
After subscribing to a report, in the report preview window, the VoiceOver cursor returns to the Back button instead of to the report, which can be confusing.
When viewing a report, the open / closed state of the table of contents pane is not communicated to VoiceOver users. This might make using the table of contents pane confusing.
When accessing data elements in a list table, the VoiceOver cursor might land on the maximize icon. VoiceOver users might need to swipe forward several times to access the data elements in the table.
When accessing tooltips for cells in a crosstab, the tooltip might appear in the wrong location, below the crosstab, if VoiceOver is enabled. The tooltip still works normally.
Selecting points within geo maps might not work well with VoiceOver.

13
Legend information for charts is not screen-reader accessible. Users cannot inspect the legend in the right pane of the app when viewing a report. Some of the information present in the legend is available to screen reader users through announcements on data elements (bars, points, and so on) within report objects.
VoiceOver users might have trouble scrolling through options within a drop-down list, if the control contains many options. While users can move through options one-at-a-time using the single-finger flick left / right gesture, the three-finger swipe up / down gesture might not work to scroll a page at a time.
VoiceOver users might have difficulty adjusting sliders in increments that are granular enough to filter objects as desired. For example, when using a slider to filter another object by a date range, VoiceOver users might find it difficult to adjust the range by a single day. Swiping up or down to adjust the value might increment by larger amounts that desired. VoiceOver users might get better results using the double-tap-and-hold-then-drag gesture to adjust the value.
VoiceOver users cannot view tooltips on or follow links from image objects.
When VoiceOver users follow links that open Info windows, the VoiceOver cursor does not move to within the Info window. Users will need to swipe or touch within the Info window to move focus to it before interacting with its contents.
SAS Mobile BI for Android
SAS Mobile BI for Android does not yet support screen reader use. While determined users can likely accomplish many of the tasks listed above, we do not yet recommend using the app with TalkBack.
SAS Mobile BI for Windows
SAS Mobile BI for Windows does not yet support screen reader use. SAS plans to add support for screen reader use in future releases.
ACCESSIBILITY: LOW VISION
Users with low vision are a diverse group that includes people with color deficient vision (also known as color blindness), presbyopia (age-related loss of near vision), cataracts, and so on. (NEI)
This category includes these WCAG criteria:
1.4.1 Use of Color (only)
1.4.3 Minimum Contrast
1.4.4 Resize Text (Zooming)
1.4.5 Images of Text
1.4.6 Contrast Enhanced (High Contrast Theming)
For users with low vision, their specific needs determine the report viewer that is best suited for them.
Users who… Will have the best experience with…
Have color deficient vision (color blindness)
Any of the viewers. Some report object types only distinguish one element from another using color see note below).
Users can accomplish all of the tasks listed in this paper, depending on report design. If a report includes objects that only support distinguishing between elements via color, then users with color deficient vision might not be able to extract information from those objects.
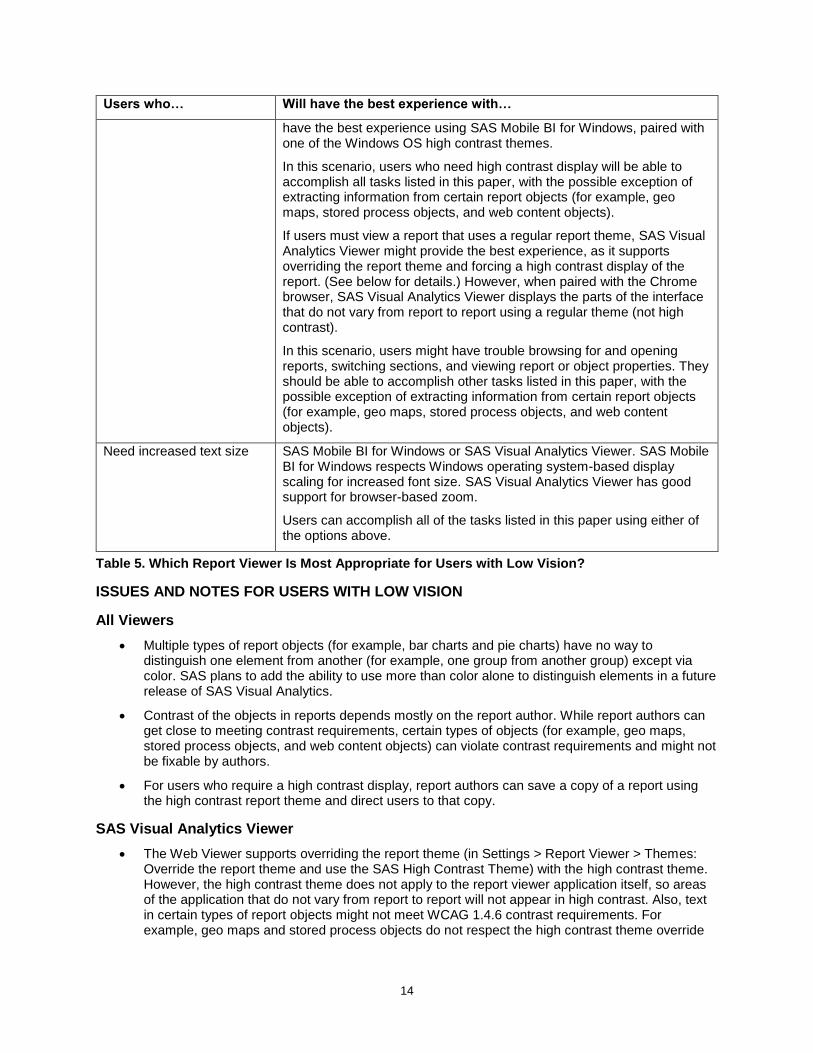
Need a high contrast display
SAS Mobile BI for Windows or SAS Visual Analytics Viewer. For the best experience, report authors should save a copy of their report using the high contrast report theme, and direct users to that copy. Users will then
14
Users who… Will have the best experience with…
have the best experience using SAS Mobile BI for Windows, paired with one of the Windows OS high contrast themes.
In this scenario, users who need high contrast display will be able to accomplish all tasks listed in this paper, with the possible exception of extracting information from certain report objects (for example, geo maps, stored process objects, and web content objects).
If users must view a report that uses a regular report theme, SAS Visual Analytics Viewer might provide the best experience, as it supports overriding the report theme and forcing a high contrast display of the report. (See below for details.) However, when paired with the Chrome browser, SAS Visual Analytics Viewer displays the parts of the interface that do not vary from report to report using a regular theme (not high contrast).
In this scenario, users might have trouble browsing for and opening reports, switching sections, and viewing report or object properties. They should be able to accomplish other tasks listed in this paper, with the possible exception of extracting information from certain report objects (for example, geo maps, stored process objects, and web content objects).
Need increased text size SAS Mobile BI for Windows or SAS Visual Analytics Viewer. SAS Mobile BI for Windows respects Windows operating system-based display scaling for increased font size. SAS Visual Analytics Viewer has good support for browser-based zoom.
Users can accomplish all of the tasks listed in this paper using either of the options above.
Table 5. Which Report Viewer Is Most Appropriate for Users with Low Vision?
ISSUES AND NOTES FOR USERS WITH LOW VISION
All Viewers
Multiple types of report objects (for example, bar charts and pie charts) have no way to distinguish one element from another (for example, one group from another group) except via color. SAS plans to add the ability to use more than color alone to distinguish elements in a future release of SAS Visual Analytics.
Contrast of the objects in reports depends mostly on the report author. While report authors can get close to meeting contrast requirements, certain types of objects (for example, geo maps, stored process objects, and web content objects) can violate contrast requirements and might not be fixable by authors.
For users who require a high contrast display, report authors can save a copy of a report using the high contrast report theme and direct users to that copy.
SAS Visual Analytics Viewer
The Web Viewer supports overriding the report theme (in Settings > Report Viewer > Themes: Override the report theme and use the SAS High Contrast Theme) with the high contrast theme. However, the high contrast theme does not apply to the report viewer application itself, so areas of the application that do not vary from report to report will not appear in high contrast. Also, text in certain types of report objects might not meet WCAG 1.4.6 contrast requirements. For example, geo maps and stored process objects do not respect the high contrast theme override

15
setting. This setting might be useful to users especially when the report author does not save a copy of the report using the high contrast report theme.
When both a) browser-based zoom is enabled and b) you are running the Web Viewer on a low-resolution display or with a browser window that sized to take up less than the full display, it might be difficult or impossible to browse for reports.
The Information view, on the right side of the window, might take up more space than desired when browser-based zoom is enabled.
When screen space is limited because a) browser-based zoom is enabled, b) the browser window is small, or c) a low-resolution display is used, graph legends might be hidden. When this happens, there is no way for users to view graph legends other than reducing zoom, making the window larger, or using a higher-resolution display.
SAS Mobile BI for iOS
Much of the text within the app (all small gray text) doesn't meet minimum contrast requirements.
There is no application-level high contrast theme – that is, there is no high contrast theme that applies to the parts of the application that are the same from one report to another. Report authors can publish their reports (or copies of their reports) using the high contrast report theme. There is no way for users of SAS Mobile BI to override the default report theme and force the report to be displayed in high contrast, if this is not set by the report author.
The iOS operating system itself does not include a high contrast theme. The app does support iOS operating system color adjustment settings.
There is no way to increase the size of all text shown within the app. iOS operating system text size settings only apply to some of the text shown within the app.
SAS Mobile BI for Android
Several places in the app have insufficient contrast.
Using the font size, display size, or both accessibility settings in the Android OS, users can increase text size to meet WCAG requirements.
The Android operating system lacks a high contrast theme. Most text in SAS Mobile BI (text within report objects) does not respect the Android OS high contrast text setting. The app lacks a high contrast app theme. So, there is effectively no support for high contrast.
Using the font size, display size, or both accessibility settings in the Android OS, users can increase text size to meet WCAG requirements. Note that geo maps do not respect these settings.
SAS Mobile BI for Windows
Using Windows display scaling (Display Settings > Advanced Display Settings > Advanced sizing of text and other items > Set a custom scaling level. Set to 200%), users can increase text size to meet WCAG requirements.
While the app itself respects operating system high contrast settings, report contents do not. To display report contents in high contrast, report authors can save a copy of their report using the high contrast report theme.
LOOKING FORWARD
As this paper was being written, SAS introduced a major step forward in making charts and graphs accessible to people with low or no vision -- the SAS® Graphics Accelerator. Using a technique called sonification, this browser extension lets users interactively explore data using sound, and opens the door for people without functional vision to understand data visualizations to an extent that was previously
16
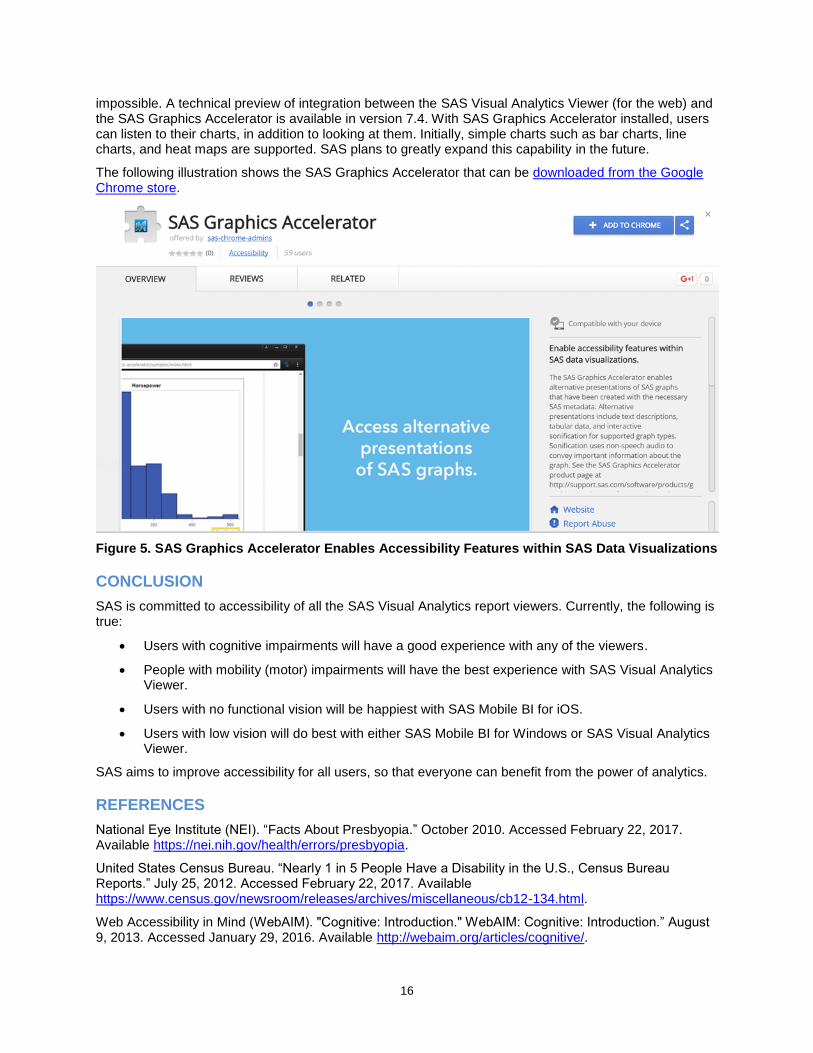
impossible. A technical preview of integration between the SAS Visual Analytics Viewer (for the web) and the SAS Graphics Accelerator is available in version 7.4. With SAS Graphics Accelerator installed, users can listen to their charts, in addition to looking at them. Initially, simple charts such as bar charts, line charts, and heat maps are supported. SAS plans to greatly expand this capability in the future.
The following illustration shows the SAS Graphics Accelerator that can be downloaded from the Google Chrome store.
Figure 5. SAS Graphics Accelerator Enables Accessibility Features within SAS Data Visualizations
CONCLUSION
SAS is committed to accessibility of all the SAS Visual Analytics report viewers. Currently, the following is true:
Users with cognitive impairments will have a good experience with any of the viewers.
People with mobility (motor) impairments will have the best experience with SAS Visual Analytics Viewer.
Users with no functional vision will be happiest with SAS Mobile BI for iOS.
Users with low vision will do best with either SAS Mobile BI for Windows or SAS Visual Analytics Viewer.
SAS aims to improve accessibility for all users, so that everyone can benefit from the power of analytics.
REFERENCES
National Eye Institute (NEI). “Facts About Presbyopia.” October 2010. Accessed February 22, 2017. Available https://nei.nih.gov/health/errors/presbyopia.
United States Census Bureau. “Nearly 1 in 5 People Have a Disability in the U.S., Census Bureau Reports.” July 25, 2012. Accessed February 22, 2017. Available https://www.census.gov/newsroom/releases/archives/miscellaneous/cb12-134.html.
Web Accessibility in Mind (WebAIM). "Cognitive: Introduction." WebAIM: Cognitive: Introduction.” August 9, 2013. Accessed January 29, 2016. Available http://webaim.org/articles/cognitive/.
17
World Wide Web Consortium. “Web Content Accessibility Guidelines 2.0.” December 11, 2008. Accessed February 22, 2017. Available http://www.w3.org/TR/200X/REC-WCAG20-20081211/. Latest version at http://www.w3.org/TR/WCAG20/.
ACKNOWLEDGMENTS
Thanks to Brice Smith at SAS for his help with screen reader testing.
RECOMMENDED READING AND VIEWING
Accessibility at SAS
Accessibility Features of SAS Mobile BI 7.33 for iPad and iPhone
SAS Mobile BI 8.1 for Android: Accessibility Features
SAS Mobile BI 7.31 for Windows 10: Accessibility Features
SAS Accessibility YouTube Playlist
SAS Mobile BI 7.31 for iOS: Quick Tour of VoiceOver Support on YouTube
SAS Graphics Accelerator: Getting Started on YouTube
Sookne, Jesse, Ed Summers, Julianna Langston, and Karen Mobley. 2016. “If You Build It, Will They Understand? Designing Reports for the General Public in SAS® Visual Analytics.” Proceedings of the SAS Global Forum 2016 Conference. Cary, NC: SAS Institute Inc. Available http://support.sas.com/resources/papers/proceedings16/SAS6321-2016.pdf.
CONTACT INFORMATION
Your comments and questions are valued and encouraged.
For questions about accessibility of SAS Visual Analytics Viewer, SAS Mobile BI, or other SAS products, contact [email protected].
For questions about the content or methods used in this paper, contact the authors at:
Jesse Sookne Accessibility and Applied Assistive Technology 100 SAS Campus Drive Cary, NC 27513 SAS Institute, Inc. [email protected] http://www.sas.com Kristin Barker Quality User-driven Enterprise Software Testing 100 SAS Campus Drive Cary, NC 27513 SAS Institute, Inc. [email protected] http://www.sas.com Joe Sumpter Quality User-driven Enterprise Software Testing 100 SAS Campus Drive Cary, NC 27513 SAS Institute, Inc. [email protected] http://www.sas.com
18
Lavanya Mandavilli Quality User-driven Enterprise Software Testing 100 SAS Campus Drive Cary, NC 27513 SAS Institute, Inc. [email protected] http://www.sas.com
SAS and all other SAS Institute Inc. product or service names are registered trademarks or trademarks of SAS Institute Inc. in the USA and other countries. ® indicates USA registration.
Other brand and product names are trademarks of their respective companies.