accessing data from the new american factfinder jerry wong information services specialist los...
TRANSCRIPT
Accessing Data from the
NEW American FactFinder
Jerry WongInformation Services Specialist
Los Angeles Regional OfficeU.S. Census Bureau
Agenda
• How Census Data is Used• 2010 Census• American Community Survey• Economic Indicators• QuickFacts• Interactive Map• Population Finder• Population Estimates• Economic Census & Surveys• Local Employment Dynamics• American FactFinder – Accessing 2010 Census & ACS Data (Demonstration)• Questions
2
• How many people live here?• How has the number of people changed?• How old or young are the people?• What race and ethnicity are they?• How well educated are the people?• What languages do they speak?• How many single parents?• How many households are low-income?
Why Census Data is Important
Helping Your Community Answer Questions Like…
• Grant Writing– Describe Community and Target Population– Helps Identify Problem/Need for Project– Critical for Measurable Objectives
• Make Informed Decisions– Policy– Program Planning & Evaluation– Funding Allocations
Why Census Data is Important
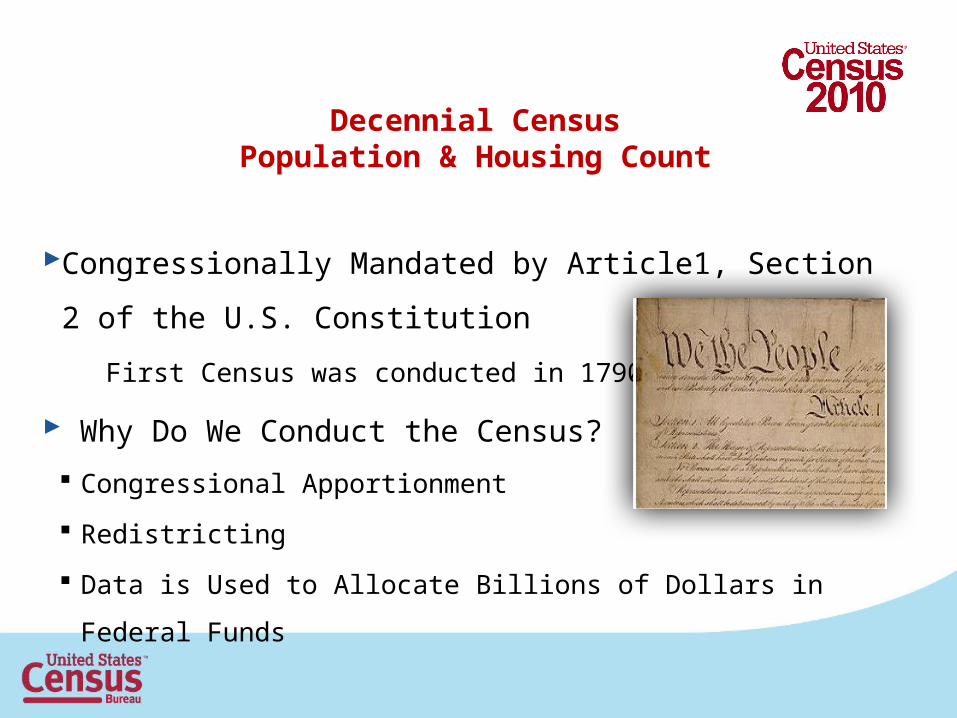
Congressionally Mandated by Article1, Section 2 of
the U.S. Constitution
First Census was conducted in 1790
Why Do We Conduct the Census?
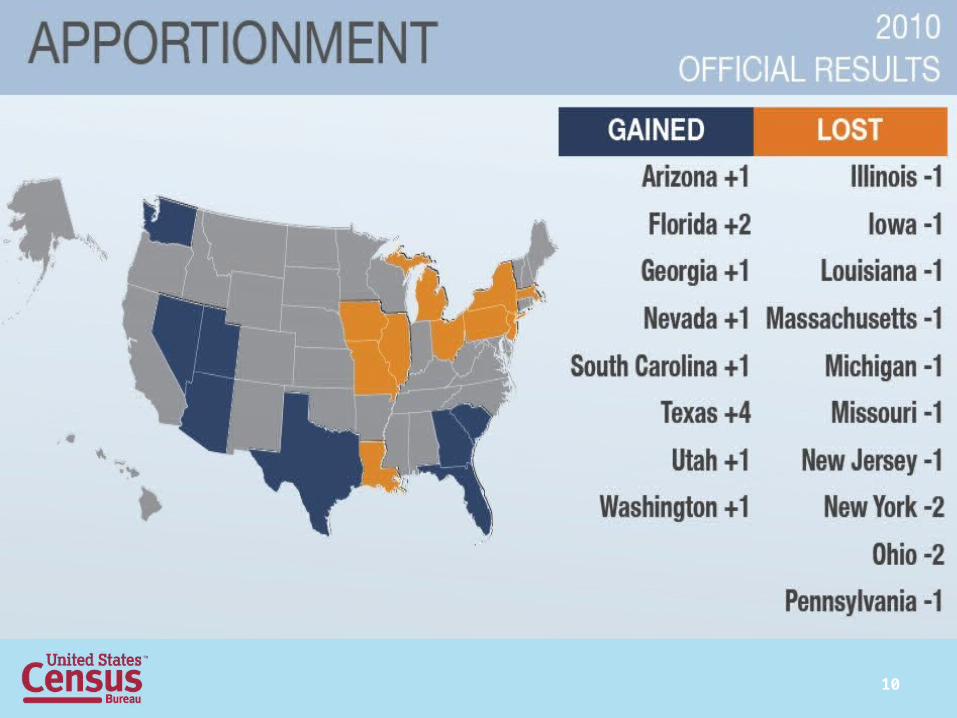
Congressional Apportionment
Redistricting
Data is Used to Allocate Billions of Dollars in Federal Funds
Decennial CensusPopulation & Housing Count
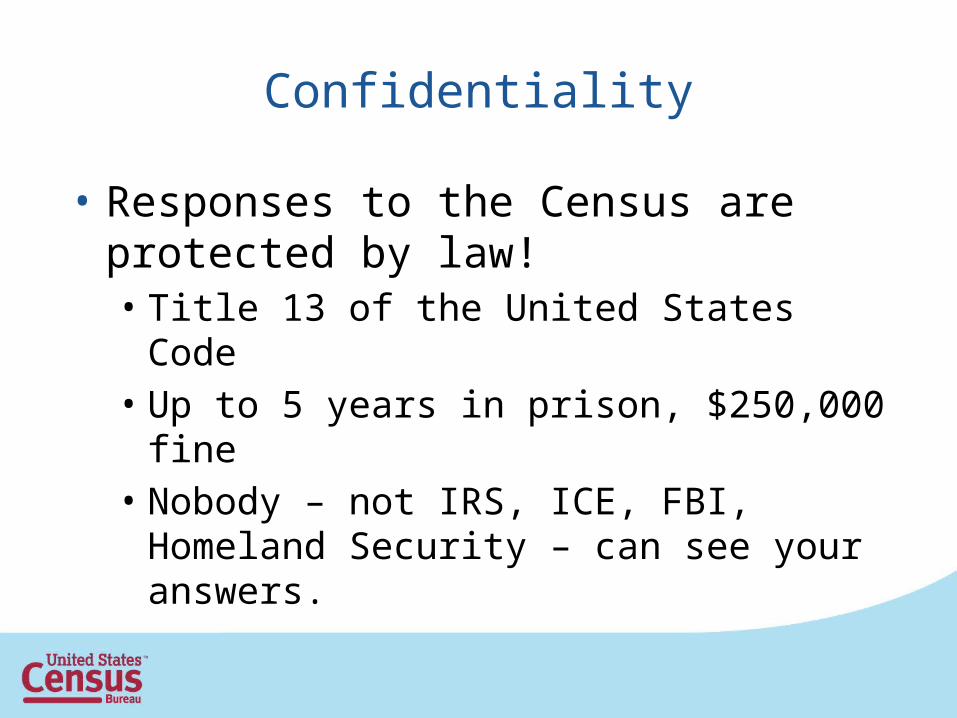
Confidentiality
• Responses to the Census are protected by law!• Title 13 of the United States Code• Up to 5 years in prison, $250,000 fine• Nobody – not IRS, ICE, FBI, Homeland
Security – can see your answers.
7
8
9
10
0.363
0.163
0.0190000000000001
0.00200000000000001
0.00200000000000001
0.047
0.00700000000000001
0.122
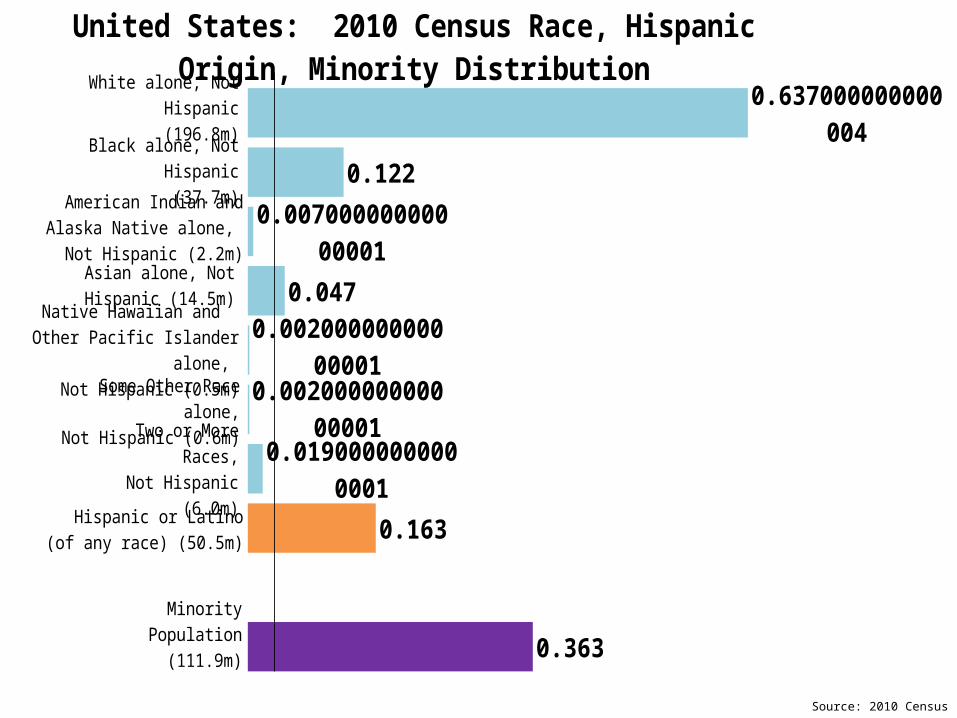
0.637000000000004White alone, Not Hispanic
(196.8m)
Black alone, Not Hispanic(37.7m)
American Indian and Alaska Na-tive alone, Not Hispanic (2.2m)
Native Hawaiian and Other Pacific Islander alone,
Not Hispanic (0.5m)
Asian alone, Not Hispanic (14.5m)
Some Other Race alone,Not Hispanic (0.6m)
Two or More Races,Not Hispanic (6.0m)
Hispanic or Latino(of any race) (50.5m)
Minority Popula-tion
(111.9m)
United States: 2010 Census Race, Hispanic Origin, Minority Distribu-tion
Source: 2010 Census
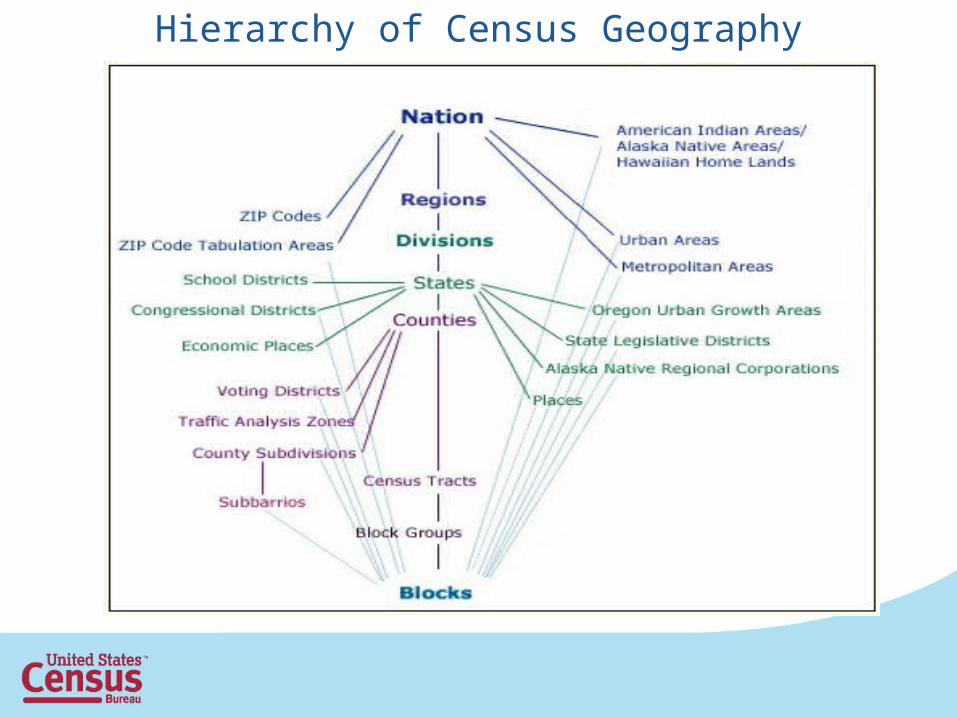
Hierarchy of Census Geography
Provide Comparison
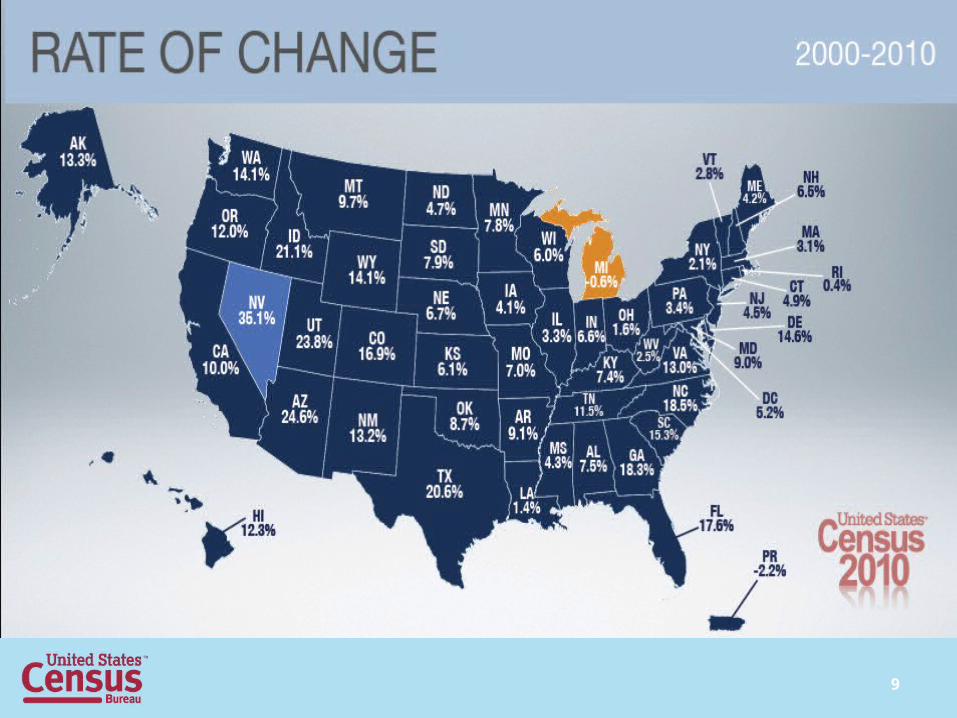
1. Over Time (2000, 2010)– Demonstrate emerging issues affecting your population– Beware of changes in census tract boundaries
2. Compare Subject Data to a Larger Group– City/Town to County or State– Census Tract to Other Tracts or to City or County
Census Data
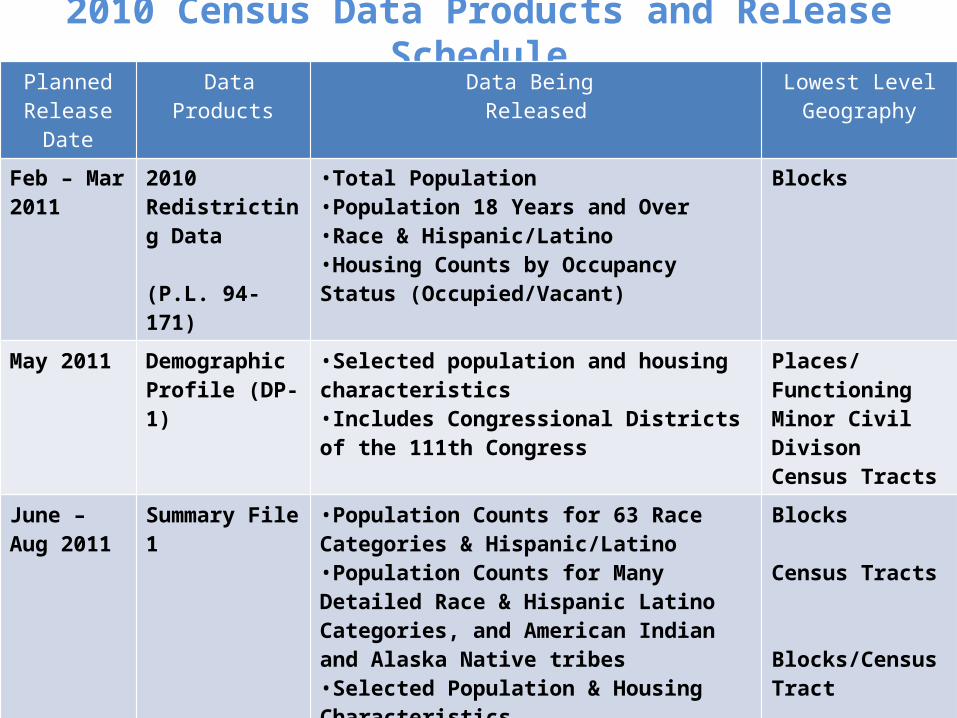
2010 Census Data Products and Release SchedulePlanned
Release Date Data Products Data Being
ReleasedLowest Level Geography
Feb – Mar 2011
2010 Redistricting Data (P.L. 94-171)
•Total Population •Population 18 Years and Over•Race & Hispanic/Latino•Housing Counts by Occupancy Status (Occupied/Vacant)
Blocks
May 2011 Demographic Profile (DP-1)
•Selected population and housing characteristics•Includes Congressional Districts of the 111th Congress
Places/Functioning Minor Civil Divison Census Tracts
June – Aug 2011
Summary File 1 •Population Counts for 63 Race Categories & Hispanic/Latino•Population Counts for Many Detailed Race & Hispanic Latino Categories, and American Indian and Alaska Native tribes•Selected Population & Housing Characteristics
Blocks
Census Tracts
Blocks/Census Tract
Dec 2011 – Apr 2012
Summary File 2 •Population & Housing Characteristics Iterated for Detailed
• Race• Hispanic/Latino• American Indian and Alaska Native Tribes
Census Tracts
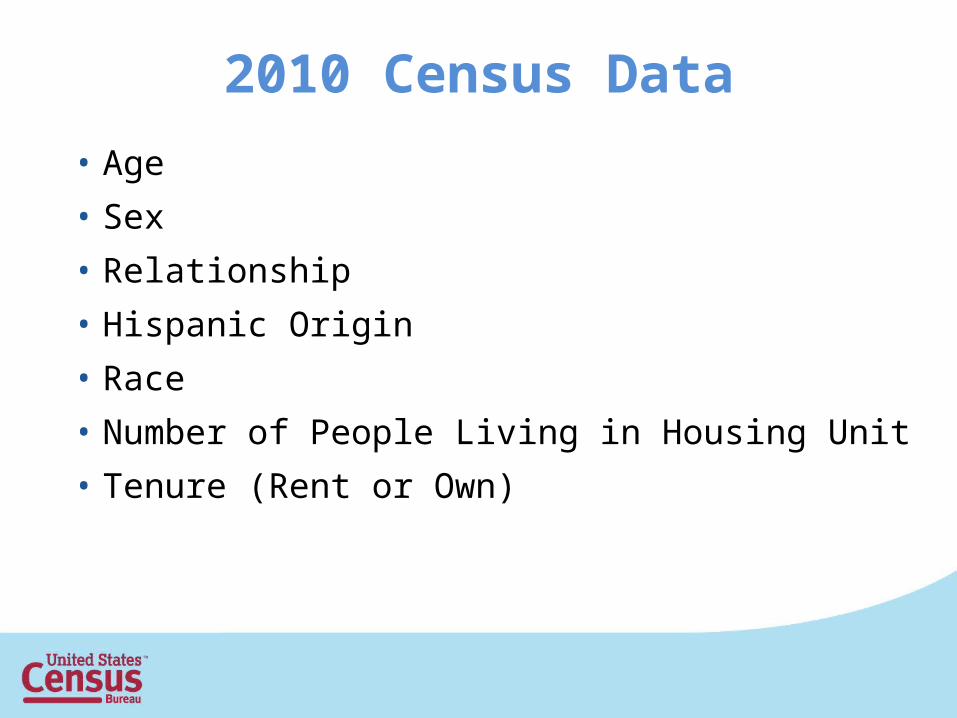
• Age• Sex• Relationship• Hispanic Origin• Race• Number of People Living in Housing Unit• Tenure (Rent or Own)
2010 Census Data
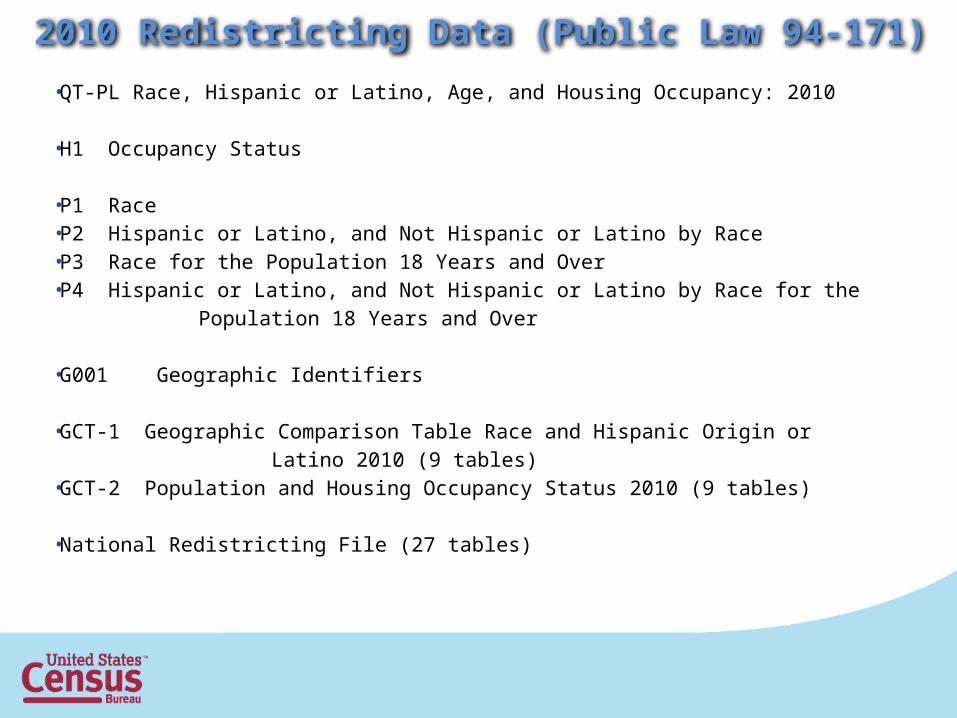
2010 Redistricting Data (Public Law 94-171)
• QT-PL Race, Hispanic or Latino, Age, and Housing Occupancy: 2010
• H1 Occupancy Status
• P1 Race• P2 Hispanic or Latino, and Not Hispanic or Latino by Race• P3 Race for the Population 18 Years and Over• P4 Hispanic or Latino, and Not Hispanic or Latino by Race for the
Population 18 Years and Over
• G001 Geographic Identifiers
• GCT-1 Geographic Comparison Table Race and Hispanic Origin or
Latino 2010 (9 tables)• GCT-2 Population and Housing Occupancy Status 2010 (9 tables)
• National Redistricting File (27 tables)
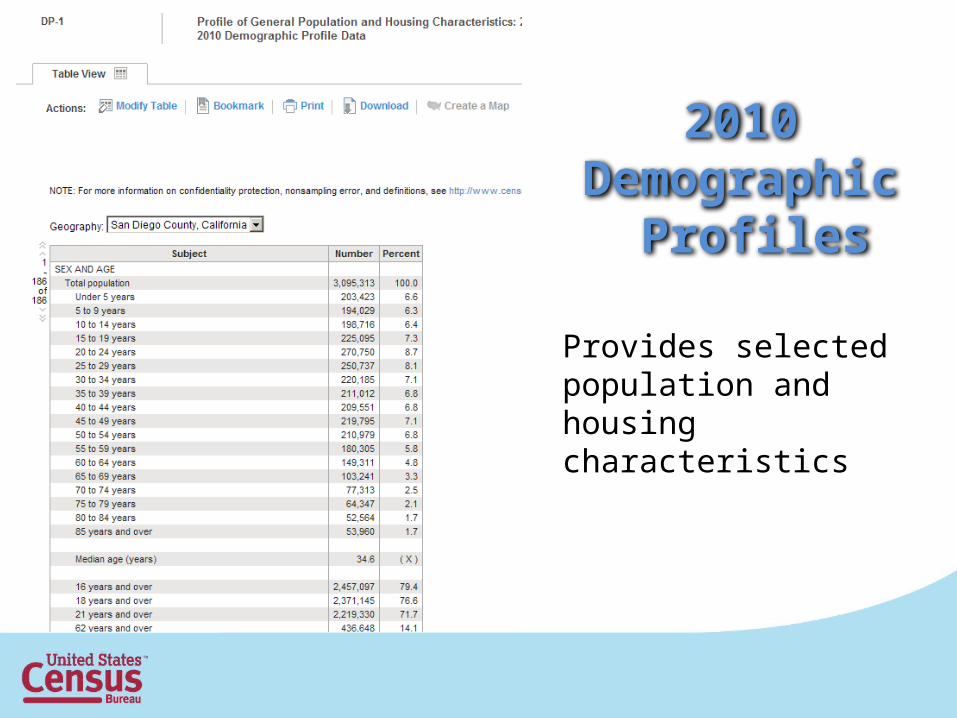
2010 Demographic
Profiles
Provides selected population and housing characteristics
2010 Summary File 1 (SF-1)
• More detail than the Demographic Profile
• Similar content as Census 2000 Summary File 1Cross tabulations of age, sex, households, families, relationship to householder, characteristics of owners and renters, detailed race and Hispanic or Latino origin groups and group quarters
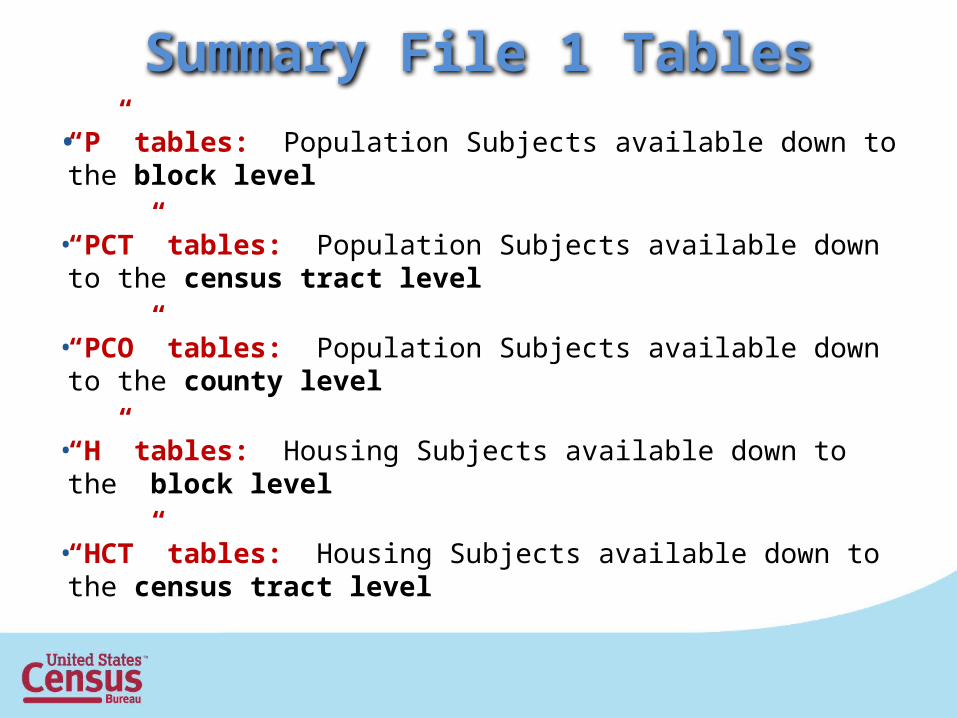
Summary File 1 Tables
• “P” tables: Population Subjects available down to the block level
• “PCT” tables: Population Subjects available down to the census tract level
• “PCO” tables: Population Subjects available down to the county level
• “H” tables: Housing Subjects available down to the block level
• “HCT” tables: Housing Subjects available down to the census tract level
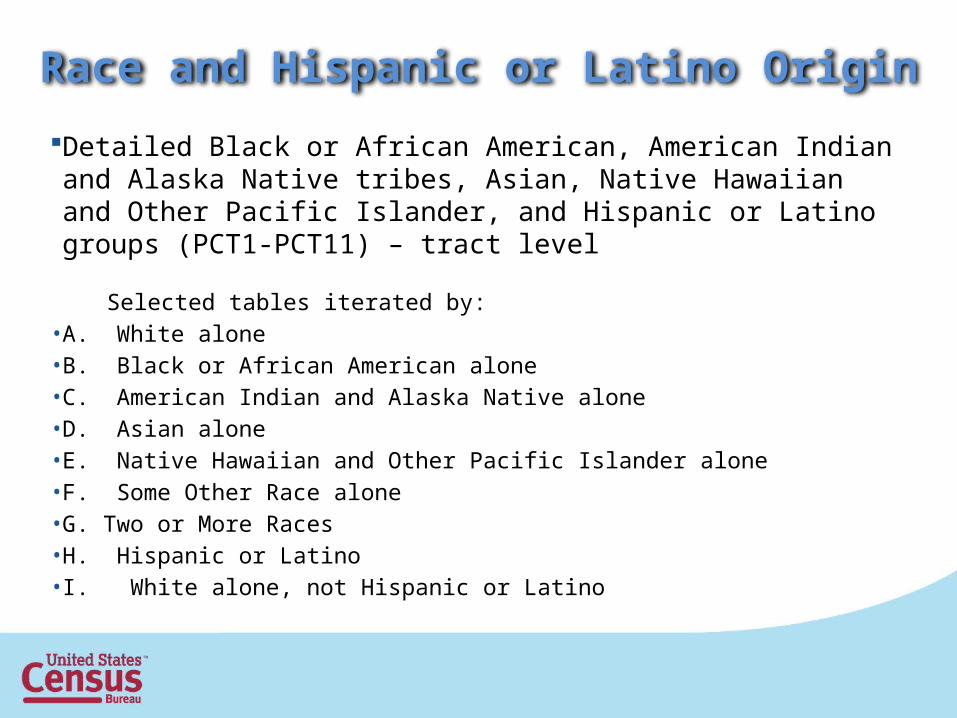
Race and Hispanic or Latino Origin
Detailed Black or African American, American Indian and Alaska Native tribes, Asian, Native Hawaiian and Other Pacific Islander, and Hispanic or Latino groups (PCT1-PCT11) – tract level
Selected tables iterated by: • A. White alone• B. Black or African American alone• C. American Indian and Alaska Native alone• D. Asian alone• E. Native Hawaiian and Other Pacific Islander alone• F. Some Other Race alone• G. Two or More Races• H. Hispanic or Latino• I. White alone, not Hispanic or Latino
• Population & Housing Characteristics Iterated for:• Detailed Race groups• Detailed Hispanic/Latino groups• American Indian and Alaska Native Tribes
2010 Summary File 2
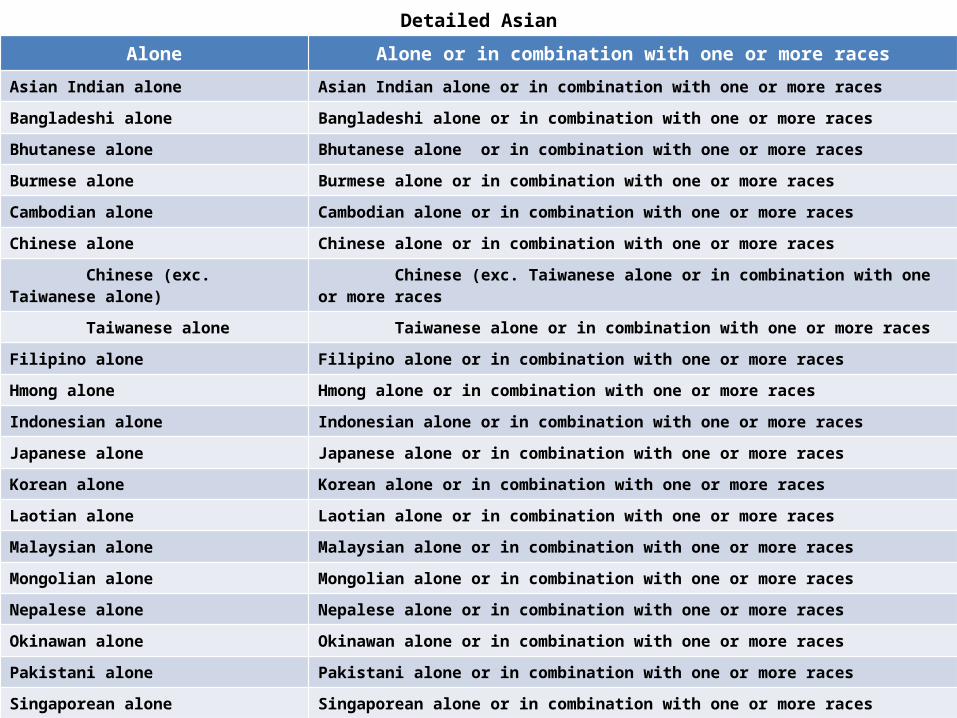
Detailed Asian Alone Alone or in combination with one or more races
Asian Indian alone Asian Indian alone or in combination with one or more races
Bangladeshi alone Bangladeshi alone or in combination with one or more races
Bhutanese alone Bhutanese alone or in combination with one or more races
Burmese alone Burmese alone or in combination with one or more races
Cambodian alone Cambodian alone or in combination with one or more races
Chinese alone Chinese alone or in combination with one or more races
Chinese (exc. Taiwanese alone) Chinese (exc. Taiwanese alone or in combination with one or more races
Taiwanese alone Taiwanese alone or in combination with one or more races
Filipino alone Filipino alone or in combination with one or more races
Hmong alone Hmong alone or in combination with one or more races
Indonesian alone Indonesian alone or in combination with one or more races
Japanese alone Japanese alone or in combination with one or more races
Korean alone Korean alone or in combination with one or more races
Laotian alone Laotian alone or in combination with one or more races
Malaysian alone Malaysian alone or in combination with one or more races
Mongolian alone Mongolian alone or in combination with one or more races
Nepalese alone Nepalese alone or in combination with one or more races
Okinawan alone Okinawan alone or in combination with one or more races
Pakistani alone Pakistani alone or in combination with one or more races
Singaporean alone Singaporean alone or in combination with one or more races
Sri Lankan alone Sri Lankan alone or in combination with one or more races
Thai alone Thai alone or in combination with one or more races
Vietnamese alone Vietnamese alone or in combination with one or more races
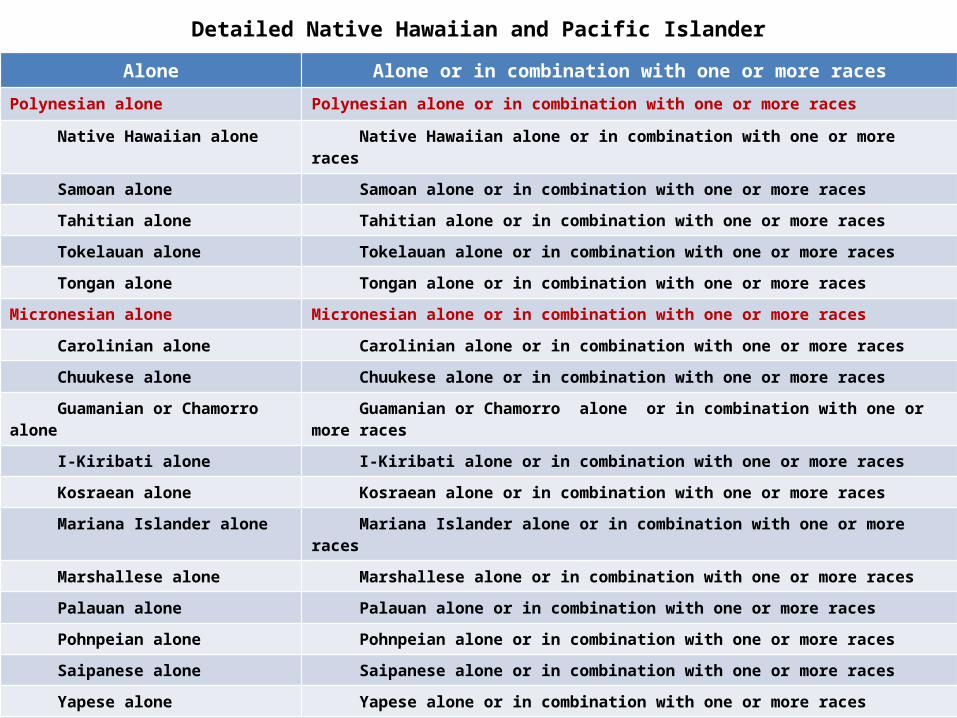
Detailed Native Hawaiian and Pacific Islander
Alone Alone or in combination with one or more races
Polynesian alone Polynesian alone or in combination with one or more races
Native Hawaiian alone Native Hawaiian alone or in combination with one or more races
Samoan alone Samoan alone or in combination with one or more races
Tahitian alone Tahitian alone or in combination with one or more races
Tokelauan alone Tokelauan alone or in combination with one or more races
Tongan alone Tongan alone or in combination with one or more races
Micronesian alone Micronesian alone or in combination with one or more races
Carolinian alone Carolinian alone or in combination with one or more races
Chuukese alone Chuukese alone or in combination with one or more races
Guamanian or Chamorro alone Guamanian or Chamorro alone or in combination with one or more races
I-Kiribati alone I-Kiribati alone or in combination with one or more races
Kosraean alone Kosraean alone or in combination with one or more races
Mariana Islander alone Mariana Islander alone or in combination with one or more races
Marshallese alone Marshallese alone or in combination with one or more races
Palauan alone Palauan alone or in combination with one or more races
Pohnpeian alone Pohnpeian alone or in combination with one or more races
Saipanese alone Saipanese alone or in combination with one or more races
Yapese alone Yapese alone or in combination with one or more races
Melanesian alone Melanesian alone or in combination with one or more races
Fijian alone Fijian alone or in combination with one or more races
Papua New Guinean alone Papua New Guinean alone or in combination with one or more races
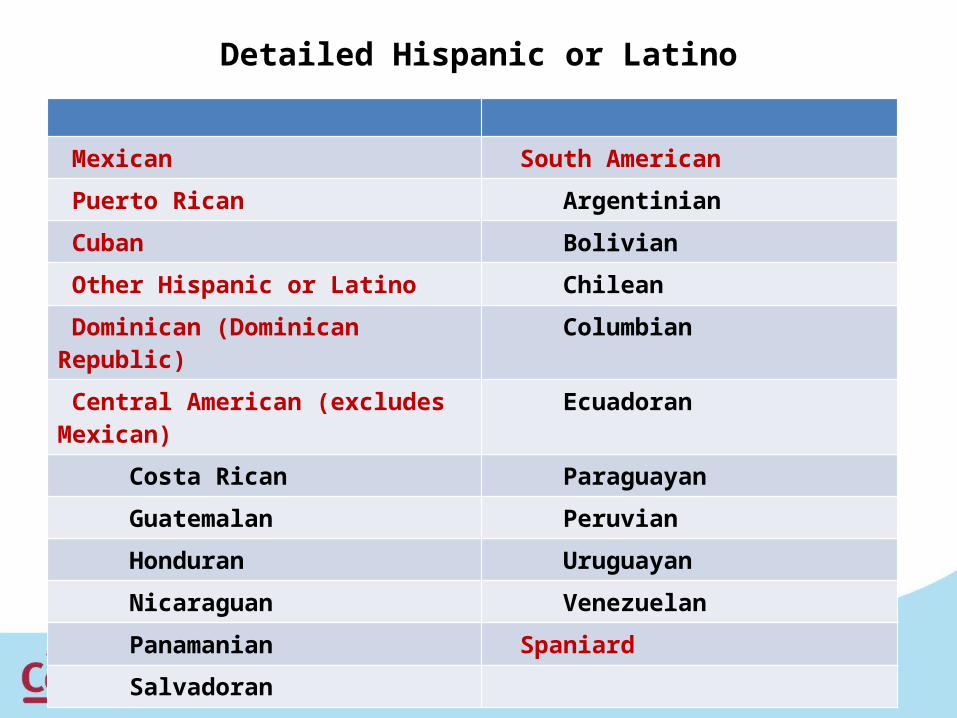
Detailed Hispanic or Latino
Mexican South American
Puerto Rican Argentinian
Cuban Bolivian
Other Hispanic or Latino Chilean
Dominican (Dominican Republic) Columbian
Central American (excludes Mexican) Ecuadoran
Costa Rican Paraguayan
Guatemalan Peruvian
Honduran Uruguayan
Nicaraguan Venezuelan
Panamanian Spaniard
Salvadoran
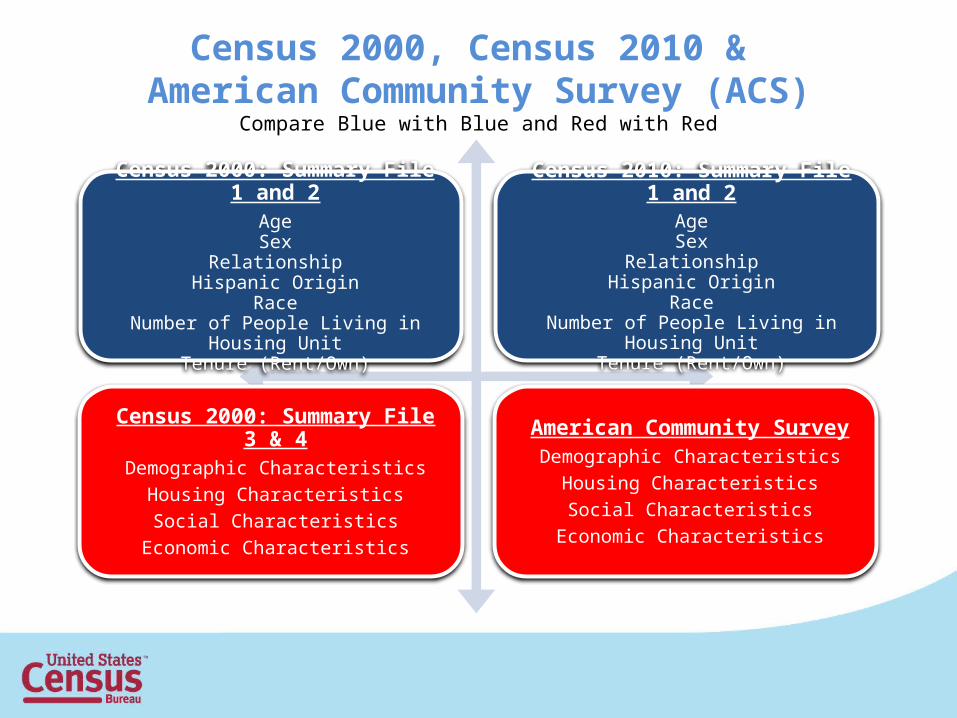
Census 2000: Summary File 1 and 2AgeSex
RelationshipHispanic Origin
RaceNumber of People Living in Housing Unit
Tenure (Rent/Own)
Census 2010: Summary File 1 and 2AgeSex
RelationshipHispanic Origin
RaceNumber of People Living in Housing Unit
Tenure (Rent/Own)
Census 2000: Summary File 3 & 4Demographic Characteristics
Housing CharacteristicsSocial Characteristics
Economic Characteristics
American Community SurveyDemographic Characteristics
Housing CharacteristicsSocial Characteristics
Economic Characteristics
Census 2000, Census 2010 & American Community Survey (ACS)
Compare Blue with Blue and Red with Red
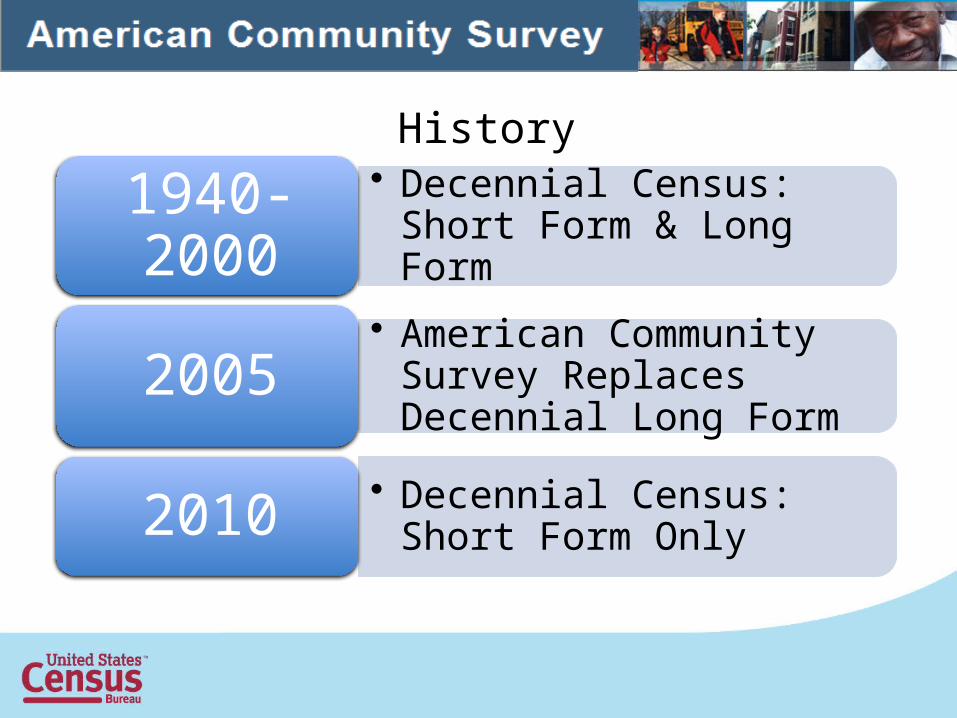
History
• Decennial Census: Short Form & Long Form1940-2000
• American Community Survey Replaces Decennial Long Form2005
• Decennial Census: Short Form Only2010
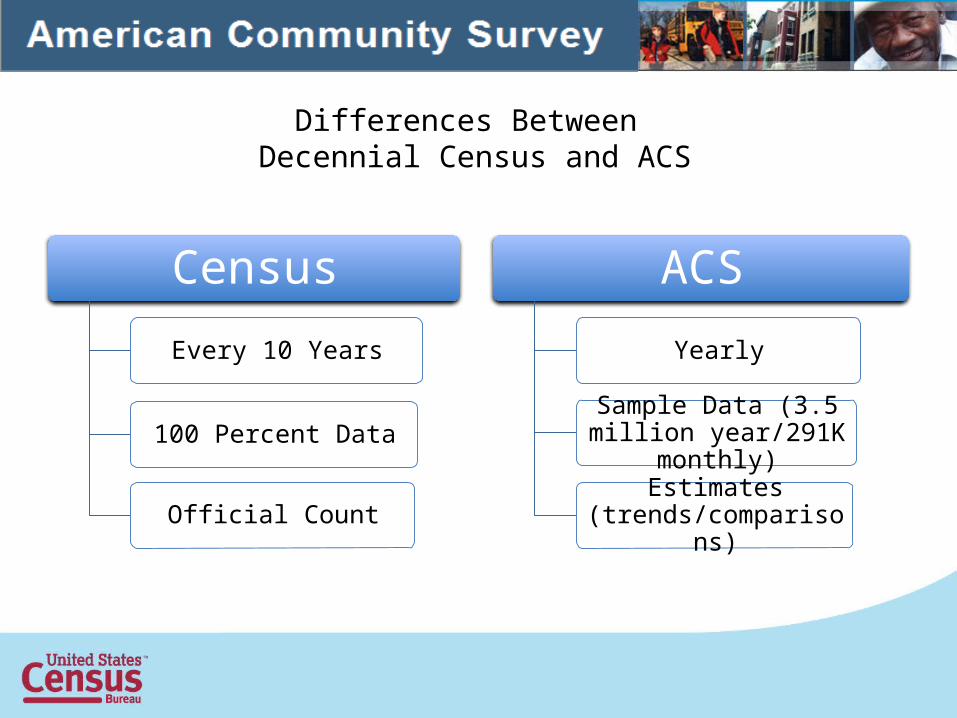
Differences Between Decennial Census and ACS
Census
Every 10 Years
100 Percent Data
Official Count
ACS
Yearly
Sample Data (3.5 million year/291K monthly)
Estimates (trends/comparisons)
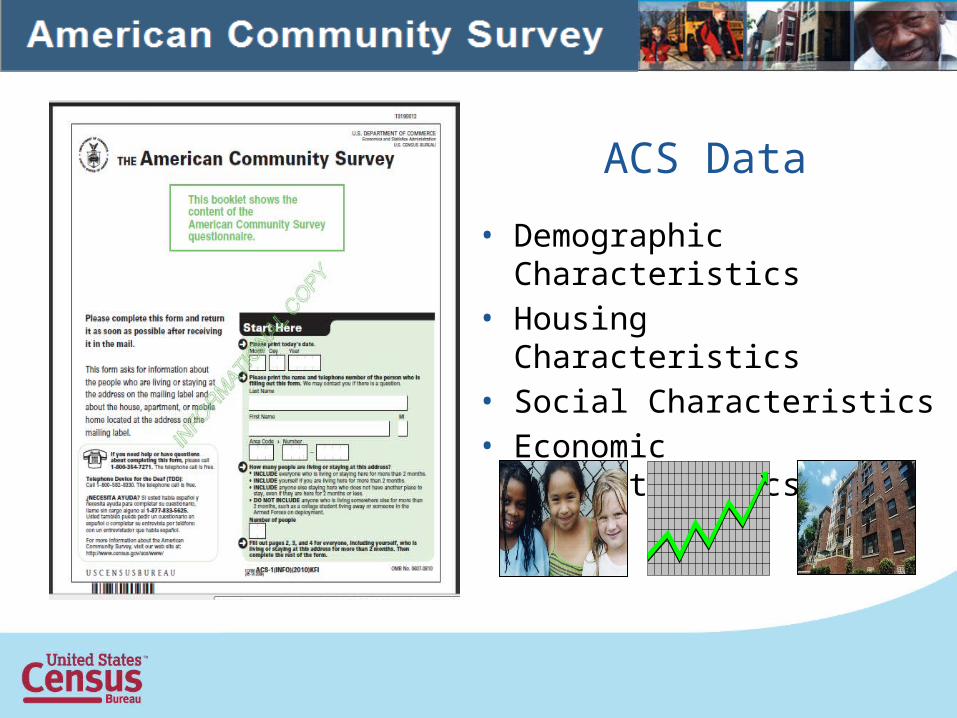
ACS Data
• Demographic Characteristics• Housing Characteristics• Social Characteristics• Economic Characteristics
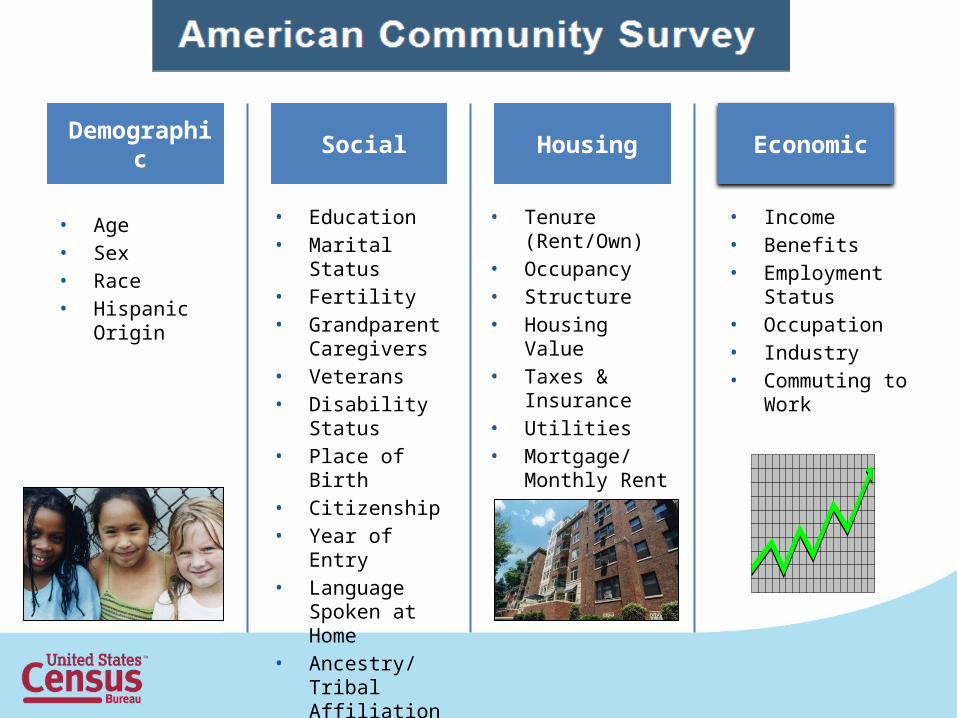
Demographic Housing
• Age• Sex• Race• Hispanic
Origin
• Tenure (Rent/Own)
• Occupancy• Structure• Housing Value• Taxes &
Insurance• Utilities• Mortgage/
Monthly Rent
• Income• Benefits• Employment
Status• Occupation• Industry• Commuting to
Work
EconomicSocial
• Education• Marital Status• Fertility• Grandparent
Caregivers• Veterans• Disability Status • Place of Birth• Citizenship• Year of Entry• Language
Spoken at Home
• Ancestry/Tribal Affiliation
30
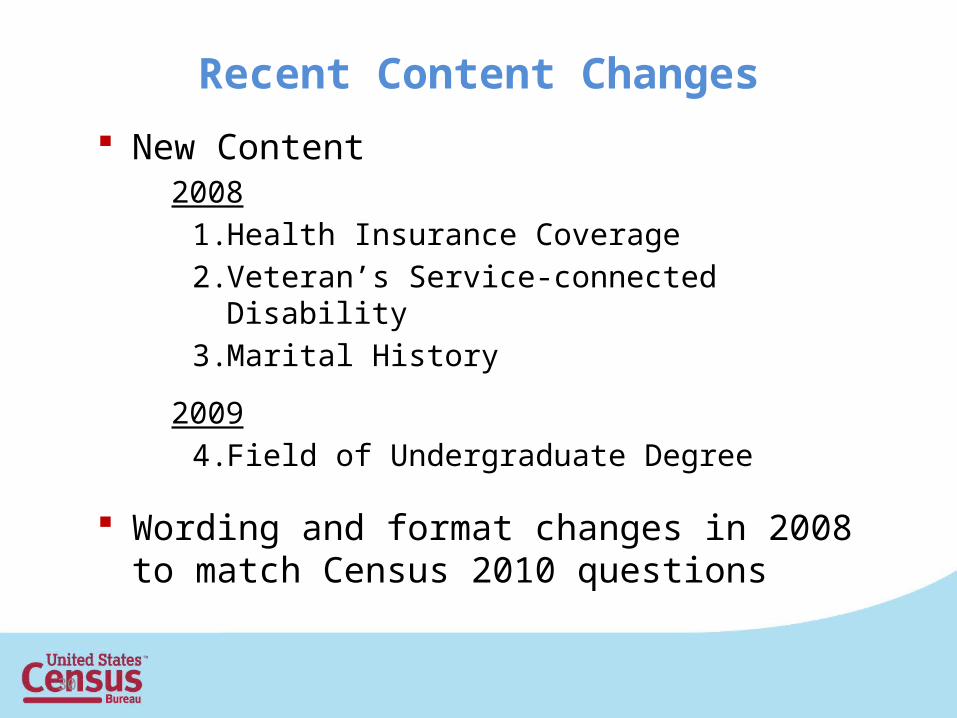
Recent Content Changes
New Content2008
1. Health Insurance Coverage
2. Veteran’s Service-connected Disability
3. Marital History
2009
4. Field of Undergraduate Degree
Wording and format changes in 2008 to match Census 2010 questions
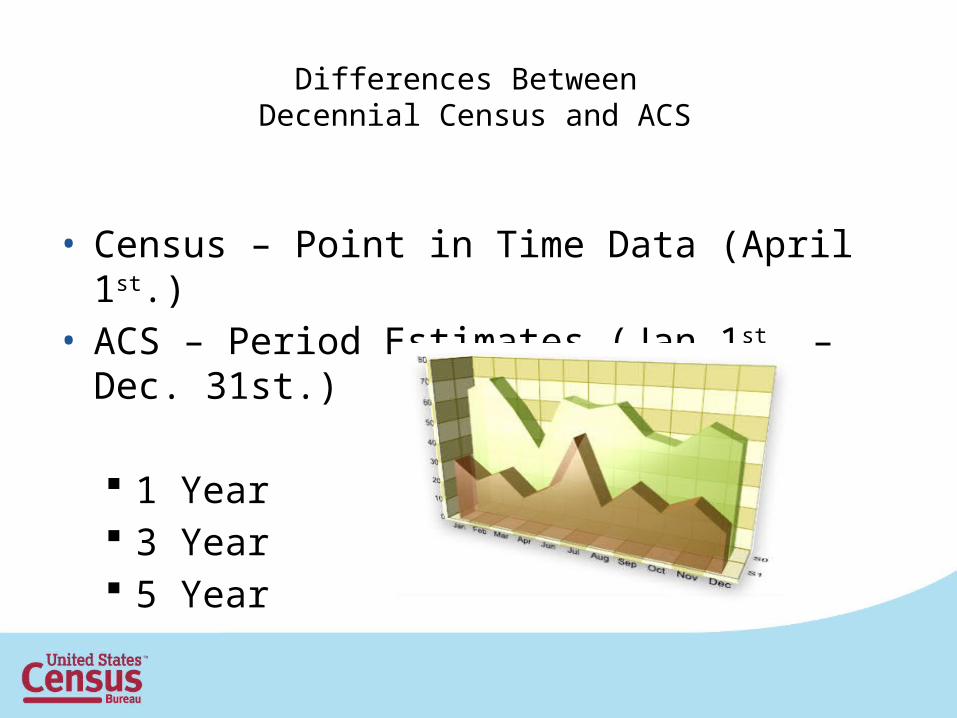
Differences Between Decennial Census and ACS
• Census – Point in Time Data (April 1st.)• ACS – Period Estimates (Jan 1st. – Dec. 31st.)
1 Year 3 Year 5 Year

• Geographies of 65,000 or more
1-Year Estimates
• Geographies of 20,000 or more
3-Year Estimates
• All geographies5-Year Estimates
ACS Period Estimates
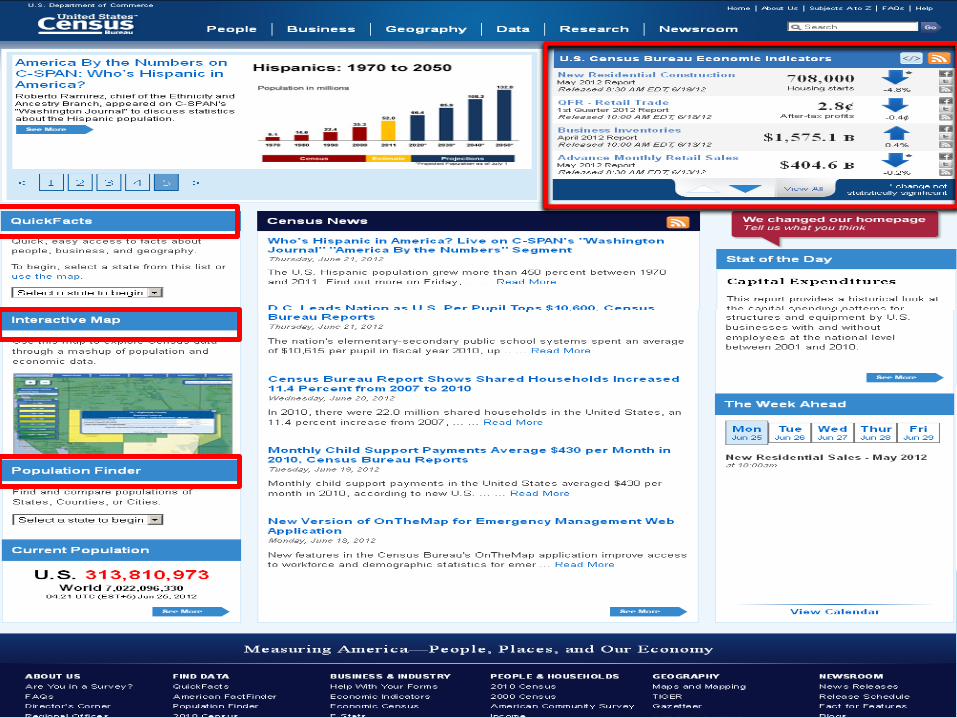
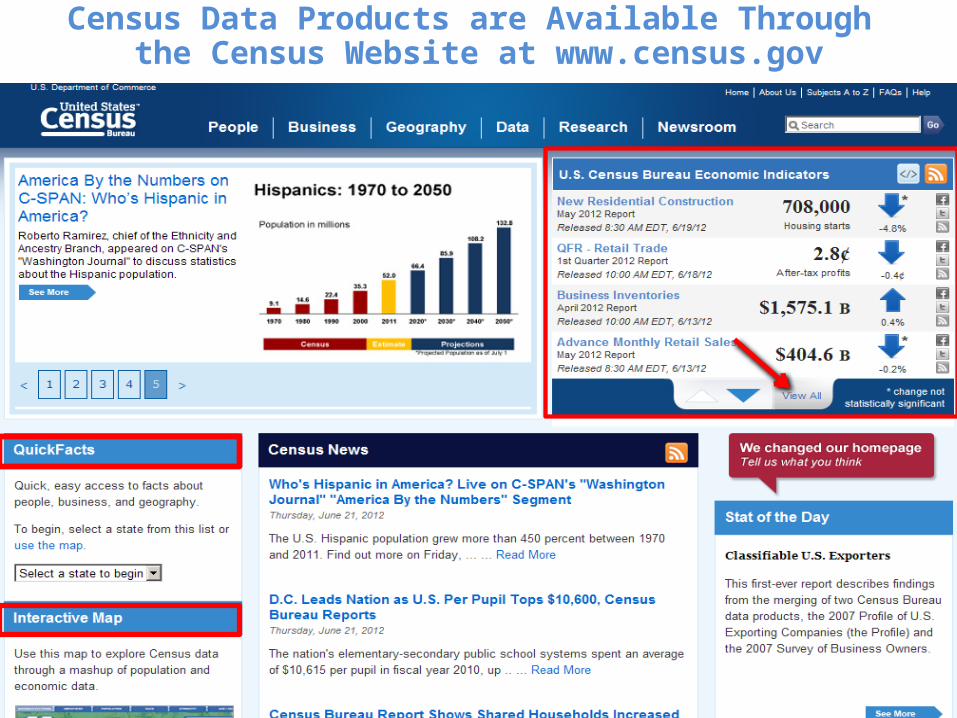
Census Data Products are Available Through the Census Website at www.census.gov
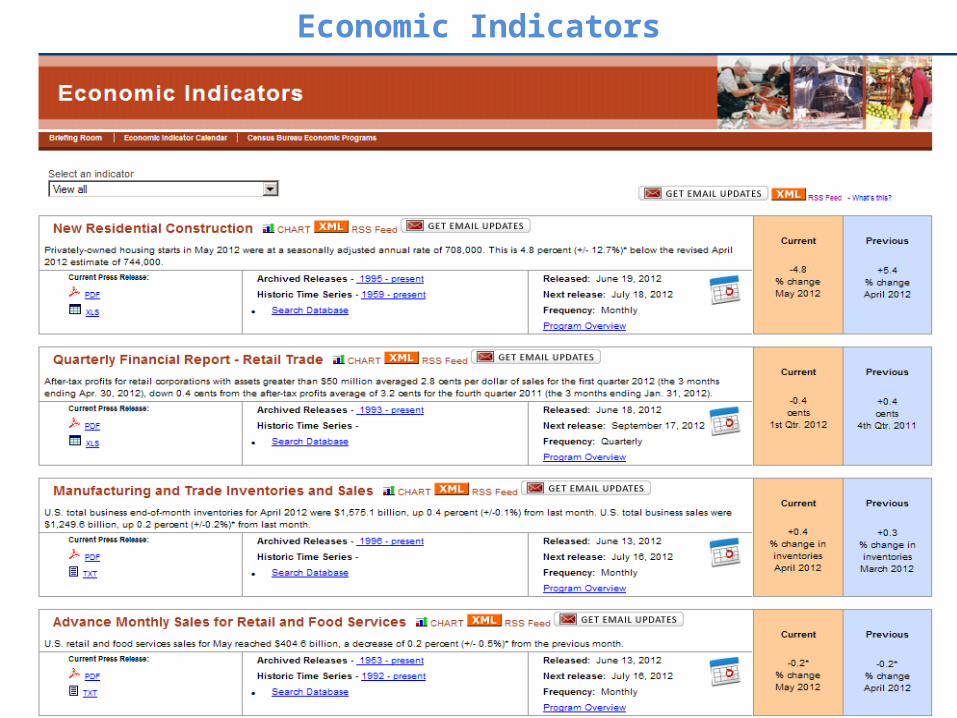
Economic Indicators
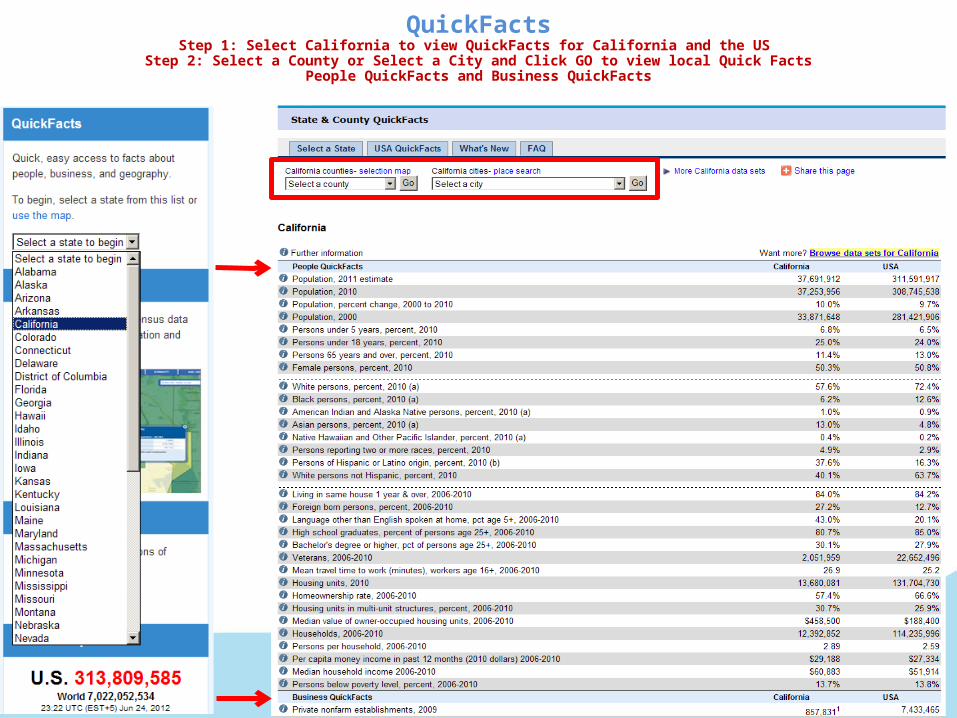
QuickFactsStep 1: Select California to view QuickFacts for California and the US
Step 2: Select a County or Select a City and Click GO to view local Quick FactsPeople QuickFacts and Business QuickFacts
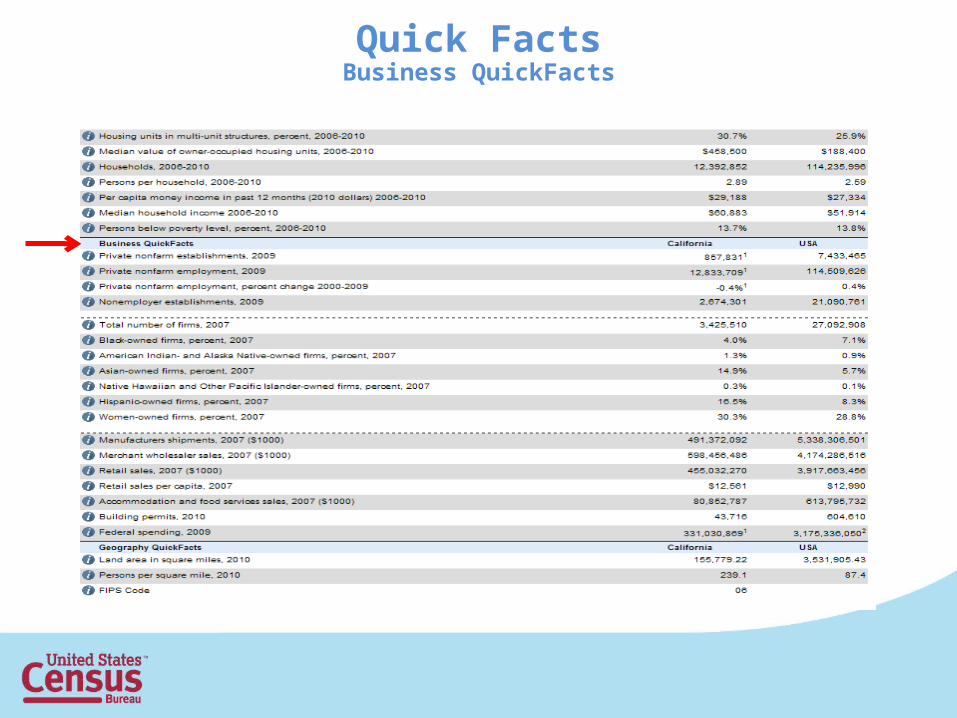
Quick FactsBusiness QuickFacts
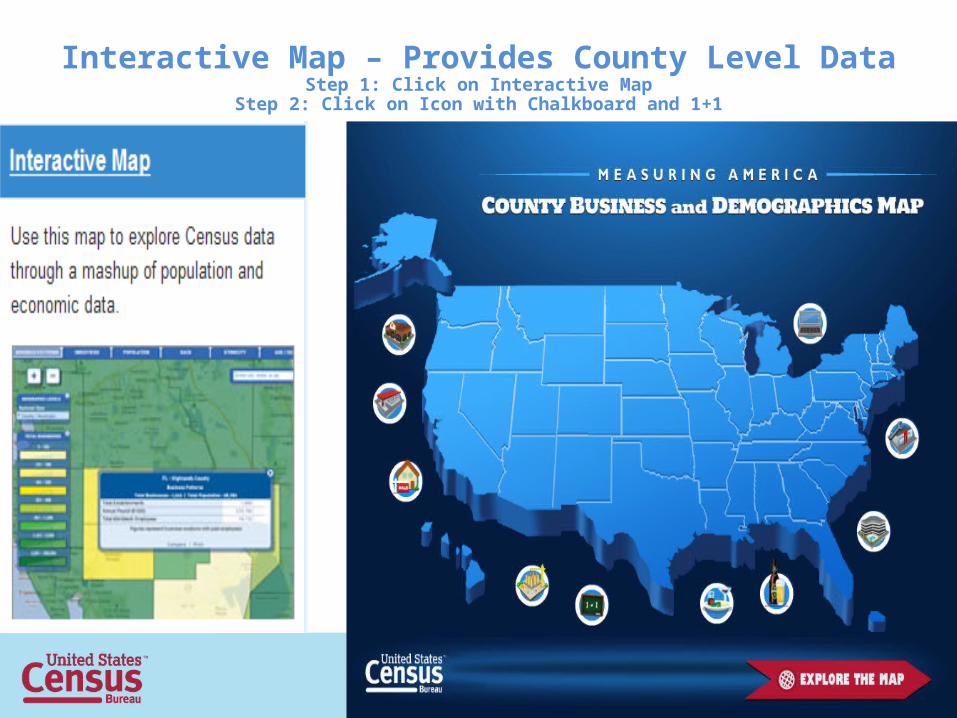
Interactive Map – Provides County Level DataStep 1: Click on Interactive Map
Step 2: Click on Icon with Chalkboard and 1+1
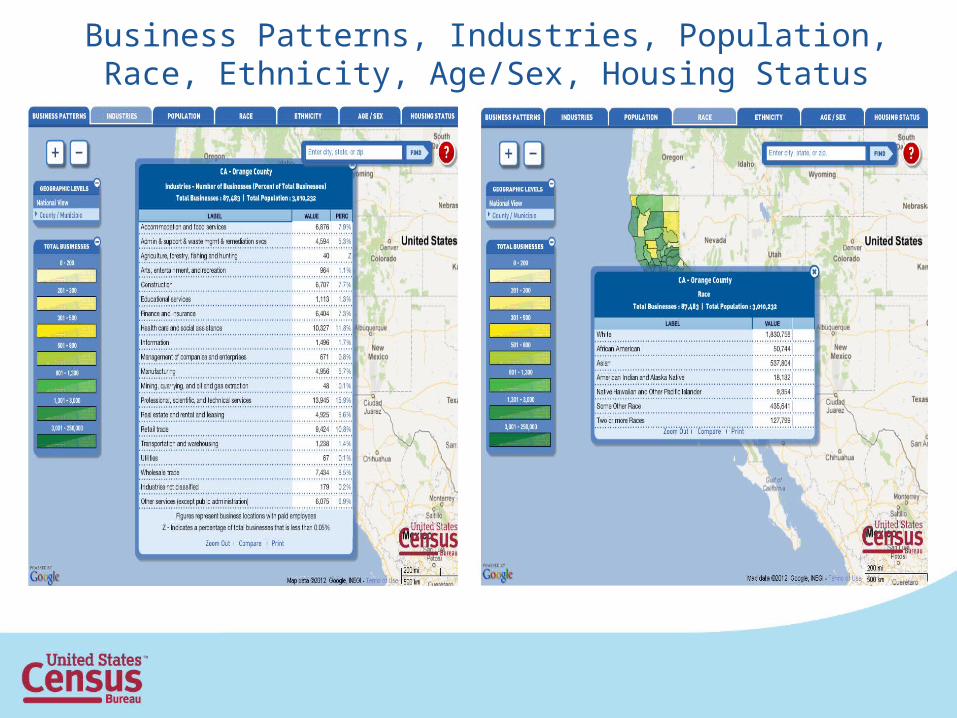
Business Patterns, Industries, Population, Race, Ethnicity, Age/Sex, Housing Status
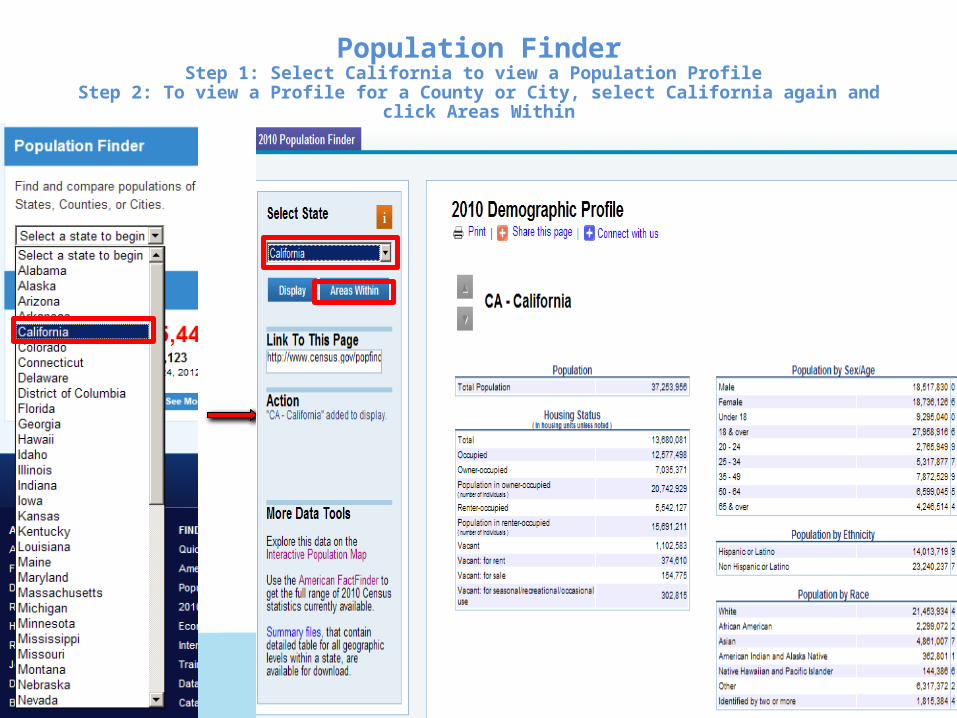
Population FinderStep 1: Select California to view a Population Profile
Step 2: To view a Profile for a County or City, select California again and click Areas Within

Population Estimates Program
• Released Annually in July
• Formulated based on latest Census Population Number, Birth Rate, Death Rate and Migration
• Data Available for Nation, States, Metro Areas, Counties and Cities/Towns
• For Nation, States and Counties - Some General Demographics: Age, Sex, Race, Ethnicity
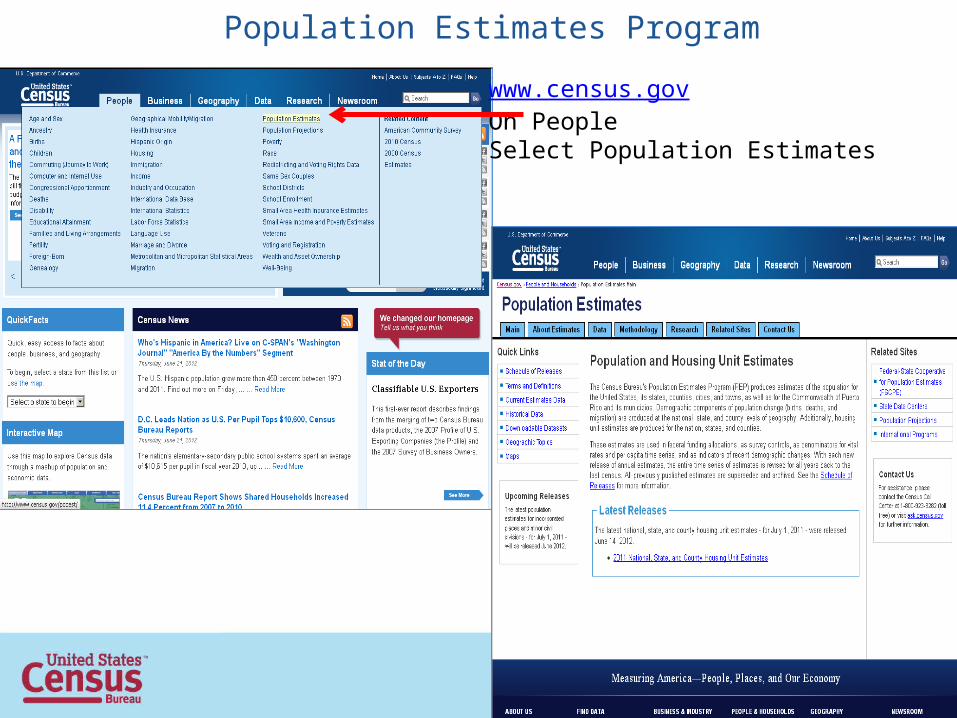
Population Estimates Program
www.census.govOn PeopleSelect Population Estimates
Other Demographic Surveys
• American Housing Survey• Current Population Survey• Housing Vacancy Survey• Survey of Income and Program Participation
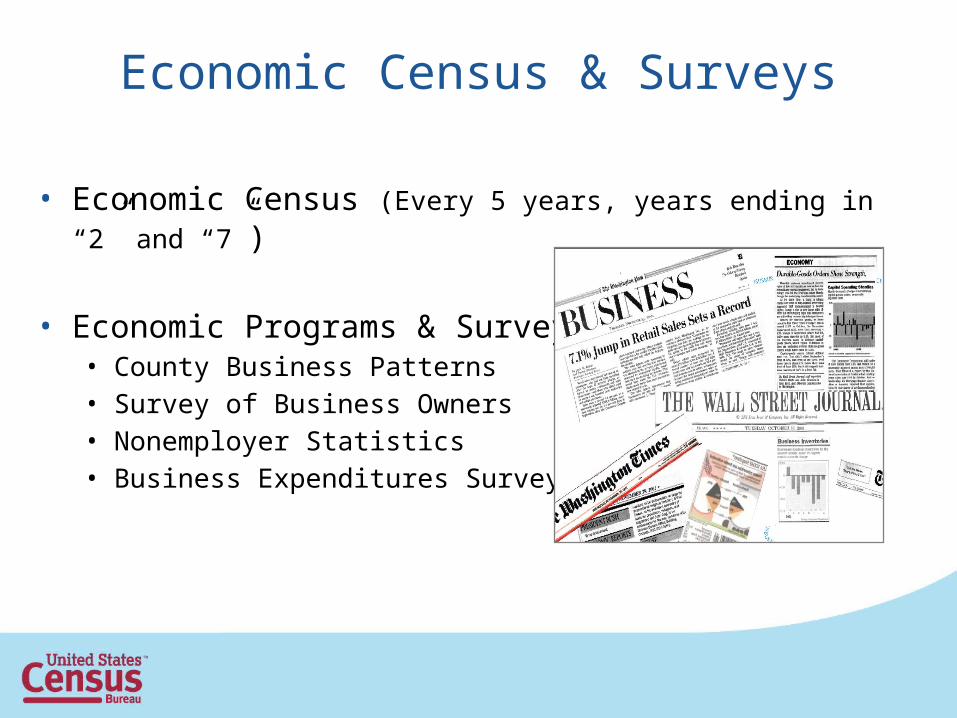
Economic Census & Surveys
• Economic Census (Every 5 years, years ending in “2” and “7”)
• Economic Programs & Surveys• County Business Patterns• Survey of Business Owners• Nonemployer Statistics• Business Expenditures Survey
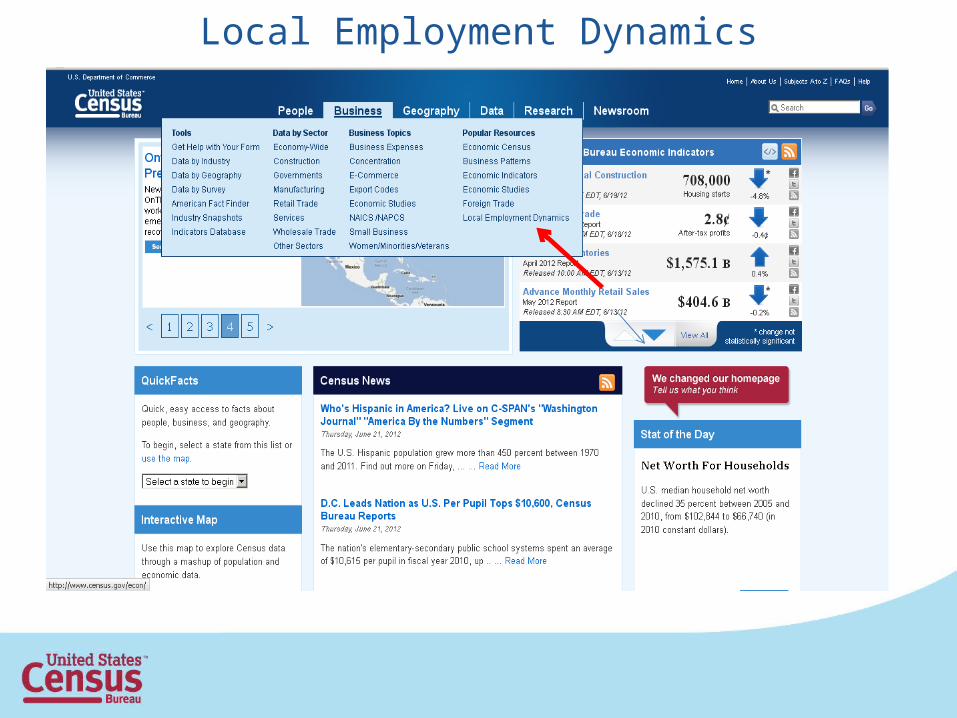
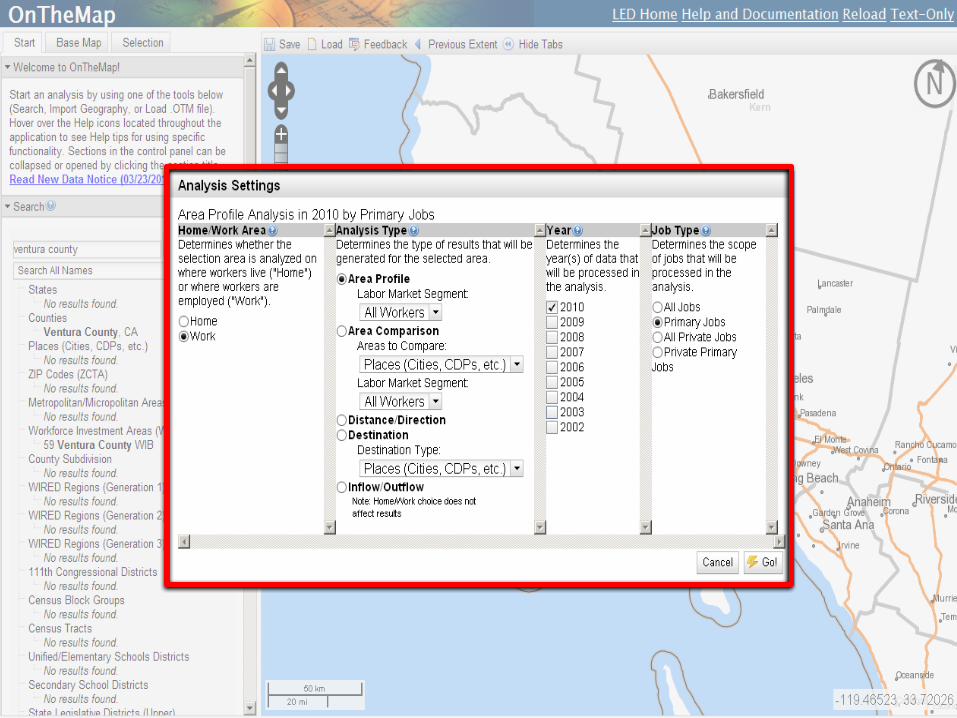
Local Employment Dynamics
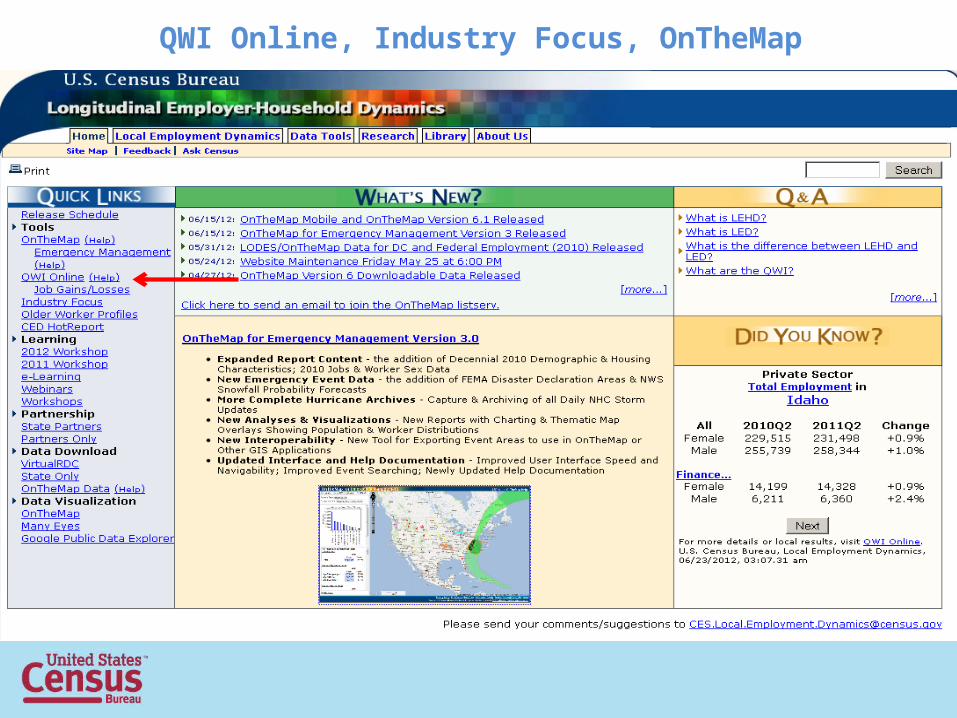
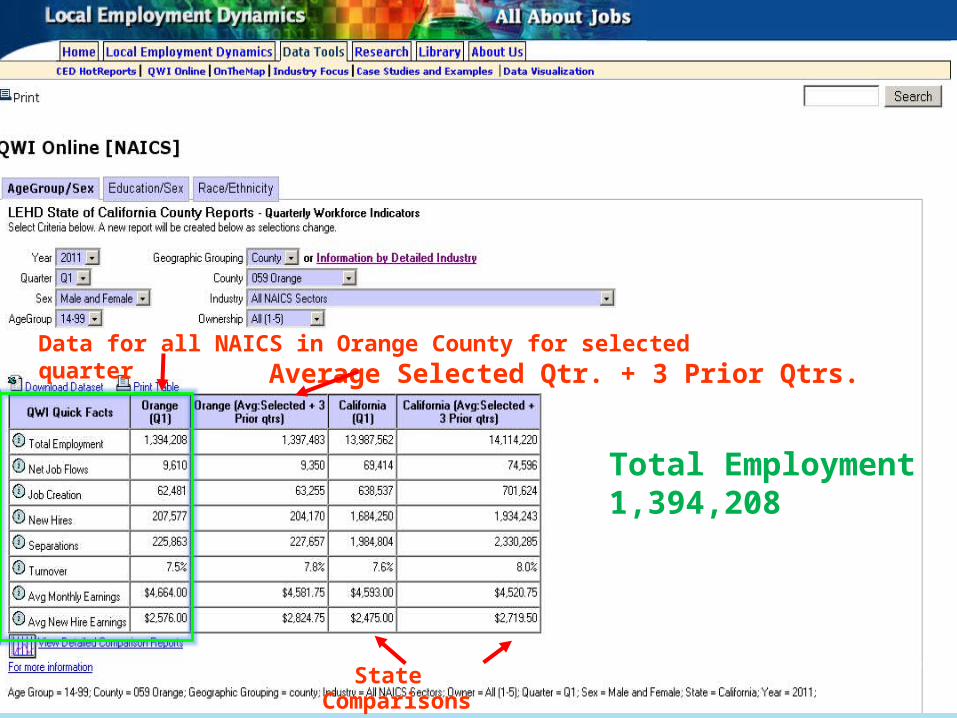
QWI Online, Industry Focus, OnTheMap
49
Data for all NAICS in Orange County for selected quarter Average Selected Qtr. + 3 Prior Qtrs.
State Comparisons
Total Employment1,394,208
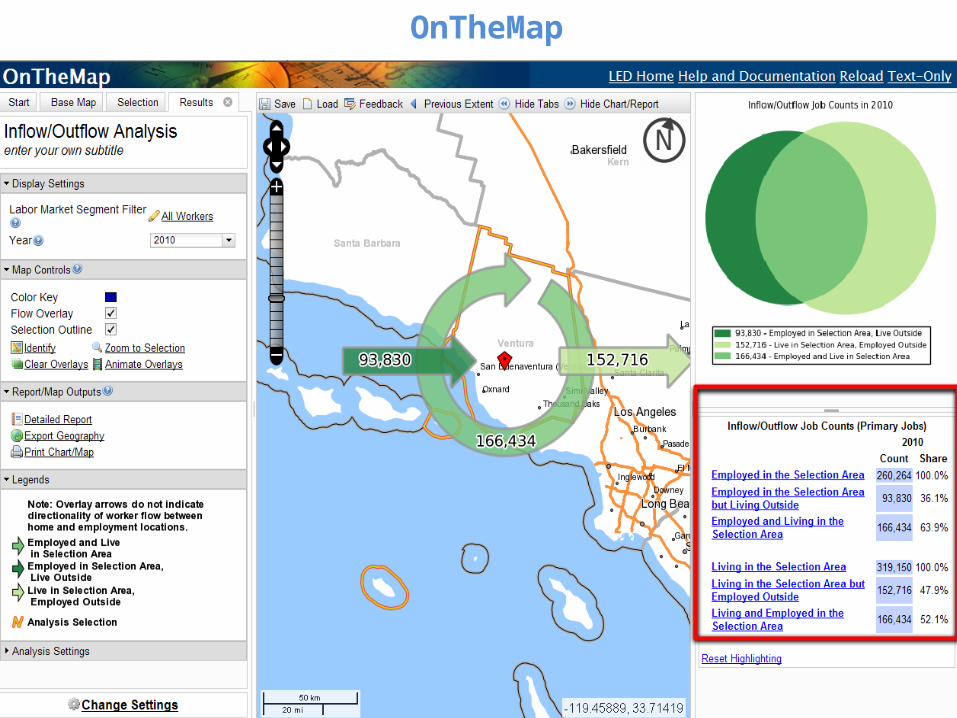
OnTheMap
Census Data Workshops
Hands-on Training
Customized to Your Data Needs
Free of Cost
Learn to Access Census Data Through American FactFinder
53
U.S. Census BureauPartnership & Data Services Program
15350 Sherman Way, Suite 400Van Nuys, CA 91406
(888) 806-6389 Toll Free
L.A. Regional Website: www.census.gov/losangeles [email protected]
Resources: Need Assistance?