accompanying comments do not purport to identify the risks
TRANSCRIPT

These statements may relate to future events or our future financial performance and are subject to known and unknown risks, uncertainties and other factors that may cause our actual results, levels of activity, performance or achievements to differ materially from those expressed or implied by these forward-looking statements. This presentation and our accompanying comments do not purport to identify the risks inherent in an investment in Domino’s Pizza and factors that could cause actual results to differ materially from those expressed or implied in the forward-looking statements. These risks include but are not limited to those risk factors identified in Domino’s Pizza, Inc.’s Annual Report on Form 10-K for the fiscal year ended January 3, 2016, as well as other SEC reports filed by Domino’s Pizza, Inc. from time to time. Although we believe that the expectations reflected in the forward-looking statements are based upon reasonable estimates and assumptions, we cannot guarantee future results, levels of activity, performance or achievements. We caution you not to place undue reliance on forward-looking statements, which reflect our estimates and assumptions and speak only as of the date of this presentation and you should not rely on such statements as representing the views of the Company as of any subsequent date. We undertake no obligation to update the forward-looking statements to reflect subsequent events or circumstances. In light of the above, you are urged to review the disclosures contained in the Domino’s Pizza, Inc. SEC reports, including the risk factors contained therein. This presentation contains trade names, trademarks and service marks of other companies. We do not intend our use or display of other parties’ trade names, trademarks and service marks to imply a relationship with, or endorsement or sponsorship of, these other parties.
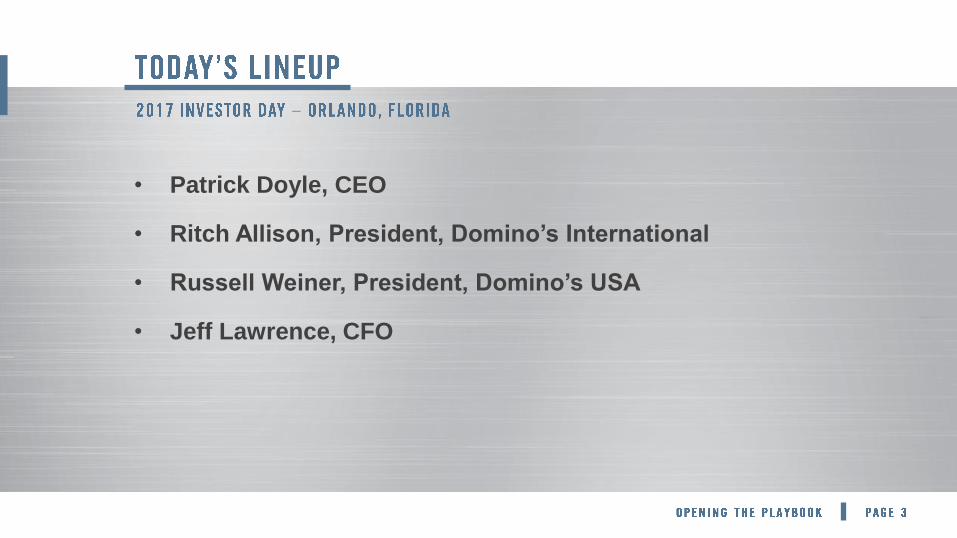
• Patrick Doyle, CEO
• Ritch Allison, President, Domino’s International
• Russell Weiner, President, Domino’s USA
• Jeff Lawrence, CFO
–
…
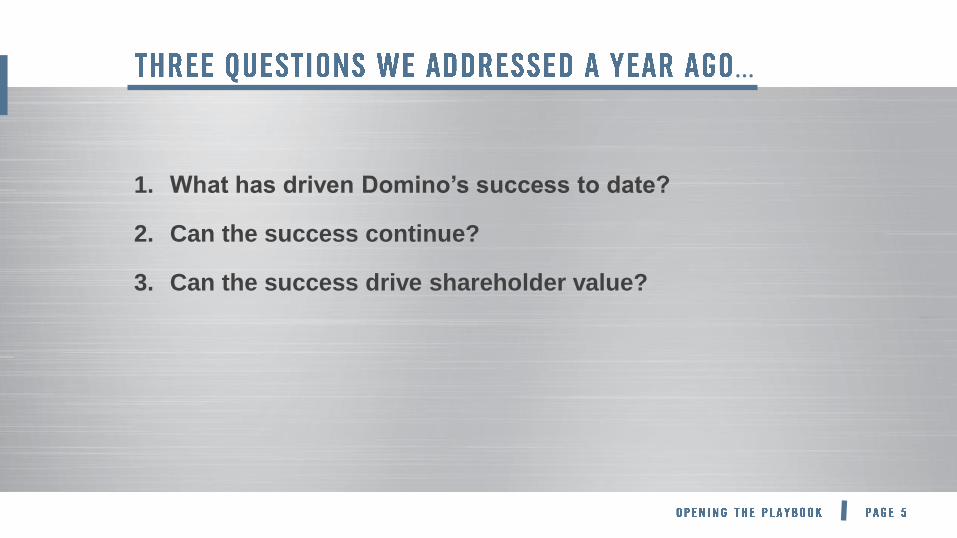
1. What has driven Domino’s success to date?
2. Can the success continue?
3. Can the success drive shareholder value?

…
BUTT
ON
BUTT
ON BUTT
ON
BUTT
ON BUTT
ON
BUTT
ON BUTT
ON
BUTT
ON BUTT
ON
BUTT
ON BUTT
ON
BUTT
ON BUTT
ON
BUTT
ON
We told the story a year ago through ‘36 Blast’...
but today, we want to Open the Playbook.
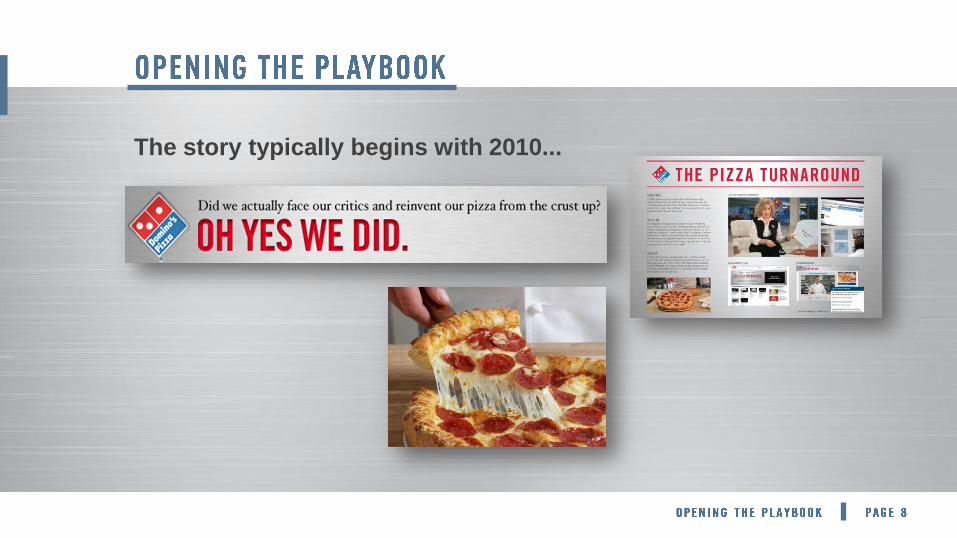
The story typically begins with 2010...
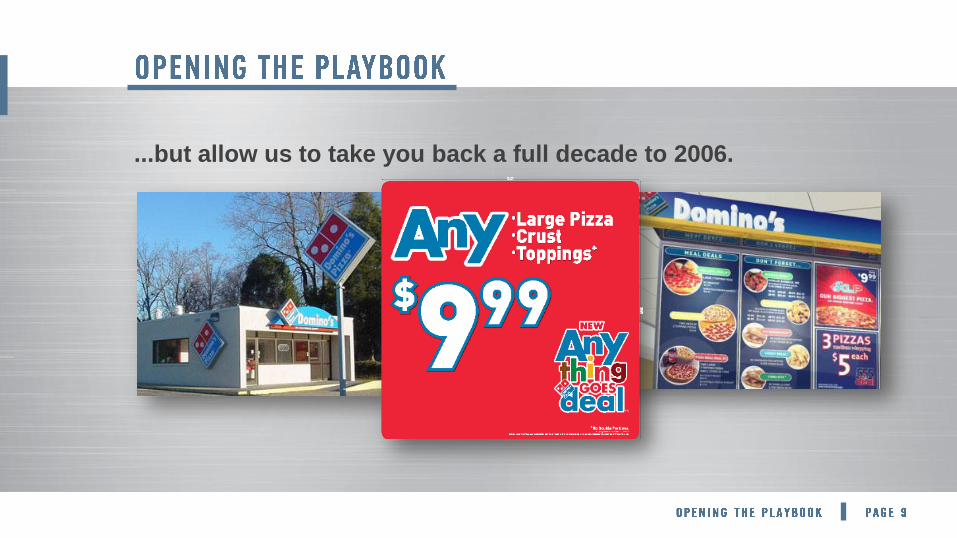
...but allow us to take you back a full decade to 2006.
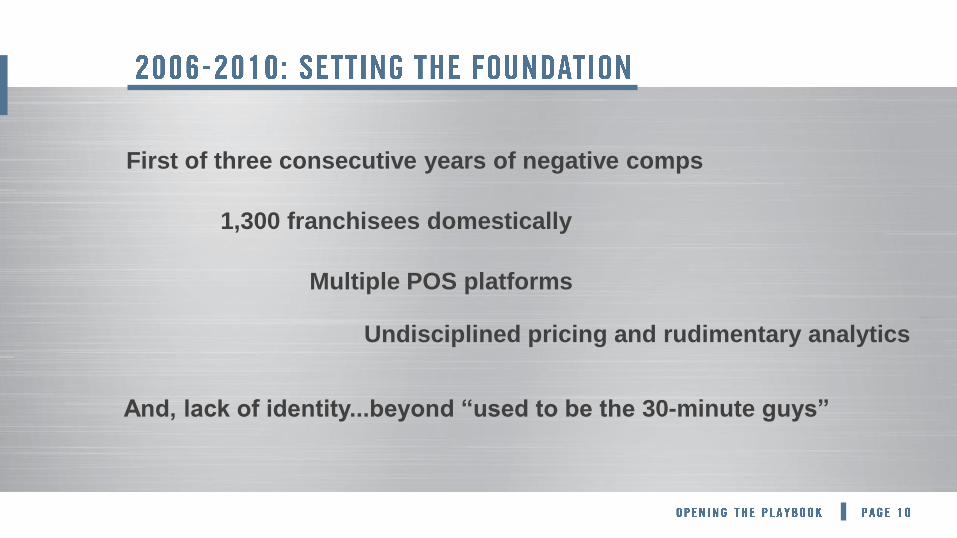
First of three consecutive years of negative comps
1,300 franchisees domestically
Multiple POS platforms
Undisciplined pricing and rudimentary analytics
And, lack of identity...beyond “used to be the 30-minute guys”
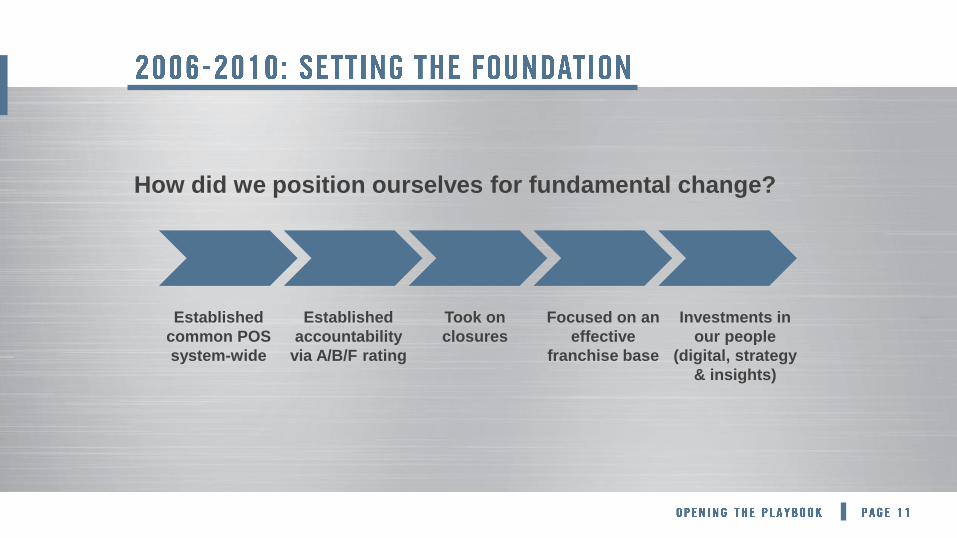
How did we position ourselves for fundamental change?
Established
accountability
via A/B/F rating
Took on
closures
Focused on an
effective
franchise base
Established
common POS
system-wide
Investments in
our people
(digital, strategy
& insights)
This didn’t happen overnight.
Or during a certain quarter.
Or during a certain year.
But it did happen.
True, sustainable competitive
advantage takes time to build.
Decade-long, relentless focus on the customer experience through:
- Real Innovation
- Responsible Investment
- Disciplined Decisions
- Taking Smart Risks
- True Global Alignment

#
#
We set a goal in 2010 to become #1 in pizza.
Every decision we have made, or considered,
begins and ends with that goal…and an exclusive
focus on the long-term over the short-term.
#1 for customers
AND
#1 for franchisees
#
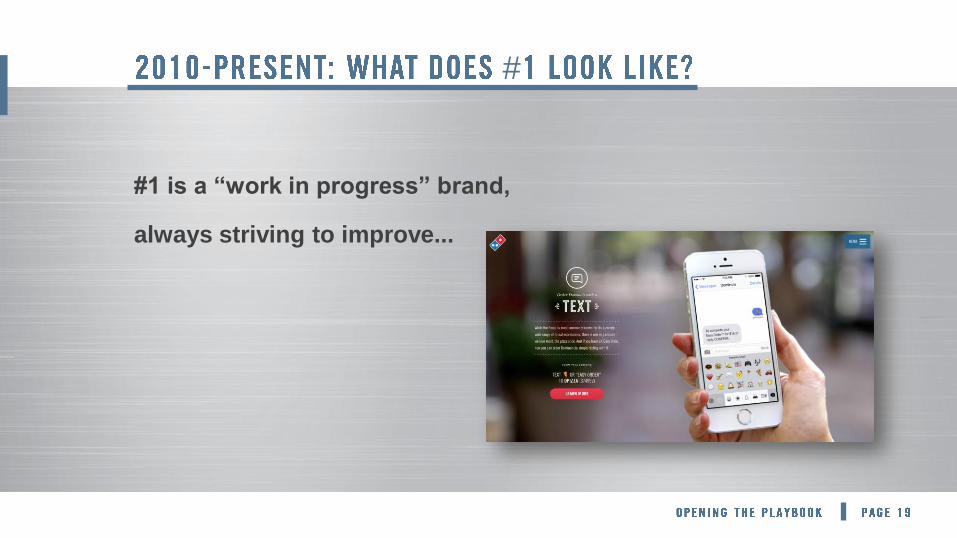
#1 is a “work in progress” brand,
always striving to improve...
#
#
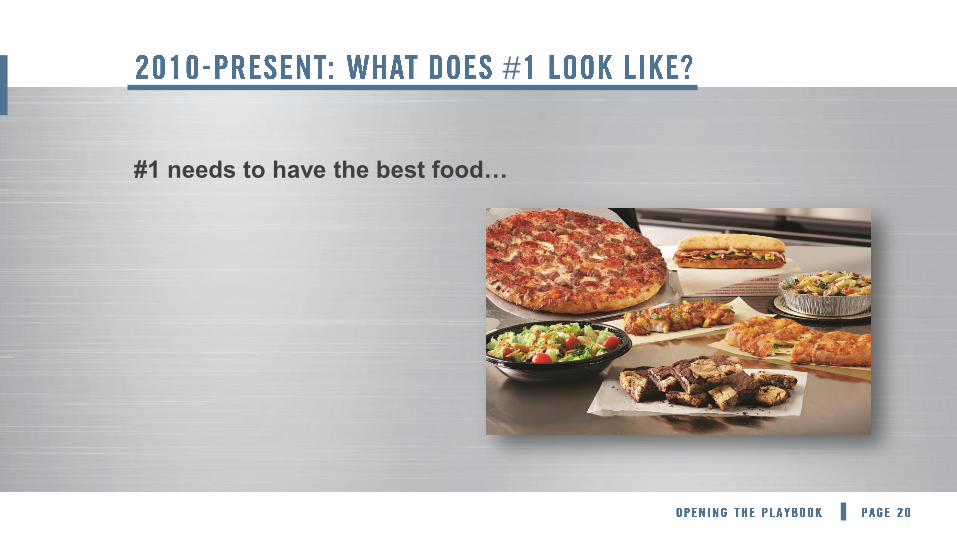
#1 needs to have the best food…

#
#1 has the best store image worldwide...
#
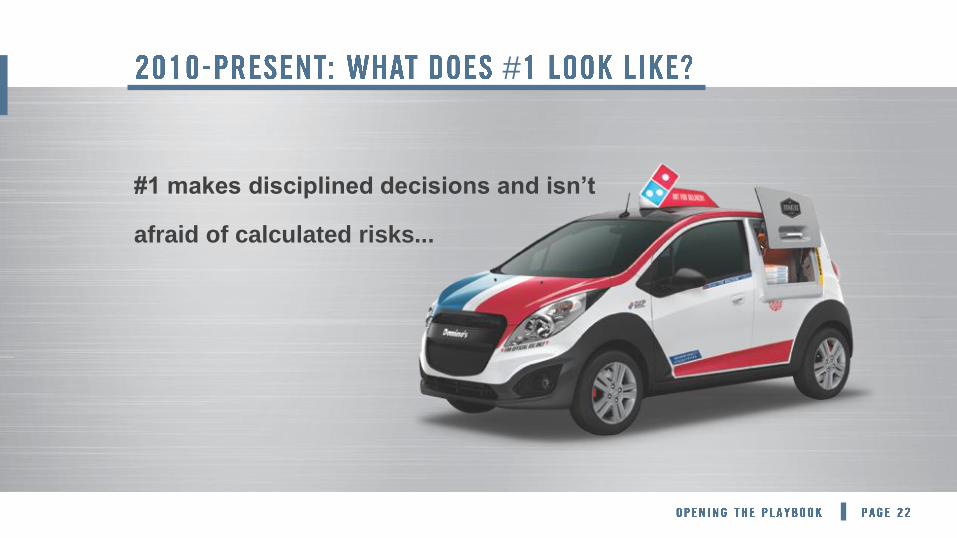
#1 makes disciplined decisions and isn’t
afraid of calculated risks...

#
#1 delivers big, bold ideas and doesn’t
‘tactic’ its way forward...

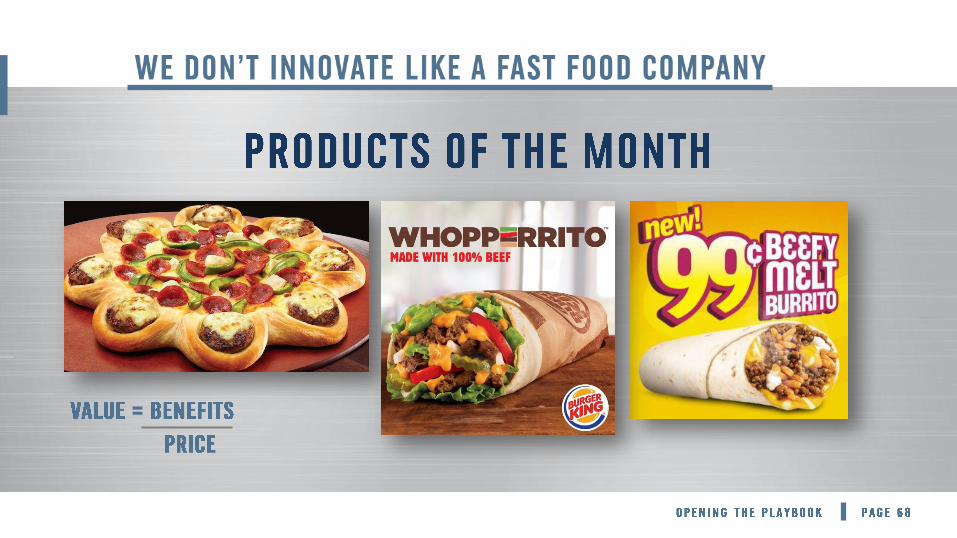
#1 makes news outside of ‘product of the month’...
#
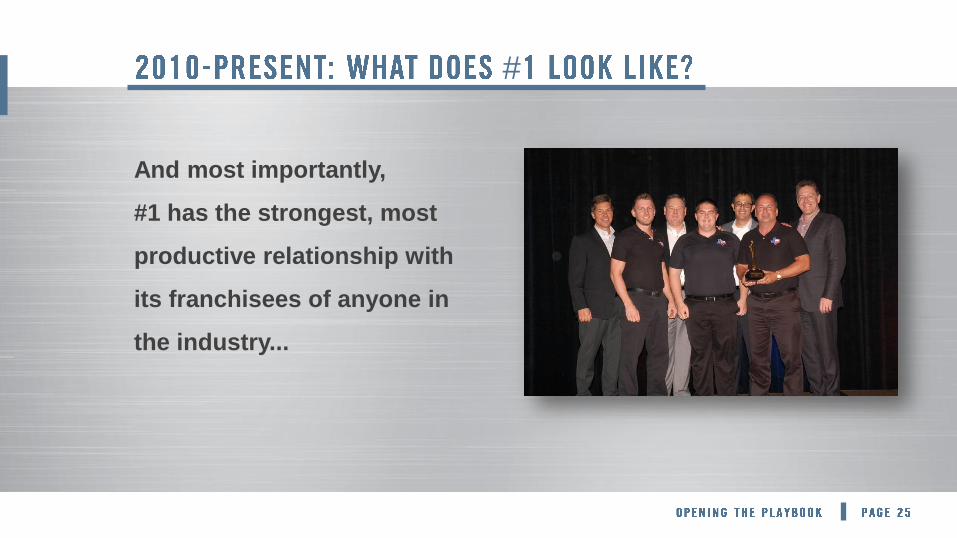
And most importantly,
#1 has the strongest, most
productive relationship with
its franchisees of anyone in
the industry...
#
…
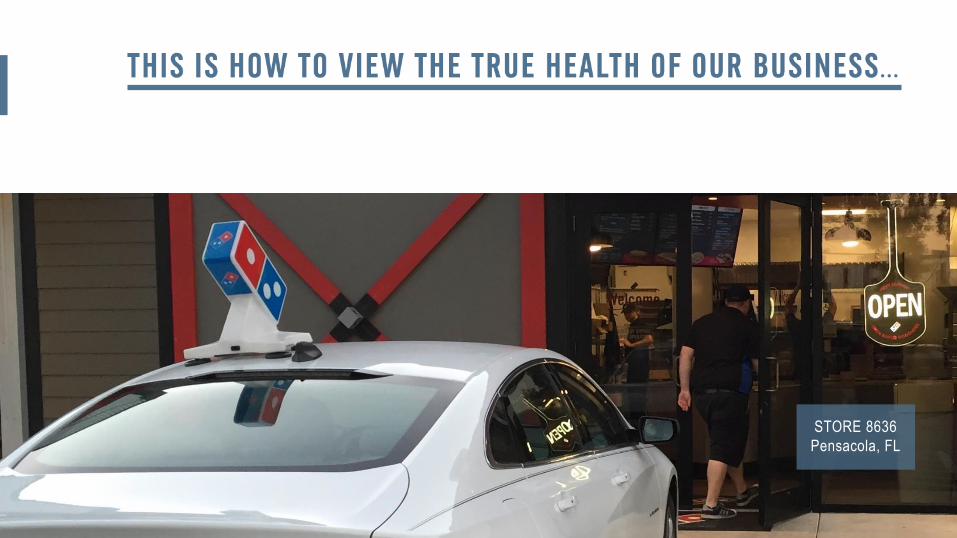
STORE 8636
Pensacola, FL
…
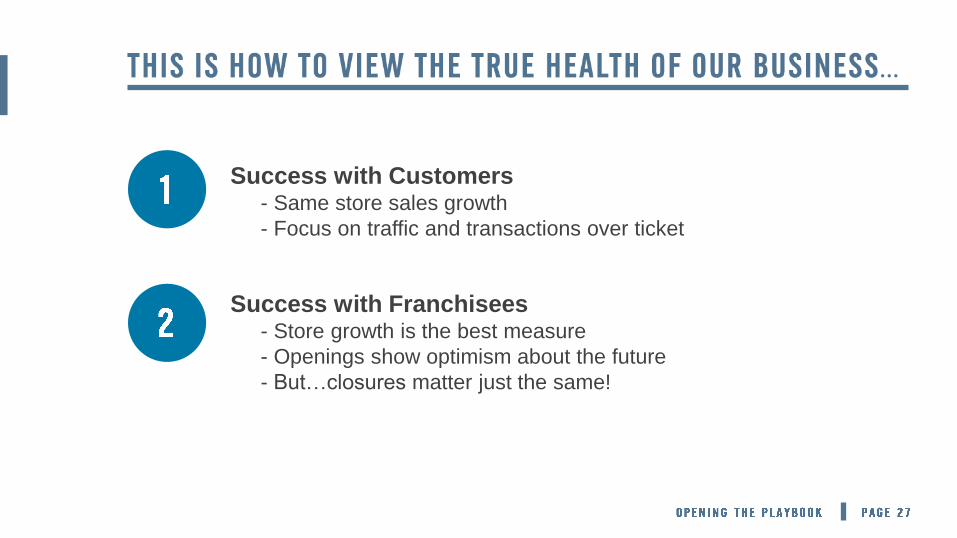
Success with Customers - Same store sales growth
- Focus on traffic and transactions over ticket
2
Success with Franchisees - Store growth is the best measure
- Openings show optimism about the future
- But…closures matter just the same!
#

…
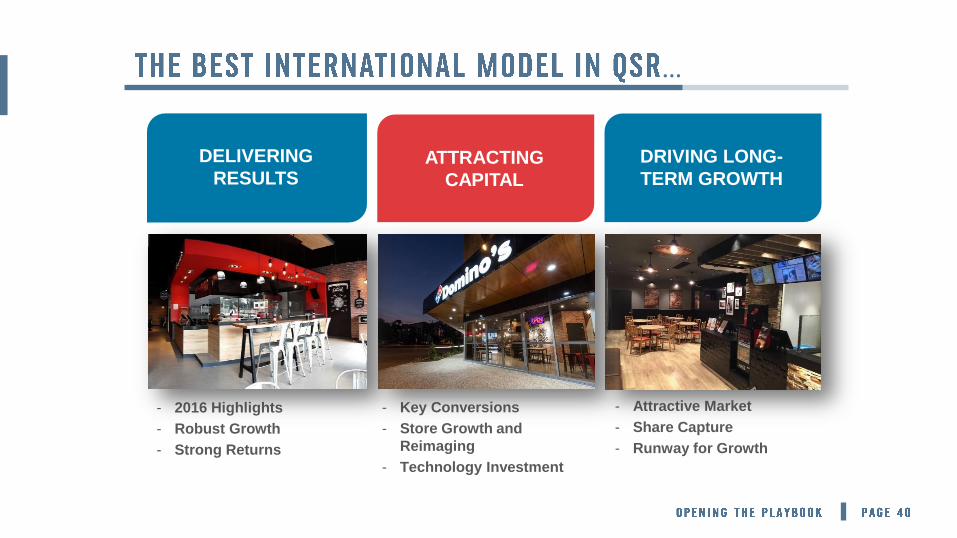
- 2016 Highlights
- Robust Growth
- Strong Returns
- Key Conversions
- Store Growth and
Reimaging
- Technology Investment
- Attractive Market
- Share Capture
- Runway for Growth
DELIVERING
RESULTS DRIVING LONG-
TERM GROWTH ATTRACTING
CAPITAL
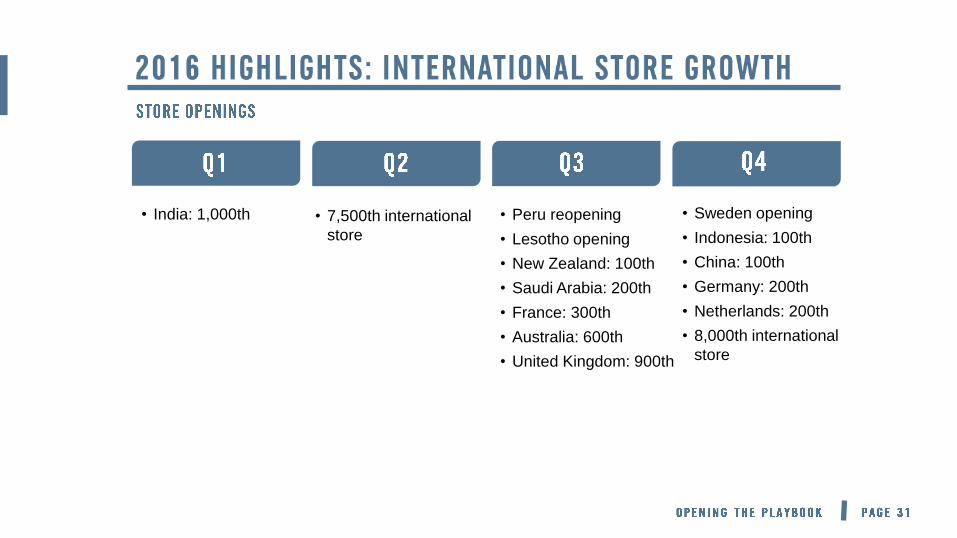
• India: 1,000th • 7,500th international
store
• Peru reopening
• Lesotho opening
• New Zealand: 100th
• Saudi Arabia: 200th
• France: 300th
• Australia: 600th
• United Kingdom: 900th
• Sweden opening
• Indonesia: 100th
• China: 100th
• Germany: 200th
• Netherlands: 200th
• 8,000th international
store


%
Retail Sales ($ in millions)
2010 2011 2012 2013 2014 2015 2016 Q3TTM
Retail Sales
$2,952
$3,519 $3,861
$4,252
$4,800 $5,090
$5,447

6.8%
5.2%
6.2% 6.9%
7.8% 7.2%
2011 2012 2013 2014 2015 2016 Q3 YTD
Same Store Sales Growth
Nearly 60% of
SSS growth over
the last six years
has come from
order count
increases.
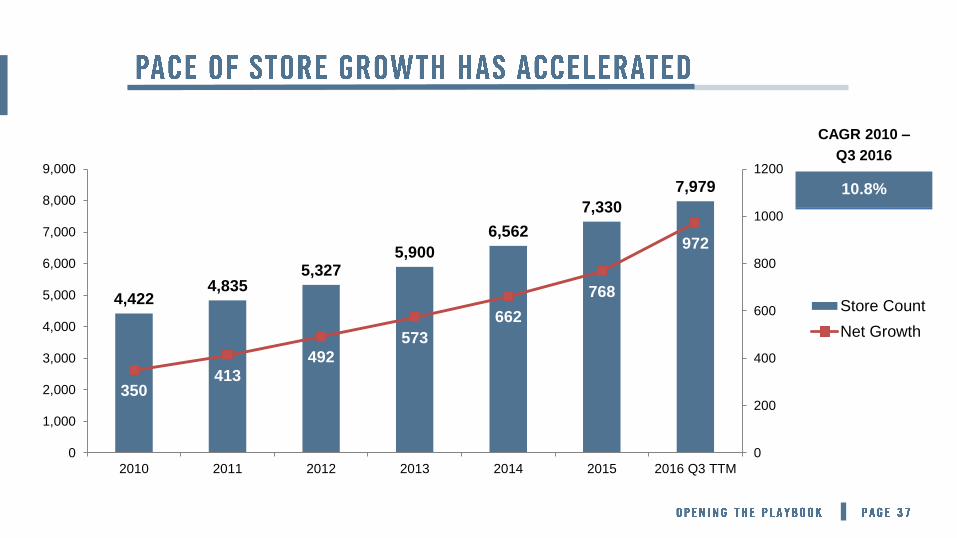
4,422 4,835
5,327 5,900
6,562
7,330
7,979
350 413
492
573
662
768
972
0
200
400
600
800
1000
1200
0
1,000
2,000
3,000
4,000
5,000
6,000
7,000
8,000
9,000
2010 2011 2012 2013 2014 2015 2016 Q3 TTM
Store Count
Net Growth
CAGR 2010 –
Q3 2016
10.8%
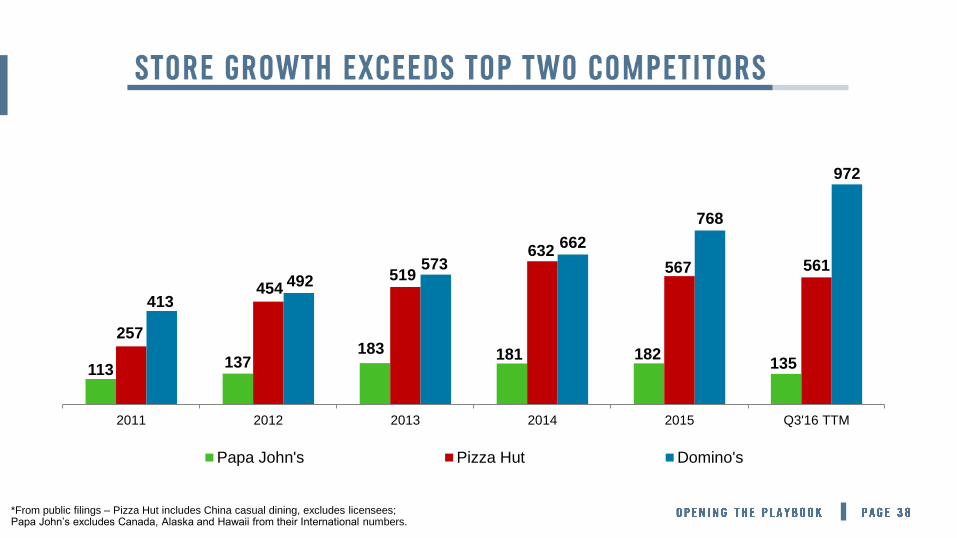
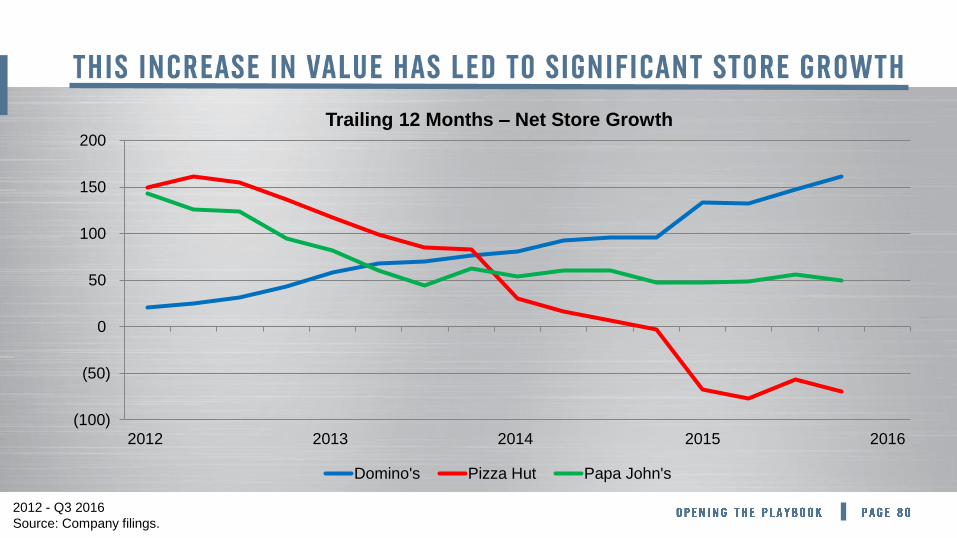
113 137 183 181 182
135
257
454 519
632 567 561
413
492 573
662
768
972
2011 2012 2013 2014 2015 Q3'16 TTM
Papa John's Pizza Hut Domino's
*From public filings – Pizza Hut includes China casual dining, excludes licensees; Papa John’s excludes Canada, Alaska and Hawaii from their International numbers.
• International franchisees average 3-year
payback on new stores
• Many international markets have
experienced improving or consistent
paybacks since 2015
…
- 2016 Highlights
- Robust Growth
- Strong Returns
- Key Conversions
- Store Growth and
Reimaging
- Technology Investment
- Attractive Market
- Share Capture
- Runway for Growth
DELIVERING
RESULTS DRIVING LONG-
TERM GROWTH ATTRACTING
CAPITAL

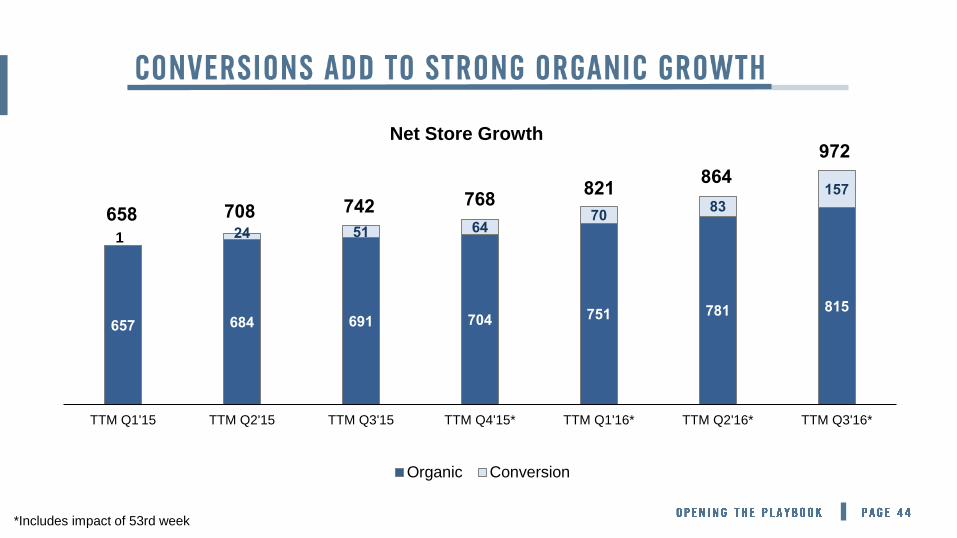
657 684 691 704 751 781 815
24 51 64 70
83 157
TTM Q1'15 TTM Q2'15 TTM Q3'15 TTM Q4'15* TTM Q1'16* TTM Q2'16* TTM Q3'16*
Net Store Growth
Organic Conversion
658
821 768 742 708
864
972
*Includes impact of 53rd week
1
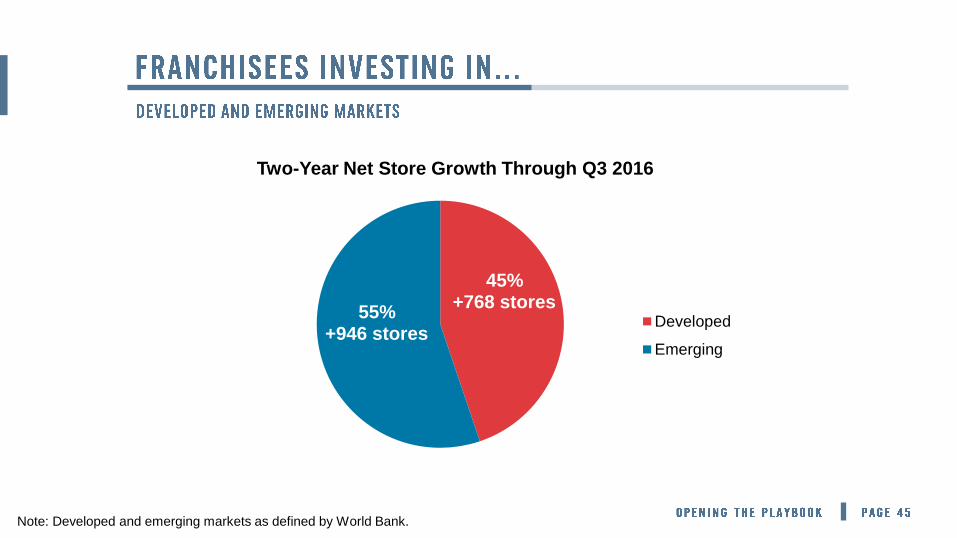
45% +768 stores
55% +946 stores
Two-Year Net Store Growth Through Q3 2016
Developed
Emerging
Note: Developed and emerging markets as defined by World Bank.

• As of Q3 2016
- Approximately 5,100 international
stores reimaged
• Plans for 2017
- Reimage approximately 1,000 more
existing stores

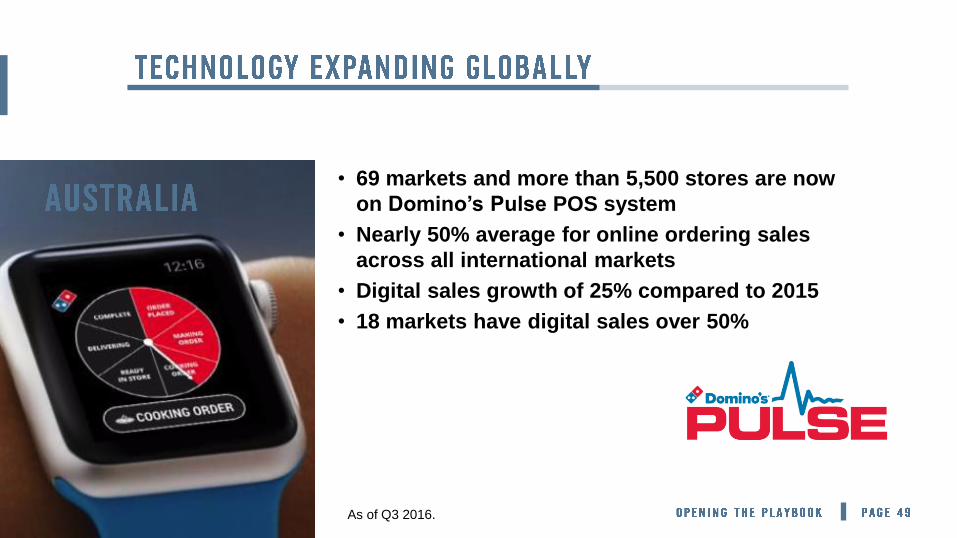
• 69 markets and more than 5,500 stores are now
on Domino’s Pulse POS system
• Nearly 50% average for online ordering sales
across all international markets
• Digital sales growth of 25% compared to 2015
• 18 markets have digital sales over 50%
As of Q3 2016.

36%
21%
43%
2011
% of International Stores
69%
6%
25%
Q3 2016
Domino's PulseInstalled
AgreementsSigned
Other
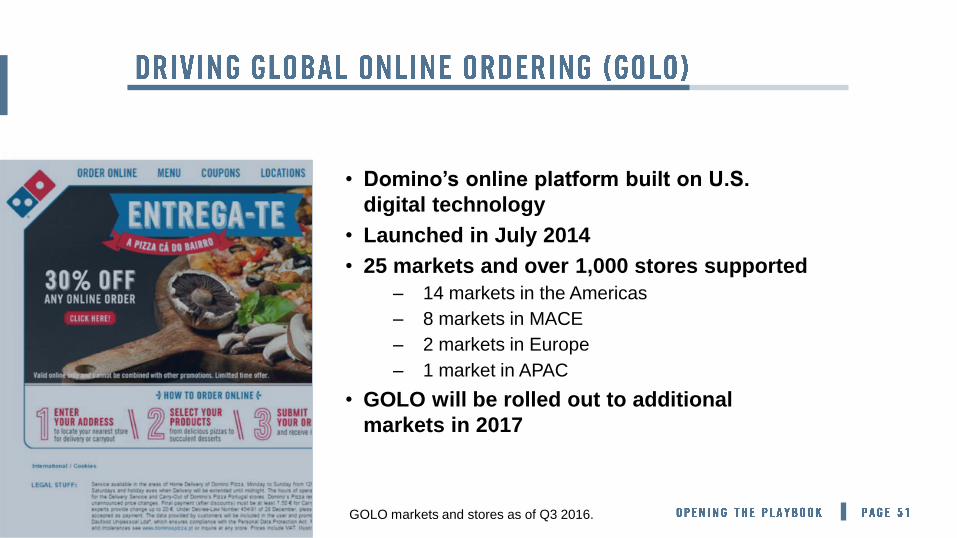
• Domino’s online platform built on U.S.
digital technology
• Launched in July 2014
• 25 markets and over 1,000 stores supported
– 14 markets in the Americas
– 8 markets in MACE
– 2 markets in Europe
– 1 market in APAC
• GOLO will be rolled out to additional
markets in 2017
GOLO markets and stores as of Q3 2016.

…
- 2016 Highlights
- Robust Growth
- Strong Returns
- Key Conversions
- Store Growth and
Reimaging
- Technology Investment
- Attractive Market
- Share Capture
- Runway for Growth
DELIVERING
RESULTS DRIVING LONG-
TERM GROWTH ATTRACTING
CAPITAL
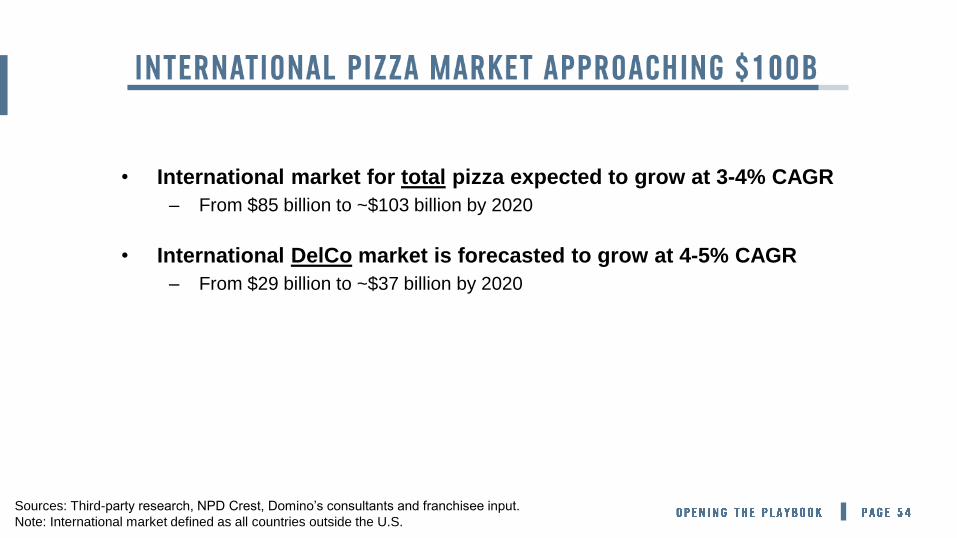
• International market for total pizza expected to grow at 3-4% CAGR
– From $85 billion to ~$103 billion by 2020
• International DelCo market is forecasted to grow at 4-5% CAGR
– From $29 billion to ~$37 billion by 2020
Sources: Third-party research, NPD Crest, Domino’s consultants and franchisee input.
Note: International market defined as all countries outside the U.S.
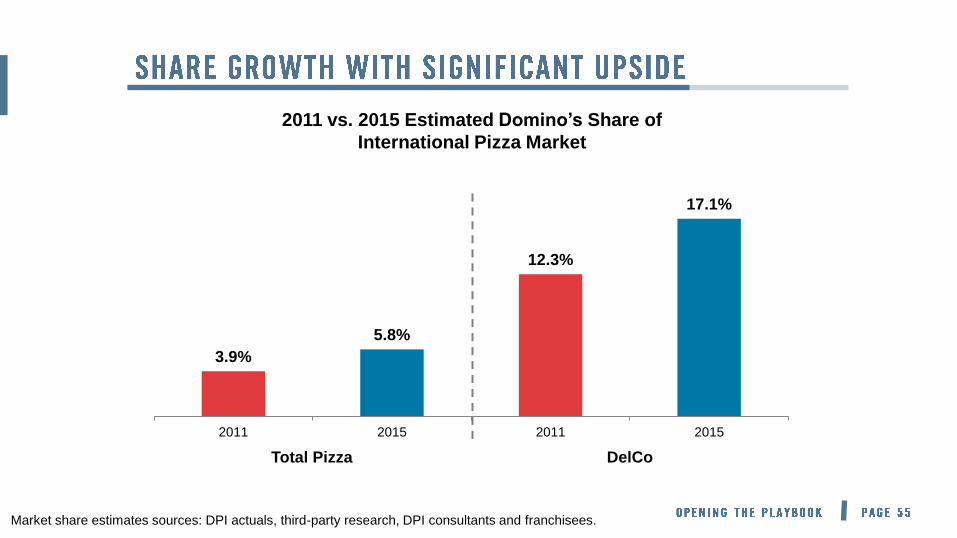
2011 vs. 2015 Estimated Domino’s Share of
International Pizza Market
3.9%
5.8%
12.3%
17.1%
2011 2015 2011 2015
Market share estimates sources: DPI actuals, third-party research, DPI consultants and franchisees.
Total Pizza DelCo
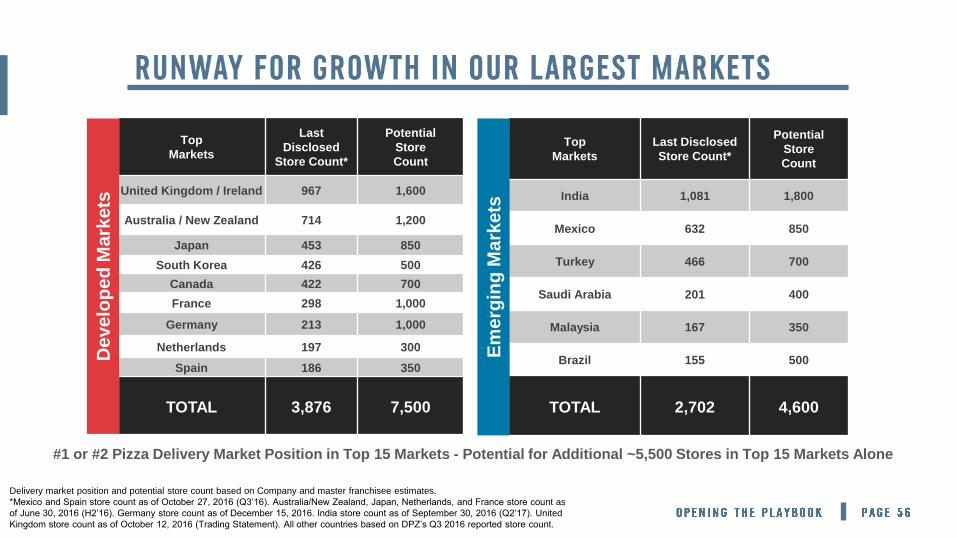
Delivery market position and potential store count based on Company and master franchisee estimates.
*Mexico and Spain store count as of October 27, 2016 (Q3’16). Australia/New Zealand, Japan, Netherlands, and France store count as
of June 30, 2016 (H2’16). Germany store count as of December 15, 2016. India store count as of September 30, 2016 (Q2’17). United
Kingdom store count as of October 12, 2016 (Trading Statement). All other countries based on DPZ’s Q3 2016 reported store count.
#1 or #2 Pizza Delivery Market Position in Top 15 Markets - Potential for Additional ~5,500 Stores in Top 15 Markets Alone
Top
Markets
Last Disclosed
Store Count*
Potential
Store
Count
India 1,081 1,800
Mexico 632 850
Turkey 466 700
Saudi Arabia 201 400
Malaysia 167 350
Brazil 155 500
TOTAL 2,702
4,600
Top
Markets
Last
Disclosed
Store Count*
Potential
Store
Count
United Kingdom / Ireland 967 1,600
Australia / New Zealand 714 1,200
Japan 453 850
South Korea 426 500
Canada 422 700
France 298 1,000
Germany 213 1,000
Netherlands 197 300
Spain 186 350
TOTAL 3,876
7,500
De
ve
lop
ed
Ma
rkets
Em
erg
ing
Ma
rkets

No Domino’s Presence
Below 5% Total Pizza Market Share
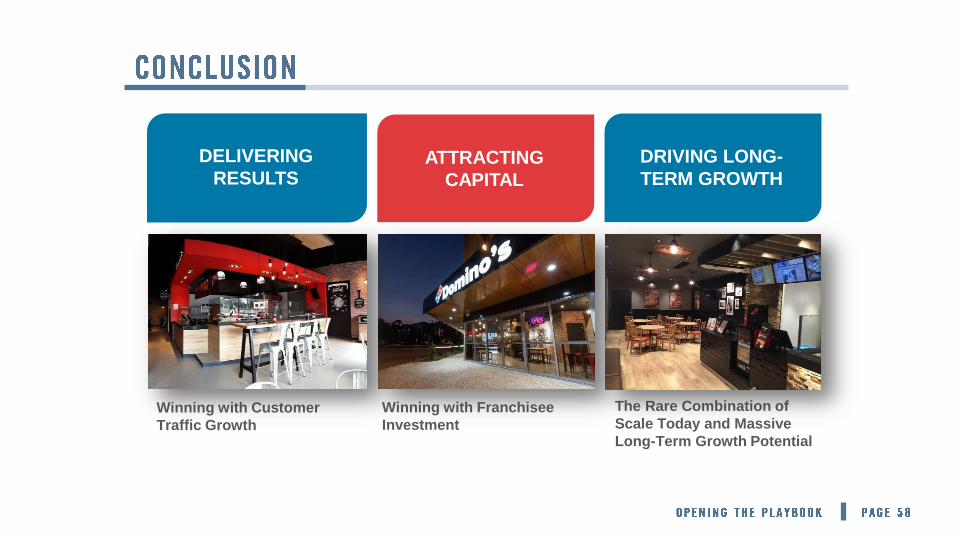
Winning with Customer
Traffic Growth
Winning with Franchisee
Investment
The Rare Combination of
Scale Today and Massive
Long-Term Growth Potential
DELIVERING
RESULTS DRIVING LONG-
TERM GROWTH ATTRACTING
CAPITAL
…
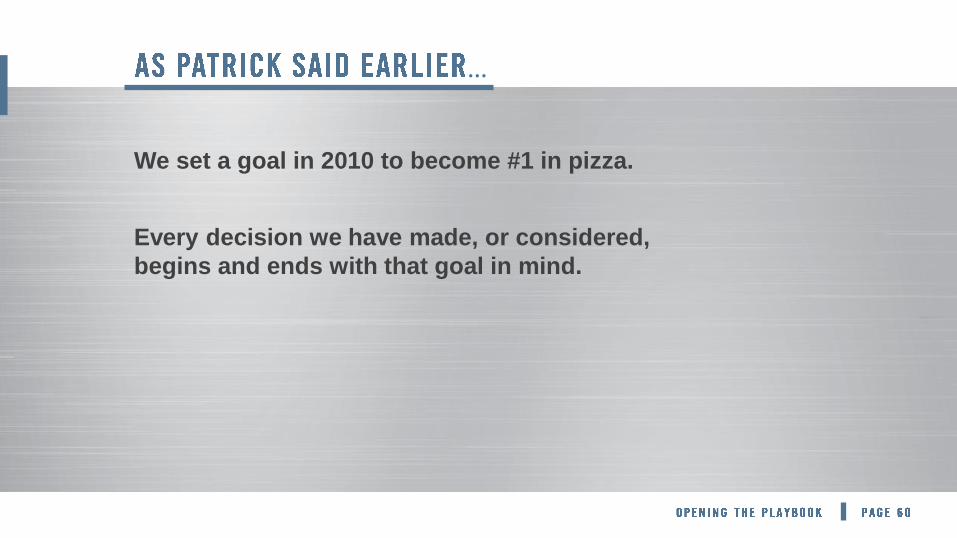
We set a goal in 2010 to become #1 in pizza.
Every decision we have made, or considered,
begins and ends with that goal in mind.
#
#1 for customers
AND
#1 for franchisees
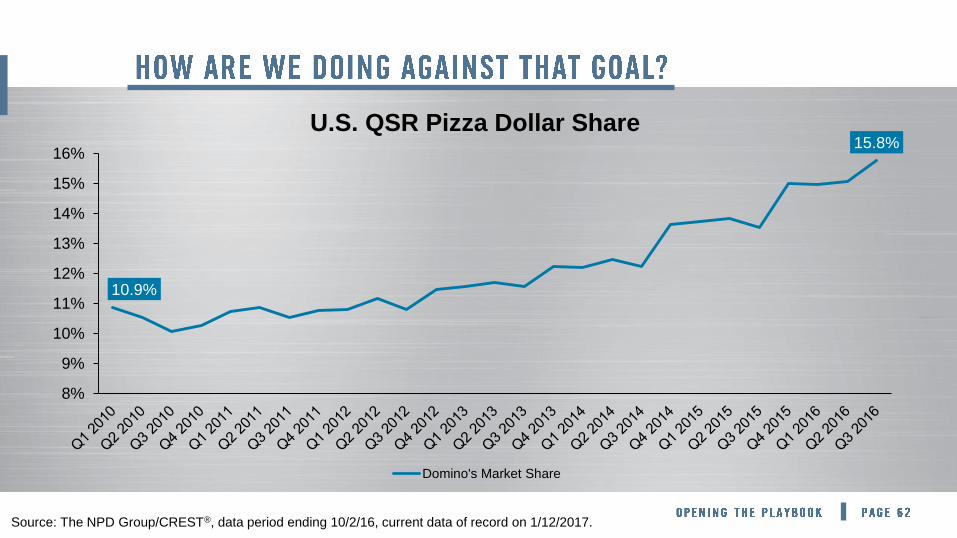
Source: The NPD Group/CREST®, data period ending 10/2/16, current data of record on 1/12/2017.
10.9%
15.8%
8%
9%
10%
11%
12%
13%
14%
15%
16%
U.S. QSR Pizza Dollar Share
Domino's Market Share

We think so!
#
#
=/

#
=
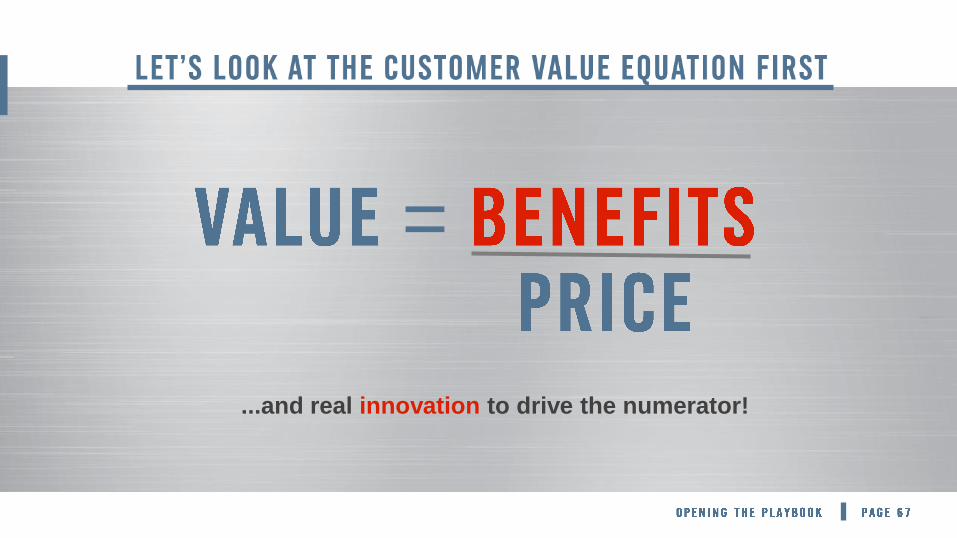
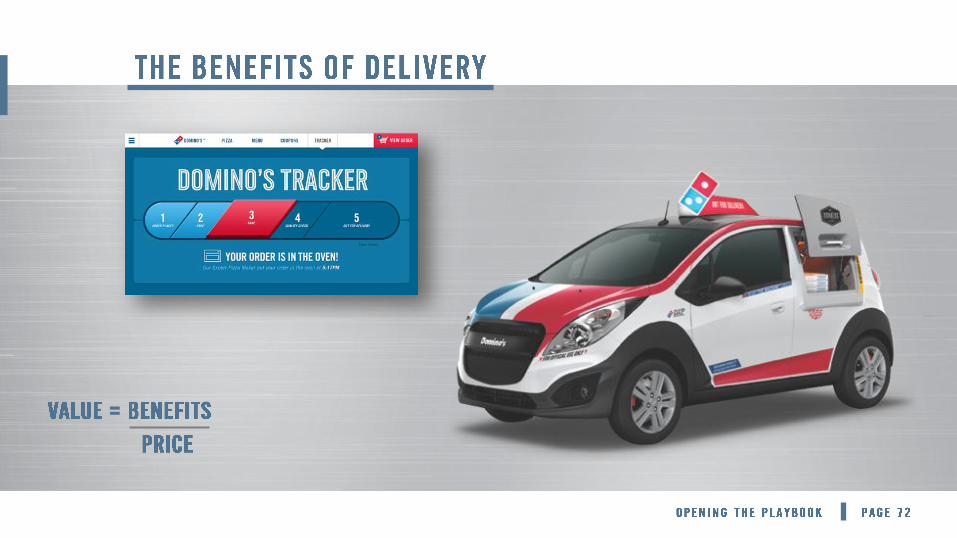
…This equation works with customers and franchisees.
=
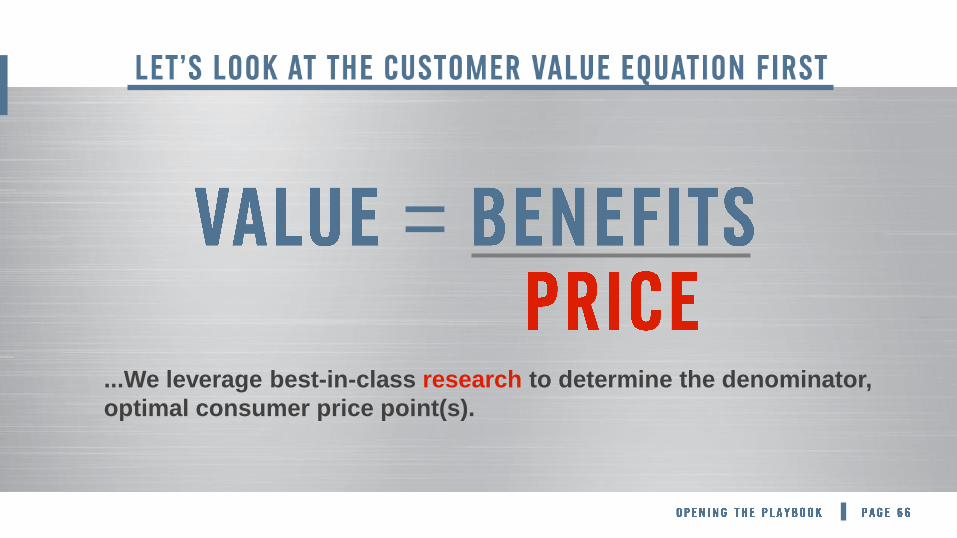
...We leverage best-in-class research to determine the denominator,
optimal consumer price point(s).
=
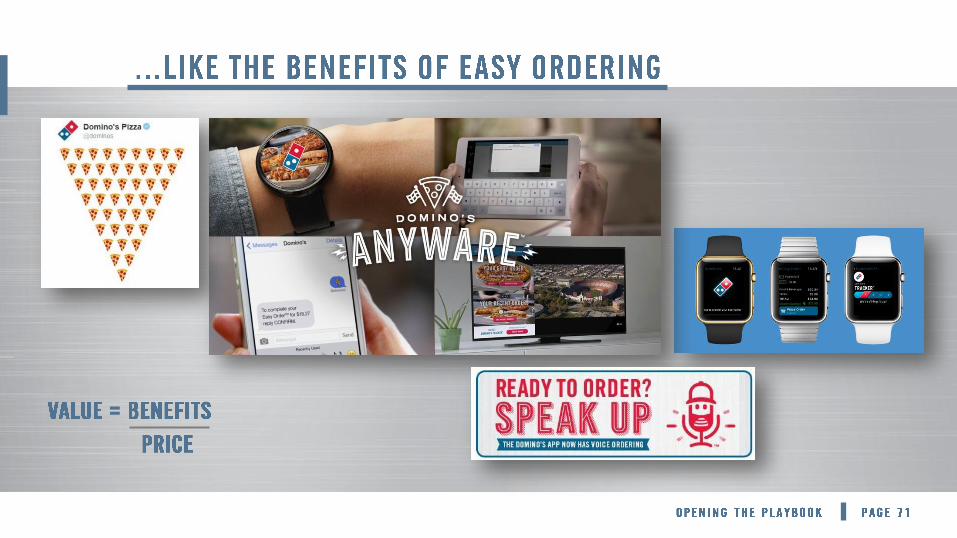
...and real innovation to drive the numerator!
=

...all of these are sustainable product platforms!
=
=
=

=
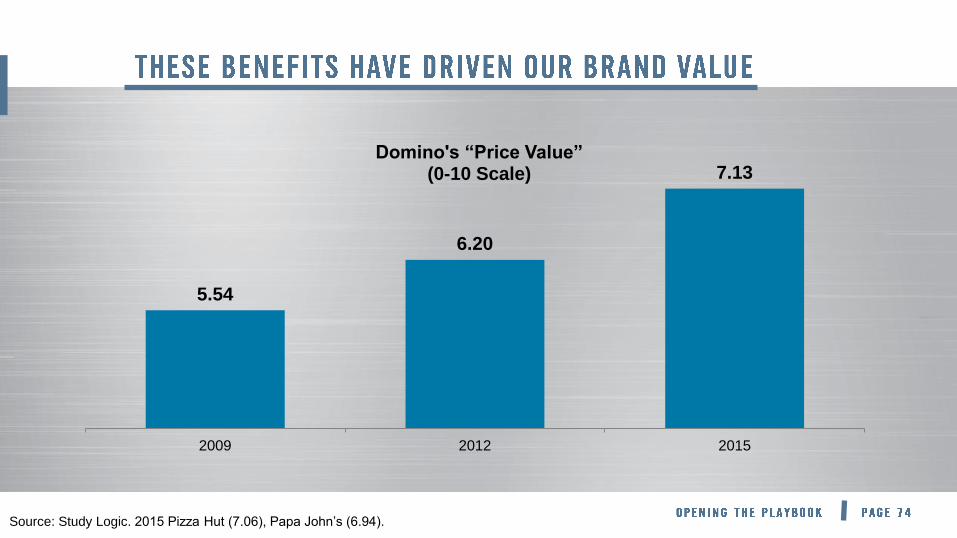
5.54
6.20
7.13
2009 2012 2015
Domino's “Price Value” (0-10 Scale)
Source: Study Logic. 2015 Pizza Hut (7.06), Papa John’s (6.94).

=
...while the price of opening a Domino’s store has remained
relatively stable, the benefits of being a Domino’s franchisee
have increased.

0.0%
1.0%
2.0%
3.0%
4.0%
5.0%
6.0%
7.0%
8.0%
DPZ SBUX PNRA TBELL DNKN MCD WEN BK PHUT KFC
Top 10 QSR Brands Average Same Store Sales 2010 - Q3 2016
Source: Technomic Top 10 Public QSR Companies.
Comparable calendar quarters (SBUX).
Results: Company filings and Bloomberg.
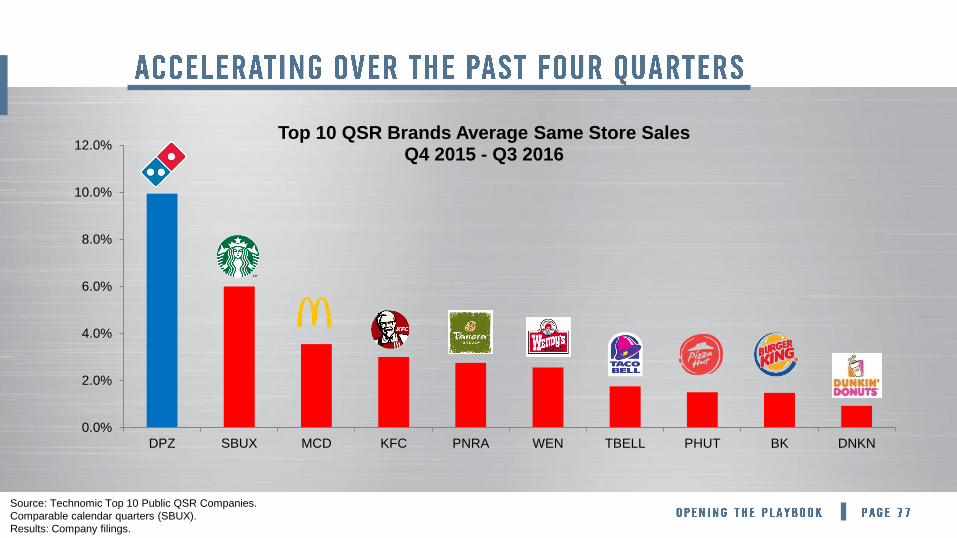
0.0%
2.0%
4.0%
6.0%
8.0%
10.0%
12.0%
DPZ SBUX MCD KFC PNRA WEN TBELL PHUT BK DNKN
Top 10 QSR Brands Average Same Store Sales Q4 2015 - Q3 2016
Source: Technomic Top 10 Public QSR Companies.
Comparable calendar quarters (SBUX).
Results: Company filings.

$130
$49
$61 $67 $70
$75 $82
$89
$126
$0
$20
$40
$60
$80
$100
$120
$140
2008 2009 2010 2011 2012 2013 2014 2015 2016 EST
Average Store Level EBITDA +
Note: EBITDA is an average of self-reported figures submitted by franchisees. 2016 is an estimate.
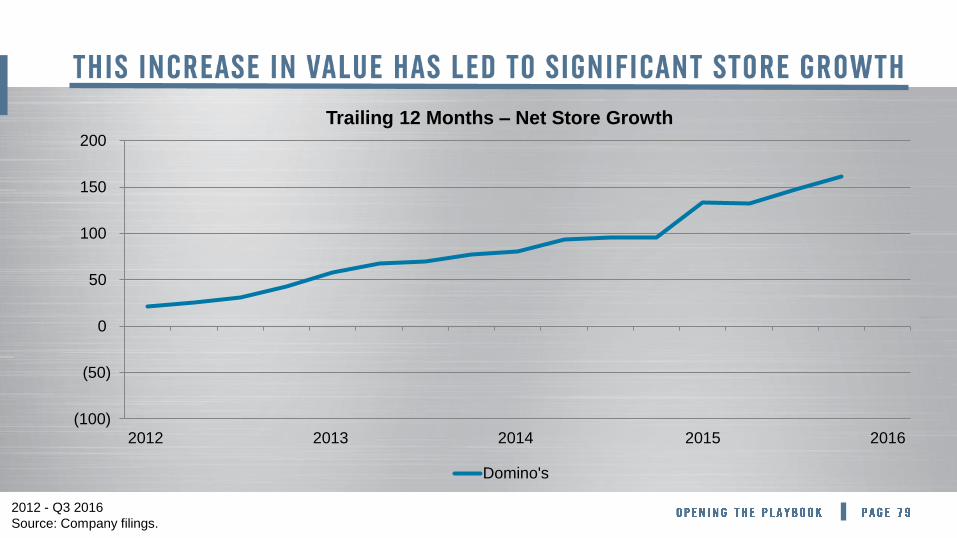
(100)
(50)
0
50
100
150
200
2012 2013 2014 2015 2016
Trailing 12 Months – Net Store Growth
Domino's
2012 - Q3 2016
Source: Company filings.
(100)
(50)
0
50
100
150
200
2012 2013 2014 2015 2016
Trailing 12 Months – Net Store Growth
Domino's Pizza Hut Papa John's
2012 - Q3 2016
Source: Company filings.
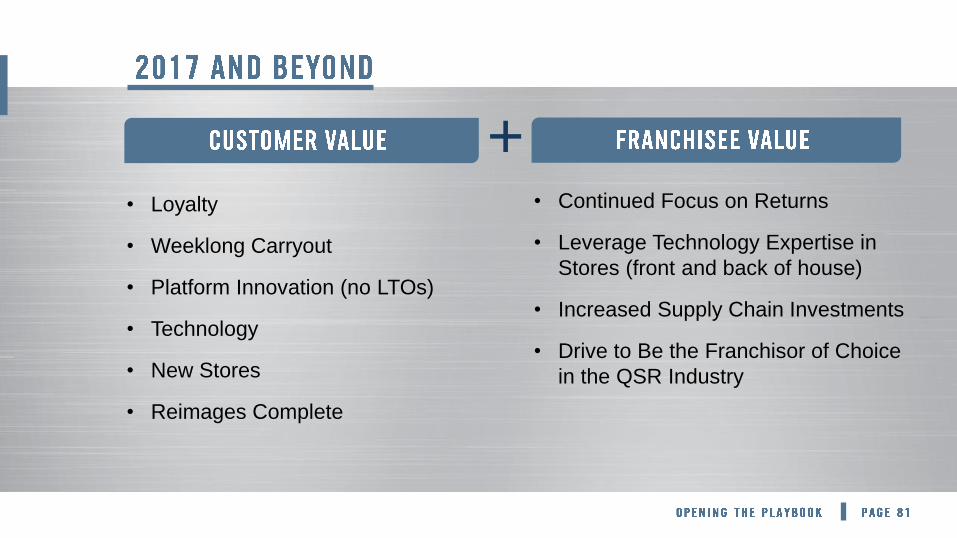
• Loyalty
• Weeklong Carryout
• Platform Innovation (no LTOs)
• Technology
• New Stores
• Reimages Complete
• Continued Focus on Returns
• Leverage Technology Expertise in
Stores (front and back of house)
• Increased Supply Chain Investments
• Drive to Be the Franchisor of Choice
in the QSR Industry
+


/

RECAP OF
RECENT RESULTS
- Comps and Unit Growth
- Bottom Line Results
BUSINESS
OUTLOOK LOOKING AHEAD
TO 2017
- Investing to Win
- Commodities and FX Outlook
- Balance Sheet Update
- Industry Outlook
- DPZ Outlook
,
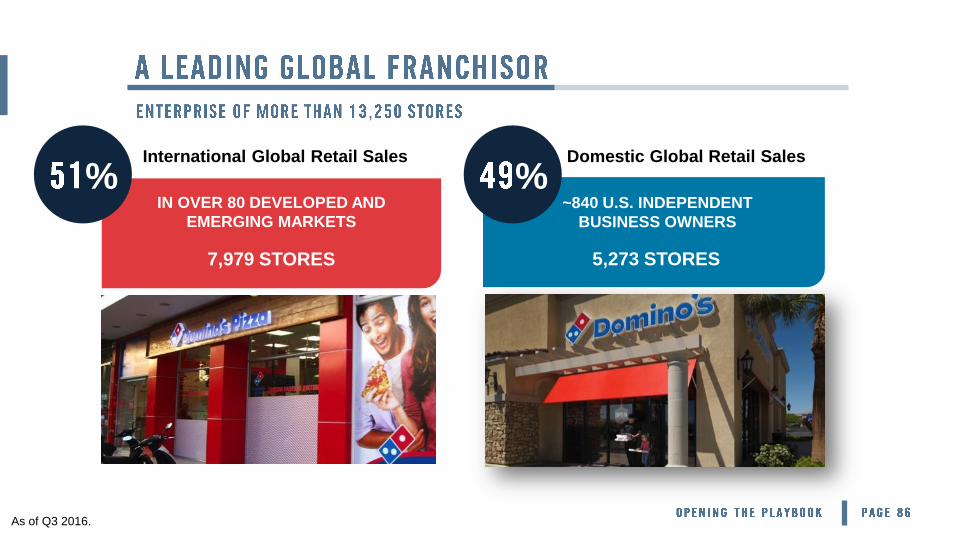
International Global Retail Sales
IN OVER 80 DEVELOPED AND
EMERGING MARKETS
7,979 STORES
~840 U.S. INDEPENDENT
BUSINESS OWNERS
5,273 STORES
As of Q3 2016.
% % Domestic Global Retail Sales
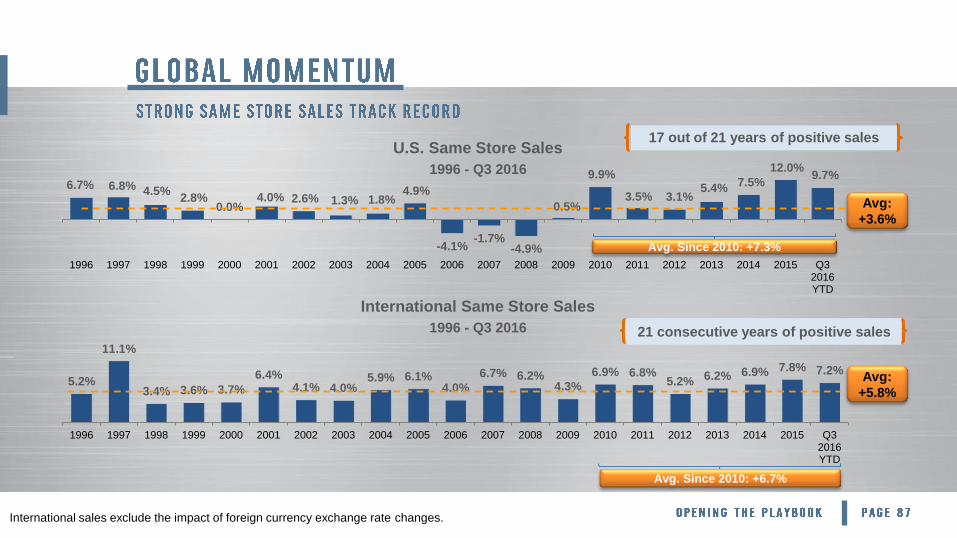
International sales exclude the impact of foreign currency exchange rate changes.
6.7% 6.8% 4.5% 2.8%
0.0% 4.0% 2.6% 1.3% 1.8%
4.9%
-4.1% -1.7%
-4.9%
0.5%
9.9%
3.5% 3.1% 5.4%
7.5%
12.0% 9.7%
1996 1997 1998 1999 2000 2001 2002 2003 2004 2005 2006 2007 2008 2009 2010 2011 2012 2013 2014 2015 Q32016YTD
Avg:
+3.6%
5.2%
11.1%
3.4% 3.6% 3.7%
6.4% 4.1% 4.0%
5.9% 6.1% 4.0%
6.7% 6.2% 4.3%
6.9% 6.8% 5.2% 6.2% 6.9% 7.8% 7.2%
1996 1997 1998 1999 2000 2001 2002 2003 2004 2005 2006 2007 2008 2009 2010 2011 2012 2013 2014 2015 Q32016YTD
Avg:
+5.8%
17 out of 21 years of positive sales U.S. Same Store Sales
1996 - Q3 2016
21 consecutive years of positive sales
International Same Store Sales
1996 - Q3 2016
Avg. Since 2010: +7.3%
Avg. Since 2010: +6.7%

9,351 9,742 10,255
10,886 11,629
12,530 13,252
2010 2011 2012 2013 2014 2015 Q3 2016
Q3 2016 TTM Net
Growth = 1,133
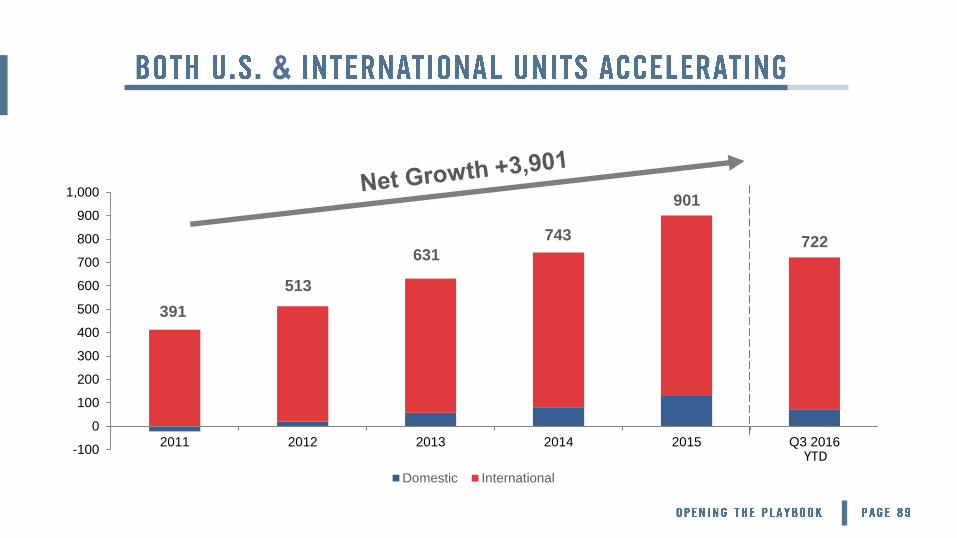
-100
0
100
200
300
400
500
600
700
800
900
1,000
2011 2012 2013 2014 2015 Q3 2016
Domestic International
513
631 722
YTD
. . &
391
743
901

Note: 2015 has been adjusted to only include 52 weeks.
11%
7%
8%
11%
8%
11%
2011 2012 2013 2014 2015 Q3 YTD 2016Q3 2016 YTD
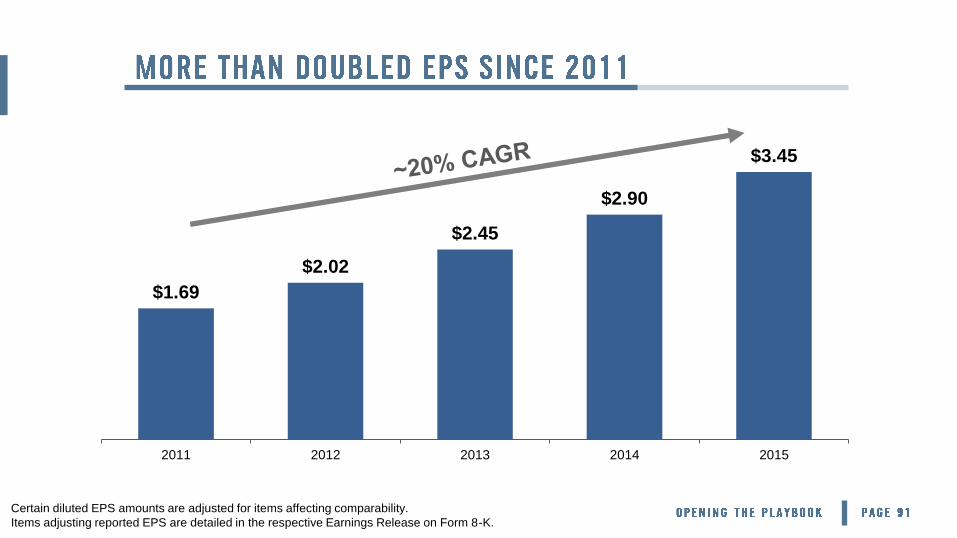
Certain diluted EPS amounts are adjusted for items affecting comparability.
Items adjusting reported EPS are detailed in the respective Earnings Release on Form 8-K.
$1.69
$2.02
$2.45
$2.90
$3.45
2011 2012 2013 2014 2015
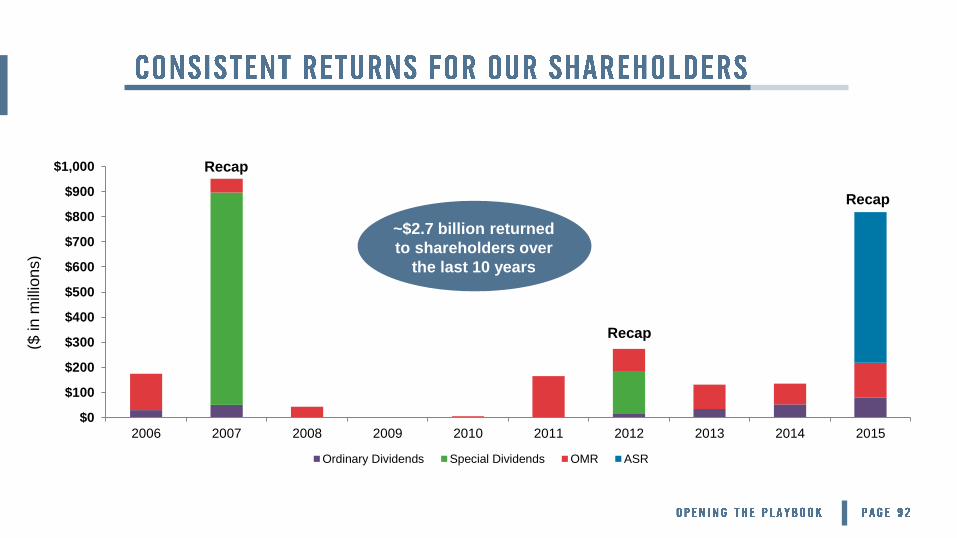
$0
$100
$200
$300
$400
$500
$600
$700
$800
$900
$1,000
2006 2007 2008 2009 2010 2011 2012 2013 2014 2015
Ordinary Dividends Special Dividends OMR ASR
($ in m
illio
ns)
Recap
Recap
Recap
~$2.7 billion returned
to shareholders over
the last 10 years
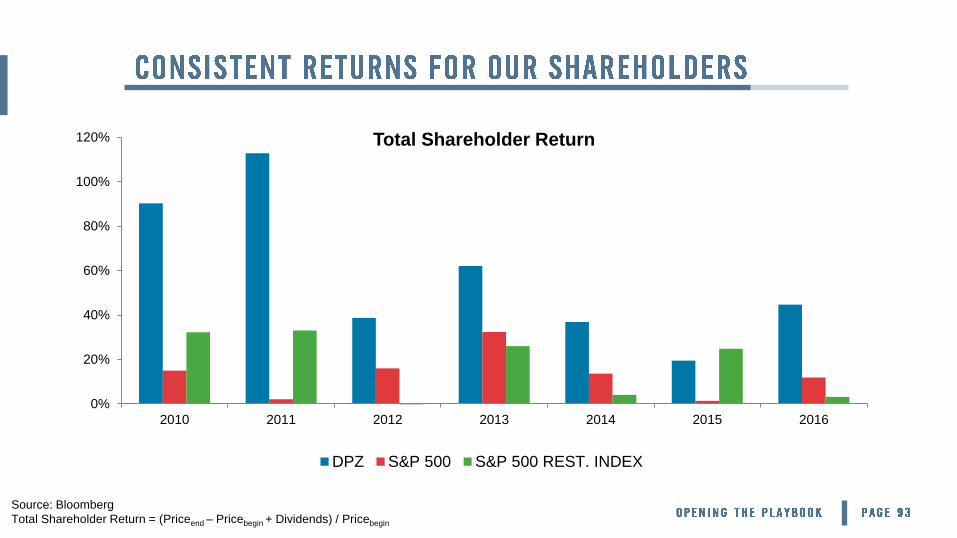
Source: Bloomberg
Total Shareholder Return = (Priceend – Pricebegin + Dividends) / Pricebegin
0%
20%
40%
60%
80%
100%
120%
2010 2011 2012 2013 2014 2015 2016
Total Shareholder Return
DPZ S&P 500 S&P 500 REST. INDEX

RECAP OF
RECENT RESULTS
- Comps and Unit Growth
- Bottom Line Results
BUSINESS
OUTLOOK LOOKING AHEAD
TO 2017
- Investing to Win
- Commodities and FX Outlook
- Balance Sheet Update
- Industry Outlook
- DPZ Outlook
• Projected 2017 Gross G&A of ~$340-$345 million
- Includes increased investments in technology (including depreciation),
supply chain, marketing and teams
- Can flex significantly with performance and strategic opportunities
• Projected 2017 CapEx of ~$75 million
- Technology remains priority
• Digital dominance
• POS reinvestment
- Supply chain investments to support growth
- Willing to invest above this estimate for strategic opportunities

. .
Current U.S. store food basket
outlook is projected to be flat to
+2% vs. 2016 levels
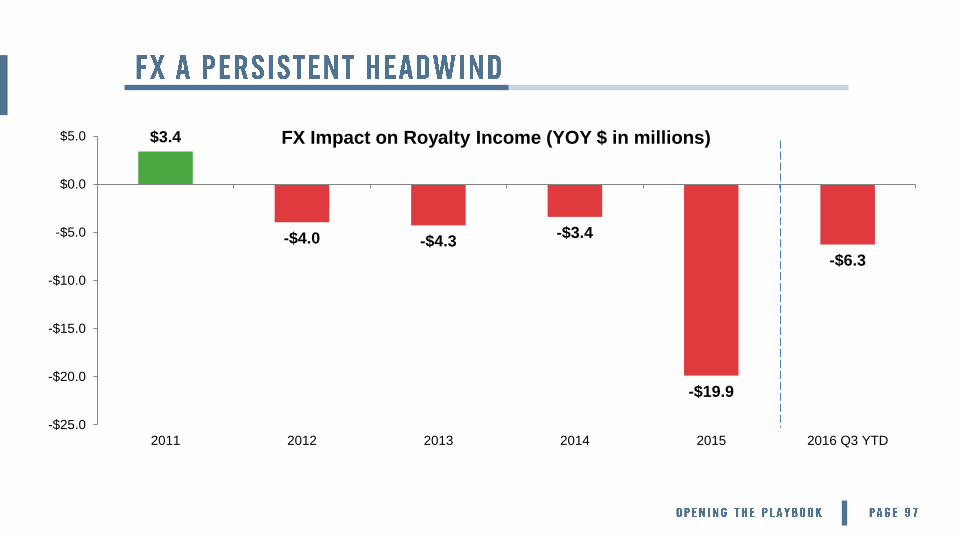
$3.4
-$4.0 -$4.3 -$3.4
-$19.9
-$6.3
-$25.0
-$20.0
-$15.0
-$10.0
-$5.0
$0.0
$5.0
2011 2012 2013 2014 2015 2016 Q3 YTD
FX Impact on Royalty Income (YOY $ in millions)
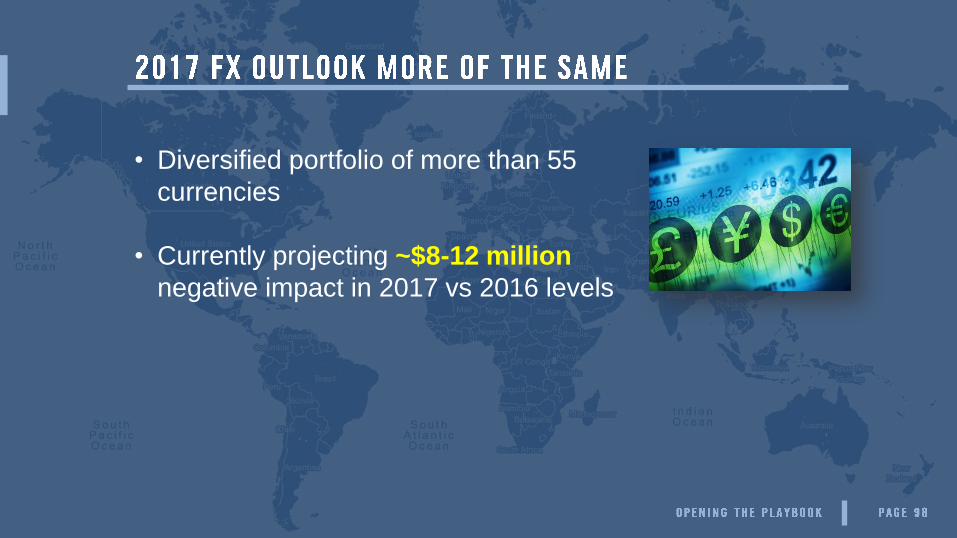
• Diversified portfolio of more than 55
currencies
• Currently projecting ~$8-12 million
negative impact in 2017 vs 2016 levels
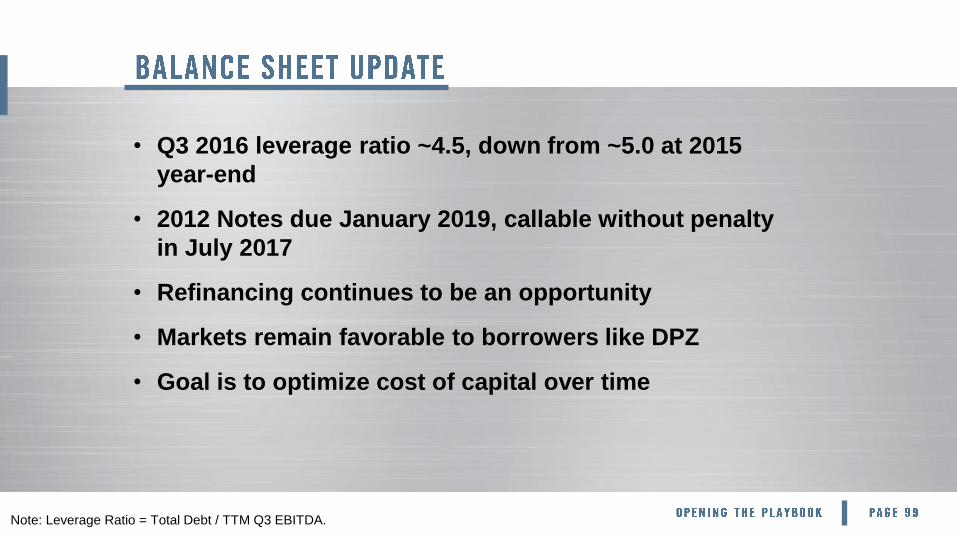
• Q3 2016 leverage ratio ~4.5, down from ~5.0 at 2015
year-end
• 2012 Notes due January 2019, callable without penalty
in July 2017
• Refinancing continues to be an opportunity
• Markets remain favorable to borrowers like DPZ
• Goal is to optimize cost of capital over time
Note: Leverage Ratio = Total Debt / TTM Q3 EBITDA.

- &
• Beginning in Q1 2017, tax impact from equity-based
compensation to be recorded directly on P&L
- GAAP requirement
- Has been, and will continue to be, recorded in the cash flow statement
• Will have a positive (i.e. lower) impact on GAAP income tax
provision and tax rate
• Cash and economics haven’t changed…only the GAAP
treatment
• Expect significant and ongoing volatility in reported GAAP
taxes and EPS
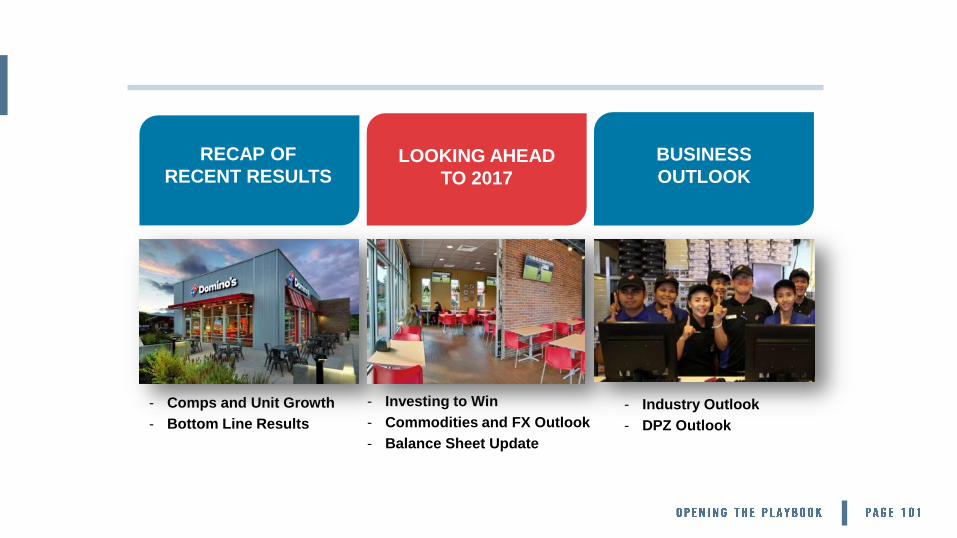
RECAP OF
RECENT RESULTS
- Comps and Unit Growth
- Bottom Line Results
BUSINESS
OUTLOOK LOOKING AHEAD
TO 2017
- Investing to Win
- Commodities and FX Outlook
- Balance Sheet Update
- Industry Outlook
- DPZ Outlook
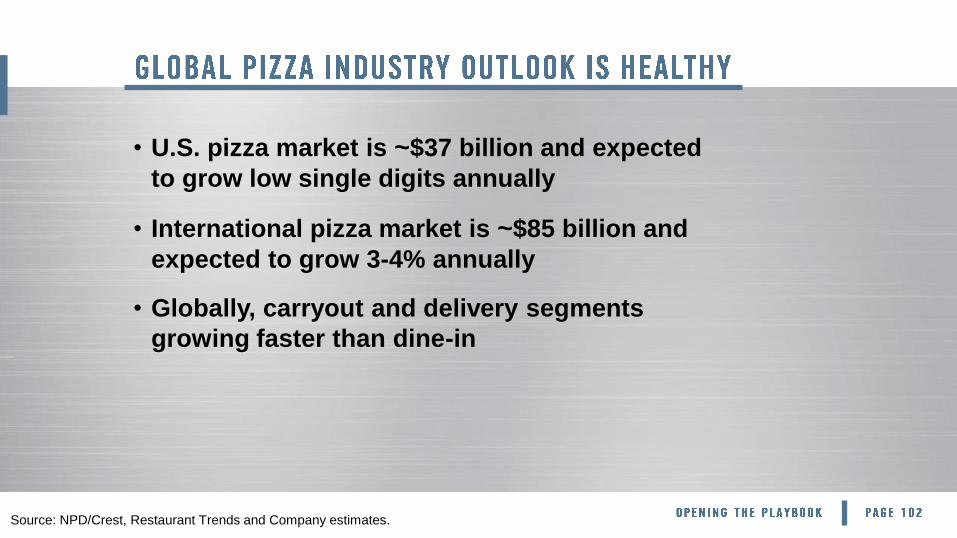
• U.S. pizza market is ~$37 billion and expected
to grow low single digits annually
• International pizza market is ~$85 billion and
expected to grow 3-4% annually
• Globally, carryout and delivery segments
growing faster than dine-in
Source: NPD/Crest, Restaurant Trends and Company estimates.
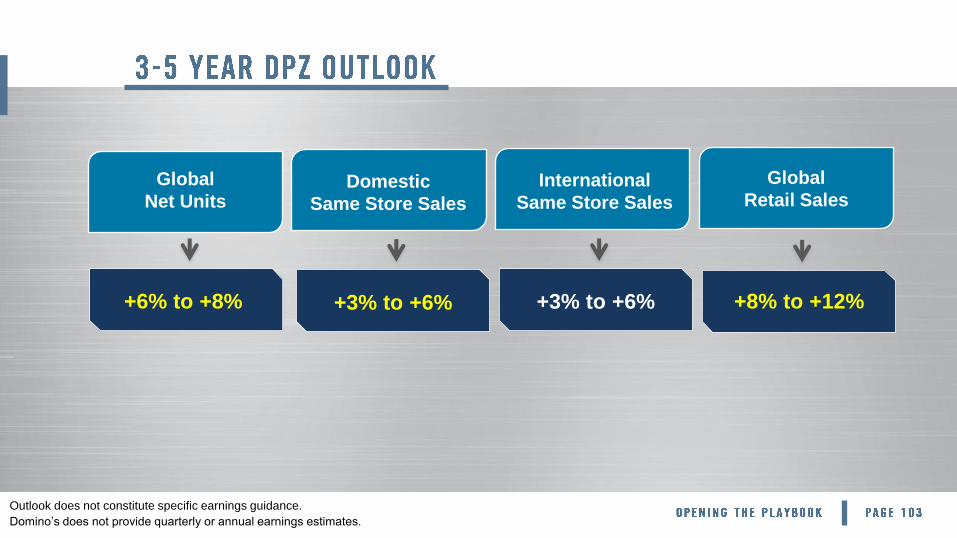
Outlook does not constitute specific earnings guidance.
Domino’s does not provide quarterly or annual earnings estimates.
Global
Net Units Domestic
Same Store Sales
International
Same Store Sales
Global
Retail Sales
+6% to +8%
+3% to +6%
+3% to +6%
+8% to +12%