accountability and performance of government agencies in
TRANSCRIPT

Accountability and Performance of Government Agencies in the Delivery of Water,
Education and Road Services in Nigeria
By:
Nigerian Institute of Social and Economic Research
(NISER)
October 2012

This report was produced in the context of a Global Research Project, ‘Varieties of Governance: Effective Public Service Delivery’, generously supported by the UK Government through the Partnership for African Social and Governance Research (PASGR). The views herein are those of the author(s), and do not necessarily represent those of PASGR. For any inquiries, contact: Nigerian Institute of Social and Economic Research (NISER) P. M. B. 5, U. I. Post Office, Oyo Road, Ibadan, Nigeria Email: [email protected] or [email protected] Website: http://www.niseronline.org/
Research Team Members
Aderibigbe S. Olomola Anthonia T. Simbine Audu Wadinga Ademola Adeagbo

Accountability and Performance of Government Agencies in the Delivery of Water, Education and Road Services in Nigeria
3
Table of Contents
Acronyms ....................................................................................................................................................... 5 Executive Summary ....................................................................................................................................... 6 1. Introduction ............................................................................................................................................. 11 1.1 The Problem Setting .............................................................................................................................. 13 1.2 Objectives .............................................................................................................................................. 14 1.3 Hypotheses ............................................................................................................................................ 15 2. Background of Country and Sector context ............................................................................................ 15 Figure 1: Map of Nigeria showing the 36 States and the Federal Capital City, Abuja) ............................... 15 The Education Sector .................................................................................................................................. 16 Road Sector ................................................................................................................................................. 17 The Water Sector ......................................................................................................................................... 17 3. Conceptual Framework and Literature Review: Governance of Effective Public Services Provision .... 18 3.1 Governance on the Supply Side ............................................................................................................ 18 3.2 Governance on the Demand Side ......................................................................................................... 20 4. Methodology ........................................................................................................................................... 22 4.1 Analytical Techniques ............................................................................................................................ 22 4.1.1 Determinants of Governance in Service Delivery ............................................................................... 23 4.1.2 Effects of Governance on Service Delivery ........................................................................................ 24 4.2 Data Collection ...................................................................................................................................... 26 Primary Data for the Education Sector ........................................................................................................ 27 Primary Data for Rural Road Construction/Maintenance ............................................................................ 27 Primary Data for the Water Sector .............................................................................................................. 28 5. Presentation of Analysis ......................................................................................................................... 28 5.1 Nature and Effectiveness of Government Channels for delivering public services. .............................. 28 5.1.1 Effectiveness of Government Channels for Delivering Education Services ....................................... 28 5.1.2 Effectiveness of Government Channels for Delivering Water Services ............................................. 30 5.1.3 Effectiveness of Government Channels for Delivering Rural Feeder Roads ..................................... 31 5.2 Governance Mechanisms and Quality Service Delivery ...................................................................... 32 5.2.1 Accountability mechanisms and Education Service Delivery ............................................................ 32 5.2.1.1 Effects of Participation on Education Service Delivery ................................................................... 32 5.2.2 Accountability Mechanisms and Water Service Delivery ................................................................... 33 5.2.2.1 Effects of Governance Mechanisms on Water Service Delivery ..................................................... 35 5.2.3 Accountability Mechanisms and Quality of Road Service Delivery .................................................... 37 5.3 Sectoral Differences and Other Factors Influencing Governance Mechanisms ................................... 39 5.3.1 Factors Influencing Governance Mechanisms - Accountability and Participation in Education Service
Delivery ................................................................................................................................................. 39 5.3.1.1 Factors Influencing Participation and Accountability in Education Service Delivery in Nigeria ...... 40 5.3.2 Effects of Channel Differences and Other Factors on Accountability and Participation in Water
Service Delivery .................................................................................................................................... 42 5.3.2.1 Factors Influencing Accountability and Participation in Water Service Delivery ............................. 42 5.4. Rural-Urban Split in Accountability of Public Service Delivery ............................................................ 45 5.4.1 Geographical Differences in Accountability of Education Service Delivery ....................................... 45 5.4.2 Geographical Differences in Accountability of Water Service Delivery .............................................. 46 6. Summary of Key Findings, Policy Implications and Conclusions ........................................................... 48 6.1 Summary of Key Findings ..................................................................................................................... 48 6.1.1 Findings in Respect of Education Service Delivery ............................................................................ 48 6.1.2 Findings in Respect of Water Service Delivery .................................................................................. 49 6.1.3 Findings in Respect of Road Provision .............................................................................................. 50 6.2 Policy Implications and Recommendations ........................................................................................... 51 6.2.1 Policy Recommendations for Improved Education Service Delivery ................................................. 51
Accountability and Performance of Government Agencies in the Delivery of Water, Education and Road Services in Nigeria
4
6.2.2 Policy Recommendations for Improved Water Service Delivery ........................................................ 52 6.2.3 Policy Recommendations for Improved Road Provision .................................................................... 52 6.3 Conclusions ........................................................................................................................................... 53 References .................................................................................................................................................. 55 Appendix I: Tables ....................................................................................................................................... 57 Table 5.1.1: Effectiveness of Delivery of Water Services in Nigeria ........................................................... 57 Table 5.2.1: Estimated Regression Model of Effects of Participation on Students’ Performance ............... 57 Table 5.2.2: Assessment of Accountability Mechanisms ............................................................................ 58 Table 5.2.3: Estimated Probit Model of Effects of Governance on Water Supply ....................................... 58 Table 5.2.4: Marginal Effects of the Variables in the Water Availability Probit Model ................................. 59 Table 5.3: Alternative Channels of Public Service Delivery in Nigeria ........................................................ 59 Table 5.3.1: Estimated Probit Model of Determinants of Participation in Education Sector ....................... 60 Table 5.3.2: Marginal Effects of Variables in the Education Sector Participation Probit Model .................. 60 Table 5.3.3: Estimated Probit Model of Determinants of Accountability in Education Sector ..................... 61 Table 5.3.4: Marginal Effects of Variables in the Education Sector Accountability Probit Model................ 61 Table 5.3.5 Estimated Probit Model of Determinants of Participation in Water Sector ............................... 62 Table 5.3.6: Marginal Effects of Variables in the Water Sector Participation Probit Model ........................ 62 Table 5.3.7: Estimated Probit Model of Determinants of Accountability in Water Sector ........................... 63 Table 5.3.8: Marginal Effects of Variables in Water Sector Accountability Probit Model ............................ 63 Table 5.4: Rural-Urban Split in Accountability of Water Service Delivery ................................................... 64 Appendix II: Figures ..................................................................................................................................... 65 Figure 5.1: Proportion of Respondents That Claimed Availability of Teachers ........................................... 65 Figure 5.2: Proportion of Respondents That Claimed Adequacy of Classrooms ........................................ 65 Figure 5.3: Proportion of Respondents That Claimed Accessibility of Education Projects ......................... 66 Figure 5.4: Proportion of Respondents That Claimed Affordability of Education Services ......................... 66 Figure 5.5: Proportion of Respondents That Claimed Access to Any Type of Information ......................... 67 Annex III : Questionnaire ............................................................................................................................. 68

Accountability and Performance of Government Agencies in the Delivery of Water, Education and Road Services in Nigeria
5
Acronyms
CGG Commission on Global Governance
CGS Conditional Grants Scheme
CSOs Civil Society Organizations
CTB Centralized Traditional Bureaucracy
DFFRI Directorate of Food, Roads and rural Infrastructure
FERMA Federal Road Maintenance Agency
FGDs Focus Group Discussions
FMARD Federal Ministry of Agriculture and Rural Development
FMW Federal Ministry of Works
FRN Federal Republic of Nigeria
GDN Global Development Network
GEP Girl-Child Education Project
IGPs Intergovernmental Partnerships
LEAs Local Education Authorities
LGAs Local Government Areas
MDAs Ministries, Departments and Agencies
MDGs Millennium Development Goals
NGOs Non-Governmental Organizations
NISER Nigerian Institute of Social and Economic Research
NUC National Universities Commission
NWRI National water Resources Institute
OECD Organization for Economic Co-operation and Development
PTA Parent-Teachers Association
RAMP Rural Access and Mobility Project
RBDAs River Basin Development Authorities
RUWASSA Rural Water Supply and Sanitation Agencies
SBMCs School Based management Committees
STU Small Town Unit
SUBEB State Universal Basic Education Board
SWAs State Water Agencies
UBEC Universal basic Education Commission
UK United Kingdom
WASHCOM Water, Sanitation and Hygiene Committee
WCA Water Consumers Association

Accountability and Performance of Government Agencies in the Delivery of Water, Education and Road Services in Nigeria
6
Executive Summary
Public service delivery in Nigeria is bedevilled with governance crisis especially in the
education, water and road sectors in spite of alternative channels being developed to deliver
services for the achievement of the Millennium Development Goals (MDGs). Have the
alternative channels being employed proved to be effective and better channels of service
delivery? Have the service delivery systems been accountable and participatory? What
factors account for the emerging performance? What are the effects of the governance
mechanisms on outcome in the various sectors? In unravelling these issues it was
hypothesized that accountability and participation in service delivery have significant effects
on output, that these governance indicators are significantly influenced by the socio-
economic characteristics of the beneficiaries and channels of service delivery and that
performance of service delivery is significantly affected by geographical location and regional
characteristics. The study made use of secondary data obtained from relevant agencies in
Abuja and the 12 states covered as well as primary data obtained from an extensive survey
of facilities and beneficiaries. In what follows we present the summary of the results of the
qualitative and quantitative analysis of the data.
Governance and Service Delivery Performance in the Water Sector
Intergovernmental partnerships (IGPs) and centralized traditional bureaucracy (CTB) are the
channels through which water services are delivered as part of the efforts to achieve the
MDGs in Nigeria. The IGP has a better performance in terms of participation and
accountability. The channel has a framework for involving beneficiaries in needs
assessment, choice of locations of water projects and in the operation and management of
water facilities. With respect to accountability, though the performance of the two channels
is not impressive, the IGP channel nevertheless has an edge over that of the CTB. Higher
proportion of IGP beneficiaries claimed access to any type of information on water facilities
in their communities, compared to the CTB beneficiaries.
With respect to the performance of water facilities such as water availability all year
round, accessibility to beneficiaries’ residences, affordability of water and water adequacy,
majority of the beneficiaries of the two channels expressed satisfaction but generally the IGP
channel has a slight edge over that of CTB.
Determinants and Effects of Governance on Water Service Delivery
We examined the extent to which household and community characteristics influence the
governance of water services in the country focusing on indicators such as participation and
accountability. We found that participation depends on household and community
characteristics such as educational attainment, income, geographical domain as well as

Accountability and Performance of Government Agencies in the Delivery of Water, Education and Road Services in Nigeria
7
channel of service delivery and geo-political zones. We accept the hypothesis that
participation is significantly influenced by the socio-economic characteristics (income and
educational attainment) of the beneficiaries and channels of service delivery. With rising
income and educational attainment the probability in water service delivery may reduce. The
probability of participation is significantly higher in the rural than urban areas. And it is also
higher in the case of IGP than CTB. We also accept the hypothesis that socio-economic
characteristics (household size, income and educational attainment) of the beneficiaries are
significant determinants of accountability. Accountability is unlikely to change significantly
irrespective of the channel adopted in providing water for the communities. The results
show that where poverty is endemic, citizens may not be capable of holding service
providers and government officials accountable. A critical level of empowerment (in terms of
income) is required before citizens can exercise their rights even when they have a clear
understanding of such rights.
As regards the effect of governance attention is focussed on water availability. We
reject the hypothesis that participation in water service delivery has significant effect on
output whereas in the case of accountability the hypothesis is accepted. We found that with
rising awareness and increased accountability there is the tendency that the projects
implemented will guarantee water availability all the year round; with a higher probability in
the urban than rural areas. Overall, for these two governance indicators, the probability of
all-season availability of water is apt to increase by 11.8 and 11.7 percent respectively.
Governance and Service Delivery in the Education Sector
The channel for education service delivery for the achievement of the MDGs is through
intergovernmental partnerships exemplified by the creation of the Universal Basic Education
Commission (UBEC) and its partnership with State Universal Basic Education Board
(SUBEB) in all the 36 states of the federation. A major institutional change is the
introduction of School Based Management Committees to foster community participation in
the management of primary schools across the country. Nonetheless, the analysis of the
governance practices show there is considerable room for improvement. Less than half of
the respondents claim that they participate in the execution of education projects
implemented by SUBEB. The reason for non-participation in education projects is lack of
participation opportunity or lack of awareness of such projects.
The education projects implemented by SUBEB have certainly improved access to
education services as claimed by most respondent beneficiaries. They also consider the
quality of the entire education project environment as good. However, teachers and
classrooms remain grossly inadequate. By and large it can be concluded that the

Accountability and Performance of Government Agencies in the Delivery of Water, Education and Road Services in Nigeria
8
governance of service delivery has been relatively effective resulting in positive changes in
availability, access, affordability and quality.
Determinants and Effects of Governance on Education Service Delivery
The extent to which household and community characteristics influence the governance of
education services at the primary school level was analysed focusing on such indicators as
participation and accountability. The results show that participation depends on income,
educational attainment and geo-political zones and that the probability that beneficiaries will
participate does not differ between rural and urban areas. As regards education and
income, the analysis reveals that the higher the income and educational attainment of the
community members, the lower the probability of participating in the delivery of education
services. This is a reflection of poor governance in the education sector and it is an
indication that despite the activities of UBEC and SUBEB the crisis of governance in terms of
lopsided participation of the citizens in the implementation of service delivery projects
remains unresolved.
With regard to accountability, the results indicate that the opportunity to make
complaints against violation of preferences in decisions regarding the allocation of
resources, choice of location of education facilities and management of resources and
secure appropriate response depend mainly on the age and income of the beneficiaries and
the household size. The result indicates that older citizens are not likely to enforce
accountability compared to younger members of the community. Moreover, we found that
there is no significant difference in accountability between rural and urban areas as far as
education service delivery is concerned. Thus, we reject the hypothesis that participation
and accountability are significantly affected by geographical location. On the other hand, we
accept the hypothesis that participation and accountability are significantly affected by socio-
economic characteristics.
With regard to the hypothesis that governance has significant effects on education
service delivery, the results depend on the type of output and governance indicators. We
focus on such outcomes as students’ performance and adequacy of classrooms. We reject
the hypothesis in the case of participation and accept it with regard to accountability. The
key finding here is that students’ performance has not been significantly affected by
participation of community members in the management of the schools. The main
determinants are the number of teachers and geo-political zones. In the case of classroom
adequacy, the results show that there is no significant difference between rural and urban
areas and is not affected by participation of community members in the management of the
schools. Classroom adequacy is significantly influenced by awareness of rights and
responsibilities by stakeholders, accountability and regional characteristics.

Accountability and Performance of Government Agencies in the Delivery of Water, Education and Road Services in Nigeria
9
Governance Practices in Road Service Delivery
The identified channel for the provision of rural roads in the country is the centralized
traditional bureaucracy in which an agency of the Federal Government (Federal Ministry of
Agriculture and Rural Development - FMARD) is charged with the control of the services
rendered. There are two variants of this approach namely; (i) rural roads implemented by
the FMARD with funds provided by the MDGs Office, (ii) rural roads implemented by FMARD
using Constituency Funds appropriated by Members of the National Assembly (Constituency
Project). The mechanisms for service delivery under this bureaucratic approach failed to
recognize the need for participation of community members in project design,
implementation and road maintenance. Results suggest that needs assessment, project
location, costing and implementation have followed improper procedures. With regard to the
constituency roads, the politicians determined the location of the road projects based on
political considerations with minimal participation of beneficiary community members.
Another governance indicator considered is accountability which is grossly
undermined in the two variants of centralized traditional bureaucracy approach adopted in
the delivery of road services. State Coordinators of Federal Department of Rural
Department explained that their roles became ineffective due to lack of funds and logistics.
Moreover, the stage by stage supervision and monitoring reports sent to their Head Office in
Abuja received no feedbacks, which rendered them powerless with regard to enforcement of
rules and sanctions that would have ensured good performance by contractors. These
shortcomings were the same for MDGs and the Constituency funded road projects.
Service Delivery Performance in the Road Sector
We found that the supervisory roles played by the State Coordinators were of little or no
effect in ensuring that the road projects were timely completed and to specifications. As a
result, performance by the contractors with regard to both the Constituency and MDG funded
roads were generally poor. Besides, physical inspection of the completed and uncompleted
MDG and Constituency funded roads indicated they were in very poor conditions, a problem
compounded by the use of laterite for surfacing the roads. Indeed, the fact that rural feeder
roads were by design surfaced with laterite, will make them not to be cost effective, as the
surface materials are easily washed away by a single heavy rain. As a result, the roads are
not effectively utilised during rainy season on account of their poor quality. In terms of
accessibility, however, we found that rural road rehabilitation actually opened up rural
communities and that affordability of cost of rural transportation was enhanced at the initial
stages of road rehabilitation.

Accountability and Performance of Government Agencies in the Delivery of Water, Education and Road Services in Nigeria
10
By and large, despite the acclaimed crucial roles played by road transport in
enhancing the attainment of the MDGs, service delivery in the sector has been highly
defective principally due to weak institutional structures, lack of coordination of efforts by the
three-tiers of government and relevant institutions, poor stewardship by public officials
arising from conflict of interest, as well as weak community participation.
Policy Implications and Conclusions
Effective delivery of services in the education, water and road sectors is critical for the
attainment of MDGs in Nigeria. Earmarking part of government revenue for this purpose is a
step in the right direction. Desirable results will be achieved however, only if there is an
overhaul of the governance mechanisms and delivery channels. An important policy lesson
emerging from this study is that service beneficiaries should always be aware of their rights
and responsibilities with regard to the provision of services in their communities.
Moreover, the emergence of inter-governmental partnership in water service delivery
has demonstrated that a decentralized governance system provides better results. It is
instructive therefore, to ensure that alternative channels for delivery of public services have a
framework for involving beneficiaries in needs assessment, choice of locations of projects
and in the operation and management of facilities. There is also the need for proper inter-
governmental coordination and economic empowerment of the beneficiaries to enable them
discharge their responsibilities creditably. Such a framework enhances accountability and
guarantees effective service delivery. It will also lead to an improvement in service delivery
performance in terms of increased availability, accessibility, quality and adequacy.
Finally, it is apt to point out that accountability and participation are necessary
conditions for improved delivery of public services and for good governance. However, they
need to be fostered in addition to other key elements of good governance including effective
budget process and timely release of funds in order to have any significant improvement in
public service delivery in the country.

Accountability and Performance of Government Agencies in the Delivery of Water, Education and Road Services in Nigeria
11
1. Introduction
This study examines different public service delivery channels which are associated with the
achievement of MDGs in three key sectors namely, education, water and transport (roads) in
Nigeria. Public services are being delivered through centralized traditional bureaucracy
(CTB) in which Ministries, Departments and Agencies (MDAs) are reformed to control the
provision of public services in these sectors. There are also other delivery approaches such
as creation of agencies (agencification) for better delivery of services and inter-governmental
partnerships (IGPs) for the provision of public services in which the Federal Government is
partnering with State Governments through the instrumentality of a conditional grant scheme
(CGS). There are growing concerns as to whether or not the country is making the required
progress to achieve the targets of the MDGs in spite of these initiatives which emerged since
early 2000s. This is the challenge of this study. The study is of interest because improving
service delivery to the poor is both a widespread political demand and key to the
achievement of the MDGs; and improving governance is integral to achieving these goals.
The study is further motivated by the need to strengthen transparency, participation and
accountability mechanisms in public service delivery to assist the marginalized poor and to
fully realize the desired development outcomes.
Public service delivery is critical to the attainment of the MDGs. A major challenge in
this regard is the improvement in the performance of the MDAs involved in the delivery of
required services and improved governance of the associated institutions. The MDAs are
used as institutions to turn resources into welfare outcomes and as vital links in the service
delivery chain. Inter-governmental collaboration in the delivery of public services was
initiated in 2007 to enhance the achievement of MDGs through the conditional grant
scheme. Has this proved to be a better channel of service delivery? Have the service
delivery systems (CTB and IGPs) been accountable? Which of the service delivery
approaches has been more effective and participatory? What factors account for the
emerging performance? The study places emphasis on the governance structures and
institutional changes that help policymakers, citizens, service providers, development
partners and other stakeholders to enhance the quality of public services and ultimately
improve their development outcomes.
Theoretically, incentives aimed at influencing the choice of effort exerted in a service
delivery system and the type of individuals attracted to specific tasks at different levels of the
service delivery hierarchy, are positively and significantly related to service delivery
outcomes especially in the education sector. Conditional on providers exerting effort and
being motivated, therefore, increasing resources can have beneficial effects. Thus, it is
necessary to strengthen the governance structures with proper decentralization and
delegation of power to ensure that those who have remit for public service delivery perform

Accountability and Performance of Government Agencies in the Delivery of Water, Education and Road Services in Nigeria
12
with utmost transparency and accountability right from the highest authority to the service
delivery unit. Adequate financing, infrastructure, human resources, material and equipment
have to be available for service delivery at the frontline, as well as proper institutions and
governance structure to provide adequate incentives to the service providers. The
availability of these essential elements and institutions are a function of the efficiency of the
entire service delivery system. Government at the upstream level sets overall policies,
allocates resources and designs rules and service providers’ incentive systems; service
providers’ behaviour downstream is conditioned by these sets of constraints and incentives
as well as rules determined locally; while citizens’ decisions are influenced by the choices
offered and the services’ characteristics. Accommodating these diverse interests within a
transparent process where each party can be held accountable for actions taken with high
compliance with rules and regulations in order to match service outcomes with the right
delivery options constitute good governance.
A key element in the design of the service delivery channels for the attainment of the
MDGs is decentralization of regulatory and administrative control from the Federal to lower
levels of government. A host of factors is likely to influence the performance of
decentralized public service delivery. These include fiscal aspects of decentralization,
transparency of government actions, citizen participation in public service delivery and other
factors. The level of awareness of citizens is critical in improving service delivery on account
of decentralization. Theoretically, the argument that decentralization improves resource
allocation, accountability and cost recovery relies heavily on the assumption that sub-
national governments have better information than the central government about the needs
and preferences of the local population, and that the population is more aware of actions of
sub-national governments than of the central government. However, whether sub-national
governments have information about the preferences of citizens depends critically on the
existence of mechanisms for the local population to participate in the delivery of public
services and have their voice heard in decision making. According to Azfar et al (1999),
citizen participation in service delivery facilitates information flows between the government
and local population and thereby reduces asymmetric information. It provides means for
demand revelation and helps the government to match the allocation of resources to user
preferences. Moreover, it can promote government accountability by increasing citizens’
awareness of actions of and control over sub-national governments.
As we examine the governance issues and performance of service delivery in the
education, road and water sectors, the various service delivery channels are characterized
along the aforementioned paradigmatic delineations for which there has been global
convergence over the years. For each sector, what public management or “governance”
practices are associated with public service delivery in Nigeria? (ii) What conditions affect

Accountability and Performance of Government Agencies in the Delivery of Water, Education and Road Services in Nigeria
13
service delivery performance? (iii) What are the effects of the “governance” practices on
service outcomes? The study proceeds in this manner with a view to determining which
channel delivers expected outcomes in a transparent and accountable manner in the interest
of the stakeholders. Furthermore, the issues of awareness, citizens’ participation are
analysed (qualitatively and quantitatively) and their effects on service delivery outcomes
determined. This enables us to ascertain the critical changes required in terms of
governance reforms and institutional re-engineering for effective delivery of public services in
the country.
1.1 The Problem Setting
As allocation of public spending is buoyed by the debt relief gains of 2005, there may not be
commensurate progress on the MDGs unless there is considerable improvement in the
governance of the delivery of associated public services. There is growing concern in the
country as to whether the goals will be achieved based on the myriad of problems
associated with the delivery of key services in critical sectors including education, water and
transport. Access to such services especially by the masses of the people is highly
restricted due to inadequate supply, high cost and dysfunctional governance structures.
With regard to education, services are delivered within a dysfunctional governance
and weak management environment especially at the primary school level where all the
three tiers of government in the country play considerable role. The education sector has
enormous needs for effective coordination arrangements. Evidence suggests that nine out
of 12 key management functions in the sector are concurrent, i.e. expected to be delivered
by more than one government level. Thus, the sector has enormous needs for effective
coordination arrangements. Another weakness of the current arrangements in education
relates to lack of clarity in the accountability framework. It is unclear which government level
is responsible for achieving key educational outcomes. There are also major concerns
about interactions between the Universal Basic Education Commission (UBEC), a federal
structure created to support primary education nationwide and state ministries of education.
There has been a common claim that instead of supporting state efforts to upgrade primary
education, UBEC has been trying to run the primary school network without showing much
interest in building state capacity to manage its primary education. This undermines longer-
term sustainability of the recent reform efforts (Freinkman, 2007).
In the water sector, the need for improvement of service delivery cannot be
overemphasized. About 58.9 percent of the Nigerian population had access to improved
water source as at 2009 down from 66.25 percent in 2003. Although the proportion of the
population using improved sanitation facility has been rising, it stood at 51.6 percent as at
2009 (FRN, MDGs Report 2010). Most consumers who receive piped water are supplied by

Accountability and Performance of Government Agencies in the Delivery of Water, Education and Road Services in Nigeria
14
state water corporations, all of which are currently owned by the governments of the states
within which they operate. All three government levels (Federal, State and Local) have been
engaged in uncoordinated activity to provide water and this frequently resulted in duplication
of efforts. At the same time, there has not been much interest in the development of local
water systems. In the transport sector, the involvement of multiple agencies in the
enforcement of road transport regulations result in high transactions costs. Besides,
inadequate road and poor initial construction and design have tended to shorten the useful
life of the roads and increase the operating cost of vehicles.
Public service delivery in Nigeria is in crisis and infrastructure across the country is in
huge deficit. Indeed, the crisis in the education, road and water sector is a crisis of
governance. The mechanism for service delivery is deficient in accountability, transparency
and effective resource management which are critical elements of governance of service
delivery. The Organization for Economic Co-operation and Development (OECD) defines
governance as the use of political authority and exercise of control in a society in relation to
the management of its resources for social and economic development. This broad
definition encompasses the role of public authorities in establishing the environment in which
economic operators function and in determining the distribution of benefits as well as the
relationship between the ruler and the ruled. According to the Commission on Global
Governance (CGG), governance has to do with the institutional environment in which
citizens interact among themselves and with government agencies and officials. In Nigeria,
adoption of alternative service delivery mechanisms as exemplified by innovative
approaches associated with the MDGs is a major governance reform which is aimed at
improving access to quality education and improved safe drinking water in Nigeria.
Nonetheless, access to drinking water and improved educational facilities is still far from
being adequate in various geo-political zones of the country particularly in rural areas. The
approaches essentially involve agencification and inter-governmental partnerships especially
in the water and education sectors. What are the incentives and institutional arrangements
associated with such service governance that define the interaction between providers and
beneficiaries? What are the governance practices and how do they affect the desired
outcomes? These are the issues unravelled in this study.
1.2 Objectives
The broad goal of this study is to examine the governance and performance of public service
delivery for the achievement of MDGs in Nigeria. The specific objectives are threefold:
(i) Examine the nature of government channels for the delivery of education, road and
water services;
(ii) Determine the effects of governance (accountability and participation) on services

Accountability and Performance of Government Agencies in the Delivery of Water, Education and Road Services in Nigeria
15
delivered in the education and water sectors and examine the variations in the output
across the geo-political and geographical zones; and
(iii) Ascertain the factors affecting governance (accountability and participation) in the
delivery of education, road and water services in Nigeria and compare the
performance of the alternative service delivery channels.
1.3 Hypotheses
The following working hypotheses are adopted in the execution of the study.
(a) Accountability and participation in service delivery have significant effects on output
in the education and water sectors irrespective of the type of service delivery
channels.
(b) Accountability and participation in service delivery are significantly influenced by the
socio-economic characteristics of the beneficiaries;
(c) The output (performance) of service delivery is significantly affected by geographical
location and channel of service delivery.
The remaining part of the report is structured as follows. Following this introductory
section, we present a highlight of the country background and sector context in section two
while section three contains a more elaborate presentation of the conceptual framework and
literature review. Section four contains the research methodology while the results of the
qualitative and quantitative analysis are presented in section five. The report is rounded off
in section six with a presentation of the summary of findings, policy recommendations and
conclusions.
2. Background of Country and Sector context
Nigeria is a federal constitutional republic
comprising 36 States and its Federal Capital
Territory, Abuja. The country lies between
latitudes 40 and 140N, and longitudes 20 and
150E (Figure 1). It has a total area of
923,768km2 (356,669 sq m) making it the
world’s 32nd largest country after Tanzania. It
has a density of 184.2 per km2. The country
shares borders with the Republic of Benin in
the West, Chad and Cameroon in the east,
and Niger in the north. Its coast in the south
lies on the Gulf of Guinea on the Atlantic
Figure 1: Map of Nigeria showing the
36 States and the Federal Capital

Accountability and Performance of Government Agencies in the Delivery of Water, Education and Road Services in Nigeria
16
Ocean. Nigeria is the most populous country in Africa and the seventh most populous
country in the world. The country is divided into thirty-six states and one federal Capital
territory, which are further divided into 774 Local government Areas (LGAs). The country
has six cities with a population of more than one million people. These are, from largest to
smallest, Lagos, Kano, Ibadan, Kaduna, Port Harcourt, and Benin City.
According to the country’s 2006 population census, it has a total population of
140,003,542 people while the 2012 estimated population figure is 170,123,740
(http://en.wikipeadia.org/wiki/nigrtia). Nigeria has been undergoing explosive population
growth and one of the highest growth and fertility rates in the world. It is one of the eight
countries expected to account collectively for half of the world’s total population increase
from 2005 to 2050 (United Nations, 2005). Nigeria is a large country with a greater
proportion of its population (about 70 per cent) living in the rural hinterlands. It is also a
country with high incidence of poverty. This makes delivery of accessible, affordable and
sustainable services a great challenge. The case of water, education and transport services
in form of road provision is not an exception.
The three sectors (water, education and road) are very critical to the socio-economic
wellbeing of the teeming population of the country and the growth and sustainability of the
country’s economy. Thus, governance of delivery of services in these sectors becomes an
issue of concern hence, the focus on them in this study.
The Education Sector
The Federal Ministry of Education at the Federal level is responsible for the formulation of
education policies and strategies in the country. At the State level there are the State
Ministries of Education while at the Local government level there are Local Education
Authorities LEAs). While the Federal government is responsible for tertiary education, the
State Ministries, through the State Universal Basic Education Board (SUBEB) is responsible
for primary education in urban and rural areas with the LEAs as the executing authorities. At
the Federal level there is the Universal Basic Education Commission (UBEC) which
collaborates with the SUBEB at the State level in supporting primary education and Junior
Secondary education in the country. There is also the National Universities Commission
(NUC) which regulates activities of tertiary Institutions. There are private sector operators in
the education sector right from the pre-primary facilities to tertiary institutions. Again there is
no formal contractual arrangement between the government and the private sector actors in
education service delivery, except regulatory functions being performed by the NUC over
tertiary institutions and those by the State Ministry of Education over private sector actors in
the primary and secondary education at the State and Local levels.

Accountability and Performance of Government Agencies in the Delivery of Water, Education and Road Services in Nigeria
17
Road Sector
The road sector is also administered at the Federal, State and Local government level. At
the Federal level is the Federal Ministry of Works (FMW) which is responsible for
construction of federal roads, the Federal Road Maintenance Agency (FERMA) which is
responsible for rehabilitation and maintenance of Federal Roads, the Federal Ministry of
Agriculture and Rural development (FMARD) which is responsible for construction and
rehabilitation of rural earth roads and later the introduction of Rural Access Mobility Project
which took off after the scrapping of the Directorate of Food, Roads and Rural Infrastructure
(DFFRI) which was responsible for rural road provision between 1985 and 1993. There is
also the Constituency Channel for road provision which is under the National Assembly. It
offers the National Assembly members the opportunity to push for construction of roads in
their various constituencies.
The Water Sector
With respect to institutional framework for water supply in the country, there are five levels.
At the Federal level there is the Federal Ministry of Water Resources with two parastatals –
The River Basin Development Authorities (RBDAs) and the National Water Resources
Institute (NWRI). Other line Ministries at that level that have to do with water supply include
the Federal Ministry of Agriculture, the Federal Ministry of Health, and the Federal Ministry of
Environment. There are also the RBDAs, each of which has jurisdiction over between 2 and
four States. The Federal Ministry of Water Resources is responsible for formulating,
developing and implementing National Water Policy and carrying out necessary reviews
from time to time. At the State level, are the State Water Agencies (SWAs), each of which is
responsible for developing and managing water supply facilities within its respective State.
In many States, the responsibilities for rural water supply have been transferred to the State
Rural Water Supply and Sanitation Agencies (RUWASSA). At the Local Government level,
the Local Government Authorities (LGAs) are responsible for the provision of rural water
supplies and sanitation facilities in their areas of jurisdiction. At the fourth level are the
private sector firms and individuals who engaged in water provision in plastic bottles and
rubber sachets. There are some who operate water tankers and sell to consumers.
However, there is no formal framework or contractual arrangement for their operations and
their activities are not coordinated. At the last level are communities and households who
embark on construction of water facilities provided by government agencies. The 2010 MDG
report put access rate to safe drinking water in 2009 at 58.9 per cent indicating that 41.1 per
cent of Nigerians lacked access to safe drinking water.

Accountability and Performance of Government Agencies in the Delivery of Water, Education and Road Services in Nigeria
18
3. Conceptual Framework and Literature Review: Governance of Effective Public
Services Provision
In broad terms, governance is the exercise of economic, political and administrative authority
to manage a country’s affairs at all levels. It comprises the mechanisms, processes and
institutions through which citizens and groups articulate their interests, exercise their legal
rights, meet their obligations and mediate their differences. In the case of water for instance,
governance refers to the range of political, social, economic and administrative systems that
are in place to develop and manage water resources, and the delivery of water services at
different levels of society (Global Water Partnership, 2002).
3.1 Governance on the Supply Side
Conceptually, governance has increasingly been used in the public and voluntary sectors to
refer to the oversight of executive power; it sets the expectations for executive agents, sets
parameters, grants decision rights and conditional authority and it monitors performance
against targets. Governance is constituted by a number of processes which are designed to
meet a number of objectives and which are usually organised into a number of structural
arrangements. However, ‘governance’ in the modern sense tends to be associated with a
system constituted by devolved bodies assuming ‘bottom up’ range of responsibilities while
subject to ‘top down’ regulations, scrutiny and oversight – a network in place of a single
central controlling agent but one that is accountable to its members (Storey et al, 2008).
Since the early 1990s alternative service delivery framework has been popularized
under many names in both developed and developing countries and has now become a
world-wide phenomenon. In its original form it was meant to be a creative and dynamic
process of public sector restructuring that improves the delivery of services to clients by
sharing governance functions with individuals, community groups and other government
entities (see Ford and Zussman, 1997). Some of the service delivery channels invented
since the 1990s can be categorized into four clusters namely; (i) mainstream government
(ministries, departments and agencies - MDAs), (ii) agencies (statutory, non-statutory), (iii)
partnerships (with other governments, contracts) and (iv) private entities (not-for-profit, for-
profit).
With regard to public service delivery, consensus is growing regarding the inability of
a centralised system to deliver services efficiently and to the satisfaction of beneficiaries.
The search for alternative service delivery channel has been part of the New Public
Management reforms in various parts of the world. In this connection, agencification which
is a core element of this paradigm has been part of the governance reform agenda both in
developing and developed countries. The NPM-related reforms have resulted in various
types of agencies such as the non-departmental bodies and Next Steps agencies in the UK,

Accountability and Performance of Government Agencies in the Delivery of Water, Education and Road Services in Nigeria
19
public establishments in France, Italy and Portugal, state agencies in the Nordic countries,
and so-called bureaus and boards in central eastern European countries (Pollitt and Talbot,
2004; OECD, 2002, van Thiel, 2011). According to Pollitt et al (2004), agencification refers
to the creation of semi-autonomous agencies that operate at arms’ length of the government,
to carry out public tasks like service delivery, policy implementation and/or regulation.
Consistent with this definition, Talbot (2004) offers three basic criteria by which NPM-
Talbot (2004) related agencies can be identified: (i) structural disaggregation from
government and/or the creation of task-specific organizations, (ii) performance ‘contracting’ –
some form of performance target setting, monitoring and reporting and (iii) deregulation of
controls over personnel, finance and other management matters.
As noted by Slyke (not dated), philosophically, policy makers are enacting decisions
that not only restrict but in many cases remove government from providing services directly
to citizens. In part, this is being driven by market and political ideologies that have their
roots in perceptions about greater efficiencies and innovations arising from private sector
and broader support for smaller government. According to McMaster (1999), there are
alternative forms of service delivery. These include contracting our services to private firms,
franchising services to the private sector, the use of grants and vouchers, mobilising
community groups and developing self service measures as well as the privatization of
government enterprises that have provided urban services. However, as much as there are
many alternative channels of service delivery, there must be fundamental reforms with
respect to legislations, administrative frameworks, and the totality of business environment
before any of them could be effectively adopted.
In Nigeria, the 2000s witnessed the emergence of public service delivery channels
for enhancing the achievement of MDGs in various sectors of the economy. This includes
mechanisms for MDAs involvement in service delivery, a system of centralized traditional
bureaucracy (CTB), creation of agencies (agencification) and partnership between the
Federal and lower levels of government (inter-governmental partnerships – IGPs) in the
delivery of education and water services. These alternative channels of service delivery are
the focus of attention in this study as far as the water, education and road services
associated with the implementation of the MDGs in Nigeria are concerned. A key element in
the design of the service delivery channel is decentralization of regulatory and administrative
control from the Federal to lower levels of government.
Conceptually, governance has increasingly been used in the public and voluntary
sectors to refer to the oversight of executive power; it sets the expectations for executive
agents, sets parameters, grants decision rights and conditional authority and it monitors
performance against targets. Governance is constituted by a number of processes which
are designed to meet a number of objectives and which are usually organised into a number

Accountability and Performance of Government Agencies in the Delivery of Water, Education and Road Services in Nigeria
20
of structural arrangements. However, ‘governance’ in the modern sense tends to be
associated with a system constituted by devolved bodies assuming ‘bottom up’ range of
responsibilities while subject to ‘top down’ regulations, scrutiny and oversight – a network in
place of a single central controlling agent but one that is accountable to its members (Storey
et al, 2008).
Since the early 1990s alternative service delivery framework has been popularized
under many names in both developed and developing countries and has now become a
world-wide phenomenon. In its original form it was meant to be a creative and dynamic
process of public sector restructuring that improves the delivery of services to clients by
sharing governance functions with individuals, community groups and other government
entities (Ford and Zussman, 1997). Some of the service delivery channels invented since
the 1990s can be categorized into four clusters namely; (i) mainstream government
(ministries, departments and agencies - MDAs), (ii) agencies (statutory, non-statutory), (iii)
partnerships (with other governments, contracts) and (iv) private entities (not-for-profit, for-
profit).
With regard to public service delivery, consensus is growing regarding the inability of
a centralized system to deliver services efficiently and to the satisfaction of beneficiaries.
The search for alternative service delivery channel has been part of the New Public
Management reforms in various parts of the world. In this connection, agencification which
is a core element of this paradigm has been part of the governance reform agenda both in
developing and developed countries. The NPM-related reforms have resulted in various
types of agencies such as the non-departmental bodies and Next Steps agencies in the UK,
public establishments in France, Italy and Portugal, state agencies in the Nordic countries,
and so-called bureaus and boards in central eastern European countries (Pollitt and Talbot,
2004; OECD, 2002, van Thiel, 2011). According to Pollitt et al (2004), agencification refers
to the creation of semi-autonomous agencies that operate at arms’ length of the government,
to carry out public tasks like service delivery, policy implementation and/or regulation.
Consistent with this definition, Talbot (2004) offers three basic criteria by which NPM-related
agencies can be identified: (i) structural disaggregation from government and/or the creation
of task-specific organizations, (ii) performance ‘contracting’ – some form of performance
target setting, monitoring and reporting and (iii) deregulation of controls over personnel,
finance and other management matters.
3.2 Governance on the Demand Side
The role of citizens in the principal-agent public service provision and management is crucial
for ensuring effective service delivery. This is important in the light of the prevailing
economic reforms that ushered in transformations from ‘governance by authority to
Accountability and Performance of Government Agencies in the Delivery of Water, Education and Road Services in Nigeria
21
governance by contract’ (David, 2006). Under this paradigm shift, the agency theory best
explains managerial behaviour of government as ‘principal’ and contractors as ‘agents’. In
this arrangement, government still maintains control of activities but contracts out to the
private sector the production and or supply of goods and services. Price competition is
introduced through the open invitation of tenders from firms. Government maintains
responsibility for determining the quality, timing and quantity of services to be provided
(World Bank, 2009).
The consideration of the roles of citizens in these arrangements becomes necessary
because, under conditions of incomplete information and uncertainty which characterize
most business settings, two agency problems arise: adverse selection and moral hazard.
Adverse selection is the condition under which the principal cannot ascertain if the agent
accurately represents his ability to do the work for which he is being paid. Moral hazard is
the condition under which the principal cannot be sure if the agent has put forth maximal
effort (Eisenhardt, 1989). For this reason, attention is now being focused on role of citizens
or users of services being provided. Under the principal-agent relationships, the role
citizens’ play, especially the ability to demand for services instead of being supplied matters
a lot. The extent to which their voices count in determining their needs and to voice
discontents with quality of services provided, demand value for money, ability to hold
governance actors accountable are crucial tools for counteracting the fault lines and
weaknesses inherent in the principal-agent service provision and managerial relationships.
It is has been suggested, for example, that the dilemma of failed public services stems from
the structure of responding to public ‘needs’, such that services are ‘supplied’ rather than
‘demanded (GDN, 2009). In this regard, Cornwall and Gaventa (2000) point to citizen
‘demand’ for services as the starting point of good governance in service delivery, pointing
out that, for effective service provision through the principal-agent mechanism, a distinction
must be made between ‘invited spaces’ created for citizens ‘from above’ through
governmental or donor interventions, and spaces which are ‘chosen, taken and demanded’
through collective citizen actions ‘from below’ (bottom-up). They stressed that, in coming to
terms with structures under which citizens can hold governance actors accountable, and to
demand value for money, rather than focusing simply on the role of the state in ensuring
rights of citizenship, attention should be drawn to emerging new models of accountability
which focus on the role of citizens themselves in monitoring the enforcement of rights, and in
demanding public scrutiny and transparency. It is in this direction that the World Bank
(2012) advocates for citizens’ exertion of influence by assuming some responsibilities such
as monitoring and supervision, etc., in the process of service delivery. A good example of
citizens exerting influence is parents joining Parents-Teachers Associations (PTA) in the
delivery and management of basic education in most countries (World Bank, 2012). This

Accountability and Performance of Government Agencies in the Delivery of Water, Education and Road Services in Nigeria
22
point reinforces the growing consensus on the values of decentralisation and devolution of
administrative and regulatory mechanisms that allow for consultative ‘bottom-up’ approach to
service delivery.
At the Local government level, for instance, local community development
associations, interest groups and associations can offer citizens useful channels for exerting
influence enabling them to operate from position of strength (Ya’u, 2012), as opposed to the
weakness in citizens operating within the ‘invited spaces from above’, which , due to lack of
information flow limits citizens ability to hold governance actors accountable (Cornwall and
Gaventa, 2000). On the other hand, attention is being drawn to the importance of
democratic governance structures which put power in the hands of citizens and offer
effective channels of information flow which is a crucial factor in ability to hold actor
accountable. But as pointed out, many political systems have failed to achieve this (GDN,
2009). Under true democracy, a majority of voters should be able to vote in new politicians
of their choice that will improve service delivery. But in practice, in many political systems,
several factors compromise or weaken this long route. Such factors include election rigging,
low voter turnout, etc (GDN, 2009). In spite of the dilemma, however, the fact still remains
that true democracy that allows for institutional structures, policies and information flow in
the bottom-up framework remains key to governance of effective service delivery (World
Bank, 2007).
4. Methodology
4.1 Analytical Techniques
The study employs both qualitative and quantitative techniques in achieving the specified
objectives. In characterizing the governance practices attention is focussed on key
indicators such as awareness, participation and accountability. Data from in-depth
interviews of officials of relevant agencies and FGDs are used to describe the governance
practices associated with the delivery of services in the education, road and water sectors.
The output indicators used in analysing the performance of service delivery channels include
availability of water, adequacy of classrooms and performance of students. The survey data
used in the analysis tend to be skewed towards the demand side of service delivery which is
known to be far more problematic in Nigeria than the supply side. The approach is also
consistent with the fact that research on public service delivery in developing countries,
including Nigeria, has focused on supply-side problems such as absenteeism, red tapism,
corruption, weak institutions, poor regulatory framework and inefficient supply mechanisms
while leaving the demand-side relatively under-studied. Yet the exclusion of beneficiaries’
from the governance of service delivery systems and lack of awareness among them have
been found to be important causes of failure of public service delivery in developing

Accountability and Performance of Government Agencies in the Delivery of Water, Education and Road Services in Nigeria
23
countries (see Berg et al, 2011). In the case of Nigeria, in particular, demand-side analysis
which focuses on beneficiaries’ awareness of governance arrangements and service
delivery procedures, their participation and assessment of accountability in the system is
desirable. This will go a long way to resolve the governance crisis in public service delivery
and lead to an enhancement of access and satisfaction in the provision of road, water and
education services in the country.
4.1.1 Determinants of Governance in Service Delivery
The governance indicators involved in the analysis are participation and accountability. The
a priori expectation is that good governance will prevail in a community with high income,
high educational attainment, reasonable household size and proximity to the location of the
facility provided. Specifically, the relationship between participation of a particular household
in the execution of a project will be inversely related to the distance between the household
and the location of the particular project; whereas the household size may have a positive
relationship. With regard to accountability, both the service provider and beneficiary have a
role to play. To hold the provider accountable, the beneficiary must possess the necessary
empowerment in terms of income and educational attainment. Efforts involved in reporting
poor performance are not costless and unless a beneficiary earns a reasonable level of
income the cost may be unbearable. Thus, accountability may be low in poverty stricken
communities. These expectations are tested following standard econometric procedures
and the results enable us come up with appropriate suggestions as to how the governance
system can be made more effective in the supply of water to the affected communities.
The analysis is applicable to the water and education sectors for which relevant
survey data are available. For instance in the water sector, the focus of attention is the
explanation of the factors affecting governance in the two channels (IGP and CTB) involved
in water supply. The analysis is apt to provide a better understanding of the effects of such
factors (especially the socio-economic characteristics of the beneficiaries) and differences (if
any) between channels and across the six geo-political zones of the country. Specifically,
three indicators of governance are involved in the analysis. They are participation,
accountability and awareness. The hypothesis is that governance is significantly affected by
the socio-economic characteristics of the beneficiaries. Implicitly, the estimating equation is
expressed as:
G = f(X1, X2, X3, X4, X5, Zone, Domain, Channel)
where,
G = Governance indicator
X1 = Household size
X2 = Age of household head

Accountability and Performance of Government Agencies in the Delivery of Water, Education and Road Services in Nigeria
24
X3 = Income
X4 = Educational attainment (number of years of schooling)
X5 = Distance between residence and facility
Zone = Dummy variable representing geo-political zones
Domain = Dummy variable Rural = 1; otherwise = 0
Channel = Dummy variable IGP =1; otherwise = 0
The analysis is carried out for each of the indicators of governance namely, participation and
accountability. Participation is proxied by the proportion of beneficiaries that participate in
the execution of the project while accountability refers to the proportion of beneficiaries who
indicate that they are willing and have opportunity to report poor performance. The
participation indicator takes a value of unity for those who participated and zero otherwise.
A similar assignment of value is made for those who have opportunity to report poor
performance. Therefore, since the dependent variable in the analysis is a binary variable a
probit analysis is carried out. The channel of service delivery is included to capture supply-
side governance issues; but this is relevant only to the water sector.
4.1.2 Effects of Governance on Service Delivery
The output indicators in respect of education service delivery are the proportion of students
who pass the common entrance examination at the end of their course in a particular school
and adequacy of classrooms. Invariably the input of teachers, the learning environment and
governance structure are critical variables that will determine such output/outcome. The
relationship between the output and input variables is examined in an econometric analysis.
The estimating equation is specified implicitly as follows.
Qi = Service delivery performance in education = f(Xi1, Xi2, Xi3, Xi4,D)
where,
Qi = proportion of students that pass common entrance in school i
X1 = teacher-students ratio
X2 = distance between pupils’ residence and the school
X3 = pupils per class
X4 = governance proxied by parents’ participation in school management
Zone = Dummy variable representing geo-political zones
Domain = Dummy variable Rural = 1; otherwise = 0
With regard to adequacy of classrooms, the estimating equation is specified implicitly as:
Qi = f(PART, AWARE, ACCOUNT, Zone, Domain)

Accountability and Performance of Government Agencies in the Delivery of Water, Education and Road Services in Nigeria
25
where,
Qi = Adequacy of classrooms (with a value of unity for respondents who claimed
that number of classrooms is adequate and zero otherwise)
PART = Participation(proportion of beneficiaries who participate in project execution(
AWARE = Awareness (proportion of beneficiaries with information on the project)
ACCOUNT = Accountability (proportion of beneficiaries who indicate that they have
opportunity to report poor performance)
Zone = Dummy variable for geo-political zones
Domain = Dummy variable: Rural = 1; otherwise = 0
As regards service delivery in the water sector, the output indicator is availability of water at
all seasons. The estimating equation is:
Qi = f( PART, AWARE, ACCOUNT, Zone, Domain, Channel)
where,
Qi = Availability of water (with unity for respondents who claimed that water is
available at all seasons and zero for those who claimed otherwise)
PART = Participation(proportion of beneficiaries who participate in project execution)
AWARE = Awareness (proportion of beneficiaries with information about the water
facility)
ACCOUNT = Accountability (as earlier defined)
Zone = Dummy variable for geo-political zone
Domain = Dummy variable Rural = 1; otherwise = 0
Channel = Dummy variable IGP = 1; otherwise = 0
The literature on the effects of governance on service delivery has identified three key
elements in characterizing public service delivery. They are the quality of the service, its
cost and its availability. According to Kaufmann et al (2008), poor governance can affect
service delivery directly through higher price and indirectly through lower quality or quantity
available. With data on users’ evaluation of access to public services and survey of public
agencies, the authors analysed the cost of bad governance and importance of various
governance determinants on access to public services in Peru using probit and OLS
regressions. Using the two data sets enabled them to cover both the demand and supply-
side effects of governance. They found that low-income users are more likely to be
discouraged and not to seek a service than wealthier ones especially when in need of a
basic service such as water and education. The analysis suggests that individual

Accountability and Performance of Government Agencies in the Delivery of Water, Education and Road Services in Nigeria
26
characteristics such as education and age matter in the decision about whether or not to
seek a service when needed.
The inclusion of socio-economic characteristics as determinants of governance is
considered to be relevant in view of the critical role such characteristics can play in ensuring
that service delivery is beneficiary-centred and result-oriented. Like many governance
reforms, the emerging channels of public service delivery seem to follow top-down
approaches in response to global trends ignoring the preferences and capabilities of the
public (consumers) in the governance process (Goetz and Gaventa 2001; Rojas 2000; Sajor
and Minh Thu 2009). With regard to the water sector for instance, recent studies in some
developing countries have argued and demonstrated that lack of information on household
preferences regarding water services is an important impediment to implementing
sustainable public water supply systems (Vásquez, Franceschi, and Van Hecken 2011;
Vásquez, 2011). There is therefore, the need to have a better understanding of household
capabilities, characteristics and preferences in order to design and nurture appropriate forms
of service governance for the implementation of sustainable water projects in Nigeria.
4.2 Data Collection
Both primary and secondary data were used in the study. But the study is largely primary-
data based. The data were collected using structured questionnaires, in-depth interviews
and focus group discussions (FGDs). The coverage of the service delivery channels is
nation-wide. In particular, the IGPs are being implemented in the 36 states of the Federation
across the six geo-political zones. The survey was designed to cover two states in each of
the geopolitical zones making a total of 12 states which constitute about 33 percent of the
states in the country. The states selected from each of the six geo-political zones are
Kaduna and Jigawa (North-west zone), Adamawa and Yobe (North-east zone), Niger and
Nasarawa (North-central zone), Lagos and Ekiti (South-west zone), Anambra and Imo
(South-east zone) and Rivers and Delta (South-south zone). The states were selected on
the basis of their participation in the partnership approach to water services delivery for at
least two years since its inception in 2007. In zones where different parties are in
government, efforts are made to allow the states selected to reflect multi-party
representation.
The key secondary data include the activities of ministries and agencies in the
delivery of relevant services, implementation procedures associated with services delivered
under the inter-governmental partnership arrangements, locations of rural roads provided
under the 2006 MDGs Office Projects and list of 2009 constituency road projects. Besides,
relevant publications and policy documents were obtained from the relevant ministries

Accountability and Performance of Government Agencies in the Delivery of Water, Education and Road Services in Nigeria
27
concerning the recent reforms and project implementation strategies in the education, water
and transport (road) sectors.
Primary Data for the Education Sector
The collection of primary data relating to education services was based on in-depth
interviews, survey of facilities and survey of beneficiaries. In-depth interviews were
conducted in each state with officials of the State Universal Basic Education Board
(SUBEB). The Director of School Services and the Desk Officer in charge of the Federal
Teachers Scheme were the interviewees. In each of the 12 states, 20 Primary Schools
identified to have benefited from the Federal Teachers Scheme and the Book and
Instructional Materials Supply Scheme of UBEC were included in the facility survey. The
schools spread over a maximum of 10 local government areas (LGAs) in each state and
cover both rural and urban areas. Within the community where the facility is located five
households were selected for inclusion in the survey of beneficiaries. Thus, in each of the
selected States 100 beneficiaries were covered. Altogether a total of 24 interviewees, 240
primary schools and 1,200 beneficiaries were involved in the survey.
Primary Data for Rural Road Construction/Maintenance
The primary data for the road sector were collected through in-depth interviews and FGDs.
The road projects sponsored by the MDGs Office in 2006 were implemented by the
Department of Rural Development of the Federal Ministry of Agriculture and Rural
Development. In each state, two of such roads were selected making a total of 24 rural
roads. In 2009, the rural road projects, known as Constituency Roads were implemented by
RAMP (Rural Access and Mobility Project) a project in the Ministry of Agriculture and Rural
Development. However, in the list of participating states obtained from RAMP, only two
states (Jigawa and Anambra) fall within the 12 states already selected for the coverage of
the study. Therefore, the two states, Jigawa from the North and Anambra from the South
were included in the study of constituency road projects. The Desk Officers responsible for
the implementation of the road projects were the interviewees during the survey. Moreover,
within the communities linked with the road projects, FGDs were conducted to further
examine the key pillars of governance such as transparency in service delivery,
accountability and communication. The two villages linked by a road were involved in the
FGDs. Thus, for the 24 selected MDA-controlled roads, 48 FGDs were conducted while for
the two constituency roads, four FGDs were held. In other words, a total of 52 villages
across the country were involved in the survey.

Accountability and Performance of Government Agencies in the Delivery of Water, Education and Road Services in Nigeria
28
Primary Data for the Water Sector
The collection of primary data in the water sector was based on in-depth interviews, survey
of facilities and survey of beneficiaries. The Desk Officers in charge of the MDA-delivered
services at the state level were selected as key informants for the in-depth interviews. For
the CGS water projects, designated Desk Officers were also involved in the interviews. In
some States, officials of Water Corporations and the Focal Persons for project
implementation were the key informants. The survey of communities was carried out in each
of the 12 selected states. Within the selected communities where the water projects are
located FGDs were held to further examine the key pillars of governance such as
transparency in service delivery, accountability and communication. Altogether a total of 60
FGDs were conducted – 24 for the MDA-delivered services and 36 for the services delivered
under the inter-governmental partnership (IGP) arrangements. Data on key variables such
as accessibility, functionality, repairs/maintenance costs, quality, quantity, availability etc.
were obtained during the discussions to complement available quantitative information. For
the survey of beneficiaries, five communities with water facilities were targeted in each state;
and from each community a sample of 25 beneficiaries was drawn for inclusion in the
survey. Thus in each of the selected States 125 beneficiaries were covered; thus giving a
total of 1,500 across the 12 states.
5. Presentation of Analysis
This section is structured in such a way as to accomplish the objectives of the study, validate
the working hypotheses focusing on key governance issues to be addressed in ensuring that
public service delivery is result-oriented. The four areas of focus in the presentation of the
results are (a) the nature and effectiveness of government channels for public service
delivery (b) accountability mechanisms and service delivery outcomes, (c) channel
differences and other factors influencing governance mechanisms, and (d) rural-urban
split/geographical differences in accountability of public service delivery. These areas, with
the exception of the first, are associated with the three working hypotheses which provide
overall guidance for the analysis and interpretation of results.
5.1 Nature and Effectiveness of Government Channels for delivering public services.
The analysis here focuses on different government channels for delivering water, education
and rural roads and how beneficiaries rate their performance and the quality of services
delivered.
5.1.1 Effectiveness of Government Channels for Delivering Education Services
Effectiveness of government channels for delivering education public services is examined
qualitatively by assessing the perception of beneficiaries with regard to availability,

Accountability and Performance of Government Agencies in the Delivery of Water, Education and Road Services in Nigeria
29
adequacy, accessibility, affordability and quality of the services provided. The results show
that majority of respondents (53 percent) indicate that teachers are not available or are
inadequate (Appendix Figure 5.1). This confirms a NISER (2007) Mid-term assessment
report on MDG1. Like teachers, classrooms are also indicated by 58 percent of respondents
to be inadequate (Appendix Figure 5.2) and are largely responsible for the phenomenon of
large or choked classes that is not conducive to learning. Furthermore, it was found that
SUBEB Education Projects have certainly improved access for most respondent
beneficiaries (Appendix Figure 5.3). This was measured by the distance in kilometres from
household to SUBEB School that they have to trek. With regard to affordability, 69 percent
of respondents claim SUBEB education projects are affordable (Appendix Figure 5.4).
Moreover, respondents perceive the quality of the entire education project environment as
good (64 percent), Fair (27 percent) while only nine percent see it as poor. Clearly,
therefore, on the issue of performance in the education sector, efforts should be geared
towards improving on the number of classrooms, provision of teachers, improving quality of
the education project environment, improving affordability and ultimately access.
With regard to the impact of service delivery, respondents were asked to assess the
changes observed between 2008 and 2011 in terms of whether the situation has worsened,
improved or not in respect of availability, accessibility and affordability of education services.
The results show that positive impact has been made on beneficiaries. Majority of the
respondents rated the situation better in terms availability (73 percent), accessibility (77
percent) and affordability (78 percent). The delivery of services under the partnership
arrangements between UBEC and SUBEB also involves the application of rules to guide the
performance of contractors (service providers) and involvement of relevant stakeholders. In
virtually all geo-political zones of the country the due process and bidding system of
contracting is practised as required by the MDGs Office. Along this line, several criteria such
as show of tax clearance certificate, registration with SUBEB and evidence of completion of
similar projects etc are set and used as guide for the award of contracts. This ensures that
only credible contractors are engaged. When engaged, they are monitored and any erring
contractor is sanctioned by either being asked to go back to site and follow specifications,
delayed payment or outright revocation of contract and blacklisting. This practice ensures
good attitude and commitment by contractors to effectively deliver on projects.
The strategies in place to ensure quality and functionality of school facilities include
regular monitoring and evaluation of school facilities, ensuring compliance to specifications
by contractors and the involvement of the beneficiary communities in the management of
school facilities. Indeed, provision and management of basic education services would not
1 The report states that there are about 25 million children attending 60,188 basic public schools with only about 575,068 teachers of whom only about half (51.6 percent) are qualified.

Accountability and Performance of Government Agencies in the Delivery of Water, Education and Road Services in Nigeria
30
have been possible without the involvement of all relevant stakeholders. In all the zones,
stakeholders in the provision of basic education range from individual community members
who form members of Parents Teachers Associations (PTAs), School Based Management
Committees (SBMCs) (involved in the management of school facilities), the Local
Government, State Universal Basic Education Board (SUBEB), the Federal Government
(UBEC), as well as CSOs and NGOs who are involved in monitoring and evaluation.
5.1.2 Effectiveness of Government Channels for Delivering Water Services
This section examines the effectiveness of service delivery. This is done looking at how
households/users perceive availability, accessibility, affordability, adequacy and quality of
water facility, considering the water sector separately and the two channels of delivery. A
little above three-fifths of the respondents perceived water facilities to be available while
majority of the beneficiaries of both the MDA and CGS water facilities held the same opinion,
though the proportion of MDA beneficiaries is higher than that of CGS beneficiaries
suggesting that MDA water facilities could be more available than CGS facilities (Appendix
Table 5.1.1). With respect to accessibility, at least nine out of every ten respondents
claimed water facility to be available, and again majority of the MDA and CGS beneficiaries
also shared this view but the proportion of CGS beneficiaries is higher than that of their MDA
counterparts, suggesting that water facilities provided under the CGS could be more
accessible than those provided by MDAs.
On the issue of affordability, at least nine out of every ten respondents claimed water
facilities to be affordable with majority of MDA and CGS beneficiaries in this category but the
proportion of CGS beneficiaries is higher, again suggesting that CGS water facilities could
be more affordable. With respect to whether water drawn from the facilities is adequate,
majority of the respondents replied in the affirmative. The same applies to MDA and CGS
beneficiaries but the proportion of the former is higher, suggesting again that MDA water
facilities have more capacity to produce higher quantity of water compared to the CGS ones.
As regards water quality, majority of the respondents claimed that the water from the water
facilities had no taste, no colour and no sediments. This suggests that generally the quality
of water was perceived by the respondents to be good. The same applies to beneficiaries of
MDA and CGS water facilities. However, the proportion of the MDA beneficiaries who
claimed that water had taste is higher than their MDA counterparts, while the proportion of
the CGS beneficiaries who claimed water to have colour is higher compared to their MDA
counterparts.
Generally, it could be said that water service delivery is effective from the perception
of the respondents. The findings also suggest that: MDA water facilities could be more
available than CGS facilities; CGS water facilities could be more accessible and affordable

Accountability and Performance of Government Agencies in the Delivery of Water, Education and Road Services in Nigeria
31
than MDA facilities; and that MDA water facilities have more capacity to produce higher
quantity of water compared to the CGS ones.
5.1.3 Effectiveness of Government Channels for Delivering Rural Feeder Roads
The country’s total road network is shared among the three levels of government in terms of
provision and maintenance. However, in spite of the three-tier categorization, to date, the
Federal Government is the only active key player in the provision of rural feeder roads in the
country; interestingly it is an activity outside its constitutional jurisdiction. The reason for the
Federal Government veering into provision of rural feeder roads is not farfetched, as the two
sources of funds (Millennium Development Goals and Constituency Funds) meant for rural
feeder roads are all in its custody. Instead of channelling the funds to Local Governments
for implementation under the principle of Fiscal Federalism, the Federal Government chose
to channels these funds to its Federal Ministry of Agriculture and Rural Development
(FMARD), which has branch offices in all the states of the federation for implementation.
The state offices of the FMARD are headed by State Coordinators.
Rural feeder road projects are directly executed at the local communities by the
FMARD offices in the States without the involvement of Local Governments using the MDGs
and Constituency funds. These two categories of funds are applied towards feeder road
provision using similar approach in terms contractual and management procedures, but only
differentiated by the strategy of deciding the location of the feeder road in the communities.
While the State Coordinators of the FMARD exclusively decide where MDGs-funded roads
are sited, the locations of Constituency-funded roads are exclusively determined by
politicians (National Assembly Members). In both cases however, in-depth interviews
indicate that there have been little or no participation of State and Local Governments
officials, as well as the community members at all stages of road project cycle. As a result,
accountability and transparency issues among actors were highly compromised. Such
crucial principal-agent accountability mechanisms in project management for ensuring
quality in service delivery like performance monitoring, community participation, certification
before payment, etc became ineffective despite actors awareness of their provisions as
alignment control tools for ensuring quality in service delivery. Insight into this disconnects
was provided by the Badagry Local Government Engineer in Lagos State as follows:
Lack of coordination among the Federal, State and Local Government Areas is major
problem. A project initiated by Federal Government for execution at the state level
should be brought to the attention of State. The State should mobilize Engineers and
relevant officials of the local government involved for supervision. But this is lacking.

Accountability and Performance of Government Agencies in the Delivery of Water, Education and Road Services in Nigeria
32
5.2 Governance Mechanisms and Quality Service Delivery
Hypothesis: (a) Accountability and participation in service delivery have
significant effects on output in the education and water sectors irrespective of
the type of service delivery channels.
5.2.1 Accountability mechanisms and Education Service Delivery
Accountability, as another attribute of good governance, is measured by the extent to which
stakeholders have opportunity to ask questions, seek clarifications and report cases of
dissatisfaction with services or activities of institutions and agencies in the belief that doing
so will enhance service delivery. Accountability is examined by looking at respondents’
access to any type of information on the education project in their communities and
existence of opportunity to complain about poor performance of the education project.
Within the communities, accountability is also examined by looking at the existence or
otherwise of rules and sanctions guiding the use of the education facility or project.
With regard to whether opportunity exists for reporting poor school facility/project to
MDA officials, most of the respondents (55 percent) expressed lack of opportunity to make a
report/complain. In addition to the above, the issue of accountability is examined with
respect to the relationship among beneficiaries. This relates to the existence of rules and
guidelines for usage of education projects within communities and whether these are
enforced. Such rules and sanctions are important to ensure that projects are properly
utilised. Evidently, rules and sanctions exist as indicated by majority of respondents (54
percent) and are applied on everyone as indicated by 86 percent of respondents. This is
indicative of the high level of importance attached to them. Clearly, these help to ensure that
projects are put to good use.
5.2.1.1 Effects of Participation on Education Service Delivery
The output indicators in respect of education service delivery are the proportion of pupils
who passed the common entrance examination at the end of their course in a particular
school and adequacy of classrooms. Invariably the input of teachers, distance between
students’ residence and schools and governance structure are critical variables that will
determine such output/outcome. With regards to governance and students’ performance, It
is expected a priori, that the relationship between students’ performance and number of
teachers will be positive. In other words, the higher the number of teachers, the higher will
be the proportion of students that pass common entrance. On the other hand an inverse
relationship is expected between students’ performance and distance from their residence.
Furthermore, the effect of governance on performance is expected to be positive since it

Accountability and Performance of Government Agencies in the Delivery of Water, Education and Road Services in Nigeria
33
breeds an environment that is supportive of knowledge sharing in school management and
development should be conducive for improved performance of students.
The relationship between the output and input variables is examined in a regression
analysis in which the proportion of students who passed common entrance is the dependent
variable while the explanatory variables are the number of teachers, distance of students
from schools and participation of community members in the management of the schools.
The results indicate that participation has no significant role to play in the performance of
students. The main determinants are the number of teachers and geo-political zones
(Appendix Table 5.2.1). Out of the coefficients of the five zones in the model, only the
coefficient of South-east zone is not statistically significant; implying that the effect is not
significantly different from that of the South-south. The performance of students is
significantly higher in the South-west than South-south whereas the performance is
significant lower in each of the northern zones (Northwest, North-east and North-central)
than it is the case in the South-south. These results are consistent with what is known about
performance of students across the country.
The analysis of the effects of governance on education service delivery produced
mixed results depending on the outcome indicators. The major outcomes analysed are the
proportion of pupils who passed the common entrance examination at the end of their
course in a particular school and adequacy of classrooms. The key finding here is that
students’ performance has not been significantly affected by participation of community
members in the provision of education services. The main determinants are the number of
teachers and geo-political zones. The performance of students is significantly higher in the
South-west than South-south whereas the performance is significant lower in each of the
northern zones (Northwest, North-east and North-central) than it is the case in the South-
south. Once again, these results are consistent with what is known about performance of
students across the country.
5.2.2 Accountability Mechanisms and Water Service Delivery
Accountability in the delivery of water services is addressed by assessing access of
beneficiaries to any type of information on the water facility in their communities, existence of
opportunity to complain poor performance of water facility and existence of rules and
sanctions guiding use of water facility. It appears that there is constrained access to any
type of information from both channels of delivery of water services, as claimed by 65.5 per
cent of the beneficiaries of both the MDA and CGS water facilities. However, it appears the
situation is not as bad with CGS channel compared with MDA channel as close to 40 per
cent of the beneficiaries of this channel claimed existence of access to any type of
information compared to the MDA corresponding proportion of 21.3 per cent. With respect
to availability of opportunity to make a report to officials in case of dissatisfaction with

Accountability and Performance of Government Agencies in the Delivery of Water, Education and Road Services in Nigeria
34
functionality or quality of water facility a little above half of the beneficiaries claimed lack of
such opportunity. However, the situation does not seem that bad because close to half of
the beneficiaries claimed the opportunity was there.
However, comparing the two channels, the state of existence of such opportunity is
better with CGS channel as more than 50 per cent of the beneficiaries of the channel
claimed the opportunity was there to lodge complaints. With respect to whether there are
rules and sanctions guiding use of water facility in the community, the situation is almost
neither here nor there. About half of the beneficiaries claimed existence and non existence
of sanctions (Appendix Table 5.2.2). However, more MDA beneficiaries claimed there were
sanctions guiding the use of water facilities, perhaps due to limited opportunity to lodge
complaints if there is problem with the facility.
The importance of water as a utility for domestic, agricultural and industrial activities
creates a sense of serious concern among the various stakeholders. This is why any
delivery channel which seeks to make impact widens the scope of participation of the
stakeholders as is experienced in the CGS channel mode of operation. This is again
responsible for the reason why many stakeholders especially community members seek
participation in the process. As could be seen from the previous section there is relatively
opportunity for lodging complaints and seeking for information on water facilities. It is
reasonable for delivery channels, especially government institutions to provide such
opportunities because water could be used as a political instrument. This is corroborated by
the high level of awareness among community members on execution of water projects and
the procedure for engaging contractors. About nine out of every ten respondents claimed
awareness of water projects in their communities. This is due to the nature of the service. It
is consumed everyday and it means much to their livelihood. The pattern is the same for
both the MDA and CGS channels except that the proportion of respondents claiming
awareness of MDA water projects is slightly higher than that of the CGS channel. This is not
surprising because politicians use provision of water as dividend of democracy and
construction of water projects is always well publicised.
Due to the importance attached to water, there is active participation of community
members. In some communities households are levied to maintain water facilities while
committees are set up to manage proceeds from such levies. This is illustrated below:
“Before contractors are taken to site, the community or schools are visited and requested to make provision for three possible locations for the facility. The first port of call is the LGA. The LGA chairman is informed of the activity taking place in a community in his domain. Then we move into the communities or schools. If it is RUWASSA, rural communities, there are Water, Sanitation and Hygiene Committees (WASHCOM) at the community level. If it is STU, small towns (5000 to 20000 population), there are Water Consumers Association (WCA). They are actively involved in the process” (coordinator, RUWASSA, Anambra State)

Accountability and Performance of Government Agencies in the Delivery of Water, Education and Road Services in Nigeria
35
“When they came, they met village leader and requested for suitable location. Village leader in consultation with 2 Ward Heads and others met and chose a location. Place is central and a bit removed from another borehole constructed by the State” (FGD for CGS water project, Dakaci village, Kajuru, Kaduna State)
5.2.2.1 Effects of Governance Mechanisms on Water Service Delivery
Having examined the different channels for providing water services and the variations in
performance in this study, the basic premise here is to determine the effect of governance
on service delivery focusing on water availability and to ask how improved accountability and
participation could improve this outcome. Thus, in what follows we analyse the effects of
governance indicators such as participation, accountability and awareness on availability of
water at all seasons using a probit model. The data set is based largely on a survey of
beneficiaries’ evaluation of accountability and participation thus examining the demand side
of service delivery. An attempt is made to capture the supply side by including in the model
the channels of service delivery which reflect the different agencies involved in controlling
the supply of water services. At the Federal level, it is only the Federal Ministry of Water
Resources that is the controlling agency as regards the centralized traditional bureaucracy
(CTB) approach whereas in the case of the inter-governmental partnerships (IGPs), the
Office of the Senior Special Assistant to the President on the MDGs is the relevant agency
as far as the articulation and implementation of water provision for achieving MDGs is
concerned. This arrangement therefore precludes a survey of water agencies for the
purpose of assessing the supply side of service delivery. In this connection, a qualitative
approach has therefore, been adopted to examine the governance issues involved. The
inclusion of the service delivery channel in the probit regression is to complement the
qualitative analysis. Other non-governance variables that can affect the service outcome
such as geographical domain or scale of settlement (whether rural or urban) and regional
characteristics proxied by geo-political zones are also included as regressors in the probit
model. Each regression includes zonal (regional) dummies to control for possible regional
differences not captured by the other explanatory variables.
The coefficients of all the explanatory variables in the model are statistically
significant with the exception of participation (Appendix Table 5.2.3). With rising awareness
and increased accountability there is the tendency that the projects implemented will
guarantee water availability all the year round. On the basis of the marginal effects of these
two indicators, the probability of all-season availability of water is apt to increase by 11.8 and
11.7 percent respectively (Appendix Table 5.2.4).
The positive sign and statistical significance of awareness are consistent with a priori
expectation and should be of considerable policy relevance. The policy lesson is that the
beneficiaries should always be aware of their rights and responsibilities with regard to the

Accountability and Performance of Government Agencies in the Delivery of Water, Education and Road Services in Nigeria
36
provision of services in their communities. For instance in the particular case of water
services, the beneficiaries have a role to play to ensure availability of water all year round
and they should be made to recognize and understand this at the appropriate stage in the
design and implementation of water projects. They are to be involved in the maintenance
and repair of water facilities by paying levies for pump repairs and arranging to manage the
process. Since frequent breakdown of pumps can contribute to unavailability of water all
year round, any efforts made by the beneficiaries to undertake repairs as at when due can
lead to an improvement in water availability. These responsibilities have been creditably
discharged in some of the communities included in this study. For instance, FGD
participants in one of the communities with IGP water facility narrated a relevant incidence:
“Hand pump handle was broken by the children within the six month of its commissioning and we called the contractor to come and repair it. Afterwards, when there is a breakdown, beneficiaries often contribute money. People are levied and are ready to contribute between ₦100 and ₦300.” (FGD participants, Kufana Village, Kajuru LGA, Kaduna State)
The coefficient of geographical domain is negative and significant. The variable (domain)
has a value of unity for rural areas and zero otherwise. The result therefore, implies that
there is a higher probability of all-year round water in the urban areas than rural areas. This
result actually corroborates the findings of the qualitative analysis. As rural-urban pattern of
distribution of respondents in that analysis shows that more urban respondents than their
rural counterparts claimed water is available all year round for both CTB and IGP channels.
With regard to the geo-political zones, the coefficients are all positive. This implies that
availability of water is better in each of the zones than it is the case in the South-south zone.
In the light of the foregoing the quantitative analysis indeed, tends to validate the findings of
the qualitative aspects of the study and this complimentary results have actually
strengthened the authenticity of the findings in general.
In sum, attempts have been made to examine governance of delivery of water
services in Nigeria looking at two different channels – the IGP and the CTB channels. The
water sector suffers from policy inconsistency and poor policy implementation. This has had
adverse impact on delivery of water services in the country in spite of availability of abundant
water resources. The performance of the two channels using governance indicators like
awareness, participation, and accountability reveals that generally, the IGP channel fairs
better. The channel has a framework for involving beneficiaries in needs assessment,
choice of locations of water projects and in the operation and management of water facilities.
With respect to Accountability, though the performance of the two channels is not
impressive, the IGP channel nevertheless has an edge over that of the CTB. Higher

Accountability and Performance of Government Agencies in the Delivery of Water, Education and Road Services in Nigeria
37
proportion of IGP beneficiaries claimed access to any type of information on water facilities
in their communities, compared to the CTB beneficiaries.
With respect to the performance of water facilities such as water availability all year
round, accessibility to beneficiaries’ residences, affordability of water and water adequacy,
majority of the beneficiaries of the two channels expressed satisfaction but generally the IGP
channel has a slight edge over that of CTB. An examination of the impact of water facilities
provided through both channels on the situation of water in the beneficiaries’ communities
between 2008 and 2011 revealed that, to majority of the beneficiaries of both channels, the
situation in 2011 was better compared to that of 2008. This is with respect to water
availability, accessibility, adequacy, affordability, quality and the time spent fetching water.
Though both channels of delivery have impacted positively on the situation of water in the
various communities where they were located, sustainability become a serious issue, as
substantial proportion of beneficiaries claimed the water facilities are not functional
throughout the year due most especially to incessant breakdown of generating plants and
mal-functioning of water pumps. However, it appears that the IGP channel has a better
arrangement for carrying out repairs, compared to that of CTB.
5.2.3 Accountability Mechanisms and Quality of Road Service Delivery
One of principal reasons for placing the provision and maintenance of rural feeder roads
under the jurisdiction of the 774 Local Governments in Nigeria is that Federal Government is
too far removed from the grass-root to effectively assess their needs, just as it would be too
difficult for the Federal Government to assess the conditions and rehabilitation needs of
feeder roads due to the huge size of the country, especially with the rural roads accounting
for 67% of the total country’s total road network. Moreover, by constitutional arrangements,
the implementing Federal Government Agency, Federal Ministry of Agriculture and Rural
Development (FMARD) and the private contractors it hires are not accountable to the
beneficiary communities. As a result, there was complete disregard for the role of users in
accountability mechanisms for ensuring quality of feeder roads being provided. With no
mechanism put in place to lay complaints by users, beneficiary communities were left at the
mercy of contractors to execute the road projects according to specifications, or not to
execute at all as it were some many cases.
Rather, accountability mechanisms put in place were between the Federal
Government implementing agency (FMARD) and its Contractors. Even at this level, results
from the field indicate high levels of non-compliance to the accountability mechanisms by the
principal actors (Officials of the FMARD sitting in Abuja, the State Coordinators of FMA&RD
and the Private Contractors hired to execute the projects). On performance monitoring of
contractors in particular, which was the responsibility of the State Coordinators of the

Accountability and Performance of Government Agencies in the Delivery of Water, Education and Road Services in Nigeria
38
FMARD, the Coordinators interviewed indicated that the reporting and feedback
mechanisms, which were to play significant roles in the effective execution of the road
projects by contractors were completely undermined by their superior in Abuja. According to
them, the stage by stage supervision and performance monitoring reports sent to
Headquarters in Abuja were of no effect as they received no feedbacks from Abuja.
Consequently, they lacked ability to enforce compliance, rules and sanctions. The situation
was similar with regard to implementation of the MDGs and the Constituency funded feeder
roads across all the states studied. It was therefore not surprising that, all the State
Coordinators contacted reported tales of woos in project implementations. Surprisingly,
facts available with the State Coordinators indicate that many of non-performing contractors
received payments at Abuja with complete disregard to performance monitoring reports
submitted by them.
On quality of roads that were completed, the beneficiary community members
interviewed indicated that the benefits they enjoyed lasted less than a year after completion
of the projects, as the roads easily washed off with the onset of the first rainy season. With
no maintenance mechanism built into the road projects, the community members remarked
that many of the feeder roads soon turned out to be gullies. Nonetheless, the tremendous
benefits of feeder roads to rural communities are not in doubt. With regard to one completed
feeder road in Kaduna State, for example, an elated community head had this to say:
As father of the village, I have seen the benefit in terms of improved transportation of farm products and movement of people, improvement in trading and commercial activities in farm products such maize, tomato, yam pepper, groundnut, onion. As a result of the road, we can now take our farm products from this village to Kaduna, Zaria, and Kano even up to Abuja. Also, if someone is sick, the person can easily be taken to Mararaba – Jos hospital. Moreover, commercial motorcycle business (Okada) began to thrive from Rahama to Mararaba Jos due to the road. The road has reduced cost of transportation. Before the road was constructed, Okada journey to Mararaba Jos was N600, but now it is between N200 - N250. Travel time has also reduced from 2 hours before to about 30 minutes. Also vehicle breakdowns have reduced.
But in spite of these immediate benefits, the roles of community members in ensuring quality
through project management tools inherent in participation and accountability were lacking.
This is partly responsible for the short lifespan of the benefits of the completed feeder roads
which easily got deteriorated after completion due to poor project execution and
management. The situation is most likely to be better if the Local Governments are to
implement the road projects as they are directly accountable to the rural communities. At
that level, local participation and accountability mechanisms are most likely to be very
effective given the opportunities available to communities to make complaints, determine
their needs, etc, through their Representatives that are easily accessible to them at the Local
Government Council Offices.
Accountability and Performance of Government Agencies in the Delivery of Water, Education and Road Services in Nigeria
39
5.3 Sectoral Differences and Other Factors Influencing Governance Mechanisms
The hypothesis to be tested in this section is that accountability and participation in service
delivery are significantly influenced by the socio-economic characteristics of the
beneficiaries. Essentially, the question to be tackled, inter alia, is what factors influence
governance in the delivery of the various services? In terms of sectoral differences, it is
important to note that road has the most centralized delivery channel. Although water and
education have some form of inter-governmental partnership, the governance practices vary.
Governance on the demand side is grossly limited in the education sector whereas it is far
more pronounced in the case of water. There are opportunities for community participation
as well as involvement of private sector and civil society organizations in the monitoring and
evaluation of water service delivery (Appendix Table 5.3). These differences in delivery
channels may account for variations in performance. There are also differences in the
outcome variables in terms of their physical and economic characteristics. For instance, the
degree of ‘publicness’ varies substantially between water and road and between education
and road. On the other hand there is not even justification for the comparison of the
outcomes from the three sectors in terms of their physical characteristics. It is far more
valuable, therefore, to examine intra-sectoral differences in service delivery channels to
ascertain their influence on performance and to provide the basis for prescribing reform
measures. The water sector stands out in this regard and is relied upon for analytical
evidence; although the education sector is also relevant for the purpose of validating the
specified hypothesis.
5.3.1 Factors Influencing Governance Mechanisms - Accountability and Participation
in Education Service Delivery
As indicated, intergovernmental partnership between UBEC and SUBEB is the identifiable
channel of service delivery for education projects. This form of partnership is non-existent
for road and water services. As an important governance indicator, it is perceived that giving
people the opportunity to participate in various stages of project implementation enhances
the credibility of the channel of delivery, project acceptability and ownership all of which
impact positively on the sustainability and overall success of the project. Thus, the extent to
which MDA education projects provide opportunity for stakeholders’ participation is given
particular attention. It was found that less than half of the respondents (48 percent)
participate in the execution of education projects implemented through this channel. Fifty
percent of respondents indicate the reason for non-participation in education projects as lack
of participation opportunity while 34 percent claim that their non-participation is due to lack of
Accountability and Performance of Government Agencies in the Delivery of Water, Education and Road Services in Nigeria
40
awareness of such projects. Much more crucial is the level at which respondents
participated in the execution of education projects. Most respondents (45 percent) indicated
that this is at the level of ‘Repairs & Maintenance of School Facilities’. This is followed by
‘Purchase of Educational Consumables’ (18 percent). It is disheartening that the three main
areas that may most account for ownership and ultimately sustainability attract the least
levels at which respondents participate in education projects viz: ‘Project/Programme
Identification’ (15 percent), ‘Needs Assessment and Prioritisation’ (nine percent) and
‘Location of Educational Project’ (six percent). Clearly, there is need to enhance the
credibility of this channel of delivery, project acceptability and ownership all of which would
impact positively on the sustainability and overall success of projects.
5.3.1.1 Factors Influencing Participation and Accountability in Education Service
Delivery in Nigeria
A probit model is estimated to determine the key characteristics that influence governance in
the delivery of education services. The two indicators of governance involved in the analysis
are participation and accountability. The explanatory variables in the participation model are
age of head of household, household size, household income, education of head of
household, distance between the household and the education facility (primary school),
geographical domain of the facility (rural or urban) and the region (geo-political zone) in
which the school community is located. The results of the analysis are presented in
Appendix Tables 5.3.1 and 5.3.2 in terms of the estimated coefficients and marginal effects.
The results show that age, household size, distance and geographical domain are
not significantly related to the probability of participation in service delivery in the education
sector. The probability that beneficiaries will participate does not differ between rural and
urban areas. The significant predictors of participation are income, educational attainment
and geo-political zones. Out of the six geo-political zones, the South-south zone is adopted
as the reference zone for the analysis. The effect of each of the remaining five zones is
therefore, considered in relation to that of South-south. In the case of North-west and South-
west, there seems to be no difference in their effects relative to that of South-south. The
probability that beneficiaries in the North-east will participate is significantly lower than that of
South-south whereas in the South-east and North-central, it is significantly higher.
As regards education and income, the analysis reveals that the higher the income
and educational attainment of the community members, the lower the probability of
participating in the delivery of education services. Thus, the a priori expectation that good
governance will prevail in a community with high income and high educational attainment is
contradicted by this result. However, this is not surprising as far as Nigeria is concerned and
the finding will be insightful in articulating better policies to strengthen the service delivery

Accountability and Performance of Government Agencies in the Delivery of Water, Education and Road Services in Nigeria
41
channel. Indeed, the finding is a reflection of the reality even at the country level. Evidently,
it is known that the higher the growth of the Nigerian economy, the worse the incidence of
poverty has been over the years in spite of the emphasis on improved political participation,
corruption reduction and governance reforms aimed at creating better service delivery
channels. For instance, real GDP in Nigeria grew from 6.5 percent in 2005 to 7.82 percent
in 2010 while the incidence of poverty rose despicably from 54.4 percent to 70 percent over
the same period based on data from the National Bureau of Statistics. Poor governance is
one of the major reasons for this development paradox. The fact that rising income and
educational attainment tends to be associated with decreasing probability of beneficiaries’
participation in education services delivery as revealed by this study is a reflection of poor
governance in the education sector and it is an indication that despite the activities of UBEC
and SUBEB the crisis of governance in terms of lopsided participation of the citizens in the
implementation of service delivery projects remains unresolved. There is therefore, a great
lacuna to be filled in terms of re-designing education policies and re-engineering service
delivery channels to resolve the governance issues retarding progress in the sector.
The analysis in respect of accountability indicates that distance, educational
attainment and geographical domain are not significant determinants. Specifically, there is
no significant difference in accountability between rural and urban areas as far as education
service delivery is concerned. The significant predictors are household size, age, income
and geo-political zones. The higher the household size the higher is the probability that
project implementers will be held accountable whereas the probability is lower with rising
income and age (Appendix Table 5.3.3). For instance, household size has a marginal effect
of about 0.9 percent increase in the probability that the implementers will be held
accountable; whereas the marginal effect of age is a reduction in the probability by 0.3
percent. The marginal effect of distance, education and geographical domain is not
significantly different from zero. There is no difference in accountability in the North-central
and South-west zones relative to the South-south zone. The probability to hold
implementers accountable is lower in the North-west relative to the South-south whereas it is
greater in the North-east and South-east (Appendix Table 5.3.4).
The accountability indicator being analysed is the willingness of the beneficiaries to
exercise the right to “voice” in the delivery of education services. Specifically, the result
indicates that the opportunity to make complaints against violation of preferences in
decisions regarding the allocation of resources, choice of location of education facilities and
management of resources provided by parents and teachers associations (PTAs) etc. and
secure appropriate response depend mainly on the age and income of the beneficiaries and
the household size. The result indicates that older citizens are not likely to enforce
accountability compared to younger members of the community. This is plausible since the

Accountability and Performance of Government Agencies in the Delivery of Water, Education and Road Services in Nigeria
42
time, vigour and transaction costs involved may be more difficult to bear for older than
younger citizens. The positive and statistically significant coefficient of household size is an
indication that it should be better for larger households to meet these requirements relative
to households of smaller sizes. Moreover, the motivation to hold government officials and
service providers accountable may be more compelling for larger households that are likely
to have more potential beneficiaries of primary education compared to smaller households.
There are two sides to the explanation of the negative relationship between income
and accountability. Even though wealthier citizens are likely to cope better with the
transactions costs of expressing their “voices”, they may not be enthusiastic to do so if there
are alternative services which they can utilize (as it is the case in Nigeria) while the public
services are faced with the problem of poor governance. Besides, if the beneficiaries’ trust
and confidence in the regulatory authorities and service providers to remedy the situation
have waned considerably as it is the case in Nigeria in recent times, the motivation to
enforce accountability may be relegated even when income of dissatisfied beneficiaries
seem to be rising.
5.3.2 Effects of Channel Differences and Other Factors on Accountability and
Participation in Water Service Delivery
In the water sector, services are delivered through two major channels namely; the
centralized traditional bureaucracy (CTB) approach under the control of Ministry,
Departments and Agencies (MDAs) and the Inter-governmental Partnership (IGP) approach
under the conditional grant scheme (CGS). It is hypothesized that governance of service
delivery will be influenced by these varieties of delivery channels in addition to the socio-
economic and demographic characteristics of the beneficiaries and the location of their
communities in the rural and urban areas.
5.3.2.1 Factors Influencing Accountability and Participation in Water Service Delivery
The analysis proceeds with participation and accountability as indicators of governance in a
probit model in which household size, age, educational attainment, income, geographical
domain (rural-urban), channel of service delivery (IGP or CTB) and geo-political zones are
included as explanatory variables. The South-south zone is selected as the benchmark for
comparing the effect of the other five zones which are included in the model as dummy
variables. The results of the participation model show that household size and age have no
significant effect on probability of participation. The significant determinants are educational
attainment, income, geographical domain, channel of service delivery and geo-political
zones (Appendix Table 5.4.1). The marginal effect of income seems imperceptible but

Accountability and Performance of Government Agencies in the Delivery of Water, Education and Road Services in Nigeria
43
judging by the sign and significance of the coefficient, the implication is that with rising
income, the probability of participation may reduce.
With regard to education, the marginal effect is that the probability of participation is
apt to reduce by about 0.58 percent with an increase in educational attainment (Appendix
Table 5.4.2). The coefficients of domain and channel are positive and statistically significant.
This implies that the probability of participation is significantly higher in the rural than urban
areas. Moreover, the probability of participation is significantly higher in the case of IGP
than CTB. These results are consistent with the findings of the qualitative analysis.
Out of the five geo-political zones included in the analysis, only the North-west and
North-east have significant coefficients; implying that the other three – North-central, South-
west and South-east - are not significant determinants of participation. Furthermore, the
coefficient of North-west is positive and this implies that there is a significantly higher
probability of participation in the zone than it is the case in the South-south (which is the
reference zone). On the other hand, the coefficient of North-east is negative and this implies
that there is a significantly lower probability of participation in the zone than it is the case in
the South-south.
As regards accountability, the results show that age and channel of service delivery
are not significant determinants. In the case of the latter, the implication is that the
probability of holding project implementers accountable is unlikely to change significantly
irrespective of the channel adopted in providing water for the communities. As shown in
Appendix Table 5.4.3, the significant variables are household size, education, income,
geographical domain and geo-political zones. The marginal effects of household size and
education are positive and they are capable of increasing the probability of accountability by
1.14 and 1.22 percent respectively (Appendix Table 5.4.4). Although the marginal effect
appears imperceptible, the implication of a negative coefficient of income is that rising
income has a tendency of lowering the probability of accountability.
The result in the case of education is consistent with a priori expectation. A more
educated individual is likely to have greater awareness of his rights and have better access
to information. They also should be more willing to complain about poor performance since
they are supposed to have a better understanding of the rules and sanctions guiding the
delivery of water services. Thus we should expect that a higher level of education should
lead to greater accountability as the results reveal. A similar relationship may be expected
between income of individuals and accountability. Contrary to expectation, however, the
results show that accountability and income are negatively related. This implies that even
when income is increasing, users may not be willing to express their voice against providers.
However, it important to ask why an increase in the income of users will not lead to
greater access to the mechanisms that they can use to “voice” suggestions and complaints.

Accountability and Performance of Government Agencies in the Delivery of Water, Education and Road Services in Nigeria
44
What the result is showing is that this is possible in areas where poverty is endemic. In
other words where income is generally low, citizens may not be capable of holding providers
and government officials accountable. A critical level of empowerment (in terms of income)
is required before citizens can exercise their rights even when they have a clear
understanding of such rights. This result is consistent with the findings of Kaufmann et al
(2008) in their analysis of the effects of some socioeconomic variables (including education
and income) on users’ discouragement from using services when needed. The authors had
expected that the number of citizens that would be discouraged (i.e. chose not to use
services on account of poor governance even when they are needed) would be positively
correlated with income and education among other factors. The coefficient of education in
their probit regression goes from negative in primary education to positive for university
education. In the case of income, the coefficient is negative for low income, positive for
middle income and zero for high income. The citizens covered in the Nigerian study are
largely of very low level of education and of very low income; judging by the high incidence
of poverty in the country which is currently put at about 70 percent. The result is therefore,
not totally surprising.
It is also not surprising that the effects of education and income are different. This is
because an increase in educational attainment especially in rural areas may not necessarily
translate to a significant increase in income. With the high rate of unemployment and high
transactions costs in the country, undertaking activities that will bring service providers into
account may be a tall order for the citizens. Thus, in the face of poor governance and
unsatisfactory performance, citizens may be discouraged from investing their time and
money on presenting complaints if they know that their “voice” will likely fall on deaf ears or
the cost will be prohibitive. In other words, they may rather “exit” from the service or remain
ambivalent than attempting to enforce accountability especially in situations where
alternative sources of water exist. Indeed, this result corroborates the qualitative analysis
earlier presented. The analysis clearly indicates that some community members who
expressed their displeasure with the lack of consultation demonstrated by the government
officials and service providers before making decisions about the type and location of water
facilities, were not enthusiastic to participate in the management as well as monitoring and
evaluation of the water projects.
As depicted by the results of the qualitative analysis in previous chapters, the effects
of geographical domain and geo-political zones on governance vary widely. The results are
corroborated by the estimated probit model on accountability in this section. The results
reveal that the probability to hold project implementers accountable is significantly higher in
the rural than urban areas. The effects of geopolitical zones on accountability are not
statistically significant in the case of North-west and South-west zones. The effect is

Accountability and Performance of Government Agencies in the Delivery of Water, Education and Road Services in Nigeria
45
significantly higher in the case of North-east and North-central than it is in the South-south.
In the case of South-east, the coefficient is negative and significant implying that the
probability of being accountable is lower in this zone than in the South-south.
5.4. Rural-Urban Split in Accountability of Public Service Delivery
This section focuses on the differences in the findings relating to the urban and rural areas.
Essentially this is to address the hypothesis that performance of service delivery is
significantly affected by geographical location. Since the road services are basically rural-
based, the findings here relate to the education and water sectors where there are
possibilities of urban-rural differences in service provision and governance mechanisms.
5.4.1 Geographical Differences in Accountability of Education Service Delivery
With regard to effectiveness of government channels for delivering public services, the
situation is worse in the rural areas where 62 percent of respondents identify this
inadequacy that is also more acute in the south east (94 percent). Inadequacy in rural areas
can be attributed to the low level of development of many rural areas in Nigeria and to which
many government workers including teachers dislike being posted to. Teachers are more
available in the north east (73 percent) and northwest (65 percent). This is not surprising
due to the low level of (western) education pervasive in these zones and which government
may consciously want to improve through posting of teachers.
The preponderance of inadequacy of classrooms, is observed in the south east (93
percent) and slightly better in the north east (75 percent). At least two geo-political zones
(north east and south east) have 100 percent access to SUBEB education projects. It is only
in the southwest and northwest that only 53 percent and 69 percent respondents
respectively claim to have access. The rural areas of the southwest zone are also affected
by poor access as indicated by 53 percent of respondents. With regard to affordability, the
situation is the case in all the geo-political zones except for the northwest where up to 61
percent of respondents claim that education is not affordable. It has been indicated already
that though education is said to be free, in some zones/states, parents still have to provide
their children with uniforms, other books etc that are not covered by this channel of service
delivery. As such, education may still not be considered so affordable. In the words of the
Yobe state Girl-Child Education (GEP) Desk Officer,
“In spite of the free education policy, girl-child primary school enrolment is still very poor in the rural areas. The situation is a bit better in the urban areas. The poor girl-child enrolment is due to the prevailing high level of poverty in the state. Poverty affects basic education because even though basic education is said to be free, parents in Yobe state still have to provide their children with uniforms, books, etc. Moreover, even though the phenomenon is reducing, the value attached to girl child education, especially in the rural areas is very low, such that parents, especially mothers, prefer their daughters to go hawking in the streets in order to bring home the much needed money”.
Accountability and Performance of Government Agencies in the Delivery of Water, Education and Road Services in Nigeria
46
The clearly complimentary trend with regards to perception of quality of entire education
project environment is observable in the northeast, northcentral, northwest and south-south.
It is only in the southeast that the perception of quality of projects is rated ‘Fair’ by most (77
percent) of respondents, while it is only in the southwest that they are rated ‘Poor’ by as
many as 29 percent of respondents. Again this may be explained by not much need for or
appreciation of MDGs assisted projects in the south west zone.
With regard to impact of education projects put in place since 2008-2011, by geo-
political zones, education is said to be better available than before in the north central (91
percent) and north east (82 percent); it is better accessible in the north central (89 percent)
and south west (83 percent); and better affordable as well in the north central (90 percent)
and south east (87 percent). In terms of access to any type of information about MDA (CGS
Variant) Education Projects. The lack of access is more so among rural (78 percent) than
among urban residents (67 percent). This can be attributed to the fact that urban residents
who utilise public facilities are more likely to seek out information than their rural
counterparts. The situation is more pronounced in the northeast, southwest and northwest
geo-political zones. More access is indicated by south east urban (86 percent) and rural (48
percent) respondents (Figure 5.5).
Lack of opportunity to make a report/complain about poor school facility/project to
MDA officials, is worse in the rural (66 percent) than urban (54 percent) locations. The
situation is more unfavourable in the rural (66 percent) than urban (54 percent) locations.
This to some extent underscores the belief that the higher level of enlightenment in urban
areas with respect to having knowledge of the possibility of, and the procedure for making a
complaint or report, as well as the manner of going about this, the higher the likelihood of
knowing about and utilising the opportunity. Here, urban respondents will clearly have an
upper hand over their rural counterparts. In conclusion, it is obvious that the governance of
service delivery has been relatively effective resulting in positive changes in availability,
access, affordability and quality. The effects appear to be better in urban than rural areas.
5.4.2 Geographical Differences in Accountability of Water Service Delivery
This section examines the rural urban dichotomy with respect to effectiveness in
accountability, participation, awareness mechanism with respect to provision of water
services and whether there are some peculiar socio-economic characteristics responsible if
some differences are observed. With respect to respondents’ level of awareness of
implementation of water facilities, Though majority of the respondents in the rural (94.4
percent) and urban (88.6 percent) areas claimed awareness of execution of water projects
for the two channels of delivery, the proportion of the respondents in rural areas in this

Accountability and Performance of Government Agencies in the Delivery of Water, Education and Road Services in Nigeria
47
category is higher than that of their urban counterparts (Appendix Table 5.,4). This suggests
that level of awareness of water execution of water facilities is higher in the rural areas than
in the urban areas. This could be attributed to the small size of rural communities and the
large size of the urban communities. It is easier for rural community members to know what
goes on in their communities due to close social relations that exist there, compared to the
complex urban communities. The same applies to level of awareness of the procedure for
engaging contractors for the execution of water facilities.
With respect to participation in execution of water facilities, though majority of the
respondents claimed lack of participation in the execution of both the MDA and CGS water
facilities, for MDA water facilities, the proportion of those who participated in rural areas
(37.8%) is much higher than that of those who participated in urban areas(4.5%) as
indicated in table 4. This could be attributed to the fact that MDA focuses more on rural
areas than urban areas. Another reason could be that urban residents hardly find time to
participate compared to their rural areas; and that mobilization is easier in rural areas than in
urban areas. With respect to CGS water facilities, the proportion of participants in the urban
areas and rural areas are almost at par. This is could be because CGS water facilitates are
both for urban and rural communities, and CGS has a built in mechanism for strong
involvement of stakeholders.
With regard to access to any type of information on the water facility, though for the
two channels of water service delivery, majority of the respondents claimed lack of access,
the proportion of the urban respondents (27.4 percent) that claimed access to any type of
information on MDA water facilities is higher than that of their rural counterparts. As for CGS
water facilities the proportions of rural and urban respondents that claimed existence of
access to information are almost at par. This pattern suggests the state of access to
information on water facilities is better in the urban areas that in the rural areas. The
plausible reasons for this could be higher level of education and enlightenment among
respondents in the urban areas as well as ability to afford the cost of asking for information
like use of telephone and cost of transport to sources of such information. The same applies
to availability of opportunity to make a report to officials in case of dissatisfaction with
functionality of water facility, a situation which appears to be better as indicated in Appendix
Table 5.4. However, when it comes to availability of rules and sanctions guiding use of
water facility, it appears that rural communities have more of such sanctions compared to
urban communities for both MDA and CGS water facilities. The reason for this is likely to be
associated with the fact that in rural areas, water sources are scarce and the available ones
have to be well managed and guided seriously unlike in the urban areas where there are
many alternatives.

Accountability and Performance of Government Agencies in the Delivery of Water, Education and Road Services in Nigeria
48
6. Summary of Key Findings, Policy Implications and Conclusions
This study sought to examine the governance and performance of public service delivery in
the education, road and water sectors for the achievement of MDGs in Nigeria following the
adoption of alternative channels since the early 2000s. In the analysis we hypothesized that
accountability and participation in service delivery have significant effects on output in the
education and water sectors and that these governance indicators are significantly
influenced by the socio-economic characteristics of the beneficiaries. Moreover, it was
hypothesized that performance of service delivery is significantly affected by geographical
location of beneficiaries. In what follows we present the summary of findings, conclusions
and policy implications.
6.1 Summary of Key Findings
The findings derive from a combination of the validation of the working hypothesis and
qualitative analysis of the governance issues in each of the three sectors included in the
study. Accordingly, the summary of findings are presented with highlights from the results of
such validation relating to the education and water sectors and qualitative analysis relating to
the road sector.
6.1.1 Findings in Respect of Education Service Delivery
We reject the hypothesis that participation and accountability are significantly affected by
geographical location. We found that there is no significant difference in the effects of
participation and accountability between rural and urban areas as far as education service
delivery is concerned. On the other hand, we accept the hypothesis that participation and
accountability are significantly affected by socio-economic characteristics. The significant
explanatory variables are income and educational attainment (for participation) while in the
case of accountability the predictors are household size, age, income and regional
characteristics reflected in the geo-political zones. The fact that rising income and
educational attainment tends to be associated with decreasing probability of beneficiaries’
participation in education services delivery as revealed by this study is a reflection of poor
governance in the education sector and it is an indication that despite the activities of UBEC
and SUBEB the crisis of governance in terms of lopsided participation of the citizens in the
implementation of service delivery projects remains unresolved.
With regard to the hypothesis that governance has significant effects on education
service delivery, the results depend on the type of output and governance indicators. We
reject the hypothesis in the case of participation and accept it with regard to accountability.
The major output indicators analysed are the proportion of pupils who passed the common
entrance examination at the end of their course in a particular school and adequacy of

Accountability and Performance of Government Agencies in the Delivery of Water, Education and Road Services in Nigeria
49
classrooms. The key finding is that students’ performance has not been significantly
affected by participation of community members in the provision of education services. The
main determinants are the number of teachers and regional characteristics. The
performance of students is significantly higher in the South-west than South-south whereas
the performance is significant lower in each of the northern zones (Northwest, North-east
and North-central) than it is the case in the South-south. These results are consistent with
what is known about performance of students across the country.
Furthermore, the results show that adequacy of classrooms does not differ
significantly between rural and urban areas and is not affected by participation of community
members in the delivery of education services. The significant explanatory variables are
awareness, accountability and regional characteristics. The probability of classroom
adequacy tends to increase significantly with increase in awareness and accountability. This
is understandable given the innovative governance mechanisms under the School Based
Management Committees (SBMCs) introduced into the primary education system in 2005.
Through the instrumentality of the (SBMCs), community members seem to have been able
to exercise their collective voice which occurs in the interactions among members, policy
makers (regulators) and school authorities. The SBMCs have accountability responsibilities
and there are procedures to ensure full awareness and understanding. These include a
responsibility for the oversight of school finances and they work directly with Head Teachers
in managing school accounts. The SBMCs also provide funding for the provision of facilities
in schools based on needs. The positive and significant effects of awareness and
accountability in this study is therefore, an indication that the discharge of these
responsibilities have started to yield desirable results especially in terms of improvement in
the adequacy of classrooms in primary schools in the communities included in the study.
6.1.2 Findings in Respect of Water Service Delivery
With regard to governance of water service delivery, we accept the hypothesis that
participation is significantly influenced by the socio-economic characteristics (income and
educational attainment) of the beneficiaries and channels of service delivery. With rising
income and educational attainment the probability in water service delivery may reduce.
Moreover, we found that the probability of participation is significantly higher in the rural than
urban areas; and it is significantly higher in the case of inter-governmental partnerships
(IGP) than centralized bureaucratic (CTB) channel. As far as accountability is concerned,
we also accept the hypothesis that socio-economic characteristics (household size, income
and educational attainment) of the beneficiaries and channels of service delivery are
significant determinants. Household size and educational attainment are capable of
increasing the probability of accountability whereas income has a tendency of lowering the

Accountability and Performance of Government Agencies in the Delivery of Water, Education and Road Services in Nigeria
50
probability in the sense that when income is increasing, users may not be willing to express
their voice against providers. The results also reveal that the probability to hold project
implementers accountable is significantly higher in the rural than urban areas.
Furthermore we examined the effects of governance on service delivery focusing on
water availability and found out how improved accountability and participation could improve
this outcome. We have to reject the hypothesis that participation in water service delivery
has significant effect on output whereas in the case of accountability the hypothesis is
accepted. The results show that with rising awareness and increased accountability there is
the tendency that the projects implemented will guarantee water availability all the year
round. Also, we accept the hypothesis that performance of service delivery is significantly
affected by geographical location as evidenced by the result which shows a higher
probability of all-year round water in the urban areas than rural areas.
Inter-governmental partnerships through the conditional grant scheme (IGP/CGS)
and centralized traditional bureaucracy (CTB) are the channels through which water services
are delivered as part of the efforts to achieve the MDGs in Nigeria. Governance of service
delivery through the IGPs seems to be better than CTB in terms of awareness of
procedures, rights and responsibilities, access to information and willingness and existence
of opportunities to report poor performance. The IGP/CGS channel also appears better with
respect to water availability, affordability, functionality, adequacy and arrangement for
repairs and maintenance of facility as well as access and quality. Nonetheless, the two
channels have positive impact on the water situation of the communities where they were
located.
6.1.3 Findings in Respect of Road Provision
Road services are provided through the centralized traditional bureaucracy – an approach
that is bedevilled with numerous governance challenges. The implementation of rural road
projects using the two variants of this approach (MDGs and the Constituency Funds) was
fraught with problems that led to general poor performance by service providers
(contractors) in all the regions. Many of the problems such as weak monitoring as well as
inadequate material and financial resources could have been averted if the State
Coordinators of the projects were empowered financially and logistically to carry out their
assigned responsibilities which they clearly understood. .The situation was worsened by the
roles of the State Coordinators being undermined by non-response to their technical
monitoring reports to Headquarters in Abuja. As a result, they lacked the ability to enforce
compliance to specifications and or enforce sanctions on non-performing contractors. Thus,
the crisis of poor participation and accountability continue unabated. Nonetheless, in the

Accountability and Performance of Government Agencies in the Delivery of Water, Education and Road Services in Nigeria
51
communities where rural roads have been provided community members acknowledged the
tremendous socio-economic benefits that have accrued to them.
6.2 Policy Implications and Recommendations
6.2.1 Policy Recommendations for Improved Education Service Delivery
Even though positive changes have taken place in education service delivery between 2008
and 2011, the trend where majority of respondents claim that SUBEB education projects are
affordable needs to be maintained and improved upon if the country is to achieve universal
primary education by 2015 or beyond. In these schools, books and other instructional
materials and at times a meal a day should be provided each child for free or at the most, a
token, in order to encourage new entrants and retain those already within the system. This
is a sure way to ensure that beneficiaries equally take advantage of accessibility and
availability.
The fact that rising income and educational attainment tends to be associated with
decreasing probability of beneficiaries’ participation in education services delivery as
revealed by this study is a reflection of poor governance in the education sector and it is an
indication that despite the activities of UBEC and SUBEB, the crisis of governance in terms
of lopsided participation of the citizens in the implementation of service delivery projects
remains unresolved. This huge lacuna needs to be filled in terms of re-designing education
policies and re-engineering service delivery channels to resolve the governance issues
clogging the way of progress in the sector. Generally, beneficiaries of education projects
need to have more room and opportunity to participate at higher levels of the project
execution cycle.
The effect of governance on performance is expected to be positive and the
participation of community members in the management of school is very crucial. Therefore,
community members’ knowledge, experience and approaches of resolving issues and of
making valuable contributions for smooth running of schools as well as monitoring the way
teachers perform their functions need to be harnessed and an environment supportive of
knowledge sharing in school management and development be created for improved
performance of students. This will ensure that management responsibility is not left in the
hands of government; be it at the Federal, State or local level. Nevertheless, this should be
done advisedly since a key finding of the study is that performance has not been significantly
affected by participation of community members in the management of the schools. This is
more crucial in the rural areas and will provide opportunities to complain against violation of
preferences in decisions regarding the allocation of resources, choice of location of
education facilities and management of resources provided by parents and teachers
associations (PTAs).

Accountability and Performance of Government Agencies in the Delivery of Water, Education and Road Services in Nigeria
52
As a way of improving the performance of students, there is need for the government
to provide more teachers in the primary schools. In this connection government should
provide incentives for teachers in rural areas as a form of motivation to prevent absenteeism
and improve their performance.
6.2.2 Policy Recommendations for Improved Water Service Delivery
Since the communities may not be able to handle the maintenance of some water facilities, it
is necessary for the MDGs Office to liaise with the local governments or appropriate
agencies within the states to be involved in assisting the communities in carrying out
maintenance services that are beyond the capacity of the community members. The LGAs
should also be involved in the design of the projects. An important measure to promote
participation of community members is for the contractors to hire labour within the
participating communities for project execution rather than bringing workers from outside the
communities.
6.2.3 Policy Recommendations for Improved Road Provision
To address the poor performance of service delivery in the road sector the following
measures are recommended.: (i) Capacity building for project design, implementation and
management in the road sector should be enhanced at the Local Government level; (ii) Rural
communities should be involved and be sensitized on participatory project design,
implementation and management, and to be aware of their roles in accountability
mechanisms for ensuring quality service delivery, (iii) For effective rural road provision, the
inter-governmental partnership arrangements especially in the water sector should be
adapted to improve the channel of road service delivery in the country, (iv) Preventive
maintenance method is recommended for ensuring that the current situation where most of
the rural roads get deteriorated in the first year of construction/rehabilitation is contained.
Preventive method requires that water must be evacuated as quickly as possible from the
road before it softens the surface and does irreversible damage to the road bed and
foundation. This requires eliminating standing water by filling in of potholes and ruts on level
ground as well as preventing the formation of lateral and longitudinal gullies where the
destructive momentum of flowing water is particularly damaging, (v) Irrespective of the
agencies involved in the provision of rural roads, local governments’ participation in
monitoring and evaluation of road projects must not be negotiated, and (vi) To enhance
durability of roads and minimize cost, alternative materials for paving rural roads should be
developed through research activities rather than relying on asphalt which is usually very
expensive, and the consequent reliance on laterite for surfacing of rural roads.
Accountability and Performance of Government Agencies in the Delivery of Water, Education and Road Services in Nigeria
53
6.3 Conclusions
Effective delivery of services in the education, water and road sectors is critical for the
attainment of MDGs in Nigeria. Earmarking part of government revenue for this purpose is a
step in the right direction. Desirable results will be achieved however, only if there is an
overhaul of the governance mechanisms and delivery channels. The flaws in the
governance of education service delivery continue unabated notwithstanding the inter-
governmental partnership channel for service delivery. Despite the activities of UBEC and
SUBEB the crisis of governance in terms of lopsided participation of the citizens in the
implementation of service delivery projects remains unresolved. Nevertheless, it can be
concluded that the governance of service delivery has been relatively effective resulting in
positive changes in availability, access, affordability and quality.
An important policy lesson emerging from this study is that service beneficiaries
should always be aware of their rights and responsibilities with regard to the provision of
services in their communities. For instance in the particular case of water services, the
beneficiaries have a role to play to ensure availability of water all year round and they should
be made to recognize and understand this at the appropriate stage in the design and
implementation of water projects. They are to be involved in the maintenance and repair of
water facilities by paying levies for pump repairs and arranging to manage the process.
Since frequent breakdown of pumps can contribute to unavailability of water all year round,
any efforts made by the beneficiaries to undertake repairs as at when due can lead to an
improvement in water availability.
Moreover, the emergence of inter-governmental partnership in water service delivery
has demonstrated that a decentralized governance system provides better results. It is
instructive therefore, to ensure that alternative channels for delivery of public services have a
framework for involving beneficiaries in needs assessment, choice of locations of projects
and in the operation and management of facilities. Such a framework enhances
accountability and guarantees effective service delivery. It will also lead to an improvement
in service delivery performance in terms of increased availability, accessibility, quality and
adequacy. A delivery channel that lacks such a framework will find it difficult to deliver
services on the basis of value for money. The road sector where such a framework is
lacking, has witnessed bad governance and poor delivery of service. Thus, in addressing
the decay of road infrastructure in the country, there is need to pay attention to governance
issues including participation, accountability and transparency in the design and operation of
delivery channels.
In the light of the foregoing, a clear message for policy makers is the need to
empower the citizens economically to enable them hold providers of public services
accountable and to discharge their responsibilities creditably. This is borne out of the finding

Accountability and Performance of Government Agencies in the Delivery of Water, Education and Road Services in Nigeria
54
that where poverty is endemic, citizens may not be capable of holding service providers and
government officials accountable. A critical level of empowerment (in terms of income) is
required before citizens can exercise their rights even when they have a clear understanding
of such rights. The poverty reduction programmes of the government should therefore,
continue to be vigorously pursued so that the capacity of the citizens to demand
accountability can be strengthened. Invariably, this is apt to lead to a reduction in corruption
and release of funds for financing public service delivery in the country.
Finally, the point must be stressed that good governance requires timely release of
funds for financing the provision of public services. This study reveals that a major
challenge in the delivery of (education, water and road) services irrespective of the channels
is the delay in releasing funds for the execution of projects. The budget process in the
country does not allow easy and timely access to the funds by intended users. When
budgets are not passed on time by the National Assembly (and even Houses of Assembly in
the states), MDG projects suffer due to delays in fund release. Unspent funds during the
fiscal year are expected to be returned to the treasury. Where and when this occurs service
delivery performance is apt to be adversely affected. Thus, it is apt to point out that
accountability and participation are necessary conditions for improved delivery of public
services and for good governance. However, they need to be fostered parri passu with other
key elements of good governance including effective budget process and timely release of
funds in order to have any significant improvement in public service delivery in the country.

Accountability and Performance of Government Agencies in the Delivery of Water, Education and Road Services in Nigeria
55
References
Azfar, O., Kähkönen, S., Lanyi, A., Meagher, P. and Rutherford, D. (1999) Decentralization, Governance and Public Services The Impact of Institutional Arrangements: A Review of The Literature, IRIS Center, University of Maryland, College Park, USA. Batley R. (2006). Engaged or Divorced? Cross-Service Findings on Government Relations with Non-State Service Providers. Published Online: Www.Interscience.Wiley.Com Berg, E., Ghatak, M., Manjula, R., Rajasekhar, D. and Roy, S. (2011) ‘Motivating Agents to Spread Information: The Role of Explicit Incentives and Social Identity-Matching’, IGC-ISI India Development Policy Conference, Delhi, 20 December. Cornwall A. and Gaventa J. (2000). From Users and Choosers to Makers and Shapers: Re-positioning Participation in Social Policy, IDS Bulletin, Vol. 31 No 4 David M. Van Slyke (2006). Agents or Stewards: Using Theory to Understand the Government-nonprofit Social Service Contracting Relationship: Downloaded from jpart.oxfordjournals.org at Erasmus University Rotterdam on February 3, 2011 Eisenhardt K. M. (1989) “Agency theory: An assessment and review”. Academy of Management Review,14:57-74 Federal Government of Nigeria (2010). Draft National Transport Policy, August, 2010; Federal Republic of Nigeria (FRN) (2010) Millennium Development Goals Report. Federal Republic of Nigeria. Abuja Ford, R. and Zussman, D. eds. (1997) Alternative Service Delivery: Sharing Governance in Canada. The Institute of Public Administration of Canada and KPMG Centre for Government Foundation. Freinkman, L. (2007) ‘Intergovernmental relations in Nigeria: improving service delivery in core sectors’ The World Bank. Online at http://mpra.ub.uni-muenchen.de/10032/ Munich Personal Repel Archive (MPRA) Paper No. 10032 GDN (2009). Markets and Hierarchies in Social Services in Latin America: Incentives, Institutions, and Politics. GDN Working Paper No. 13 September 2009 GDN (2009). A Framework for education service delivery. GDN Working Paper No. 10 September 2009 Global Water Partnership (2002) Introducing Effective Water Governance, mimeo, April Goetz, A. M. and Gaventa, J. (2001) Bringing Citizen Voice and Client Focus into Service Delivery. Working Paper No. 138. Brighton, UK: Institute of Development Studies. Kaufmann, D., Montoriol-Garriga, J. and Recanatini, F. (2008) ‘How Does Bribery Affect Public Service Delivery? Micro-Evidence from Service Users and Public Officials in Peru’, Policy Research Working Paper 4492, The World Bank, World Bank Institute Global Programmes Group. Washington D. C. McMaster, Jim (1999) Alternative Methods of Service Delivery, Economic Development Institute, World Bank

Accountability and Performance of Government Agencies in the Delivery of Water, Education and Road Services in Nigeria
56
NISER (2007) Millennium Development Goals (MDGs) Mid-Point Assessment for Nigeria. Abuja: National Planning Commission. OECD (2002) Distributed Public Governance: Agencies, Authorities and Other Government Bodies, Paris: Organization of Economic Cooperation and Development. Pollitt, C. and Talbot, C. (eds.) (2004) Unbundled Government. A Critical Analysis of the Global Trend to Agencies, Quangos and Contractualisation, London/New York: Routledge, Pollitt, C., Caulfield, J., Smullen, A. and Talbot, C. (2004) Agencies: How Governments do Things through Semi-autonomous Organizations, Basingstoke: Palgrave MacMillan. Rojas, F. (2000) ‘The Political Context of Decentralization in Latin America: Accounting for the Particular Demands of Decentralization in the Region’, In Annual World Bank Conference on Development in Latin America and the Caribbean, edited by S. J. Burki and G. E. Perry, 9–32. Washington, DC: World Bank. Sajor, E. and Minh Thu, N. (2009) ‘Institutional and Development Issues in Integrated Water Resource Management of Saigon River’, Journal of Environment and Development 18 (3): 268–290. Storey, J., Bate, P., Buchanan, D., Green, R., Salaman, G. and Winchester, N. (2008) New Governance Arrangements in the NHS: Emergent Implications, NHS/SDO Working Paper, No. 3. United Nations (2005). World Population to increase by 2.6 Billion over next 45 years, with all growth occurring in less developed countries” http://www.un.org/News/Press/docs/2005/pop918.doc.htm. Retrieved 21 November 2008. van Thiel, S. (2011) ‘Comparing Agencification in Central Eastern European and Western European Countries: Fundamentally Alike in Unimportant Respects?’, Transylvanian Review of Administrative Sciences, Special Issue, pp. 15-32 (http://en.wikipeadia.org/wiki/nigrtia). Vásquez, W. F., Franceschi, D. and Van Hecken, G. (2011) ‘Household Preferences for Municipal Water Services in Matiguas, Nicaragua’, Environment and Development Economics doi:10.1017/S1355770X11000234. World Bank (2007). Performance Accountability and Combating Corruption. Public Sector Governance and Accountability Series. World Bank (1999). Alternative Methods of Service Delivery. Online: [email protected] World Bank (2012). Citizens and Service Delivery: Assessing the Use of Social Accountability Approaches in the Human Development Sectors. Public Sector Governance and Accountability Series. Ya’u A.Z. (2012). Exposure to Tools for Holding Governments Accountable in Democratic System by Civil Society. Online: http://www.neiti.org.ng/press-releases/exposure-tools-holding-governments-accountable-democratic-system-civil-society

Accountability and Performance of Government Agencies in the Delivery of Water, Education and Road Services in Nigeria
57
Appendix I: Tables
Table 5.1.1: Effectiveness of Delivery of Water Services in Nigeria
Source: Authors’ Calculation Using 2011 Survey Data Table 5.2.1: Estimated Regression Model of Effects of Participation on Students’
Performance Dependent Variable: Proportion of Students Who Passed Common Entrance Variable Coefficient S.E. P>|t| Number of Teachers 0.177** 0.072 0.015 Distance -0.027 0.219 0.900 Participation -0.011 0.045 0.801 North-west -12.792*** 4.873 0.009 North-east -10.938** 5.207 0.037 North-central -15.882*** 4.357 0.000 South-west 12.966*** 4.308 0.003 South-east -3.373 4.477 0.452 Constant 73.396*** 4.576 0.000 Author’s computation Note: ***significant @ one percent level **significant @ five percent level
Indicator Response MDA CGS TOTAL MDA/CGS
No % No % No % Availability Yes 146 58.9 314 50.7 460 60.4 No 102 41.1 200 49.3 302 39.6 Accessibility Yes 223 86.8 496 96.1 719 93.0 No 34 13.2 20 3.9 54 7.0 Affordability Yes 200 88.1 440 91.9 640 90.7 No 27 11.9 39 8.1 66 9.3 Adequacy Yes 142 61.5 340 68.1 482 66.0 No 89 38.5 159 31.9 248 34.0 Quality Has taste Yes 51 19.9 66 12.1 117 14.6 No 205 80.1 479 87.9 684 85.4 Has colour Yes 18 7.0 59 11.1 77 9.8 No 238 93.0 473 88.9 711 90.2 Has sediments
Yes 41 16.6 82 15.4 123 15.7
No 206 83.4 452 84.6 658 84.3

Accountability and Performance of Government Agencies in the Delivery of Water, Education and Road Services in Nigeria
58
Table 5.2.2: Assessment of Accountability Mechanisms Indicator Responses MDA CGS Total
MDA/CGS No % No % No %
Existence of any type of Information
Yes 48 21.3 224 39.7 272 34.5
No 117 78.7 340 60.3 517 65.5 Availability of Opportunity to make a report to officials in case of dissatisfaction with functionality/quality of water facility
Yes 76 34.5 274 53.0 350 47.5
No 144 65.5 243 47.0 387 52.5 Availability of Rules and Sanctions guiding use of water facility
Yes 131 51.0 264 48.8 395 49.5
No 126 49.0 277 51.2 403 50.5 Source: Author’s computation using survey data
Table 5.2.3: Estimated Probit Model of Effects of Governance on Water Supply Dependent Variable: Availability of Water All-year Round Variable Coefficient S.E. P[|Z|>z]Participation 0.024 0.126 0.848 Awareness 0.313* 0.163 0.054 Accountability 0.312*** 0.123 0.011 Domain (Rural-Urban) -0.760*** 0.123 0.000 Channel of Service Delivery 0.357*** 0.136 0.009 North-west 2.703*** 0.264 0.000North-east 1.303*** 0.251 0.000 North-central 2.979*** 0.262 0.000 South-west 1.451*** 0.250 0.000 South-east 0.797*** 0.262 0.000 Constant . -1.730*** 0.300 0.000 Log likelihood = -359.62 LR chi2(10) = 456.10 Prob > chi2 = 0.00 Number of obs = 867 Author’s computation Note: ***significant @ one percent level *significant @ ten percent level

Accountability and Performance of Government Agencies in the Delivery of Water, Education and Road Services in Nigeria
59
Table 5.2.4: Marginal Effects of the Variables in the Water Availability Probit Model Variable Coefficient S.E. P[|Z|>z]Participation 0.009 0.047 0.848 Awareness 0.118* 0.061 0.054 Accountability 0.117*** 0.046 0.011 Domain (Rural-Urban) -0.268*** 0.040 0.000 Channel of Service Delivery 0.134*** 0.051 0.008 North-west 0.571*** 0.032 0.000 North-east 0.363*** 0.046 0.000 North-central 0.681*** 0.033 0.000 South-west 0.387*** 0.042 0.000 South-east 0.261*** 0.071 0.000 Author’s computation Note: ***significant @ one percent level *significant @ ten percent level Table 5.3: Alternative Channels of Public Service Delivery in Nigeria S/N SECTOR SERVICE DELIVERY CHANNELS 1 Education (i) Agencification
-Creation of Universal Basic Education Commission (UBEC)
(ii) Partnerships (Inter-governmental Partnering) – UBEC at Federal level and State Universal Basic Education Board (SUBEB) at State level
2 Road (i) Agencification – Creation of the Federal Road Maintenance Agency (FERMA)
(ii) Centralized Traditional Bureaucracy (CTB) (a) Federal Government Controlled (involving only
Executive Arm of Government – Federal Ministry of Agriculture and Rural Development)
(b) Federal Government Controlled (involving both Executive and Legislative Arms of Government – Constituency Road Projects)
3 Water (i) Centralized Traditional Bureaucracy (CTB) MDA-Controlled - Controlled only by Federal Ministry of
Water Resources (FMWR) (ii) Partnerships (Inter-governmental Partnering - IGP)
-Community participation -Monitoring and Evaluation by private sector, civil society
and community-based organizations Source: Authors’ compilation
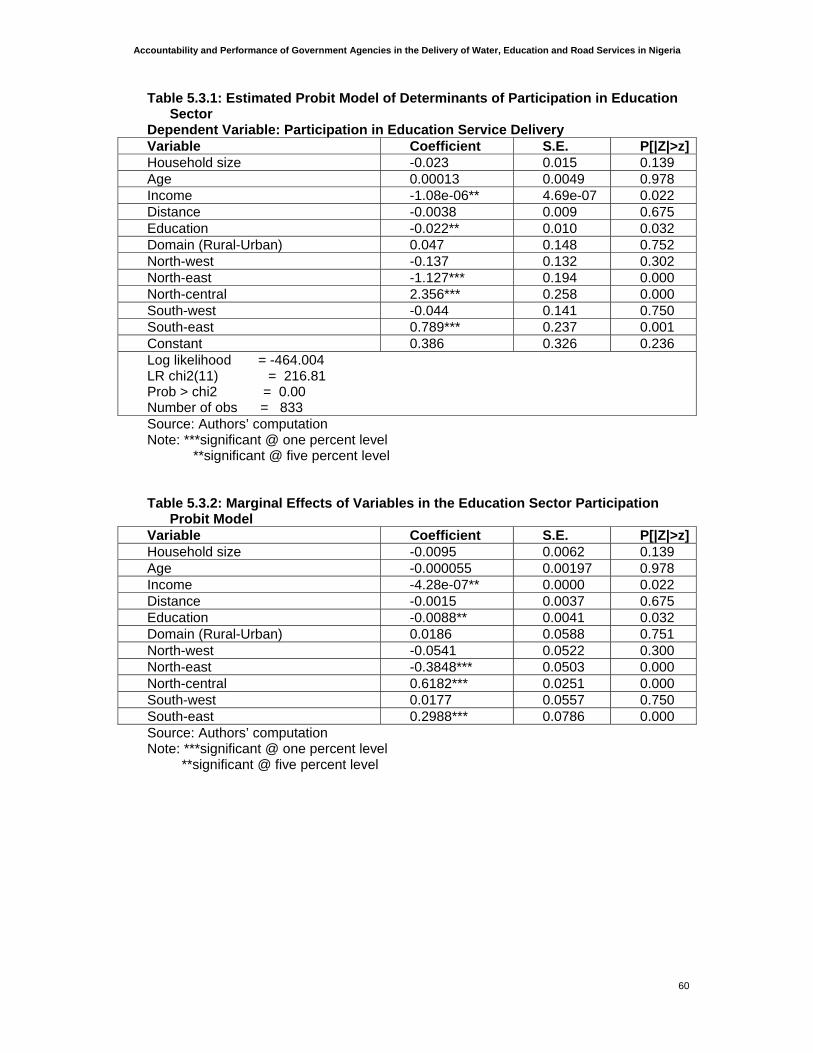
Accountability and Performance of Government Agencies in the Delivery of Water, Education and Road Services in Nigeria
60
Table 5.3.1: Estimated Probit Model of Determinants of Participation in Education Sector
Dependent Variable: Participation in Education Service Delivery Variable Coefficient S.E. P[|Z|>z]Household size -0.023 0.015 0.139 Age 0.00013 0.0049 0.978 Income -1.08e-06** 4.69e-07 0.022 Distance -0.0038 0.009 0.675 Education -0.022** 0.010 0.032 Domain (Rural-Urban) 0.047 0.148 0.752 North-west -0.137 0.132 0.302 North-east -1.127*** 0.194 0.000 North-central 2.356*** 0.258 0.000 South-west -0.044 0.141 0.750 South-east 0.789*** 0.237 0.001 Constant 0.386 0.326 0.236 Log likelihood = -464.004 LR chi2(11) = 216.81 Prob > chi2 = 0.00 Number of obs = 833 Source: Authors’ computation Note: ***significant @ one percent level **significant @ five percent level Table 5.3.2: Marginal Effects of Variables in the Education Sector Participation
Probit Model Variable Coefficient S.E. P[|Z|>z]Household size -0.0095 0.0062 0.139 Age -0.000055 0.00197 0.978 Income -4.28e-07** 0.0000 0.022 Distance -0.0015 0.0037 0.675 Education -0.0088** 0.0041 0.032 Domain (Rural-Urban) 0.0186 0.0588 0.751 North-west -0.0541 0.0522 0.300 North-east -0.3848*** 0.0503 0.000 North-central 0.6182*** 0.0251 0.000 South-west 0.0177 0.0557 0.750 South-east 0.2988*** 0.0786 0.000 Source: Authors’ computation Note: ***significant @ one percent level **significant @ five percent level

Accountability and Performance of Government Agencies in the Delivery of Water, Education and Road Services in Nigeria
61
Table 5.3.3: Estimated Probit Model of Determinants of Accountability in Education Sector
Dependent Variable: Accountability in Education Service Delivery Variable Coefficient S.E. P[|Z|>z]Household size 0.026* 0.013 0.057 Age -0.008* 0.004 0.069 Income -8.91e-07* 4.84e-07 0.065 Distance -0.012 0.009 0.208 Education -0.004 0.010 0.666 Domain (Rural-Urban) 0.047 0.137 0.732 North-west -0.524*** 0.144 0.000 North-east 0.499*** 0.149 0.001 North-central 0.267 0.169 0.115 South-west -0.056 0.142 0.690 South-east 0.971*** 0.229 0.000 Constant 0.020 0.311 0.947 Log likelihood = -479.67 LR chi2(11) = 135.00 Prob > chi2 = 0.00 Number of obs = 833 Source: Authors’ computation Note: ***significant @ one percent level *significant @ ten percent level Table 5.3.4: Marginal Effects of Variables in the Education Sector Accountability
Probit Model Variable Coefficient S.E. P[|Z|>z]Household size 0.009* 0.005 0.057 Age -0.003* 0.002 0.069 Income -3.30e-07* 0.000 0.065 Distance -0.004 0.003 0.207 Education -0.002 0.003 0.666 Domain (Rural-Urban) 0.017 0.050 0.730 North-west -0.181*** 0.045 0.000 North-east 0.193*** 0.058 0.001 North-central 0.102 0.066 0.124 South-west -0.021 0.052 0.688 South-east 0.372*** 0.078 0.000 Source: Authors’ computation Note: ***significant @ one percent level *significant @ ten percent level

Accountability and Performance of Government Agencies in the Delivery of Water, Education and Road Services in Nigeria
62
Table 5.3.5 Estimated Probit Model of Determinants of Participation in Water Sector
Dependent Variable: Participation in Water Service Delivery Variable Coefficient S.E. P[|Z|>z]Household size -0.001 0.010 0.908 Age 0.004 0.004 0.312 Education 0.017* 0.009 0.086 Income -1.19e-06*** 3.30e-07 0.000 Domain (Rural-Urban) 0.261** 0.113 0.021 Channel of Service Delivery 0.461*** 0.119 0.000 North-west 0.983*** 0.198 0.000 North-east -0.820*** 0.230 0.000 North-central 0.259 0.185 0.160 South-west -0.119 0.202 0.553 South-east -0.187 0.203 0.356 Constant -1.187*** 0.294 0.000 Log likelihood = -460.33 LR chi2(11) = 138.15 Prob > chi2 = 0.00 Number of obs = 847 Author’s computation Note: ***significant @ 1 percent level **significant @ 5 percent level *significant @ 10 percent level Table 5.3.6: Marginal Effects of Variables in the Water Sector Participation Probit
Model Variable Coefficient S.E. P[|Z|>z]Household size -0.0004 0.0034 0.908 Age 0.0014 0.0014 0.312 Education 0.0058* 0.0034 0.085 Income -4.08e-07*** 0.000 0.000 Domain (Rural-Urban) 0.087*** 0.036 0.018 Channel of Service Delivery 0.158*** 0.041 0.000 North-west 0.365*** 0.074 0.000 North-east -0.225*** 0.046 0.000 North-central 0.091 0.066 0.170 South-west -0.040 0.065 0.542 South-east -0.061 0.064 0.336Source: Author’s computation Note: ***significant @ one percent level *significant @ ten percent level

Accountability and Performance of Government Agencies in the Delivery of Water, Education and Road Services in Nigeria
63
Table 5.3.7: Estimated Probit Model of Determinants of Accountability in Water Sector
Dependent Variable: Accountability in Water Service Delivery Variable Coefficient S.E. P[|Z|>z]Household size 0.028*** .010 0.007 Age -0.002 .004 0.635 Education 0.031*** .009 0.002 Income -4.11e-07* 2.36e-07 0.081 Domain (Rural-Urban) 0.638*** 0.113 0.000 Channel of Service Delivery 0.057 0.099 0.561 North-west 0.264 0.190 0.165 North-east 0.520*** 0.200 0.009 North-central 0.916*** 0.183 0.000 South-west 0.059 0.193 0.760 South-east -1.269*** 0.222 0.000 Constant -0.935*** 0.279 0.001 Log likelihood = -465.588 LR chi2(11) = 242.28 Prob > chi2 = 0.00 Number of obs = 847 Author’s computation Note: ***significant @ one percent level *significant @ ten percent level Table 5.3.8: Marginal Effects of Variables in Water Sector Accountability Probit
Model Variable Coefficient S.E. P[|Z|>z]Household size 0.0114*** 0.0042 0.007 Age -0.00079 0.0016 0.635 Education 0.0122*** 0.0039 0.002 Income -1.65e-07* 0.0000 0.081 Domain (Rural-Urban) 0.2487*** 0.0424 0.000 Channel of Service Delivery 0.0229 0.0395 0.561 North-west 0.1048 0.0747 0.161 North-east 0.2022*** 0.0738 0.006 North-central 0.347*** 0.0633 0.000 South-west 0.023*** 0.0771 0.000 South-east -0.438*** 0.0550 0.000Source: Author’s computation Note: ***significant @ one percent level *significant @ ten percent level

Accountability and Performance of Government Agencies in the Delivery of Water, Education and Road Services in Nigeria
64
Table 5.4: Rural-Urban Split in Accountability of Water Service Delivery Indicator Responses MDA CGS
Rural Urban Rural Urban No % No % No % No %
Awareness of water Projects
Yes 135 94.4 96 87.3 351 88.6 151 87.3
No 8 5.6 14 12.7 45 11.4 22 12.7 Awareness of Procedure for Engaging Contractors
Yes 125 87.4 94 86.2 346 88.5 143 84.1
No 18 12.6 15 13.8 45 11.5 27 15.9 Participation in Execution of water projects
Yes 54 37.8 5 4.5 180 32.0 128 32.7
No 89 62.2 105 95.5 382 68.0 263 67.3 Existence of access to any type of information on the water facility
Yes 19 16.0 29 27.4 224 39.7 154 39.3
No 100 84.0 77 72.6 340 60.3 238 60.7 Availability of opportunity to make a report to officials in case of dissatisfaction with functionality of water facility
Yes 40 33.6 36 35.6 185 52.1 89 54.9
Availability of Rules and sanctions guiding use of water facility
No 79 66.4 65 64.4 170 47.9 73 45.1
Source: Authors’ Computation Using 2011 Survey Data

Accountability and Performance of Government Agencies in the Delivery of Water, Education and Road Services in Nigeria
65
Appendix II: Figures
Figure 5.1: Proportion of Respondents That Claimed Availability of Teachers
SSource: Authors’ Plot Using Survey Data 2011
Figure 5.2: Proportion of Respondents That Claimed Adequacy of Classrooms
Source: Authors’ Plot Using Survey Data 2011

Accountability and Performance of Government Agencies in the Delivery of Water, Education and Road Services in Nigeria
66
Figure 5.3: Proportion of Respondents That Claimed Accessibility of Education Projects
Source: Authors’ Plot Using Survey Data 2011 Figure 5.4: Proportion of Respondents That Claimed Affordability of Education
Services
SSource: Authors’ Plot Using Survey Data 2011

Accountability and Performance of Government Agencies in the Delivery of Water, Education and Road Services in Nigeria
67
Figure 5.5: Proportion of Respondents That Claimed Access to Any Type of Information
Source: Authors’ Plot Using Survey Data 2011

Accountability and Performance of Government Agencies in the Delivery of Water, Education and Road Services in Nigeria
68
Annex III : Questionnaire
GOVERNANCE AND PERFORMANCE OF PUBLIC SERVICE DELIVERY FOR ACHIEVING MDGs IN NIGERIA QUESTIONNAIRE FOR BENEFICIARIES OF CGS AND MDA WATER PROJECTS
S/No QUESTIONS AND FILTERS CODING CATEGORIES CODES
A General Information
A1 State (Name)
A2 Urban Community (Name)
A3 Rural Community (Name)
A4 Household size
A5 Gender of Respondents Male 1
Female 2
A6 Age Last birthday A7 Marital Status Never Married 1
Married 2
Separated 3
Divorced 4
Widow 5 A8 Highest Educational Attainment
No formal education 1 Primary School not
completed 2 Primary School
completed 3 Secondary School
Completed 4 Secondary School not
Completed 5
Post secondary school 6
Koranic Education 7
Other (Specify) 8 A9 Primary Occupation Farming 1
Petty trading 2
Artisan 3
Public Civil Servant 4Private Sector
Employee 5
Unemployed 6 A10 Secondary Occupation Farming 1
Petty trading 2
Artisan 3
Public Civil Servant 4
Private (Forma sector) 5
Others (Specify) 6

Accountability and Performance of Government Agencies in the Delivery of Water, Education and Road Services in Nigeria
69
A11 Average Monthly Income (Write) B. Governance Issues - Probe and discuss the following
B1 Awareness of CGS water project:
B11 Are you aware of the CGS water project in the community?
Yes 1
No 2 B12 If yes to Q.B1, what was the source of
information? Members of the
community 1
Radio/Television 2
State CGS officials 3
Contractor 4
Others (Specify) 5
B2 Participation in the execution of CGS water projects: B21 Did you participate in the execution of
CGS water project? Yes 1
No 2 B22 If response to B21 is yes, at what level
did you participate? Needs Assessment
and prioritization 1
Project identification 2 Location of water
facility 3 Construction/Drilling
of water project 4 Determining User
charges 5
Repairs and Maintenance
6
Monitoring and evaluation
B23 If response to B22 is No, why did you not participate?
Not aware of the project
1
No opportunity to participate
2
Lack of time/chance 3
B3 Transparency B31 Are you aware of the stage - by - stage
process of the construction of the water facility
Yes 1
No 2 B32 If response to B31 is yes, what was your
source of information Community leaders 1
CGS 2
Others (specify) 3B33 Are you aware of the procedure for
engaging the contractors that executed the water facility
No 1
Yes 2 B34 Are you aware of the cost of constructing
the water facility Yes 1
No 2

Accountability and Performance of Government Agencies in the Delivery of Water, Education and Road Services in Nigeria
70
B35 If response to B34 is yes, what is the source of information
Community leaders 1
CGS officials 2
Others (specify) 3 B36 Do you have access to any type of
information on the water facility? Yes 1
No 2 B37 If response to B36 is yes, what is the
procedure for accessing information on the water facility?
B4 Accountability B41 Are there rules and sanctions guiding the
use of CGS water facility? Yes 1
No 2 B42 If response to B41 is yes, describe these
sanctions and rules
B43 Do these sanctions and rules apply to all members of the community or just some groups?
All 1
Some groups 2 B44 If response to B43 is 2, mention these
groups and the reasons for this B45 Have any of these rules and sanctions
been enforced before? Yes 1
No 2B46 If response to B45 is yes, give a
narration of the episode B47 If you are dissatisfied with
functionality/quality of the CGS water facility, is there opportunity for you to make a report to CGS officials?
Yes 1
No 2 B48 If response to B47 is yes, what is the
procedure? B49 Has there been a case of reporting before? Yes 1
No 2 B410 If response to B49 is yes, give a narration of
the episode
B5 Agency Issues B51 Apart from CGS officials, who are those
involved in the execution of the water projects in the community?
B52 What was the role played by each of the actors?
B53 How do the actors relate with one another? B54 How do they relate with individuals in the
community? B55 Was there a case where contractors
handling the water project were stopped and another engaged?
Yes 1
No 2 B56 If yes what was responsible for the action? B7 Stewardship Issues: B71 How do you see the attitude of the CGS Positive/favourable 1
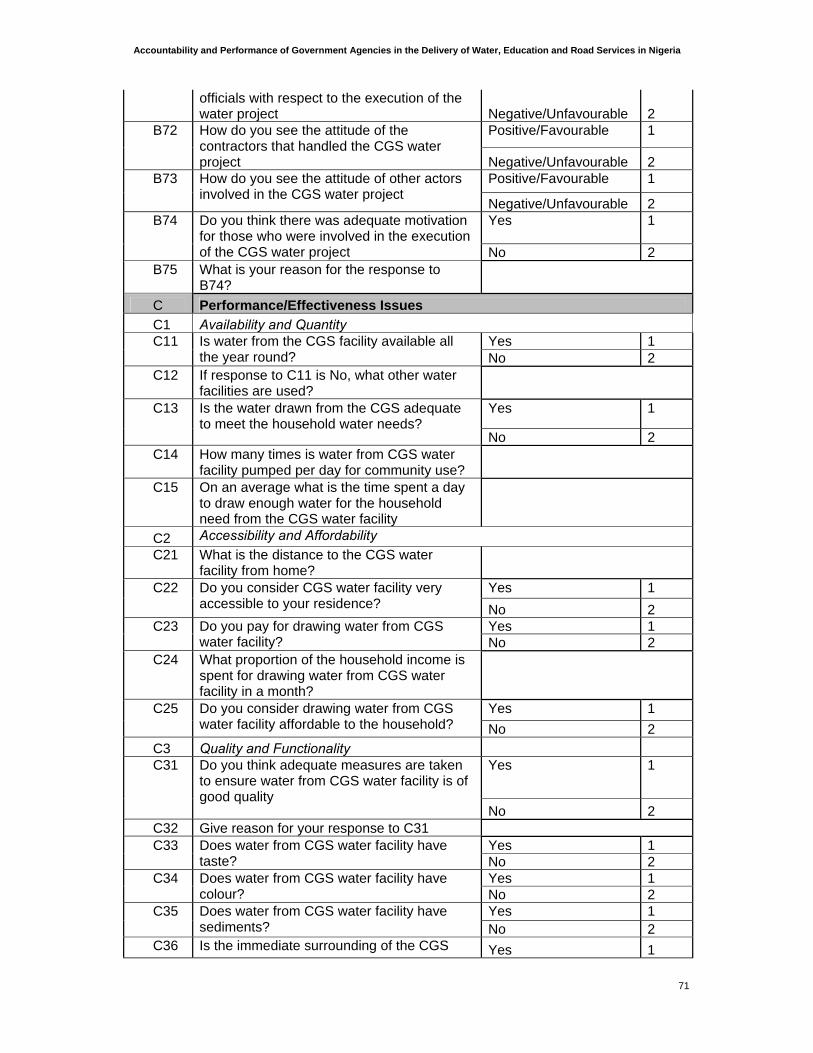
Accountability and Performance of Government Agencies in the Delivery of Water, Education and Road Services in Nigeria
71
officials with respect to the execution of the water project Negative/Unfavourable 2
B72 How do you see the attitude of the contractors that handled the CGS water project
Positive/Favourable 1
Negative/Unfavourable 2B73 How do you see the attitude of other actors
involved in the CGS water project Positive/Favourable 1
Negative/Unfavourable 2 B74 Do you think there was adequate motivation
for those who were involved in the execution of the CGS water project
Yes 1
No 2 B75 What is your reason for the response to
B74?
C Performance/Effectiveness Issues
C1 Availability and Quantity C11 Is water from the CGS facility available all
the year round? Yes 1 No 2
C12 If response to C11 is No, what other water facilities are used?
C13 Is the water drawn from the CGS adequate to meet the household water needs?
Yes 1
No 2 C14 How many times is water from CGS water
facility pumped per day for community use? C15 On an average what is the time spent a day
to draw enough water for the household need from the CGS water facility
C2 Accessibility and Affordability
C21 What is the distance to the CGS water facility from home?
C22 Do you consider CGS water facility very accessible to your residence?
Yes 1
No 2C23 Do you pay for drawing water from CGS
water facility? Yes 1No 2
C24 What proportion of the household income is spent for drawing water from CGS water facility in a month?
C25 Do you consider drawing water from CGS water facility affordable to the household?
Yes 1
No 2
C3 Quality and Functionality C31 Do you think adequate measures are taken
to ensure water from CGS water facility is of good quality
Yes 1
No 2 C32 Give reason for your response to C31 C33 Does water from CGS water facility have
taste? Yes 1 No 2
C34 Does water from CGS water facility have colour?
Yes 1 No 2
C35 Does water from CGS water facility have sediments?
Yes 1 No 2
C36 Is the immediate surrounding of the CGS Yes 1

Accountability and Performance of Government Agencies in the Delivery of Water, Education and Road Services in Nigeria
72
water facility always clean? No 2 C37 Is the CGS water facility always covered? Yes 1
No 2 C38 Is the CGS water facility functional
throughout the year? Yes 1
No 2 C39 Give reason for your response to C38 C310 How often does CGS water facility
breakdown Frequently 1
Once in a week 2
Once in a month 3
Never 4
C4 Repairs and maintenance C41 Is there arrangement for carrying out repairs
and maintenance works on CGS water facility?
Yes 1
No 2 C42 Who are those involved in carrying out
repairs and maintenance works on CGS water facility in the community
C43 How often are repairs and maintenance carried out on CGS water facility
Frequently 1 Once in a week 2Once in a month 3 Never 4
C44 How is fund for repairs and maintenance works on CGS facility sources?
C45 Who are those managing such funds?
D External Influence
D1 Political factors:
D11 Does political affiliation in the community affect use of water from the CGS water facility?
Yes 1
No 2
D12 Give reason for your response to D11 D13 Does political affiliation in the community
affect repairs and maintenance of CGS water facility?
Yes 1
No 2
D14 Give reason for your response to D13
D15 Are there cases where community leaders and chief use their influence on the use of water from CGS water facility
Yes 1
No 2D16 Give reasons for your response to D15
D2 Cultural factors: D21 Are there cultural or traditional factors that
influence the use of water from CGS water facility?
Yes 1
No 2
D22 If response to D2 is yes, what are these factors?
D3 Religious factors:
D31 Are there religious factors that influence the use of water from CGS water facility?
Yes 1
No 2 D32 If response to D4 is yes, what are these
factors

Accountability and Performance of Government Agencies in the Delivery of Water, Education and Road Services in Nigeria
73
E Sustainability
E1 Is there arrangement for ensuring functionality of the CGS water facility?
Yes 1
No 2 E2 If response to E1 is yes, what is the
arrangement?
E3 Is there arrangement for ensuring regular repairs and maintenance of CGS water facility?
Yes 1
No 2E4 If response to E3 is Yes, what is the
arrangement?
E5 Are there sanctions for misuse of CGS water facility by any member of the community?
Yes 1
No 2 E6 If response to E5 is yes, what are these
sanctions? E7 Have the sanctions ever been enforced? Yes 1
No 2 E8
If response to E7 is Yes, give a narration of the episode.
F Impact
F1 Assess the impact of CGS water facility in the community with respect to the following comparing the situation now and before (Better 1; Worse 2; No difference 3)
F11 Present state of water availability 1 2 3
F12 Present state of quantity of water 1 2 3
F13 Present state of water quality 1 2 3
F14 Present state of water affordability 1 2 3
F15 Present state of accessibility of water facility 1 2 3
F16 Present state of incidence of water-borne diseases 1 2 3
F17 present state of time spent fetching water 1 2 3
F18 Present state of having time for economic activities 1 2 3