accounting department · accounting department accomplishment report. plans & ... • post...
TRANSCRIPT

ACCOUNTING DEPARTMENT
Accomplishment Report

PLANS &
PROGRAMS
• Submit financial statement to the Municipal Mayor and the
Sanggunian Bayan concerned.
• Certify to the availability and budgetary allotment to which
expenditures and obligation may be properly charged.
• Review supporting documents before preparation of vouchers to
determine completeness of requirements.
• Prepare statement of cash advance, liquidation of the same.
• Post individual disbursement to the subsidiary ledger and index
card.
• Maintain individual ledgers for officials and employee of the LGU
pertaining to the payrolls and deductions.

CONSOLIDATED
STATEMENT OF
CASH FLOW –GENERAL FUND
CONSOLIDATED STATEMENT OF CASH FLOWS
For the Year Ended December 31, 2011
(With Comparative Figures for CY 2010)
GENERAL FUND
2011 2010
Cash Flows from Operating Activities
Cash Inflows
Collection from Taxpayers 32,992,068.40 23,632,511.27
Internal Revenue Allotment 63,473,772.00 58,609,814.00
Other Reciepts 9,606,762.60 20,564,088.22
Total Cash Inflows 106,072,603.00 102,806,413.49
Cash Outflows
Payments to Suppliers and Creditors 68,245,657.95 71,839,432.38
Payments to Employees 32,111,880.41 31,468,437.70
Total Cash Outflows 100,357,538.36 103,307,870.08
Net Cash from Operating Activities 5,715,064.64 (501,456.59)
Net Increase (Decrease) in Cash 5,715,064.64 (275,818.46)
Cash at the Beginning of the Period 12,219,950.95 12,721,407.54
Cash at the End of the Period 17,935,015.59 12,219,950.95
STATEMENT OF
INCOME &
EXPENSE –GENERAL FUND
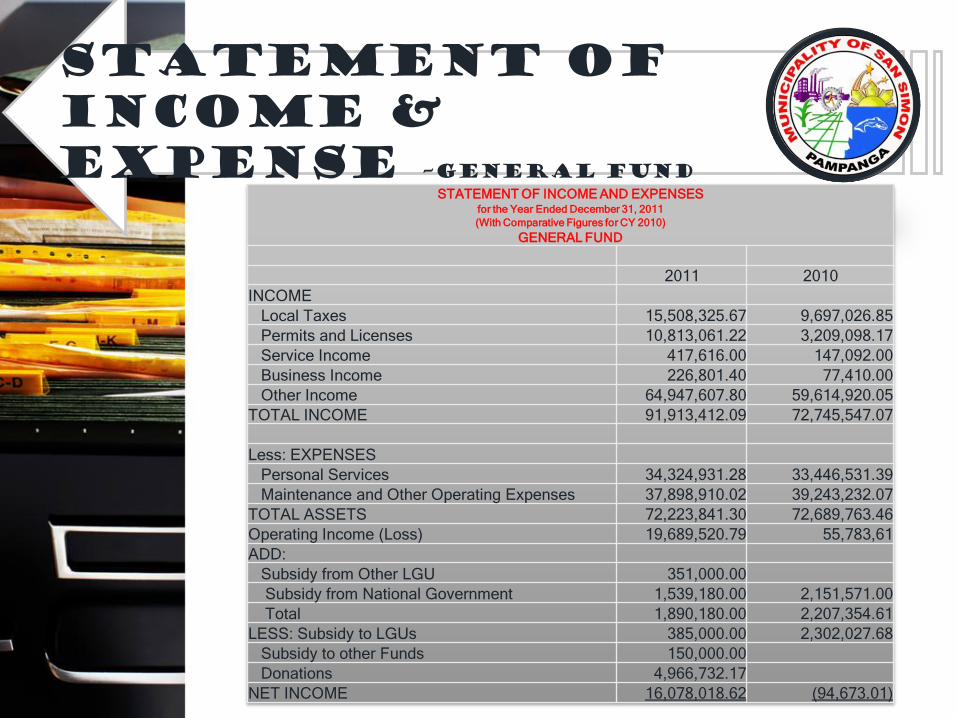
STATEMENT OF INCOME AND EXPENSESfor the Year Ended December 31, 2011
(With Comparative Figures for CY 2010)
GENERAL FUND
2011 2010
INCOME
Local Taxes 15,508,325.67 9,697,026.85
Permits and Licenses 10,813,061.22 3,209,098.17
Service Income 417,616.00 147,092.00
Business Income 226,801.40 77,410.00
Other Income 64,947,607.80 59,614,920.05
TOTAL INCOME 91,913,412.09 72,745,547.07
Less: EXPENSES
Personal Services 34,324,931.28 33,446,531.39
Maintenance and Other Operating Expenses 37,898,910.02 39,243,232.07
TOTAL ASSETS 72,223,841.30 72,689,763.46
Operating Income (Loss) 19,689,520.79 55,783,61
ADD:
Subsidy from Other LGU 351,000.00
Subsidy from National Government 1,539,180.00 2,151,571.00
Total 1,890,180.00 2,207,354.61
LESS: Subsidy to LGUs 385,000.00 2,302,027.68
Subsidy to other Funds 150,000.00
Donations 4,966,732.17
NET INCOME 16,078,018.62 (94,673.01)

STATEMENT OF
CASH FLOW –GENERAL FUND
STATEMENT OF CASH FLOWS
For the Year Ended December 31, 2011
(With Comparative Figures for CY 2010)
GENERAL FUND
2011 2010
Cash Flows from Operating Activities
Cash Inflows
Internal Revenue Allotment 63,473,772.00 58,609,814.00
Collection from Taxpayers 27,365,380.63 17,793,443.61
Other Reciepts 1,473,835.80 2,151,571.00
Total Cash Inflows 92,312,988.43 78,554,828.61
Cash Outflows
Payments of Salaries 30,328,025.41 30,940,687.70
Payments to Suppliers and Creditors 5,966,313.63 47,889,959.37
Total Cash Outflows 89,991,159.04 78,830,647.07
Net Cash from Operating Activities (275,818.46)
Net Increase (Decrease) in Cash 2,321,829.39 (275,818.46)
Cash at the Beginning of the Period 2,625,804.11 2,901,622.57
Cash at the End of the Period 4,947,633.50 2,625,804.11

BALANCE SHEET SPECIAL EDUCATION
BALANCE SHEET
As of December 31, 2011
(With Comparative Figures for CY 2010)
SPECIAL EDUCATION FUND
ASSETS 2011 2010
CURRENT ASSETS
Cash 1,226,641.99 1,376,543.34
Receivables 2,220,853.69 2,220,853.69
Total Current Assets 3,447,495.68 3,597,397.03
INVESTMENTS AND PROPERTY, PLANT & EQUIPTMENT
Property, Plant & Equiptment (Net of Depreciation)
Office Buildings 163,699.12 163,904.00
Office Equipment, Furniture and Fixtures 595,994.16 596,740.09
Total Property, Plant & Equipment 759,693.28 760,644.09
OTHER ASSETS 198,800.00 198,800.00
TOTAL ASSETS 4,405,988.96 4,556,841.12
LIABILITIES AND EQUITY
LIABILITIES
Current Liabilities 1,534,373.73 1,565,179.79
Deferred Credits 1,693,493.69 1,693,493.69
Total Liabilities 3,227,867.42 3,258,673.48
EQUITY
Government Equity, Beginning 1,393,248.15 1,439,782.96
Add (Deduct):
Retained Operating Surplus (215,126.61)
Net Income (Loss) (141,615.32)
Government Equity, End 1,178,121.54 1,298,167.64
TOTAL LIABILITIES AND EQUITY 4,405,988.96 4,556,841.12

STATEMENT OF INCOME
AND EXPENSES SPECIAL EDUCATIONAL FUND
STATEMENT OF INCOME AND EXPENSES
For the Year Ended December 31, 2011
(With Comparative Figures for CY 2010)
SPECIAL EDUCATION FUND
2011 2010
INCOME
Local Taxes 2,076,426.33 2,951,158.86
TOTAL INCOME 2,076,426.33 2,951,158.86
Less: EXPENSES
Personal Service 464,900.00 527,750.00
Maintenance and Other Operating Expenses 1,872,174.84 2,560,024.18
TOTAL EXPENSES 2,337,074.84 3,087,774.18
Operating Income (Loss) (260,648.51) (136,615.32)
LESS:
Subsidy from other Funds 150,000.00 (5,000.00)
TOTAL LIABILITIES AND EQUITY (110,648.51) (141,615.32)

STATEMENT OF
CASH FLOW SPECIAL EDUCATIONAL FUND
STATEMENT OF CASH FLOWS
For the Year Ended December 31, 2011
(With Comparative Figures for CY 2010)
SPECIAL EDUCATION FUND
2011 2010
Cash Flows from Operating Activities
Cash Inflows
Collection from Taxpayers 4,302,851.97 5,839,067.66
Total Cash Inflows 4,302,851.97 5,839,067.66
Cash Outflows
Payments to Employees 464,900.00 527,750.00
Payments to Suppliers and Creditors 4,011,853.32 5,400,851.97
Total Cash Outflows 4,476,753.32 5,928,601.97
Net Cash from Operating Activities (173,901.35) (89,534.31)
Net Increase (Decrease) in Cash (173,901.35) (89,534.31)
Cash at the Beginning of the Period 1,376,543.34 1,466,077.65
Cash at the End of the Period 1,202,641.99 1,376,543.34
BALANCE SHEET TRUST FUND
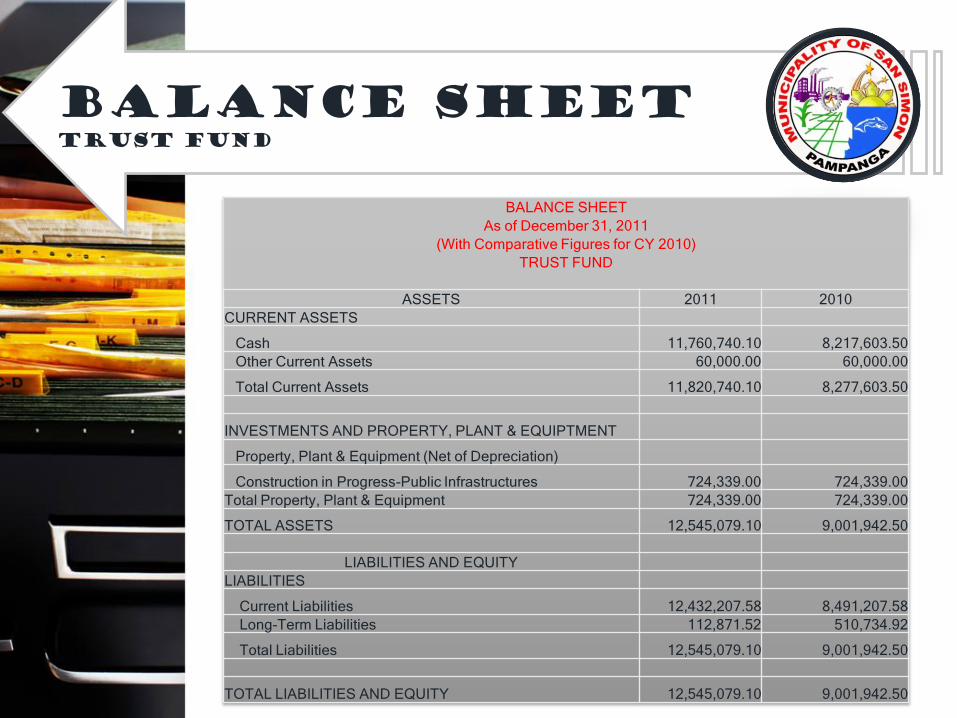
BALANCE SHEET
As of December 31, 2011
(With Comparative Figures for CY 2010)
TRUST FUND
ASSETS 2011 2010
CURRENT ASSETS
Cash 11,760,740.10 8,217,603.50
Other Current Assets 60,000.00 60,000.00
Total Current Assets 11,820,740.10 8,277,603.50
INVESTMENTS AND PROPERTY, PLANT & EQUIPTMENT
Property, Plant & Equipment (Net of Depreciation)
Construction in Progress-Public Infrastructures 724,339.00 724,339.00
Total Property, Plant & Equipment 724,339.00 724,339.00
TOTAL ASSETS 12,545,079.10 9,001,942.50
LIABILITIES AND EQUITY
LIABILITIES
Current Liabilities 12,432,207.58 8,491,207.58
Long-Term Liabilities 112,871.52 510,734.92
Total Liabilities 12,545,079.10 9,001,942.50
TOTAL LIABILITIES AND EQUITY 12,545,079.10 9,001,942.50

STATEMENT OF
CASH FLOWS TRUST FUND
STATEMENT OF CASH FLOWS
For the Year Ended December 31, 2011
(With Comparative Figures for CY 2010)
TRUST FUND
2011 2010
Cash Flows from Operating Activites
Cash Inflows
Other Receipts 9,028,898.60 18,412,517.22
Total Cash Inflows 9,028,898.60 18,412,517.22
Cash Oulflows
Payments to Supplier and Creditors 5,485,762.00 18,548,621.04
Total Cash Outflows 5,485,762.00 18,548,621.04
Net Cash from Operating Activities (136,103.82)
Net Cash from Operating Activites 3,543,136.60 (136,103.82)
Cash at the Beginning of the Period 8,217,603.50 8,353,707.32
Cash at the End of the Period 11,760,740.10 8,217,603.50

CONSOLIDATED
BALANCE SHEET GENERAL FUND
CONSOLIDATED BALANCE SHEET
As of December 31, 2011
(With Comparative Figures for CY 2010)
ASSETS 2011 2010
CURRENT ASSETS
Cash (Note 4) 17,935,015.59 12,219,950.95
Receivables (Note 50) 4,658,526.33 3,973,126.33
Total Current Assets 60,000.00 60,000.00
Other Current Assets 22,653,541.92 16,253,077.28
INVESTMENTS AND PROPERTY, PLANT & EQUIPTMENT
Property, Plant & Equiptment, Net (Note 6)
Land 15,508,400.00 6,358,400.00
Land Improvements 181,500.00 181,500.00
Buildings 19,138,074.27 19,162,026.81
Office Equipment, Furniture & Fixtures 4,210,221.05 3,435,092.54
Machineries & Equipment 787,358.14 588,900.00
Transportation Equipment 3,712,402.23 1,295,770.00
Other Property, Plant and Euipment 1,614,932.44 63,539.44
Construction in Progress-Public Infrastructures 840,339.00 840,339.00
Total Property, Plant & Equipment 45,993,227.13 31,925,567.79
OTHER ASSETS
Other Assets 266,885.47 266,885.47
Work/Other Animals 285,500.00 285,500.00
Total Other Assets 552,385.47 552,385.47
TOTAL ASSETS 69,199,154.52 48,731,030.54
LIABILITIES AND EQUITY
LIABILITIES
Current Liabilities (Note 7) 23,116,601.16 20,201,580.86
Long-Term Liabilities (Note 8) 22,364,122.04 22,761,985.44
Deferred Credits (Note 9) 3,401,754.33 3,401,754.33
Total Liabilities 48,882,477.53 46,365,320.63
EQUITY
Government Equity (Note 10) 20,316,676.99 2,365,709.91
TOTAL LIABILITIES AND EQUITY 69,199,154.52 48,731,030.54

CONSOLIDATED
BALANCE SHEET GENERAL FUND
CONSOLIDATED STATEMENT OF INCOME AND EXPENSES
For the Year Ended December 31, 2011
(With Comparative Figures for CY 2010)
2011 2010
INCOME (Note 11)
Local Taxes 17,584,752.00 12,648,185.71
Permits and Licenses 10,813,061.22 3,209,098.17
Service Income 417,616.00 147,092.00
Business Income 226,801.40 77,410.00
Other Income 64,947,607.80 59,614,920.05
TOTAL INCOME 93,989,838.42 75,696,705.93
Less: EXPENSES (Note 12)
Personal Services 34,789,831.28 33,974,281.39
Maintenance and Other Operating Expenses 39,741,023.71 41,803,256.25
TOTAL EXPENSES 74,530,854.99 75,777,537.64
Operating Income 19,458,983.43 (80,831.71)
ADD:
Subsidy from Other LGU 351,000.00
Subsidy from Other Funds 150,000.00
Subsidy from National Government 1,539,180.00 2,151,571.00
Total 2,040,180.00 2,070,739.29
LESS: 385,000.00 2,302,027.68
Subsidy from other Funds 150,000.00
Subsidy to LGUs 385,000.00 2,302,027.62
Donations 4,966,732.17 5,000.00
Total 5,501,732.17 2,307,027.62
NET INCOME (LOSS) 15,997,431.76 (236,288.33)

CONSOLIDATED
BALANCE SHEET GENERAL FUND
CONSOLIDATED STATEMENT OF CASH FLOWS
For the Year Ended December 31, 2011
(With Comparative Figures for CY 2010)
2011 2010
Cash Flows from Operating Activities
Cash Inflows
Collection from Taxpayers 32,992,068.40 23,632,511.27
Internal Revenue Allotment 63,473,772.00 58,609,814.00
Other Reciepts 9,606,762.60 20,564,088.22
Total Cash Inflows 106,072,603.00 102,806,413.49
Cash Outflows
Payments to Suppliers and Creditors 68,245,657.95 71,839,432.38
Payments to Employees 32,111,880.41 31,468,437.70
Total Cash Outflows 100,357,538.36 103,307,870.08
Net Cash from Operating Activities 5,715,064.64 (501,456.59)
Net Increase (Decrease) in Cash 5,715,064.64 (275,818.46)
Cash at the Beginning of the Period 12,219,950.95 12,721,407.54
Cash at the End of the Period 17,935,015.59 12,219,950.95

Acting Municipal Accountant