accounting for measurement error in dietary intake data · slide 10 one thing to keep in mind...
TRANSCRIPT

Accounting for measurement
error in dietary intake data
September 20-December 6, 2011

Slide 1
Hello and thank you for joining today’s webinar, the first in the Measurement Error Webinar Series. My name is Sharon Kirkpatrick and I’m a nutrition researcher at the U.S. National Cancer Institute. It is my pleasure to kick off the webinar series with today’s introductory session. We are very excited by the response that the series has generated—close to 600 people have subscribed to our listserv, including participants from several countries.
Before we get started, I’d like to mention a few things:
Today’s webinar and all of the webinars in the series are being recorded so that we can make them available on our Web site. To avoid any interruptions from background noise, all participant phone lines are muted and they will remain so throughout the duration of the webinar.
The format for each webinar is a presentation followed by a question-and-answer period. Each webinar has been scheduled for 90 minutes. We may not use the full 90 minutes every week but our aim is to allow adequate time for questions and answers. You are welcome to submit questions using the Chat feature in the middle of the screen at the left. Dr. Kevin Dodd, a mathematical statistician at the National Cancer Institute, will be monitoring the questions for today’s session. Please direct your questions to Kevin. This information is available in the Note window at the top left of the screen.

2
Presenters and Collaborators
Sharon Kirkpatrick
Series Organizer
Regan Bailey
Dennis Buckman
Raymond Carroll
Kevin Dodd
Laurence Freedman
Patricia Guenther
Victor Kipnis
Susan Krebs-Smith
Douglas Midthune
Amy Subar
Fran Thompson
Janet Tooze

Slide 2
This series is organized by collaborators from the National Cancer Institute, the Office of Dietary Supplements at the National Institutes of Health, the U.S. Department of Agriculture, the Gertner Institute for Epidemiology, Texas A&M University, and Wake Forest School of Medicine. Many of the nutritionists and statisticians listed on this slide have been working together on the topic of measurement error in self-report dietary intake data for the last several years. This webinar series is intended to share many of the insights that have culminated from this work. This fruitful collaboration between nutritionists and statisticians highlights the need for various types of expertise to make progress in this area. While a number of people listed here are not presenters in the series, their involvement in the planning has been integral.


Slide 3
The series is dedicated to the memory of our colleague, Arthur Schatzkin, who took a great interest in this work.

4
–
–
–
–
Webinar series goal
Provide participants with an understanding of:
The sources and magnitudes of dietary
measurement errors
How measurement error may affect estimates
of usual dietary intake distributions
How measurement error may affect analyses
of diet-health relationships
How the effects of measurement error may be
mitigated

Slide 4
The overall goal of the series is to provide participants with an understanding of:
The sources and magnitudes of dietary measurement errors
How measurement error may affect estimates of usual dietary intake distributions
How measurement error may affect analyses of diet-health relationships
How the effects of measurement error may be mitigated.
Presenters will discuss general principles but will draw mainly upon methods developed within this collaborative group based at the National Cancer Institute. The series has been designed for a broad audience, though many of the statistical methods to be discussed are quite complex, again highlighting the need for collaboration between nutritionists, epidemiologists, and statisticians, for example.

Introduction to measurement error in dietary intake data
Sharon Kirkpatrick, PhD National Cancer Institute

Slide 5
Today’s webinar is an introduction to the problem of measurement error in dietary intake data. It is intended to provide a foundation for the webinars to come but could also serve as a basic overview for those of you who may be new to this topic and want to get your feet wet. We do hope that your interest will be piqued and you will come back to the subsequent webinars.

Introduction to measurement error in dietary intake data 6
Today’s objective
Participants will gain an understanding of:
–
–
–
The concept of usual dietary intake
Sources of measurement errors and their
impact
Concepts underpinning approaches to
reducing and correcting for measurement
error

Slide 6
The objectives for today are to describe the concept of usual dietary intake and challenges to capturing it, sources of measurement error and their impact, and concepts underpinning approaches to reducing and correcting for measurement error. Throughout the rest of the series, the presenters will describe the specifics of correcting for measurement error in detail.

Introduction to measurement error in dietary intake data 7
Outline
Introductory concepts
Usual intake
Measurement error
The structure of measurement error
Accounting for measurement error
Summary & series overview

Slide 7
I will describe some key concepts that we considered in structuring the series, then move on to discuss usual intake and measurement error, followed by a discussion of the structure of measurement error in self-report dietary assessment instruments, and a high-level overview of methods of accounting for measurement error. I will finish up by highlighting the topics to come in the remainder of the series.

Introduction to measurement error in dietary intake data 8
Introductory concepts
Usual intake Measurement
error
The structure of measurement
error
Accounting for measurement
error
Summary & series overview
INTRODUCTORY CONCEPTS

Slide 8
Starting out with some introductory concepts…

Intro
duction to measurement error in dietary intake data 9
Introductory concepts
Two main areas of interest
Describing usual
intake distributions:
mean, percentiles,
proportion above or
below a threshold
Estimating diet-
health relationships:
regression coefficients

Slide 9
The webinars will cover two main areas of interest: 1) the impact of measurement error and ways to account for it when describing usual intakes; for example, when monitoring diet and nutrition among a population of interest; and 2) assessing relationships between a dietary exposure and a health outcome.
In the first case, we are interested in distributions and associated statistics, such as means, percentiles, and proportions above or below a threshold, such as a nutrient requirement or food group recommendation. For example, what proportion of a given population of interest has intakes that meet the recommendations for whole grains or calcium?
In studying diet-health relationships, we’re interested in describing the relationship between a dietary exposure and an outcome, using regression coefficients such as odds ratios or relative risks. An example is the relationship between dietary fat and breast cancer.

Introduction to measurement error in dietary intake data 10
Introductory concepts
Two main areas of interest - caveat
For estimating usual intake distributions or diet-
health relationships, draw upon data for a
population/group of interest rather than a
standalone individual
In contrast to clinical settings, where interest is
in a standalone individual and only his or her
data

Slide 10
One thing to keep in mind throughout is that when we estimate usual intake distributions or diet-health relationships, we draw upon data for a population or group, not data for a standalone individual. The methods that will be discussed are not applicable to a clinical setting, for example, where interest is in a particular individual and only his or her data. In other words, throughout the series, we are discussing populations or groups of interest, not individuals.

Introduction to measurement error in dietary intake data 11
Introductory concepts
Two types of self-report instruments
Short-term instruments
(e.g., 24-hour recalls, food records, food diaries)
– Often used in population surveys for
monitoring health and nutrition
Long-term instruments
(e.g., food frequency questionnaire)
– Often used in large cohort or case-control
studies to examine diet-health relationships

Slide 11
The focus is on error in self-report dietary data measured using two types of instruments. Short-term instruments include 24-hour recalls and food records or diaries, which are often used in population surveys, data from which are used to estimate intake distributions for a population of interest. Long-term instruments like food frequency questionnaires have often been used in large cohort or case-control studies aimed at examining diet and health relationships. As the names indicate, while short-term instruments aim to capture data on recent or current diet, long-term instruments aim to capture data on diet over some long-run period of time.

Introduction to measurement error in dietary intake data 12
Introductory concepts
Main versus reference instrument
Main instrument
–
–
–
The primary dietary assessment instrument
Reference instrument
An instrument used to calibrate or validate
the main instrument
Assumed to provide estimates that are closer
to the underlying truth than the main
instrument (alloyed gold standard)

Slide 12
We will also talk about main instruments and reference instruments. The main instrument is the primary dietary assessment instrument used in a study. We often also have use for a reference instrument, which is a second instrument administered in a study that is assumed to provide estimates closer to true intakes than the main instrument. The reference instrument may be used to calibrate or validate the main instrument and may be referred to as an alloyed gold standard. I will pick up on this idea again later on in the presentation.

Introduction to measurement error in dietary intake data 13
Introductory concepts
Instruments drawn upon in this series
24-hour recall (24HR)
–
–
–
Main instrument for estimating usual intake
distributions
Reference instrument for estimation of diet-
health relationships using food frequency
questionnaire as main instrument
For future studies, main instrument for
assessing diet-health relationships

Slide 13
In this series, we will primarily discuss 24-hour recalls (24HR) and food frequency questionnaires (FFQs). We will discuss the use of 24-hour recalls as the main instrument for estimating usual intake distributions, as a reference instrument for estimating diet-health relationships in studies in which a food frequency questionnaire is the main instrument, and, in the latest developments section of the series, as the main instrument in studies aimed at examining diet-health relationships.

Introduction to measurement error in dietary intake data 14
Introductory concepts
Instruments drawn upon in this series
Food frequency questionnaire (FFQ)
–
–
Main instrument for assessing diet-health
relationships
Supplemental instrument for studying diet-
health relationships using a short-term
instrument as the main instrument

Slide 14
We will discuss the use of food frequency questionnaires as the main instrument for assessing relationships between diet and health. Food frequency questionnaires can also be used to supplement information from a short-term instrument, such as a 24-hour recall.

Introduction to measurement error in dietary intake data 15
Introductory concepts
Instruments drawn upon in this series
Recovery biomarker (reference instrument)
–
–
Specific biologic product that is directly
related to intake and not subject to
homeostasis or substantial interindividual
differences in metabolism
Examples:
•
•
Doubly labeled water for energy intake
Urinary nitrogen for protein intake

Slide 15
In addition to the self-report instruments, we will also consider recovery biomarkers as reference instruments in studies of diet and health relationships.
Recovery biomarkers are specific biologic products that are directly related to intake and are not subject to homeostasis or substantial interindividual or between-person differences in metabolism. As reference instruments, they are assumed to provide estimates that are closer to the underlying truth than the self-report instrument.
Recovery biomarkers are known for only a few dietary components and include doubly labeled water as an indicator of energy intake and urinary nitrogen as an indicator of protein intake.

Introduction to measurement error in dietary intake data 16
Introductory concepts
Daily vs. episodic consumption
Consumed nearly daily by nearly all persons
– E.g., vitamin C, total grains, total vegetables,
solid fats, added sugars
Consumed episodically by most persons
– E.g., vitamin A, whole grains, dark green
vegetables, fish

Slide 16
Finally, while I will not discuss this concept in detail today, the regularity with which a dietary component is consumed among a population of interest is another key concept in terms of methods of addressing measurement error.
We can think about two different types of dietary components—nutrients and foods that are consumed nearly daily by nearly all persons and those that are consumed episodically by most persons.
Examples of nonepisodically consumed components include nutrients like vitamin C and food groups like total grains. Episodically consumed components include nutrients that are concentrated in a few foods like vitamin A and food groups that are not commonly consumed like whole grains and dark green vegetables.
Many individuals will report zero intake of episodically consumed components on a given day, which poses a challenge for statistical modeling. This is of public health significance since the food groups that are underconsumed and that we would like to encourage the population to consume more of tend to be episodically consumed.
The regularity with which a dietary component is consumed can vary among subgroups; for example, milk may be episodically consumed among adults but not among children. Dr. Tooze will expand upon the concept and challenges of episodically consumed dietary components in the third webinar in the series, which will focus on estimating intake distributions for such components, and Dr. Kipnis will discuss examining relationships between episodically consumed components and health outcomes in the eighth webinar.

Introduction to measurement error in dietary intake data 17
Introductory concepts
Usual intake Measurement
error
The structure of measurement
error
Accounting for measurement
error
Summary & series overview
USUAL INTAKE

Slide 17
We will now move into the main content for today, starting with the concept of usual intake. In some cases, we might be interested in intake on a given day; for example, in monitoring intake of alcohol, where the number of drinks consumed on a given day is of public health significance.

Introduction to measurement error in dietary intake data 18
Usual intake
Usual dietary intake
Average or long-run intake (habitual intake) over a specific period of time

Slide 18
However, in many cases, we are interested in usual intake or average long-run intake.

Introduction to measurement error in dietary intake data 19
Usual intake
Usual dietary intake
Average or long-run intake (habitual intake) over a specific period of time
Population monitoring and surveillance:
Dietary recommendations
intended to be met over time
Diet-health research, e.g., cohort or case-
control studies:
Hypotheses based on long-
term intake

Slide 19
In monitoring and surveillance of intakes among a population, we are typically interested in usual intake since dietary recommendations are intended to be met over time. This is because nutrients can be stored in the body, making it unnecessary to achieve nutrient and food intake recommendations every day.
As well, what we eat varies from day to day, making it impractical to achieve recommendations on a daily basis. Similarly, from the perspective of diet and health relationships, what we are often interested in is how diet over a long period of time is related to some health outcome.
It should be pointed out that this time period is not always well defined. What do we mean by long-run intake over a specific period of time? The time period tends to be defined operationally rather than conceptually. For example, for estimating usual intake distributions using population monitoring and surveillance data, our assumptions about the time period are often related to the way the data are collected. For example, in the U.S., the National Health and Nutrition Examination Survey, or NHANES, is conducted in 2-year cycles so users of the data may assume the time period of interest to be 2 years. In diet and health studies, the time period may be specified by the dietary instrument; for example, a food frequency questionnaire intended to capture diet over the past 30 days or year.
Despite the potential for ambiguity about the time period, the main point here is that, often, we are interested in capturing long-run usual intake as opposed to intake on a given day.

Introduction to measurement error in dietary intake data 20
Usual intake
Challenges to estimating usual intake
Not directly observable
Typically rely on self-report instruments
– Measure usual intake with error

Slide 20
However, usual intake is not directly observable, and when it comes to estimating usual intake using data from self-report instruments there are some serious challenges. Commonly used self-report instruments, including food frequency questionnaires, 24-hour recalls, and food records, each have advantages and disadvantages related to error. Let’s consider these instruments more closely.

Introduction to measurement error in dietary intake data 21
Usual intake
Food frequency questionnaire (FFQ)

Slide 21
The food frequency questionnaire, or FFQ, asks respondents to indicate the usual frequency with which they consumed particular foods and drinks over a specified time period, such as 30 days or a year.

Introduction to measurement error in dietary intake data 22
Usual intake
Food frequency questionnaire (FFQ)
Aims to capture long-
term intake
Cognitively
challenging
Affected by recent
diet
Finite food list
Lack of detail
assumptions required
in converting to
nutrient and food
group intake

Slide 22
This slide shows what could be considered potential advantages of an FFQ on the left and potential disadvantages on the right. The FFQ is designed to measure long-term intake and thus, going back to our earlier categorization, is a long-term instrument. This could be viewed as an advantage since our interest is in capturing long-run usual intake rather than intake on a given day. However, the cognitive challenge of recalling food intake retrospectively over a long period of time can introduce substantial error.
Other sources of error in a food frequency questionnaire can include the influence of recent diet and the finite food list given that it is not typically feasible to include every possible food and drink that an individual may consume.
Further, the lack of detail on the particular foods consumed requires making assumptions when converting to nutrient and food group intake. For example, an individual may indicate consuming lasagna but there may be only one line for lasagna, not a line for lasagna made with ground beef as compared with spinach lasagna or some other variation. As a result, the nutrient and food group data that are applied are often for a composite lasagna based on the most commonly consumed variations of the food.

Introduction to measurement error in dietary intake data 23
Usual intake
Food frequency questionnaire (FFQ)
Aims to capture long-
term intake
Inexpensive to
administer
Cognitively
challenging
Affected by recent
diet
Finite food list
Lack of detail
assumptions required
in converting to
nutrient and food
group intake

Slide 23
Despite these potential sources of error, the FFQ has traditionally been the instrument of choice for large studies aimed at examining diet and health relationships because it is relatively inexpensive to administer and code.

Introduction to measurement error in dietary intake data 24
Usual intake
24-hour recall (24HR)

Slide 24
Moving to the 24-hour recall now, this is an instrument that requires the respondent to remember and report all foods and beverages consumed in the preceding 24 hours or during the preceding day.

Introduction to measurement error in dietary intake data 25
Usual intake
24-hour recall (24HR)
Less cognitively
challenging (relies on
short- term recall)
Rich detail fewer
assumptions required
in converting to
nutrient and food
group intake
Aims to capture
recent diet
– Need more than one
to assess usual intake

Slide 25
In contrast to the FFQ, the 24-hour recall is a short-term instrument that aims to capture recent diet, which could be viewed as a disadvantage if our interest is in estimating usual intake. Due to this short-term focus, recall data for more than one day are needed to enable estimation of usual intake. However, the completion of a 24-hour recall is less cognitively challenging than for an FFQ because it relies on short-term recall only. The collection of more detailed data for a given day means that fewer assumptions are required when converting to nutrient and food group intake, resulting in less error. For example, whereas an FFQ might have one line for lasagna, the details collected in a recall could allow the researcher to code multiple varieties of lasagna and, thus, to apply more accurate nutrient and food group data.

Introduction to measurement error in dietary intake data 26
Usual intake
24-hour recall (24HR)
Less cognitively
challenging (relies on
short- term recall)
Rich detail fewer
assumptions required
in converting to
nutrient and food
group intake
Aims to capture
recent diet
– Need more than one
to assess usual intake
Expensive to collect
and code
(until recently)

Slide 26
The 24-hour recall has typically been interviewer administered, with the result being that it has been a costly method. The cost is exacerbated by the need to collect data for more than one day in order to assess usual intake. As a result, this method has been impractical for large cohort studies of many thousands of people that are designed to examine diet and health relationships, though it is the default instrument for population surveys like NHANES in the U.S.
With technological advances in the field, it is becoming possible to collect recall data at a much lower cost; for example, by using automated Web-based recalls. As a result, it is anticipated that the 24-hour recall will become the instrument of choice in more and more studies aimed at examining diet and health—I’ll talk more about why that is a positive development later in the talk.

Introduction to measurement error in dietary intake data 27
Usual intake
Food records/diaries

Slide 27
Food records and diaries are the main dietary instruments for surveillance studies in Europe.

Introduction to measurement error in dietary intake data 28
Usual intake
Food records/diaries
Less cognitively
challenging (does not
rely on memory)
Rich detail fewer
assumptions required
in converting to
nutrient and food
group intake
Aims to capture
current diet (often
over several
consecutive days)
Recording may affect
intake (reactivity)

Slide 28
They share features with 24-hour recalls in terms of the focus on short-term rather than long-term diet, the collection of detailed data, and the reduced cognitive challenge compared with a food frequency questionnaire. However, a record or diary aims to capture diet concurrent with eating behavior. The act of record keeping can induce reactivity such that individuals may change their intake patterns. For this reason, records or diaries are often used as tools in weight loss programs and trials. However, this is a concern if our intent is to capture true usual intake.

Introduction to measurement error in dietary intake data 29
Usual intake
Food records/diaries
Less cognitively
challenging (does not
rely on memory)
Rich detail fewer
assumptions required
in converting to
nutrient and food
group intake
Aims to capture
current diet (often
over several
consecutive days)
Recording may affect
intake (reactivity)
Expensive to code
(until recently)

Slide 29
Similar to recalls, records and diaries have tended to be more expensive than food frequency questionnaires owing to the costs associated with coding. This, too, is changing with technological advances, such as food record apps on mobile phones that may reduce much of the manual coding required. Because most of the data sets that we have access to in the U.S. do not make use of records or diaries, we will not focus specifically on them. However, concepts discussed in relation to accounting for measurement error in recall data may apply to these other short-term instruments.

Introduction to measurement error in dietary intake data 30
Usual intake
Challenges to estimating usual intake
Self-report instruments used to assess usual
dietary intake are affected by several types of
measurement error
– If we ignore this error, our results may be
biased

Slide 30
The bottom line is that all self-report instruments have sources of error. However, because we can’t observe usual intake directly, we continue to rely on self-report data. While some instruments are known to have more sources of error than others, a particular instrument may be used in a given study for practical reasons, such as cost. But if we ignore the error, we may end up with biased results.

Introduction to measurement error in dietary intake data 31
Usual intake
Describing intake distributions
Using observed rather than true intake can lead
to erroneous conclusions

Slide 31
For example, this focuses on the estimation of intake distributions, where typically we rely on 24-hour recall data. Here, we are looking at a hypothetical distribution of intake. The red line shows intake based on a single day, the blue line shows intake based on 2 days, and the green line shows estimated usual intakes that have been adjusted for measurement error.
We’ll talk more about adjusting for error later but, here, what I want to emphasize is that the distribution of intakes based on 1 day is wider and flatter compared with the usual intake distribution. The graph also shows that averaging over 2 days may help somewhat but is not sufficient to account for error. An important implication here is that if we do not account for measurement error, we may arrive at erroneous conclusions; for example, a biased estimate of the fraction of a population of interest with usual intake above or below some standard, such as a nutrient requirement or food group recommendation. This is because, as you can see here, without accounting for measurement error, we have overestimation of the probabilities at the tail of the distribution.

Introduction to measurement error in dietary intake data 32
Usual intake
Estimating diet-health relationships
Regression using observed rather than true
intake produces:
–
–
Attenuated slope estimate
Loss of power to detect relationship between
a dietary exposure and an outcome

Slide 32
Similarly, for estimation of diet-health relationships, using observed intake based on self-report data without taking measurement error into account can lead to biased results. In particular, estimates of relationships between diet and health are attenuated or biased towards the null. In addition, measurement error causes loss of power to detect relationships between a dietary exposure and an outcome, meaning that a larger sample size is needed. The implication is that we may not be able to uncover relationships that actually exist because of measurement error, leading to erroneous conclusions about how diet affects health—an obvious problem from a public health perspective.

Introduction to measurement error in dietary intake data 33
Usual intake
Challenges to estimating usual intake
Self-report instruments used to assess usual
dietary intake are affected by several types of
measurement error
Need to understand and address error to avoid biased results

Slide 33
In order to reach valid conclusions and avoid biased results when using self-report instruments, we need to understand the error—in particular, the structure of measurement error—in the self-report instruments we use so that we can appropriately address it.

Introduction to measurement error in dietary intake data 34
Introductory concepts
Usual intake Measurement
error
The structure of measurement
error
Accounting for measurement
error
Summary & series overview
MEASUREMENT ERROR

Slide 34
So let’s go on now to look at measurement error more closely.

Introduction to measurement error in dietary intake data 35
Measurement error
What is measurement error?
Difference between the true value and the
value obtained from a measure
Random Systematic

Slide 35
What exactly is measurement error? This term refers to the difference between the true value of a parameter such as intake and the value obtained from a measure such as reported intake. This problem affects all kinds of data, not just dietary intake data. Other examples include measures of weight, height, or blood pressure that are self-reported or taken with poorly calibrated equipment. There are two kinds of measurement error: random and systematic.

Introduction to measurement error in dietary intake data 36
Measurement error
Random error
An unpredictable source of error that contributes
variability
– Instrument may be accurate (i.e., unbiased),
but may not be precise

Slide 36
Random error is the most studied form and as a result is sometimes referred to as classical measurement error. It is an unpredictable source of error that contributes variability. As the figure shows, an instrument that has random error is not biased but may not be precise.

Introduction to measurement error in dietary intake data 37
Measurement error
Random error
An unpredictable source of error that contributes
variability
– Instrument may be accurate (i.e., unbiased),
but may not be precise
If an instrument has only random error,
the average of many repeat measures
approximates the true value

Slide 37
The positive of random error is that if it is the only type of error affecting an instrument, we can deal with it by averaging so long as we have repeat measures.

Introduction to measurement error in dietary intake data 38
Measurement error
Systematic error (bias)
A source of error in which measurements
consistently depart from the true value in the
same direction
– Instrument is inaccurate (i.e., biased)

Slide 38
Systematic error, on the other hand, cannot be dealt with by averaging. Also known as bias, systematic error is a source of error that results in measurements that consistently depart from the true value in the same direction. In contrast to random error, an instrument with systematic error is inaccurate, as depicted by the figure.

Introduction to measurement error in dietary intake data 39
Measurement error
Systematic error (bias)
A source of error in which measurements
consistently depart from the true value in the
same direction
–
Instrument is inaccurate (i.e., biased)
If an instrument has systematic error,
the average of many repeat measures
does not approximate the true value

Slide 39
If an instrument has systematic error, the mean of many repeats does not approximate the true value. To address systematic error, we must have a reference instrument that allows us to estimate truth and correct for the bias. This is a challenge with dietary intake data.

Introduction to measurement error in dietary intake data 40
Measurement error
Key measurement error terms
–
–
–
–
Random error:
Within-person random
error
Systematic error:
Person-specific bias
Constant additive error
Intake-related bias

Slide 40
There are some key measurement error terms that will be referred to repeatedly through the series. They include within-person random error and three types of systematic error or bias: person-specific bias, constant additive error, and intake-related bias.

Introduction to measurement error in dietary intake data 41
Measurement error
Key measurement error terms
–
–
–
–
Random error:
Within-person random
error
Systematic error:
Person-specific bias
Constant additive error
Intake-related bias

Slide 41
Let’s look at each of these more closely, starting with within-person random error.

Introduction to measurement error in dietary intake data 42
Measurement error
Within-person random error In
take
True usual intake
for an individual
Days

Slide 42
As I noted, random error contributes variability. This graph shows true intake over days for a given individual. The x-axis represents days and the y-axis represents intake. The red dots indicate actual intake for each day, with the red line showing usual or long-run average intake. The variation across days, or day-to-day variation, reflects the fact that what we eat and drink tends to change from day to day.

Introduction to measurement error in dietary intake data 43
Measurement error
Within-person random error In
take
True usual intake
for an individual
Days
Reported intake

Slide 43
We now layer on reported intake in blue. This shows that in addition to within-person or day-to-day variation in intake, there may be other sources of variability such as error in measurement on a given day.
However, if we have enough repeat measures, averaging across days will give us an approximation of usual intake such that our estimate of usual intake based on self-report is not biased.

Introduction to measurement error in dietary intake data 44
Measurement error
Key measurement error terms
–
–
–
–
Random error:
Within-person random
error
Systematic error:
Person-specific bias
Constant additive error
Intake-related bias

Slide 44
That is in contrast to systematic error. While we will look at each of the three types of systematic error one by one from a conceptual perspective, it is important to note that they typically do not occur in isolation in dietary intake data.

Introduction to measurement error in dietary intake data 45
Measurement error
Person-specific bias (systematic) In
tak
e
Days
True usual
intake for an
individual
Defined by personal characteristics

Slide 45
Person-specific bias is a type of systematic error that arises as a result of personal characteristics, such as sex, age, or body weight, that lead to under- or overreporting, for example. This graph again shows true intake over days for a given individual, with the red dots indicating actual intake for each day and the red line showing usual or long-run average intake.

Introduction to measurement error in dietary intake data 46
Measurement error
Person-specific bias (systematic)
True usual
intake for an
individual
Reported intake
Defined by personal characteristics
Inta
ke
Days

Slide 46
Now we layer on reported intake for this individual. In contrast to what we saw for random within-person error, we now see bias such that if we average across many days, our estimate of intake based on self-reports will not approximate true usual intake.

Introduction to measurement error in dietary intake data 47
Measurement error
Constant additive error (systematic)
Occurs equally for all participants
True usual intake
True usual intake
Individual A
Individual B Inta
ke
Days

Slide 47
In contrast to person-specific bias, constant additive error and intake-related bias are sources of group-level bias—a term you may hear in the subsequent webinars. Constant additive bias is a result of systematic errors that occur equally for all participants. Again, here we have a graph showing true intake over days, but this time we have data for two individuals—individual A in red and individual B in green.

Introduction to measurement error in dietary intake data 48
Measurement error
Constant additive error (systematic)
Occurs equally for all participants
True usual intake
Reported intake
True usual intake
Reported intake
Individual A
Individual B Inta
ke
Days

Slide 48
Now we layer on reported intake for these two individuals, in blue for individual A and in purple for individual B.
We see that there is systematic effect such that the reported intake departs from true intake in a consistent direction and the average reported intake over many days does not approximate true intake. For this type of error, the magnitude of the effect is constant for the two individuals.
As mentioned earlier, systematic errors do not occur in isolation in dietary intake and it is difficult to come up with a simple example of constant additive error. However, for illustrative purposes, an example outside of diet is a weight scale that results in measures that are 5 lbs too low for all individuals in the population of interest.

Introduction to measurement error in dietary intake data
Days
49
True usual intake
True usual intake
Individual A
Individual B
Measurement error
Intake-related bias (systematic)
Inta
ke
Proportional to true intake level

Slide 49
Another source of group-level bias is intake-related bias. This type of bias may also be referred to as proportional or multiplicative bias because its magnitude is proportional to or multiplied by true intake. Again, we have our graph showing true intake over days for individual A in red and individual B in green.

Introduction to measurement error in dietary intake data 50
Measurement error
Intake-related bias (systematic)
True usual intake
True usual intake
Reported intake
Reported intake
Individual A
Individual B
Inta
ke
Days
Proportional to true intake level

Slide 50
When we layer on reported intake, you can see that we have a systematic bias and that reported intake averaged over days does not approximate true usual intake but, here, the magnitude of the bias is related to true intake. In other words, person A, with a higher true intake level, underreports his or her intake to a greater degree than person B, who has a lower true intake level.

Introduction to measurement error in dietary intake data 51
Measurement error
Key measurement error terms
–
–
–
–
Random error:
Within-person random
error
Systematic error:
Person-specific bias
Constant additive error
Intake-related bias

Slide 51
You will hear more about these types of error and their impact on estimates in the subsequent webinars.

Introduction to measurement error in dietary intake data 52
Measurement error
Impact of measurement error
Random error can be dealt with by averaging
across repeat measures
This is not the case for systematic error
The ideal instrument hasonly random error

Slide 52
To summarize, self-report instruments are affected by multiple sources of error. Random error can be mitigated by averaging across repeat measures, but the same is not true for systematic error. Assuming all instruments have some error, the ideal instrument, then, has only random error because this is a type of error that we can work to mitigate.

Introduction to measurement error in dietary intake data 53
Introductory concepts
Usual intake Measurement
error
The structure of measurement
error
Accounting for measurement
error
Summary & series overview
THE STRUCTURE OF
MEASUREMENT ERROR

Slide 53
So far, we have reviewed some potential sources of error in self-report instruments and looked more closely at types of measurement error. Now let’s look more specifically at the main types of measurement errors that affect 24-hour recalls and food frequency questionnaires—what we refer to as the structure of measurement error in these instruments. This will help us to understand how to address error when we use these tools.

Introduction to measurement error in dietary intake data 54
The structure of measurement error
The structure of measurement error
Rij = β0 + β1Ti + ui + eij
Constant additive
error
Intake-related
bias Person-specific
bias
Random error
R = reported intake
T = truth
i=person, j=day

Slide 54
In order to study the structure of measurement error, statistical modeling can be used to separate different types of measurement error.
This equation shows the key types of measurement error that we just examined, including the three types of systematic bias and random error.
Here, reported intake, or R, for person i on day j equals additive error, which is a constant, plus intake-related bias, which is proportional to true intake, or T, plus the person-specific bias plus random error.
For today, we don’t need to worry about this notation but you will see similar notation over the subsequent webinars.
On that note, there is a glossary of key terms and notation on the webinar series Web site that you may want to access if you have not already.

Introduction to measurem
ent error in dietary intake data 55
The structure of measurement error
How can we study error in a given instrument?
Validation studies: examine measurement error
structure by comparing self-report instrument
with a reference instrument
Alloyed gold standard used to estimate truth
More
extensive
self-report
instrument
Recovery
biomarker

Slide 55
Back to the topic of measurement error structure: How do we go about studying the measurement error structure of a given instrument?
Validation studies have been conducted to estimate the relationship between data from a self-report instrument and true intake using statistical theory. We do not have a true gold standard for usual intake but we can use an alloyed gold standard to estimate truth.
An alloyed gold standard is a reference instrument that has error but only random error. In the past, we have often used a more extensive self-report instrument as an alloyed gold standard. More recently, recovery biomarkers have been used to assess how well a self-report instrument captures true intake.
A recovery biomarker is so termed because it allows us to recover intake without systematic bias. As we reviewed at the beginning of the session, a recovery biomarker is a specific biologic product that is directly related to intake and not subject to homeostasis or substantial interindividual differences in metabolism.

Introduction to measurement error in dietary intake data 56
Observing Protein and Energy Nutrition (OPEN) The structure of measurement error
261 men and 223 women aged 40-69 years living
in Montgomery County, Maryland
Assessed measurement error structure of:
–
–
Interviewer-administered 24HR
FFQ (Diet History Questionnaire)

Slide 56
Several validation studies have been conducted to examine the error structure of self-report instruments, including the Observing Protein and Energy Nutrition, or OPEN, study conducted by the National Cancer Institute in 1999-2000.
This study included 261 men and 223 women aged 40-69 years who lived in Montgomery County, Maryland, where the U.S. National Institutes of Health are located. OPEN was designed to assess the measurement error structure of 24-hour recalls and a food frequency questionnaire.

Introduction to measurement error in dietary intake data 57
The structure of measurement error
OPEN study design
Self-report instruments:
•
•
24HR (2 repeats)
FFQ (2 repeats)
Recovery biomarkers:
•
•
Doubly labeled water (2 repeats for n=25)
Urinary nitrogen (2 repeats)
Slide 57
The study protocol involved two repeats of each of the dietary assessment instruments. The recovery biomarkers used to estimate truth were doubly labeled water for energy and urinary nitrogen for protein. Statistical modeling was then used to assess the structure of measurement error in FFQ and 24-hour recall. Today, I will give a brief overview of the results and their implications, and you will hear more details about the results of OPEN in later sessions.

Introduction to measurement error in dietary intake data 58
The structure of measurement error
OPEN findings: Structure of measurement error
24-hour recall (24HR)
•
•
Larger within-person random error
Smaller systematic error
Food frequency questionnaire (FFQ)
•
•
Smaller within-person random error
Larger systematic error

Slide 58
The findings of OPEN suggest that 24-hour recalls have larger within-person random error than the FFQ but smaller systematic error. This relates back to the features of the instruments we examined earlier.
The random error in the 24-hour recall is driven by day-to-day variation in intake and other random errors that affect reporting from day-to-day.
The error in the FFQ is driven by inaccuracies associated with the task of recalling long-term intake as well as features of the instrument such as the finite food list and the relative lack of detail about foods consumed.

Introduction to measurement error in dietary intake data 59
Energy underreporting The structure of measurement error
–
–
Results of OPEN (and other large validation
studies) suggest a tendency toward serious
energy under-reporting at the group level:
24HR by 10%
FFQ by 30%
Part of systematic error – due to sources of
group-level bias

Slide 59
Where does energy underreporting fit in?
On average at the population or group level, OPEN and other validation studies suggest serious energy underreporting of approximately 10 percent using 24-hour recalls but around 30 percent for FFQs. This underreporting is part of the systematic error at the group level and arises from sources of group-level bias, including constant additive error and intake-related bias.

Introduc
tion to measurement error in dietary intake data 60
The structure of measurement error
OPEN findings: Attenuation and correlation
–
–
Attenuation factor: the degree to which a
regression coefficient is biased to the null
(attenuated) due to measurement error
Closer to zero = more attenuation
Correlation between self-report and truth:
related to statistical power to detect diet-health
relationships
Closer to zero = less powerful the study will
be (i.e., need larger sample size)

Slide 60
Other parameters of interest from the OPEN study include attenuation factors and correlation coefficients. These are of particular relevance to studies aimed at examining diet-and-health relationships.
Attenuation factors reflect the degree to which a regression coefficient is biased to the null due to measurement error. Closer to zero means more attenuation. In other words, an attenuation factor closer to zero indicates more bias in a regression coefficient, such as an odds ratio or relative risk.
Correlation between the self-report estimate and truth as estimated from the recovery biomarkers tells us about the statistical power of a study to detect relationships. Closer to zero means the less powerful the study will be; in other words, we have less statistical power and need a larger sample size to detect relationships between a dietary exposure and a health outcome.

Introduction to measurement error in dietary intake data 61
The structure of measurement error
OPEN findings: Attenuation and correlation
Attenuation factors and correlation coefficients
are substantially better (closer to 1) for repeated
24HR compared to FFQ

Slide 61
What the OPEN results showed are substantially better attenuation factors and correlation coefficients for repeat 24-hour recalls as compared with the food frequency questionnaire.

Introduction to measurement error in dietary intake data 62
The structure of measurement error
OPEN findings: hypothetical scenarios (men)
Nutrient 1
FFQ
2
FFQ
1
24HR
4
24HR
14
24HR
Attenuation factor/correlation with truth
Energy .08/.20 .09/.21 .18/.34 .30/.45 .36/.49
Protein .16/.32 .17/.34 .20/.37 .37/.51 .46/.57
Protein Density .40/.43 .49/.47 .23/.38 .50/.55 .68/.65

Slide 62
This table shows attenuation factors and correlation with truth estimated from the recovery biomarkers for men for one and two food frequency questionnaires and one, four, and fourteen 24-hour recalls for energy, protein, and protein density (or energy-adjusted protein), based on simulation.
You will notice that the parameters are closer to one for repeat recalls compared with the food frequency questionnaire. The parameters do not improve much with a repeat of the FFQ. Consistent with our earlier discussion of the structure of error in these two instruments, this suggests that the attenuation factors for the food frequency questionnaire are mostly driven by systematic error, whereas for the 24-hour recall they are mostly driven by random error that can be addressed with repeat measures.
We also see some patterns by nutrient, with less attenuation and better correlation for protein compared with energy. There is less attenuation and higher correlation for protein density compared with protein, suggesting that adjusting for energy is an important consideration. Dr. Larry Freedman will pick up on this concept in webinar 6.

Introduction to measurement error in dietary intake data 63
The structure of measurement error
OPEN findings: hypothetical scenarios (women)
Nutrient 1
FFQ
2
FFQ
1
24HR
4
24HR
14
24HR
Attenuation factor/correlation with truth
Energy .04/.10 .05/.11 .10/.21 .20/.30 .26/.35
Protein .14/.30 .16/.32 .14/.29 .32/.44 .46/.53
Protein Density .32/.35 .38/.38 .16/.25 .40/.39 .61/.49

Slide 63
Similar patterns can be seen for women, with attenuation factors and correlation coefficients closer to one for recalls as opposed to the food frequency questionnaire.

Introduction to measurement error in dietary intake data 64
The structure of measurement error
Summary: Measurement error structure
Main sources of error for dietary components for
which we can assess measurement error
structure:
– 24HR: random within-person error
•
Can be mitigated by repeats and averaging

Slide 64
To summarize, then, for the dietary components for which we can assess measurement error using recovery biomarkers, the main source of error in the 24-hour recall is random within-person error that can be addressed by averaging over many repeats.

Introduction to measurement error in dietary intake data 65
–
•
•
–
Summary: Measurement error structure The structure of measurement error
Main sources of error for dietary components for
which we can assess measurement error
structure:
FFQ: systematic error
Unaffected by averaging
Unless we have a reference instrument
with only random error, cannot correct for
systematic error
Available for only 2 to 3 dietary
components

Slide 65
For the FFQ, the main sources of error are systematic biases that are not mitigated by averaging across repeat measures. For systematic error, we need a reference instrument that allows us to separate and correct for the different types of error. Because we only have recovery biomarkers for a few dietary components, this remains a challenge.

Introduction to measurement error in dietary intake data 66
Summary: Measurement error structure The structure of measurement error
–
–
Studies using 24HR as main instrument:
Intake distributions closer to truth because
can account for random error
Less bias and more power to detect diet-
health relationships
Use the instrument with the smallest
systematic error (i.e., 24HR)
– assume it is unbiased

Slide 66
So what are the implications of these findings?
Based on its measurement error structure, the 24-hour recall is the best existing approximation of a correct reference instrument except for those cases for which we have a recovery biomarker.
Usual intake distributions based on 24-hour recall data will be closer to the truth because we can account for the random error and there is less systematic error.
Similarly, diet-health studies using 24-hour recalls as the main instrument will have less bias and more power to detect relationships as compared with those using food frequency questionnaires.
Given that we can account for random error, the overall implication is to use the instrument with the smallest systematic error, which is the 24-hour recall with repeats, and to assume that it is unbiased or, in other words, contains only random error. I emphasize this because this assumption has been a springboard for work conducted over recent years and underlies the methods that you will hear about over the coming webinars.

Introduction to measurement error in dietary intake data 67
The structure of measurement error
Implications for study design and analysis
Use of 24HR with repeats for estimation of usual
intake distributions
Efforts to make collection of multiple 24HR from
large samples in diet-health studies feasible
– Development of statistical techniques for the
use of short-term instruments (e.g., 24HR) as
main instrument in diet-health studies
Use of 24HR as a reference instrument for
studies using FFQ as the main instrument

Slide 67
What does this mean for study design and analysis for either estimating usual intake distributions or examining diet-health relationships?
What we have discussed so far supports the use of 24-hour recalls with repeats for estimation of usual intake distributions and efforts to make the collection of multiple 24-hour recalls from large samples feasible so that they may be used as the main instruments in diet-and-health studies.
As noted earlier, with technological advances such as automated Web-based recalls, the cost of collecting high-quality recall data will no longer be prohibitive. However, this poses new challenges in terms of methods development to appropriately analyze such data; this is a nascent area that Dr. Kipnis will discuss in the final webinar in the series.
Finally, under the assumption that it is unbiased, the 24-hour recall can be used as a reference instrument for studies that use a food frequency questionnaire as the main instrument, a concept that will be covered in webinars 6 through 8. While this assumption may be flawed, the existing evidence suggests that using a 24-hour recall as a reference instrument is preferable to ignoring the error in an FFQ.

Introduction to measurement error in dietary intake data 68
Introductory concepts
Usual intake Measurement
error
The structure of measurement
error
Accounting for measurement
error
Summary & series overview
METHODS OF ACCOUNTING
FOR MEASUREMENT ERROR

Slide 68
Now let’s move on to a brief overview of methods of accounting for measurement error. This section will provide some highlights of the methods that will be discussed in detail throughout the webinar series.

Introduction to measurement error in dietary intake data 69
Accounting for measurement error
Addressing error in 24HR data
24-hour recall (24HR)
•
•
Larger within-person random error
Smaller systematic error
Food frequency questionnaire (FFQ)
•
•
Smaller within-person random error
Larger systematic error
If repeat measures available, can distinguish
random from systematic within-person variation
and correct for within-person variation

Slide 69
Starting out with 24-hour recall data, for which we have noted we can mitigate the random within-person error if we have repeat measures. One point we haven’t discussed yet and which Dr. Dodd will pick up on in the second webinar is that the repeat measures may be available for a subsample only.

Introduction to measurement error in dietary intake data 70
–
–
•
Estimating usual intake distributions Accounting for measurement error
24HR with repeats – general approach:
Separate within- and between-person
variation
Estimate distribution of usual intake by
removing within-person variation using
statistical modeling
May also account for nuisance effects
(e.g., day of week, recall sequence,
interview mode) Webinars 2, 3, 5

Slide 70
When using 24-hour recalls for estimation of usual intake distributions—for example, for the purpose of estimating the proportion of the population with intake above or below some threshold—the general approach is to separate the within- and between-person variation and remove the within-person variation using statistical modeling.
While we have talked about averaging as a way to mitigate the effects of random error, in most cases we don’t have enough repeats on each individual to make this a viable option, in which case statistical modeling is used to remove the within-person error.
Statistical models for estimating intake distributions may include covariates to account for nuisance effects, which are variables that may have an effect on observations but are of no intrinsic interest themselves. Examples include the day of the week for which intake was recalled, whether the recall was the first or second completed by a particular individual, and interview mode—for example, telephone compared with in-person.

Introduction to measurement error in dietary intake data 71
Some existing methods Accounting for measurement error
U.S. National Research Council (NRC)/Institute
of Medicine (IOM)
Iowa State University (ISU) Method
U.S. National Cancer Institute (NCI) Method
EFCOVAL Consortium Multiple Source Method
(MSM)
Statistical Program for Age-adjusted Dietary
Assessment (SPADE)

Slide 71
A number of methods have been proposed to estimate usual intake distributions using 24-hour recall data, including the U.S. National Research Council, or NRC, method; the Iowa State University, or ISU, method; the U.S. National Cancer Institute, or NCI, method; the Multiple Source Method from the European Food Consumption Validation Project; and the Statistical Program for Age-adjusted Dietary Assessment from the National Institute for Public Health and the Environment in the Netherlands. A 2006 paper in the Journal of the American Dietetic Association that was included in the recommended resources for this session compares a few of these methods.
In contrast to the other methods listed here, the National Cancer Institute method is a unified approach that can be used not only for estimating usual intake distributions but also for predicting individual intake for use in diet-and-health models. It can be used for dietary components consumed nearly daily by nearly all persons and those consumed episodically. This is the method that the presenters will primarily draw upon given that each has been involved in the development or extension of the method over recent years.

Introduction to measurement error in dietary intake data 72
Accounting for measurement error
Describing intake distributions
Single-day intake
2-day mean intake
Usual intake
Distribution of added sugar intake, 2-8 year olds, NHANES 2003-04

Slide 72
This is similar to the graph that I showed earlier but this time shows the distribution of usual intake of added sugars among 2-8-year-olds based on data from the 2003-04 U.S. National Health and Nutrition Examination Survey.
This distribution is typical of the distributions that we see in practice. As we saw earlier, the distributions based on a single-day or even 2 days of intake data are wider and flatter compared with the adjusted usual intake distribution. This is a result of the excess within-person variation that we have discussed and can result in biased estimates of the proportion of a population of interest falling below a threshold, for example. It is essential to take measurement error into account using statistical modeling when one is interested in characteristics of the distribution in order to avoid erroneous conclusions.
One other thing to point out here is that even though it’s hard to see because of the skewed distributions, the means are equal.

Introduction to measurement error in dietary intake data 73
Accounting for measurement error
Estimating group mean intake
Assumption that 24HR is subject to random error
only = unbiased for estimating group mean
intake
– Mean from single 24HR may be sufficient

Slide 73
This raises a question: If we are interested in estimating mean intake among a population of interest using recall data—for example, for comparing mean intake among groups—do we need to conduct statistical modeling?
Under the assumption that recalls are unbiased for true intake on that day, the mean from 1 day is assumed to be equal to the mean of the usual intake distribution. As a result, if we are interested only in the mean, we may use a mean from a single 24-hour recall to estimate the usual mean intake for the group. If our research question hinges only on estimating mean usual intake for a group, we do not need to collect recall data for more than 1 day.
There are still some considerations to keep in mind, such as ensuring that recalls are distributed across the days of the week and seasons, and we may still want to conduct statistical modeling to account for these nuisance effects as we do for distributions. However, we do not need to remove the within-person error in order to arrive at the mean usual intake.
Moving on now to consider diet-and health-relationships, I mentioned the use of 24-hour recall data to assess diet-health relationships in future studies, but I will come back to that after discussing food frequency data, which up until now have been what are commonly available in such studies.

Introduction to measurement error in dietary intake data 74
Addressing error in FFQ data
24-hour recall (24HR)
•
•
Larger within-person random error
Smaller systematic error
Food frequency questionnaire (FFQ)
•
•
Smaller within-person random error
Larger systematic error
Use a reference instrument to distinguish the
components of systematic error and correct
intake estimates
Accounting for measurement error

Slide 74
As we noted, the main source of error in food frequency data is systematic error that we cannot correct for unless we have a reference instrument that allows us to distinguish the components of the error and correct our intake estimates.

Introduction to measurement error in dietary intake data 75
Accounting for measurement error
Estimating diet-health relationships
–
•
FFQ as the main instrument – general approach:
Adjust regression coefficients for bias due to
measurement error (regression calibration)
Requires data from a reference instrument
(e.g., 24HR) administered to a subsample
(calibration substudy)
Webinars 6-8

Slide 75
When we are interested in examining diet-and-health relationships, regression models are used to quantify the relationship between the dietary exposure and the health outcome. Regression coefficients such as odds ratios can be adjusted for bias using various statistical techniques. The most commonly used is regression calibration.
Applying this method requires data from a calibration substudy, a study in which a reference instrument is administered to a subsample. The calibration substudy can be either internal or external to the main study and provides us with data that allow us to estimate true intake and correct our estimates from the food frequency questionnaire.
In the absence of biomarkers for most dietary components, the 24-hour recall is used as the reference instrument. These methods will be described in detail for both nonepisodically and episodically consumed dietary components in webinars 6 through 8.

Introduction to measurement error in dietary intake data 76
Estimating diet-health relationships Accounting for measurement error
-3 -2 -1 0 1 2 3
-3
-2
-1
0
1
2
3
•
•
Ou
tco
me
Intake
Usual Intake
Observed Intake

Slide 76
This is a graph that we saw earlier, to remind you that our intent here is to deattenuate our estimates of relationships between diet and health, which are biased towards the null by measurement error. In other words, measurement error makes it harder to detect an effect and we want to correct for that bias in our results so that we can better understand how diet is associated with a variety of health and disease outcomes. Dr. Freedman, in particular, will expand upon these concepts in webinar 6.

Introduction to measurement error in dietary intake data 77
Accounting for measurement error
Estimating diet-health relationships
–
–
Future studies using a 24HR (or other short-term
instrument) as the main instrument – general
approach:
Adjust regression coefficients for bias due to
measurement error (regression calibration)
Information from FFQ may be used to
supplement data from short-term instrument
Webinar 12

Slide 77
Now to consider the use of 24-hour recall data as the main instrument in diet-health studies….
Similar principles apply in terms of the use of techniques such as regression calibration to adjust regression coefficients for bias, but it is considerably more complex as compared with the approach for food frequency data. In this case, data from an FFQ may be used, not as a reference per se, but to supplement data from the short-term instrument. You will hear much more about this in webinar 12.

Introduction to measurement error in dietary intake data 78
Accounting for measurement error
Alleviating the effects of measurement error
–
–
Combine self-report instruments (e.g., 24HR and
FFQ) or self-report and biomarker data to:
Improve power to detect relationships
Increase precision of estimates, e.g.,
percentiles of the distribution
Webinars 10 & 11

Slide 78
Finally, we can also mitigate the effects of measurement error by combining instruments or combining self-report and biomarker data, which can increase power to detect relationships and increase the precision of estimates. In webinars 10 and 11, Doug Midthune and Larry Freedman will discuss the potential gains to be made from such strategies in detail.

Introduction to measurement error in dietary intake data 79
Introductory concepts
Usual intake Measurement
error
The structure of measurement
error
Accounting for measurement
error
Summary & series overview
SUMMARY & SERIES
OVERVIEW

Slide 79
Moving on now to summarize the main messages from today’s webinar….

Introduction to measurement error in dietary intake data 80
Summary & series overview
Today’s webinar: summary of main messages
Self-report instruments used to assess usual dietary
intake are affected by several types of measurement
error
Ideal instrument has only random error (unbiased)
Structure of error in 24HR makes it the best
approximation of an unbiased instrument for
estimation of intake distributions and diet-health
relationships
Use best instrument possible and statistical
techniques to account for measurement error

Slide 80
We are often interested in usual intake, which is not directly observable; thus, we typically rely on self-report instruments, which measure usual intake with error. We examined types of measurement error and determined that the ideal instrument has only random error; in other words, is unbiased, because we can mitigate the effects of random error using repeat measures, while this is not the case for systematic error.
Because of the measurement error structure of the 24-hour recall, it is considered the best approximation of a reference instrument, making it the recommended instrument for estimation of usual intake distributions. While the 24-hour recall has not traditionally been used in diet-and-health studies, technologic advances are making it feasible to do so in the future. The bottom line for study design and analysis is to use the best possible instrument and statistical techniques to account for measurement error in order to reach valid conclusions.

Introduction to measurement error in dietary intake data 81
Today’s webinar: the basics Summary & series overview
The basics Describing
usual intake distributions
Assessing relationships
Latest developments
Usual dietary intake
Random and systematic measurement errors
and their impact
Concepts underpinning approaches to reducing
measurement error

Slide 81
In today’s webinar, we’ve covered the basics and reviewed many concepts that will be revisited over the coming sessions.
Introduction to measurement error in dietary intake data 82
The basics Assessing
relationships Latest
developments
Webinars 2-5 Summary & series overview
Describing usual intake distributions
Describing usual intake distributions for dietary
components consumed daily and episodically
Accounting for complex survey design
Estimating total usual intake
(diet and supplements)

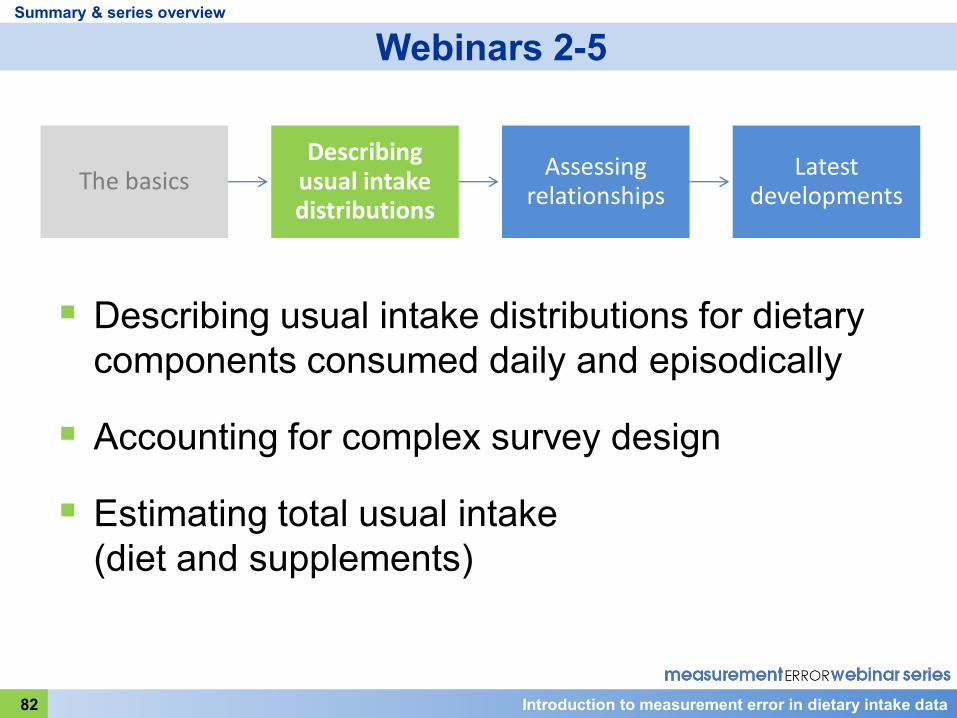
Slide 82
In the second portion of the webinar series, we will focus on estimation of usual intake distributions. In addition to webinars on distributions for nonepisodically and episodically consumed dietary components, we will hear about accounting for complex survey design, which is of relevance since survey data used for estimating usual intake distributions among a population of interest are often collected using complex sampling strategies that have implications for analysis.
In this portion of the series, we will also hear from Dr. Regan Bailey about estimating total usual nutrient intake from diet and supplemental sources, a topic that we have not yet touched on but which is of importance given the substantial contribution that supplements can make to nutrient intake.

Introduction to measurement error in dietary intake data 83
The basics Describing usual
intake distributions
Latest developments
–
–
Summary & series overview
Webinars 6-8
Assessing relationships
Impact of measurement error on assessing diet-
health relationships
Dietary components
consumed daily
Episodically consumed
dietary components
FFQ as
main dietary
assessment
instrument

Slide 83
In the third section of the series, we will hear details about the theory and methods of accounting for measurement error in assessing diet-and-health relationships using a food frequency questionnaire as the main instrument and a 24-hour recall as a reference instrument.

Introduction to measurement error in dietary intake data 84
The basics Describing usual
intake distributions
Assessing relationships
Summary & series overview
Webinars 9-12
Latest developments
–
–
Multivariate applications, e.g., diet quality indices
Improving estimation by:
Combining instruments
Combining self-report and biomarker data
Using 24-hour recalls in diet-health studies

Slide 84
Finally, in the last section of the series, we will hear about some recent developments in measurement error methods, including statistical techniques designed to handle the complexity of multivariate dietary data and study design strategies to mitigate the effects of measurement error. This will include a session on multivariate dietary variables such as indices that will be presented by Dr. Raymond Carroll.

85
Summary & series overview
Webinar resources
Series schedule
Objectives and recommended readings
Glossary of key terms and notation
Archived webinars (slides and audio)
riskfactor.cancer.gov/measurementerror

Slide 85
Before we wrap up, I will highlight a few resources that you may find to be useful. If you have not visited our Web site recently, please do so to access the full series schedule as well as objectives and recommended readings for each webinar and the glossary of key terms and notation that I mentioned earlier. Links to the archived recorded webinars will be posted on the site as they become available. The Web site address is available on this slide and in the Note section at the top left of the screen.

86
Summary & series overview
Other resources
National Cancer Institute method, references,
and SAS macros
riskfactor.cancer.gov/diet/usualintakes
NHANES Advanced Dietary Analyses Tutorial
www.cdc.gov/nchs/tutorials/dietary/advanced

Slide 86
Other resources that may be of interest include the usual intakes pages on the National Cancer Institute Web site. These pages include details on the NCI method and links to SAS macros that can be used to implement some of the applications that will be described in the series. The National Health and Nutrition Examination Survey Advanced Dietary Analyses tutorial, authored by Dr. Tooze, may also be of interest as a supplementary resource.

Introduction to measurement error in dietary intake data 87
QUESTIONS & ANSWERS Moderator: Kevin Dodd
Please submit questions
using the Chat function

Slide 87
We will now check with Kevin Dodd for any questions that may have been submitted during the session. But one more note: It is no coincidence that I have a statistician here to moderate the questions. As I mentioned earlier, our intent was to design the webinars for a broad audience and we welcome participants who do not have an extensive statistical background, but we do recommend consultation, and better yet collaboration, with a statistician in order to make use of the complex methods that will be presented throughout the series. In that spirit, Kevin may jump in to help me answer questions. Kevin.

Questions & Answers
Question: Can recovery biomarkers have systematic error due to lab differences or storage or other issues?
This is certainly possible. Appropriate quality control is needed to guard against this and if there are problems, strategies are needed to correct for this error in the analysis. (S. Kirkpatrick)
Could you discuss the limitations of the OPEN study?
The OPEN study will be discussed in greater detail in webinar 6. (K. Dodd)
In addition to the attenuation factors, there has also been a recent paper that has described contamination factors. Can you comment on this?
Dr. Freedman will describe this in detail in webinar 6. It is also described in the glossary. (S. Kirkpatrick)
How many days are recommended to measure usual intake of energy?
For an individual, one would need many days, but for estimating distributions of usual intake or diet-health relationships, a smaller number is needed. Again, this is something that will be covered in the subsequent webinars. We also need to keep underreporting in mind when we think about energy. (S. Kirkpatrick)
Do methods need to model each nutrient or food separately?
For distributions, it makes sense to do so. For epidemiology, we often use joint models to take into account the relationships among dietary components. (S. Kirkpatrick)
Are there special considerations for infants and toddlers where the usual intake changes rapidly?
There are a couple of different ways to address this. We can try to estimate usual intake using some of the ideas discussed today but collecting data over a shorter time period. We may be able to extend some of the models that will be discussed later to account for age effects. For example, the SPADE program may be a useful way to address rapidly changing usual intakes. (K. Dodd)
Will the National Children’s Study include dietary intake measures?
I believe that the Study will include a dietary intake measure, but we are not intimately involved. There is a Web site for the Study that may include this information. (S. Kirkpatrick)
What about aggregating data across different studies?

One needs to do quite a bit of background work to make sure studies are comparable in terms of methods. (K. Dodd)
What is the reproducibility of doubly labeled water?
There is random error in doubly labeled water; there is a host of literature on this topic. (K. Dodd)
Other questions refer to technical details that are probably best handled when we get to some of the later webinars.

Next Session Tuesday, September 27, 2011
10:00-11:30 EDT
Estimating usual intake
distributions for foods and nutrients
consumed daily by most persons
Kevin Dodd
National Cancer Institute

Slide 88
That brings today’s webinar to an end. Please join us for our next webinar, in which we will hear from Kevin on estimating usual intake distributions for food and nutrients consumed daily by most persons. Details for joining that webinar will be sent out shortly. Thank you for joining today’s session. Good bye.