accounting of cost of owner-occupied housing services in
TRANSCRIPT

ФЕДЕРАЛЬНАЯ СЛУЖБА
ГОСУДАРСТВЕННОЙ СТАТИСТИКИ
Accounting of cost of owner-occupied
housing services
in the Russian SNA
Workshop on measuring the informal economyfor EECCA and SEE countries
S.Levit (Deputy Director, Department of National Accounts, ROSSTAT)

РОССТАТ
2
BACKGROUND
INFORMATION
2012
• OECD Workshop on the implementation in statistical practice ofthe estimates of owner-occupied housing services in line withinternational recommendations
2012-2015
• Development and approval of the methodology for estimation ofowner-occupied housing services in Russia
• Experimental estimates• Preparatory work with statistical users
December 2015
• First publication of the results for 2011-2014
РОССТАТ
3
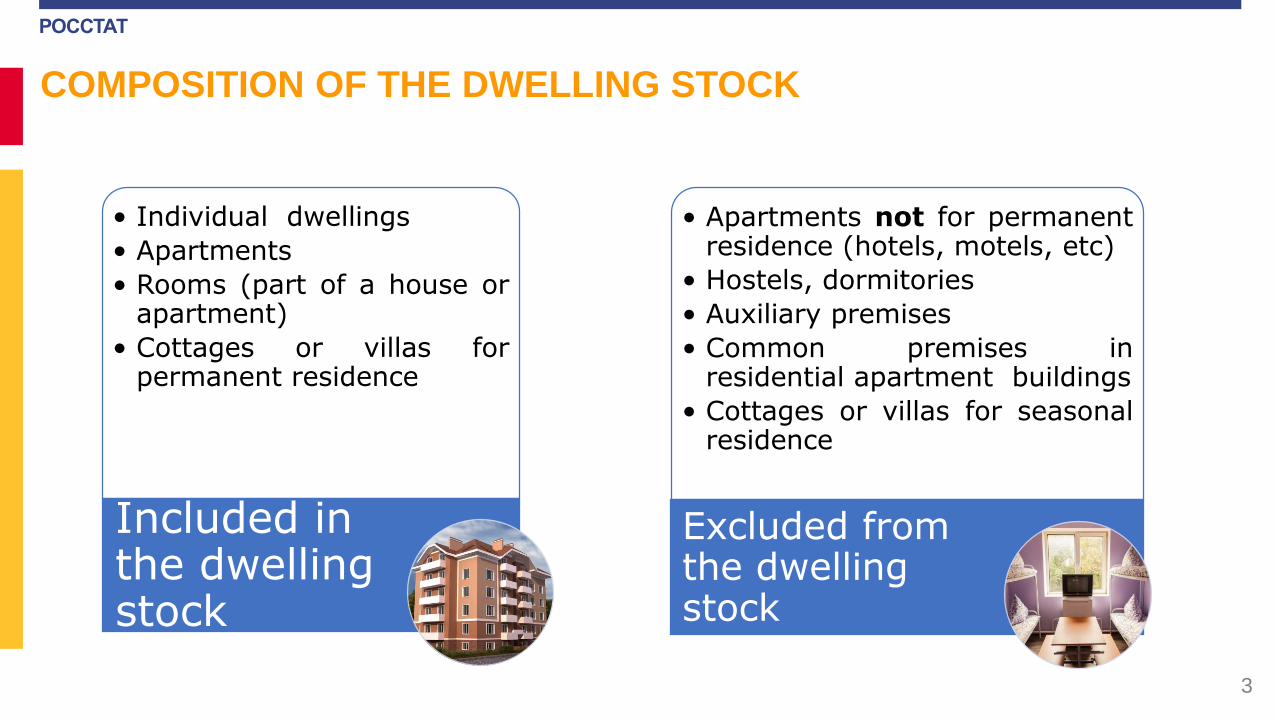
COMPOSITION OF THE DWELLING STOCK
• Individual dwellings
• Apartments
• Rooms (part of a house orapartment)
• Cottages or villas forpermanent residence
Included in the dwelling stock
• Apartments not for permanentresidence (hotels, motels, etc)
• Hostels, dormitories
• Auxiliary premises
• Common premises inresidential apartment buildings
• Cottages or villas for seasonalresidence
Excluded from the dwelling stock

РОССТАТ
4
The structure of the dwelling stock by form of ownership, % of total
Dwelling stock
owned by
households
Dwelling stock
owned by
government and
legal entities

РОССТАТ
5
Structure of the dwelling stock, %
36
60
4 individual dwellings
multi apartmentdwellings
row houses(townhouses)
Total amount of dwelling stock owned by households –
3,472.8 million m2 (at the end of 2019)
27
73
in ruralsettlements
in cities andurban-typesettlements

РОССТАТ
6
Choosing a method for the assessment of owner-occupied
housing services
Rental equivalence
approach
User cost approach
The share of housing rented at market value is less than 10%
─ √ ≈ 8 %
The difference in price of renting 1m2 of commercial and public/communal housing is more than 3 times
─ √ more than 20 times
РОССТАТ
7
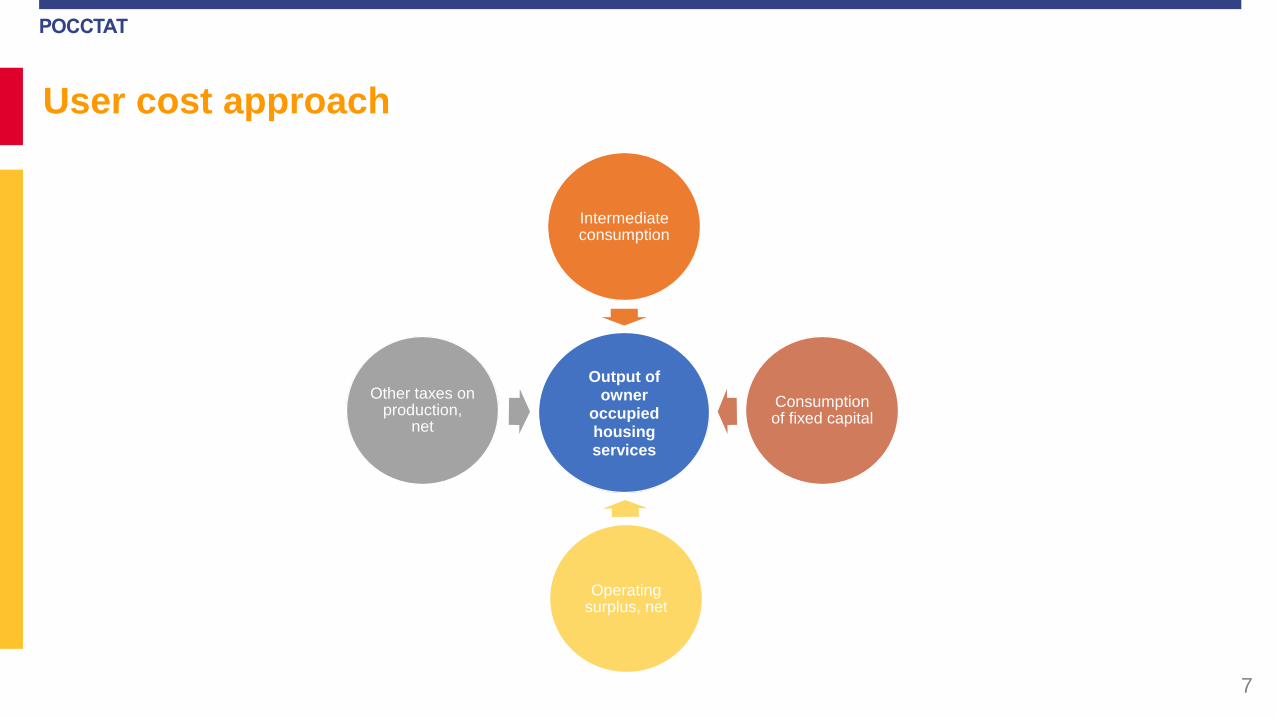
User cost approach
Output of owner
occupied housing services
Intermediate consumption
Consumption of fixed capital
Operating surplus, net
Other taxes on production,
net

РОССТАТ
8
Includes:
•current expenses for repairs and maintenance of the dwelling
•dwelling insurance services
•FISIM for mortgage loans
Does not include:
•capital expenditures on the dwelling
•utility bills
Intermediate consumption

РОССТАТ
9
Net surplus of owner-occupied housing services
𝑈 = 0,025 ∗ 𝑖 ∗ 𝑊, where
𝑈 – net surplus
𝑖 – price index at the secondary dwellings market
𝑊– value of dwelling stock in average annual market prices

РОССТАТ
10
Method for assessing the market value of the dwelling stock
The comparative approach is a method of assessing the value of goods basedon comparison with similar goods for which there is information on thetransaction prices or offers.
The main requirement of the comparative valuation method is to ensurethe structural conformity between the dwelling stock for which prices on thesecondary market are determined, and all available dwelling stock.
It is implemented by making calculations for sufficiently differentiated typesand groups of residential buildings, and in some cases-by applying correctionfactors to the prices of dwellings for sale.

РОССТАТ
11
Estimation of the average annual market value of the dwelling stock
1. Data on the average annual market value of residential buildings arecalculated by multiplying the total surface and the market value of 1square meter of housing by detailed groups of dwelling stock.
2. The share of dilapidated and failing housing is determined and its value isdiscounted by applying a reduction factor.
3. The share of residential premises owned by households is determinedseparately for each group of residential buildings. The average annualmarket value of individual and multi-apartment dwellings is multiplied bythe respective shares.
4. The market values of individual and multi-apartment dwellings owned byhouseholds are summed up.

РОССТАТ
12
The scheme of dwelling stock distribution by groupsStone houses, brick houses
un
til
19
20
.
19
21
-19
45
.
19
46
-19
70
.
19
71
-19
95
.
aft
er 1
99
5.
Panel buildings, pre-engineered buildings
Multi-apartment dwellingsMonolithic buildings
Administrative center
of the region
Wooden houses
Mixed, other
Stone houses, brick houses
Panel buildings, pre-engineered buildings
Individual housingMonolithic buildings
Wooden houses
Mixed, other
Stone houses, brick houses
Panel buildings, pre-engineered buildings
Multi-apartment dwellings
Monolithic buildings
Housing
stock
Cities, except for the
administrative center
of the region
Wooden houses
Mixed, other
Stone houses, brick houses
Individual housing
Panel buildings, pre-engineered buildings
Monolithic buildings
Wooden houses
Mixed, other
Stone houses, brick houses
Panel buildings, pre-engineered buildings
Multi-apartment dwellings
Monolithic buildings
Rural area
Wooden houses
Mixed, other
Stone houses, brick houses
Individual housing Panel buildings, pre-engineered buildings
Monolithic buildings
Wooden houses
Mixed, other

РОССТАТ
13
Sources of information about housing prices
Data on prices per unit area of housingin the secondary market, received fromlegal entities and individualentrepreneurs engaged in real estateactivities
wall material:1) large-panel and large-block walls2) brick walls3) monolithic walls
housing categories:1) low quality2) medium quality (standardised)3) improved quality4) elite housing
Results of the cadastral assessment of real estate
properties carried out by the Federal Service for State
Registration, Cadastre and Cartography (Rosreestr)
Prices for 1 m2 of residential buildings located in rural areas, of individual dwellings
of all types based on the materials of external walls, as well as of wooden or mixed material walls of multi-apartment dwellings

РОССТАТ
14
Estimation of fixed capital consumption
Age-efficiency function:
• hyperbolic
Liquidation function:
• log-normal distribution
Perpetual inventory method

РОССТАТ
15
Imputed value of owner-occupied housing services
at current prices, RUB bn.2017 2018 2019
Intermediate consumption
01Current maintenance costs of owner-occupieddwellings
927.4 933.3 1023.6
02 Net insurance premiums paid by homeowners 19.8 18.9 21.1
03 Total intermediate consumption (01 + 02) 947.2 952.3 1 044.7
Other taxes on production
04 Ad valorem taxes paid by the owners the occupied housing (personal property tax) 36.3 41.8 42.3
Gross surplus
05 Price index in the secondary dwellings market,% 97.7 101.6 104.3
06 The rate of return on the owner-occupied dwellings, % per year 2.5 2.5 2.5
07 The average annual value of housing owned by households, in current prices 121,156.3 124,865.1 131880.7
08 Consumption of fixed capital 2 068.4 2 142.2 2309.2
09 Gross surplus from owner-occupied housing05*06*07 + 08
5 026.4 5 313.1 5 748.4
Output
10 Value of owner-occupied housing services(03 + 04 + 09)
6 009.9 6 307.2 6 835.4

РОССТАТ
16
Revaluation in constant prices
1=2+3+4+5Intermediate consumption Deflation by price indices:
2 Materials for the current maintenance and repair of the dwelling
CPI for building materials
3 Services for the current maintenance and repair of the dwelling
CPI for housing repair services
4Technical maintenance CPI for maintenance and repairs for
homeowners
5Net insurance premiums CPI for the voluntary dwelling insurance
against standard risks

РОССТАТ
17
Revaluation to constant prices (continued)
6 Other net taxes on production The value of current year housing stock in previous year prices, multiplied by the share of taxes on residential buildings in the value of the previous year housing stock
7 Consumption of fixed capital The value of the housing stock in previous year prices, multiplied by the rate of the CFC
8 Net surplus The value of current year housing stock in previous year prices, multiplied by the rate of net operating surplus of the previous year
9=1+6+7+8 Owner-occupied housing services

РОССТАТ
18
The share of owner-occupied housing services in macroeconomic
indicators, %
in GDP
in final consumption of households
in disposable income of households

РОССТАТ
19
Deflators,%, 2011 = 100
owner-occupied housing services GDP CPI

РОССТАТ
20
Volume indexes, %, 2011 = 100
disposable income of HH
OOH services
GDP

РОССТАТ
21
The share of owner-occupied housing services in regional GDP, %
(2018)
Federal districts Old
methodology
New
methodology
Russian Federation 1.8 6.1
Central District 2.4 6.7
Northwestern District 1.8 7.7
Southern District 2.4 8.3
North-Caucasian District 0.6 8.6
Privolzhsky District 1.3 6.2
Ural District 1.2 6.3
Siberian District 1.5 5.0
Far Eastern District 1.0 4.2

РОССТАТ
22
Directions for future research
▪ Inclusion in the value of owner-occupied housing of FISIM estimates formortgage loans
▪ Dividing owner-occupied housing services into actual and imputed
▪ Methods for estimation of housing services for the government andcommunal dwellings, apartments