accounting system dynamics - muratopia · of financial reports consisting of income statement,...
TRANSCRIPT
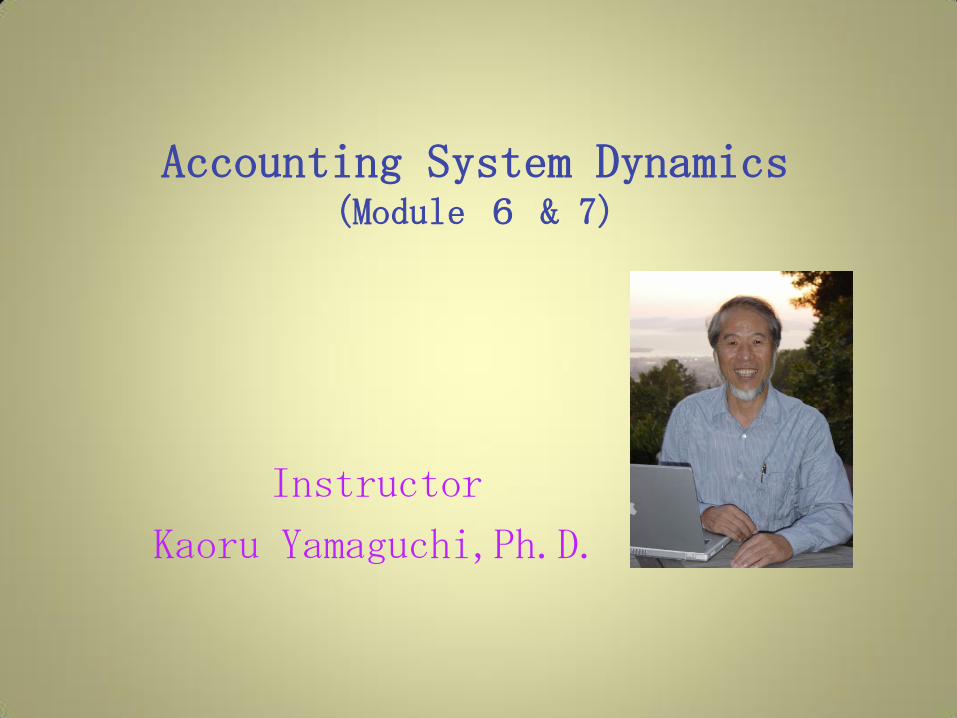
Accounting System Dynamics (Module 6 & 7)
Instructor
Kaoru Yamaguchi,Ph.D.
Module Overview
It is essential for business people to understand the structure
of financial reports consisting of income statement, balance
sheet and cash flow statement. With the application of stock-
flow concept of simple dynamics, the understanding of
financial reports becomes very simple and easy. This method
is proposed by Prof. K. Yamaguchi as accounting system
dynamics – a foundation of business modeling in this course.

Suggested Reading(A)
Money and Macroeconomic Dynamics
– Accounting System Dynamics Approach –
by Kaoru Yamaguchi, 2013
Chapter 3: Accounting System Dynamics

Suggested Reading (B)
“Financial Statements” by Thomas Ittelson, Career Press, 1998
Learning Subjects
1. Principle of Accounting System Dynamics
2. Accounting System Dynamics Simplified
- Household Account Booking -
3. Accounting System Dynamics in Action

Accounting in Crisis: Enron Special-Purpose Entities(SPEs)
Normally, once a company owns 50% or more of another, it
must consolidate it under the 1959 rules.
The controversial exception is that outsiders need invest
only 3% of an SPE’s capital for it to be independent and off
the balance sheet.
It 1990, accounting firms asked the SEC to endorse the 3%
rule that had become a common, though unofficial practice
in the ’80s.

Accounting in Crisis: Enron Special-Purpose Entities(SPEs)
The SEC didn’t like the idea, but
it didn’t stomp on it, either --
fumbles by the Securities &
Exchange Commission and the
Financial Accounting Standards
Board.
The SEC asked the FASB to set
tighter rules to force
consolidation of entities that
were effectively controlled by
companies. Business Week
January 28, 2002, p. 36 FASB = Financial Accounting Standards Board

1.Accounting System Dynamics
This method was originally presented in the following paper:
Principle of Accounting System Dynamics
– Modeling Corporate Financial Statements,
by Kaoru Yamaguchi,
International System Dynamics Conference 2003,
Proceedings, New York, 2003.

System Dynamics Applied to Accounting
わかる!図解キャッシュフロー 久保豊子著、ダイアモンド社 2000年、p. 111
Business Dynamics by John D. Sterman, McGraw-Hill Companies, 2000, p.194
Cash through
Operation
Cash through
Investment
Cash through
Finance

Principles of System Dynamics(1)
Principle 1. System as a Collection of Stocks
System can be described by a collection of state variables, called
stocks in system dynamics, whose levels or volumes are measured
at a moment in time.
System
Stock 1
Stock 2
Stock 3
Stock 4
Stock 5
Stock 6

Principles of System Dynamics(2)
Principle 2. Stock-Flow Relation
Levels of a stock can only be changed by the amount of flows
measured for a period of time.
The amount of flow that increases the stock is called inflow,
while the one that decreases it is called outflow.
StockInflow Outflow

Principles of System Dynamics(3)
Principle 3. Information Feedback
The amount of inflows and outflows is directly or indirectly
determined either by the information obtained from the stocks
through their feedback loops, or parameters obtained outside
the system.
StockInflow OutflowStock A
Stock B
VariableStock F
Parameter

Principles of Accounting System(1)
Principle 4. Stock-Flow Relation of Financial Statements
Balance sheet is a collection of stocks only, while income
statement and cash flow statement consist of inflows and
outflows of the stocks in balance sheet.

Balance Sheet
as
a System
of
Stocks
Cash
Accounts
Receivable
Inventories
Book Value of
PP&E
Accounts
Payable
Accrued
Expenses
Long-Term
Debt
Capital Stock
(Current Assets) (Current Liabilites)
Shareholders' Equity
Prepaid Expenses
(Net Fixed Assets)
Current
Portion of
Debt
Retained
Earnings
Income Taxes
Payable
(Long-Term Debt)
Assets Liabilities
Other Assets
-------------------------

Principles of Accounting System(2)
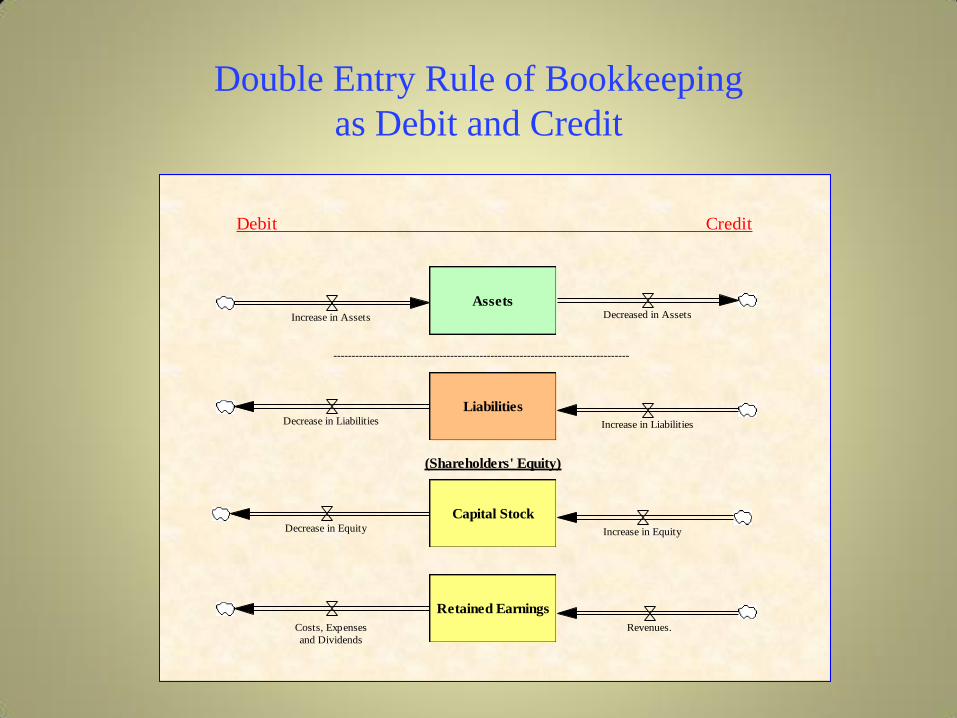
Principle 5. Double Entry Rule of Bookkeeping
All transactions in the accounting system are recorded as inflows
and/or outflows of stocks in the balance sheet so that each
transaction causes two corresponding stocks to change
simultaneously in balance.
For this purpose, each transaction is booked twice on both debit
and credit sides. Inflows of assets and outflows of liabilities and
shareholders' equity are booked on the debit side, while outflows of
assets and inflows of liabilities and shareholders' equity are booked
on the credit side.
Double Entry Rule of Bookkeeping
as Debit and Credit
Liabilities
Assets
Capital Stock
Retained Earnings
Revenues.
Debit Credit
---------------------------------------------------------------------------------
Increase in Assets Decreased in Assets
Decrease in Liabilities
Decrease in Equity
Increase in Liabilities
Increase in Equity
Costs, Expenses
and Dividends
(Shareholders' Equity)

Double Entry Rule of Bookkeeping
as Debit and Credit
Equity
LiabilitiesAssets
Capital
Stock
Retained
Earnings
Revenues.
Debit Credit
Increase inAssets
Decreased inAssets
Decrease inLiabilities
Decrease inEquity
Increase inLiabilities
Increase inEquity
Costs, Expensesand Dividends
Debit Credit
1 1
2
2
3
3
4
4

Double Entry Rule of Bookkeeping
as Debit and Credit(1)
Debit:inflow <-> Credit:outflow
Transactions within assets are classified in this category.For example,
an increase in Fixed Assets by the purchase of PP&E is balanced by
the decrease in Cash by its payment.
Account
ReceivableCash
Receipt
Cash
Book Value
of PP&E
Purchase
of PP&E
Cash
Payment
of PP&E

Double Entry Rule of Bookkeeping
for Book Value
Book Valueof PP&E
AccumulatedDepreciation
Property,Plants andEquipments
DepreciationPP&EPurchase
Cash

Double Entry Rule of Bookkeeping
as Debit and Credit(2)
Debit:outflow <-> Credit:inflow
Transactions within liabilities and equity are classified here.For example,
a decrease in Retained Earnings caused by an increase in operating
expenses such as sales & marketing expenses is balanced by the increase
in Accrued Expenses.
Accrued
Expenses
Retained
Earnings
AccruedExpensesIncuured
Operationg
Expenses
Sales & Marketing
Expenses

Double Entry Rule of Bookkeeping
as Debit and Credit(3)
Debit:inflow <-> Credit:inflow
Transactions in this category cause both Assets and Liabilities/Equity to
increase. For instance, an increase in net sales causes both Accounts
Receivable and Retained Earnings to increase.
Accounts
Receivable
Retained
EarningsRevenues
Net Sales

Double Entry Rule of Bookkeeping
as Debit and Credit(4)
Debit:outflow <-> Credit:outflow
Transactions here cause both Assets and Liabilities/Equity to decrease.
For instance, payment of Accounts Payable causes both Cash and
Accounts Payable to decrease.
CashAccounts
PayableDisbursements Account
PayablePaid

Double Entry Rule in Financial Statements
(3) & (4) Combined
Accounts
Receivable
Inventories
Retained
Earnings
Shipment
RevenuesCost of Goods
Sold
Customer
Order
Net Sales
Unit
Cost
Price
Raw Materials
Wages
All Oterh Overhead
Depreciation

Principles of
Accounting System Dynamics
Principles 1 through 5 obtained from system
dynamics and accounting system constitutes
the Principle of Accounting System Dynamics.

2. Accounting System Dynamics Simplified
Retained
Earnings
SalesRevenue
Cost of GoodsSold
Operating
Expenses
Gross
Margin
IncomeFrom
Operations
Net Income
Assets Liabilities
Shareholders' Equity
Accounts
Receivable
Cash /
Deposits
Inventories
(Raw Materials,
Goods in
Process,
Finished goods)
Fixed Assets
(Property,
Plant &
Equipment)
Accounts
Payable
Debts (Short& LongTerm)
Receipts Expenses
Orders
PricesUnit Cost
Production Shipment
<Sales Revenue>
PP&E
Purchase
Depreciation
Raw Materials Wages
<Raw Materials>
<Wages>
<Operating
Expenses>
Payment
Reimbursement Loans
Cash Flow
<Expenses>
<Loans>
<Cost of Goods
Sold>
<Operating
Expenses>
Research &
Development
Sales &
Marketing
Non-Operating
Expenses<Debts (Short &
Long Term)> Interest
PaymentInterestRates
EarningsBeforeIncome
Tax<Non-Operating
Expenses>
<Non-Operating
Expenses>
General &
Administrative
Income
Taxes<Income Taxes>
Earnings
Before Interest
and Income Tax
<Income Taxes>

2.1 Cash Flow of Household Account
Cash/Deposits
Cash Inflow Cash Outflow
Wages
Bonuses
Windfall Income Benefit/Grant
Food
Clothes
Housing Rent
Utilities
Phones
Transportation
Education
Medical Care and
Health
Social expenses
Recreation
Furnishings
Insurances
Taxes
Miscellaneous
Expenses
Income
Expend
itures
Net Cash Flow
Rent/Rental
Income Dividends
Initial Deposits

2.2 Financial (Interest) System
Cash/Deposits
Cash Inflow Cash Outflow
Wages
Bonuses
Windfall Income Benefit/Grant
Interest
Food
Clothes
Housing Rent
Utilities
Phones
Transportation
Education
Medical Care and
Health
Social expenses
Recreation
Furnishings
Insurances
Taxes
Miscellaneous
Expenses
Income
Expend
itures
Interest Rate
Net Cash Flow
Months per Year
Rent/Rental
Income Dividends
Initial Deposits

2.3 Loans
Cash/Deposits
DebtsBorrowing
Principan and
Interest Repayment
AutomobilesPurchase of
a Car
<Expenditures><Taxes>
Cash Outflow
Loan Interest
Loan Interest Rate<Income> <Interest>
Cash Inflow
Installment Plan
Principal
PaymentDesired Loan
Time for Loan
<Months per
Year>
<Initial Deposits>
Per MonthAmount of
Loan
Loan Period
(Months)
<Amount of
Loan>

2.4 Personal Financial Management: Equity
Cash/Deposits
DebtsBorrowing
Principan and
Interest Repayment
AutomobilesPurchase of
a Car
<Expenditures><Taxes>
Cash Outflow
Loan Interest
Loan Interest Rate
Personal Equity
(Net Assets)
<Income>
<Income> <Interest>
Cash Inflow
<Interest>
Installment Plan
Principal
PaymentDesired Loan
Time for Loan
<Months per
Year>
<Initial Deposits>
Per MonthAmount of
Loan
Loan Period
(Months)
<Amount of
Loan>

2.5 Personal Financial Management: Depreciation
Cash/Deposits
DebtsBorrowing
Principan and
Interest Repayment
AutomobilesPurchase of
a Car
<Expenditures><Taxes>
Cash Outflow
Loan Interest
Loan Interest Rate
Depreciation
Personal Equity
(Net Assets)
<Income>
<Income> <Interest>
Cash Inflow
<Interest>
Installment Plan
Principal
Payment
DepreciationRate
Desired Loan
Time for Loan
<Months per
Year>
<Initial Deposits>
Per MonthAmount of
Loan
Loan Period
(Months)
<Amount of
Loan>
<Months per
Year>

2.6 Income Statement
Personal Equity
(Net Assets)
<Taxes>
<Benefit/Grant>
<Wages>
<Bonuses>
<WindfallIncome>
Income
<Medical Care and
Health>
<Education>
<Recreation>
<Social expenses>
<Transportation>
<Utilities>
<Miscellaneous
Expenses>
<Housing Rent>
<Food>
<Phones>
<Clothes>
<Furnishings>
<Insurances>
<Debts><Loan Interest
Rate>
<Depreciation
Rate>
<Automobiles>
<Cash/Deposits><Interest Rate>
InterestLoan Interest
Depreciation
<Rent/Rental
Income>
<Dividends>
<Initial Deposits>
Expenditures
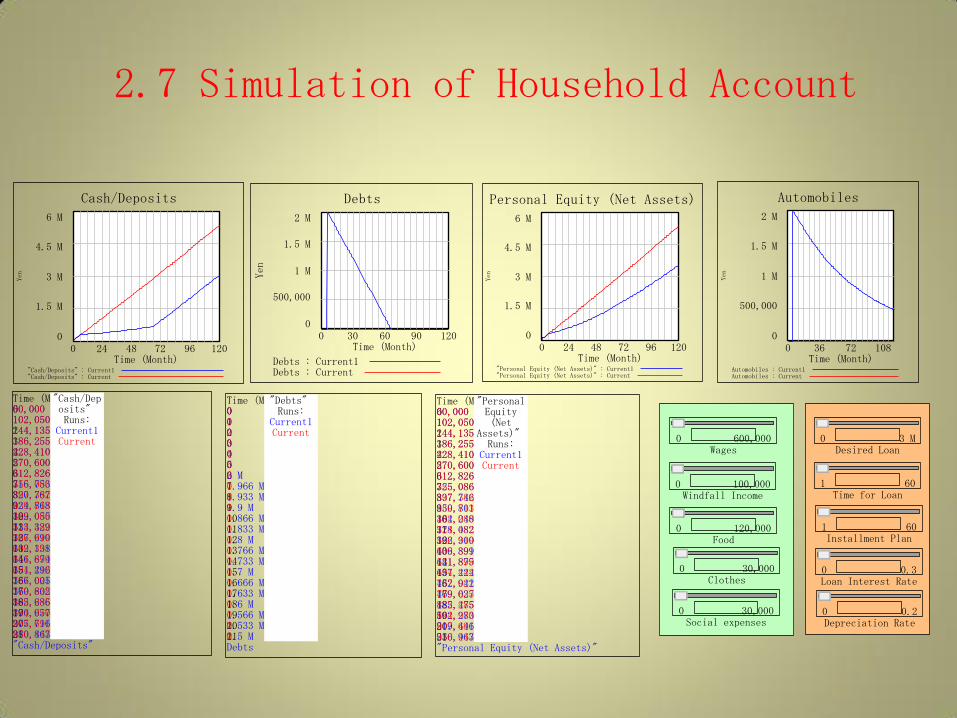
2.7 Simulation of Household Account
Cash/Deposits
6 M
4.5 M
3 M
1.5 M
00 24 48 72 96 120
Time (Month)
Yen
"Cash/Deposits" : Current1"Cash/Deposits" : Current
Debts
2 M
1.5 M
1 M
500,000
00 30 60 90 120
Time (Month)
Yen
Debts : Current1Debts : Current
Personal Equity (Net Assets)
6 M
4.5 M
3 M
1.5 M
00 24 48 72 96 120
Time (Month)
Yen
"Personal Equity (Net Assets)" : Current1"Personal Equity (Net Assets)" : Current
Automobiles
2 M
1.5 M
1 M
500,000
00 36 72 108
Time (Month)
Yen
Automobiles : Current1Automobiles : Current
Desired Loan0 3 M
Time for Loan1 60
Installment Plan1 60
Loan Interest Rate0 0.3
Depreciation Rate0 0.2
Time (Month)0123456789101112131415161718192021
"Cash/Deposits" Runs:
Current1Current
"Cash/Deposits"
60,000102,050144,135186,255228,410270,600312,826316,753320,767324,868329,055333,329337,690342,138346,674351,296356,005360,802365,686370,657375,716380,863
60,000102,050144,135186,255228,410270,600312,826355,086397,382439,713482,080524,482566,919609,391651,899694,442737,021779,635822,285864,970907,691950,447
Time (Month)0123456789101112131415161718192021
"Debts" Runs:
Current1Current
Debts
0000002 M1.966 M1.933 M1.9 M1.866 M1.833 M1.8 M1.766 M1.733 M1.7 M1.666 M1.633 M1.6 M1.566 M1.533 M1.5 M
0000000000000000000000
Time (Month)0123456789101112131415161718192021
"PersonalEquity(Net
Assets)" Runs:
Current1Current
"Personal Equity (Net Assets)"
60,000102,050144,135186,255228,410270,600312,826325,086337,746350,801364,248378,082392,300406,899421,875437,224452,942469,027485,475502,283519,446536,963
60,000102,050144,135186,255228,410270,600312,826355,086397,382439,713482,080524,482566,919609,391651,899694,442737,021779,635822,285864,970907,691950,447
Wages0 600,000
Food0 120,000
Clothes0 30,000
Social expenses0 30,000
Windfall Income0 100,000

3.Accounting System Dynamics
in Action

Transactions (Startup)
You have just incorporated (in Delaware) and invested
$50,000 of your own money into the company: AppleSeed.
When you formed the company you bought 50,000 shares of
"founder's stock" at $1 per share for a total investment of
$50,000 in cash.

Transactions
① A group of investors is willing to exchange their $1.5
million in cash for stock certificates representing 150,000
common shares of AppleSeed Enterprises, Inc. Thus, after
this sale to the investor group there will be 200,000 shares
outstanding. They will own 75% of AppleSeed and you
will own the rest.
② Book all payroll-associated company expenses totaling
$6,230 including salary, employer's contribution to FICA
(Social Security) and various insurance expenses. Issue
yourself a payroll check for $3,370 (your $5,000 monthly
salary minus $1,250 in federal and state withholding tax
and $380 for your own contribution to FICA).
(FICA = Federal Insurance Contribution Act of 1937)

Transactions
③ Borrow $1 million to purchase an all-purpose building. This term note will run for 10 years, calling for yearly principal payments of $100,000 plus interest at a rate of 10% per annum.
④ Purchase 100,000 square foot building and land for $1.5 million in cash. This facility will serve as AppleSeed Enterprises' headquarters, manufacturing facility and warehouse.
………………………………………………..

Corporate Financial Statements:Overview
Production
Income Statement Cash Flow
Balance Sheet
Financial (Ratio) Analysis
Cash Flow (Figues)
Ratio Analysis (Figues)
List ofTransaction
Data
Financial Statements
Strategies
Bookkeeping

Raw Material
Inventories
Work in
Process
Inventories
Finished Goods
Inventories
Raw Material
Use
Production
Factor Value
Completion
Value
Shipment
Value
T: Wages
<Depreciation>
Production (Inventories)
Inventories
Accounts
Payable
Account
Payable
Incurred
Accrued
ExpensesAccrued
Expenses
Incurred
Raw Material
Purchase
T: Completion
Scrap
T: Scrapped
Cases
<Order
Fulfilment>
Cash
Disbursements
T: Payroll-associated
Fringes and Taxes
T: All Other
Overhead
T: Raw Material
Purchase
Scrap Value Manufacturing
Costs
Work in
Process
Finished
Goods
Production Completion
Unit
Cost
Scrapped
Scrapping
T: Production
Total
Production
<Unit Cost>
Raw Material
Cost
Raw Material
Price<T: Production>
<T: Completion>
Shipment

Income Statement
General &
Administrative
Net Income
Variable
Costs
Fixed Costs
(Overhead)
Costs of Goods Sold
<Raw Material Use>
<T: Wages>
<Depreciation>
Retained Earnings
Revenues
Dividends
<Net Sales>
Gross
Margin
Income
from
Operations
Income
before Tax
Income Taxes
Payable
Accounts
Receivable
<Write-off>
T: Write-off Cost
T: Insurance
Premium Paid
T: Interest
Expenses
Cost of Goods Sold
<Scrap><Shipment Value>
Operating Expenses
Sales & Marketing
T: Researh &
Development
Interest Expenses
Income Taxes
<Cost of Goods Sold>
<Operating Expenses>
<Interest Expenses>
<Income Taxes>
Accrued
ExpensesAccrued
ExpensesIncurred
Accounts
Payable Account
Payable
Incurred
T: Sales &
Marketing (AP)
T: Sales &
Marketing (AE)
T: General &
Administrative (AE)
<Income before Tax>
Income
Tax Rate
Prepaid Expenses
Covered
<T: Write-off
Cost>

Cash Flow Statement
Cash
Accounts
Receivable
Accounts
Payable
Accrued
Expenses
Capital Stock
Long-Term
Debt
Book Value
of PP&EAccumulated
Depreciation
Property,
Plants and
Equipments
Net Borrowings
Sale of
Capital StockDividends Paid to
Stockholders
Depreciation
Cash
Disbursements
Account
Payable Paid
Accrued
Expenses Paid
Account
Payable
Incurred
Accrued
Expenses
Incurred
Purchase of
Capital Stock
<Net Sales>
Prepaid
Expenses
OperatingActivities
InvestingActivities
FinancingActivities
Income Taxes
PayableIncome Taxes
Paid
Capital Stock
IssueCapital Stock
Redemption
Retained Earnings
RevenuesDividends
<Capital Stock
Issue>
Current
Portion of
Debt
T: New Issue
of Shares
Par
value
T: Long-Term
Borrowing
T: PP&E
Purchase
T: Depreciation
Write-off
Cash
Receipts
T: Insurance
Premium
Long-Term
Debt Paid
Long-Term
Debt (total)
PrepaidExpensesCovered
Shares
Outstanding
T: Par Share
Dividend
PP&E
Purchase
Prepaid
Expenses
Incuuured
Debt Payment
Principal
Payment
Current Debt
Paid
T: Accrued
Expenses Paid
Other
Assets
T: Other Assets
PurchaseInstallation
Other Assets
Purchase
Full Payment
T: Account
Payable Paid
<T: Write-off Cost>
<T: Insurance
Premium Paid>
T: Principal
Payments
T: Current
Debt Paid
<T: Wages>
<Net Sales>
<Income Taxes>
<InterestExpenses>
Current
Borrowing
Long-Term
Borrowing
<Current
Borrowing>
<Long-Term
Borrowing>
<T: All OtherOverhead>
<T: Raw Material Purchase>
<T: Researh & Development>
<T: Sales & Marketing (AP)>
<T: General & Administrative (AE)>
<T: Payroll-associated Fringes and
Taxes>
<T: Sales & Marketing (AE)>
T: Income
Taxes Paid
T: Account
Receivable Paid

List of Transaction Data
Account Payable
Cash (Disbursements)
Cash (Receipts)
T: Long-Term Borrowing
T: Account Payable Paid
T: Accrued Expenses Paid
T: Current Debt Paid
T: PP&E Purchase
T: Interest Expenses
T: Other Assets Purchase
Accrued Expenses
Account Receivable
Prepaid Expenses
T: Income Taxes Paid
T: Completion
T: Customer Order
T: Depreciation
T: Principal Payments
Data: Price Change
Inventories
T: Production
T: Account Receivable Paid
T: New Issue of Shares
T: Par Share Dividend
T: Wages
T: Insurance Premium Paid
T: Insurance Premium
T: Write-off Cost
T: Scrapped Cases
T: Raw Material Purchase
T: All Other Overhead
T: Sales & Marketing (AP)
T: Researh & Development
T: Payroll-associated Fringes
and Taxes
T: Sales & Marketing (AE)
T: General & Administrative (AE)

Balance Sheet
<Cash>
<Accounts
Receivable>
<Inventories>
<Book Value of
PP&E>
<Accounts
Payable>
<Accrued
Expenses>
<Long-Term
Debt>
<Capital
Stock>
Current Assets Current Liabilites
Shareholders' Equity
<Prepaid
Expenses>
Net Fixed Assets
<Income Taxes
Payable>
<Retained
Earnings>
Assets
Liabilities
Shareholders'
Equity
Current
Assets
Current
Liabilities
<Current
Portion of
Debt>
Long-Term Debt
Liabilities
& Equity
<Other Assets>
------------------------

Ratio Analysis
Current
Ratio
Quick
Ratio
<Current Assets>
<Current Liabilities>
<Current Liabilities>
<Cash><Accounts
Receivable>
Liquidity RatiosAsset Management Ratios
Inventory
Turnover
Asset
Turn
Ratio
Account
Receivable
Turnover<Inventories>
<Assets>
<Net Sales>
<Net Sales>
<Accounts Receivable>
+
Profitability Ratios
Return on
Assets
(ROA)
<Assets>
Return on
Equity
(ROE)<
Shareholders'
Equity>
Return on
Sales
(Profit
Margin) <Net Sales>
Gross
Margin
(Gross
Profits)<Net Sales>
Leverage Ratios
Debt-to-
Equity
Debt
Ratio
<CurrentPortion of
Debt>
<Long-Term
Debt>
<
Shareholders'
Equity>
<CurrentPortion of
Debt>
<Long-Term
Debt>
<Assets>
+
+<Gross Margin>
<Cost of Goods
Sold>
<Net Income>
<Net Income>
<Net Income>

Ratio Analysis Simulations
Liquidity Ratios
20
15
10
5
0
1 3 5 7 9 11 13 15 17
Time (Month)
Current Ratio : run Dmnl
Quick Ratio : run Dmnl
Asset Management Ratios
100
2 1/Month
50
1 1/Month
0
0 1/Month
1 3 5 7 9 11 13 15 17
Time (Month)
Inventory Turns : run
Asset Turn Ratio : run 1/Month
Leverage Ratios
0.8
0.4
0
1 3 5 7 9 11 13 15 17
Time (Month)
"Debt-to-Equity" : run Dmnl
Debt Ratio : run Dmnl
Profitability Ratios(1)
0.4
0.28
0.16
0.04
-0.08
1 3 5 7 9 11 13 15 17
Time (Month)
"Return on Assets (ROA)" : run 1/Month
"Return on Equity (ROE)" : run 1/Month
Profitability Ratios (2)
0.4
0.3
0.2
0.1
0
1 3 5 7 9 11 13 15 17
Time (Month)
"Return on Sales (Profit Margin)" : run Dmnl
"Gross Margin (Gross Profits)" : run Dmnl

Net Cash Flow<Net
Borrowings>
<Sale of
Capital Stock>
<CashDisbursements>
<Purchase of
Capital Stock>
<Dividends Paid to
Stockholders>
Cash
Cash
2 M
1 M
01 2 3 4 5 6 7 8 9 10 11 12 13 14 15 16 17 18
Time (Month)
Cash : run DollarsCash : Accounting Dollars
<CashReceipts>
Net CashFlow fromOperations
Net Cash Flow
2 M
1 M
0
-1 M
-2 M
1 2 3 4 5 6 7 8 9 10 11 12 13 14 15 16 17 18
Time (Month)
Net Cash Flow : run Dollars/Month
Net Cash Flow from Operations : run Dollars/Month
Net Income : run Dollars/Month
Time Delay of
Account Receivable
Time Delay of
Account Payable
<Prepaid
Expenses
Incuuured>
<Income Taxes
Paid>
<PP&E
Purchase>
<Debt Payment>
Net Cash Flow
2 M
1 M
0
-1 M
-2 M
1 2 3 4 5 6 7 8 9 10 11 12 13 14 15 16 17 18
Time (Month)
Net Cash Flow : run Dollars/Month
Net Cash Flow from Operations : run Dollars/Month
Net Income : run Dollars/Month
Net Cash Flow<Net
Borrowings>
<Sale of
Capital Stock>
<CashDisbursements>
<Purchase of
Capital Stock>
<Dividends Paid to
Stockholders>
Cash
Cash
2 M
1 M
01 2 3 4 5 6 7 8 9 10 11 12 13 14 15 16 17 18
Time (Month)
Cash : run DollarsCash : Accounting Dollars
<CashReceipts>
Net CashFlow fromOperations
Net Cash Flow
2 M
1 M
0
-1 M
-2 M
1 2 3 4 5 6 7 8 9 10 11 12 13 14 15 16 17 18
Time (Month)
Net Cash Flow : run Dollars/Month
Net Cash Flow from Operations : run Dollars/Month
Net Income : run Dollars/Month
Time Delay of
Account Receivable
Time Delay of
Account Payable
<Prepaid
Expenses
Incuuured>
<Income Taxes
Paid>
<PP&E
Purchase>
<Debt Payment>
Net Cash Flow<Net
Borrowings>
<Sale of
Capital Stock>
<CashDisbursements>
<Purchase of
Capital Stock>
<Dividends Paid to
Stockholders>
<CashReceipts>
Net CashFlow fromOperations
Time Delay of
Account Receivable
Time Delay of
Account Payable
<Prepaid
Expenses
Incuuured>
<Income Taxes
Paid>
<PP&E
Purchase>
<Debt Payment>
Cash
2 M
1 M
01 2 3 4 5 6 7 8 9 10 11 12 13 14 15 16 17 18
Time (Month)
Cash : run DollarsCash : Accounting Dollars
Cash Flow Analysis