accounting’s role in the reporting, creation, and ...dn75/systemic risk chapter final...
TRANSCRIPT
Accounting’s Role in the Reporting, Creation, and Avoidance of Systemic Risk in Financial Institutions
Trevor S. Harris*, Robert H. Herz**, and Doron Nissim***
Columbia Business School
January 2012^
Forthcoming in: “The Handbook of Systemic Risk”, ed. J-P. Fouque & J. Langsam, Cambridge University Press, 2013.
We are grateful to the editor, Joe Langsam for helpful comments.
* Trevor Harris is the Arthur J. Samberg Professor of Professional Practice and Co-Director of the Center for Excellence in Accounting and Security Analysis at Columbia Business School. He was previously a Managing Director and Vice Chairman of Morgan Stanley. ** Robert Herz is an Executive in Residence at Columbia Business School and provides consulting services and expert witness testimony on financial reporting matters. He is currently a member of the Board of Directors of Fannie Mae, the Standing Advisory Group of the Public Company Oversight Board, and the Accounting Standards Oversight Council of Canada and was previously the Chairman of the Financial Accounting Standards Board and a member of the International Accounting Standards Board. *** Doron Nissim is the Ernst and Young Professor of Accounting and Finance at Columbia Business School and was formerly a consultant to Morgan Stanley. ^ Subsequent to the writing of this chapter, in early May 2012, JPMorgan announced an “unusual” trading loss of more than $2 billion arising from concentrated positions intended as a macro hedge against its corporate credit exposures. In commenting on the loss, JPM CEO Jamie Dimon said that the strategy was “flawed, complex, poorly reviewed, poorly executed, and poorly monitored.” The episode is not large enough to trigger systemic risk but it received widespread media coverage, led to the dismissal of several JPM officials, prompted regulatory investigations, and sparked renewed debate over key aspects of financial services reform. Full details of the transaction are not yet known, but it is not surprising to us that such situations can arise and that the way current accounting and information systems are set up will not eliminate such losses and “surprises” occurring. Notably, if a transaction is realistically a hedge then there should be an offsetting gain to the loss. If the underlying exposures are not valued at a current market price then the accounting mismatch may create a perceived rather than an economic risk. This seems unlikely in the current scenario, but we do not have information to know and from the press reports, and his quoted remarks, it would seem that Mr. Dimon was sufficiently surprised by the losses that the existence of an economic hedge is unlikely. As we articulate in the chapter, managers and investors need to be provided with information that indicates the underlying economic, duration and counterparty details to evaluate the business profitability and risks. The apparent opacity in this case feeds uncertainty and as the amount of the loss has changed since the initial revelation it is not hard to foresee that if we were in a time of economic stress and/or JPM was a riskier and less well-capitalized institution, the lack of transparency into the underlying positions, offsets and risks could translate into systemic risk as defined in the chapter.

Accounting’s Role in the Reporting, Creation, and Avoidance of Systemic Risk in Financial Institutions
Abstract: The financial crisis that erupted in late 2007 has resurfaced debates about the role of accounting and external financial reporting by financial institutions in helping detect or mask systemic risks and in exacerbating or mitigating such risks. The debate has largely focused on the role of fair value accounting, securitization and special purpose entities, off-balance sheet reporting and pro-cyclicality. We consider these and other issues using a single company’s published accounts. We explain the role, purpose and limitations of external financial reporting and suggest that there are aspects of the current accounting system that may help provide early warnings of and help mitigate potential systemic risks and others that may mask and exacerbate these risks. We offer some ideas on how the accounting might be adjusted to mitigate the latter. Our arguments lead to several conclusions the most important of which include: that credit-related crises are at least partly induced by not requiring financial institutions to take credit valuation adjustments on loans based on expected losses, and that disclosures would have to change significantly to allow an investor or regulator to make a realistic attempt at measuring a firm’s risk and even more so any potential systemic risk. But there is no way that an accounting system that is based on measurements at a single point can serve to fully identify and capture the uncertainty and risks. We believe that to be able to assess systemic risk even for a single firm we would need massive amounts of detailed data that few market participants would be able to utilize and interpret. At best the system can provide more disclosures to facilitate the understanding of such risks. Forthcoming in: “The Handbook of Systemic Risk”, ed. J-P. Fouque & J. Langsam, Cambridge University Press, 2013.

1
Introduction
The financial crisis that erupted in late 2007 has resurfaced a debate about the role of
accounting and reporting by financial institutions in exacerbating and mitigating systemic risk.
The debate has largely focused on specific issues relating to the role of, and valuation challenges
associated with, “mark-to-market” or “fair-value1” accounting and the related aspect of
determining the extent of impairment of financial assets; “off-balance sheet reporting” of assets
and liabilities including those arising from over-the-counter derivatives, securitization
transactions and involvements with special purpose entities; as well as overall questions
regarding the adequacy of disclosure on the nature and extent of various risks present at many
financial institutions. While the focus of discussion has been on financial institutions,
commercial and industrial companies are not immune from these issues, and the ideas discussed
in this chapter have implications for these entities too.
The current crisis has also generated a number of important public policy debates focused
on the so-called “pro-cyclicality” of certain accounting methods and on the relationship between
financial reporting to investors and the capital markets versus prudential regulation of banks and
other financial institutions. There has been some discussion about the inadequacy of companies
internal risk systems, but surprisingly, there has been less discussion of whether and how the
internal accounting and reporting systems provide appropriate data for managers (and indirectly
regulators) to understand their performance and risk, and what it would take to ensure they have
more appropriate internal transparency. There is a usually an assumption that managers have
complete private information, so all problems stemmed from bad intentions and misaligned
incentives. This view is naïve, especially in complex organizations where aggregation and set-
off rules are non-trivial. Moreover, capturing, recording and displaying information is costly and
depending on the systems and their design, subject to legacy constraints that work against
transparency. We raise this issue as the feasibility and effectiveness of proposals for changes in
1 The accounting definition of fair value by accounting regulators has evolved over time. The current definition is “The price that would be received to sell an asset or paid to transfer a liability in an orderly transaction between market participants at the measurement date” FASB Accounting Standards Codification Sec 820. This definition requires the sales (exit) value rather than a purchase (entry) value and does not consider the value (in use) to the company, which used to be a consideration. There is also very limited cases where any recognition can be made of portfolio or block pricing adjustments to the basic unit pricing.
2
external reporting are subject to the data capture process at the entity level, and how the data can
be aggregated across entities.
It is worth noting that many of the issues are not new, deficiencies in accounting and
financial reporting have been cited as contributory factors to prior financial and economic crises,
including the collapse of stock prices in 1929 that preceded the Great Depression, the savings
and loan (S&L) crisis in the U.S.2, the collapse of the real estate bubble and ensuing “lost
decade” in Japan, and many more3. So, an appropriate question to be asked is whether and how
accounting and financial reporting may contribute to either increasing systemic risk or to helping
detect the presence and extent of systemic risk, and to stimulating policy actions that might help
reduce it.
Measuring and reporting of activities, changes in value and risks, at an entity level are
complicated issues. Moving to multiple-entity and multiple-country dimensions, which are
inherent in any analysis of systemic risk, raise the degree of complexity and feasibility of getting
useful data. Anyone familiar with the development of internal systems can appreciate the
difficulty of standardizing back office data systems to even be able to clearly identify all the
interrelated legal entities of large global organizations, let alone the legal issues of “set-off” that
might be associated with such entities and a variety of securities. This identification is a
necessary starting point for measuring key items like counterparty exposures, irrespective of the
accounting issues involved4. Even if all the entities are clearly identifiable, the choices that need
to be made in measuring and valuing securities (particularly if they are complex structured
instruments) will inevitably lead to inconsistent measurements across time and especially across
different companies and regions. Accounting is not an exact science and in order to be useful it
must attempt to faithfully capture, represent, and report the effects of transactions and economic
and market events on the performance and financial condition of the reporting enterprise. That
requires the use of accounting methods and estimates that go beyond cash basis accounting. But
the more we utilize approaches not based on cash realization, the more likely judgments must be
2 See, for example, Epstein (1993) and Schuetze (1993). 3 Reinhart and Rogoff (2009) describe “Eight Centuries of Financial Folly” documenting many crises that have accounting aspects to them. 4 The issue has begun to receive the attention of regulators. On November 24th 2011, The Office of Financial Research of the U.S. Department of the Treasury issued for comment a Statement on Legal Entity Identification for Financial Contracts which would require a universal standard for identifying parties to financial contracts.

3
made, complexity is introduced and inconsistencies occur. As we move forward to discuss the
relevant issues, we need to be sanguine about what solutions are actually viable in practice.
We begin by discussing some basic tenets of accounting, as currently applied, before
relating these to definitions of systemic risk. This will allow us to better frame the specific
accounting issues that are the focus of this chapter. These issues are discussed in the context of a
highly-regarded single company’s actual disclosures and then the equivalent aggregate data
across U.S. banks. Our arguments lead to several conclusions the most important of which
include: that credit-related crises are at least partly induced by not requiring financial institutions
to take credit valuation adjustments on loans based on expected losses, and that disclosures
would have to change significantly to allow an investor or regulator to make a realistic attempt at
measuring a firm’s risk and even more so any potential systemic risk. We further conclude that
while many specific accounting measurement issues are consistent with elements of systemic
risk, there is no obvious alternative that would prevent the risk, especially as most accounting
measures are based on single point in time estimates and cannot capture the uncertainty inherent
in the underlying variables.
Some Basics of Accounting and Financial Reporting
Accounting systems are traditionally built to record transactions and events of an entity
using a double-entry system that maintains the accounting equation:
Assetst (Resources) = Liabilitiest (Obligations) + Equityt (Wealth)
Measuring the stocks of and changes in these elements requires choices that are usually
based on an objective function or goal, which is currently defined by standard setting bodies.
We need to assess the plausibility of any accounting-based recommendations in the context of
the purpose and public policy objectives of external financial reporting to investors and the
capital markets and what information financial statements are intended to portray and
communicate, including the potential limitations of such information. The Conceptual
Framework of the Financial Accounting Standards Board (FASB), the body that establishes U.S.
Generally Accepted Accounting Principles (GAAP), and the Framework of the International

4
Accounting Standards Board (IASB), the body that establishes International Financial Reporting
Standards (IFRS) describe the objective of “general purpose” financial reporting as follows:
“The objective of general purpose financial reporting is to provide financial
information about the reporting entity that is useful to existing and potential investors,
lenders, and other creditors in making decisions about providing resources to the entity.
Those decisions involve buying, selling, or holding equity and debt instruments and
providing or settling loans and other forms of credit.
Decisions by existing and potential investors … depend on the returns they expect
from an investment in those instruments; for example, dividends, principal and interest
payments, or market price increases. Investors’, lenders’ and other creditors’
expectations about returns depend on their assessment of the amount, timing, and
uncertainty of (the prospects for) future net cash inflows to the entity. Consequently,
existing and potential investors, lenders, and other creditors need information to help
them assess the prospects for future net cash inflows to an entity.
To assess an entity’s prospects for future net cash inflows, existing and potential
investors, lenders, and other creditors need information about the resources of the entity,
claims against the entity, and how efficiently and effectively the entity’s management and
governing board have discharged their responsibilities to use the entity’s resources ….
Many existing and potential investors, lenders, and other creditors cannot require an
entity to provide information directly to them and must rely on general purpose financial
reports for much of the financial information they need. Consequently, they are the
primary users to whom general purpose financial reports are directed.” (Paragraphs
OB2-OB5 of Chapter 1 of the FASB’s Conceptual Framework for Financial Reporting,
September 2010).
In summary, the FASB and IASB make it clear that the objective of general purpose
financial reports is to provide financial information that helps potential investors, lenders, and
other creditors assess the amounts, timing and uncertainty of an entity’s future cash flows and
how well managers have discharged their “stewardship” responsibilities. The FASB’s and
IASB’s concepts also indicate that general purpose financial reports cannot provide all of the
information that investors and creditors may need. For example, while financial statements may

5
provide information that is useful in estimating the value of a reporting entity, they are not
designed to directly report that value, and that while other parties such as regulators may find the
information in general purpose financial reports useful in carrying out their responsibilities, those
reports are not primarily directed to those groups, nor motivated by their needs.
In order to meet the objectives of financial reporting, current GAAP and accounting
regulators, such as the U.S. Securities and Exchange Commission (SEC), have standards and
rules that require companies to publish financial statements that provide information on a
company’s financial position at points in time (the reporting dates) and the activities of the
entity, reconciled to changes in that financial position, between those points in time. The
requirements are met by presenting a statement of financial position (balance sheet) showing the
entity’s assets, liabilities and stockholders’ equity “measured” at each reporting date, and
statements of earnings (also known as profit and loss or net income), cash flows, and changes in
equity, for each reporting period. The financial statements are supplemented by footnotes that
provide enhanced explanations, breakdowns and tables about items in the financial statements,
and are a potential source for some of the detailed information that would inform any
measurement or assessment of a firm’s impact related to systemic risk. Further information may
also be found in management’s review of their business. For U.S. public companies, this is
formalized in their annual 10-K and quarterly 10-Q filings in the Management’s Discussion and
Analysis (MD&A) that contains additional quantitative and qualitative information regarding the
results of operations, liquidity and capital resources, developments affecting those matters and
any material trends. In many other countries there is an analagous Management Review with
different regimes requiring different types of disclosure.
Lastly, in order to fulfill the objectives of general purpose financial reporting, the
standard setters seek to have the information contained in financial reports be both relevant to the
purpose and as objective and reliable as possible in portraying the performance and financial
condition of the reporting entity. Accordingly, the information should not be purposefully
skewed to either favor or penalize particular business and financial arrangements, particular
companies and industries, or to accomplish public policy objectives other than providing
financial information to investors, lenders and other creditors in making capital allocation
decisions.
6
We point out these pedantic underpinnings because there is an existing framework that
underlies many of the choices made under current GAAP financial reporting standards which
may not always fit well with measuring, revealing or controlling systemic risk. Other
approaches can and often are taken by regulators with other objectives. For example in many
countries tax-reporting rules differ from local GAAP because the objectives of revenue
collection and policy initiatives applied through credits or deductions are driven by local public
policy issues not capital allocation decisions.
Analogously, bank and other prudential regulators have objectives of maintaining the
safety and soundness of the institutions they regulate and the overall stability of the financial
system. These regulators can make use of the information contained in GAAP-based financial
reports, but they can and often do require the entities they regulate to provide separate reports
with additional and different sets of information and measurement bases that are pertinent to
meeting their regulatory objectives. For example, in the U.S., banks are required to provide
separate “call reports” to their regulators, and insurance companies are required to file separate
“statutory” financial statements.
In most GAAP-based and regulatory reporting systems the emphasis has been on
measuring and disclosing the position and performance of a single entity with the role or impact
of system-wide factors considered indirectly, at best. That said, if, for example, the prudential
regulators believe that to reduce systemic risks fair-value accounting should not be used in the
estimation of regulatory capital amounts, this can be mandated without changing the information
provided to current or potential investors. During the recent financial crisis, there sometimes
appeared to be some confusion in the media and in a number of the key policy debates relating to
financial stability, about this important distinction. Despite the clear logical difference between
GAAP and regulatory reporting issues, in times of economic stress any information that is
perceived by some as fueling uncertainty is going to be questioned. On the one hand, some
believe that even if regulatory reporting chooses to ignore certain reported measures, such as
fair-value measures of assets reported under GAAP the public dissemination of this data may
actually exacerbate uncertainty and hence economic stress given that non-technical users of
accounting data, which frankly includes most participants in the financial system, do not
appreciate subtle measurement issues that regulators and accountants debate. On the other hand,
withholding or obfuscating this information, especially in times of economic uncertainty, can

7
undermine confidence in the numbers being reported by financial institutions and add to
uncertainty over their financial condition, thereby potentially undermining the perceived stability
of the financial system. Given how the media and many academics assume that business
decision-makers and financiers have nefarious objectives, the lack of clarity in financial
measures can often add to the fear and hence risk making the contagion effects even worse.
How useful is the information contained in financial statements in understanding and
evaluating the financial risks inherent in financial institutions? First, it is important to
understand that the numbers included on balance sheets are single point estimates at a specific
reporting date, while the financial risks embedded in financial assets, financial liabilities and
derivatives can, of course, be quite dynamic and depending on the particular instruments can
encompass various forms of risk, including interest rate risk, foreign currency risk, equity price
risk, credit risk, commodity price risk, and liquidity risk. In principle, non-derivative
instruments measured on an amortized cost basis reflect the risks inherent in the instrument at the
date it was acquired5. Thereafter, income or costs are measured based on the initial interest or
discount rate, so specific instrument interest rate risk is ignored. Other exposures are at least
partially accounted for: foreign currency changes are reflected in book values, certain credit risks
relating to “probable” losses on loans are reflected in an allowance, and declines in the value of
debt and equity securities are written down for “other than temporary impairments”. An
important criticism of the use of such accounting methods during the financial crises, is that they
may fail to report on a timely basis the effects of credit problems and of changing market and
economic forces on the value of the instruments and on an institution’s exposures to interest rate
and liquidity risks. Proponents of using fair value to measure all financial instruments argue that
fair values incorporate the effects of all changes in market risks on a timely basis and therefore
provide a better starting point for understanding and analyzing these risks than historical cost
based measures. Both of these views are incomplete. We will discuss more details on the actual
accounting of financial institutions and the potential association with systemic risk, but first we
need to put some context on the concept itself.
5 We will argue later that certain forward looking uncertainty or risk (such as credit risk) is not reflected in the initial recorded cost in some instruments.

8
Accounting for Systemic Risk
While systemic risk is defined in other parts of this book, Brunnermeier et al (2010)
indicate:
“Currently, we lack not only an operational definition of systemic risk, but also the data needed to measure it…….. Given the complexity of the financial system, it is unlikely that a single measure of systemic risk will suffice. We anticipate that the variety of inputs ranging from leverage and liquidity to codependence, concentration, and connectedness will all be revealing.” (Brunnermeier et al 2010)
So can accounting influence or help to measure systemic risk? Traditionally, transaction-
based accounting focuses on reflecting the financial position and activity of an individual firm
(not necessarily a single legal entity) with little direct regard to issues like codependence,
concentration and connectedness, even notions of leverage and liquidity need specification if
they are to be useful indicators for assessing systemic risk. To focus our analysis of accounting’s
role more specifically on the locus of the firm, we utilize a description from a governor of the
Federal Reserve. Tarullo (2011, pp. 1-2) details four ways in which distress in a single financial
firm can create risks to overall financial stability. For each of these we indicate some of the
associated accounting and reporting implications:
Counterparties of a failing firm cannot meet their obligations causing severe strain on their
creditors, thereby creating widespread distress. Requires an understanding of the
underlying assets, how they are measured, who are the counterparties, what is their
ability to pay, and the implications of delayed or failed payments on the firm.
To obtain liquidity, failing firms have to sell their most liquid assets at distressed prices
causing further distress on the prices of these and other assets. The falling prices in turn
can lead to margin calls and stress on earnings and capital when market values are
adjusted to the lower prices. Requires an understanding of the underlying assets, their
ability to be held and liquidated especially in times of stress, what the implications are of
price or value changes and what does this do to the solvency of the entity?
When one firm is in distress, contagion can set in if there is incomplete transparency into
similar firms in the industry, causing liquidity and other supply shocks even to sound

9
firms6. Requires a clear understanding of the underlying assets and the related funding
and their exposure to counterparties.
If the failing firm is a “key” part of the total system, there may not be a ready substitute to
take up the critical role played by the failing firm. Requires an understanding of the
relations between the firm’s business and the broader economy and financial system.
From the above it is clear that transparent measures or disclosures of the nature, pricing,
liquidity, linkages, concentration and riskiness of assets and obligations, and of any
counterparties, is of critical importance if there is any hope of measuring and anticipating
systemic risk. How feasible is this and can accounting, especially GAAP-based financial
reporting by individual enterprises, even provide this information?
To answer this and consider the related questions of whether accounting rules contributed
to the crisis through requirements for fair-value accounting and their impact on “pro-cyclicality”,
the role of accounting for unconsolidated “off-balance sheet” entities and inadequate measures of
“capital”, we need to describe and illustrate what financial reporting of banks under U.S. GAAP
provides. For each asset and liability or asset and liability class we need to evaluate:
How is it measured at each point and over time?
Can we assess the counterparties of the asset and the likelihood they will fail to meet their
obligations?
How is the asset funded, is any funding source measured equivalently, and does the
receipt of expected cash match with the expected payment stream from funding?
Can we assess the counterparty of the funding source and how does this impact any of the
answers to the previous questions?
What is the timing and uncertainty of the cash to be received from the asset?
How and when are uncertainties about the values and the cash to be received (or paid),
measured and reflected? 6 One way in which distress in one firm contributes to systemic risk is through the cascading effect of valuation shocks. As we will see, there are limitations in the measurement and recognition of changes in values of certain assets especially in times of stress. For various reasons, managers are reluctant to be the first to recognize steep write-downs especially as they may believe the value shocks are temporary after a long cycle of high prices. The first meaningful write-downs that are recognized can be from the most distressed firms, which then creates three cascading issues. First, every other firm has to consider if their assets should be adjusted to the same low values, this may lead to the rush to sell such assets while they still can, and lastly, market participants suddenly realize they cannot rely on many of the measures they have been using.

10
What additional resources or obligations exist that are not on the balance sheet and how
would these influence the timing and pattern of receipts and payments?
What are the relationships among counterparties and what would be the sequence and
impact on cash receipts and payments in times of stress?
Accounting for Different Asset and Liability Classes
To illustrate answers to these questions we use the 2010 annual report of JPMorgan
Chase (JPM) and Company, and also show aggregate data under U.S. GAAP across all U.S. bank
holding companies. We choose JPM as it is widely considered to be one of the most sound and
well run financial holding companies in the U.S. with high quality financial reporting, and thus
should serve as a reasonable benchmark. It is important to emphasize we are not criticizing JPM
in any way; we are merely using their reports for illustrative purposes. Exhibit 1 shows the
balance sheets for JPM at the end of 2010, with the various assets and liability categories we will
consider. Within each class we will also consider associated revenue and expense or gain and
loss categories reported in earnings or other comprehensive income (OCI).

11
Exhibit 1: JPMorgan Chase Balance Sheet in 2010
Source: JPMorgan Chase 2010 Annual Report pp. 92 and 116
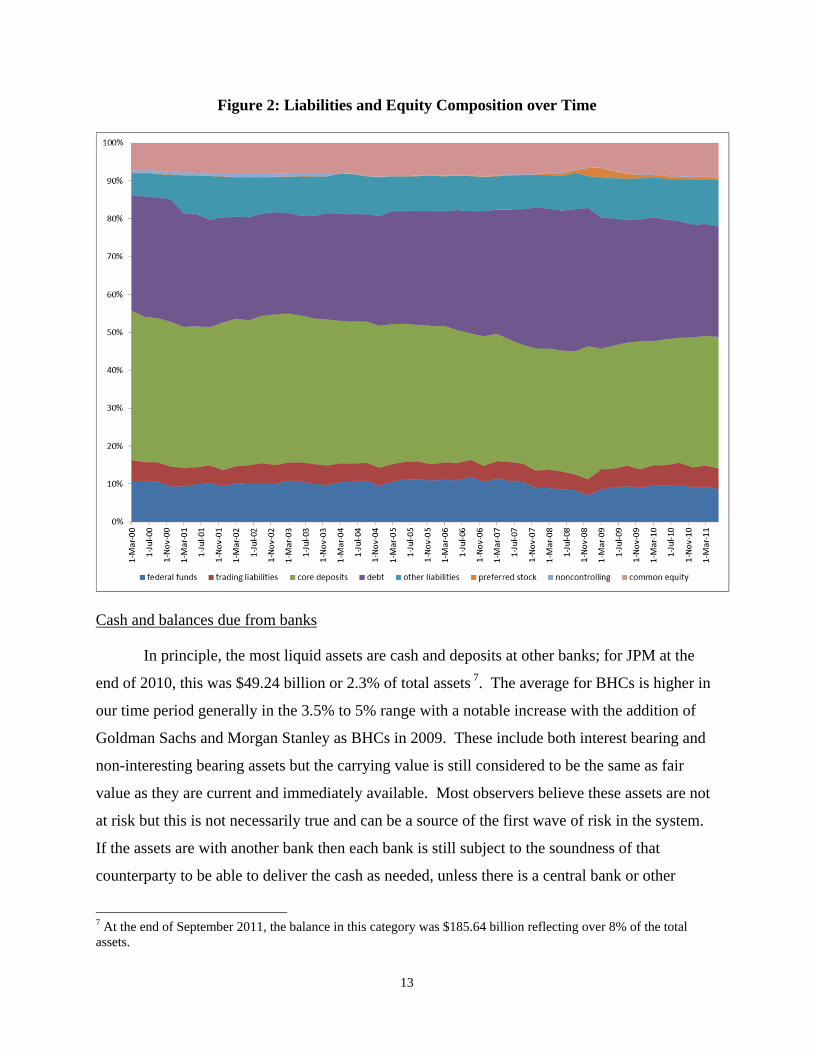
Figures 1 and 2 present the time-series of quarterly common size balance sheets for assets
(Figure 1) and liabilities and equity (Figure 2) of all U.S. Bank Holding Companies (BHCs) with

12
total assets of at least $500 in March 2006 prices. These statistics are derived by first aggregating
balance sheet items across all the BHCs each quarter, and then calculating the common size
ratios.
Figure 1: Asset Composition over Time
13
Figure 2: Liabilities and Equity Composition over Time
Cash and balances due from banks
In principle, the most liquid assets are cash and deposits at other banks; for JPM at the
end of 2010, this was $49.24 billion or 2.3% of total assets 7. The average for BHCs is higher in
our time period generally in the 3.5% to 5% range with a notable increase with the addition of
Goldman Sachs and Morgan Stanley as BHCs in 2009. These include both interest bearing and
non-interesting bearing assets but the carrying value is still considered to be the same as fair
value as they are current and immediately available. Most observers believe these assets are not
at risk but this is not necessarily true and can be a source of the first wave of risk in the system.
If the assets are with another bank then each bank is still subject to the soundness of that
counterparty to be able to deliver the cash as needed, unless there is a central bank or other
7 At the end of September 2011, the balance in this category was $185.64 billion reflecting over 8% of the total assets.

14
credible government guarantee. In the absence of such a guarantee, in a stress environment,
bank A that has the balance due may fear the liquidity of bank B where the deposit is held and
withdraw its funds as quickly as possible, then as others follow the contagion process can begin.
What do we know about the counterparties to these balances? Unfortunately we know
almost nothing from public disclosures. We may conjecture, that for the larger banks, there are
also deposits by the counterparty on the liability side so that the real risk is much smaller, but
there is no way for us to know if this is the case or the amounts involved, as current accounting
rules do not allow us to reflect this “set-off” notion, even in the disclosures8. Accounting
standards in the U.S. do require footnote disclosures on concentrations of credit risk, and the
SEC requires companies to disclose concentrations of risk or exposures in the MD&A, with a
materiality threshold of 5% of assets (or in some cases revenue) often used as a basis for
deciding what to disclose. However, this is a high threshold especially in the context of
understanding potential for systemic risk, as it is the impact on capital rather than assets that
causes concern in crises, and it is unlikely that contagion effects would be considered in this
calculation. To summarize, an obvious question to ask to understand the potential for risk in
cash is what the asset-liability make-up is by counterparty (depositary institution), guarantor and
duration? This is not available in public disclosures, but it at least should be considered by
regulators and internal risk managers with access to the underlying data. Given that the data are
not available publicly for something as simple as cash deposits, it should already be clear that
being able to obtain data about counterparty and the issues of “concentration, codependence and
connectedness” for all asset classes so as to assess systemic risk is a daunting task.
JPM does provide a detailed discussion of its liquidity risk management and how it
utilizes the different asset categories and both segment and geographic distribution to diversify
any risks9. This disclosure provides some comfort but it is too aggregated and high level to
allow a user of the public information to assess counterparty and systemic risks. This is a pattern
and theme we will indicate in all categories and demonstrates the fundamental point that we have
to be realistic about what is achievable from public information and perhaps even for regulators
8 The FASB issued Accounting Standards Update 2011-11 in December 2011 to show gross amounts in the limited set of cases where set-off is allowed under GAAP. For repos the rules are stated in ASC 210-20-45-1 through 11, issued by the FASB. 9 This is in it MD&A on pages 110-115 of its 2010 annual report.

15
with private information in terms of measuring systemic risk, irrespective of which accounting
choice is made.
Federal funds sold (purchased) and securities purchased or borrowed (sold or loaned) under
resale (repurchase) agreements10:
This category of assets and liabilities is also quite liquid subject to (“haircuts”) fees that
change based on supply and demand factors. For JPM at the end of 2010 the asset values were
$346.14 billion (of which $123.6 was for securities borrowed) equal to 16.3% of assets and the
liability value was $276.64 billion equal to 13.1% of total liabilities. This is higher than the
average for BHCs which is generally closer to 7%, partly because most BHCs have lower
securitization, trading and brokerage activity and thus less use for Repos. The balance sheet in
Exhibit 1 shows that around 10% of JPM’s repo assets and less than 2% of these liabilities are at
“fair value”. This may be a little misleading because the bulk of the assets and liabilities are
“carried at amounts that approximate fair value due to their short term nature and generally
negligible credit risk” (page 185 of JPM annual report). The liquidity and negligible credit risk
might suggest to some that these assets and liabilities are unlikely to contribute much to systemic
risk and not have any potential issues with fair value reporting. However, that conclusion is far
from correct.
Security lending and repo activities related to transactions supporting trading and client
activities may also contribute to systemic risk. In a simple case, in liquid markets, a desk or
client may want to sell short a security for a period of time and the bank will borrow the security
and then lend it to the desk or client with an agreement that fixes the period and price. The “fee”
for this depends on the demand for the security, its price volatility and the cost of funds. As long
10 Federal funds sold are immediately available funds lent to other financial institutions under agreements or contracts that have an original maturity of one business day or roll over under a continuing contract. These transactions may be secured or unsecured or may involve an agreement to resell loans or other instruments that are not securities. Federal funds purchased are the corresponding liability reported by the borrower. Securities purchased under agreements to resell (reverse repos) are funds lent under agreements to resell securities or participations in pools of securities. That is, the BHC “purchases” from the borrower securities which are effectively used as collateral for the loan. At maturity, the BHC “sells” back identical or substantially identical securities for an amount specified or determined in the agreement. These transactions typically have maturities ranging from overnight to up to a year. Securities purchased under agreements to resell are reported on the balance sheet at the amount the securities will be ultimately repurchased, including accrued interest. Securities sold under agreements to repurchase (repos) are the corresponding liability reported by the borrower. Securities loaned (borrowed) are similar to repos (reverse repos) except that the transaction is motivated by the security borrower’s need for obtaining the security rather than by the security seller’s need for funds.

16
as everything is matched by contract this specific transaction is relatively riskless. However, in
many firms these positions get aggregated and in volatile and especially panicked markets the
availability and costs of securities for borrowing and lending can change dramatically and quite
quickly. Moreover, as with securities owned, the “best” companies may find that they are the
most liquid exacerbating the trading activity and supply of securities in the hunt for liquidity. So
when we think about the continuing business, the nature of the contagion discussed in Tarullo’s
second component applies to the securities lending and repo business too. Even if the assets and
liabilities have an appropriate one-day fair value, as they are rolled over each day the impact on
the costs and spreads will worsen in times of crisis and exacerbate the negative income effect of
this business.
Gorton and Metric describe how this process took place in the recent crisis:
“The first systemic event occurs in August 2007, with a shock to the repo market … the market slowly became aware of the risks associated with the subprime market, which then led to doubts about repo collateral and bank solvency. At some point (August 2007 in this telling) a critical mass of such fears led to the first run on repo, with lenders no longer willing to provide short- term finance at historical spreads and haircuts. After August 2007, the securitized-banking model was under pressure, with small equity bases stretched by increasing haircuts on high-grade collateral. … This pressure contributed to the forced rescue of Bear Stearns in March 2008 and the failure of Lehman Brothers in September 2008. The second systemic event and run on repo occurred with the failure of Lehman. In this second event, we see parallels to 19th century banking crises, with a famine of liquidity leading to significant premia on even the safest of assets.” (Gorton and Metric, JFE 2012)
To understand the potential risks of the firm (and then potentially the system), it would be
helpful (even necessary) to know more about the mix of these assets and liabilities. Consider
that the potential for systemic risk would be quite different if the funds/securities sold or
purchased were mostly 3-month Treasuries versus mostly illiquid small-cap equity securities.
Also to the extent there are matches in the assets and liabilities in terms of the type, amount and
duration, it would be beneficial to know. Unfortunately this is not available in public data.
Trading Assets and Trading Liabilities
In 2010 JPM had debt and equity instrument assets of $409.4 billion (19.3% of total
assets) and liabilities of $76.9 billion (6.6% of total liabilities) as well as derivative net
receivables of $80.5 billion (3.8% of total assets) and net payables of $69.2 billion (3.3% of total
17
liabilities), on its balance sheet11. For trading assets and liabilities, the BHC averages are also
lower. The trading assets have risen from the 9 to 11% range to 12-14% since early 2007. The
trading liabilities for BHCs have mostly been in the 4.5-5.5% of total assets since 2000. All of
these assets and liabilities are measured at fair value each period with unrealized gains and losses
including any interest or dividends, reflected in “revenue” and hence earnings. The application
of fair value and the useful disclosures in the fair value hierarchy that the accounting rules
provide (described below) can interplay with all four of the elements that Tarullo itemizes in
describing systemic risk.
The cash realization likelihood of the assets or liabilities depends on the type of financial
instrument, the liquidity of the market for that instrument, and the size of the position on any
day. Even if there is a liquid market for a given security, if the position is large relative to the
daily volume then the market’s price may not actually reflect the cash (or value) that can be
realized on sale. Additionally, in times of stress, supply-demand imbalances can be created by
market dynamics that may not be reflective of the fundamental values of the instruments.
Current accounting rules for trading assets and liabilities generally rely on end of day “exit”
pricing12, which by its nature may reflect short-term market conditions, and anomalies. Under
U.S. GAAP and IFRS, there are three categories of fair value that are used. Level 1 uses market
prices of the actual securities in active markets. Yet in periods of high volatility, especially in
stressed markets, these reported values based on a closing price on the reporting date may not
reflect a realizable value despite their reliability. If market prices from active markets are
unavailable, the instrument’s value is estimated using valuation methodologies that incorporate
observed transaction prices, independent pricing services, broker quotes, and other inputs. If all
valuation inputs are observable and liquid, the fair value estimates are classified as Level 2. The
precision of such measures can vary depending on the particular instrument and market
conditions. Thus, in times of stressed markets the potential range and variation in the values
11 The notional amounts of the derivatives are much higher but the receivables and payables are netted where the counterparties are the same and master netting agreements are in place. The netting adjustment was greater than $1.4 trillion in 2010 for JPM (pp.176-7 in JPM’s Annual Report) 12 To complicate matters further if a particular security is traded across time zones, choosing what time constitutes end of day can make a difference to the recorded price or value.
18
selected can be significant13. The use of historical trend analysis to establish values when
markets are extremely volatile and with a negative trend suggests there is a potential for
significant variance in the measures different companies will choose. Companies that are
struggling to survive or sustain their capital levels may report high values, while stronger banks
that have stronger capital bases may choose more conservative values to withstand the scrutiny
of cynical regulators and auditors performing ex-post evaluations. The variance in measures for
similar asset classes adds to the uncertainty of market participants and may even exacerbate the
negative spiral and contagion.
There are also some securities, derivatives and other financial instruments for which there
is very limited activity and little transparency around the inputs. In these cases, the valuation
models are firm- or even trader-specific, and the fair values are classified as Level 3 values. The
distinction between Level 2 and Level 3 assets is less clear than it might seem at first. Choosing
a simpler valuation model (e.g. a Black-Scholes model for an equity option with few observable
inputs) may make it easier to fit a Level 2 definition even when a more complex model might
yield a superior measure relative to the economic value, but use factors that force it to be
classified as Level 3. Interestingly, it is the firms with stronger research and risk management
capabilities who would be most likely to use the more complex measures as their measures of
fair value. Another reason we find shifts between levels was seen during the crisis. As the
markets became disrupted for many mortgage-backed (“toxic”) securities, the benchmark (index)
prices used in the models were unreliable and securities had to be shifted into the Level 3
category making many investors more uncertain and sometimes skeptical of the values of such
assets. Auditors also would generally choose to take a risk reducing conservative approach to
what they would deem as acceptable values adding further (and in some cases appropriate)
pressure on asset values.
Ironically, while many of the Level 3 fair value estimates may be hard to verify and
therefore thought of as unreliable, they are often reflective of a tradable value, especially relative
13 For example the prices for the Barclays Capital US Aggregate CMBS (A or >) index (previously LHMN4887) shows a distinct pattern of negative returns around the month-end reporting dates especially in November and December. November 2008 was the fiscal year end for several investment banks and there were 3 days of more than plus 4% return followed by 2 days of negative returns of similar magnitudes including the month reporting date, followed by 3 days of positive returns between 1.5% and 4.5%. So using the November 30th date as an exit value is not necessarily reflective of a realizable or relevant measure for CMBS securities at this time.

19
to a security that has high price-volatility around reporting dates. In addition, some financial
instruments—primarily tailored derivatives —which only trade among a few participants and are
therefore classified as Level 3, can be the source of a critical bank service as risk intermediaries
in the financial system. So as the values and acceptability of these instruments decline, a critical
part of the market-making and intermediation system that is needed most in times of stress will
decline if not be eliminated. That is, because of the perceived stigma associated with holding
level 3 financial instruments and the increased pricing of opaqueness, dealers of tailored
derivatives may choose to reduce their activities in providing risk intermediation. Thus, the
classification of fair values under GAAP which most would agree was an improvement in
disclosures may have had the unintended consequence of limiting risk intermediation in times of
economic stress when such intermediation is most beneficial, and potentially profitable. This
situation speaks to the fourth point of Tarullo’s description of systemic risk.
However, we do not want to minimize the point that assets that were linked to the inflated
property market, and that ignored the fundamental credit and macro risks inherent in valuing the
securities, could not be sensibly reported at some unrealizable historical cost. Within the context
of the FASB and IASB goal of providing relevant and reliable information to users of financial
statements, the disclosure of fair values and the categorized sourcing is in our view necessary.
Further we do not want to suggest that ignoring these disclosures would somehow have
prevented the likelihood of the systemic risk given the existence of structural economic distress.
The more general point is that there is no simple way to avoid an impact on systemic risk by
choosing one particular accounting measurement and disclosure regime. We will however,
address some ideas on how accounting may be adapted to reduce any impact on procyclicality
and systemic risk.
To assess the potential impact of trading securities on systemic risk we need more
information about the types of securities and their valuation than the balance sheet totals. This is
provided to some extent in the GAAP disclosures. Exhibit 2 shows JPM’s note disclosing its
2010 trading assets reported at fair value. We see a mix of mortgage backed securities, debt
instruments (including some loans), commodities, equity securities and various derivatives.
Other than listed equity securities and government and government agency securities, the
majority of values are in levels 2 or 3. How much can we really tell about their susceptibility to
market uncertainty and potential stress? To answer this question we need to know much more
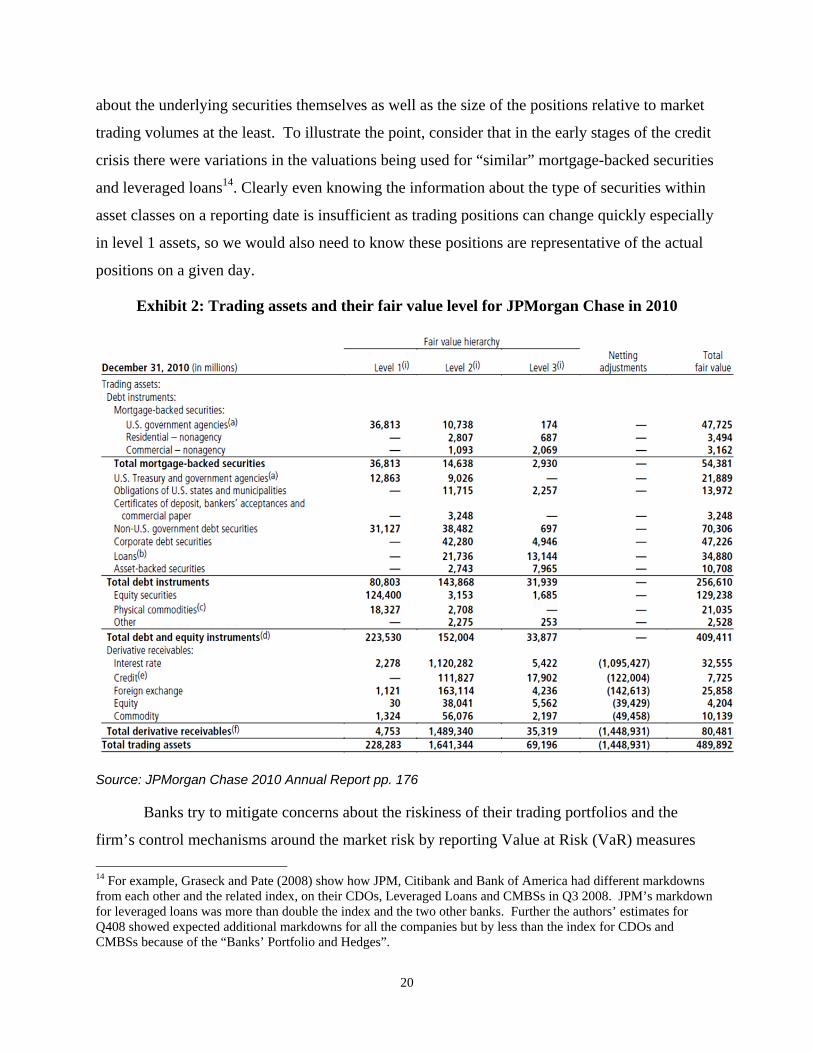
20
about the underlying securities themselves as well as the size of the positions relative to market
trading volumes at the least. To illustrate the point, consider that in the early stages of the credit
crisis there were variations in the valuations being used for “similar” mortgage-backed securities
and leveraged loans14. Clearly even knowing the information about the type of securities within
asset classes on a reporting date is insufficient as trading positions can change quickly especially
in level 1 assets, so we would also need to know these positions are representative of the actual
positions on a given day.
Exhibit 2: Trading assets and their fair value level for JPMorgan Chase in 2010
Source: JPMorgan Chase 2010 Annual Report pp. 176
Banks try to mitigate concerns about the riskiness of their trading portfolios and the
firm’s control mechanisms around the market risk by reporting Value at Risk (VaR) measures
14 For example, Graseck and Pate (2008) show how JPM, Citibank and Bank of America had different markdowns from each other and the related index, on their CDOs, Leveraged Loans and CMBSs in Q3 2008. JPM’s markdown for leveraged loans was more than double the index and the two other banks. Further the authors’ estimates for Q408 showed expected additional markdowns for all the companies but by less than the index for CDOs and CMBSs because of the “Banks’ Portfolio and Hedges”.

21
and other analogous statistics, in particular the daily distribution of market risk-related gains and
losses15. While these disclosures might be informative during non-stress periods, they are not
useful measures in the least likely scenarios that characterize periods of stress that lead to
systemic risk.
It is also worth noting that even for a “well-capitalized” bank like JPM, at year-end 2010
a 20% “shock” to its non-derivative trading assets alone (without offsetting trading liabilities or
other hedges) would eliminate half its shareholders’ equity? Most bankers and market
participants would say this is unrealistic, and we would ask how we can know this. Do we know
which equity securities are held at this time, let alone what corporate securities and loans are
valued (levels 2 and 3) with a total of more than $82 billion? The firms with good risk
management systems do stress tests of different forms and the bank regulators are starting to
perform more sophisticated stress tests which mitigate some concerns of future problems.
However, as we saw in the crisis and in current markets, historical correlations do not always
hold up thus reducing the confidence we can have in using these measures in times of stress. To
better assess the risks in these assets we need more detailed disclosures on the specific securities
held, this type of disclosure is provided by institutional investment managers in Form 13-F
filings required by the SEC.
So does the use of fair value contribute to the systemic risk of the traded assets?
Academic analysis is being performed to try and address this question, and although several
studies find suggestive evidence of fair value accounting contributing to systemic risk (e.g.,
Khan 2010), the majority of studies find it difficult to identify a clear association (e.g., Laux and
Leuz 2010). Our personal view is that requiring the use of ANY single point in time measures
for trading (or other) securities, during periods of stress can exacerbate uncertainty16. So
elimination of a fair value approach and substituting it with an alternative single point measure
such as original cost will not necessarily eliminate this risk. We will discuss this in more detail
with the next two categories of assets, Securities and Loans.
15 JPM discloses that “the Firm posted market risk-related gains on 248 out of 261 days” in 2010 and on none of the 13 loss making days did the market risk related loss exceed the risk control of daily VaR (2010 Annual Report page 144). 16 It is worth noting that the FASB recognized this possibility by including in its requirements that the market (exit) price should only be used if there is an orderly market.
22
Securities
Securities are a large class of assets for many banks. In 2010 JPM reported securities of
$316.3 billion (14.9% of total assets) separately from “Trading Assets” that also includes
securities. This is within the typical average for BHCs in the period we cover in Figure 1. These
assets consist primarily of mortgage backed securities, debt securities including corporate and
asset backed securities, and a small amount of equity securities. Most of these categories also
show up under trading assets, the critical difference is that while the balance sheet values will
mostly be at fair values the unrealized gains and losses arising from changes in fair values will
generally be shown as part of “other comprehensive income” (OCI), which currently is reflected
in a statement of equity rather than in the income statement itself17. This matters because OCI is
often excluded in reported measures of earnings and earnings per share as well as return on
capital calculations.18
There is an exception to the exclusion from reported earnings of fair value gains and
losses, which is important to understanding how the impact of fair value accounting is often
misunderstood when being discussed by politicians and the media. If the measurement of
securities at fair value leads to unrealized losses then an assessment must be made as to whether
this loss is an “other than temporary impairment” (OTTI). Analogous assessments must be made
for other assets, including “held-to-maturity” securities, loans (discussed below), and even some
physical assets19. It is critical to appreciate that in economic downturns, especially those linked
with stressed economic periods that are not over quickly, the revaluing of financial or physical
assets to reflect impairments with the resulting loss impacting both equity and in most cases
earnings, is a requirement under almost any current accounting policy regime. So the question of
whether the application of fair value accounting exacerbates systemic risk and is pro-cyclical, is
really only meaningful if we consider how fair-value accounting might contribute to the risk on
the upside of a cycle, unless we want to contemplate elimination of impairment or lower of cost
17 From 2012, companies will have to include earnings and OCI either in one statement or as two consecutive statements. 18 In practice, most people do not adjust for other comprehensive income by eliminating these amounts in the equity or invested capital denominator even though they ignore the periodic OCI in the income measure used. 19 For example, for commodities in the trading assets JPM states that the inventory is carried at the lower of cost or market value, 2010 Annual Report p. 173

23
or market value rule (LCM) rules which is rarely contemplated. We will consider this more in
the summaries of other assets and liabilities.
Loans and Allowance for Loan Losses
A major asset category for a bank is the loans they make. In 2010 JPM had loans of
$692.9 billion and an offsetting allowance for loan losses of $32. 2 billion (net is 31.2% of total
assets). For the broader BHC sample the loans (and leases) represented an average of 55% of
total assets in 2000 but have declined to around 48% before the inclusion of the investment
banks as BHCs. Today the average is around 37% of total assets. Loans (including leases) are
mostly treated as held for investment and are thus reported on the balance sheet at the original
loan amount, less any principal repayments or charge-offs to date, and adjusted for any
unamortized acquisition discounts, premiums, fees or costs. This balance is then further reduced
by an allowance for losses that represents management’s estimate of the outstanding balance that
it is unlikely to collect given current information and events20. The loans are in 3 broad
categories, wholesale $227.6 billion (of which $3.1 billion is considered held for sale and $2.0
billion is at fair value), credit card $137.7 billion (of which $2.2 billion is considered held for
sale) and other consumer, $327.5 billion. Each of these categories has sub-categories that are
disclosed in the notes.
Exhibit 3: Wholesale Retained Loan Portfolio Held for Investment
Total Loans
Commercial & Industrial
Real Estate
Financial Institutions
Government Agencies Other
Investment Grade $146.0 $31.7 $28.5 $22.5 $6.9 $56.5Non-Investment Grade $76.5 $34.9 $25.1 $8.9 $0.4 $7.1
Total $222.5 $66.6 $53.6 $31.5 $7.3 $63.6
Multi-Family $30.6Lessors $15.8
Construction and Development $3.4Other $3.8
Total $53.6
Source: JPMorgan Chase 2010 Annual Report pp. 223-226 20 Following the financial crisis the focus on existing versus forward looking information is being reconsidered by accounting standard setters. We will discuss this more explicitly later in the chapter.

24
Exhibits 3 and 4 present these sub-categories for wholesale and other consumer,
respectively, with a broad credit distinction being made. For example, in Exhibit 3, we see that
one third of wholesale loans are non-investment grade suggesting these have a much higher
credit risk. There is also disclosure (in Note 5 of JPM’s annual report) of the credit exposure in
different industries, and segmentations of investment and non-investment grade, U.S. and non-
U.S. wholesale loans (page 224). The exposure includes recognized loans and derivatives as
well as off-balance sheet “lending-related financial instruments”. For example, it shows that
there is $65.9 billion of credit exposure to banks and finance companies of which $21.6 billion is
for on balance sheet loans, $20.9 billion for on balance sheet derivatives and $23.4 billion for
off-balance sheet items. There is no distinction on how these are allocated into investment grade
or not although we can reconcile to the total of $31.5 billion for financial institutions in Exhibit 3
if we include the amounts shown for asset managers, insurance and securities firms and
exchanges in the industry disclosure. But what do these more detailed segmentations tell us
about the potential for systemic risk arising from credit concerns of borrowers, at least in terms
of the interconnectedness of financial institutions and their risks? We contend that it says very
little. If we knew which institutions the loans were held by we would have a better ability to
assess both a single bank’s risk and then with enough information and computing power
potentially the system wide risk. Without this, knowing the magnitude of the numbers can create
uncertainty when a panic starts to set in21. The disclosures show that the total off-balance sheet
exposure for financial institutions disclosed at the end of 2010 is $49.4 billion, and there is $34.8
billion of on balance sheet wholesale derivative exposures in financial services. So with almost
$100 billion of total exposure to the sector, in the absence of more details on the counterparties
and how these loans are funded in times of distress, the likelihood of their being an impact on
systemic risk using Tarullo’s four indicators is high.
21 In principle, companies can and arguably should include any disclosures deemed to be necessary or useful to investors in their MD&A or management review. When uncertainty prevails more disclosure is often provided. But to reduce uncertainty that can induce panic we would need to see the nature of positions by bank. In reality, th kind of detail that would be necessary to provide full transparency and facilitate an assessment of systemic risk, especially when we include all positions, would overwhelm virtually every investor’s ability to analyze and comprehend. There is also an inevitable debate as to when the private detailed information is too proprietary to reveal for public use. The data can and should be available to relevant regulatory authorities.
25
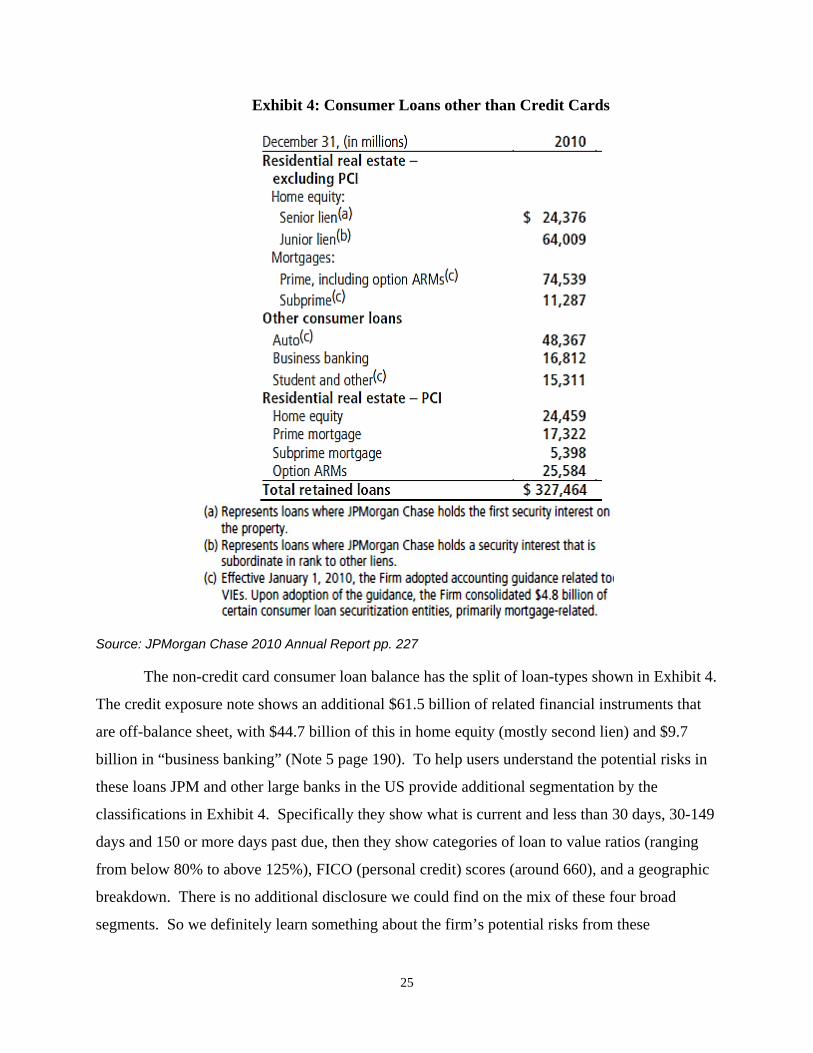
Exhibit 4: Consumer Loans other than Credit Cards
Source: JPMorgan Chase 2010 Annual Report pp. 227
The non-credit card consumer loan balance has the split of loan-types shown in Exhibit 4.
The credit exposure note shows an additional $61.5 billion of related financial instruments that
are off-balance sheet, with $44.7 billion of this in home equity (mostly second lien) and $9.7
billion in “business banking” (Note 5 page 190). To help users understand the potential risks in
these loans JPM and other large banks in the US provide additional segmentation by the
classifications in Exhibit 4. Specifically they show what is current and less than 30 days, 30-149
days and 150 or more days past due, then they show categories of loan to value ratios (ranging
from below 80% to above 125%), FICO (personal credit) scores (around 660), and a geographic
breakdown. There is no additional disclosure we could find on the mix of these four broad
segments. So we definitely learn something about the firm’s potential risks from these

26
disclosures, but if we reconsider the period before and after the current housing-led credit crisis it
is hard to conceive how we would have used this data other than to create concern about
potential losses for large balances in ANY of the riskier categories. We also cannot find
information about the duration of these loans within the sub-categories that are disclosed making
it more difficult to understand the credit risks, and any potential for matching the loans with the
funding sources.
The last category of loans identified is for credit card balances. At year-end 2010, JPM
disclosed it had $135.5 billion in such loans. They also provide additional disclosures of the
loans’ breakdown by geographic region and the same FICO-based split as for other consumer
loans, so many of the previous comments apply to the credit card loans too.
A key uncertainty that leads to systemic risk is the credit risk in loans. To better assess
such credit risk at the firm and system levels, it would be important to understand what exposure
the bank as a whole and the rest of the system has to each client. Such multiple exposures to the
clients are not disclosed nor easily captured, so there is a large gap in our ability (and perhaps
even some banks’ ability) to understand the true system-wide exposure on their books. It is
worth reemphasizing that to understand system-wide risks it is not sufficient for a bank to know
only the exposures that a given customer has to the bank, it also needs to understand all other
assets and liabilities that customer has. Credit bureaus work at aggregating this data and selling
it to customers, but one should not underestimate the difficulty and cost in capturing and
maintaining such data, let alone trying to stress the data in a meaningful way.
To summarize our review of typical public disclosures of credit risk for loans, there is a
lot of information provided, but it is far too aggregated to provide us with the ability to
independently assess firm specific credit risks and the potential for systemic risk. Regulators
could do this in principle but it is a complex and expensive task. An interesting research
question is what the appropriate aggregations that would facilitate meaningful risk analysis are.
The accounting issue that is often cited as leading to systemic risk for loans as well as
securities is use of fair value, so are all these loan exposures subject to fair value accounting, and

27
could this help address the concerns expressed above22? As seen in Exhibit 1, JPM indicates that
only $2 billion of total (non-trading) loans are measured at fair value, although they also disclose
that the carrying value and fair value are within $3 billion of each other23. JPM also states that in
the absence of available secondary markets the values are estimated based on a discounted cash
flow model. There is clearly no information about the underlying economic fundamentals or
risks or sensitivity analysis around these estimations.
While only a small fraction of loans is reported at fair value, companies have to
continuously evaluate the probability of realizing the loan balances, based on credit risks, and
appropriately adjust the net book value of loans for likely loan losses. In making this
assessment, the approach taken by JPM is typical as it is based on current regulations in the U.S.
under GAAP which are largely similar to IFRS24. The carrying value is generally “measured at
the principal amount outstanding, net of … allowance for loan losses … The allowance for loan
losses represents the estimated probable losses on held-for-investment loans.”(p.220) The
allowance for loan losses reflects current information regarding credit risk, but it does not reflect
the “pricing” of credit risk for the following reasons. First, the allowance reflects likely but yet
unconfirmed credit losses based on existing conditions; it does not reflect plausible anticipated
losses (e.g., due to an expected recession or unrealistically inflated collateral values) which have
not been incurred as of the balance sheet date. Such expectations are likely to affect the fair value
of loans and would have been “priced” in an efficient market for such loans. Second, the
allowance measures the undiscounted amount that the bank expects to charge-off in the future
due to future incurred losses. That is, the allowance ignores the time value of money, which
affects the pricing of credit risk. Third, the allowance does not reflect changes in credit spreads
which are due to changes in investors’ sentiment toward credit risk. Such changes obviously
affect the prices of credit-risky loans. Further, in addition to the credit risk, a full fair value or
22 If a fair value for loans was easily measurable and all loans were being reflected at their fair values, then arguably the full credit risk of each counterparty would be measured and reported through time. We believe this would be difficult to do and it is unlikely that the measures would also reflect the potential for systemic risk. 23 JPM and several other banks also have purchased credit impaired (PCI) loans which are measured at fair value when they are purchased either on an acquisition or from a securitization pool. We are excluding these from our discussion. 24 Both the FASB and IASB are contemplating changes to the current regulations to incorporate more forward looking analysis of credit risks.

28
market price calculation would adjust for changes in interest rates, prepayment probabilities and
other priced factors.
To summarize, for loans that are retained and held for investment purposes even when
using an amortized cost measurement approach, there is still a partial fair value requirement. In
our view the application of current accounting rules probably exacerbates or perhaps masks
business cycles. We will delay looking at this question more comprehensively until we complete
our analysis of the rest of the balance sheet categories.
Accrued Interest and Accounts Receivable
In 2010 JPM had accrued interest and accounts receivable of $70.2 billion (3.3% of total
assets), which includes receivables from customers, brokers, dealers and clearing organizations.
While in relative terms this item may seem small, we do not get a lot of detail about the
components of this total, it presumably includes receivables related to the prime brokerage
business and as such would be subject to some stress in times of panic. . We will see there are
also payables with the customers, brokers, dealers and clearing organizations but we have no
idea as to what extent the receivables and payables are to the same entities, or if they are of
similar type and duration25. Disclosing these would help with our assessment of risks.
Goodwill and other intangible assets
In 2010 JPM had reported goodwill and other intangible assets of $62.5 billion (2.5% of
total assets), which is slightly lower than the average for BHCs, at least since mid-2004. While
reported intangibles are relatively small, an important consideration when assessing the
association of accounting and systemic risk, is that there are significant intangible assets that are
not recognized, potentially adding to uncertainty and systemic risk.
In general, both types of intangibles that are recorded arise on acquisitions. At the time
of an acquisition a company has to fair value all tangible assets acquired as well as the value of
customer relationships and other identifiable intangible assets. This would include core deposit
intangibles that relate to the value arising from the stickiness of customers deposits (see
discussion of deposits below). There is an analogous calculation performed for acquired credit
25 In our BHC analysis these assets and liabilities are included with other assets and liabilities but for many of the banks this will probably be a smaller portion of assets than for JPM, given their business models.

29
card relationships. These relationships are only fair valued on acquisition and then, ironically,
this cost is amortized over time even if the depositors or card holders remain with the firm.
These acquired intangibles will still be subject to regular tests for possible impairment.
Impairment would be most likely to occur in some banks in times of distress, especially if this
occurs for the economy as a whole.
The difference between the purchase price and the fair value of all net assets acquired is
termed goodwill which remains on the balance sheet as an unamortized intangible asset unless it
is deemed to be impaired. In principle impairment arises because the price paid is too high
relative to the income that can be generated post-acquisition so that the return on equity is below
the cost of equity. This is a form of fair valuation that must be evaluated annually at a business
segment or finer level.
In general, the valuation of goodwill and intangibles is not often considered as an
accounting issue contributing to systemic risk. However, this is potentially misleading for two
reasons. The first is the unrecorded value of relationships, a large intangible asset. We will be
more explicit about this missing value when we discuss deposits and non-interest income. The
second reason relates to the likelihood of impairment charges in times of economic stress.
Recall from our basic accounting equation that the equity capital is essentially just the net
of reported assets and liabilities. So to the extent there are market participants who are using
reported book values of equity as a signal of available capital, an impairment charge taken during
times of stress will then lead to a potentially significant lowering of the equity capital, which can
exacerbate any negative spiral that begins. It is worth remembering that accounting standard
setters are focused on the objective of providing information to users not capital preservation, so
regulators focused on capital can choose to adjust for goodwill and intangibles, in any way they
want. Sophisticated investors and analysts use both reported and tangible-only measures of book
value of equity in their assessment of banks. U.S. banking regulators and many sophisticated
analysts and investors also utilize a measure of “Tier 1” capital as a measure of risk-based equity
and set a minimum ratio as a measure of being “well-capitalized”. This measure generally
30
excludes goodwill and intangible assets (net of related deferred tax liabilities), presenting a
classic case where standard GAAP is “adjusted” to meet a different regulatory objective26.
Tarullo’s third way that systemic risk occurs is when one firm is in distress, and
contagion begins to set in. When you consider that it can be quite difficult and time-consuming
to obtain clear transparency about how the multiple versions of capital differ, especially in terms
of understanding the underlying economic differences, when large write-offs of equity occur via
goodwill impairments, then even if these impairments have no impact on some capital ratios it
does on others and confusion can easily occur. The uncertainty might drive investors to sell and
ask questions later; trying to sort out the “reality” once they have liquidated the investment. The
irony here is that even when impairments are taken because the value attributed to the acquisition
prices have been eroded, there is other intangible value that is not being recognized.
All other assets
In 2010 JPM had premises and equipment of $13.4 billion, mortgage servicing rights of
$13.6 billion and “other assets” of $105.3 billion (last is 5.0% of total assets). The first two
would have little bearing on systemic risk but the amounts included in the generic category, other
assets “consist of private equity and other investments, cash collateral pledged, corporate and
bank-owned life insurance policies, assets acquired in loan satisfactions (including real estate
owned) and all other assets” (JPM 2010 Annual report p. 93). We do not know the split of these,
although we presume it includes deferred tax assets which gross $23.6 billion net of a valuation
allowance. In terms of understanding the impact on systemic risk, knowing more detail on some
categories such as the private equity investments and cash collateral pledged would be useful as
the amounts could be high relative to a bank’s capital or cash, creating stress especially during a
crisis. The less understood issue relates to the deferred tax asset category which can be an
26 Tier 1 capital still relies primarily on GAAP measures and was formed out of the Basel I Capital Accord. This accord was revised to provide greater sensitivity to asset risk in what became known as the Basel II framework and there is now a new accord termed Basel III. JPM and most other large banks also have a measure of “economic” risk capital which follows the logic of Basel II and III, incorporating credit, market, operating and other specific risks in the calculation. For JPM the economic risk capital based on these dimensions was $78.4 billion to which they add goodwill and “Other” to reflect a firm view on what rating agencies and regulators demand to report a total common equity of $161.5 billion while the reported common equity is $168.3 billion. JPM provides detailed descriptions of book equity, Tier 1 and Tier 2 capital, risk-weighted assets and economic capital in its 2010 annual report (page 103).
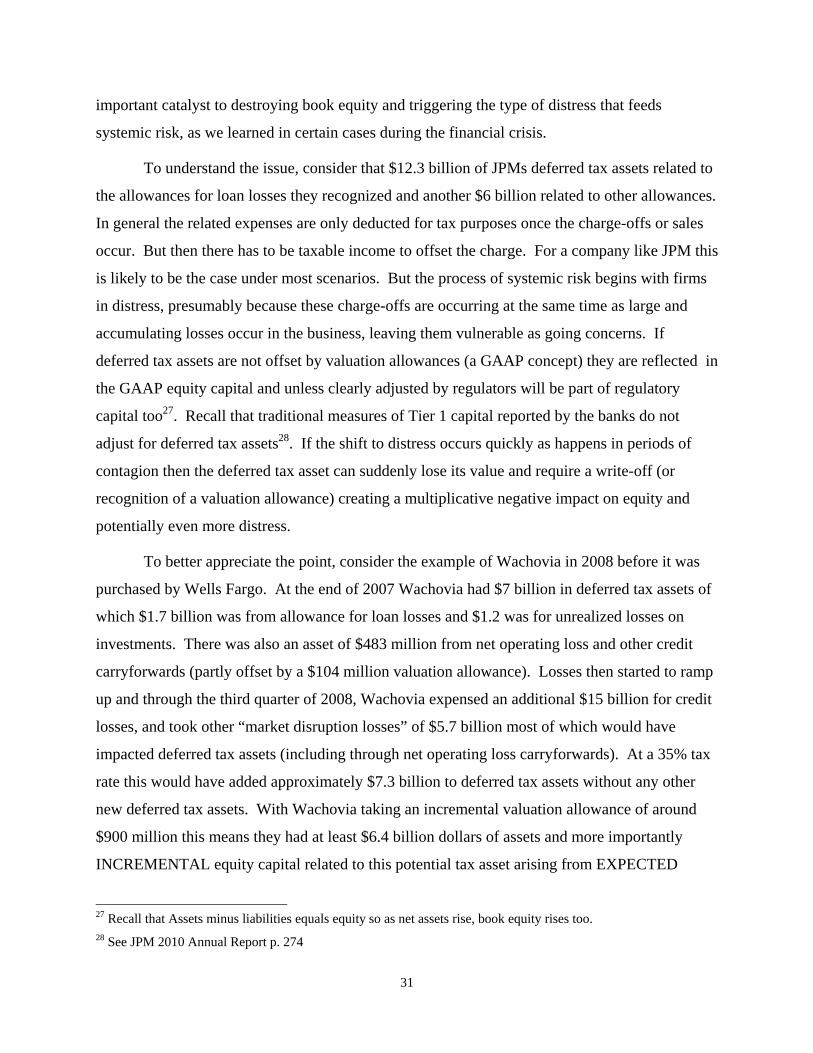
31
important catalyst to destroying book equity and triggering the type of distress that feeds
systemic risk, as we learned in certain cases during the financial crisis.
To understand the issue, consider that $12.3 billion of JPMs deferred tax assets related to
the allowances for loan losses they recognized and another $6 billion related to other allowances.
In general the related expenses are only deducted for tax purposes once the charge-offs or sales
occur. But then there has to be taxable income to offset the charge. For a company like JPM this
is likely to be the case under most scenarios. But the process of systemic risk begins with firms
in distress, presumably because these charge-offs are occurring at the same time as large and
accumulating losses occur in the business, leaving them vulnerable as going concerns. If
deferred tax assets are not offset by valuation allowances (a GAAP concept) they are reflected in
the GAAP equity capital and unless clearly adjusted by regulators will be part of regulatory
capital too27. Recall that traditional measures of Tier 1 capital reported by the banks do not
adjust for deferred tax assets28. If the shift to distress occurs quickly as happens in periods of
contagion then the deferred tax asset can suddenly lose its value and require a write-off (or
recognition of a valuation allowance) creating a multiplicative negative impact on equity and
potentially even more distress.
To better appreciate the point, consider the example of Wachovia in 2008 before it was
purchased by Wells Fargo. At the end of 2007 Wachovia had $7 billion in deferred tax assets of
which $1.7 billion was from allowance for loan losses and $1.2 was for unrealized losses on
investments. There was also an asset of $483 million from net operating loss and other credit
carryforwards (partly offset by a $104 million valuation allowance). Losses then started to ramp
up and through the third quarter of 2008, Wachovia expensed an additional $15 billion for credit
losses, and took other “market disruption losses” of $5.7 billion most of which would have
impacted deferred tax assets (including through net operating loss carryforwards). At a 35% tax
rate this would have added approximately $7.3 billion to deferred tax assets without any other
new deferred tax assets. With Wachovia taking an incremental valuation allowance of around
$900 million this means they had at least $6.4 billion dollars of assets and more importantly
INCREMENTAL equity capital related to this potential tax asset arising from EXPECTED
27 Recall that Assets minus liabilities equals equity so as net assets rise, book equity rises too. 28 See JPM 2010 Annual Report p. 274
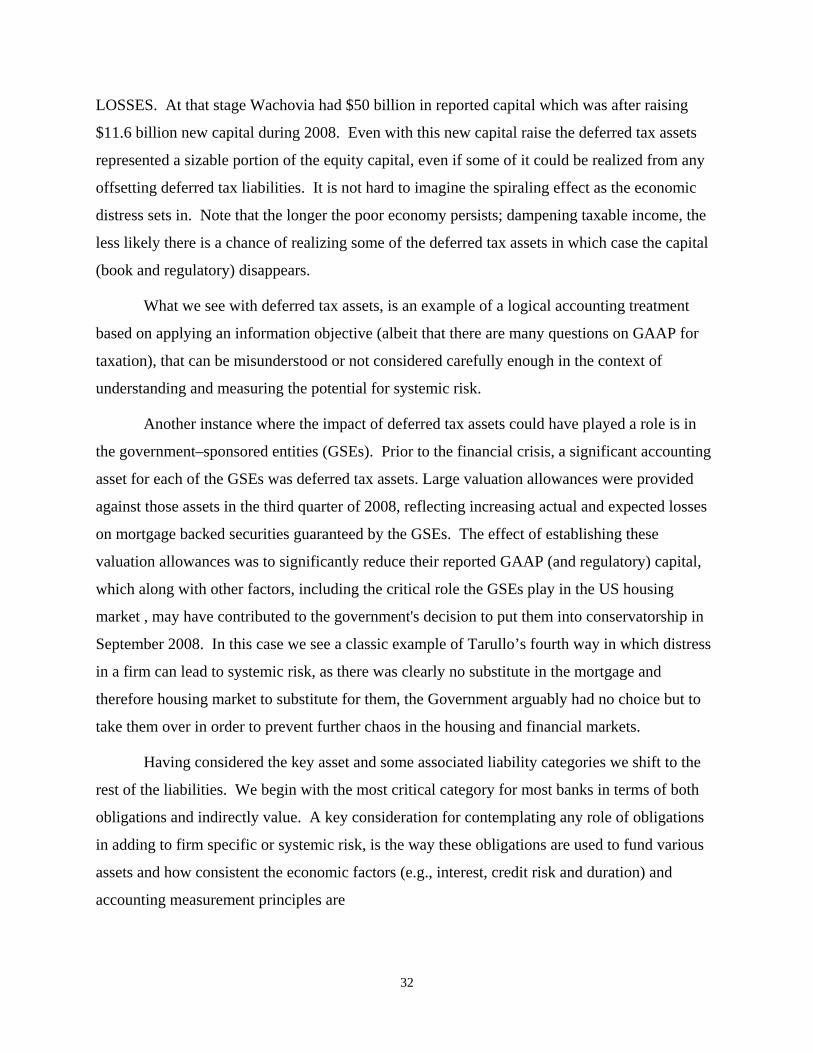
32
LOSSES. At that stage Wachovia had $50 billion in reported capital which was after raising
$11.6 billion new capital during 2008. Even with this new capital raise the deferred tax assets
represented a sizable portion of the equity capital, even if some of it could be realized from any
offsetting deferred tax liabilities. It is not hard to imagine the spiraling effect as the economic
distress sets in. Note that the longer the poor economy persists; dampening taxable income, the
less likely there is a chance of realizing some of the deferred tax assets in which case the capital
(book and regulatory) disappears.
What we see with deferred tax assets, is an example of a logical accounting treatment
based on applying an information objective (albeit that there are many questions on GAAP for
taxation), that can be misunderstood or not considered carefully enough in the context of
understanding and measuring the potential for systemic risk.
Another instance where the impact of deferred tax assets could have played a role is in
the government–sponsored entities (GSEs). Prior to the financial crisis, a significant accounting
asset for each of the GSEs was deferred tax assets. Large valuation allowances were provided
against those assets in the third quarter of 2008, reflecting increasing actual and expected losses
on mortgage backed securities guaranteed by the GSEs. The effect of establishing these
valuation allowances was to significantly reduce their reported GAAP (and regulatory) capital,
which along with other factors, including the critical role the GSEs play in the US housing
market , may have contributed to the government's decision to put them into conservatorship in
September 2008. In this case we see a classic example of Tarullo’s fourth way in which distress
in a firm can lead to systemic risk, as there was clearly no substitute in the mortgage and
therefore housing market to substitute for them, the Government arguably had no choice but to
take them over in order to prevent further chaos in the housing and financial markets.
Having considered the key asset and some associated liability categories we shift to the
rest of the liabilities. We begin with the most critical category for most banks in terms of both
obligations and indirectly value. A key consideration for contemplating any role of obligations
in adding to firm specific or systemic risk, is the way these obligations are used to fund various
assets and how consistent the economic factors (e.g., interest, credit risk and duration) and
accounting measurement principles are
33
Deposits
Deposits are a key component of a (commercial) bank’s value proposition and
susceptibility to systemic risk. They represent obligations to depositors and are usually primarily
payable on demand. Figure 2 shows that for BHCs deposits are usually the largest funding
source. The average was between 36% and 39% of total assets from 2000 through 2005. In 2006
we saw a decline to the 31 to 33% range until the end of 2010 since when the average deposits
have started to rise again. They also represent a significant source of inexpensive funding and
hence a source of value (an intangible asset). In 2010 JPM had deposits of $930.4 billion (equal
to 43.9% of total assets). The deposits include $4.4 billion measured at fair value (mainly
structured notes) although the carrying value and fair value differ by only $1.1 billion. One
reason for this is that U.S. GAAP requires that the fair value of deposit liabilities with no stated
maturity be equal to their carrying value.
Exhibit 5 shows the breakdown of deposits held by JPM at December 31, 2010. We see
that around 25% of the deposits are non-interest bearing with no stated maturity. Of the interest-
bearing deposits $543 billion have no stated maturity and $147.9 billion are time deposits most
of which ($132 billion) mature within 1 year. So clearly most of these liabilities are legally of a
short term nature and could be payable with minimal notice, which is why they are perceived as
a potential source of risk. The reality, especially with a highly regarded bank like JPM, is that
the deposits are likely to continue to be invested for long periods if not indefinitely, and thus
provide a potentially stable and cheap form of funding for investments. These stable deposits are
considered “core deposits” and given the low cost of these funds provide an intangible value that,
as mentioned, gets measured when banks are acquired, but not in the ordinary course of business.
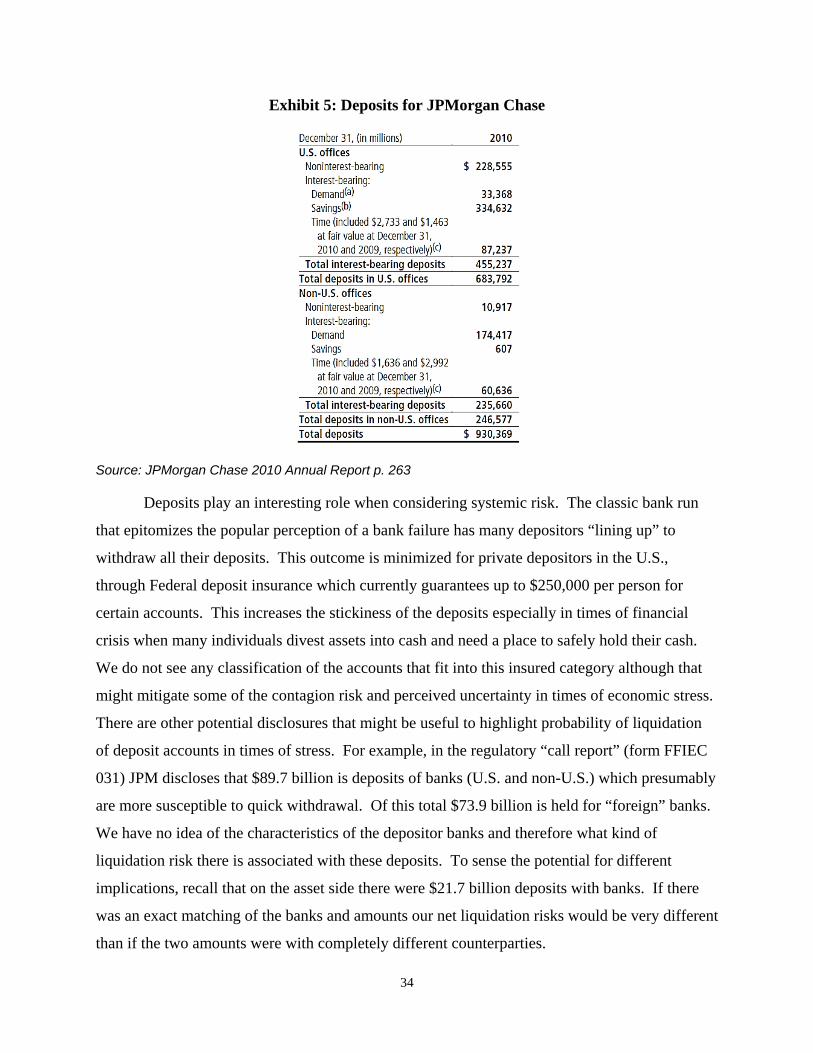
34
Exhibit 5: Deposits for JPMorgan Chase
Source: JPMorgan Chase 2010 Annual Report p. 263
Deposits play an interesting role when considering systemic risk. The classic bank run
that epitomizes the popular perception of a bank failure has many depositors “lining up” to
withdraw all their deposits. This outcome is minimized for private depositors in the U.S.,
through Federal deposit insurance which currently guarantees up to $250,000 per person for
certain accounts. This increases the stickiness of the deposits especially in times of financial
crisis when many individuals divest assets into cash and need a place to safely hold their cash.
We do not see any classification of the accounts that fit into this insured category although that
might mitigate some of the contagion risk and perceived uncertainty in times of economic stress.
There are other potential disclosures that might be useful to highlight probability of liquidation
of deposit accounts in times of stress. For example, in the regulatory “call report” (form FFIEC
031) JPM discloses that $89.7 billion is deposits of banks (U.S. and non-U.S.) which presumably
are more susceptible to quick withdrawal. Of this total $73.9 billion is held for “foreign” banks.
We have no idea of the characteristics of the depositor banks and therefore what kind of
liquidation risk there is associated with these deposits. To sense the potential for different
implications, recall that on the asset side there were $21.7 billion deposits with banks. If there
was an exact matching of the banks and amounts our net liquidation risks would be very different
than if the two amounts were with completely different counterparties.
35
Analogously, some deposits are presumably “invested” in loans with the same
counterparties. Subject to legal constraints there are plausibly different levels of liquidity and
loss risk in times of stress if the asset and liability are with the same counterparty than if they are
different. We are not aware of any public disclosures that identify this and a bank’s internal
systems would need to be highly sophisticated to have this kind of internal management
information29.
The recognition of deposits at their face or carrying value with no recognition of potential
matching with assets or recognition of the value of “core deposits” has some interesting and
potentially misleading implications in periods of stress especially when some firms move into
distress. Consider a scenario where the loans of Bank A have to be marked down and the bank is
in distress, depositors, especially if their deposits exceed the federal insurance limits, will
withdraw their funds exacerbating the distress, those deposits will shift into other banks
considered “safe” (like JPM), which we will call Bank B. Analogously Bank B’s own depositors
will have fewer options to invest their low yielding liquid assets especially if asset values are
declining as the economy is stressed and contagion grows. So the source of cheap funding and
the stickiness of those funds will grow for the “stronger” Bank B but the opposite would occur
for the weaker Bank A. The value of this intangible asset for Bank B is not recognized by the
accounting system unless Bank B is acquired. The logic for not including this is that recognition
would require managers to provide a potentially unreliable estimate of the fair value of an
intangible asset that is possibly volatile especially in times of stress. On the asset side, for both
Banks A and B, the loans (that are potentially funded by the deposits that are assumed to be
“core” and therefore of longer economic duration) will start deteriorating in value especially if
they are linked to assets with declining prices, like mortgages.
For Bank A, the asset values are declining, and with skittish depositors withdrawing
funds the bank will be under stress and the accounting will reflect most of this. On the other
hand for Bank B we see an imbalance in the reporting. The asset values will be declining which
leads to lower reported capital and a potential source of additional uncertainty and contagion.
But the persistence and improved availability of low or non-interest bearing deposits will
29 We do not have private information on JPM’s systems but presume that this information is available to them. We have some anecdotal evidence that this is not true for all banks and it would certainly take time to set up after any bank merger.

36
contribute to the economic stability of the bank, except that the accounting system does not
require fair valuation of the core deposits on an ongoing basis. If this economic value was
recognized the capital may be little affected or even improved. The irony here is that for Bank
B, it is the lack of fair value accounting for the intangible value of the low yield deposits, which
is enhanced in times of stress, combined with the necessary application of a partial fair valuation
of many of the assets via the lower of cost and market or other than temporary impairment
requirements, that leads to a potentially distorted view of stress that may in itself create distress
even in sound banks like B.
We are not advocating an automatic application of fair value accounting for core deposit
intangibles as such measures can be unreliable especially in times of economic stress if exit
values are used30. In general, intangible assets are difficult to value as they are not traded and
require making predictions about future operations, including demand and cost data, while many
tangible assets can be valued more readily using exit values or appraisals based on related
transactions. The anecdote is illustrative of the problem, the core deposits in Banks A and B
would have had a positive value until the economic stress began then the value of A’s deposits
would evaporate while B’s would go up until the period of stress went down. We would have to
apply a firm-specific “value-in-use” approach to valuation which is inconsistent with current
U.S. GAAP.
One idea to increase our ability to understand the association between deposits and
potential stress or stress reduction, as an input to understanding the impact on systemic risk
would be to provide better information about the types of depositors, the patterns of deposits and
withdrawals from the deposits and the extent to which they are matched with the banks’ assets in
terms of counterparty, duration and class of borrowing/lending.
Commercial Paper and Other Borrowed Funds
Commercial paper is another source of short-term bank funding that is small in relative
terms but not necessarily in terms of its impact, as it can be a source of rollover risk during
30 Interestingly, in May 2010 the FASB issued an ED on accounting for financial instruments that proposed showing core deposits at a “current value” that takes into account the expected run-off of deposits and its value as a source of low or no cost financing and would have presented both the face amount of the core deposits and the higher current value on the face of the balance sheet, with detailed footnote information relating to the calculation of the current values.

37
economic stress. In 2010 JPM had commercial paper of $35.4 billion (equal to 1.8% of total
assets) and other borrowed funds of $57.3 billion (equal to 2.7% of total assets). Of the other
borrowed funds JPM discloses that $37.8 billion of the total is secured by assets of $95.3 billion.
This is helpful to know but would be of more use if we knew which assets these were.
Accounts Payable and Other Liabilities
In 2010 JPM had accounts payable and other liabilities of $170.3 billion (equal to 8.0%
of total assets). These include $95.4 billion of payables to customers, brokers, dealers and
custodial agents so are generally unavailable for funding purposes in times of distress as these
counterparties will demand payment and not transact rather than allow the payables to be
outstanding, exacerbating the stress on the financial institution. As discussed with other assets,
there is a potential for a direct association with the receivables to customers, brokers, dealers and
custodial agents and it would be beneficial to understand how the assets and liabilities are
“matched” by counterparty and duration.
Beneficial Interest Issued by Consolidated Variable Interest Entities (VIEs)
Companies, and in particular financial institutions, often have interests in and
arrangements with so-called special purpose entities (SPEs), also known as Variable Interest
Entities (VIEs). Such entities may have been created or sponsored by the financial institution or
by another party to effectuate securitizations or other forms of asset-backed lending transactions.
Whether or not the assets, liabilities and activities of a particular SPE have to be included in the
financial statements of a financial institution (that is, whether the financial institution must
“consolidate” the special purpose entity) depends on the nature and extent of involvement by the
financial institution in the special purpose entity. Prior to the recent financial crisis, the
underlying assets and liabilities were often held off balance sheet rather than consolidated.
Accordingly, only the portion of the risk in the net assets that is owned or “retained” by the
sponsor was recorded and reported on the balance sheet of the sponsor. The debate of who
“controls” the assets has been a difficult one for U.S. and international standard setters to
resolve. Following perceived abuses of VIEs during the credit crisis the accounting rules were
tightened so that more VIEs are now consolidated and additional disclosures are now required
relating to both on an off-balance sheet VIEs and the relationships between the reporting
enterprise and these VIEs.
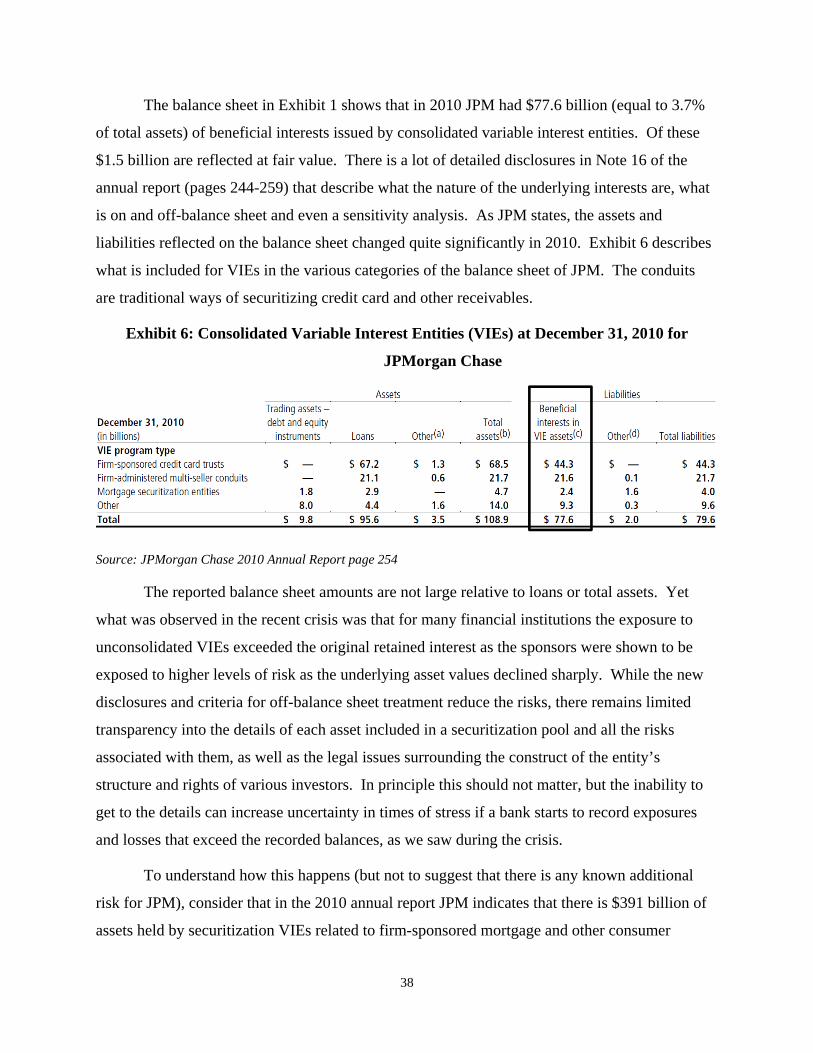
38
The balance sheet in Exhibit 1 shows that in 2010 JPM had $77.6 billion (equal to 3.7%
of total assets) of beneficial interests issued by consolidated variable interest entities. Of these
$1.5 billion are reflected at fair value. There is a lot of detailed disclosures in Note 16 of the
annual report (pages 244-259) that describe what the nature of the underlying interests are, what
is on and off-balance sheet and even a sensitivity analysis. As JPM states, the assets and
liabilities reflected on the balance sheet changed quite significantly in 2010. Exhibit 6 describes
what is included for VIEs in the various categories of the balance sheet of JPM. The conduits
are traditional ways of securitizing credit card and other receivables.
Exhibit 6: Consolidated Variable Interest Entities (VIEs) at December 31, 2010 for
JPMorgan Chase
Source: JPMorgan Chase 2010 Annual Report page 254
The reported balance sheet amounts are not large relative to loans or total assets. Yet
what was observed in the recent crisis was that for many financial institutions the exposure to
unconsolidated VIEs exceeded the original retained interest as the sponsors were shown to be
exposed to higher levels of risk as the underlying asset values declined sharply. While the new
disclosures and criteria for off-balance sheet treatment reduce the risks, there remains limited
transparency into the details of each asset included in a securitization pool and all the risks
associated with them, as well as the legal issues surrounding the construct of the entity’s
structure and rights of various investors. In principle this should not matter, but the inability to
get to the details can increase uncertainty in times of stress if a bank starts to record exposures
and losses that exceed the recorded balances, as we saw during the crisis.
To understand how this happens (but not to suggest that there is any known additional
risk for JPM), consider that in the 2010 annual report JPM indicates that there is $391 billion of
assets held by securitization VIEs related to firm-sponsored mortgage and other consumer

39
securitization trusts, yet only $8.6 billion are for assets held in consolidated VIEs and they report
total interests held of only $3.6 billion (page 247). While there may indeed be no exposure
beyond these amounts for JPM, they provided additional disclosures on “loan delinquencies and
net charge-offs” for off-balance sheet securitization with stated credit exposures of $326.5
billion, of which $65.1 billion were no longer accruing interest and against which $12.8 billion
had been charged off as “losses realized upon liquidation of the assets held by off-balance sheet
securitization entities” (page 259). JPM also stated that they had sold originated and purchased
mortgage loans primarily to U.S. government agencies for which the carrying value at December
31, 2010 was $156.6 billion. JPM adds that “The Firm has to repurchase certain loans sold to
U.S. government agencies (predominantly loans securitized in Ginnie Mae pools) if they reach
certain delinquency triggers” (page 257). They go on to say they then consolidate these assets
and liabilities which will be at the fair value at the time of repurchase. In times of economic
stress, this mix has the potential to create additional uncertainty and contagion for depositors and
investors. As we saw in the midst of the most recent crisis, when the disclosures were not as
good as they are today, investors observed financial institutions taking charges for the fair value
of assets that were being purchased out of securitization trusts and saw the large off-balance
sheet exposures that remained and asked the question “how much more of this is there?”. While
there is still real value in most of these loans given the underlying collateral. As we recall there
was significant uncertainty about the “real” exposure and who was going to have to take the final
write-offs. So ironically, by having the total exposures reported at each entity without a system
wide amount and attribution of real risks, it was natural for the uncertainty-led contagion that
Tarullo refers to occur as many investors felt uncomfortable about knowing what the limits of
such exposures might be. Given the subsequent continuing write-downs by major financial
institutions as well as the litigation against many of these institutions for some restitution for the
losses occurred in the VIEs some of the fear about higher losses was indeed justified.
One reason that it is hard to regulate what the retained interest and risks are in SPEs and
securitization pools is that while for a single entity there can be a legally limited liability
assuming no fraudulent intent when it was established, the reality is that many institutions have
recurring securitizations. In such cases, there is a strong longer run economic incentive to
“compensate” the investors for losses incurred if it is important to seek funds from these
investors for future transactions. If a bank has had such a practice and then chooses not to do

40
this in times of general economic stress then the perception can easily arise that the bank is
“stressed” and the “run” to get investments out will begin. There is no real accounting solution
to this issue. Full consolidation of all off-balance sheet VIEs that some people argue for will
balloon the asset and liability side of the balance sheets and make the bank appear more
leveraged than it really is31. Moreover, full consolidation, on its own and without additional
disclosures and risk quantifications, will do little to provide the transparency of understanding
the risk of the underlying assets and the bank’s exposure to that risk. For that we would need the
voluminous disclosure of each counterparty, the collateral and how these change over time,
analogous to what we described under loans and the other asset categories.
Long-term Debt
Long-term debt is a more expensive source of funding than deposits. Depending on what
assets it is used to fund it will also be more stable. For example, a simple debt issue that is
repayable in five years can fund any investment that is 5 years or less in duration and the bank
will be assured of not having the funding withdrawn subject to other contractual conditions. In
such cases, as long as the crisis does not persist for too long and there are no breaches of
covenants, this funding source cannot usually be withdrawn and can therefore help to provide a
buffer against systemic risk. In 2010 JPM had long-term debt of $247.7 billion (equal to 12.1%
of total assets).
Long-term debt by definition means that at issuance it does not have to be repaid for at
least twelve months. For current and past issuances, JPM’s long term debt note (Note 22) shows
what principal is repayable within one year, one to 5 years and after five years so that a laddering
of when debt rollover occurs can be estimated. There are also filings for any public issuance
which allow investors to get very detailed information on the debt. Using this information we
can see the extent the assets are funded with long-term debt that does not have to be rolled over,
which can in turn reduce the systemic risk that might occur from the impact of deteriorating asset
values.
A relatively recent change in accounting for long-term debt has been the use of fair value
to measure some debt which has had some impact on perceptions about a bank’s systemic risk.
31 Many calculations of leverage use a measure of equity against total assets, so adding the gross amounts to the asset side of the balance sheet with no change in equity will clearly add to a leverage ratio, calculated that way.
41
For JPM $38.8 billion of its 2010 year end long term debt is measured at fair value. There is an
interest yield and principal amount established when debt is first issued based on market interest
rates and the credit risk of the issuing bank. The “fair value” of the debt changes when interest
rates or the credit risk of the bank changes. Economically and mechanically this is correct and is
calculable. But it has always been disconcerting to many investors and observers of accounting
regulation to believe that there is a meaningful gain to shareholders from the increased credit risk
of the bank, especially in times of crisis. Recognizing such a gain may make sense if the bank
has sufficient cash and can repurchase the debt or it is otherwise able to monetize the economic
gain, for example, through the use of derivatives. But in times of crisis it is unlikely these excess
funds exist or that the gain can otherwise be readily monetized, especially because if the debt
was replaced with newly priced debt the gain would be offset by significantly higher costs for the
new debt essentially nullifying any gain. On the other hand, if the debt is being used to match
fund assets that are being measured on a fair value basis and both are intended to be retained
until maturity, then adjusting the assets without matching the change in the liability arguably
biases the earnings and the equity capital of the business. To be more specific, if the debt is used
to fund loans which are not delinquent but are being marked down because of the contagion
effects of uncertainty, then marking down the assets without adjusting the liabilities would
overstate the real risks. An analogous argument can be made for the impact of interest rate
changes on fair values, again on the basis of matching. Thus, there is an argument to be made
that fair valuing long term debt can in fact be countercyclical, and hence reduce systemic risk.
An alternative view is that because measuring debt at its fair value is a recent and quite
controversial accounting practice, if investors and commentators do not believe that the fair
valuation of debt makes sense, then using a gain on debt from worsening credit risk to offset
losses can exacerbate concerns of uncertainty and actually feed the contagion. Casual
observation suggested this was the case when the debt valuation adjustments (DVA) were being
reported in the midst of the crisis. To help investors and regulators better understand the
economic value of the debt and valuation adjustments made it would be helpful to know the
assets which are being funded by the debt so that the matching of the future cash flows for both
42
could be understood. We are not aware of such disclosures in practice32. This is an area that
needs more research in assessing how investors perceive and value the DVA, and how this has
evolved since the crisis as its application continues.
Stockholders’ Equity
In 2010 JPM had $176.1 billion (equal to 7.9% of total assets) of shareholders equity.
Book equity or shareholders capital is what shareholders have invested over time to cover the
risk of loss in the firm’s net assets. In reality, as we have discussed, because of the necessity to
maintain the accounting equation the amount of equity really depends on the asset and liability
measurements and the ability of these net assets to generate more net assets (earnings). Equity
(or capital) is considered to be the most expensive form of funding because it is the riskiest, so
managers and shareholders arguably want this to be as low as feasible.
As we discussed with goodwill and intangibles, the many definitions of equity capital can
be confusing, especially in times of extreme uncertainty and economic stress. From a systemic
risk perspective the more capital there is the easier it is for the firm to absorb value-based losses.
It is also important to remember that even if there is sufficient capital there can still be a liquidity
driven crisis because there is nothing that states what form the assets must take that “offset” or
“match” the capital. So even if the capital is “sufficient” to absorb loan write-downs, if the
depositors want the cash unless there are liquid assets available a crisis and panic can occur.
One way regulators, investors and the financial press gauge and allude to the riskiness
inherent in the amount of capital is the leverage. This is often calculated as the ratio of equity to
total assets. However, this is ingenuous as should be clear from our discussion in this chapter.
To the extent there is any matching of assets and liabilities then the simple leverage ratio is
overstated. Also there is a big difference between the risk of treasury bonds and investments in
CDOs that are based on sub-prime mortgage loans written in 2007. To treat these as equivalent
in a leverage ratio borders on the absurd. This notion is recognized by bank regulators in their
use of risk-weightings on assets in determining an appropriate level of capital.
32 The FASB issued an exposure draft in May 2010 that proposed an approach for matching the valuation methods used for matched or related financial assets or liabilities. It is our understanding that practitioners indicated that this would be difficult to operationalize.

43
Net Income
Banks and most financial institutions generate a significant portion of their income from
the spread between the interest received on their loans and other investments and the interest
paid on the customer deposits and other funding sources. In 2010 this amounted to $51 billion
for JPM. Interest is generally accounted for based on a fixed rate set at the time a loan is issued
or a variable rate depending on the loan agreements. As we discussed in the relevant balance
sheet categories, the funding of loans by deposits especially if they are non-interest bearing
creates a positive spread for the banks that is seen in net interest income. When interest rates
change as they often will as monetary authorities deal with economic cycles and inflation, the
spread will be impacted by the balance of fixed and variable rates and the duration of the
relevant balance sheet categories. As we discussed the absence of valuing the intangible asset
embedded in such spreads especially for “core” deposits means that the understanding of this
correlation becomes more important in assessing the long run risks of the firm.
The other major sources of revenue include fees and commissions, and gains and losses
from trading securities and principal transactions, which together also totaled $51.7 billion in
2010 for JPM. These revenues, especially the fees and commissions arise from relationships and
a bank’s reputation. The value of these intangibles is also not recognized under current
accounting rules and while accounting for the value of the employees is contemplated from time
to time, primarily by academics, the lack of reliability in these measures has kept them off the
balance sheet. Nevertheless, the value is reflected in higher margins and returns on equity. The
stronger these relationships are and the more a bank can sustain them during a crisis, the more
valuable they are. As this intangible asset value is unrecorded the capital is often understated,
and it is important for regulators trying to stem systemic risk to try to measure the ability of the
companies to monetize this value.
While lending relationships and similar intangible assets may provide some “buffer” at a
time of financial crisis, they could in some cases lead to increased short-term exposures and
losses. In particular, banks with valuable relationship intangibles may be more inclined to lend
at times of financial stress to maintain their customer relationships. Similarly, reputable banks
may be more likely to absorb losses from securitizations and other off-balance sheet activities to
maintain these sources of profits as well as their reputation.

44
The primary costs include costs for labor, occupancy, technology, professional services
and credit losses. As mentioned when discussing loans, there is extensive disclosure about non-
performing loans and the recording of credit losses. We will discuss these further below with
respect to the question of pro-cyclicality. In general there is much less disclosure about the costs
and to some extent the relative comparative advantage of the resources that underlie the labor,
technology and occupancy expenses. Yet these can often be a significant source of future value
and one of the dilemmas banks (and other companies) face especially in the peaks and valleys of
business cycles is retaining the most valuable talent. We are not suggesting this be measured as
a balance sheet intangible, but it would be beneficial to have much more information about the
talent through disclosures. Even if companies are reluctant to do this in public disclosure it
seems that regulators should take this into account when assessing the inherent risks in a single
firm and the system as a whole. An interesting research question is what characteristics of key
personnel are needed to mitigate taking excessive risks and managing stressed environments.
The follow up analysis would consider what measures or disclosures would be feasible to reflect
these characteristics.
The primary revenues and costs that influence or are impacted by economic crises and
systemic risk and are associated with the question of whether accounting enhances pro-
cyclicality are net interest, principal and securities transactions, and credit losses. We discuss
this in the next section.
Off balance sheet sources and commitments
The last item in the financial statements we consider is the commitments that a bank has
made or received. In addition to the off-balance sheet amounts related to VIEs, in its 2010
annual report JPM has extensive disclosures on off-balance sheet lending-related financial
instruments and other guarantees (pages 95-101) indicating total commitments of just less than
$955 billion although $547 billion of this is for credit card commitments, most of which will
never be taken up at any one point in time. These commitments include commitments to
consumers and companies and will generate revenues without the loans being extended. Many
of these commitments have a higher probability of being utilized in times of economic stress.
The disclosures are made in the MD&A and were added as a requirement after the Enron and
other scandals of the early 2000s. This is clearly helpful disclosure but as with other loans it
45
would be helpful to know more about the counterparties, their credit profiles, and the
probabilities of drawdown especially at times of severe stress. Working in the opposite
direction, JPM also has commitments made to it by other banks and guarantors that provide some
insurance in times of stress. Again more details on counterparties would facilitate managing
uncertainty during times of stress, especially as insurers and guarantors can also be under stress.
We are unaware of any research on the question of how useful current disclosures of
commitments and contingencies have been for investors or regulators. But it seems to be an
important one to explore.
Another source of off-balance sheet commitments is derivatives. As JPM states in Note 6
of its 2010 annual report, “Derivative instruments enable end-users to modify or mitigate
exposure to credit or market risks. Counterparties to a derivative contract seek to obtain risks
and rewards similar to those that could be obtained from purchasing or selling a related cash
instrument without having to exchange upfront the full purchase or sales price” (page 191).
Most of these derivative contracts have offsetting receivables and payables on set-up. Thereafter
they are marked to fair value over time with the gains and losses being recorded mostly in
income, and the related net receivable or payable being shown on the balance sheet. Although
there is some risk for the firm from the derivative contracts, it is not going to be the trillions of
dollars in notional amounts as disclosed in the notes to the accounts at year-end 2010. We could
spend significant space conjecturing on the impact of derivatives and derivative accounting in
creating uncertainty in times of economic stress. But much of this would be repetitive of the
general theme that without knowing significantly more about the details of the actual contracts
and counterparties it is impossible for a user of the financial statements to make informed
judgments about the underlying risks in the derivative balances. That said, if market participants
begin to see large losses being taken on a derivatives book in times of economic stress they will
look to the disclosed nominal amounts and wonder how bad it can get. Unless companies can
provide some viable indications of downside risk the uncertainty dimension that feeds contagion
and systemic risk will inevitably occur. Given the opacity of the risks in many derivatives and
some of the bad outcomes we have seen over the last decades, it is not clear that the senior
manager of firms understand the embedded risks. An interesting area for research would be to
assess alternative ways to measure and report these boundaries and then to assess how investors
and regulators interpret or use them.

46
Again we stress that it is not the fair value accounting itself that creates the risk, rather it
is the opacity in the underlying risks together with the huge nominal exposures that can lead to
greater systemic risk than merited the underlying economic reality.
Accounting, Pro-cyclicality and Systemic Risk: Summary Thoughts
As discussed, through the crisis and at the time of writing, most retained loans (that are
not traded) are measured at (amortized) cost with an adjustment for probable losses via a reserve
based on current conditions. If the loan is considered to be uncollectible and the impairment is
not considered to be temporary then it is written down. Securities held as investments that are
“available for sale” and measured at fair value do not impact periodic income unless they are
sold or deemed to be impaired. The question at hand is whether this accounting approach might
add to the business cycle, i.e., is procyclical?
There are mixed views on this but there are valid arguments as to why it is pro-cyclical.
Consider what occurs in the early stages of the positive side of the business cycle. At that time
interest rates are often low as monetary authorities do not fear inflation and may choose to
stimulate the economy. Banks that have funds deposited choose to lend to the least risky
borrowers and capture the positive spread that exists. The deposit base available to lend
increases as economic activity improves providing more incentive for banks to lend. Even when
interest rates rise as the economy heats up, there is initially an improvement in the spread
between deposits and loans. As high credit quality lending opportunities are exhausted, banks
start to offer funds to those with higher credit risk. We are not just alluding to individuals, this
phenomenon applies to all loans including for mortgages, commercial businesses and others too.
Exacerbating the incentive for banks to follow this path to lending to higher risk customers is
that they can charge these customers a higher nominal interest rate to pay for the higher risk.
How does the accounting deal with this?
If these investments (loans) were made through a trading desk it would be charged a
credit valuation adjustment (CVA) for the credit risk of the counterparty or transaction. For
internal purposes the related income would only be recognized once the loan or investment is
repaid. This is simply an application of accrual accounting where expected costs associated with
the revenue generation process are accrued at the inception of the sale. The simplest analogy is a
47
provision for warranties. In the case of loans there is often a specific risk embedded in the price.
We only have to think of the high rates of interest charged on credit card balances that are not
paid on their due date. The interest rates charged are generally several percentage points higher
than other secured loans presumably because the banks know they are taking on more credit risk.
But current accounting rules do not allow such accruals or adjustments to be made, partly due to
a fear that recognizing potential losses before there is historic evidence that the loss will occur
will lead to the creation of “cookie-jar” reserves by managers who want to distort the underlying
economic activity, and will use these reserves to smooth income and hide bad news, either
because they are nefarious or they have skewed short-term incentive contracts. A view we think
exaggerates the reality, especially if the company incorporates CVAs in their internal
performance measurement systems. So at the time of writing, credit or loan loss reserves can
only be established based on current conditions and historic patterns33. In the upside of a
business cycle banks are required to report all the interest income without any offset for the
credit risk they are undertaking. Thus there is almost no short-term downside to taking on this
credit risk and chasing income. This activity of taking excessive risks, may be exacerbated to the
extent that incentive compensation is based on reported performance, and managers and
compensation committees do not have transparency into the underlying credit risks of the
counterparties. As we indicated, true counterparty information is unavailable to most investors
and in many cases to senior managers. We question whether any single institution really knows
the true system-wide credit risk of many of their borrowers on a regular basis, as maintaining
such data is burdensome and costly. Of course, as soon as the cycle peaks and starts to head
down, the credit risks start to become realized and now the banks have to add to their loan loss
reserves at the same time that they need to make actual charge offs. At this stage there are also
going to be fewer borrowers especially with good credit records and rates will start to head
down, all of which add to the downward pressure on business activity and add to the potential for
systemic risk.
There are other dimensions to this. Investors and regulators demand certain levels of
capital to support the risk of loss and are currently seeking more of the assets to be highly liquid.
This is negative for a bank’s value as equity is the highest cost of funding and liquid assets earn
33 At the time of writing the FASB and IASB are working on a joint project to change the accounting regulations to require more forward-looking approaches to provisioning for credit losses.
48
the lowest rates. What we regularly see happening with the current system of loss reserving that
uses current and historical information is that the reserves get built up (and losses are taken)
adding to pressure on equity capital. Regulators and investors do not seem to be comfortable
allowing the capital levels or ratios to go down to deal with these losses keeping the buffers at
former levels or even in some cases raising them adding to procyclicality.
This is the pro-cyclicality created by current accounting for credit risks. There is another
missing element which is the impact on the values of loans and securities carried at amortized
costs. When interest rates change the economic value of fixed-rate assets (and liabilities) will
change in the opposite direction. So as interest rates rise existing loans fall in value and vice
versa. This would be recognized if fair value accounting was applied. In principal at least, fair
value accounting would also recognize expected credit risks. Thus, the irony is that it is the
absence of fair value accounting on an ongoing basis that adds to the pro-cyclicality of
accounting for banks.
We have some concerns about the ability of fair values based on current exit prices to
reflect all the components of economic risk, as we believe that there are times when prices
deviate from economic fundamentals34. We argue that the accounting policy should recognize
the economic credit risks taken on at the time loans are advanced. If these CVAs were recorded
the reserve would provide flexible “capital buffers” that would dampen the impact of economic
cycles and reduce the potential for systemic risk. In addition there would be less incentive for
the institutions to chase the riskier credits to enhance reported current earnings. Research on
how to measure and apply an objective credit reserve for all types of loans would be valuable,
but it will be difficult without access to private data that is rarely available to those outside an
institution.
A similar pattern will apply to many securities. This is particularly true of loans or
securitized products collateralized by property when prices are increasing during the upside of
the cycle. If a loan is secured by a property that is rising in value then even if the borrower is
deemed to have a compromised credit, if the loan to value ratio were around one then current
accounting would deem it to be inappropriate to take any provision for potential credit losses.
Similarly if the underlying loans (mortgages) had been securitized there could even be an
34 See Harris, Estridge and Nissim (2009) p 195.

49
increase in the value of the securities booked into income or other comprehensive income and
hence in equity. This may seem to be economically reasonable especially in the first stages of a
new upward trend in a cycle. But as we move to higher and higher levels should the same logic
apply? The stated objective of financial reporting is that it must apply accounting measures in a
neutral manner. Traditionally in accounting we do not revalue property or equipment because
such asset values are considered unreliable and because current fair value regulations require an
exit value rather than a value in use concept. So if an exit-based fair value approach was applied
to equipment, a firm would probably have to take an immediate fair value loss as soon as the
equipment is delivered and put to use as its exit value will have gone down35. Yet when
contemplating the credit risk inherent in loans secured by property the approach to credit analysis
by lenders, regulators, rating agencies, investors and auditors, seems to be accept the higher
values thereby accepting an implicit revaluation. In principle, this is fine unless we enter periods
like Japan in the late 1980s and the U.S. in the mid-2000s when property prices rose to levels
that many felt were unsustainable compared to economic fundamentals. To avoid this use of
overvalued assets would require some recognition of the extent to which collateral prices have
deviated from some economically reasonable trend. This is obviously easier to analyze ex post
and would introduce a degree of judgment into the accounting for reserves that many academics,
investors and regulators would undoubtedly be uncomfortable with.
Ironically best practices for internal management of financial institutions attribute
revenue into various components to isolate sources of risk and then adjust a business unit’s
income for many of the risks (essentially setting up internal reserve accounts) until they are
realized. The businesses are also charged for the risks of the desk and how they contribute to the
portfolio risks of the firm. This practice could arguably be transferred into the external reporting
environment. It would be interesting for researchers to define attributions that could be made
when revenue is recognized and if data were available to test the application, and any
implications, of such an approach.
What is important to appreciate in this discussion is that issues of pro-cyclicality related
to accounting are not about measuring specific instruments at fair value. Accrual accounting
35 Revaluation of property and equipment is permitted under IFRS and is often done in times of high inflation. Downward revaluations are also required for impairments of property and equipment under both U.S. GAAP and IFRS.

50
differs from cash accounting in that it reflects the matching of costs and revenues over time not
just when cash flows occur. This is done in order to better reflect the economic profits rather
than a simplistic lumpy net cash flow. But somehow this underlying concept of accrual
accounting has not been extended to issues like examining underlying credit, liquidity or
collateral risks in financial instruments. To change the current system to significantly reduce the
likelihood that the accounting will be positively associated with pro-cyclicality will require
companies and their auditors, as well as regulators with enforcement roles, to look beyond
current market prices or values to the longer run economic fundamentals and apply subjective
haircuts to dampen volatility. We conjecture this would be a difficult regulation to be accepted
by those academics and regulators who believe in market efficiency and perceive that most
managers are selfish and ready to distort reality to their own ends. Research that could guide
objective measurement of how to assess the probability that a given price deviates from
economic fundamental trends, would be an important step in moving towards a more counter-
cyclical approach. We believe that it would be a positive step for managers to develop their own
indicators and factor this into their risk assessment and incentive systems.
Single firm versus Systemic risk
The information in published GAAP-based financial statements relates to an individual
reporting entity. As such, it is not aimed at directly providing information on systemic risk
beyond that reporting entity. We have illustrated how difficult it is to capture and reflect the
potential risks of a single entity and how the accounting practices that exist today can impact the
elements of systemic risk as defined by Tarullo (2011). To move beyond the single firm is much
more complex because it requires a detailed analysis of the assets, obligations and risks across
legal entities and geographical boundaries with enormous complexities around potential legal
and economic netting benefits. To do this with any degree of precision would be like solving a
massively complex multi-period simultaneous equation system with potentially hundreds of
thousands of variables. Even if we had the technology to achieve this it would be naïve to rely
on the current accounting measures as the primary inputs as they have not been created or
considered in the context of such a problem.

51
That said, there is more that can be done to help reduce the continuing process of periods
of systemic risk. We have indicated that one critical feature is to be provided with a much
clearer picture of how assets and liabilities are funded and especially if certain assets have been
match-funded. The proposal that Brunnermeier et al (2009) make for a “mark-to-funding
accounting rule” (p.39) seems like an interesting opportunity. In their proposal the accounting
measurement approaches are similar for matched assets and liabilities. However, practical
implementation of this is probably not something we can reasonably expect in the near future36.
What we can begin with is much more detailed disclosures along these lines so that we can judge
the matching of the book and the accounting.
Concluding Remarks
Financial reporting regulation has a stated objective of providing information for users
that is unbiased, relevant and reliable, and facilitates the prediction of future performance and
assessment of managements’ stewardship function. It does not have an objective of promoting
stable financial systems; this is the domain of appropriate regulatory agencies. But it seems
reasonable to presume that the financial statements that are the primary information source for
investors and the media impact the psychology of market participants. Many senior managers
are also motivated to deliver results based on the financial reporting measures so it would be
naïve to presume that the financial accounting rules do not impact the risks in the financial
markets and the economy more generally.
In the last crisis the controversy surrounding accounting practices and their impact on
systemic risk seem to have focused primarily on the roles of fair value accounting, pro-
cyclicality, and special-purpose entities with their off-balance sheet risks. We consider these but
look more broadly at the accounting for all balance sheet and income statement key items. We
suggest that there are aspects of the current accounting system that may exacerbate systemic
risks. We offer some ideas of how the accounting may be adjusted to mitigate these. But there
is no way that an accounting system that is based on measurements at a single point can serve to
36 As mentioned, the FASB did propose something like this in May 2010 and practitioners indicated the difficulty in applying this.

52
fully identify and capture the uncertainty and risks. At best the system can provide more
disclosures to facilitate the understanding of such risks.
We want to be very clear that we believe that to be able to assess systemic risk even for a
single firm we would need massive amounts of detailed data that few market participants would
be able to utilize and interpret. The regulators can and arguably should do this, although we fear
this is a daunting if not impossible task given the breadth and depth of global financial markets.
Moving from the single firm to a system-wide analysis is obviously even more complicated, and
simply adding single firm measures across firms makes no sense.
The simplest steps we see that will help to mitigate the problem is to require much more
disclosure that identifies the upside and downside scenarios under different economic conditions
that are forward looking in nature. This is not a VaR type analysis as VaR does not deal with
fundamental risks inherent in both the business cycle and firm specific issues. VaR also does not
reflect the risks in the extreme “tails” during stressed environments. We also see a move to
reserving against ex ante risks in extensions of credit and the income earned on that as an
opportunity to dampening the credit cycles that exacerbate business cycles that occur. We also
recognize limitations in the use of an exit value measure of fair value especially if this is not
applied uniformly for all the assets and liabilities and if it is used mechanically in times of stress.
But we caution against assuming that applying an original cost basis will eliminate systemic risk.
If the economic values of the underlying assets and liabilities have changed this must be
disclosed to avoid adding to uncertainty, and if the changes are structural (other than temporary)
they should probably be recognized.
Finally, we would hope that as ideas on measuring and mitigating systemic risk continue
to be researched and debated, everyone will keep in perspective the data system and
measurement plausibility of their ideas, so that these ideas can actually be implemented.
References
Benston, G. (1986). An Analysis of the Causes of Savings and Loan Association Failures. Salomon Brothers Center for the Study of Financial Institutions, Graduate School of Business Administration, New York University.
53
Brunnermeier, M., Crockett, A., Goodhart, C., Persaud, A. and Shin, H.. (2009). The Fundamental Principles of Financial Regulation. Centre for Economic Policy Research.
Brunnermeier, M., Hansen, L.P., Kashyap, A., Krishnamurthy, A., and Lo, A.W. (2010). Modeling and Measuring Systemic Risk. American Economic Association, Ten Years and Beyond: Economists Answer NSF's Call for Long-Term Research Agendas. (October).
Brunnermeier, M. and Pedersen, L. (2009). Market Liquidity and funding Liquidity. The Review of Financial Studies. 22, (6), 2200-2238.
Epstein, M.J. (1993). Accountants and the S&L crisis. Management Accounting 74(8), pages 24-29.
Gorton, G., and Metric, A. (2012). Securitized banking and the run on repo. Journal of Financial Economics 104(3), 425-451.
Graseck B. L. and Pate, C.M. (2008) Large Cap Banks: Marking to Market 4Q08. Morgan Stanley Research (December 7).
Harris, T., Estridge, J., and Nissim, D. (2009). ModelWare’s Approach to Intrinsic Value: Focusing on Risk-Reward Trade-offs, in Equity Valuation: Models from Leading Investment Banks, edited by Jan Viebig, Thorsten Poddig and Armin Varmaz, Part IV, 193-252, Wiley Publishing.
Khan, Urooj, Does Fair Value Accounting Contribute to Systemic Risk in the Banking Industry? (2010). Columbia Business School Research Paper.
Laux, C. and Leuz, C. (2010). Did Fair-Value Accounting Contribute to the Financial Crisis?, Journal of Economic Perspectives, 24(1), pages 93-118.
Lo, A. W. (2011). Reading about the financial crisis: a 21-book review. Journal of Economic Literature, (forthcoming).
Reinhart C. M., and Rogoff, K. (2009). This Time Is Different: Eight Centuries of Financial Folly. Princeton University Press
Ryan, S. G. (2011). Risk reporting quality: implications of academic research for financial reporting policy. Paper presented at ICAEW Information for Better Markets Conference. London (December).
Schuetze, W. P. 1993. The liability crisis in the U.S. and its impact on accounting. Accounting Horizons (June): 88-91.
Tarullo, D. K. (2010). Equipping financial regulators with the tools necessary to monitor systemic risk. Paper presented at Banking Subcommittee on Security and International Trade and Finance U.S. Senate. Washington, D.C. (February).
Tarullo, D. K. (2011). Regulating Systematic Risk Remarks. Paper presented at 2011 Credit Markets Symposium. Charlotte, N.C. (March).