accounts at a glance
TRANSCRIPT

Accounts at a Glance 2019-20
Principal Accountant General (A&E), Andhra Pradesh

4
PREFACE
The publication, ‘Accounts at a Glance’, is prepared annually under the directions of
the Comptroller and Auditor General of India, and is intended to distil and provide a broad
overview of the voluminous information contained in the Finance Accounts and Appropriation
Accounts that are placed every year before the State Legislature in accordance with
requirements of the Comptroller and Auditor General’s (Duties, Powers and Conditions of
Service) Act, 1971.
Accountant General (Accounts and Entitlements) prepares the State Finance Accounts
and Appropriation Accounts. Finance Accounts are summary statements of accounts under
the Consolidated Fund, the Contingency Fund and the Public Account. The Appropriation
Accounts record the Grant-wise gross expenditures vis-a-vis Budget as approved by the State
Legislature along with explanations for variations between the actual expenditure and the
funds provided.
“Accounts at a Glance’’ provides a broad overview of Governmental activities, as
reflected in the Finance Accounts and the Appropriation Accounts. The information is
presented through brief explanations, statements, and graphs. These figures have been
adopted from the Finance and Appropriation Accounts of Government of Andhra Pradesh. In
case of difference, if any, the figures depicted in the Finance and Appropriation Accounts
may be treated as correct.
We look forward to suggestions that would help us in improving the publication.
Our Email address: [email protected]
Place: Hyderabad, (Lata Mallikarjuna)Date: 17/03/2021. PRINCIPAL ACCOUNTANT GENERAL(A&E)
ANDHRA PRADESH

5

7
8
TABLE OF CONTENTS Chapter 1 Overview ___________________________________________________ 1
1.1 Introduction ___________________________________________________________ 1
1.2 Structure of Government Accounts _________________________________________ 2
1.3 Finance and Appropriation Accounts ________________________________________ 4
1.4 Cash Management ______________________________________________________ 6
1.5 Fiscal Responsibility and Budget Management (FRBM) Act, 2005 _________________ 8
Chapter 2 Receipts ___________________________________________________ 10
2.1 Introduction __________________________________________________________ 10
2.2 Revenue Receipts _____________________________________________________ 10
2.3 Tax Revenue _________________________________________________________ 13
2.4 State’s own Tax and State’s share of Union Taxes ____________________________ 14
2.5 Grants-in-Aid _________________________________________________________ 16
2.6 Public Debt ___________________________________________________________ 17
Chapter 3 Expenditure ________________________________________________ 19
3.1 Introduction __________________________________________________________ 19
3.2 Revenue Expenditure ___________________________________________________ 20
3.3 Capital Expenditure ____________________________________________________ 22
Chapter 4 Appropriation Accounts _______________________________________ 24
4.1 Summary of Appropriation Accounts _______________________________________ 24
4.2 Significant Savings _____________________________________________________ 24
Chapter 5 Assets and Liabilities _________________________________________ 28
5.1 Assets_______________________________________________________________ 28
5.2 Debt and Liabilities _____________________________________________________ 28
5.3 Guarantees___________________________________________________________ 29
Chapter 6 Other Items ________________________________________________ 31
6.1 Adverse Balances under Internal Debt ______________________________________ 31
6.2 Loans and Advances by the State Government _______________________________ 31
6.3 Financial assistance to Local Bodies and others ______________________________ 31
6.4 Cash Balance and Investment of Cash Balance ______________________________ 32
6.5 Reconciliation of accounts _______________________________________________ 32
6.6 Submission of Accounts by Accounts rendering Units __________________________ 32
6.7 Advance Payments ____________________________________________________ 33
6.8 Status of Suspense and Remittances Balance _______________________________ 33
6.9 Commitments on Account of Incomplete Capital Works ________________________ 34
6.10 Liabilities towards New Pension System: ____________________________________ 34
6.11 Personal Deposit (PD) Accounts __________________________________________ 35
6.12 Investment ___________________________________________________________ 36

9

1
1
CHAPTER 1 OVERVIEW 1.1 Introduction The Principal Accountant General (Accounts and Entitlement) [Pr.AG(A&E)], Andhra Pradesh
compiles the accounts of receipts and expenditure of the Government of Andhra Pradesh. This
compilation is based on the initial accounts rendered by the District Treasuries and Pay and Accounts
Offices (PAOs) of the State Government, information received from the Government of India and other
State Governments on their financial transactions with the Government of Andhra Pradesh and
intimations (known as advices) of the Reserve Bank of India regarding changes to the State’s Cash
Balance. Based on these, the Pr.AG(A&E) furnishes the Monthly Civil Accounts to the Finance
Department. At the end of the year, after audit by the Principal Accountant General (Audit), Andhra
Pradesh and certification by the Comptroller and Auditor General of India, the Finance Accounts and
the Appropriation Accounts of the State Government are placed before the State Legislature.
2
2
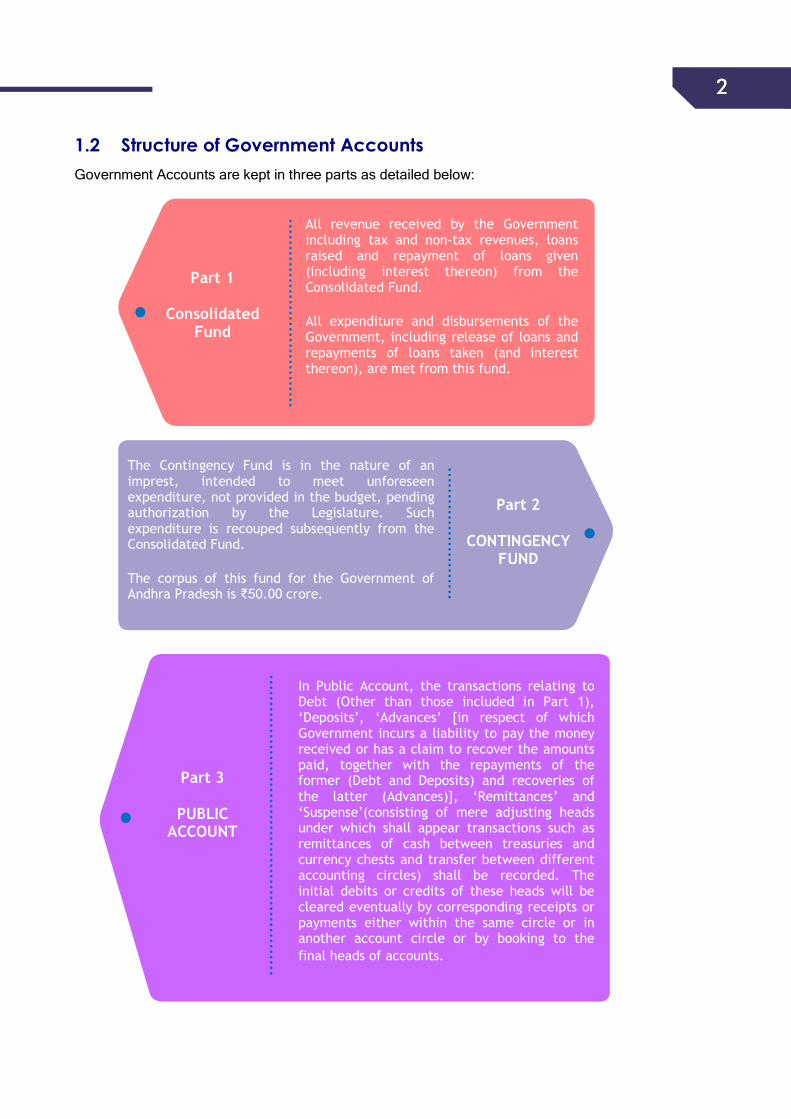
1.2 Structure of Government Accounts Government Accounts are kept in three parts as detailed below:
All revenue received by the Government including tax and non-tax revenues, loans raised and repayment of loans given (including interest thereon) from the Consolidated Fund.
All expenditure and disbursements of the Government, including release of loans and repayments of loans taken (and interest thereon), are met from this fund.
The Contingency Fund is in the nature of an imprest, intended to meet unforeseen expenditure, not provided in the budget, pending authorization by the Legislature. Such expenditure is recouped subsequently from the Consolidated Fund.
The corpus of this fund for the Government of Andhra Pradesh is ₹50.00 crore.
In Public Account, the transactions relating to Debt (Other than those included in Part 1), ‘Deposits’, ‘Advances’ [in respect of which Government incurs a liability to pay the money received or has a claim to recover the amounts paid, together with the repayments of the former (Debt and Deposits) and recoveries of the latter (Advances)], ‘Remittances’ and ‘Suspense’(consisting of mere adjusting heads under which shall appear transactions such as remittances of cash between treasuries and currency chests and transfer between different accounting circles) shall be recorded. The initial debits or credits of these heads will be cleared eventually by corresponding receipts or payments either within the same circle or in another account circle or by booking to the final heads of accounts.
Part 3
PUBLIC ACCOUNT
Part 2
CONTINGENCY FUND
Part 1
Consolidated Fund
3 3
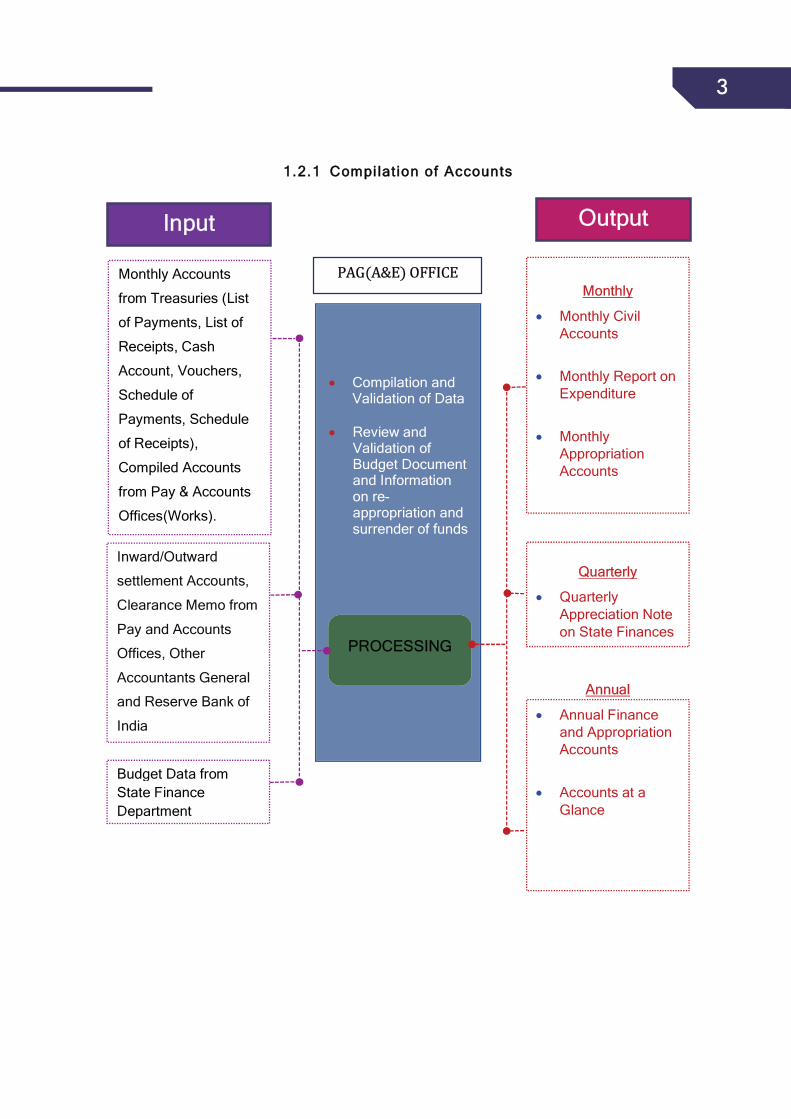
11..22..11 CCoommppii llaatt iioonn ooff AAccccoouunnttss
IINNPPUUTTSS
Compilation and Validation of Data
Review and Validation of Budget Document and Information on re-appropriation and surrender of funds
Monthly Accounts
from Treasuries (List
of Payments, List of
Receipts, Cash
Account, Vouchers,
Schedule of
Payments, Schedule
of Receipts),
Compiled Accounts
from Pay & Accounts
Offices(Works).
Inward/Outward
settlement Accounts,
Clearance Memo from
Pay and Accounts
Offices, Other
Accountants General
and Reserve Bank of
India
Budget Data from State Finance Department DdDDepartment
MMoonntthhllyy
Monthly Civil Accounts
Monthly Report on Expenditure
Monthly Appropriation Accounts
QQuuaarrtteerrllyy
Quarterly Appreciation Note on State Finances
AAnnnnuuaall
Annual Finance and Appropriation Accounts
Accounts at a Glance
PPRROOCCEESSSSIINNGG
PPAAGG((AA&&EE)) OOFFFFIICCEE
IInnppuutt OOuuttppuutt
4
4
1.3 Finance and Appropriation Accounts
11..33..11 FFiinnaannccee AAccccoouunnttss
The Finance Accounts depict the receipts and disbursements of the Government for the year, together
with the financial results disclosed by the Revenue and Capital Accounts, Public Debt and Public
Account balances recorded in the accounts. Finance Accounts are prepared in two volumes to make
them more comprehensive and informative.
Volume I of the Finance Accounts contains the certificate of the Comptroller and Auditor
General of India, summarized statements of overall receipts and disbursements and ‘Notes to
Accounts’ containing the summary of significant accounting policies, comments on quality of
accounts and other items.
Volume II contains detailed statements (Part-I) and appendices (Part-II).
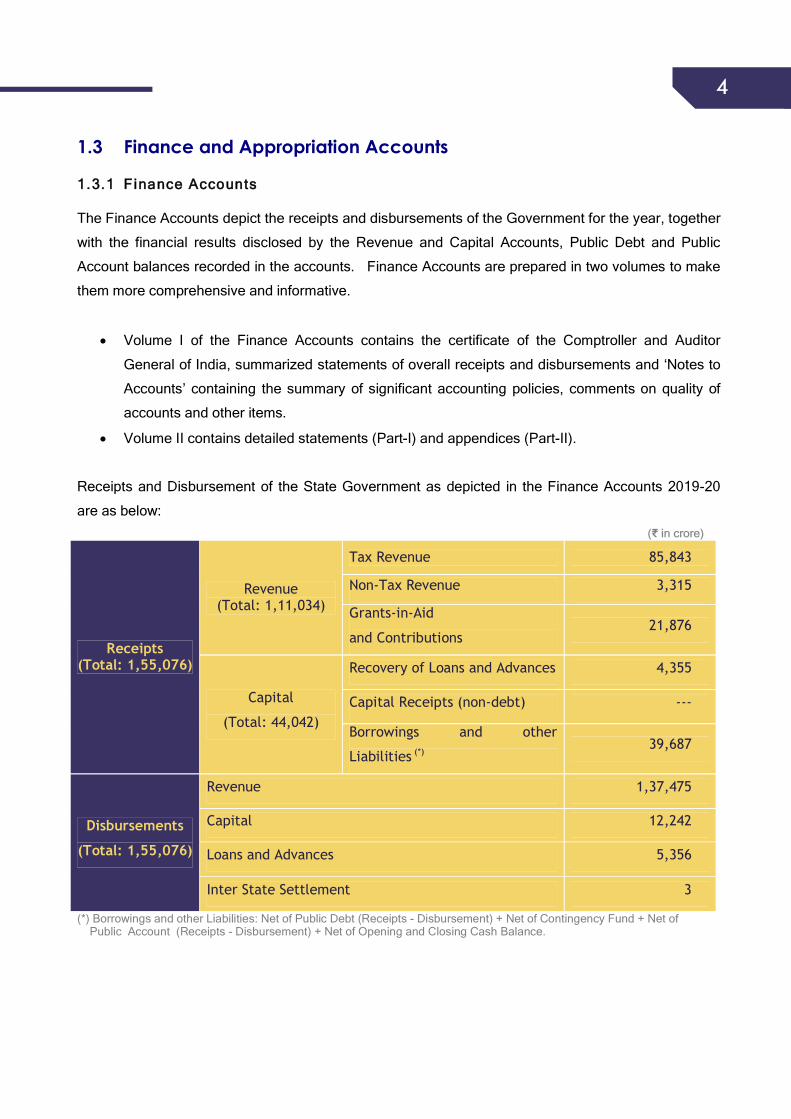
Receipts and Disbursement of the State Government as depicted in the Finance Accounts 2019-20
are as below:((₹ iinn ccrroorree))
Receipts (Total: 1,55,076)
Revenue (Total: 1,11,034)
Tax Revenue 85,843
Non-Tax Revenue 3,315
Grants-in-Aid
and Contributions 21,876
Capital
(Total: 44,042)
Recovery of Loans and Advances 4,355
Capital Receipts (non-debt) ---
otherandBorrowings
Liabilities (*) 39,687
Disbursements
(Total: 1,55,076)
Revenue 1,37,475
Capital 12,242
Loans and Advances 5,356
Inter State Settlement 3
(*) Borrowings and other Liabilities: Net of Public Debt (Receipts - Disbursement) + Net of Contingency Fund + Net of Public Account (Receipts - Disbursement) + Net of Opening and Closing Cash Balance.

5
5
In addition to the Budget approved for the year by Andhra Pradesh Legislature, Government of India
transfers funds directly to State Implementing Agencies and Non-Government Organisations (NGOs)
in the State for spending on various schemes and programmes. Such transfers (₹8,035 crore) are not
reflected in the accounts of the State Government but have been shown at Appendix VI in Volume II of
the Finance Accounts.
11..33..22 FFiinnaanncciiaall hhiigghhll iigghhttss ooff 22001199--2200
The following table provides the details of actual financial results vis-a-vis budget estimates for the
year 2019-20:
1 GSDP figure of ₹9,72,782 crore adopted as provided in the Andhra Pradesh Socio-Economic Survey. 2Includes State’s share of Union Taxes of ₹20,228crore. 3 Borrowings and other liabilities: Net (Receipts-Disbursements) of Public debt (₹33,062 crore) + Net of Contingency fund (₹Nil’crore) + Net (Receipts- Disbursements) of Public Account (₹7,084 crore) + Net of Opening and Closing cash balance (₹ (-)4,59 crore). 4 Capital Expenditure includes Capital Expenditure (₹12,242 crore), Loans and Advances disbursed (₹5,356crore) and Inter State Settlement ₹3 crore 5 Expenditure does not include Public Debt as net of Public Debt has been taken under Borrowings and Liabilities
Sl. No
Component Budget
Estimates (₹ in crore)
Actuals (₹ in crore)
Percentage of Actuals to
B.E.
Percentage of Actuals to
GSDP1
1 Tax Revenue (including Central Share)2 1,10,271 85,843 78 9
2 Non-Tax Revenue 7,355 3,315 45 ---
3 Grants-in-aid & Contributions 61,072 21,876 36 2
4 Revenue Receipts (1+2+3) 1,78,698 1,11,034 62 11
5 Recovery of Loans & Advances 600 4,355 726 ---
6 Borrowings & Other Liabilities3 35,260 39,687 113 4
7 Capital Receipts (5+6) 35,860 44,042 123 5
8 Total Receipts (4+7) 2,14,558 1,55,076 72 16
9 Revenue Expenditure 1,80,476 1,37,475 76 14
10 Expenditure on Interest Payments(Out of 9) 17,244 17,653 102 2 11 Capital Expenditure4 34,082 17,601 52 2
12 Total Expenditure (9+11)5 2,14,558 1,55,076 72 16
13 Revenue Surplus (+)/Deficit (-) (4-9) (-)1,778 (-)26441 1487 3
14 Fiscal Deficit (4+5-12) (-)35,260 (-)39,687 113 4
6
6
11..33..33 AApppprroopprr iiaatt iioonn AAccccoouunnttss
Under Article 204(3) of the Constitution of India, no expenditure can be incurred by the Government
except with the authorisation of the Legislature. Barring certain expenditure specified in the
Constitution as “charged” on the Consolidated Fund, which can be incurred without vote of the
Legislature, all other expenditures require to be “voted”. The budget of Government of Andhra
Pradesh has 15 charged Appropriations and 40 voted Grants. The purpose of the Appropriation
Accounts is to indicate the extent to which the actual expenditure complied with the appropriations
authorised by the Legislature through the Appropriation Act of each year.
11..33..44 EEffff iicciieennccyy oonn BBuuddggeett pprreeppaarraatt iioonn
At the end of the year, the expenditure of Government of Andhra Pradesh against the budget
approved by the Legislature, showed an excess of ₹357 crore (0.14 per cent of total grants). Details
of grants showing consistent savings, excesses, unwanted supplementary provision etc. are detailed
in Chapter 4.
1.4 Cash Management
11..44..11 WWaayyss aanndd MMeeaannss AAddvvaanncceess aanndd SSppeecciiaall WWaayyss aanndd MMeeaannss AAddvvaanncceess
Reserve Bank of India (RBI) extends Special Drawing Facility / Ways and Means Advances to enable
State Government to tide over temporary shortfalls in their minimum cash balance (₹1.94 crore) which
the State Government is required to maintain with the Reserve Bank of India. During 2019-20,
Government of Andhra Pradesh availed ways and means advance of ₹60,371.10 crore on 221 days
(128 days of Ordinary Ways and Means Advance, 36 days of Special Drawing Facility and 57 days of
Overdraft) and repaid ₹60,740.83 crore (including opening balance of ₹369.73 crore) leaving ‘Nil’
balance at the end of the year. Further, an amount ₹66.17 crore was paid as interest on the Ways
and Means Advances during 2019-20.
11..44..22 OOvveerrddrraafftt ff rroomm tthhee RReesseerrvvee BBaannkk ooff IInnddiiaa
Overdraft is taken from the Reserve Bank of India when the minimum cash balance falls below
₹1.94 crore, even after taking Ways and Means Advances. During 2019-20, Government of Andhra
Pradesh availed Overdraft from Reserve Bank of India for 57 days amounting to ₹17,631.58 crore
11..44..33 FFuunndd FFllooww
Figures in the next page shows how the State Government raised money from various sources and
spent money for various objects like salary, pension, interest etc. The State had a Revenue Deficit of
₹26,441crore and Fiscal Deficit of ₹39,687 crore as on 31 March 2020. The Fiscal Deficit constituted
25.59per cent of total expenditure.

7

8
8 1.5 Fiscal Responsibility and Budget Management (FRBM) Act, 2005
Deficit indicators, revenue augmentation and expenditure management are major yardsticks for
judging the fiscal performance of the Government. The Government of Andhra Pradesh has
enacted the Fiscal Responsibility and Budget Management (FRBM) Act, 2005. As per this Act, the
State Government was required to achieve certain fiscal targets by specified periods.
Achievements during the year 2019-20 against fiscal targets laid down in the Act and rules framed
there under were as follows:
SSll.. NNoo.. PPaarraammeetteerr AAccttuuaall
((₹₹ iinn ccrroorree)) RRaattiioo ttoo GGSSDDPP
TTaarrggeett AAcchhiieevveemmeenntt
1 Revenue Deficit 26,441 To become Revenue Surplus
2.72 rounded to 3(not achieved)
2 Fiscal Deficit 39,687 3.00 or less 4.08 rounded to 4(not achieved)
3 Debt and other obligation 3,01,802 25.22 31.02 (not achieved)
GSD P f ig ure o f ₹9 ,7 2 ,782 c rore a dop ted as prov ided in t he An dhra Pr ad esh Soc io- Eco nom ic Survey .
WWhhaatt ddoo tthhee SSuurrpplluuss aanndd DDeeff iiccii tt iinnddiiccaattee??
DEFICIT
The gap between Revenue and Expenditure. The kind of deficit, how the deficit is financed, and application of funds are important indicators of prudence in Financial Management.
REVENUE DEFICIT / SURPLUS
The gap between Revenue Receipts and Revenue Expenditure. Revenue Expenditure is required to maintain the existing establishment of Government and ideally, should be fully met from Revenue Receipts.
FISCAL DEFICIT / SURPLUS
The gap between Total Receipts (excluding borrowings) and Total Expenditure. This gap, therefore, indicates the extent to which expenditure is financed by borrowings. Ideally, the borrowings should be invested in capital projects.
9
The trend of Revenue deficit as percentage of Total revenue Recei
of GSDP are shown below. In the past five years
deficit and Fiscal deficit has always been more than the desired level of 3%
crore) as prescribed in the FRBM Act.
Note: f igure in pa renthes is
Note: F igure in parenthes is
-8.24(7,302)
-30
-25
-20
-15
-10
-5
0
2015-16
(Rev
enue
Def
icit/
Surp
lus a
s %ag
e to
Tota
lRev
enue
Rec
eipt
s (TR
R)
3.66% (22,059)
-6
-5
-4
-3
-2
-1
0
2015-16
FFiisscc
aall DD
eeffiicc
iitt aass
%%aagg
ee ooff
GGSS
DDPP
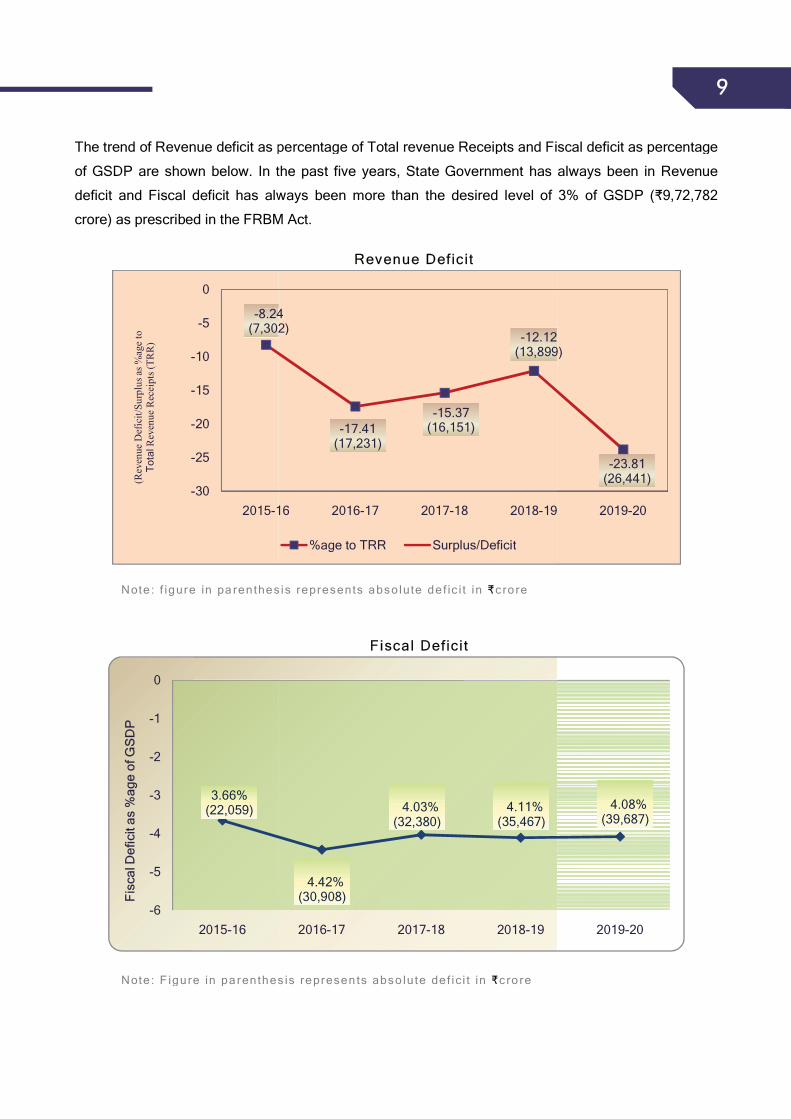
The trend of Revenue deficit as percentage of Total revenue Receipts and Fiscal deficit as percentage
shown below. In the past five years, State Government has always been
Fiscal deficit has always been more than the desired level of 3%
BM Act.
RReevveennuuee DDeeff iicciitt
Note : f igure in pa renthesis represents abso lute def ic i t in ₹cro re
FFiissccaall DDeeff iiccii tt
igure in pa renthes is represen ts abso lu te def ic i t in ₹cro re
8.24(7,302)
16
8.24(7,302)
-17.41(17,231)
-15.37(16,151)
-12.12(13,899)
16 2016-17 2017-18 2018-19
%age to TRR Surplus/Deficit
4.42%(30,908)
4.03%(32,380)
4.11%(35,467)
2016-17 2017-18 2018-19
9
pts and Fiscal deficit as percentage
, State Government has always been in Revenue
Fiscal deficit has always been more than the desired level of 3% of GSDP (₹9,72,782
(13,899)
-23.81(26,441)
19 2019-20
4.08%(39,687)
2019-20

10
10
CHAPTER 2 RECEIPTS 2.1 Introduction The Receipts of the Government are classified as Revenue Receipts and Capital Receipts. Total
receipts for 2019-20 were ₹1,55,076 crore against Budget estimate of ₹2,14,558 crore.
2.2 Revenue Receipts The revenue receipts of the Government comprises of three components viz. Tax Revenue, Non-tax
Revenue and Grants-in-aid received from the Union Government.
TAX REVENUE
NON-TAX REVENUE
GRANTS-IN-AID
Comprises taxes collected and retained by the State and State’s share of union taxes under Article 280(3) of the Constitution.
Includes interest receipts, dividends, profits, departmental receipts etc.
Represent central assistance to the State Government from the Union Government. Includes ‘External Grant Assistance’ and ‘Aid, Material & Equipment’ received from Foreign Governments and channelised through the Union Government. In turn, the State Government also gives Grants-in-aid to Panchayati Raj Institutions, Autonomous Bodies etc.
11
Components
A. Tax Revenue*
Goods and Services Tax
Taxes on Income & Expenditure
Taxes on Property & Capital Transactions
Taxes on Commodities & Services
B. Non-Tax Revenue
Interest Receipts, Dividends and Profits
General Services
Social Services
Economic Services
C. Grants-in-aid & Contributions
Total –Revenue Receipts
Non-tax revenue 3%
( )
Grants-in-aid & Contributions,
20% ( )
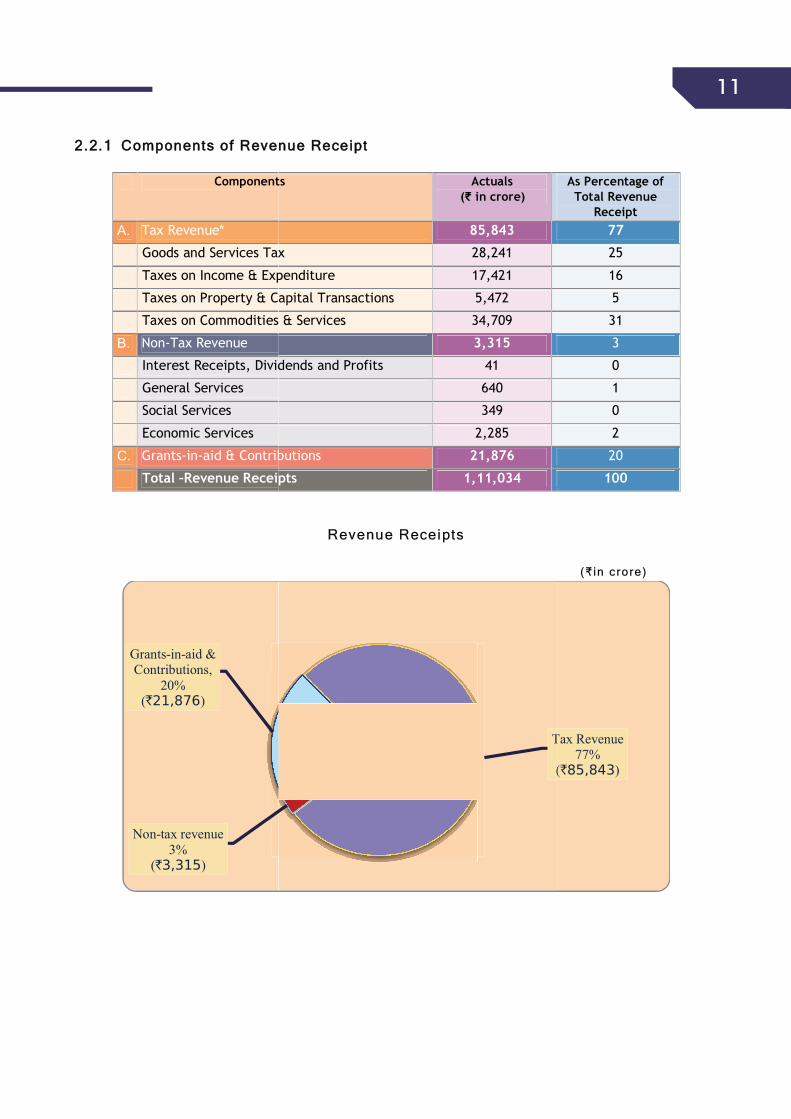
22..22..11 CCoommppoonneennttss ooff RReevveennuuee RReecceeiipptt
Components Actuals(₹ in crore)
85,843
Services Tax 28,241
Taxes on Income & Expenditure 17,421
Taxes on Property & Capital Transactions 5,472
Taxes on Commodities & Services 34,709
3,315
Interest Receipts, Dividends and Profits 41
640
349
2,285
aid & Contributions 21,876
Revenue Receipts 1,11,034
RReevveennuuee RReecceeiippttss
Tax Revenue
(
11
As Percentage of Total Revenue
Receipt 77
25
16
5
31
3
0
1
0
2
20
100
(₹ in c rore)
Tax Revenue 77%
( )

12
12
22..22..22 TTrreenndd ooff RReevveennuuee RReecceeiippttss
((₹₹iinn ccrroorree)) 2015-16 2016-17 2017-18 2018-19 2019-20
Tax Revenue 61,800
(10.24)
70,445
(10.07)
78,488
(9.76)
90,818
(9.73)
85,843
(8.82) Non-Tax Revenue
4,920
(0.82)
5,193
(0.74)
3,814
(0.47)
4,396
(0.47)
3,315
(0.34) Grants-in-aid 21,928
(3.63)
23,346
(3.34)
22,761
(2.83)
19,457
(2.08)
21,876
(2.25) Total Revenue Receipts
88,648
(14.69)
98,984
(14.15)
1,05,063
(13.07)
1,14,671
(12.29)
1,11,034
(11.41) GSDP 6,03,376 6,99,307 8,03,873 9,33,402 9,72,782
Note: Figures in parentheses represent percentage to GSDP (Gross State Domestic Product).GSDP figures in this publication are adopted as provided in the Andhra Pradesh Socio-Economic Survey.
Though the GSDP increased by 4.22 per cent in 2019-20 as compared to previous year, decline in
revenue receipts was 3.17 per cent. The total tax revenue (including share of Union Taxes) decreased
by 5.48 per cent, the non-tax revenue decreased by 24.59 per cent and the grants-in-aid increased by
12.43 per cent as compared to previous year.
22..22..33 TTrreenndd ooff CCoommppoonneennttss ooff RReevveennuuee RReecceeiippttss
6611,,88
0000 7700,,44
4455 7788,,44
8888 9900,,88
1188
8855,,88
4433
44,,9922
00
55,,1199
33
33,,8811
44
44,,3399
66
33,,3311
55
21,9
28
23,3
46
22,7
61
19,4
57
21,8
76
0
10,000
20,000
30,000
40,000
50,000
60,000
70,000
80,000
90,000
1,00,000
1,10,000
22001155--1166 22001166--1177 22001177--1188 22001188--1199 22001199--2200
((₹₹ iinn
ccrroo
rree))
TTRREENNDD OOFF CCOOMMPPOONNEENNEETTSS OOFF RREEVVEENNUUEE RREECCEEIIPPTTSS
Tax Revenue
Non-Tax Revenue
Grants-in-aid

1313
2.3 Tax Revenue
22..33..11 CCoommppoonneennttss ooff TTaaxx RReevveennuuee
((₹₹ iinn ccrroorree))
Sector 2015-16 2016-17 2017-18 2018-19 2019-20
a. Goods and Services Tax NA* NA* 14,157
(1.76)
29,349
(3.14)
28,241
(2.90)
b. Taxes on Income and Expenditure
11,932
(1.98)
14,515
(2.08)
16,623
(2.07)
20,110
(2.15)
17,421
(1.79)
c. Taxes on Property and Capital Transactions
3,777
(0.63)
3,854
(0.55)
4,510
(0.56)
5,648
(0.61)
5,472
(0.56)
d. Taxes on Commodities and Services
46,091
(7.64)
52,076
(7.45)
43,198
(5.37)
35,711
(3.83)
34,709
(3.57)
Total Tax Revenues 61,800(10.24)
70,445(10.07)
78,488(9.76)
90,818(9.73)
85,843(8.82)
GSDP 6,03,376 6,99,307 8,03,873 9,33,402 9,72,782 Note: Figures in parentheses represent percentage to GSDP.* Not Applicable.
The decrease in total tax revenue during 2019-20 was mainly attributable to lower collection
under State Goods and Services Tax (₹20,227 crore), Corporation Tax (₹9,630 crore), Taxes on
Income other than Corporation Tax (₹7,545 crore), Stamps and Registration Fees (₹5,318
crore), Taxes on Vehicles (₹3,279 crore).
22..33..22 TTrreenndd ooff MMaajjoorr TTaaxxeess iinn PPrrooppoorrtt iioonn ttoo GGSSDDPP
1.76
3.14 2.91.98 2.08 2.07
2.15 1.790.63 0.55 0.56 0.61
0.56
7.64 7.45
5.37 3.83 3.57
0123456789
2015-16 2016-17 2017-18 2018-19 2019-20
PPeerr
cceenn
tt ooff GG
SSDD
PP
TTrreenndd ooff MMaajjoorr TTaaxxeess iinn PPrrooppoorrttiioonn ttoo GGSSDDPP
Goods and Services TaxTaxes on Income and ExpenditureTaxes on Property and Capital TransactionsTaxes on Commodities and Services
14
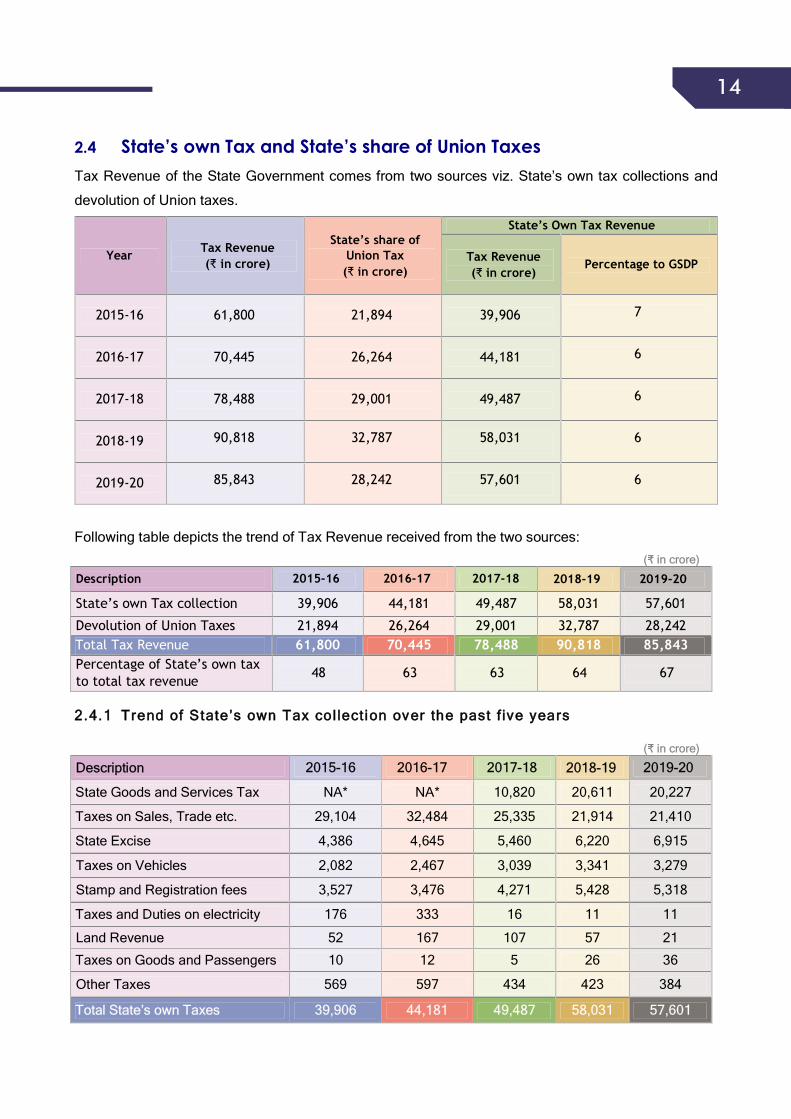
14 2.4 State’s own Tax and State’s share of Union Taxes
Tax Revenue of the State Government comes from two sources viz. State’s own tax collections and
devolution of Union taxes.
Year Tax Revenue(₹ in crore)
State’s share ofUnion Tax(₹ in crore)
State’s Own Tax Revenue
Tax Revenue(₹ in crore)
Percentage to GSDP
2015-16 61,800 21,894 39,906 7
2016-17 70,445 26,264 44,181 6
2017-18 78,488 29,001 49,487 6
2018-19 90,818 32,787 58,031 6
2019-20 85,843 28,242 57,601 6
Following table depicts the trend of Tax Revenue received from the two sources: ((₹₹ iinn ccrroorree))
Description 2015-16 2016-17 2017-18 2018-19 2019-20
State’s own Tax collection 39,906 44,181 49,487 58,031 57,601
Devolution of Union Taxes 21,894 26,264 29,001 32,787 28,242 Total Tax Revenue 61,800 70,445 78,488 90,818 85,843 Percentage of State’s own tax to total tax revenue
48 63 63 64 67
22..44..11 TTrreenndd ooff SSttaattee’’ss oowwnn TTaaxx ccooll lleecctt iioonn oovveerr tthhee ppaasstt ff iivvee yyeeaarrss
((₹₹ iinn ccrroorree))
DDeessccrriippttiioonn 22001155--1166 22001166--1177 22001177--1188 22001188--1199 22001199--2200
State Goods and Services Tax NA* NA* 10,820 20,611 20,227
Taxes on Sales, Trade etc. 29,104 32,484 25,335 21,914 21,410
State Excise 4,386 4,645 5,460 6,220 6,915
Taxes on Vehicles 2,082 2,467 3,039 3,341 3,279
Stamp and Registration fees 3,527 3,476 4,271 5,428 5,318
Taxes and Duties on electricity 176 333 16 11 11
Land Revenue 52 167 107 57 21
Taxes on Goods and Passengers 10 12 5 26 36
Other Taxes 569 597 434 423 384
TToottaall SSttaattee’’ss oowwnn TTaaxxeess 3399,,990066 4444,,118811 4499,,448877 5588,,003311 5577,,660011
15
15
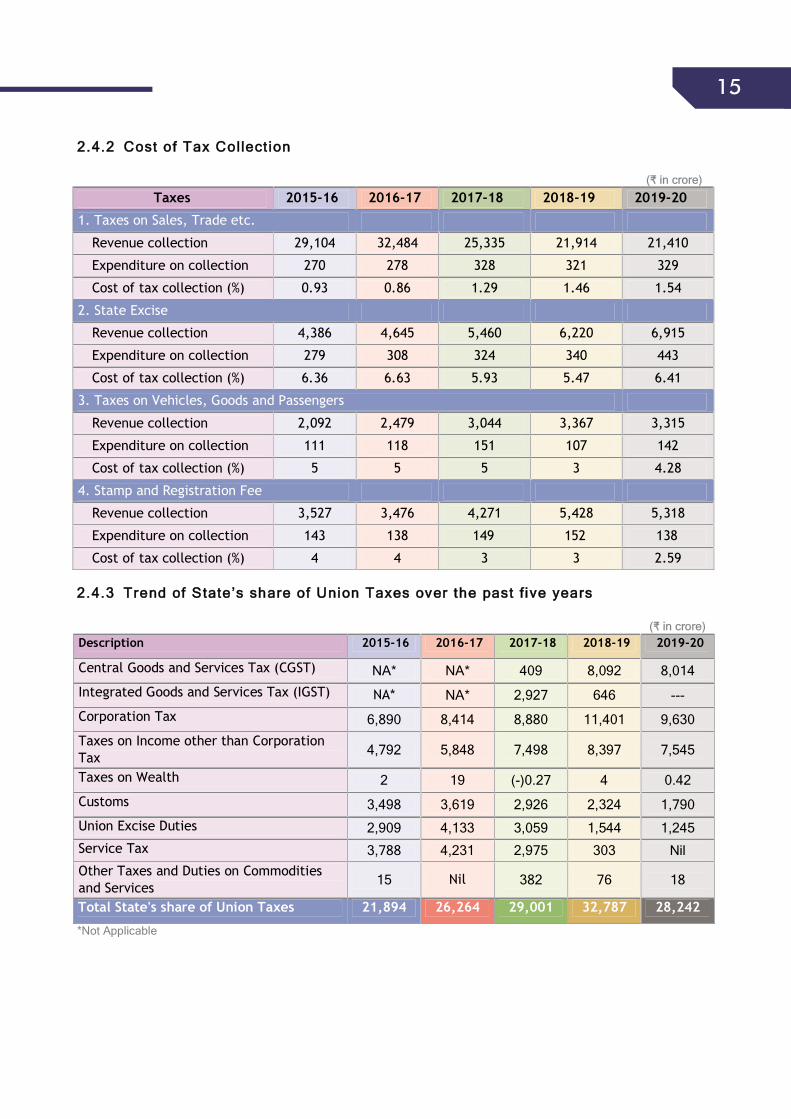
22..44..22 CCoosstt ooff TTaaxx CCooll lleecctt iioonn
((₹₹ iinn ccrroorree))
Taxes 2015-16 2016-17 2017-18 2018-19 2019-20
1. Taxes on Sales, Trade etc.
Revenue collection 29,104 32,484 25,335 21,914 21,410
Expenditure on collection 270 278 328 321 329
Cost of tax collection (%) 0.93 0.86 1.29 1.46 1.54
2. State Excise
Revenue collection 4,386 4,645 5,460 6,220 6,915
Expenditure on collection 279 308 324 340 443
Cost of tax collection (%) 6.36 6.63 5.93 5.47 6.41
3. Taxes on Vehicles, Goods and Passengers
Revenue collection 2,092 2,479 3,044 3,367 3,315
Expenditure on collection 111 118 151 107 142
Cost of tax collection (%) 5 5 5 3 4.28
4. Stamp and Registration Fee
Revenue collection 3,527 3,476 4,271 5,428 5,318
Expenditure on collection 143 138 149 152 138
Cost of tax collection (%) 4 4 3 3 2.59
22..44..33 TTrreenndd ooff SSttaattee’’ss sshhaarree ooff UUnniioonn TTaaxxeess oovveerr tthhee ppaasstt ff iivvee yyeeaarrss
((₹₹ iinn ccrroorree))Description 2015-16 2016-17 2017-18 2018-19 2019-20
Central Goods and Services Tax (CGST) NA* NA* 409 8,092 8,014 Integrated Goods and Services Tax (IGST) NA* NA* 2,927 646 --- Corporation Tax 6,890 8,414 8,880 11,401 9,630 Taxes on Income other than Corporation Tax 4,792 5,848 7,498 8,397 7,545
Taxes on Wealth 2 19 (-)0.27 4 0.42
Customs 3,498 3,619 2,926 2,324 1,790 Union Excise Duties 2,909 4,133 3,059 1,544 1,245 Service Tax 3,788 4,231 2,975 303 Nil Other Taxes and Duties on Commodities and Services 15 Nil 382 76 18
Total State's share of Union Taxes 21,894 26,264 29,001 32,787 28,242
*Not Applicable

16
Finance Commission
Grants₹ 6,452
(29%)
Other Grants₹ 1,861
₹21,927
17,000
18,000
19,000
20,000
21,000
22,000
23,000
24,000
2015-16
Other GrantsOther Grants
Centrally Sponsored Schemes₹ 13,563
Other Grants₹ 1,861
(9%)
₹23,346
₹22,761
₹19,457
2016-17 2017-18 2018-19
16
22 55..11 TTrreenndd ooff GGrraannttss iinn AAiidd..
((₹in cro re ))
Centrally Centrally Centrally Centrally Sponsored Sponsored SchemesSchemesSchemesSchemes₹ 13,563₹ 13,563SchemesSchemes₹ 13,563₹ 13,563
Centrally Sponsored Schemes₹ 13,563
(62%)
₹21,876
2019-20
2.5 Grants-in-AidGrants-in-aid represent assistance from the Government of India, grants ggiven for State Schemes,
Central Schemes and Centrally Sponsored Schemes and State Grants recommmended by the Finance
Commission.
Total receipts during 2019-20 under Grants-in-aid were ₹21,876 crore as showwn below:(₹ in crore)
17
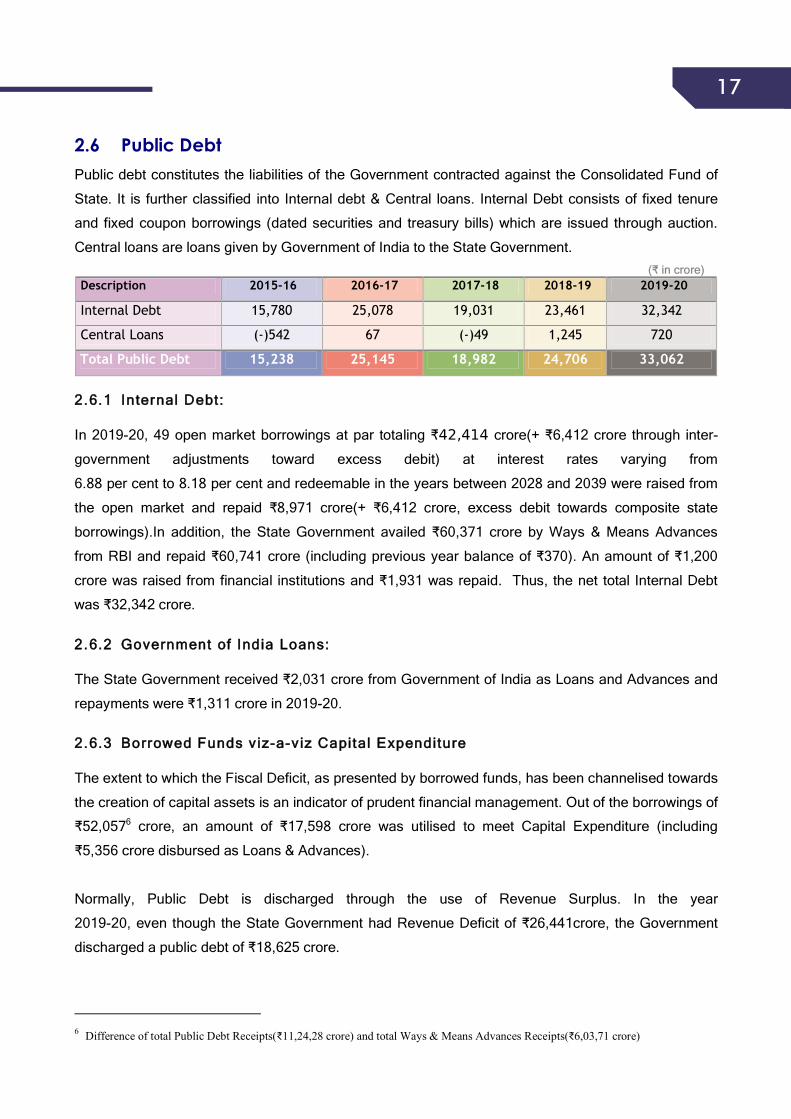
17 2.6 Public Debt Public debt constitutes the liabilities of the Government contracted against the Consolidated Fund of
State. It is further classified into Internal debt & Central loans. Internal Debt consists of fixed tenure
and fixed coupon borrowings (dated securities and treasury bills) which are issued through auction.
Central loans are loans given by Government of India to the State Government. ((₹₹ iinn ccrroorree))
Description 2015-16 2016-17 2017-18 2018-19 2019-20
Internal Debt 15,780 25,078 19,031 23,461 32,342
Central Loans (-)542 67 (-)49 1,245 720
Total Public Debt 15,238 25,145 18,982 24,706 33,062
22..66..11 IInntteerrnnaall DDeebbtt::
In 2019-20, 49 open market borrowings at par totaling ₹ crore(+ ₹6,412 crore through inter-
government adjustments toward excess debit) at interest rates varying from
6.88 per cent to 8.18 per cent and redeemable in the years between 2028 and 2039 were raised from
the open market and repaid ₹8,971 crore(+ ₹6,412 crore, excess debit towards composite state
borrowings).In addition, the State Government availed ₹60,371 crore by Ways & Means Advances
from RBI and repaid ₹60,741 crore (including previous year balance of ₹370). An amount of ₹1,200
crore was raised from financial institutions and ₹1,931 was repaid. Thus, the net total Internal Debt
was ₹32,342 crore.
22..66..22 GGoovveerrnnmmeenntt ooff IInnddiiaa LLooaannss::
The State Government received ₹2,031 crore from Government of India as Loans and Advances and
repayments were ₹1,311 crore in 2019-20.
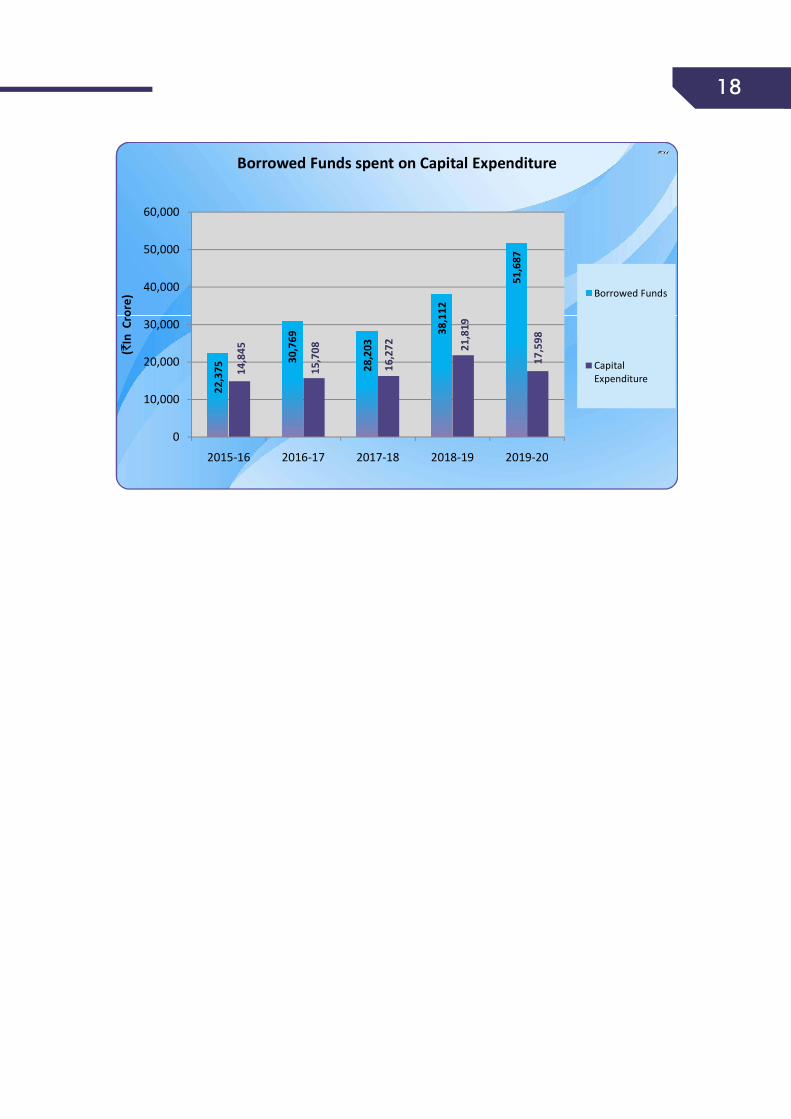
22..66..33 BBoorrrroowweedd FFuunnddss vviizz--aa--vviizz CCaappii ttaall EExxppeennddiittuurree
The extent to which the Fiscal Deficit, as presented by borrowed funds, has been channelised towards
the creation of capital assets is an indicator of prudent financial management. Out of the borrowings of6₹52,057 crore, an amount of ₹17,598 crore was utilised to meet Capital Expenditure (including
₹5,356 crore disbursed as Loans & Advances).
Normally, Public Debt is discharged through the use of Revenue Surplus. In the year
2019-20, even though the State Government had Revenue Deficit of ₹26,441crore, the Government
discharged a public debt of ₹18,625 crore.
6 Difference of total Public Debt Receipts(₹11,24,28 crore) and total Ways & Means Advances Receipts(₹6,03,71 crore)
18
18
22,3
75
30,7
69
28,2
03
38,1
12
51,6
87
14,8
45
15,7
08
16,2
72 21,8
19
17,5
98
0
10,000
20,000
30,000
40,000
50,000
60,000
2015-16 2016-17 2017-18 2018-19 2019-20
(In
Cro
re)
Borrowed Funds spent on Capital Expenditure
Borrowed Funds
Capital Expenditure
19
19
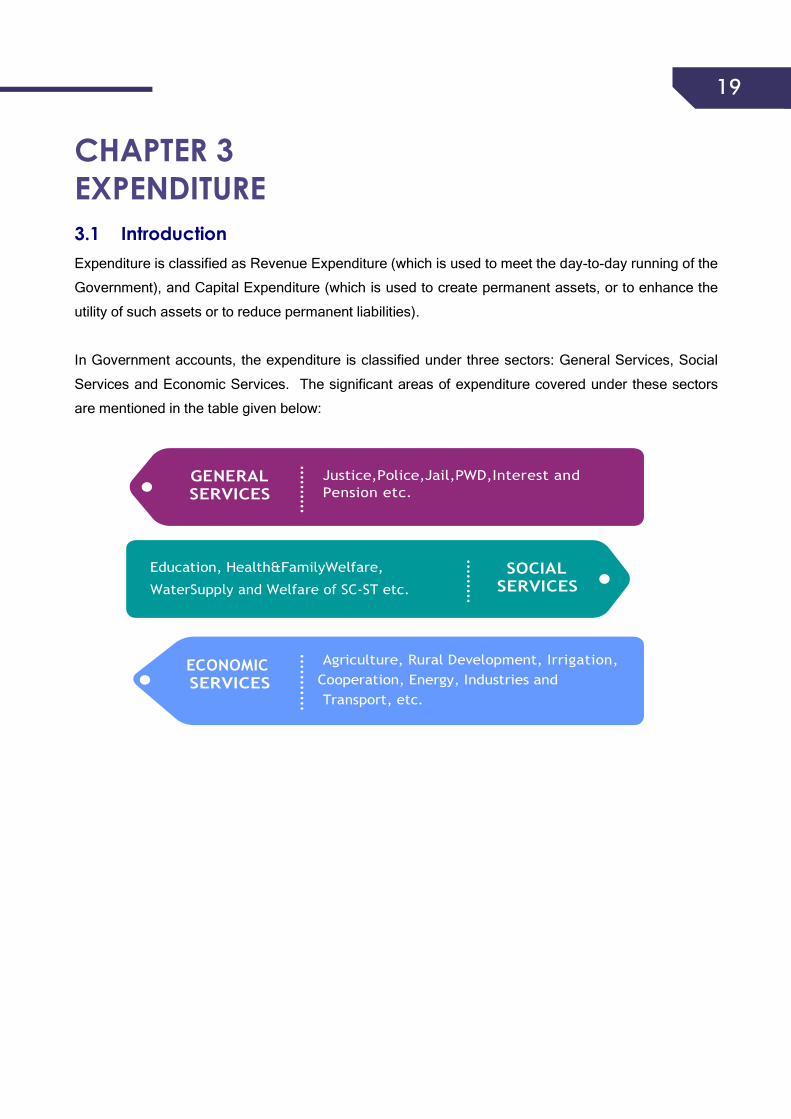
CHAPTER 3 EXPENDITURE 3.1 Introduction Expenditure is classified as Revenue Expenditure (which is used to meet the day-to-day running of the
Government), and Capital Expenditure (which is used to create permanent assets, or to enhance the
utility of such assets or to reduce permanent liabilities).
In Government accounts, the expenditure is classified under three sectors: General Services, Social
Services and Economic Services. The significant areas of expenditure covered under these sectors
are mentioned in the table given below:
GENERAL SERVICES
Justice,Police,Jail,PWD,Interest and Pension etc.
ECONOMIC SERVICES
Agriculture, Rural Development, Irrigation, Cooperation, Energy, Industries and Transport, etc.
SOCIAL SERVICES
Education, Health&FamilyWelfare,
WaterSupply and Welfare of SC-ST etc.
20
Component
A. Fiscal Services
(i) Collection of Taxes on Property and Capital transactions
(ii) Collection of Taxes on Commodities and Services
(iii) Other Fiscal Services
B. Organs of State
C. Interest Payments and Servicing of Debt
D. Administrative Services
E. Pensions and Miscellaneous General Services
F. Social Services
G. Economic Services
H. Grants-in-aid and Contributions
Total Expenditure (Revenue Account)
4946
,40,
813
2 ,329
1810
,359
0
10,000
20,000
30,000
40,000
50,000
60,000
70,000
80,000
2015-16
(in
cro
re)
Trend of Major Components of Revenue Expenditure
2018-19 2019-20
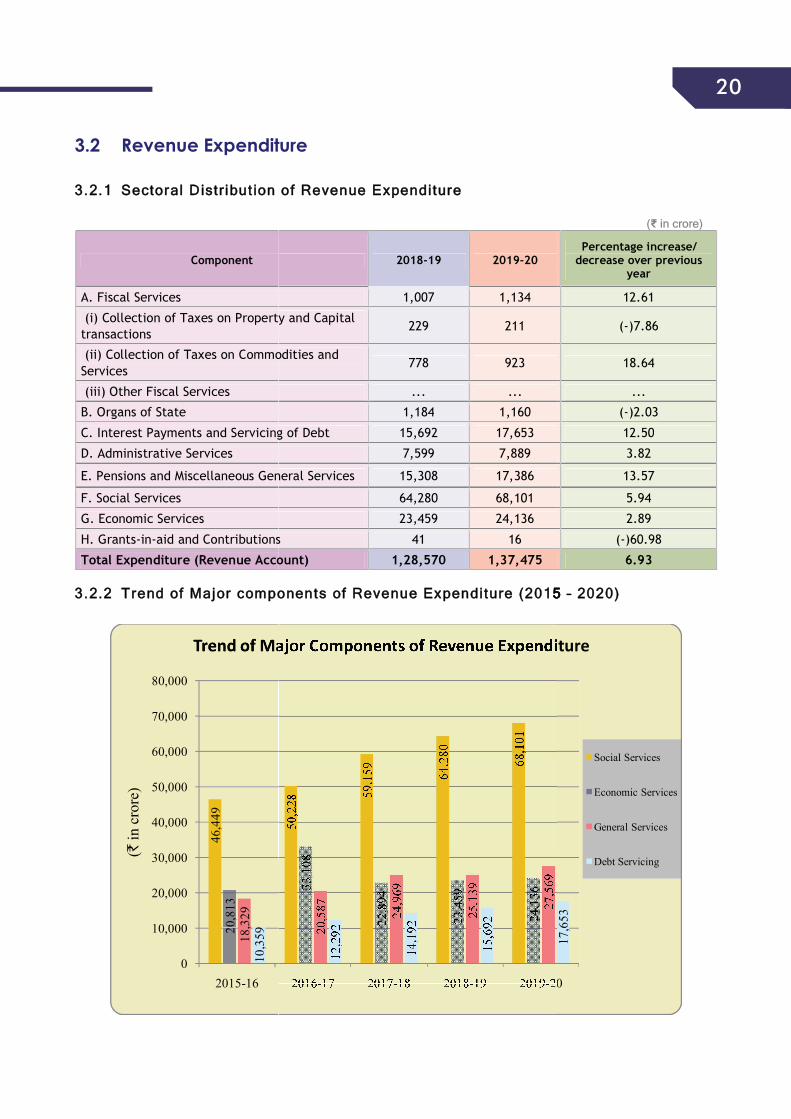
1,007 1,134
(i) Collection of Taxes on Property and Capital 229 211
(ii) Collection of Taxes on Commodities and 778 923
... ...
1,184 1,160
C. Interest Payments and Servicing of Debt 15,692 17,653
7,599 7,889
E. Pensions and Miscellaneous General Services 15,308 17,386
64,280 68,101
23,459 24,136
aid and Contributions 41 16
Total Expenditure (Revenue Account) 1,28,570 1,37,475
50,2
28
59,1
59 64,2
80
68,1
01
33,1
08
22,8
94
23,4
59
24,1
36
20,5
87 24,9
69
25,1
39
27,5
69
12,2
92
14,1
92
15,6
92
2016-17 2017-18 2018-19 2019-20
Trend of Major Components of Revenue ExpenditureTrend of Major Components of Revenue ExpenditureTrend of Major Components of Revenue ExpenditureTrend of Major Components of Revenue Expenditure
20
3.2 Revenue Expenditure
33..22..11 SSeeccttoorraall DDiissttrr iibbuutt iioonn ooff RReevveennuuee EExxppeennddii ttuurree
((₹ iinn ccrroorree))
Percentage increase/ decrease over previous
year
12.61
(-)7.86
18.64
...
(-)2.03
12.50
3.82
13.57
5.94
2.89
(-)60.98
6.93
33..22..22 TTrreenndd ooff MMaajjoorr ccoommppoonneennttss ooff RReevveennuuee EExxppeennddii ttuurree ((2200115555 –– 22002200))
17,6
53
20
Trend of Major Components of Revenue Expenditure
Social Services
Economic Services
General Services
Debt Servicing

21
21
33..22..33 SShhoorrtt ffaall ll ooff RReevveennuuee EExxppeennddiittuurree
The shortfall of Revenue Expenditure against budget estimates during the past five years is given
below:((₹₹ iinn ccrroorree))
Year 2015-16 2016-17 2017-18 2018-19 2019-20
Budget Estimates 97,425 1,14,168 1,25,912 1,50,272 1,80,476
Actuals 95,950 1,16,215 1,21,214 1,28,570 1,37,475
Gap (-)1,475 2,047 (-)4,698 (-)21,702 (-)43,001
Percentage of variation of Actuals against BE
(-)1 2 (-)3.73 (-)14.44 (-)23.83
In 2019-20 the State Government did not incur the planned revenue expenditure / budgeted revenue
expenditure leading to shortfall of 23.83% of budget estimates.
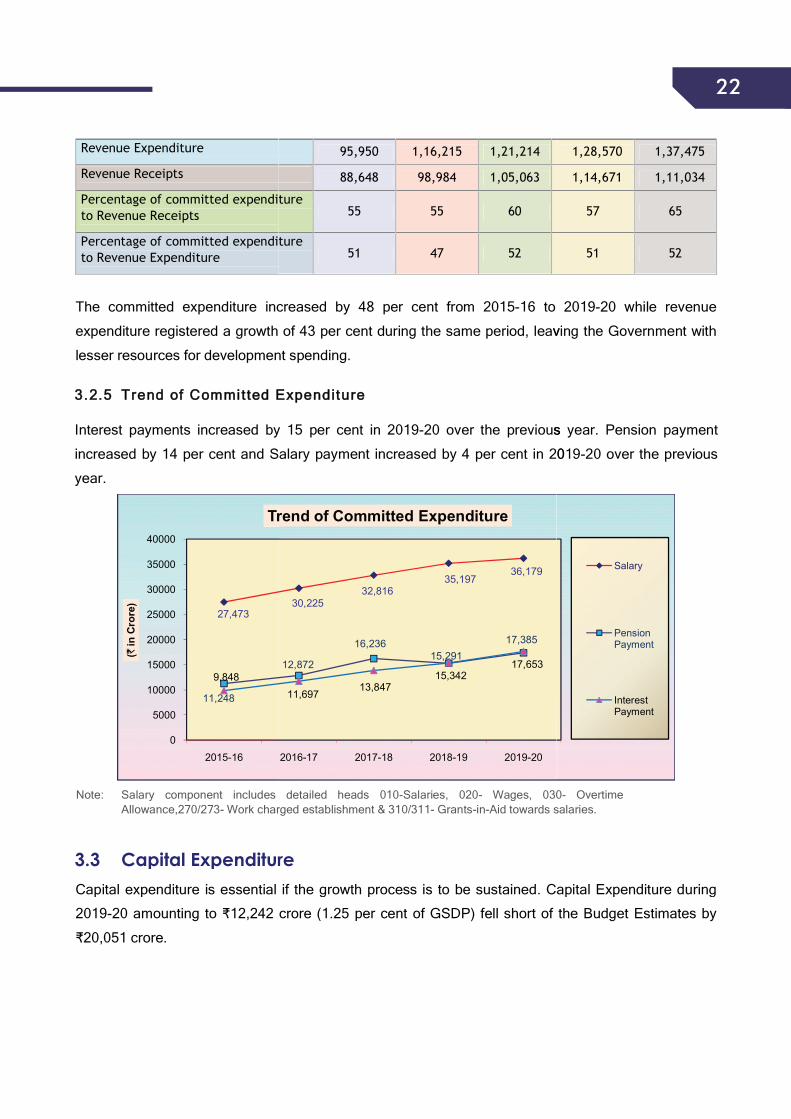
33..22..44 CCoommmmiitt tteedd EExxppeennddiittuurree
Expenditure on Salaries, Interest Payments and Pensions is treated as Committed Expenditure.
Around 51.80 per cent of the revenue expenditure was incurred on committed expenses such as7Salaries (₹36,179 crore), Interest Payments (₹17,653 crore) and Pensions (₹17,386 crore) which is
the committed liability of the state government.
The position of Committed Revenue Expenditure over the last five years is given below:((₹₹ iinn ccrroorree))
Component 2015-16 2016-17 2017-18 2018-19 2019-20
Total revenue expenditure 95,950 1,16,215 1,21,214 1,28,570 1,37,475
Committed revenue expenditure # 48,099 55,170 62,364 65,226 71,218
Percentage of committed revenue expenditure to total revenue expenditure
50 47 51 51 52
# Committed revenue expenditure includes expenditure on Salaries, Interest Payments and Pensions. The ratio of Committed Expenditure to Revenue Expenditure and Revenue Receipts over the past five
years is given below: (₹₹ iinn ccrroorree)
Component 2015-16 2016-17 2017-18 2018-19 2019-20
Committed Expenditure 48,569 54,794 62,899 65,830 71,811*
7Includes detailed heads 010-Salaries (₹32,520 crore), 020-Wages (₹56 crore), 030-Overtime allowance (₹0.04 crore), 270/273, Work charged establishment (₹141 crore) & 310/311-Grants-in-aid towards salaries (₹3,462 crore). *Includes Salaries of ₹594 crore booked under Capital.
22
Revenue Expenditure
Revenue Receipts
Percentage of committed expenditure to Revenue Receipts
Percentage of committed expenditure to Revenue Expenditure
Note: Salary component includes detailed heads 010Allowance,270/273- Work charged
3.3 Capital ExpenditureCapital expenditure is essential if the growth process is to be sustained. Capital Expenditure during
2019-20 amounting to ₹12,242 crore (1.25
₹20,051 crore.
27,473
11,248
9,848
0
5000
10000
15000
20000
25000
30000
35000
40000
2015-16
(in
Cro
re)
Trend of Committed Expenditure
95,950 1,16,215 1,21,214
88,648 98,984 1,05,063
Percentage of committed expenditure 55 55 60
Percentage of committed expenditure 51 47 52
Salary component includes detailed heads 010-Salaries, 020- Wages, 030charged establishment & 310/311- Grants-in-Aid towards salaries.
Capital ExpenditureCapital expenditure is essential if the growth process is to be sustained. Capital Expenditure during
12,242 crore (1.25 per cent of GSDP) fell short of the
Trend of Committed ExpenditureTrend of Committed Expenditure
30,22532,816
35,19736,179
12,872
16,23615,291
17,385
11,69713,847
15,34217,653
2019-202018-192017-182016-17
Trend of Committed Expenditure
22 1,28,570 1,37,475
1,14,671 1,11,034
57 65
51 52
to The committed expenditure increased by 48 per cent from 2015-16 to 2019-20 while revenue
expenditure registered a growth of 43 per cent during the same period, leavving the Government with
lesser resources for development spending.
33..22..55 TTrreenndd ooff CCoommmmii tt tteedd EExxppeennddiittuurree
Interest payments increased by 15 per cent in 2019-20 over the previouss year. Pension payment
increased by 14 per cent and Salary payment increased by 4 per cent in 20019-20 over the previous
year.
Wages, 030- Overtime Aid towards salaries.
Capital expenditure is essential if the growth process is to be sustained. Capital Expenditure during
of the Budget Estimates by
Salary
Pension Payment
Interest Payment
23
23
33..33..11 DDiissttrr iibbuutt iioonn ooff CCaappiittaall EExxppeennddii ttuurree
During 2019-20, Government spent ₹4,275 crore on various irrigation projects (₹3,630 crore on Major
Irrigation, ₹17 crore on Medium Irrigation, and ₹628 crore on Minor Irrigation) and ₹4 crore on Ports
and Light Houses. Apart from the above, the Government spent ₹411 crore on construction of
Buildings, ₹753 crore on construction of Roads and Bridges, ₹312 crore on Rural Water Supply
Schemes, ₹NIL crore on investment in various Corporations/Companies/Societies and ₹6,487 crore
on other Capital Expenditure.
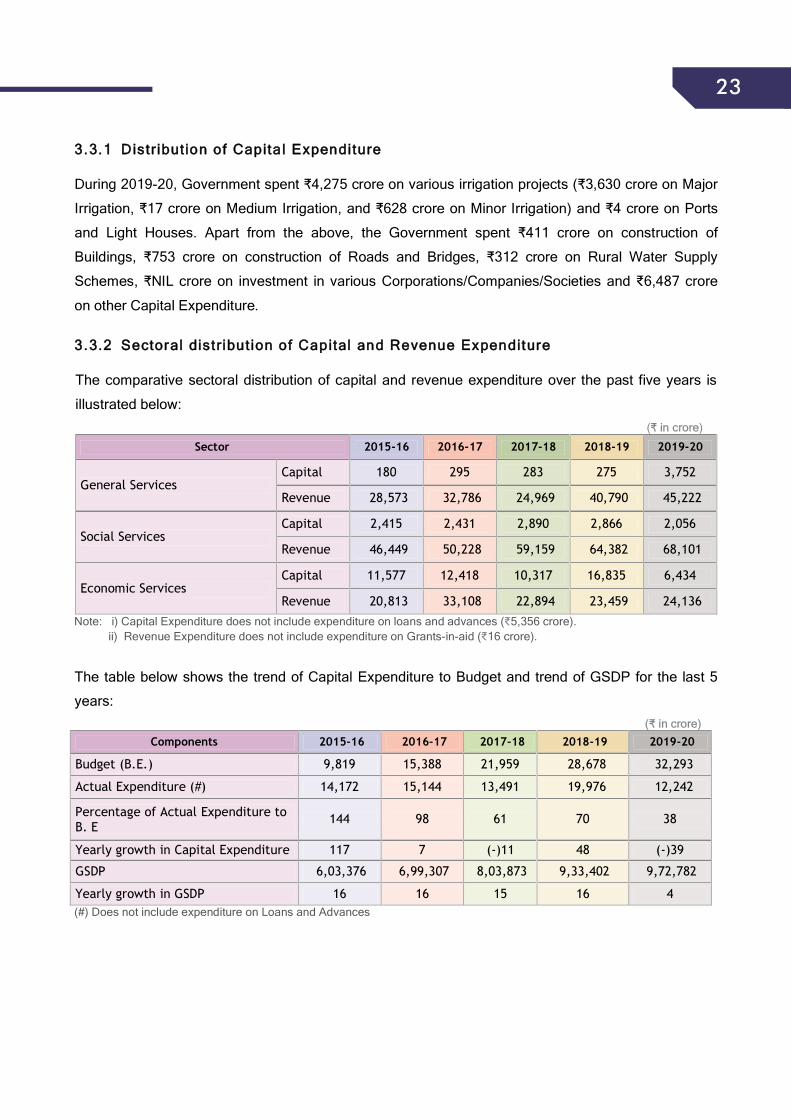
33..33..22 SSeeccttoorraall ddiissttrr iibbuutt iioonn ooff CCaappiittaall aanndd RReevveennuuee EExxppeennddiittuurree
The comparative sectoral distribution of capital and revenue expenditure over the past five years is
illustrated below:(₹₹ iinn ccrroorree)
Sector 2015-16 2016-17 2017-18 2018-19 2019-20
General Services Capital 180 295 283 275 3,752
Revenue 28,573 32,786 24,969 40,790 45,222
Social Services Capital 2,415 2,431 2,890 2,866 2,056
Revenue 46,449 50,228 59,159 64,382 68,101
Economic Services Capital 11,577 12,418 10,317 16,835 6,434
Revenue 20,813 33,108 22,894 23,459 24,136 Note: i) Capital Expenditure does not include expenditure on loans and advances (₹5,356 crore). ii) Revenue Expenditure does not include expenditure on Grants-in-aid (₹16 crore).
The table below shows the trend of Capital Expenditure to Budget and trend of GSDP for the last 5
years: ((₹₹ iinn ccrroorree))
Components 2015-16 2016-17 2017-18 2018-19 2019-20
Budget (B.E.) 9,819 15,388 21,959 28,678 32,293
Actual Expenditure (#) 14,172 15,144 13,491 19,976 12,242
Percentage of Actual Expenditure to B. E
144 98 61 70 38
Yearly growth in Capital Expenditure 117 7 (-)11 48 (-)39
GSDP 6,03,376 6,99,307 8,03,873 9,33,402 9,72,782
Yearly growth in GSDP 16 16 15 16 4 (#) Does not include expenditure on Loans and Advances

24
24
CHAPTER 4 APPROPRIATION ACCOUNTS 4.1 Summary of Appropriation Accounts
((₹ iinn ccrroorree))
Nature of Expenditure
Original Grant
Supplementary Grant
Total Budget
Actual expenditure
Savings (-) Excesses (+)
SSuurrrreennddeerr ((bbyy wwaayy ooff rree--aapppprroopprriiaattiioonn))
Revenue
Voted 1,67,620 10,684 1,78,304 1,33,427 (-)44,877 (-)52,128
Charged 16,555 33 16,588 17,764 (+)1,176 (-)38
Capital
Voted 32,850 401 33,251 12,637 (-)20,614 (-)20,547
Charged 56 69 125 83 (-)42 (-)42
Public Debt
Charged 13,395 23 13,418 79,366 (+)65,948 Nil
Loans and Advances
Voted 1,811 4,782 6,593 5,359 (-)1,234 (-)861
Grand Total
Grand Total 22,,3322,,228877 1155,,999922 22,,4488,,227799 22,,4488,,663366 ((++))335577 ((--))7733,,661166
4.2 Significant Savings
Substantial savings under a Grant indicates either non-implementation / slow implementation of
certain schemes / programs or inaccurate budget estimation. Some Grants with persistent and
significant savings (percentage of budget) are given below:

25
25
Grant No. Grant Name Section Budget
(₹₹ in crore) Expenditure (₹₹ in crore)
Saving (₹₹ in crore)
% of Saving
III Administration of
Justice Capital (Voted) 70.00 26.37 43.63 62.33
IV General Administration and Elections:
Capital (Voted) 11.60 3.13 8.47 73.02
VII Commercial Taxes: Capital (Voted) 12 0.13 11.87 98.92
VIII Transport Administration:
Revenue(Voted) 643.35 147.30 496.50 77.17
Capital (Voted) 10 1.35 8.65 86.50
IX
Fiscal Administration
Planning Surveys and
Statistics:
Capital(Voted) 624.08 28.99 595.09 95.35
Loans(Voted) 405.18 32.00 373.18 92.10
XI Roads and Buildings:
Revenue(Charged) 2.71 0.47 2.24 82.66
Capital(Voted) 2883.86 974.28 1909.58 66.22
Loans(Voted) 1000 300 700 70
XII School Education: Capital (Voted) 1684.26 150.94 1533.32 91.04
XIV Technical Education: Capital (Voted) 126 35.49 90.51 71.83
XVI Medical and Health: Capital (Voted) 2670.65 204.41 2466.23 92.35
XVII Municipal Administration and Urban Development:
Capital(Voted) 1693.02 540.66 1152.36 68.07
XVIII Housing: Revenue(Voted) 3543.09 937.02 2606.06 73.55
Loans(Voted) 74.29 26.37 47.91 64.49
XX Labour and Employment: Capital (Voted) 134.02 11.72 122.29 91.25
XXI Social Welfare: Capital (Voted) 130.51 41.62 88.89 68.11
XXIV Minority Welfare: Capital (Voted) 40.05 2.78 37.27 93.06
XXV Women Child and Disabled Welfare: Capital(Voted) 169.57 18.25 151.13 89.13
XXVII Agriculture: Revenue(Voted) 17568 6805.32 10762.68 61.26
Capital(Voted) 562.83 123.96 438.87 77.98
XXVIII Animal Husbandry and Fisheries: Capital(Voted) 334.29 49.95 284.34 85.06
XXXII Rural Development: Revenue(voted) 23273.18 4493.43 18779.75 80.69
XXXIII Major and Medium Irrigation Capital (Voted) 11193.95 3659.35 7534.60 67.31
XXXVI Industries and Commerce
Revenue(Voted) 2484.52 818.01 1666.51 67.08
Capital(Voted) 1449.52 478.00 971.52 67.02
XXXVIII Civil Supplies Administration: Revenue(Voted) 4466.95 501.93 3965.02 88.76
XXXIX Information Technology Electronics and Communications:
Revenue(Voted) 350.76 82.91 267.85 76.36
26
26
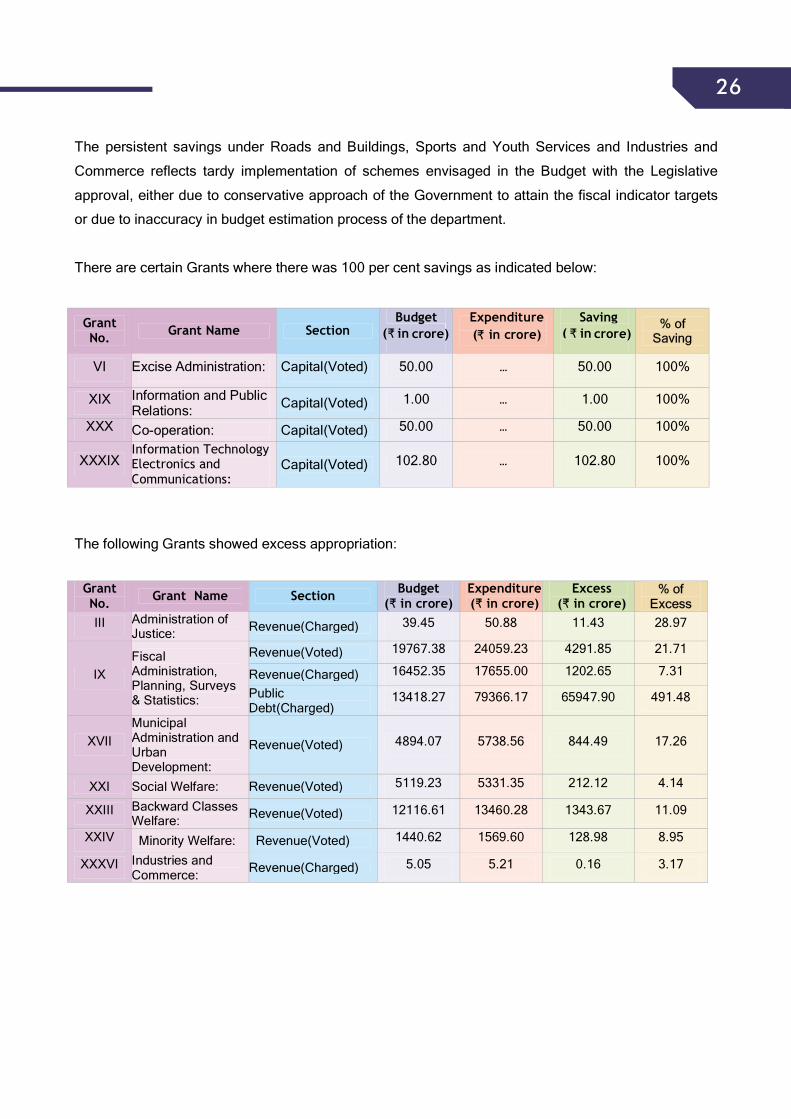
The persistent savings under Roads and Buildings, Sports and Youth Services and Industries and
Commerce reflects tardy implementation of schemes envisaged in the Budget with the Legislative
approval, either due to conservative approach of the Government to attain the fiscal indicator targets
or due to inaccuracy in budget estimation process of the department.
There are certain Grants where there was 100 per cent savings as indicated below:
The following Grants showed excess appropriation:
Grant No. Grant Name Section
Budget(₹ in crore)
Expenditure (₹ in crore)
Saving ( ₹ in crore)
%% ooff SSaavviinngg
VI Excise Administration: Capital(Voted) 50.00 … 50.00 100%
XIX Information and Public Relations: Capital(Voted) 1.00 … 1.00 100%
XXX Co-operation: Capital(Voted) 50.00 … 50.00 100%
XXXIX Information Technology Electronics and Communications:
Capital(Voted) 102.80 … 102.80 100%
Grant No. Grant Name Section Budget
(₹ in crore) Expenditure (₹ in crore)
Excess (₹ in crore)
%% ooff EExxcceessss
III Administration of Justice: Revenue(Charged) 39.45 50.88 11.43 28.97
IX Fiscal Administration, Planning, Surveys & Statistics:
Revenue(Voted) 19767.38 24059.23 4291.85 21.71
Revenue(Charged) 16452.35 17655.00 1202.65 7.31
Public Debt(Charged)
13418.27 79366.17 65947.90 491.48
XVII Municipal Administration and Urban Development:
Revenue(Voted) 4894.07 5738.56 844.49 17.26
XXI Social Welfare: Revenue(Voted) 5119.23 5331.35 212.12 4.14
XXIII Backward Classes Welfare: Revenue(Voted) 12116.61 13460.28 1343.67 11.09
XXIV Minority Welfare: Revenue(Voted) 1440.62 1569.60 128.98 8.95
XXXVI Industries and Commerce: Revenue(Charged) 5.05 5.21 0.16 3.17
27
27
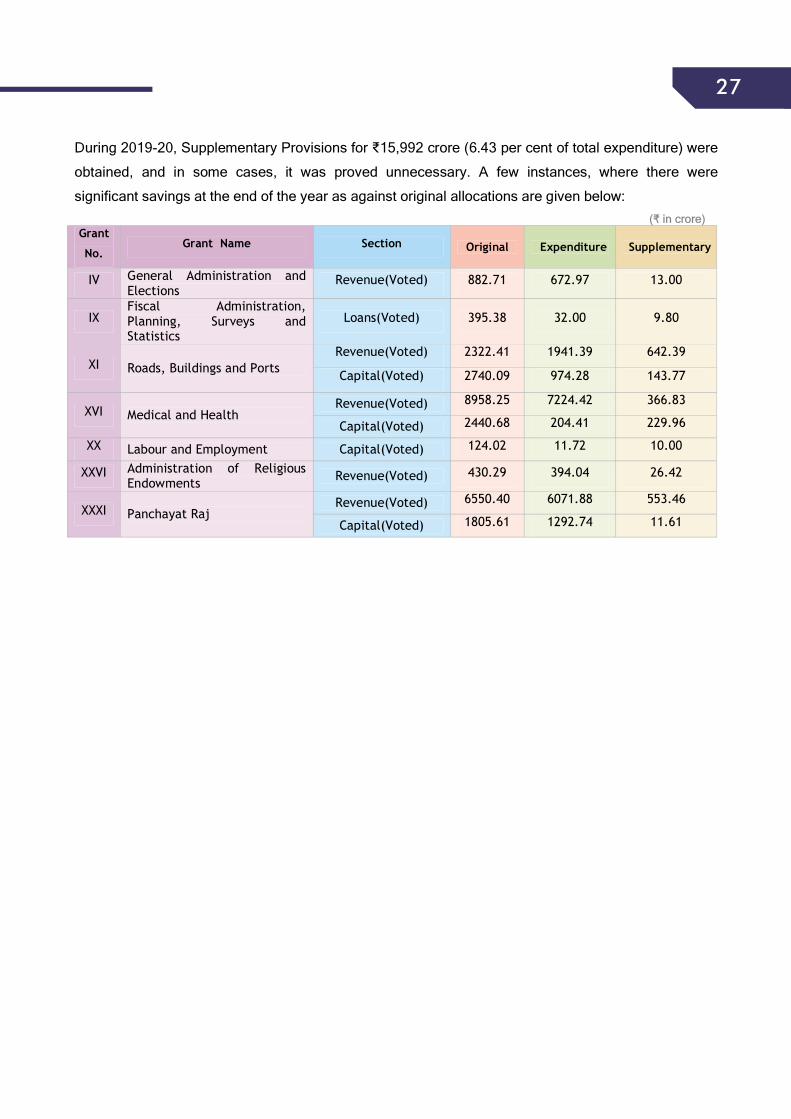
During 2019-20, Supplementary Provisions for ₹15,992 crore (6.43 per cent of total expenditure) were
obtained, and in some cases, it was proved unnecessary. A few instances, where there were
significant savings at the end of the year as against original allocations are given below: ((₹₹ iinn ccrroorree))
Grant
No. Grant Name Section Original Expenditure Supplementary
IV General Administration and Elections
Revenue(Voted) 882.71 672.97 13.00
IX Fiscal Administration, Planning, Surveys and Statistics
Loans(Voted) 395.38 32.00 9.80
XI Roads, Buildings and Ports Revenue(Voted) 2322.41 1941.39 642.39
Capital(Voted) 2740.09 974.28 143.77
XVI Medical and Health Revenue(Voted) 8958.25 7224.42 366.83
Capital(Voted) 2440.68 204.41 229.96
XX Labour and Employment Capital(Voted) 124.02 11.72 10.00
XXVI Administration of Religious Endowments Revenue(Voted) 430.29 394.04 26.42
XXXI Panchayat Raj Revenue(Voted) 6550.40 6071.88 553.46
Capital(Voted) 1805.61 1292.74 11.61
28
28
CHAPTER 5 ASSETS AND LIABILITIES 5.1 Assets The existing form of accounts do not depict valuation of Government assets like land, buildings etc.,
except in the year of acquisition/purchase. Similarly, while the accounts present the impact of liabilities
arising in the current year, they do not depict the overall impact of the liabilities to future generations
except to the limited extent shown by the rate of interest and period of existing loans.
Total Investments as Share Capital in non-financial Public Sector Undertakings (PSUs) stood at
₹9,497 crore at the end of 2019-2020. An amount of ₹4.46 crore (0.05 per cent of investment) was
received as dividends indicating an inadequate return on investment.
Cash balance with the RBI stood at ₹25 crore on 1st April 2019 and increased to ₹485 crore at the
end of 31 March 2020. Government had invested an amount of ₹50,833 crore in 14 days treasury bills
in 2019-20 and rediscounted bills worth ₹45,700 crore leaving a closing cash balance investment of
₹5,133 crore at the end of the year.
5.2 Debt and Liabilities Article 293 of the Constitution of India empowers the State Government to borrow on the security of
the Consolidated Fund. Government of India, from time to time determines, the limit up to which State
Governments can borrow from the market which is ₹42,513 crore for 2019-20. Against this,
Government of Andhra Pradesh availed of open market borrowings totaling ₹42,415 crore during
2019-20.
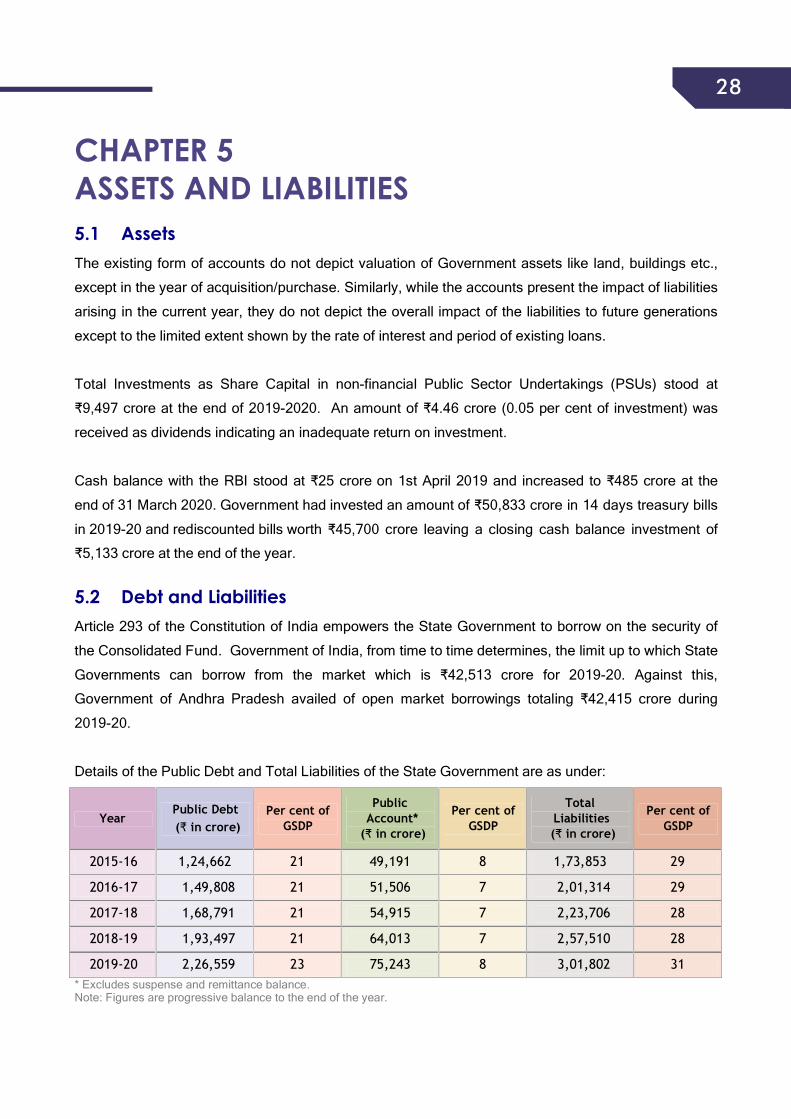
Details of the Public Debt and Total Liabilities of the State Government are as under:
Year Public Debt (₹ in crore)
Per cent of GSDP
Public Account*
(₹ in crore)
Per cent of GSDP
Total Liabilities (₹ in crore)
Per cent of GSDP
2015-16 1,24,662 21 49,191 8 1,73,853 29
2016-17 1,49,808 21 51,506 7 2,01,314 29
2017-18 1,68,791 21 54,915 7 2,23,706 28
2018-19 1,93,497 21 64,013 7 2,57,510 28
2019-20 2,26,559 23 75,243 8 3,01,802 31 * Excludes suspense and remittance balance. Note: Figures are progressive balance to the end of the year.
2929
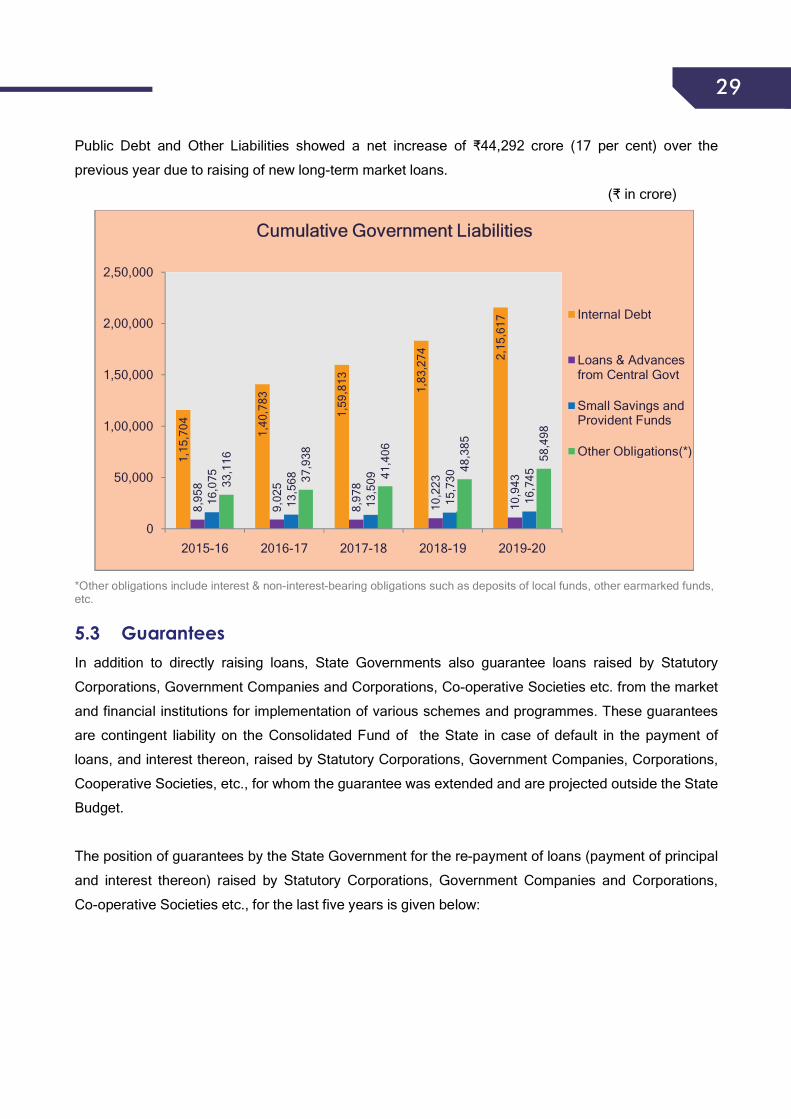
Public Debt and Other Liabilities showed a net increase of ₹44,292 crore (17 per cent) over the
previous year due to raising of new long-term market loans.
(₹ in crore)
*Other obligations include interest & non-interest-bearing obligations such as deposits of local funds, other earmarked funds, etc.
5.3 Guarantees In addition to directly raising loans, State Governments also guarantee loans raised by Statutory
Corporations, Government Companies and Corporations, Co-operative Societies etc. from the market
and financial institutions for implementation of various schemes and programmes. These guarantees
are contingent liability on the Consolidated Fund of the State in case of default in the payment of
loans, and interest thereon, raised by Statutory Corporations, Government Companies, Corporations,
Cooperative Societies, etc., for whom the guarantee was extended and are projected outside the State
Budget.
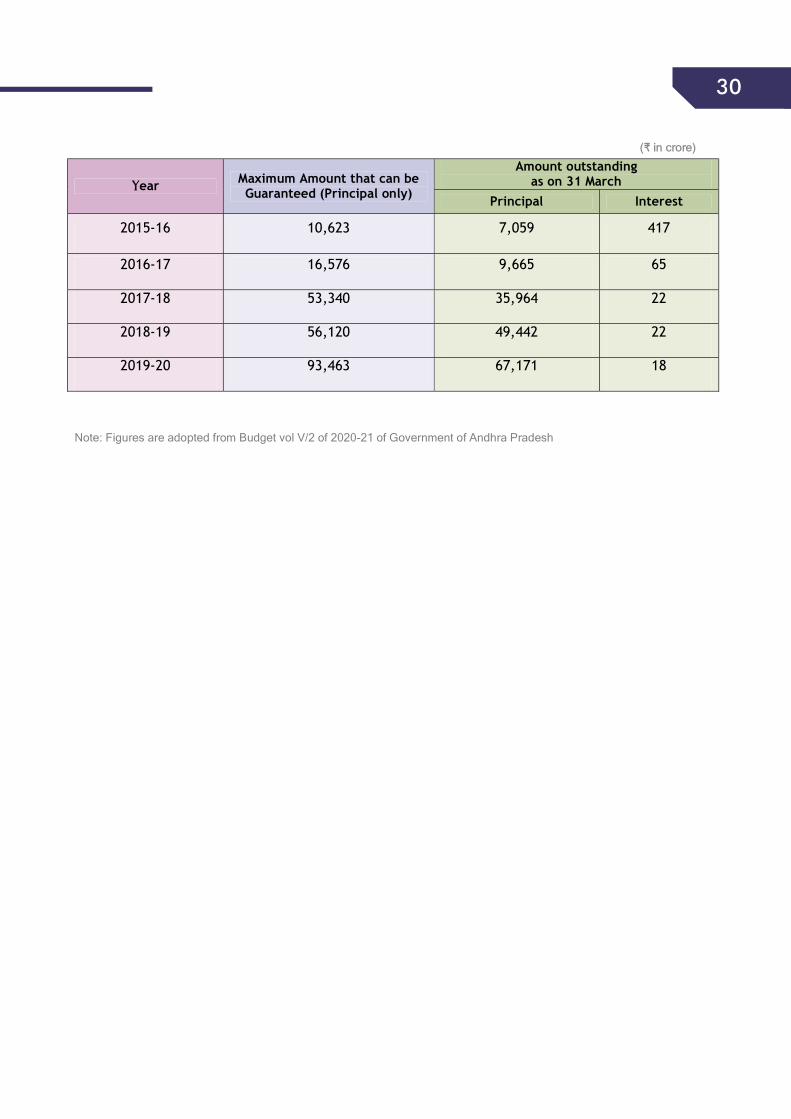
The position of guarantees by the State Government for the re-payment of loans (payment of principal
and interest thereon) raised by Statutory Corporations, Government Companies and Corporations,
Co-operative Societies etc., for the last five years is given below:
1,15
,704 1,40
,783
1,59
,813
1,83
,274 2,
15,6
17
8,95
8
9,02
5
8,97
8
10,2
23
10,9
43
16,0
75
13,5
68
13,5
09
15,7
30
16,7
4533,1
16
37,9
38
41,4
06
48,3
85
58,4
980
50,000
1,00,000
1,50,000
2,00,000
2,50,000
2015-16 2016-17 2017-18 2018-19 2019-20
CCuummuullaattiivvee GGoovveerrnnmmeenntt LLiiaabbiilliittiieess
Internal Debt
Loans & Advances from Central Govt
Small Savings and Provident Funds
Other Obligations(*)
30
30 ((₹₹ iinn ccrroorree))
Note: Figures are adopted from Budget vol V/2 of 2020-21 of Government of Andhra Pradesh
YYear Maximum Amount that can be Guaranteed (Principal only)
Amount outstanding as on 31 March
Principal Interest
2015-16 10,623 7,059 417
2016-17 16,576 9,665 65
2017-18 53,340 35,964 22
2018-19 56,120 49,442 22
2019-20 93,463 67,171 18
31
31
CHAPTER 6 OTHER ITEMS 6.1 Adverse Balances under Internal Debt From time to time, the Government of Andhra Pradesh, assumed the liabilities of various institutions by permitting them to borrow from the open market / financial institutions, with the Government taking over the responsibility for repayment. As on 31 March 2020, an adverse balance of ₹110 crore exists under MH 6003-Internal Debt. Adverse balance arises in a loan account when the amount repaid is more than the loan amount or due to misclassification. Out of this, ₹86 crore represents loans availed of by the Andhra Pradesh Road Development Corporation, ₹8 crore by Rural Electric Corporation and ₹9 crore pertains to repayments on behalf of Co-operatives and ₹5 crore from HUDCO and ₹2 crore from SBH. The PAG (A&E) has been requesting the State Government to provide adequate budget provision to clear the adverse balance under MH 6003.
6.2 Loans and Advances by the State Government The total Loans and Advances made by the State Government at the end of 2019-2020 was ₹32,769 crore. Of this, Loans and Advances to Government Corporations / Companies, Non-Government Institutions and Local Bodies amounted to ₹32,368 crore. Recovery of principal aggregating to ₹29,871 crore and interest amounting to ₹18,664 crore is in arrears at the end of 31 March 2020. During 2019-20, only ₹4,355 crore has been received towards repayment of Loans and Advances, out of which ₹48 crore relate to repayment of loans to Government Servants. Effective steps to recover the outstanding loans would facilitate the Government to maintain better fiscal position.
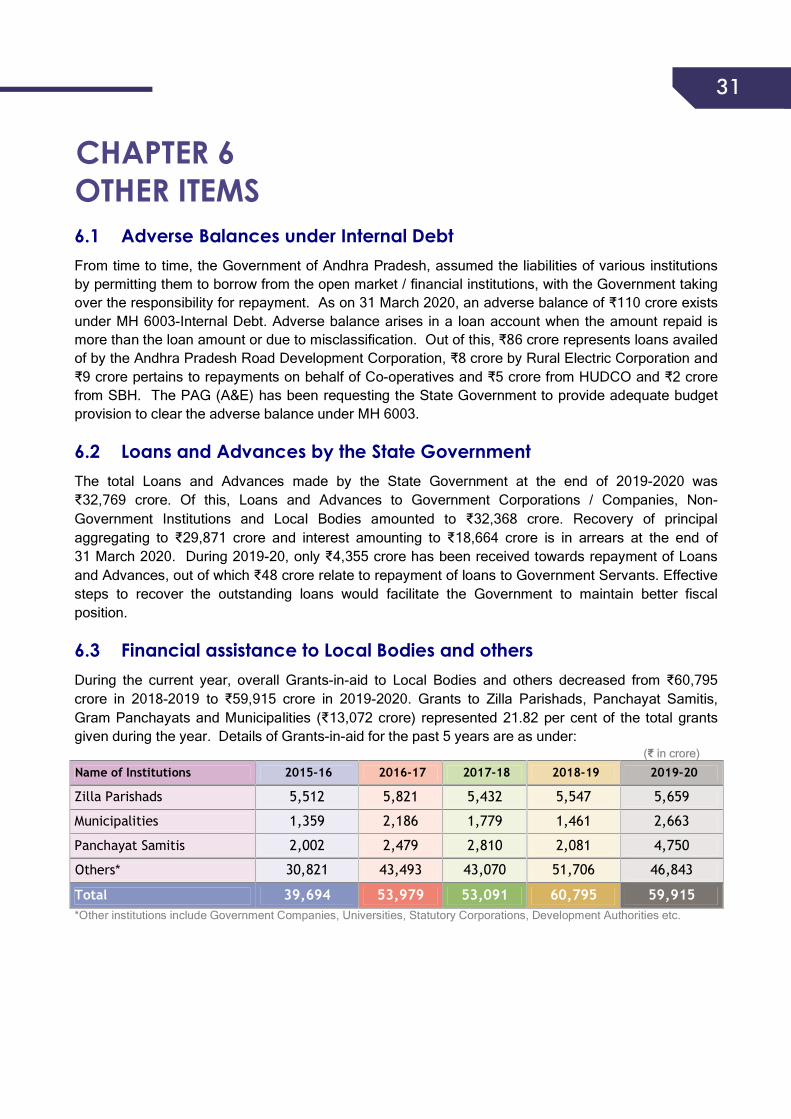
6.3 Financial assistance to Local Bodies and others During the current year, overall Grants-in-aid to Local Bodies and others decreased from ₹60,795 crore in 2018-2019 to ₹59,915 crore in 2019-2020. Grants to Zilla Parishads, Panchayat Samitis, Gram Panchayats and Municipalities (₹13,072 crore) represented 21.82 per cent of the total grants given during the year. Details of Grants-in-aid for the past 5 years are as under:
((₹ iinn ccrroorree))
Name of Institutions 2015-16 2016-17 2017-18 2018-19 2019-20
Zilla Parishads 5,512 5,821 5,432 5,547 5,659
Municipalities 1,359 2,186 1,779 1,461 2,663
Panchayat Samitis 2,002 2,479 2,810 2,081 4,750
Others* 30,821 43,493 43,070 51,706 46,843
Total 39,694 53,979 53,091 60,795 59,915 *Other institutions include Government Companies, Universities, Statutory Corporations, Development Authorities etc.

32
32 6.4 Cash Balance and Investment of Cash Balance
((₹ iinn ccrroorree))
Component As on
01 April 2019 As on
31 March 2020
Net increase (+)/ decrease (-)
Cash Balances 25 485 (+)460 Investment from cash balance (GoI Treasury Bills)
Nil 5,133 5,133
Other Cash Balances 3 3 0 a) Departmental Balances 1 1 0 b) Permanent Cash Imprest 2 2 0 Investment from earmarked fund balances 8,361 9,073 712
(a) Sinking Fund 7,613 8,260 647
(b) Guarantee Redemption Fund 742 808 66
(c ) Other Funds 6 5 (-)1
Interest realized during the year 685 758 73
State Government had a positive closing cash balance at the end of 2019-20. It invested ₹9,073 crore
towards cash balances and earmarked fund (Consolidated Sinking Fund, Guarantee Redemption
Fund, etc.) balances.
6.5 Reconciliation of accounts Accountant General (A&E) receives compiled accounts from the Treasuries and PAOs. Funds are
placed at the disposal of Chief Controlling Officers (CCOs) for incurring expenditure. Accuracy of the
accounts maintained by the CCOs is an important requirement for effective budgetary control. The
Financial Rules stipulate that CCOs should reconcile the receipts and expenditure recorded in their
books every month with that recorded by the AG.
On the expenditure side, out of 180 CCOs, 113 CCOs have reconciled an amount of
₹1,21,285.97 crore (78.21 per cent of total expenditure of ₹1,55,075.81 crore) whereas on the
receipt side, there has been no reconciliation of the total receipts of ₹1,15,389.25 crore. The
State Government had stated that due to non-linkage of CCO-HoA for receipt classification,
reconciliation of receipts could not be done. However, necessary action was stated to have initiated
for the accounting year 2020-21.The figures are exclusive of the Public Debt which is handled by the
Accountant General. There is no assurance about the completeness and correctness of the receipts
and expenditure figures depicted in the Finance Accounts to the extent of non- reconciliation.
6.6 Submission of Accounts by Accounts rendering Units All the initial accounts were rendered by Treasuries & Pay and Accounts Officers (PAOs) of the Public
Works and Forest departments during the year and no accounts were excluded.
33
33
6.7 Advance Payments In terms of the Andhra Pradesh Financial Code (APFC), Drawing and Disbursing Officers are
authorised to draw sums of money by preparing Abstract Contingent (AC) bills by debiting service
heads. As per Government orders, Detailed Contingent (DC) bills are required to be presented
subsequently along with supporting documents. Delayed submission or prolonged non-submission of
supporting DC bills renders the expenditure under AC bills opaque. Further, to the extent of non-
receipt of DC bills, the expenditure shown in the Finance Accounts could not be vouched as correct or
final.
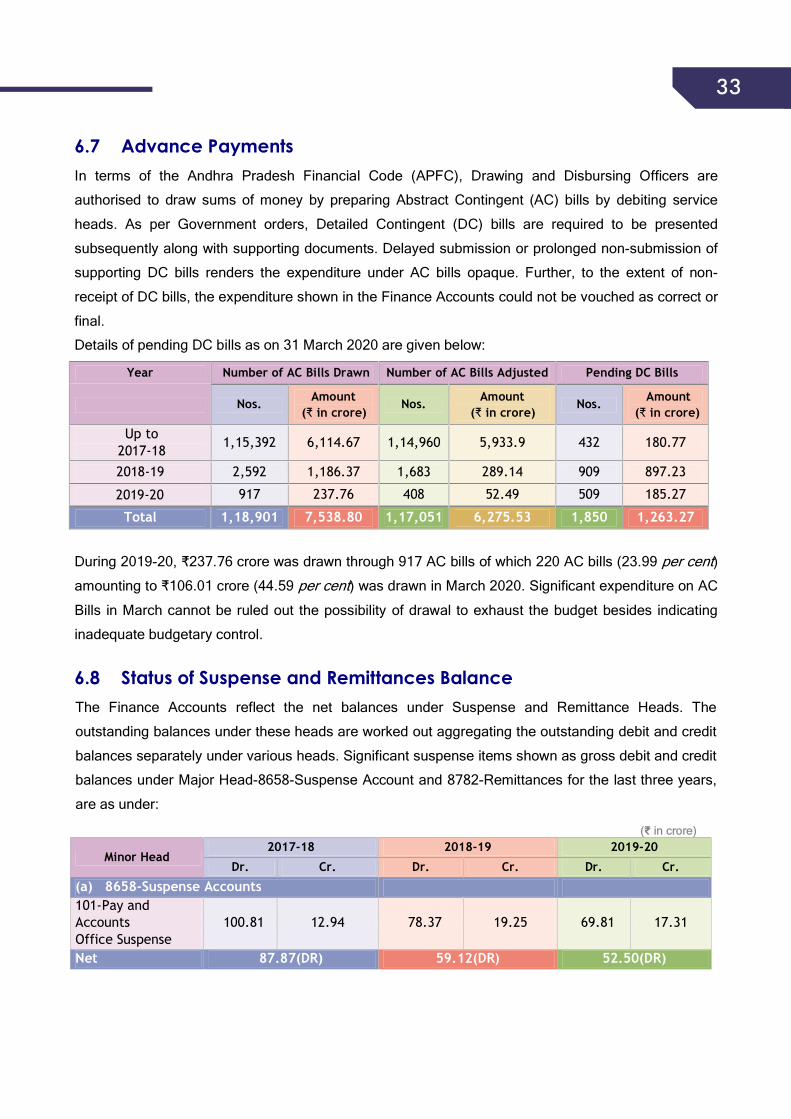
Details of pending DC bills as on 31 March 2020 are given below:
Year Number of AC Bills Drawn Number of AC Bills Adjusted Pending DC Bills
Nos. Amount(₹ in crore)
Nos. Amount(₹ in crore)
Nos. Amount(₹ in crore)
Up to 2017-18 1,15,392 6,114.67 1,14,960 5,933.9 432 180.77
2018-19 2,592 1,186.37 1,683 289.14 909 897.23
2019-20 917 237.76 408 52.49 509 185.27
Total 1,18,901 7,538.80 1,17,051 6,275.53 1,850 1,263.27
During 2019-20, ₹237.76 crore was drawn through 917 AC bills of which 220 AC bills (23.99 per cent)
amounting to ₹106.01 crore (44.59 per cent) was drawn in March 2020. Significant expenditure on AC
Bills in March cannot be ruled out the possibility of drawal to exhaust the budget besides indicating
inadequate budgetary control.
6.8 Status of Suspense and Remittances Balance The Finance Accounts reflect the net balances under Suspense and Remittance Heads. The
outstanding balances under these heads are worked out aggregating the outstanding debit and credit
balances separately under various heads. Significant suspense items shown as gross debit and credit
balances under Major Head-8658-Suspense Account and 8782-Remittances for the last three years,
are as under:
((₹ iinn ccrroorree))
Minor Head 2017-18 2018-19 2019-20
Dr. Cr. Dr. Cr. Dr. Cr.
(a) 8658-Suspense Accounts 101-Pay and Accounts Office Suspense
100.81 12.94 78.37 19.25 69.81 17.31
Net 87.87(DR) 59.12(DR) 52.50(DR)

34
34 102-Suspense Account (Civil)
264.03 309.98 380.87 282.25 473.19 317.42
Net 45.95(CR) 98.62(DR) 155.77(DR) 110-Reserve Bank Suspense-Central Accounts Office
295.76 141.83 252.37 82.73 356.77 82.73
Net 153.93(DR) 169.64(DR) 274.04(DR) (b) 8782- Remittance Accounts 102-Public Works Remittances 76,007.41 77,211.80 76,007.41 75,328.35 76,007.41 75,318.64
Net 12,04.39(CR) 6,79.06(DR) 6,88.77(DR) 103-Forest Remittances 438.96 617.42 438.96 617.55 439.12 617.44
Net 178.46(CR) 178.59(CR) 178.32(CR)
6.9 Commitments on account of Incomplete Capital Works A total expenditure of ₹24,008 crore was incurred upto the year 2019-20 by the State Government on
various incomplete projects against an estimated cost of ₹40,161 crore. The estimated cost was
further revised to ₹51,758 crore to end of 2019-20.
During 2019-20, a total expenditure of ₹2,308 crore incurred by the State Government on various
projects taken up by Engineering Departments. An amount of ₹1,301 crore was due to be paid to the
end of 31-03-2020. The original estimated cost (₹40,161 crore) increased by 29 per cent in revised
estimates on various projects.
A summarized view on commitments on account of “Incomplete Capital Works” is furnished below: ((₹ iinn ccrroorree))
S. No.
Category of works
Estimated cost of works
Expenditure during the
year
Progressive expenditure to the
end of the year
Pending payments
Estimated cost after revision
1 Roads 10,014 518 807 635 13,314
2 Bridges 132 31 31 12 173
3 Buildings 144 39 39 13 146
4 Others 29,871 1,720 23,188 641 38,125
TOTAL 40,161 2,308 24,065 1,301 51,758
6.10 Liabilities towards New Pension System:66..1100..11 LLiiaabb ii ll ii tt iieess ttoowwaarrddss PPeennss iioonnaarryy BBeenneeff ii ttss
During the period from 01 April 2019 to 31 March 2020, ₹16,417.37 crore (11.94 per cent of total
Revenue expenditure) was incurred on “Pension and Other Retirement Benefits” to State Government
employees recruited before 01 September 2004.

35
35 66..1100..22 NNaatt iioonnaall PPeennssiioonn SSyysstteemm
State Government employees recruited on or after 01 September 2004 are covered under the National
Pension System (NPS) which is a Defined Contribution Pension Scheme. In terms of the scheme, the
employee has to contribute 10 per cent of his/her monthly pay and dearness allowance and the State
Government has to make a matching contribution. The entire amount has to be transferred to the
designated fund manager through the National Securities Depository Limited (NSDL)/Trustee Bank.
Accountant General (Accounts and Entitlements) does not maintain the accounts of individual
employee’s contribution and, therefore, the correctness of recovery from the employee’s salary bills
cannot be verified. During 2019-20, the Government transferred ₹1,694.11 crore to NSDL, leaving
a balance of ₹721.50 crore as on 31 March 2020 on which the State Government is liable to pay
interest, which was not done.
Consequent on bifurcation of the erstwhile state of Andhra Pradesh in 2014, there was an
un-apportioned balance under NPS. After apportionments in the past years, the un-apportioned
balance at the end of 2019-20 was ₹365.43 crore. There was no apportionment during 2019-20. The
following table gives the details of transactions during the year excluding un-apportioned balance of
₹365.43 crore
((₹ in crore) Opening Balance
(A)
Employees’ contribution (B)
Government Contribution
(C)
Transfer to NSDL (D)
Closing Balance (A+B+C-D)
663.63 782.05 969.93 1694.11 721.50
The Government contribution was more than the Employees’ contribution for the year 2019-20 by
₹187.88 crore which was towards the shortfall of the previous years.
6.11 Personal Deposit (PD) Accounts
Government of Andhra Pradesh issued a G.O.Ms. No.99 dated 14.08.2019 wherein PD Accountability
Framework was introduced to provide comprehensive guidelines on Personal Deposit Account
Management.
In terms of the GO, Personal Deposits are virtual bank accounts that were conceptualized by the
Government to facilitate smooth operations at the field level for scheme implementation. Funds were
given under the PD Accounts for specific purposes by debiting the service heads in the Consolidated
Fund of the State and crediting the Personal Deposits under the Major Head 8443-Civil Deposits and
the Minor Head 106-Personal Deposits. Unspent balances in the PD accounts, if any, at the end of
the financial year should be lapsed by minus debit to the relevant service heads and the PD accounts.
All deposits lying unclaimed for more than three complete financial years shall be credited to the
36
36 Government at the close of March each year in terms of the provisions of Andhra Pradesh Financial
Code.
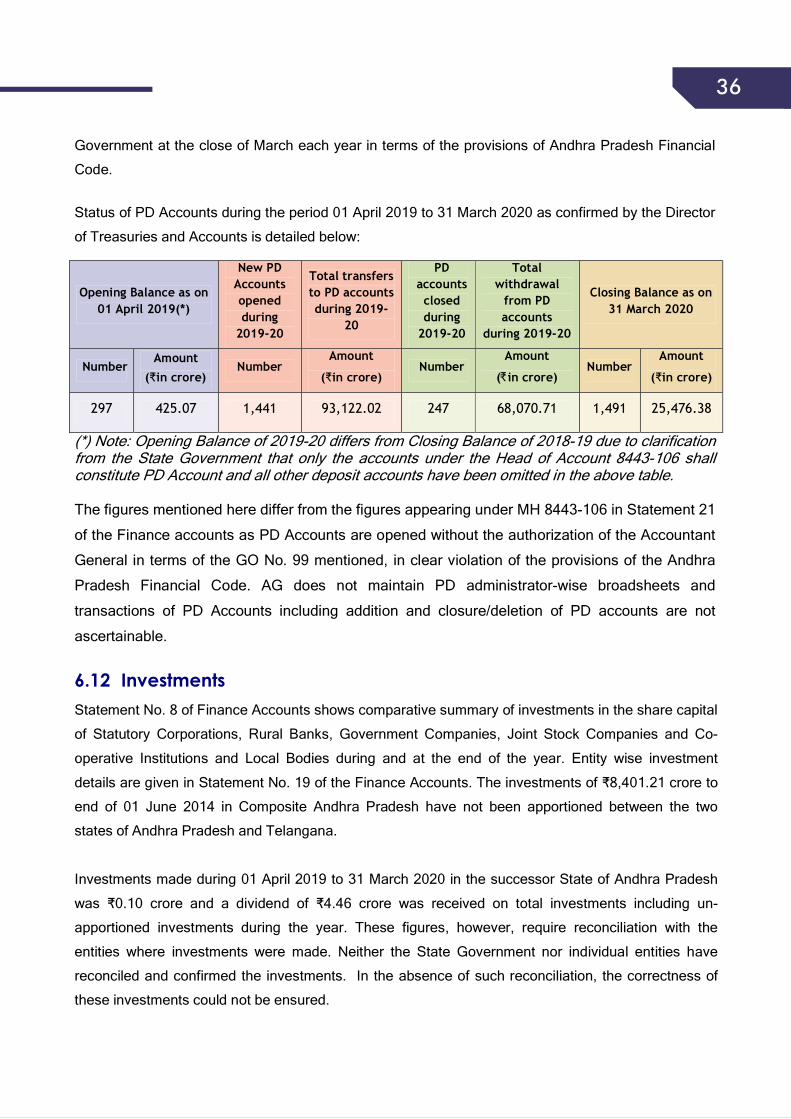
Status of PD Accounts during the period 01 April 2019 to 31 March 2020 as confirmed by the Director
of Treasuries and Accounts is detailed below:
Opening Balance as on 01 April 2019(*)
New PD Accounts opened during
2019-20
Total transfers to PD accounts during 2019-
20
PD accounts closed during
2019-20
Total withdrawal
from PD accounts
during 2019-20
Closing Balance as on 31 March 2020
Number Amount
(₹in crore) Number
Amount
(₹in crore) Number
Amount
(₹in crore) Number
Amount
(₹in crore)
297 425.07 1,441 93,122.02 247 68,070.71 1,491 25,476.38
(*) Note: Opening Balance of 2019-20 differs from Closing Balance of 2018-19 due to clarification from the State Government that only the accounts under the Head of Account 8443-106 shall constitute PD Account and all other deposit accounts have been omitted in the above table. The figures mentioned here differ from the figures appearing under MH 8443-106 in Statement 21
of the Finance accounts as PD Accounts are opened without the authorization of the Accountant
General in terms of the GO No. 99 mentioned, in clear violation of the provisions of the Andhra
Pradesh Financial Code. AG does not maintain PD administrator-wise broadsheets and
transactions of PD Accounts including addition and closure/deletion of PD accounts are not
ascertainable.
6.12 Investments Statement No. 8 of Finance Accounts shows comparative summary of investments in the share capital
of Statutory Corporations, Rural Banks, Government Companies, Joint Stock Companies and Co-
operative Institutions and Local Bodies during and at the end of the year. Entity wise investment
details are given in Statement No. 19 of the Finance Accounts. The investments of ₹8,401.21 crore to
end of 01 June 2014 in Composite Andhra Pradesh have not been apportioned between the two
states of Andhra Pradesh and Telangana.
Investments made during 01 April 2019 to 31 March 2020 in the successor State of Andhra Pradesh
was ₹0.10 crore and a dividend of ₹4.46 crore was received on total investments including un-
apportioned investments during the year. These figures, however, require reconciliation with the
entities where investments were made. Neither the State Government nor individual entities have
reconciled and confirmed the investments. In the absence of such reconciliation, the correctness of
these investments could not be ensured.
36 Government at the close of March each year in terms of the provisions of Andhra Pradesh Financial
Code.
Status of PD Accounts during the period 01 April 2019 to 31 March 2020 as confirmed by the Director
of Treasuries and Accounts is detailed below:
Opening Balance as on 01 April 2019(*)
New PD Accounts opened during
2019-20
Total transfers to PD accounts during 2019-
20
PD accounts closed during
2019-20
Total withdrawal
from PD accounts
during 2019-20
Closing Balance as on 31 March 2020
Number Amount
(₹in crore) Number
Amount
(₹in crore) Number
Amount
(₹in crore) Number
Amount
(₹in crore)
297 425.07 1,441 93,122.02 247 68,070.71 1,491 25,476.38
(*) Note: Opening Balance of 2019-20 differs from Closing Balance of 2018-19 due to clarification from the State Government that only the accounts under the Head of Account 8443-106 shall constitute PD Account and all other deposit accounts have been omitted in the above table. The figures mentioned here differ from the figures appearing under MH 8443-106 in Statement 21
of the Finance accounts as PD Accounts are opened without the authorization of the Accountant
General in terms of the GO No. 99 mentioned, in clear violation of the provisions of the Andhra
Pradesh Financial Code. AG does not maintain PD administrator-wise broadsheets and
transactions of PD Accounts including addition and closure/deletion of PD accounts are not
ascertainable.
6.12 Investments Statement No. 8 of Finance Accounts shows comparative summary of investments in the share capital
of Statutory Corporations, Rural Banks, Government Companies, Joint Stock Companies and Co-
operative Institutions and Local Bodies during and at the end of the year. Entity wise investment
details are given in Statement No. 19 of the Finance Accounts. The investments of ₹8,401.21 crore to
end of 01 June 2014 in Composite Andhra Pradesh have not been apportioned between the two
states of Andhra Pradesh and Telangana.
Investments made during 01 April 2019 to 31 March 2020 in the successor State of Andhra Pradesh
was ₹0.10 crore and a dividend of ₹4.46 crore was received on total investments including un-
apportioned investments during the year. These figures, however, require reconciliation with the
entities where investments were made. Neither the State Government nor individual entities have
reconciled and confirmed the investments. In the absence of such reconciliation, the correctness of
these investments could not be ensured.