accreditation guidelines for bone densitometry - anzbms · 2 march 2003 accreditation guidelines...
TRANSCRIPT
March 20032
Accreditation Guidelines for Bone Densitometry
Last Updated: March 2003
Prepared for the Australian and New Zealand Bone and Mineral Society, The Australian and NewZealand Association of Physicians in Nuclear Medicine, The Royal Australian and New Zealand Collegeof Radiologists and The Australasian College of Physical Scientists and Engineers in Medicine by a jointpanel comprising representatives of the above organisations.
These Standards are written in broad principle, designed to serve without alteration for many years.
Standard 1 Staff
Standard 2 Consultation
Standard 3 Facilities
Standard 4 Health and Safety
Standard 5 Patient Management
Standard 6 Equipment and Instrumentation
Standard 7 Densitometry Methods
Standard 8 Quality Assurance/Quality Control
Standard 9 Reporting
Standard 10 Record Keeping
Appendix 1: Education and training for technologists in practical densitometry
Appendix 2: DXA quality control
Appendix 3: Background on Statistical methods for bone densitometry reporting
Appendix 4: Measurement of short term prevision in-vivo
Appendix 5: Detecting “out of control” behaviour: Preparation of a multi-rule Shewart chart
Appendix 6: Construction of a Cusum Plot
Appendix 7: Compliance testing of DXA equipment
Appendix 8: Elements of a reference library
November 2001 2
STANDARD 1 - Staff There shall be sufficient professional and support staff with adequate training and experience to supervise and conduct the work of the unit. Commentary Work assignment in densitometry shall be consistent with the education, training and experience of the staff. Only staff trained in densitometry shall operate bone densitometers and such staff shall only perform scans for which they have been specifically trained. A technologist in bone densitometry shall be tertiary educated (degree or diploma) in the field of radiography, nuclear medicine, science or nursing, and must have additional post-graduate training in bone densitometry. Staff performing Quantitative Computed Tomography (QCT) must be trained radiographers. Appropriate documentation shall be available to demonstrate that the procedures used and tests performed are within the scope of the education, training and experience of the individual (Appendix 1). Duties of the technologist shall include patient scanning, scan analysis and reviewing of results. In addition they must perform or supervise all quality control procedures and personally review results. Training of the technologist shall include at least the following elements: Appropriate tertiary qualifications as noted above; Radiation safety (hazard analysis, regulations, patient advice, licensing); Patient management (reception, advising, lifting etc);
DXA (and/or QCT) scanning training; DXA (and/or QCT) quality assurance and equipment performance; Relevant statistical analysis & report generation; Staff operating equipment shall be competent, and may be required to produce evidence of their qualifications and training, as well as demonstrate their competence in a practical sense. STANDARD 2 - Consultation
The unit shall have staff who, within the limits of their clinical responsibility, can advise clinicians on evaluation and interpretation of results of bone densitometry examinations and the precision and accuracy of methods employed. Commentary An essential service of the densitometry unit is the provision of a consultative service to the referring clinician. The consulting service shall be readily available and clinicians shall be able to obtain authoritative advice from the medical specialist or technologist on: 1. The precision and accuracy of methods used in the unit, including in-vivo and in-vitro precision
estimates for all scans performed in the unit. 2. The statistical significance of results and their relation to reference intervals. This includes data on the
source of the reference interval used for scan interpretation. 3. The scientific basis and the clinical significance of the results. 4. The suitability of the requested procedure to solve the clinical problem in question. 5. Further procedures which may be helpful.

November 2001 3
On-site medical specialist and medical scientist/engineer supervision is not necessary but the reporting medical specialist must contactable. All reports to be checked by the reporting medical specialist.

November 2001 4
STANDARD 3 – Facilities
Each densitometry unit shall provide sufficient space and facilities for the satisfactory provision of service. Commentary 1. The unit environment shall be conducive to the optimum performance of personnel and equipment. 2. Facilities shall be adequate for patient comfort and privacy, and safety and efficacy of operation. 3. There shall be sufficient space around the x-ray unit such that densitometry staff and persons
accompanying the patient are out of the radiation hazard zone of the machine. If necessary, appropriate shielding shall be provided.
4. If relevant, the safety of staff and patients occupying space adjacent to the unit will also be considered.
5. Communication facilities shall be adequate for proper consultation, patient interviews, and reporting. STANDARD 4 - Health and Safety
Effective levels of control with respect to health and safety must be maintained. Commentary Radiation Safety Safety is emphasised because of hazards inherent in use of radiation. Unit personnel, hospital employees, patients and the community at large must be protected. Attention is drawn to the NHMRC Recommendations for Limiting Exposure to Ionizing Radiation and the National Standard for Limiting Occupational Exposure to Ionizing Radiation, and the New Zealand National Radiation Laboratory Code C5. Units must in addition comply with relevant State radiation safety and occupational health regulations. Specific requirements of a densitometry facility are as follows: 1. A qualified Radiation Safety Officer shall be appointed, or shall be accessible for consultation relating
to radiation safety issues. 2. Staff shall have attended a recognised course on radiation safety as it pertains to bone densitometry.
Base grade training for nuclear medicine technologists and radiographers qualifies as such a course. 3. All staff operating DXA fan beam units or performing QCT must wear radiation monitoring devices.
Records of radiation exposure shall be kept and be available for review at any time, unless specific exemption is given by the State radiation regulatory authority. For pencil beam units, the issue of personal monitoring may depend on the local regulatory authority.
4. Staff shall be aware of the effective radiation doses involved in densitometry and the clinical relevance of these doses to the normal population, pregnant women and to children. Staff shall also be aware of, and be able to clinically interpret, the effective radiation dose of complementary tests (e.g. chest and spinal radiographs).
Other Safety Issues These include electrical and mechanical safety, which would be governed by Australian and New Zealand Standards and institutional and state regulations.
November 2001 5
STANDARD 5 - Patient Management
Units shall have staff who are able to handle the particular problems of patients presenting for densitometry. Commentary 1. Staff shall be aware of the particular problems experienced by some patients during densitometry
scanning (e.g., chronic airways disease, joint prostheses, cardiac failure, arthritis and so on). 2. Staff shall possess the necessary interpersonal skills in order to interview patients, and to place them at
ease. 3. Staff shall be aware of the particular problems of patients with osteoporosis including pain due to
previous fractures and the risk of further fractures from trauma incurred during the scanning. 4. Staff shall be aware of the appropriate method of moving and lifting patients particularly those with
recent fractures or who are confined to bed. STANDARD 6 - Equipment and Instrumentation
The equipment must be suitable for the range of tests performed and be in good working order. Commentary. 1. On installation of equipment and from time-to-time, as defined in Standard 8 and Appendices 2 and 7,
quality control testing (see Appendix 2) and compliance testing (see Appendix 7) shall be performed. Some of these tests will be performed by an engineer (either provided by the supplier or independent). The engineer will be a qualified engineer who meets any requirements laid down by State or National Regulatory Authorities, ideally one who is certified by the Australasian College of Physical Scientists and Engineers in Medicine (ACPSEM).
2. Operating manuals for equipment shall be readily available and staff handling such equipment must be able to check the critical operating characteristics. They shall do so at intervals appropriate for the type of equipment and its work-load. The manuals must include all criteria used for assessment of Quality Assurance procedures. The manual shall also include all communications with the manufacturer, subsequent to installation of the machine. All software updates shall be implemented as soon as practicable.
3. Records of calibration, QC, repair and maintenance of each item of equipment shall be kept for the life of that item.
Full details pertaining to QC requirements are described in Standard 8.
November 20016
STANDARD 7 – Densitometry Methods
Only properly authenticated bone densitometry shall be used for clinical purposes. This shallinclude only those techniques for which there are established reference intervals for the populationto be studied, and data published in peer-reviewed literature demonstrating the efficacy of thetechnique in fracture prediction. Manuals containing all methods and procedures authorised for usein the unit shall be available in the appropriate work areas, and such manuals to be reviewed at leastannually.
CommentaryEach procedure performed by the unit (e.g. screening, routine clinical testing, reference densitometryservice, QC procedures) must be fully documented with all steps carefully outlined. In particular themanual must include information outlined in Appendix 1.
A library of text-books and Journals shall be available to supplement the unit manual (Appendix 8).
STANDARD 8 - Quality Assurance/Quality Control
An efficient and effective quality assurance and quality control program shall be followed, ensuringthe results provided by the unit meet acceptable standards.
CommentaryThe slow rate of bone loss in the general population necessitates that a very high level of attention beafforded to quality assurance procedures to ensure that densitometry equipment is operating as preciselyand accurately as possible. An efficient and effective quality assurance and quality control (QC) programwill include procedures able to detect real changes in instrument performance that will affect the measuredBMD value or the short or long term precision of the patient measurements.
1. QC and equipment maintenance procedures shall be performed regularly as recommended by themanufacturer. In addition to the routine calibration and QC testing of densitometry equipment,additional QC monitoring shall be performed to the standards outlined in Appendix 2 and Appendix 4.If the unit fails any of the QC procedures the instrument shall be evaluated. With repeated failure,patient measures shall be suspended until the instrument is more thoroughly evaluated. If there is asuspicion that previous patient results may be inaccurate, a retrospective re-analysis of the data shall beperformed.
2. A vital component of QC is maintenance of equipment. A maintenance program shall be in place andall aspects of the densitometer performance shall be checked according to the manufacturersspecifications. All faults discovered must be remedied, and the fault and remedial action recorded in aform available for inspection.
3. Compliance testing of equipment shall be performed. A sufficient program for compliance testing isdescribed in Appendix 7.

November 2001 7
STANDARD 9 - Reporting
Reports of results shall be furnished to the requesting person with a minimum of delay commensurate with good patient care. Commentary 1. Densitometry reports shall identify the following: - The unit - The patient - Type of densitometer as well as scan mode and software version - The type of scan and date performed - The quantitative results, reference intervals and their source. - Reference to previous studies - Date of report and name of reporting medical specialist.
2. Urgent reports may be communicated by telephone or the like to responsible medical or other authorised staff with due care to prevent mistakes, but shall always be followed by a written report.
3. No person by virtue of his/her office or employment in the Unit shall disclose information on patients or the results of investigations thereon except in the performance of his/her duties.
4. All reports to be checked by the reporting medical specialist. STANDARD 10 – Record Keeping
All units shall maintain a complete record of all tests performed and this shall include complete identifying details of the patient. Records relating to patients, results and quality control shall be kept in readily accessible form. Commentary 1. The written request shall be retained as long as considered useful or as long as required by a statutory
authority. 2. All units shall maintain a complete record of all scans performed and this shall include complete
identifying details of the patient, the name of the referring medical practitioner, the date the test was performed and investigations required.
3. The raw data from all scans shall be stored using appropriate long-term electronic storage mediums, allowing re-analysis when necessary. QC data relevant for the validation of scans shall also be stored.
4. Unlike many clinical investigations, bone densitometry data increase in utility the longer the serial record is maintained. Thus copies of reports shall be retained in the unit for a minimum of ten years, or in compliance with any statutory requirement � whichever is longer.
5. Results of investigations are normally confidential to the requesting medical practitioner and patient, but past Unit records may be made available to a clinician currently caring for the patient. Requests from a researcher for access to data must be approved by the appropriate institutional ethics committee, and all identifying information must be removed from the data, except with the specific consent of the patient.
6. Storage conditions for Unit records shall be adequate for their preservation and retrieval.

November 2001 8
Appendix 1.
EDUCATION & TRAINING FOR TECHNOLOGISTS IN PRACTICAL
DENSITOMETRY
1. Patient preparation and positioning
2. The scanning mode used for all scans performed and variation in mode with body size.
3. The anatomic landmarks used for positioning the scanner
4. Acceptable scan margins
5. A detailed, unit specific, knowledge of acquisition, analysis and QC procedures
and applicable reference intervals taken from the peer-reviewed literature.
6. Management of all problems encountered in densitometry scanning including:
- extremes of body habitus,
- soft tissue calcification,
- osteoarthritis,
- fractures
- scoliosis
- prior surgery
- prosthetic devices
- artifacts
- uncommon anatomy (eg 6 L vertebrae)
- recent nuclear medicine scans or contrast radiology
- unusual patient movement
7. Relevant safety issues.
8. Radiation Safety.

November 2001 9
Appendix 2. DXA QUALITY CONTROL
A) At time of installation, (as part of commissioning procedure) or after any major maintenance
procedure or major software upgrade
i) Machine calibration and testing by supplier. Accuracy and precision evaluation
ii) In vitro: short-term precision
Scan manufacturer�s recommended QC phantom 10-20 times. From these measurements calculate the
mean BMD of the Phantom and the coefficient of variation (CV) of the results. (See App.3).
CV = Standard deviation x 100%/Mean
iii) In vivo: short-term precision
On each machine, obtain voluntary followup scans within a short timeframe (maximum 1 month), or
duplicate scans on the same day, on at least 28 subjects. The volunteers should be in an age range
appropriate to the generally scanned population and should give informed consent. From these values
obtain the in-vivo short-term precision for BMD (See App. 4).
B) Ongoing quality control procedures
Calibration and quality control according to manufacturer's specifications. The QC phantom shall be
scanned at least twice weekly (and preferably daily) using the same scanning parameters. This phantom is
not the daily calibration phantom, but is an anthropomorphic (or quasi-anthropomorphic) phantom
recommended by (or at least acceptable to) the manufacturer. The QC phantom data shall be recorded and
checked for medium-term precisional error and systematic bias using the appropriate statistical analysis.
This analysis may include one or more of the following tests: Multi-rule Shewart Chart analysis (App. 5),
CUSUM (App. 6), and Running Mean. Further information to assist in the choice of statistical methods

November 2001 10
(particularly regarding reporting of results) is given in App. 3. The ongoing QC program must include a
regular maintenance schedule, with periodic testing of accuracy using a suitable QC phantom, as
recommended by the manufacturer. This phantom may be the same as that used for the regular (at least
twice weekly) QC. All interventions by the maintenance/repair provider shall be recorded so that
variations in QC parameters may be correlated with breakdowns and repairs if necessary - partly to
facilitate retrospective analysis and correction of BMD data, if this should, with hindsight, be deemed
necessary.
C) Long term Quality Control
Examination of trends in QC parameters (particularly BMD) over periods of years is a necessary
precaution for establishing the integrity of long term studies of individual patients, or for the reporting of
results from clinical trials. The statistical methods used to examine long term trends are the same as those
use for medium term studies (see above). However, it should be noted that statistical analyses become
more powerful and illuminating, with the acquisition of larger data groups - so that analyses are worth
periodically repeating as the QC history of a machine accumulates.
Each machine has specific operating characteristics which leads to some QC parameters being more
important than others, depending on the circumstances. For example, experience with Hologic pencil beam
systems has shown that variations in the parameters "k" and "d0" are frequently more sensitivity to the
onset of malfunctions than are BMD, BMC or Area. Such information should be incorporated into the
operations manual for a machine.
D) Use of internationally accepted anthropomorphic standards in ongoing multi-centre QC studies
It is likely that some form of multi-centre participatory QC will eventually be either strongly
recommended or mandatory. The use of such standards allows the BMD of a particular centre to be
expressed as a machine- and location-independent "standardised" BMD (sBMD), which is much more
amenable to allowing comparisons between centres in multi-centre clinical trials.

November 2001 11
However, sBMD is not currently recommended to compare the measurements of the same patients
between machines or between centres.

November 2001 12
Appendix 3. BACKGROUND ON STATISTICAL METHODS FOR BONE DENSITOMETRY REPORTING Introduction A proper interpretation of bone mineral density measurements requires some understanding of the statistical parameters used and factors which affect the confidence which can be placed on a measured value of bone density. These notes provide a basic introduction to some of the statistical terms, parameters and techniques used in the interpretation of bone densitometry results. Accuracy and Precision Accuracy is defined as the ability of a technique to measure the true value of a physical property. For bone densitometry techniques it is usually assessed in vitro by measuring phantoms of known density, or in situ on cadavers; in the latter case the measured value is compared to a chemical analysis (ash weight) of the scanned bone. Accuracy is affected by systematic errors in the measuring technique caused by, for example, machine calibration, bad positioning, analysis errors and machine algorithms for handling intra- and extra-osseous fat. Systematic errors cause the measured value to be offset by a set amount from the true value; this amount of offset is constant in repeat measurements made under the same conditions. Accuracy is less crucial than precision in bone mineral measurements since it does not affect conclusions drawn regarding changes in BMD over time measured on the same machine. However, it is important when comparing density values measured using different techniques, in comparing density values obtained on bone densitometry machines from different manufacturers and in determining an initial diagnostic classification. Precision is related to the spread of results obtained when a measurement is repeated under exactly the same conditions. That is, it is a measure of the repeatability of the measurement. Precision is affected by random errors in the measuring technique. These are caused by fluctuations in the operating characteristics of the machine over time and operator errors in positioning patients and analysing results. Random errors cause the measured value to vary about a given mean when repeat measurements are made. Precision is probably the most important factor in routine bone densitometry measurements. Better precision allows smaller changes in bone density to be detected at any selected confidence level, and hence allows any change in bone status to be detected sooner (vide infra). Ideally, measurements should be both precise and accurate. The relationship between precision and accuracy is illustrated graphically in Figure 1.

November 2001 13
Figure 1 Graphical illustration of the relationship between accuracy and precision.
Standard Deviation and Coefficient of Variation Precision is measured by looking at the dispersion of the repeated values around their average. If the frequency of each value is plotted against its value, a bell-shaped curve is generally obtained. This is called a Gaussian distribution, and is characterised by its mean (the average value of the repeated measurements) and a parameter called standard deviation, which is a measure of the spread of the measured values. The smaller the standard deviation, the more precise is the measurement. A measured result is usually quoted in terms of its mean and standard deviation as follows: mean ± standard deviation Alternatively, the result may be quoted in terms of a percentage deviation from the mean, a parameter called the coefficient of variation. The coefficient of variation is simply the standard deviation divided by the mean, expressed as a percentage. That is
Coefficient of Variation (CV) =Standard Deviation
Mean×100%
November 2001 14
Normalised Gaussian (Z) Distributions and the Z Statistic In order to carry out statistical analyses it is often convenient to normalise the Gaussian distribution to measure deviations from the mean in terms of a number of standard deviations. This is done by transforming the x values according to the following mathematical relationship: Z = x − µ
σwherex is the measured value to be transformedµ is the mean of the distribution, andσ is the standard deviation of the distribution
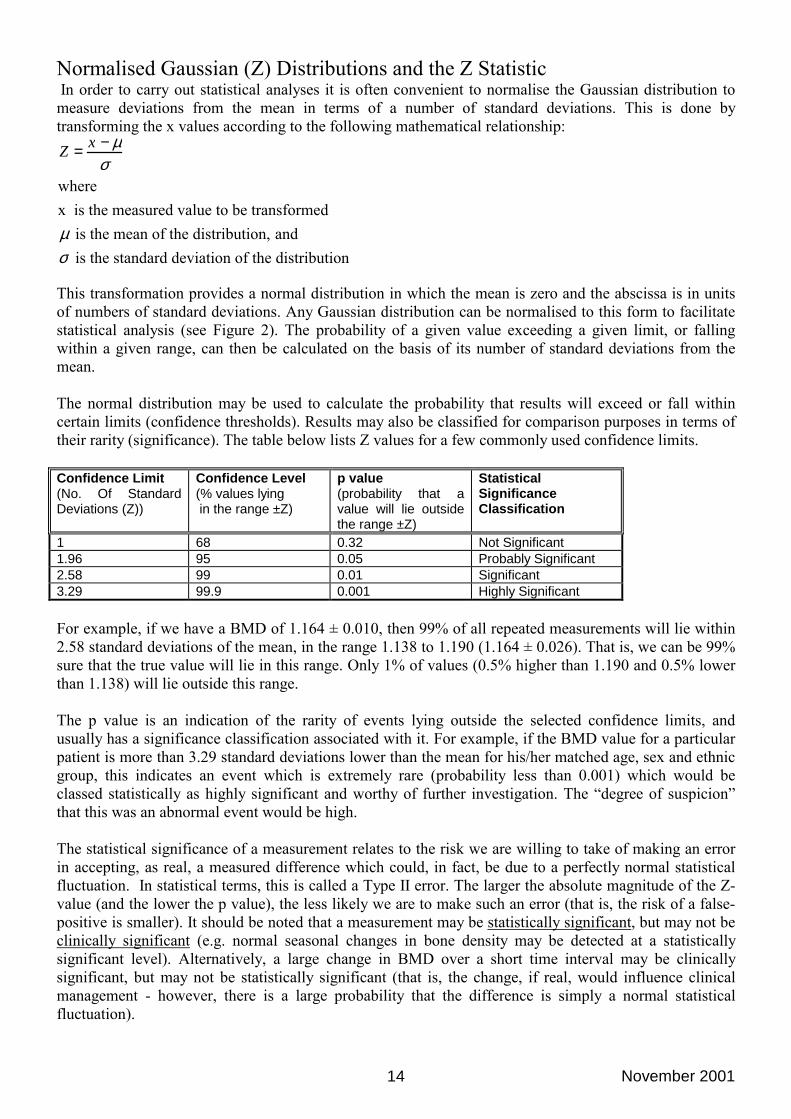
This transformation provides a normal distribution in which the mean is zero and the abscissa is in units of numbers of standard deviations. Any Gaussian distribution can be normalised to this form to facilitate statistical analysis (see Figure 2). The probability of a given value exceeding a given limit, or falling within a given range, can then be calculated on the basis of its number of standard deviations from the mean. The normal distribution may be used to calculate the probability that results will exceed or fall within certain limits (confidence thresholds). Results may also be classified for comparison purposes in terms of their rarity (significance). The table below lists Z values for a few commonly used confidence limits. Confidence Limit (No. Of Standard Deviations (Z))
Confidence Level (% values lying in the range ±Z)
p value (probability that a value will lie outside the range ±Z)
Statistical Significance Classification
1 68 0.32 Not Significant 1.96 95 0.05 Probably Significant 2.58 99 0.01 Significant 3.29 99.9 0.001 Highly Significant For example, if we have a BMD of 1.164 ± 0.010, then 99% of all repeated measurements will lie within 2.58 standard deviations of the mean, in the range 1.138 to 1.190 (1.164 ± 0.026). That is, we can be 99% sure that the true value will lie in this range. Only 1% of values (0.5% higher than 1.190 and 0.5% lower than 1.138) will lie outside this range. The p value is an indication of the rarity of events lying outside the selected confidence limits, and usually has a significance classification associated with it. For example, if the BMD value for a particular patient is more than 3.29 standard deviations lower than the mean for his/her matched age, sex and ethnic group, this indicates an event which is extremely rare (probability less than 0.001) which would be classed statistically as highly significant and worthy of further investigation. The �degree of suspicion� that this was an abnormal event would be high.
The statistical significance of a measurement relates to the risk we are willing to take of making an error in accepting, as real, a measured difference which could, in fact, be due to a perfectly normal statistical fluctuation. In statistical terms, this is called a Type II error. The larger the absolute magnitude of the Z-value (and the lower the p value), the less likely we are to make such an error (that is, the risk of a false-positive is smaller). It should be noted that a measurement may be statistically significant, but may not be clinically significant (e.g. normal seasonal changes in bone density may be detected at a statistically significant level). Alternatively, a large change in BMD over a short time interval may be clinically significant, but may not be statistically significant (that is, the change, if real, would influence clinical management - however, there is a large probability that the difference is simply a normal statistical fluctuation).

November 2001 15
+Z-Z
Rarity/Degree of Suspicion
Rarity/Degree of Suspicion
0
Normalise
Normali
se
Nor
mal
ise
Gaussian Distributions with Different Means and Standard Deviations-x +x
Normal (Z) Distribution
Z=x – µ
σ
Z=x – µ
σ
Z=x – µ
σ
Number of Standard Deviations
Figure 2 Transformation of Gaussian distributions to the normal form for statistical manipulation
Z-Scores and T-Scores BMD results are often characterised in terms of a Z value which allows comparison with some other selected population. The Z value is simply the number of standard deviations by which the patient�s BMD value differs from the mean of the selected group. The statistical significance of this difference may be quantitated (vide supra) as follows: Z value p Value Statistical Significance Greater than 3.29 Less than 0.001 Highly Significant 2.58 up to 3.29 0.001 up to 0.01 Significant 1.96 up to 2.58 0.01 up to 0.05 Probably Significant 0 to 1.96 Greater than 0.05 Not Significant 0 to -1.96 Greater than 0.05 Not Significant -1.96 down to -2.58 0.05 down to 0.01 Probably Significant -2.58 down to -3.29 0.01 down to 0.001 Significant Less than -3.29 Less than 0.001 Highly Significant In bone densitometry the T-Score expresses, in units of standard deviations, the difference between the patient�s bone density and the mean bone density of a young normal population. The statistical significance of the difference may be assessed using the above table. For older persons, the T-Score will
November 2001 16
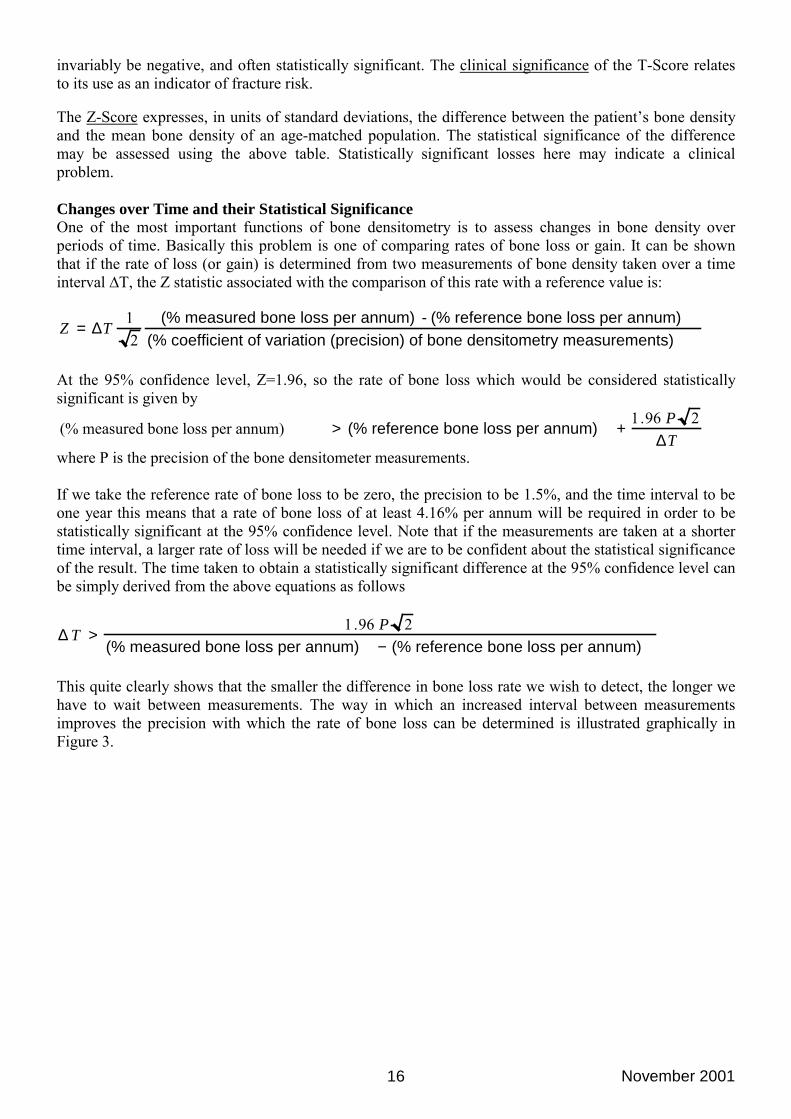
invariably be negative, and often statistically significant. The clinical significance of the T-Score relates to its use as an indicator of fracture risk. The Z-Score expresses, in units of standard deviations, the difference between the patient�s bone density and the mean bone density of an age-matched population. The statistical significance of the difference may be assessed using the above table. Statistically significant losses here may indicate a clinical problem. Changes over Time and their Statistical Significance One of the most important functions of bone densitometry is to assess changes in bone density over periods of time. Basically this problem is one of comparing rates of bone loss or gain. It can be shown that if the rate of loss (or gain) is determined from two measurements of bone density taken over a time interval ∆T, the Z statistic associated with the comparison of this rate with a reference value is:
Z = ∆T
12
(% measured bone loss per annum) - (% reference bone loss per annum)(% coefficient of variation (precision) of bone densitometry measurements)
At the 95% confidence level, Z=1.96, so the rate of bone loss which would be considered statistically significant is given by
(% measured bone loss per annum) > (% reference bone loss per annum) +
1.96 P 2∆T
where P is the precision of the bone densitometer measurements. If we take the reference rate of bone loss to be zero, the precision to be 1.5%, and the time interval to be one year this means that a rate of bone loss of at least 4.16% per annum will be required in order to be statistically significant at the 95% confidence level. Note that if the measurements are taken at a shorter time interval, a larger rate of loss will be needed if we are to be confident about the statistical significance of the result. The time taken to obtain a statistically significant difference at the 95% confidence level can be simply derived from the above equations as follows
∆ T >
1.96 P 2(% measured bone loss per annum) − (% reference bone loss per annum)
This quite clearly shows that the smaller the difference in bone loss rate we wish to detect, the longer we have to wait between measurements. The way in which an increased interval between measurements improves the precision with which the rate of bone loss can be determined is illustrated graphically in Figure 3.

November 2001 17
Figure 3 Graphical illustration of the effect of increased time interval between measurements on the
precision of bone loss determinations.
November 2001 18
Appendix 4.
MEASUREMENT OF SHORT TERM PRECISION IN-VIVO
"Appendix 4.
MEASUREMENT OF SHORT TERM PRECISION IN-VIVO
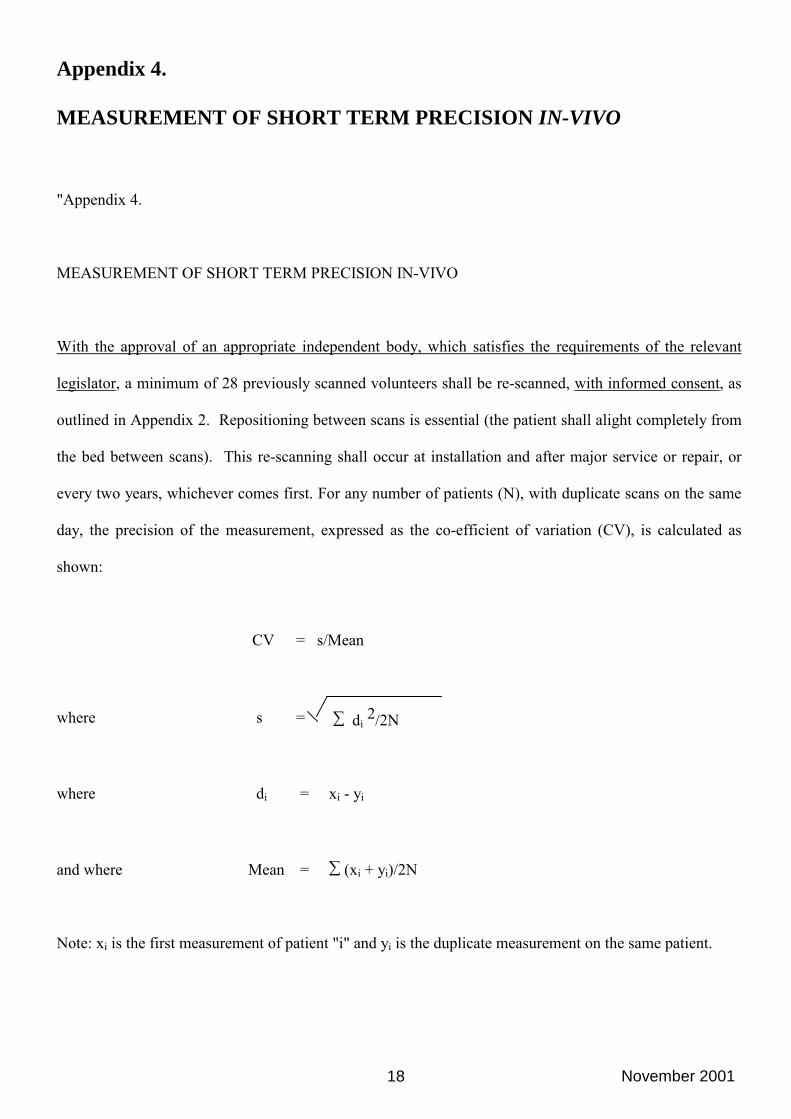
With the approval of an appropriate independent body, which satisfies the requirements of the relevant
legislator, a minimum of 28 previously scanned volunteers shall be re-scanned, with informed consent, as
outlined in Appendix 2. Repositioning between scans is essential (the patient shall alight completely from
the bed between scans). This re-scanning shall occur at installation and after major service or repair, or
every two years, whichever comes first. For any number of patients (N), with duplicate scans on the same
day, the precision of the measurement, expressed as the co-efficient of variation (CV), is calculated as
shown:
CV = s/Mean
where s = ∑ di 2/2N
where di = xi - yi
and where Mean = ∑ (xi + yi)/2N
Note: xi is the first measurement of patient "i" and yi is the duplicate measurement on the same patient.

November 2001 19
Appendix 5. DETECTING "OUT OF CONTROL" BEHAVIOUR: PREPARATION
OF A MULTI-RULE SHEWART CHART
The QC parameters obtained from serial phantom measurements can be analysed in various ways to
determine drifts, changes in precision and other factors which may affect machine performance over time.
Well-established statistical techniques are available for this purpose, usually involving the generation of a
"control chart" with appropriate control limits. The actual techniques chosen at a particular centre will
depend on its resources, and to some extent its particular preferences. Choice of control limits is a critical
issue, requiring that sensitivity to "out of control limits" situations is balanced against the "false alarm"
rate. Advice should be sought from a statistician.
One simple method for detecting changes in precision is to examine the cumulative precision value for the
densitometer daily QC phantom, as calculated by the densitometry software. Any form of drift, systematic
(ie in one direction) or otherwise, will cause this value (usually <0.5% when expressed as CV [see App.
3]) to increase. Usually a centre will not have the resources to perform regular precision measurements in-
vivo on young volunteers (other than at the time of commissioning of the machine), but ideally in-vivo
precisional errors would be charted successfully if this exercise was repeated once every 6 months.
Another method, which can be set to acceptably balance the "false alarm" rate against the "out of control
limits" rate, and which is statistically straightforward is multi-rule Shewart charting. Depending on the
rule or rules adopted (see below) Shewart charting can identify the growth of both random and systematic
errors.
November 2001 20
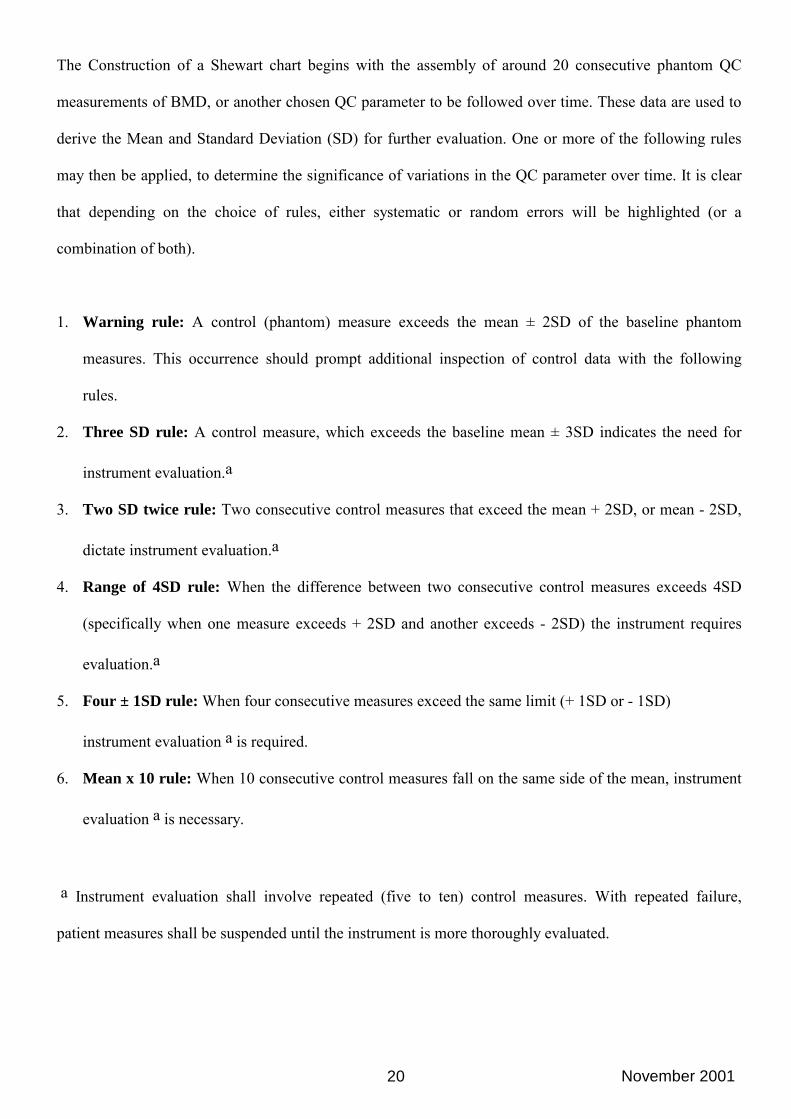
The Construction of a Shewart chart begins with the assembly of around 20 consecutive phantom QC
measurements of BMD, or another chosen QC parameter to be followed over time. These data are used to
derive the Mean and Standard Deviation (SD) for further evaluation. One or more of the following rules
may then be applied, to determine the significance of variations in the QC parameter over time. It is clear
that depending on the choice of rules, either systematic or random errors will be highlighted (or a
combination of both).
1. Warning rule: A control (phantom) measure exceeds the mean ± 2SD of the baseline phantom
measures. This occurrence should prompt additional inspection of control data with the following
rules.
2. Three SD rule: A control measure, which exceeds the baseline mean ± 3SD indicates the need for
instrument evaluation.a
3. Two SD twice rule: Two consecutive control measures that exceed the mean + 2SD, or mean - 2SD,
dictate instrument evaluation.a
4. Range of 4SD rule: When the difference between two consecutive control measures exceeds 4SD
(specifically when one measure exceeds + 2SD and another exceeds - 2SD) the instrument requires
evaluation.a
5. Four ± 1SD rule: When four consecutive measures exceed the same limit (+ 1SD or - 1SD)
instrument evaluation a is required.
6. Mean x 10 rule: When 10 consecutive control measures fall on the same side of the mean, instrument
evaluation a is necessary.
a Instrument evaluation shall involve repeated (five to ten) control measures. With repeated failure,
patient measures shall be suspended until the instrument is more thoroughly evaluated.
November 2001 21
Appendix 6. CONSTRUCTION OF A CUSUM PLOT
CUSUM plots are optional and may be difficult to interpret.
This is a method for the sensitive detection of systematic drift in a measured QC parameter, and may be
particularly useful for monitoring of long-term (ie over several years) �constant� QC parameters such as
the BMD of a phantom. Note that random errors (e.g. a deterioration in precision due to failure of
electrical circuitry, or wear in a mechanical component) may not be detected by a CUSUM chart. The use
of CUSUM (as distinct from, say, a Moving Average method) is largely a matter of personal preference
and prior experience.
Prior to deriving a CUSUM chart a "Target" value is required. The mean value of the first 10 phantom
scans can be used as the target value, denoted as T. Let Xp denote the phantom BMD at time p. The
deviation (d) of this value from the target value is calculated as d = X-T. At any time (t), the cumulative
sum of deviations (CUSUM or St) is calculated by summing all the prior values of d up to the current
measurement. This is expressed mathematically as:
St = ∑p≤t (Xp-T)
The CUSUM (St) is plotted against time to provide a cumulative sum chart. A suitable vertical scale is one
unit per 0.5 gm/cm2 and a suitable horizontal scale is one unit per 30 days. Since any variations of the
phantom BMD from the target value T, shall be randomly positive or negative, the CUSUM shall not
deviate significantly from 0. A deviation of the chart away from 0 indicates a potential instrument
problem. This will occur if a systematic error in BMD occurs.

November 2001 22
Appendix 7.
COMPLIANCE TESTING OF DXA EQUIPMENT
The following program for equipment compliance testing is based in part on a protocol developed by the
Department of Medical Physics of the New England Medical Center, Tufts University, MA, USA.
1. BMD Reproducibility
- Examination of daily QA results for array (PA & lateral lumbar spine) and pencil beam (if
relevant) modes, to determine whether the repeatability of the areal BMD results for the
phantom have fallen within the manufacturer's limits of + 1.5% of mean BMD.
- Examination of longer term QA results based on multi-rule Shewart charting, running mean
and/or Cusum plots (Apps. 5 and 6).
2. Accuracy of laser light positioning [only necessary at commissioning (and this is normally
performed by the manufacturer/installer)]
- To assess the accuracy of the laser light position indicator, two wires meeting at right angles are
positioned approximately 1 mm to the right (facing the table) of where the point beam of laser light
intercepts the scanning cushion. A PA array spine is carried out to where the wires lie in the field of
view. The wires may be imaged on the computer monitor and ideally should lie at the centre of the
transverse scan lines and at the starting point of the longitudinal scan motion. A reasonable
positioning accuracy is within 5 mm of the start point.

November 2001 23
3. Accuracy of scan line spacing and step spacing [only necessary at commissioning (and this is
normally performed by the manufacturer/installer)]
- To test the accuracy of the scan line spacing and step spacing, two rulers of set lengths are placed at
right angles on the scanning table and an AP lumbar spine scan performed to image them. The
incremental distances in each direction can be determined from this image by noting, the scan
length and width, the number of required scan lines, and number of scan steps within one line. The
calculated line spacings and step spacings should be within 2%.
4. Accuracy of indicated scan time [only necessary at commissioning (and this is normally
performed by the manufacturer/installer])
- The timing of a scan such as that indicated in Sect. 4 above is measured from when the X-ray beam
light first comes on to when it goes out. The measurement is repeated. The measurements should
agree to within 3%.
5. Patient Free Air Entrance Exposures [only necessary at commissioning or at major
service/tube replacement (and this is normally performed by the manufacturer/installer])
- Patient free air entrance exposures are measured directly for standard PA scans by placing a
calibrated radiation monitor ion chamber directly on the table cushion and scanning the
chamber. For lateral scans (in some models) the entrance exposure can be calculated from the
PA exposure values using the "inverse squared distance" correction, provided that the generator
technique is the same for the PA and lateral scans
6. X-ray scatter measurements: exposure from individual scans [only necessary at
commissioning or at major service/tube replacement (and this is normally performed by the
manufacturer/installer])
- Patients are simulated using the appropriate equipment phantom (approximately 17 cms cubic),
or else a block of perspex or the equivalent. Measurements are made in two positions: (i) 1
metre from the front edge of the patient table (and nearest the phantom); (ii) at the position
where the technologist sits when operating the unit.
- A calibrated integration radiation survey meter is required to make the measurements.
Measurements should be made in the AP and lateral aspects (if both are relevant).
- With the X-ray beam switched off, three background exposure measurements are made using
the survey meter in integration mode, and averaged. These measurements include both the

November 2001 24
instrument itself. The result (suitably weighted) is deducted from any measurements taken with
the X-rays on, or else the monitor zero reading is adjusted to account for "background".
- With the X-ray beam on, scatter measurements from the phantom (under scanning conditions)
are made for PA spine and lateral spine (if relevant) clinical protocols at the operator's seat and
at 1 metre from the front edge of the table closest to the phantom. The PA hip integrated dose
from scatter is assumed to be the same per unit time as that of the spine. If this is thought not to
be the case, then a hip scan scatter measurement should be made as well. Note that for
equipment with multiple scan modes representing different scan resolutions, data should be
collected for each scan mode. The exception is the whole body scan.
- Scattered dose from the whole body scan need not be measured directly since the scatter is
expected to be much lower than for the spine and hip protocols, due to the very low entrance
exposures. These latter exposures are measured according to the protocol of Sect. 6. The whole
body scatter dose may be estimated from (say) the spine AP dose and the ratio of the patient
free air exposures for the PA spinal and whole body scans, obtained from Sect. 6.
7. X-ray exposure measurements: weekly and annual doses to staff
- These may be estimated for each relevant staff member, from the doses for the individual scans
(Sect. 6), the number of scans of each type performed each week and each year, and the work
practices of each staff member (eg their habitual locations within the scanning room).
- The doses acquired by individual staff members on an hourly and yearly basis must comply
with limits set by the State Regulatory Authority. Usually these are "<20 µSv per hour" and "<1
mSv per year". In the unlikely event that these limits could be exceeded (particularly the
second), staff work practices should be altered to avoid that possibility, on advice from (and
confirmatory surveillance by) the Unit's radiation safety officer. Staff should be aware of
radiation safety regulations and recommendations as they pertain to pregnancy.

November 2001 25
Appendix 8. ELEMENTS OF A REFERENCE LIBRARY
Note is made of the increasing usefulness of the world wide web as a source of reference material.
The library should include at least one element from each of the two groups below:
Specialist peer-reviewed scientific journals
1. Journal of Clinical Densitometry (recommended)
2. Osteoporosis International. (recommended)
3. British Journal of Radiology
4. Journal of Bone and Mineral Research
5. Calcified Tissue Internationa
6. Progress in Osteoporosis
Books
1. Vertebral Fractures in Osteoporosis (Genant, Jegud, Van Kuik).
2. Primer on the Metabolic Bone Diseases and Disorders of Mineral Metabolism (American Society of
Bone & Mineral Research) Fourth Edition, 1999 (recommended)
3. Osteoporosis: Diagnosis and Management. PJ Meunier
4. Bone Densitometry and Osteoporosis. Genant, Guglielmi, Jergas.
5. The Evaluation of Osteoporosis: Dual energy X-ray Absorptiometry in Clinical Practice (Second
Edition). Blake,Wahner, Fogelman. Martin Dunitz Ltd, 1999. (recommended)
6. The Aging Skeleton (eds; Rosen, Glowacki, Bilezikian) Academic Press, 1999, ISBN 0-12-098655-8
(recommended).
7. Osteoporosis. (eds; Marcus R, Feldman D, Kelsey J), Academic Press, NY 1996 (recommended)