accreditation information for los … accreditation evidence packets...accreditation information for...
TRANSCRIPT
District Research
Contra Costa Community College District
500 Court Street
Martinez, California 94553
Contra Costa Community College District
ACCREDITATION INFORMATION FOR
LOS MEDANOS COLLEGE
September 2013
TABLE OF CONTENTS
STUDENT DEMOGRAPHICS ........................................................................................................................... 1
Fall 2012 College Demographics ............................................................................................................ 2
Head Count by Gender, Age Group, and Race/Ethnicity ........................................................................ 3
Student Educational Goals by Category ................................................................................................. 3
Financial Aid Information by Gender, Age Group, and Race/Ethnicity .................................................. 4
Number of Awards by Gender, Age Group, and Race/Ethnicity ............................................................ 5
Course Success by Place of Residency and Race/Ethnicity .................................................................... 6
LEVEL 1 ACCREDITATION TABLES – AGGREGATED BY MEASURE ................................................................. 7
All Courses .............................................................................................................................................. 8
Basic Skills Courses ................................................................................................................................. 8
Career and Technical Education (CTE) Courses ...................................................................................... 8
General Education Courses .................................................................................................................... 8
LEVEL 2 ACCREDITATION TABLES – AGGREGATED BY COURSE TYPE AND INSTRUCTION METHOD ............ 9
All Courses ............................................................................................................................................ 10
Basic Skills Courses ............................................................................................................................... 10
Career and Technical Education (CTE) Courses .................................................................................... 10
General Education Courses .................................................................................................................. 10
COMPARISON GRAPHICS ............................................................................................................................ 11
Student Demographics by Fall Term .................................................................................................... 12
Financial Aid Information by Demographic Group ............................................................................... 13
Number of Awards by Demographic Group ......................................................................................... 14
Course Success Rate by Demographic Group ....................................................................................... 15
Course Success Rate by Type of Course and Instruction Method ........................................................ 16
Basic Skills Course Success Rate by Demographic Group ..................................................................... 17
Career and Technical Education (CTE) Course Success Rate by Demographic Group ......................... 18
General Education Course Success Rate by Demographic Group ........................................................ 19
Persistence Rates by Type of Course .................................................................................................... 20
Fall‐to‐Spring Persistence Rate for All Courses by Demographic Group .............................................. 21
Fall‐to‐Fall Persistence Rate for All Courses by Demographic Group .................................................. 22

LEVEL 3 ACCREDITATION TABLES – AGGREGATED BY COURSE TYPE AND DEMOGRAPHIC GROUP .......... 23
All Courses by Gender .......................................................................................................................... 24
All Courses by Age Group ..................................................................................................................... 24
All Courses by Race/Ethnicity ............................................................................................................... 25
Basic Skills Courses by Gender ............................................................................................................. 26
Basic Skills Courses by Age Group ........................................................................................................ 26
Basic Skills Courses by Race/Ethnicity .................................................................................................. 27
Career and Technical Education (CTE) Courses by Gender .................................................................. 28
Career and Technical Education (CTE) Courses by Age Group ............................................................. 28
Career and Technical Education (CTE) Courses by Race/Ethnicity ....................................................... 29
General Education Courses by Gender ................................................................................................. 30
General Education Courses by Age Group ........................................................................................... 30
General Education Courses by Race/Ethnicity ..................................................................................... 31
Persistence Rates by Gender ................................................................................................................ 32
Persistence Rates by Age Group ........................................................................................................... 32
Persistence Rates by Race/Ethnicity .................................................................................................... 33
LEVEL 4 ACCREDITATION TABLES – AGGREGATED BY COURSE TYPE, DEMOGRAPHIC GROUP AND INSTRUCTION METHOD .............................................................................................................................. 34
All Courses by Gender and Instruction Method ................................................................................... 35
All Courses by Age Group and Instruction Method .............................................................................. 36
All Courses by Race/Ethnicity and Instruction Method ........................................................................ 37
Basic Skills Courses by Gender and Instruction Method ...................................................................... 38
Basic Skills Courses by Age Group and Instruction Method ................................................................. 39
Basic Skills Courses by Race/Ethnicity and Instruction Method ........................................................... 40
Career and Technical Education (CTE) Courses by Gender and Instruction Method ........................... 41
Career and Technical Education (CTE) Courses by Age Group and Instruction Method...................... 42
Career and Technical Education (CTE) Courses by Race/Ethnicity and Instruction Method ............... 43
General Education Courses by Gender and Instruction Method ......................................................... 44
General Education Courses by Age Group and Instruction Method .................................................... 45
General Education Courses by Race/Ethnicity and Instruction Method .............................................. 46
MEASURES BY PLACE OF RESIDENCY .......................................................................................................... 47
APPENDIX A – Operational Definitions ....................................................................................................... 53

STUDENTDEMOGRAPHICS
Information in this section:
Student Head Count by Gender, Age Group, and Race/Ethnicity
Financial Aid Information by Gender, Age Group, and Race/Ethnicity
Student Educational Goals by Category
Number of Awards by Gender, Age Group, and Race/Ethnicity
Course Success by Place of Residency and Race/Ethnicity
1
Los Medanos CollegeStudent Demographics by Fall Term
Fall 2012
55%
44%
1%
Gender
Female
Male
Unknown
n= 8,779
33%
34%
29%
4%
Age Group
< 20 years old
20 to 24 years old
25 to 49 years old
50 + years old
n= 8,779
15% 0%
5%
5%
33%8%
4%
1%
29%
Race/Ethnicity
African American
American Indian
Asian
Filipino
Hispanic
Multi‐Race
Other/Undeclared
Pacific Islander
White
n= 8,779
58%17%
7%
3%15%
Educational Goal
Transfer (with orwithout Degree)
Career Dev (Degree,Cert, Lic)
EducationalDevelopment
4‐Yr StudentAttending 2‐Yr
Undecided on Goal
n= 8,779
46%
54%
Financial Aid
% Not ReceivingFinancial Aid
% Receiving FinancialAid
n= 8,779
55%
6%
39%
Awards
AA/AS degree
At least 1 but lessthan 4‐yearcertificate
Less than 1‐yearcertificate
2012‐2013, n= 1,280
Source: CCCCD Colleague. Run date 8/12/2013. JD2
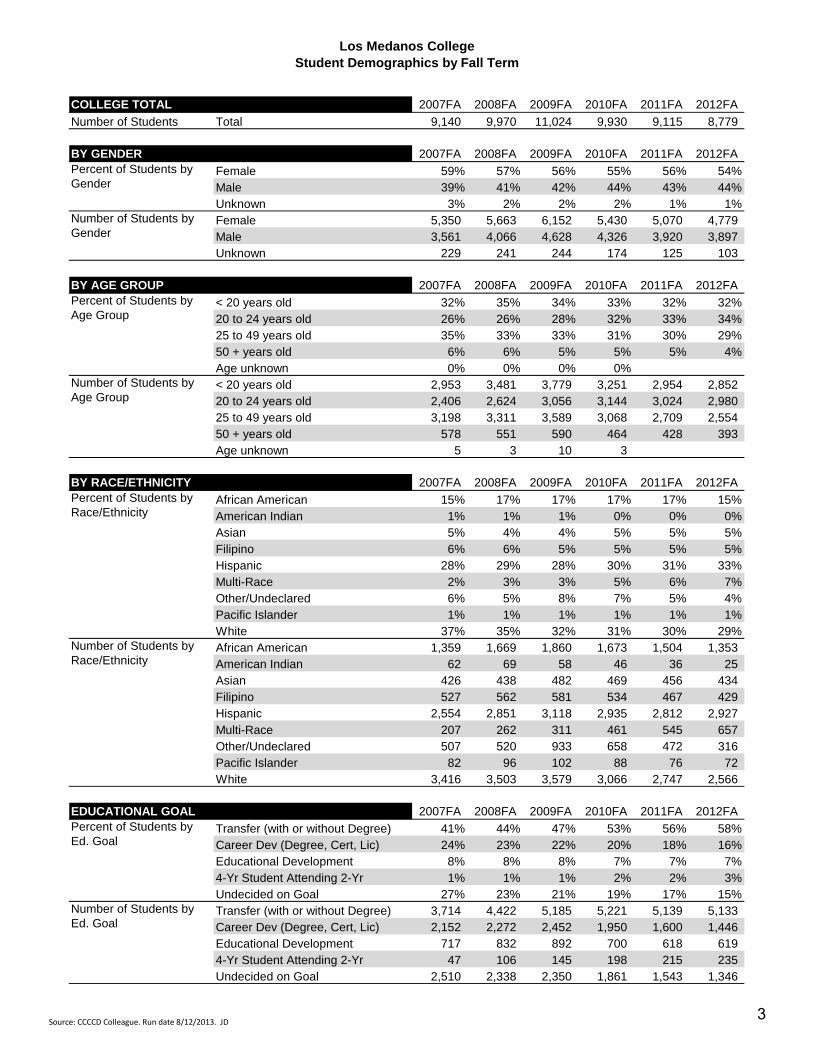
Los Medanos CollegeStudent Demographics by Fall Term
COLLEGE TOTAL 2007FA 2008FA 2009FA 2010FA 2011FA 2012FA
Number of Students Total 9,140 9,970 11,024 9,930 9,115 8,779
BY GENDER 2007FA 2008FA 2009FA 2010FA 2011FA 2012FA
Female 59% 57% 56% 55% 56% 54%Male 39% 41% 42% 44% 43% 44%Unknown 3% 2% 2% 2% 1% 1%Female 5,350 5,663 6,152 5,430 5,070 4,779 Male 3,561 4,066 4,628 4,326 3,920 3,897 Unknown 229 241 244 174 125 103
BY AGE GROUP 2007FA 2008FA 2009FA 2010FA 2011FA 2012FA
< 20 years old 32% 35% 34% 33% 32% 32%20 to 24 years old 26% 26% 28% 32% 33% 34%25 to 49 years old 35% 33% 33% 31% 30% 29%50 + years old 6% 6% 5% 5% 5% 4%Age unknown 0% 0% 0% 0%< 20 years old 2,953 3,481 3,779 3,251 2,954 2,852 20 to 24 years old 2,406 2,624 3,056 3,144 3,024 2,980 25 to 49 years old 3,198 3,311 3,589 3,068 2,709 2,554 50 + years old 578 551 590 464 428 393 Age unknown 5 3 10 3
BY RACE/ETHNICITY 2007FA 2008FA 2009FA 2010FA 2011FA 2012FA
African American 15% 17% 17% 17% 17% 15%American Indian 1% 1% 1% 0% 0% 0%Asian 5% 4% 4% 5% 5% 5%Filipino 6% 6% 5% 5% 5% 5%Hispanic 28% 29% 28% 30% 31% 33%Multi-Race 2% 3% 3% 5% 6% 7%Other/Undeclared 6% 5% 8% 7% 5% 4%Pacific Islander 1% 1% 1% 1% 1% 1%White 37% 35% 32% 31% 30% 29%African American 1,359 1,669 1,860 1,673 1,504 1,353 American Indian 62 69 58 46 36 25 Asian 426 438 482 469 456 434 Filipino 527 562 581 534 467 429 Hispanic 2,554 2,851 3,118 2,935 2,812 2,927 Multi-Race 207 262 311 461 545 657 Other/Undeclared 507 520 933 658 472 316 Pacific Islander 82 96 102 88 76 72 White 3,416 3,503 3,579 3,066 2,747 2,566
EDUCATIONAL GOAL 2007FA 2008FA 2009FA 2010FA 2011FA 2012FA
Transfer (with or without Degree) 41% 44% 47% 53% 56% 58%Career Dev (Degree, Cert, Lic) 24% 23% 22% 20% 18% 16%Educational Development 8% 8% 8% 7% 7% 7%4-Yr Student Attending 2-Yr 1% 1% 1% 2% 2% 3%Undecided on Goal 27% 23% 21% 19% 17% 15%Transfer (with or without Degree) 3,714 4,422 5,185 5,221 5,139 5,133 Career Dev (Degree, Cert, Lic) 2,152 2,272 2,452 1,950 1,600 1,446 Educational Development 717 832 892 700 618 619 4-Yr Student Attending 2-Yr 47 106 145 198 215 235 Undecided on Goal 2,510 2,338 2,350 1,861 1,543 1,346
Number of Students by Race/Ethnicity
Percent of Students by Ed. Goal
Number of Students by Ed. Goal
Percent of Students by Gender
Number of Students by Gender
Percent of Students by Age Group
Number of Students by Age Group
Percent of Students by Race/Ethnicity
Source: CCCCD Colleague. Run date 8/12/2013. JD3

Los Medanos CollegeFinancial Aid Information by Gender, Age Group, and Race/Ethnicity
COLLEGE TOTAL 2007FA 2008FA 2009FA 2010FA 2011FA 2012FA
Percent Receiving Financial Aid Total 30% 36% 42% 47% 52% 54%
Number of Students (Head Count) Total 9,140 9,970 11,024 9,930 9,115 8,779
Number Receiving Financial Aid Total 2,757 3,607 4,600 4,685 4,716 4,723
BY GENDER 2007FA 2008FA 2009FA 2010FA 2011FA 2012FA
Female 33% 40% 46% 51% 55% 59%
Male 26% 31% 36% 42% 47% 48%
Unknown 34% 42% 40% 47% 54% 51%
Female 5,350 5,663 6,152 5,430 5,070 4,779
Male 3,561 4,066 4,628 4,326 3,920 3,897
Unknown 229 241 244 174 125 103
Female 1,762 2,253 2,826 2,783 2,798 2,797
Male 916 1,253 1,677 1,821 1,851 1,873
Unknown 79 101 97 81 67 53
BY AGE GROUP 2007FA 2008FA 2009FA 2010FA 2011FA 2012FA
< 20 years old 28% 32% 38% 43% 48% 51%
20 to 24 years old 37% 44% 45% 47% 52% 54%
25 to 49 years old 30% 38% 45% 53% 57% 59%
50 + years old 16% 20% 25% 35% 40% 43%
Age unknown 20% 0% 30% 0%
< 20 years old 2,953 3,481 3,779 3,251 2,954 2,852
20 to 24 years old 2,406 2,624 3,056 3,144 3,024 2,980
25 to 49 years old 3,198 3,311 3,589 3,068 2,709 2,554
50 + years old 578 551 590 464 428 393
Age unknown 5 3 10 3
< 20 years old 817 1,106 1,441 1,414 1,429 1,450
20 to 24 years old 883 1,143 1,378 1,491 1,567 1,605
25 to 49 years old 965 1,250 1,629 1,617 1,550 1,499
50 + years old 91 108 149 163 170 169
Age unknown 1 - 3 -
BY RACE/ETHNICITY 2007FA 2008FA 2009FA 2010FA 2011FA 2012FA
African American 54% 61% 67% 68% 73% 77%
Asian 28% 32% 37% 44% 49% 50%
Hispanic 35% 40% 44% 49% 55% 57%
White 18% 22% 29% 35% 38% 39%
Other/Undeclared 31% 36% 39% 47% 51% 53%
African American 1,359 1,669 1,860 1,673 1,504 1,353
Asian 1,035 1,096 1,165 1,091 999 935
Hispanic 2,554 2,851 3,118 2,935 2,812 2,927
White 3,416 3,503 3,579 3,066 2,747 2,566
Other/Undeclared 776 851 1,302 1,165 1,053 998
African American 728 1,019 1,254 1,139 1,098 1,040
Asian 291 356 427 479 489 470
Hispanic 887 1,140 1,371 1,429 1,543 1,672
White 611 787 1,035 1,086 1,052 1,013
Other/Undeclared 240 305 513 552 534 528
Percent Receiving Financial Aid
Number of Students (Head Count)
Number Receiving Financial Aid
Percent Receiving Financial Aid
Number of Students (Head Count)
Number Receiving Financial Aid
Percent Receiving Financial Aid
Number of Students (Head Count)
Number Receiving Financial Aid
Source: CCCCD Colleague. Run date 8/12/2013. JD 4
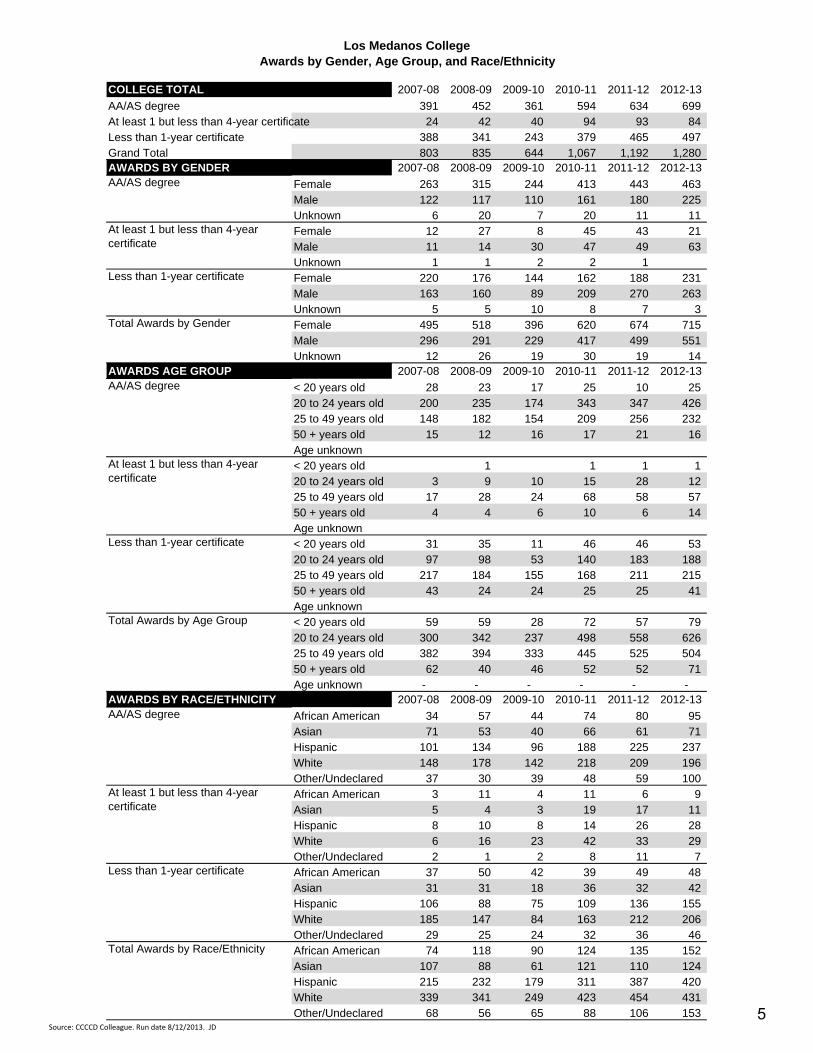
Los Medanos CollegeAwards by Gender, Age Group, and Race/Ethnicity
COLLEGE TOTAL 2007-08 2008-09 2009-10 2010-11 2011-12 2012-13
AA/AS degree 391 452 361 594 634 699 At least 1 but less than 4-year certificate 24 42 40 94 93 84 Less than 1-year certificate 388 341 243 379 465 497 Grand Total 803 835 644 1,067 1,192 1,280 AWARDS BY GENDER 2007-08 2008-09 2009-10 2010-11 2011-12 2012-13
Female 263 315 244 413 443 463 Male 122 117 110 161 180 225 Unknown 6 20 7 20 11 11 Female 12 27 8 45 43 21 Male 11 14 30 47 49 63 Unknown 1 1 2 2 1 Female 220 176 144 162 188 231 Male 163 160 89 209 270 263 Unknown 5 5 10 8 7 3 Female 495 518 396 620 674 715 Male 296 291 229 417 499 551 Unknown 12 26 19 30 19 14
AWARDS AGE GROUP 2007-08 2008-09 2009-10 2010-11 2011-12 2012-13
< 20 years old 28 23 17 25 10 25 20 to 24 years old 200 235 174 343 347 426 25 to 49 years old 148 182 154 209 256 232 50 + years old 15 12 16 17 21 16 Age unknown< 20 years old 1 1 1 1 20 to 24 years old 3 9 10 15 28 12 25 to 49 years old 17 28 24 68 58 57 50 + years old 4 4 6 10 6 14 Age unknown< 20 years old 31 35 11 46 46 53 20 to 24 years old 97 98 53 140 183 188 25 to 49 years old 217 184 155 168 211 215 50 + years old 43 24 24 25 25 41 Age unknown< 20 years old 59 59 28 72 57 79 20 to 24 years old 300 342 237 498 558 626 25 to 49 years old 382 394 333 445 525 504 50 + years old 62 40 46 52 52 71 Age unknown - - - - - -
AWARDS BY RACE/ETHNICITY 2007-08 2008-09 2009-10 2010-11 2011-12 2012-13
African American 34 57 44 74 80 95 Asian 71 53 40 66 61 71 Hispanic 101 134 96 188 225 237 White 148 178 142 218 209 196 Other/Undeclared 37 30 39 48 59 100 African American 3 11 4 11 6 9 Asian 5 4 3 19 17 11 Hispanic 8 10 8 14 26 28 White 6 16 23 42 33 29 Other/Undeclared 2 1 2 8 11 7 African American 37 50 42 39 49 48 Asian 31 31 18 36 32 42 Hispanic 106 88 75 109 136 155 White 185 147 84 163 212 206 Other/Undeclared 29 25 24 32 36 46 African American 74 118 90 124 135 152 Asian 107 88 61 121 110 124 Hispanic 215 232 179 311 387 420 White 339 341 249 423 454 431 Other/Undeclared 68 56 65 88 106 153
Less than 1-year certificate
Total Awards by Age Group
AA/AS degree
At least 1 but less than 4-year certificate
Less than 1-year certificate
Total Awards by Race/Ethnicity
AA/AS degree
At least 1 but less than 4-year certificate
Less than 1-year certificate
Total Awards by Gender
AA/AS degree
At least 1 but less than 4-year certificate
Source: CCCCD Colleague. Run date 8/12/2013. JD
5
Diablo Valley College
Head Count and Course Success Rate by City of Residence and Race/Ethnicity ‐ Fall 2012
Rank City of Residence Head Count
Success Rate
Head Count
Success Rate
Head Count
Success Rate
Head Count
Success Rate
Head Count
Success Rate
Head Count
Success Rate
1 Concord 147 59% 480 74% 987 65% 1,595 74% 596 72% 3,805 71%
2 Pleasant Hill 43 74% 344 76% 234 71% 771 74% 1,144 79% 2,536 77%
3 Walnut Creek 31 68% 264 75% 274 69% 1,008 76% 293 72% 1,870 74%
4 Martinez 45 66% 108 71% 291 71% 736 74% 241 71% 1,421 72%
5 San Ramon 33 64% 362 74% 174 73% 559 76% 147 75% 1,275 75%
6 Danville 12 73% 143 75% 120 70% 665 75% 127 76% 1,067 74%
7 Antioch 168 59% 130 72% 268 67% 260 69% 126 68% 952 67%
8 Pittsburg 118 47% 185 68% 324 64% 145 77% 96 64% 868 65%
9 Vallejo 79 55% 137 66% 105 61% 110 73% 86 64% 517 64%
10 Benicia 21 64% 32 71% 93 72% 228 77% 67 72% 441 74%
11 Lafayatte 8 79% 38 68% 48 70% 253 72% 51 77% 398 72%
12 Brentwood 34 65% 38 78% 94 64% 177 71% 42 73% 385 70%
13 Oakland 78 48% 60 75% 54 62% 127 69% 52 73% 371 65%
14 Bay Point 37 58% 73 68% 156 62% 57 70% 38 65% 361 64%
15 Hercules 26 60% 138 68% 66 76% 43 78% 55 73% 328 71%
16 Clayton 4 91% 21 67% 41 54% 193 72% 34 77% 293 70%
17 Oakley 19 47% 29 68% 81 69% 96 71% 37 72% 262 68%
18 Moraga 1 37 76% 20 81% 156 70% 35 78% 249 73%
19 Pinole 17 70% 41 76% 40 70% 75 78% 37 71% 210 74%
20 Orinda 2 100% 33 61% 19 70% 134 76% 20 71% 208 73%Other Cities 275 548 610 1,026 439 2,898
Total 20,715 72%
TotalAfrican American Asian Hispanic White Other/Undeclared
Source: CCCCD Colleague. Run date 8/12/2013. JD 6
LEVEL1ACCREDITATIONTABLES–AGGREGATEDBYMEASURE
Information in this section:
Student Head Count by Term
Percent of Students Receiving Financial Aid by Term
Success Rate for All Courses, Basic Skill Courses, CTE Courses and General Education Courses
Retention Rate for All Courses, Basic Skill Courses, CTE Courses and General Education Courses
Fall‐to‐Spring Persistence Rate for All Courses, Basic Skill Courses, CTE Courses and General
Education Courses
Fall‐to‐Fall Persistence Rate for All Courses, Basic Skill Courses, CTE Courses and General
Education Courses
Number of Course Enrollments for All Courses, Basic Skill Courses, CTE Courses and General
Education Courses
Number of Successful Course Completions for All Courses, Basic Skill Courses, CTE Courses and
General Education Courses
Number of Course Completions for All Courses, Basic Skill Courses, CTE Courses and General
Education Courses
7

Los Medanos CollegeLevel 1 Accrediation Tables - Aggregated by Measure
ALL COURSES 2007FA 2008FA 2009FA 2010FA 2011FA 2012FA
Number of Students (Head Count) 9,140 9,970 11,024 9,930 9,115 8,779
Percent Receiving Financial Aid 30% 36% 42% 47% 52% 54%
Course Success Rate 67% 69% 69% 69% 71% 70%
Course Retention Rate 83% 84% 83% 82% 86% 85%
Fall-to-Spring Persistence Rate 62% 66% 67% 69% 70% 69%
Fall-to-Fall Persistence Rate 45% 49% 48% 49% 51% na
Number of Course Enrollments 22,718 25,603 28,551 26,854 23,807 23,589
Number Successful 15,316 17,551 19,608 18,451 16,984 16,543
Number Retained 18,927 21,570 23,634 22,129 20,361 20,087
BASIC SKILLS COURSES 2007FA 2008FA 2009FA 2010FA 2011FA 2012FA
Number of Students (Head Count) 1,212 1,426 1,783 1,531 1,302 1,258
Percent Receiving Financial Aid 45% 51% 58% 62% 65% 68%
Course Success Rate 57% 61% 64% 61% 65% 60%
Course Retention Rate 80% 82% 82% 79% 82% 80%
Fall-to-Spring Persistence Rate 67% 72% 68% 70% 70% 68%
Fall-to-Fall Persistence Rate 50% 56% 50% 50% 54% na
Number of Course Enrollments 1,550 1,865 2,437 2,069 1,732 1,674
Number Successful 878 1,146 1,553 1,262 1,120 997
Number Retained 1,242 1,528 1,993 1,638 1,428 1,340
CTE COURSES 2007FA 2008FA 2009FA 2010FA 2011FA 2012FA
Number of Students (Head Count) 3,907 4,117 4,469 3,757 3,329 3,225
Percent Receiving Financial Aid 30% 36% 42% 48% 54% 54%
Course Success Rate 73% 72% 73% 71% 72% 71%
Course Retention Rate 88% 88% 87% 85% 87% 87%
Fall-to-Spring Persistence Rate 58% 63% 65% 67% 69% 67%
Fall-to-Fall Persistence Rate 40% 45% 42% 45% 47% na
Number of Course Enrollments 6,599 6,631 7,261 6,180 5,289 5,273
Number Successful 4,833 4,791 5,294 4,397 3,822 3,760
Number Retained 5,812 5,851 6,349 5,263 4,575 4,571
GENERAL ED. COURSES 2007FA 2008FA 2009FA 2010FA 2011FA 2012FA
Number of Students (Head Count) 8,029 8,982 9,947 9,446 8,710 8,406
Percent Receiving Financial Aid 31% 37% 42% 47% 52% 54%
Course Success Rate 67% 68% 68% 69% 72% 71%
Course Retention Rate 83% 84% 82% 83% 86% 86%
Fall-to-Spring Persistence Rate 64% 68% 68% 70% 71% 70%
Fall-to-Fall Persistence Rate 47% 50% 50% 49% 51% na
Number of Course Enrollments 20,000 22,564 25,116 24,477 21,962 21,770
Number Successful 13,432 15,388 17,191 16,956 15,781 15,438
Number Retained 16,550 18,905 20,659 20,209 18,833 18,615
na: Information about students persisting to the current fall term is not available.
See Addendum A for definitions.
Source: CCCCD Colleague. Run date 8/12/2013. JD 8

LEVEL2ACCREDITATIONTABLES–AGGREGATEDBYCOURSETYPEANDINSTRUCTIONMETHOD
Information in this section:
Success Rate by Traditional and Online Instruction Methods for All Courses, Basic Skill Courses,
CTE Courses and General Education Courses
Retention Rate by Traditional and Online Instruction Methods for All Courses, Basic Skill Courses,
CTE Courses and General Education Courses
Fall‐to‐Spring Persistence Rate by Traditional and Online Instruction Methods for All Courses,
Basic Skill Courses, CTE Courses and General Education Courses
Fall‐to‐Fall Persistence Rate by Traditional and Online Instruction Methods for All Courses, Basic
Skill Courses, CTE Courses and General Education Courses
Total Success Rate for All Courses, Basic Skill Courses, CTE Courses and General Education
Courses
Number of Course Enrollments by Traditional and Online Instruction Methods for All Courses,
Basic Skill Courses, CTE Courses and General Education Courses
Number of Successful Course Completions by Traditional and Online Instruction Methods for All
Courses, Basic Skill Courses, CTE Courses and General Education Courses
Number of Course Completions by Traditional and Online Instruction Methods for All Courses,
Basic Skill Courses, CTE Courses and General Education Courses
9
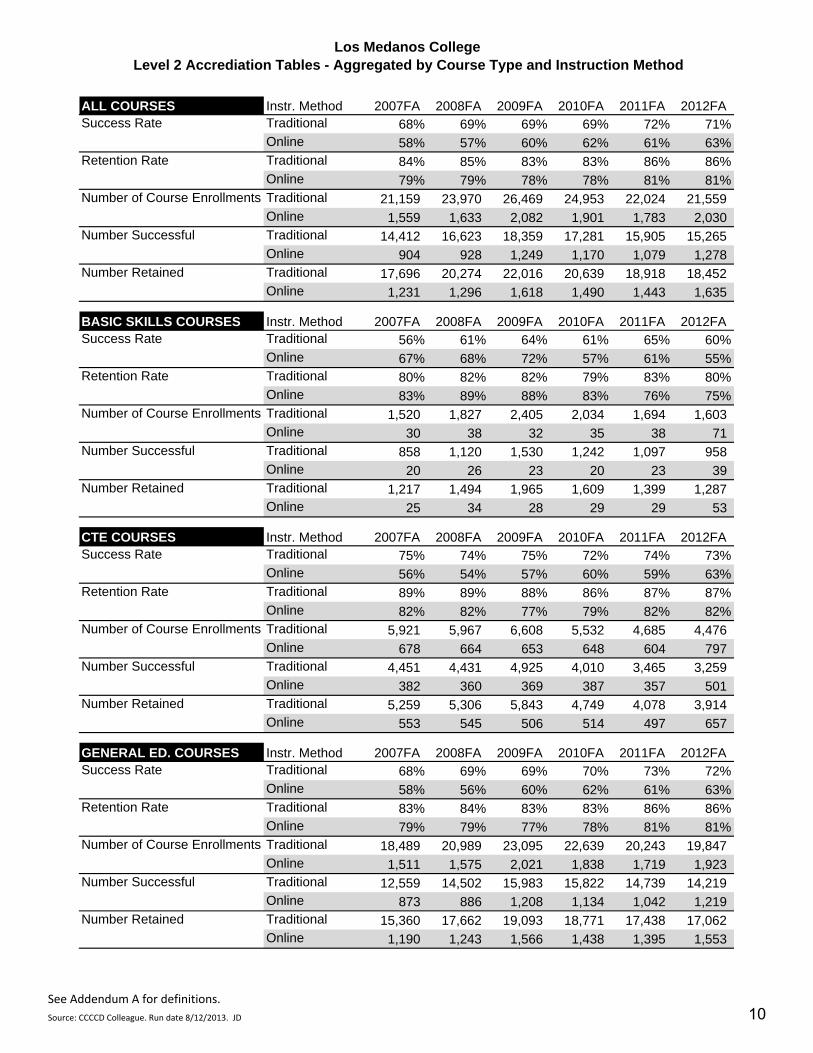
Los Medanos CollegeLevel 2 Accrediation Tables - Aggregated by Course Type and Instruction Method
ALL COURSES Instr. Method 2007FA 2008FA 2009FA 2010FA 2011FA 2012FATraditional 68% 69% 69% 69% 72% 71%Online 58% 57% 60% 62% 61% 63%Traditional 84% 85% 83% 83% 86% 86%Online 79% 79% 78% 78% 81% 81%Traditional 21,159 23,970 26,469 24,953 22,024 21,559 Online 1,559 1,633 2,082 1,901 1,783 2,030 Traditional 14,412 16,623 18,359 17,281 15,905 15,265 Online 904 928 1,249 1,170 1,079 1,278 Traditional 17,696 20,274 22,016 20,639 18,918 18,452 Online 1,231 1,296 1,618 1,490 1,443 1,635
BASIC SKILLS COURSES Instr. Method 2007FA 2008FA 2009FA 2010FA 2011FA 2012FATraditional 56% 61% 64% 61% 65% 60%Online 67% 68% 72% 57% 61% 55%Traditional 80% 82% 82% 79% 83% 80%Online 83% 89% 88% 83% 76% 75%Traditional 1,520 1,827 2,405 2,034 1,694 1,603 Online 30 38 32 35 38 71 Traditional 858 1,120 1,530 1,242 1,097 958 Online 20 26 23 20 23 39 Traditional 1,217 1,494 1,965 1,609 1,399 1,287 Online 25 34 28 29 29 53
CTE COURSES Instr. Method 2007FA 2008FA 2009FA 2010FA 2011FA 2012FATraditional 75% 74% 75% 72% 74% 73%Online 56% 54% 57% 60% 59% 63%Traditional 89% 89% 88% 86% 87% 87%Online 82% 82% 77% 79% 82% 82%Traditional 5,921 5,967 6,608 5,532 4,685 4,476 Online 678 664 653 648 604 797 Traditional 4,451 4,431 4,925 4,010 3,465 3,259 Online 382 360 369 387 357 501 Traditional 5,259 5,306 5,843 4,749 4,078 3,914 Online 553 545 506 514 497 657
GENERAL ED. COURSES Instr. Method 2007FA 2008FA 2009FA 2010FA 2011FA 2012FATraditional 68% 69% 69% 70% 73% 72%Online 58% 56% 60% 62% 61% 63%Traditional 83% 84% 83% 83% 86% 86%Online 79% 79% 77% 78% 81% 81%Traditional 18,489 20,989 23,095 22,639 20,243 19,847 Online 1,511 1,575 2,021 1,838 1,719 1,923 Traditional 12,559 14,502 15,983 15,822 14,739 14,219 Online 873 886 1,208 1,134 1,042 1,219 Traditional 15,360 17,662 19,093 18,771 17,438 17,062 Online 1,190 1,243 1,566 1,438 1,395 1,553
Number of Course Enrollments
Number Successful
Number Retained
Retention Rate
Success Rate
Retention Rate
Success Rate
Number of Course Enrollments
Number Successful
Number Retained
Success Rate
Retention Rate
Number Successful
Number Retained
Number of Course Enrollments
Number Successful
Number Retained
Number of Course Enrollments
Success Rate
Retention Rate
See Addendum A for definitions.
Source: CCCCD Colleague. Run date 8/12/2013. JD 10
FIGURES
Information in this section:
Student Head Count by Demographic Group
Student Financial Aid Information by Demographic Group
Number of Awards by Demographic Group
Course Success Rate by Type of Course and Instruction Method
Course Success Rate by Demographic Group
Basic Skills Course Success Rate by Demographic Group
Career and Technical Education (CTE) Course Success Rate by Demographic Group
General Education Course Success Rate by Demographic Group
Persistence Rates by Type of Course
Fall‐to‐Spring Persistence Rate for All Courses by Demographic Group
Fall‐to‐Fall Persistence Rate for All Courses by Demographic Group
11

Student head count:
The unduplicated number of students who receive a grade of A, B, C, D, F, FW, I*, P/CR, NP/NC, RD, W in at least one class during the term.
Los Medanos CollegeDemographic Information
2007FA 2008FA 2009FA 2010FA 2011FA 2012FA
Head Count 9,140 9,970 11,024 9,930 9,115 8,779
2,000
4,000
6,000
8,000
10,000
12,000
14,000
Number
Number of Students
2007FA 2008FA 2009FA 2010FA 2011FA 2012FA
Female 59% 57% 56% 55% 56% 54%
Male 39% 41% 42% 44% 43% 44%
0%
10%
20%
30%
40%
50%
60%
70%
Percent
By Gender
2007FA 2008FA 2009FA 2010FA 2011FA 2012FA
<20 years 32% 35% 34% 33% 32% 32%
20‐24 years 26% 26% 28% 32% 33% 34%
25‐49 years 35% 33% 33% 31% 30% 29%
50+ years 6% 6% 5% 5% 5% 4%
0%
10%
20%
30%
40%
50%
Percent
By Age Group
2007FA 2008FA 2009FA 2010FA 2011FA 2012FA
African Am. 15% 17% 17% 17% 17% 15%
Asian 11% 11% 11% 11% 11% 11%
Hispanic 28% 29% 28% 30% 31% 33%
White 37% 35% 32% 31% 30% 29%
Other/Unk. 8% 9% 12% 12% 12% 11%
0%
10%
20%
30%
40%
50%
Percent
By Race/Ethnicity
Source: CCCCD Colleague. Run date 8/12/2013. JD 12
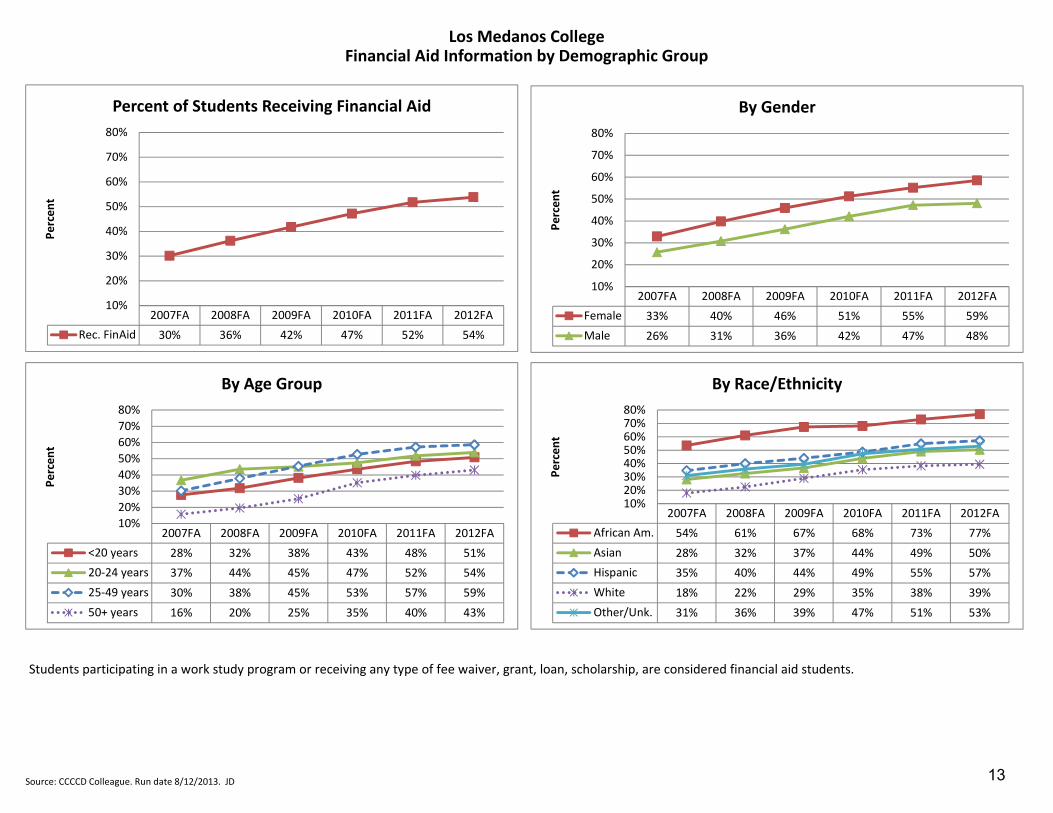
Students participating in a work study program or receiving any type of fee waiver, grant, loan, scholarship, are considered financial aid students.
Los Medanos CollegeFinancial Aid Information by Demographic Group
2007FA 2008FA 2009FA 2010FA 2011FA 2012FA
Female 33% 40% 46% 51% 55% 59%
Male 26% 31% 36% 42% 47% 48%
10%
20%
30%
40%
50%
60%
70%
80%
Percent
By Gender
2007FA 2008FA 2009FA 2010FA 2011FA 2012FA
<20 years 28% 32% 38% 43% 48% 51%
20‐24 years 37% 44% 45% 47% 52% 54%
25‐49 years 30% 38% 45% 53% 57% 59%
50+ years 16% 20% 25% 35% 40% 43%
10%
20%
30%
40%
50%
60%
70%
80%
Percent
By Age Group
2007FA 2008FA 2009FA 2010FA 2011FA 2012FA
African Am. 54% 61% 67% 68% 73% 77%
Asian 28% 32% 37% 44% 49% 50%
Hispanic 35% 40% 44% 49% 55% 57%
White 18% 22% 29% 35% 38% 39%
Other/Unk. 31% 36% 39% 47% 51% 53%
10%20%30%40%50%60%70%80%
Percent
By Race/Ethnicity
2007FA 2008FA 2009FA 2010FA 2011FA 2012FA
Rec. FinAid 30% 36% 42% 47% 52% 54%
10%
20%
30%
40%
50%
60%
70%
80%
Percent
Percent of Students Receiving Financial Aid
Source: CCCCD Colleague. Run date 8/12/2013. JD 13
Awards:
AA/AS degree: Associate of Arts (A.A.) degree, Associate of Science (A.S.) degree
Less than 1‐year certificate includes certificates ranging 6 to fewer than 30 units.
At least 1 year but less than 2‐year certificate includes certificates ranging from30 to 60 or more units.
Number of Awards by Demographic GroupLos Medanos College
2007‐08 2008‐09 2009‐10 2010‐11 2011‐12 2012‐13
Female 495 518 396 620 674 715
Male 296 291 229 417 499 551
Unknown 12 26 19 30 19 14
0
100
200
300
400
500
600
700
800
Number
By Gender
2007‐08 2008‐09 2009‐10 2010‐11 2011‐12 2012‐13
African Am. 74 118 90 124 135 152
Asian 107 88 61 121 110 124
Hispanic 215 232 179 311 387 420
White 339 341 249 423 454 431
Other/Unk. 68 56 65 88 106 153
0100200300400500600700
Number
By Race/Ethnicity
2007‐08 2008‐09 2009‐10 2010‐11 2011‐12 2012‐13
AA/AS degree 391 452 361 594 634 699
1 but <4 yr. cert 24 42 40 94 93 84
<1 yr. cert 388 341 243 379 465 497
0
100
200
300
400
500
600
700
800
Number
Awards by Type
2007‐08 2008‐09 2009‐10 2010‐11 2011‐12 2012‐13
<20 years 59 59 28 72 57 79
20‐24 years 300 342 237 498 558 626
25‐49 years 382 394 333 445 525 504
50+ years 62 40 46 52 52 71
0
100
200
300
400
500
600
700
Number
By Age Group
Source: CCCCD Colleague. Run date 8/12/2013. JD 14

Course Success Rate: Percentage of students who receive a passing/satisfactory grade.
Numerator: A, B, C, CR, IA, IB, IC, IP, P
Denominator: A, B, C, CR, D, F, IA, IB, IC, ID, IF, IN, P, NC, NP, P, W
Excluded grade notations: MW, RD
Los Medanos CollegeCourse Success Rate by Demographic Group
2007FA 2008FA 2009FA 2010FA 2011FA 2012FA
Traditional 68% 69% 69% 69% 72% 71%
Online 58% 57% 60% 62% 61% 63%
40%
50%
60%
70%
80%
90%
Success Rate
Course Success Rate
2007FA 2008FA 2009FA 2010FA 2011FA 2012FA
Female 68% 69% 69% 70% 72% 70%
Male 67% 68% 68% 68% 71% 70%
40%
50%
60%
70%
80%
90%
Success Rate
By Gender
2007FA 2008FA 2009FA 2010FA 2011FA 2012FA
African Am. 53% 53% 54% 54% 60% 58%
Asian 71% 75% 75% 74% 75% 79%
Hispanic 67% 69% 69% 69% 72% 70%
White 73% 75% 75% 74% 76% 75%
Other/Unk. 67% 65% 69% 70% 71% 68%
40%
50%
60%
70%
80%
90%
Success Rate
By Race/Ethnicity
2007FA 2008FA 2009FA 2010FA 2011FA 2012FA
<20 years 64% 66% 67% 67% 72% 71%
20‐24 years 63% 65% 66% 66% 68% 68%
25‐49 years 75% 74% 72% 72% 74% 70%
50+ years 82% 80% 79% 77% 78% 76%
40%
50%
60%
70%
80%
90%
Success Rate
By Age Group
Source: CCCCD Colleague. Run date 8/12/2013. JD 15
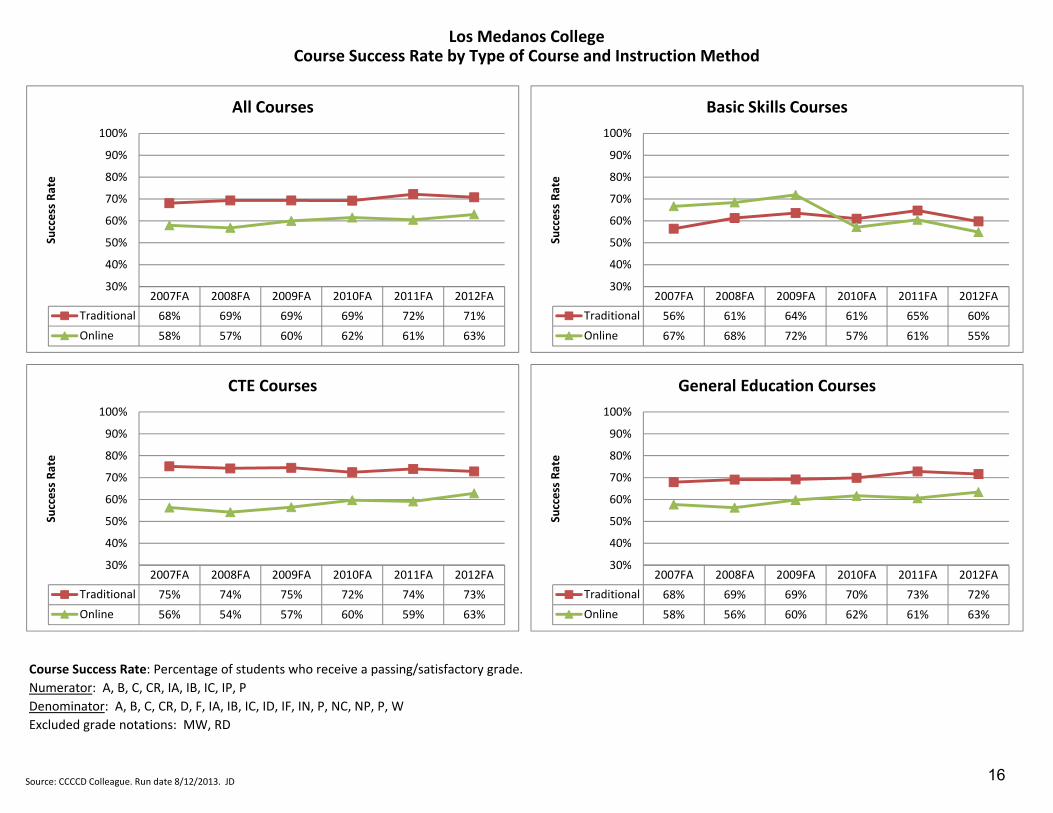
Course Success Rate: Percentage of students who receive a passing/satisfactory grade.
Numerator: A, B, C, CR, IA, IB, IC, IP, P
Denominator: A, B, C, CR, D, F, IA, IB, IC, ID, IF, IN, P, NC, NP, P, W
Excluded grade notations: MW, RD
Los Medanos CollegeCourse Success Rate by Type of Course and Instruction Method
2007FA 2008FA 2009FA 2010FA 2011FA 2012FA
Traditional 68% 69% 69% 69% 72% 71%
Online 58% 57% 60% 62% 61% 63%
30%
40%
50%
60%
70%
80%
90%
100%
Success Rate
All Courses
2007FA 2008FA 2009FA 2010FA 2011FA 2012FA
Traditional 56% 61% 64% 61% 65% 60%
Online 67% 68% 72% 57% 61% 55%
30%
40%
50%
60%
70%
80%
90%
100%
Success Rate
Basic Skills Courses
2007FA 2008FA 2009FA 2010FA 2011FA 2012FA
Traditional 75% 74% 75% 72% 74% 73%
Online 56% 54% 57% 60% 59% 63%
30%
40%
50%
60%
70%
80%
90%
100%
Success Rate
CTE Courses
2007FA 2008FA 2009FA 2010FA 2011FA 2012FA
Traditional 68% 69% 69% 70% 73% 72%
Online 58% 56% 60% 62% 61% 63%
30%
40%
50%
60%
70%
80%
90%
100%
Success Rate
General Education Courses
Source: CCCCD Colleague. Run date 8/12/2013. JD 16

Course Success Rate: Percentage of students who receive a passing/satisfactory grade.
Numerator: A, B, C, CR, IA, IB, IC, IP, P
Denominator: A, B, C, CR, D, F, IA, IB, IC, ID, IF, IN, P, NC, NP, P, W
Excluded grade notations: MW, RD
Los Medanos CollegeBasic Skills Course Success Rate by Demographic Group
2007FA 2008FA 2009FA 2010FA 2011FA 2012FA
Traditional 56% 61% 64% 61% 65% 60%
Online 67% 68% 72% 57% 61% 55%
30%
40%
50%
60%
70%
80%
90%
100%
Success Rate
Basic Skills Course Success Rate
2007FA 2008FA 2009FA 2010FA 2011FA 2012FA
Female 61% 66% 68% 65% 69% 63%
Male 49% 54% 57% 54% 56% 54%
30%
40%
50%
60%
70%
80%
90%
100%
Success Rate
By Gender
2007FA 2008FA 2009FA 2010FA 2011FA 2012FA
African Am. 38% 50% 52% 47% 48% 44%
Asian 63% 69% 74% 67% 79% 79%
Hispanic 63% 66% 66% 67% 70% 62%
White 62% 64% 68% 68% 68% 66%
Other/Unk. 54% 59% 65% 54% 59% 51%
30%40%50%60%70%80%90%100%
Success Rate
By Race/Ethnicity
2007FA 2008FA 2009FA 2010FA 2011FA 2012FA
<20 years 54% 56% 65% 55% 61% 63%
20‐24 years 45% 58% 55% 52% 57% 48%
25‐49 years 68% 70% 66% 71% 72% 64%
50+ years 61% 78% 74% 69% 75% 64%
30%
40%
50%
60%
70%
80%
90%
100%
Success Rate
By Age Group
Source: CCCCD Colleague. Run date 8/12/2013. JD 17
Course Success Rate: Percentage of students who receive a passing/satisfactory grade.
Numerator: A, B, C, CR, IA, IB, IC, IP, P
Denominator: A, B, C, CR, D, F, IA, IB, IC, ID, IF, IN, P, NC, NP, P, W
Excluded grade notations: MW, RD
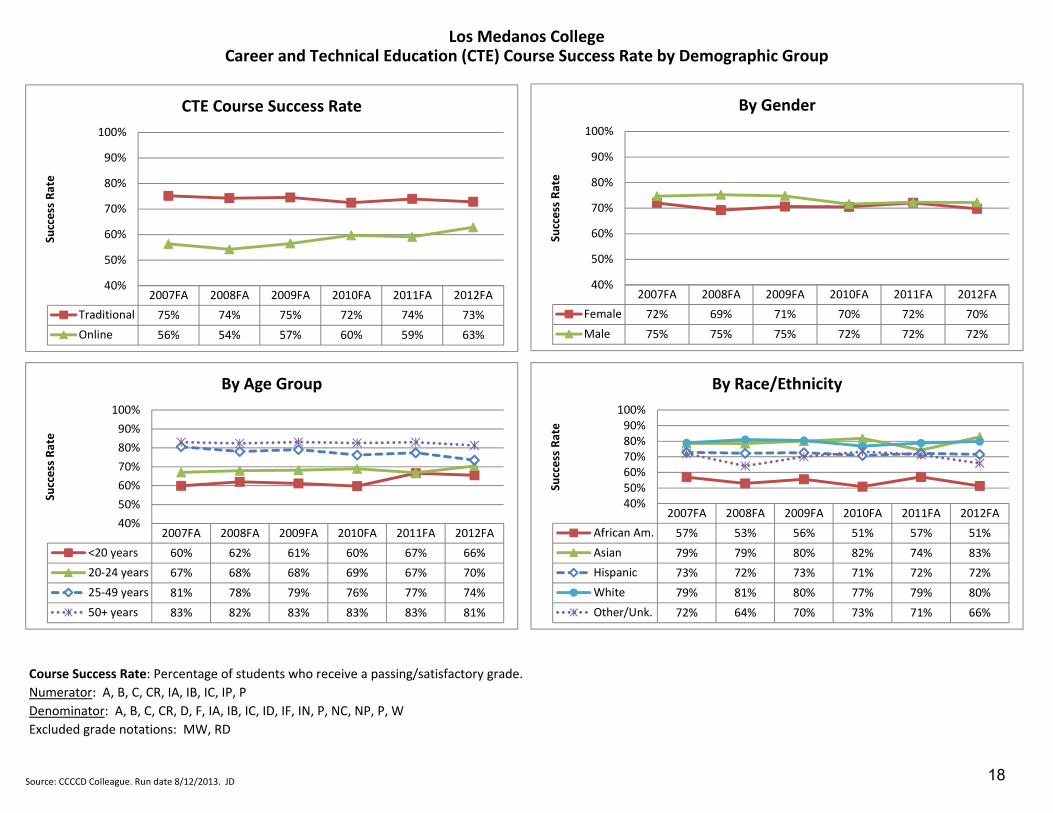
Los Medanos CollegeCareer and Technical Education (CTE) Course Success Rate by Demographic Group
2007FA 2008FA 2009FA 2010FA 2011FA 2012FA
Traditional 75% 74% 75% 72% 74% 73%
Online 56% 54% 57% 60% 59% 63%
40%
50%
60%
70%
80%
90%
100%
Success Rate
CTE Course Success Rate
2007FA 2008FA 2009FA 2010FA 2011FA 2012FA
Female 72% 69% 71% 70% 72% 70%
Male 75% 75% 75% 72% 72% 72%
40%
50%
60%
70%
80%
90%
100%
Success Rate
By Gender
2007FA 2008FA 2009FA 2010FA 2011FA 2012FA
African Am. 57% 53% 56% 51% 57% 51%
Asian 79% 79% 80% 82% 74% 83%
Hispanic 73% 72% 73% 71% 72% 72%
White 79% 81% 80% 77% 79% 80%
Other/Unk. 72% 64% 70% 73% 71% 66%
40%50%60%70%80%90%100%
Success Rate
By Race/Ethnicity
2007FA 2008FA 2009FA 2010FA 2011FA 2012FA
<20 years 60% 62% 61% 60% 67% 66%
20‐24 years 67% 68% 68% 69% 67% 70%
25‐49 years 81% 78% 79% 76% 77% 74%
50+ years 83% 82% 83% 83% 83% 81%
40%
50%
60%
70%
80%
90%
100%
Success Rate
By Age Group
Source: CCCCD Colleague. Run date 8/12/2013. JD 18

Course Success Rate: Percentage of students who receive a passing/satisfactory grade.
Numerator: A, B, C, CR, IA, IB, IC, IP, P
Denominator: A, B, C, CR, D, F, IA, IB, IC, ID, IF, IN, P, NC, NP, P, W
Excluded grade notations: MW, RD
Los Medanos CollegeGeneral Education Course Success Rate by Demographic Group
2007FA 2008FA 2009FA 2010FA 2011FA 2012FA
Traditional 68% 69% 69% 70% 73% 72%
Online 58% 56% 60% 62% 61% 63%
40%
50%
60%
70%
80%
90%
Success Rate
General Education Course Success Rate
2007FA 2008FA 2009FA 2010FA 2011FA 2012FA
Female 67% 68% 69% 70% 72% 71%
Male 67% 68% 68% 69% 72% 71%
40%
50%
60%
70%
80%
90%
Success Rate
By Gender
2007FA 2008FA 2009FA 2010FA 2011FA 2012FA
African Am. 54% 53% 54% 55% 61% 59%
Asian 70% 75% 74% 75% 74% 79%
Hispanic 67% 68% 69% 69% 72% 71%
White 72% 75% 74% 74% 77% 76%
Other/Unk. 67% 65% 69% 71% 71% 68%
40%
50%
60%
70%
80%
90%
Success Rate
By Race/Ethnicity
2007FA 2008FA 2009FA 2010FA 2011FA 2012FA
<20 years 64% 67% 67% 68% 72% 72%
20‐24 years 64% 65% 66% 67% 69% 69%
25‐49 years 73% 73% 71% 73% 74% 71%
50+ years 82% 79% 79% 78% 79% 77%
40%
50%
60%
70%
80%
90%
Success Rate
By Age Group
Source: CCCCD Colleague. Run date 8/12/2013. JD 19
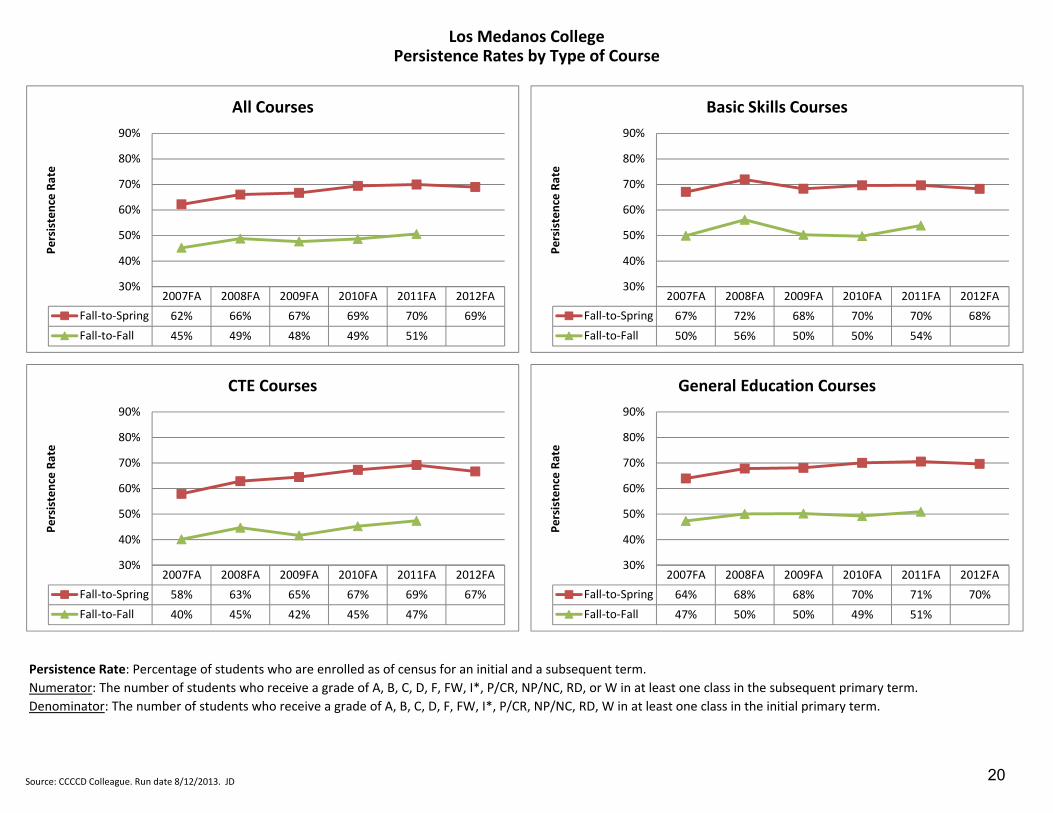
Persistence Rate: Percentage of students who are enrolled as of census for an initial and a subsequent term.
Numerator: The number of students who receive a grade of A, B, C, D, F, FW, I*, P/CR, NP/NC, RD, or W in at least one class in the subsequent primary term.
Denominator: The number of students who receive a grade of A, B, C, D, F, FW, I*, P/CR, NP/NC, RD, W in at least one class in the initial primary term.
Los Medanos CollegePersistence Rates by Type of Course
2007FA 2008FA 2009FA 2010FA 2011FA 2012FA
Fall‐to‐Spring 62% 66% 67% 69% 70% 69%
Fall‐to‐Fall 45% 49% 48% 49% 51%
30%
40%
50%
60%
70%
80%
90%
Persisten
ce Rate
All Courses
2007FA 2008FA 2009FA 2010FA 2011FA 2012FA
Fall‐to‐Spring 67% 72% 68% 70% 70% 68%
Fall‐to‐Fall 50% 56% 50% 50% 54%
30%
40%
50%
60%
70%
80%
90%
Persisten
ce Rate
Basic Skills Courses
2007FA 2008FA 2009FA 2010FA 2011FA 2012FA
Fall‐to‐Spring 58% 63% 65% 67% 69% 67%
Fall‐to‐Fall 40% 45% 42% 45% 47%
30%
40%
50%
60%
70%
80%
90%
Persisten
ce Rate
CTE Courses
2007FA 2008FA 2009FA 2010FA 2011FA 2012FA
Fall‐to‐Spring 64% 68% 68% 70% 71% 70%
Fall‐to‐Fall 47% 50% 50% 49% 51%
30%
40%
50%
60%
70%
80%
90%
Persisten
ce Rate
General Education Courses
Source: CCCCD Colleague. Run date 8/12/2013. JD 20

Persistence Rate: Percentage of students who are enrolled as of census for an initial and a subsequent term.
Numerator: The number of students who receive a grade of A, B, C, D, F, FW, I*, P/CR, NP/NC, RD, or W in at least one class in the subsequent primary term.
Denominator: The number of students who receive a grade of A, B, C, D, F, FW, I*, P/CR, NP/NC, RD, W in at least one class in the initial primary term.
Los Medanos CollegeFall‐to‐Spring Persistence Rate for All Courses by Demographic Group
2007FA 2008FA 2009FA 2010FA 2011FA 2012FA
Fall‐to‐Spring 62% 66% 67% 69% 70% 69%
40%
50%
60%
70%
80%
90%
Persisten
ce Rate
Fall‐to‐Spring Persistence Rate
2007FA 2008FA 2009FA 2010FA 2011FA 2012FA
Female 63% 66% 66% 70% 70% 69%
Male 61% 66% 67% 68% 70% 69%
40%
50%
60%
70%
80%
90%
Persisten
ce Rate
By Gender
2007FA 2008FA 2009FA 2010FA 2011FA 2012FA
African Am. 55% 59% 60% 60% 61% 62%
Asian 66% 70% 72% 72% 73% 75%
Hispanic 64% 68% 67% 71% 72% 71%
White 62% 66% 67% 70% 70% 68%
Other/Unk. 63% 68% 69% 75% 74% 69%
40%
50%
60%
70%
80%
90%
Persisten
ce Rate
By Race/Ethnicity
2007FA 2008FA 2009FA 2010FA 2011FA 2012FA
<20 years 69% 73% 73% 76% 77% 78%
20‐24 years 64% 65% 66% 68% 69% 68%
25‐49 years 56% 61% 63% 65% 65% 62%
50+ years 53% 55% 55% 64% 64% 60%
40%
50%
60%
70%
80%
90%
Persisten
ce Rate
By Age Group
Source: CCCCD Colleague. Run date 8/12/2013. JD 21
Persistence Rate: Percentage of students who are enrolled as of census for an initial and a subsequent term.
Numerator: The number of students who receive a grade of A, B, C, D, F, FW, I*, P/CR, NP/NC, RD, or W in at least one class in the subsequent primary term.
Denominator: The number of students who receive a grade of A, B, C, D, F, FW, I*, P/CR, NP/NC, RD, W in at least one class in the initial primary term.
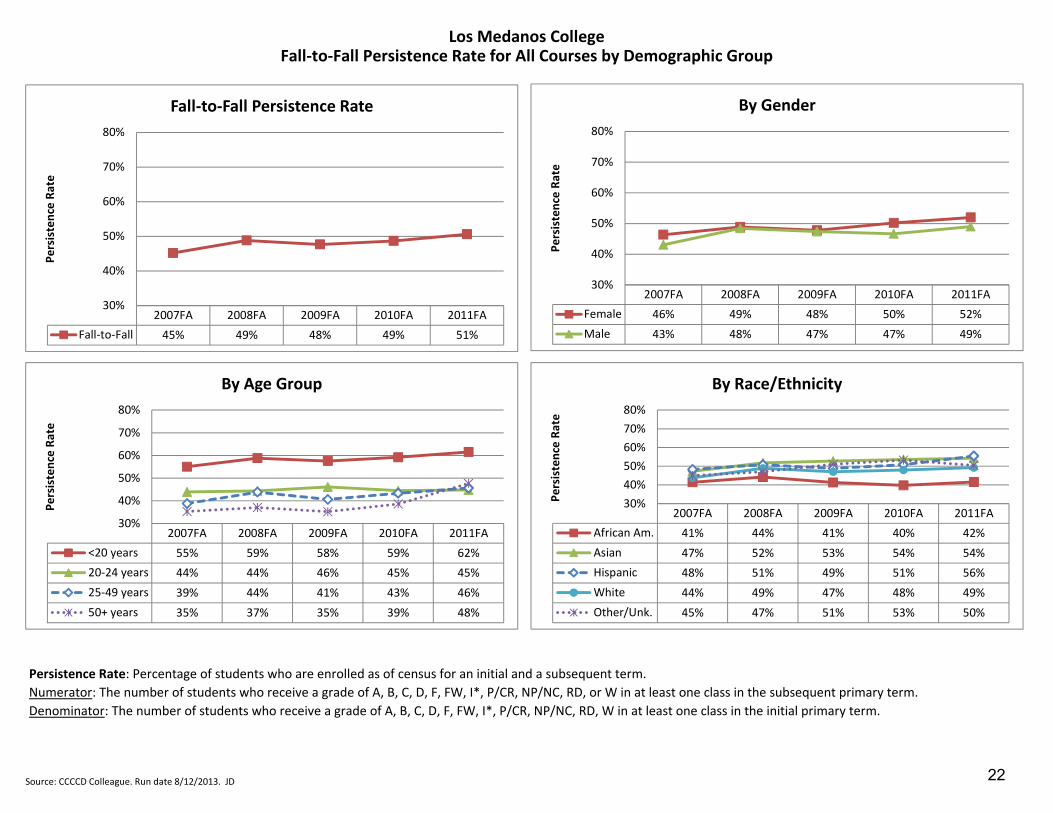
Los Medanos CollegeFall‐to‐Fall Persistence Rate for All Courses by Demographic Group
2007FA 2008FA 2009FA 2010FA 2011FA
Fall‐to‐Fall 45% 49% 48% 49% 51%
30%
40%
50%
60%
70%
80%
Persisten
ce Rate
Fall‐to‐Fall Persistence Rate
2007FA 2008FA 2009FA 2010FA 2011FA
Female 46% 49% 48% 50% 52%
Male 43% 48% 47% 47% 49%
30%
40%
50%
60%
70%
80%
Persisten
ce Rate
By Gender
2007FA 2008FA 2009FA 2010FA 2011FA
African Am. 41% 44% 41% 40% 42%
Asian 47% 52% 53% 54% 54%
Hispanic 48% 51% 49% 51% 56%
White 44% 49% 47% 48% 49%
Other/Unk. 45% 47% 51% 53% 50%
30%
40%
50%
60%
70%
80%
Persisten
ce Rate
By Race/Ethnicity
2007FA 2008FA 2009FA 2010FA 2011FA
<20 years 55% 59% 58% 59% 62%
20‐24 years 44% 44% 46% 45% 45%
25‐49 years 39% 44% 41% 43% 46%
50+ years 35% 37% 35% 39% 48%
30%
40%
50%
60%
70%
80%
Persisten
ce Rate
By Age Group
Source: CCCCD Colleague. Run date 8/12/2013. JD 22
LEVEL3ACCREDITATIONTABLES–AGGREGATEDBYCOURSETYPEANDDEMOGRAPHICGROUP
Information in this section:
Success Rate by Gender, Age Group, and Race/Ethnicity for All Courses, Basic Skill Courses, CTE
Courses and General Education Courses
Retention Rate by Gender, Age Group, and Race/Ethnicity for All Courses, Basic Skill Courses,
CTE Courses and General Education Courses
Number of Enrollments by Gender, Age Group, and Race/Ethnicity for All Courses, Basic Skill
Courses, CTE Courses and General Education Courses
Number of Successful Course Completion Enrollments by Gender, Age Group, and
Race/Ethnicity for All Courses, Basic Skill Courses, CTE Courses and General Education Courses
Number of Course Completions by Gender, Age Group, and Race/Ethnicity for All Courses, Basic
Skill Courses, CTE Courses and General Education Courses
Fall‐to‐Spring Persistence Rate by Gender, Age Group, and Race/Ethnicity
Fall‐to‐Fall Persistence Rate by Gender, Age Group, and Race/Ethnicity
Number of Unduplicated Students by Fall Term by Gender, Age Group, and Race/Ethnicity
Number of Unduplicated Students Continuing from Fall to Spring by Gender, Age Group, and
Race/Ethnicity
Number of Unduplicated Students Continuing from Fall to the Following Fall by Gender, Age
Group, and Race/Ethnicity
23
Los Medanos College
Level 3 Accreditation Tables ‐ Aggregated by Course Type and Demographic Group
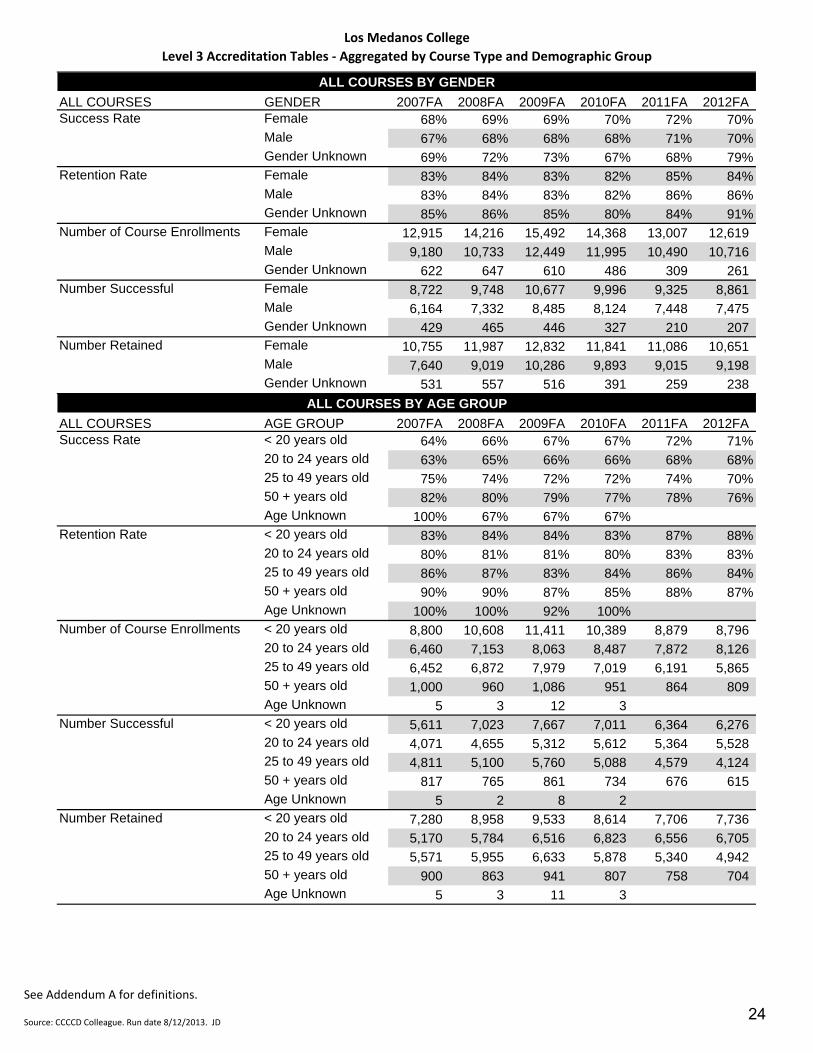
ALL COURSES GENDER 2007FA 2008FA 2009FA 2010FA 2011FA 2012FAFemale 68% 69% 69% 70% 72% 70%Male 67% 68% 68% 68% 71% 70%Gender Unknown 69% 72% 73% 67% 68% 79%Female 83% 84% 83% 82% 85% 84%Male 83% 84% 83% 82% 86% 86%Gender Unknown 85% 86% 85% 80% 84% 91%Female 12,915 14,216 15,492 14,368 13,007 12,619 Male 9,180 10,733 12,449 11,995 10,490 10,716 Gender Unknown 622 647 610 486 309 261 Female 8,722 9,748 10,677 9,996 9,325 8,861 Male 6,164 7,332 8,485 8,124 7,448 7,475 Gender Unknown 429 465 446 327 210 207 Female 10,755 11,987 12,832 11,841 11,086 10,651 Male 7,640 9,019 10,286 9,893 9,015 9,198 Gender Unknown 531 557 516 391 259 238
ALL COURSES AGE GROUP 2007FA 2008FA 2009FA 2010FA 2011FA 2012FA< 20 years old 64% 66% 67% 67% 72% 71%20 to 24 years old 63% 65% 66% 66% 68% 68%25 to 49 years old 75% 74% 72% 72% 74% 70%50 + years old 82% 80% 79% 77% 78% 76%Age Unknown 100% 67% 67% 67%< 20 years old 83% 84% 84% 83% 87% 88%20 to 24 years old 80% 81% 81% 80% 83% 83%25 to 49 years old 86% 87% 83% 84% 86% 84%50 + years old 90% 90% 87% 85% 88% 87%Age Unknown 100% 100% 92% 100%< 20 years old 8,800 10,608 11,411 10,389 8,879 8,796 20 to 24 years old 6,460 7,153 8,063 8,487 7,872 8,126 25 to 49 years old 6,452 6,872 7,979 7,019 6,191 5,865 50 + years old 1,000 960 1,086 951 864 809 Age Unknown 5 3 12 3 < 20 years old 5,611 7,023 7,667 7,011 6,364 6,276 20 to 24 years old 4,071 4,655 5,312 5,612 5,364 5,528 25 to 49 years old 4,811 5,100 5,760 5,088 4,579 4,124 50 + years old 817 765 861 734 676 615 Age Unknown 5 2 8 2 < 20 years old 7,280 8,958 9,533 8,614 7,706 7,736 20 to 24 years old 5,170 5,784 6,516 6,823 6,556 6,705 25 to 49 years old 5,571 5,955 6,633 5,878 5,340 4,942 50 + years old 900 863 941 807 758 704 Age Unknown 5 3 11 3
Number Retained
ALL COURSES BY GENDER
Success Rate
Retention Rate
Number of Course Enrollments
Number Successful
Number Retained
ALL COURSES BY AGE GROUP
Success Rate
Retention Rate
Number of Course Enrollments
Number Successful
See Addendum A for definitions.
Source: CCCCD Colleague. Run date 8/12/2013. JD24

Los Medanos College
Level 3 Accreditation Tables ‐ Aggregated by Course Type and Demographic Group
ALL COURSES RACE/ETHNICITY 2007FA 2008FA 2009FA 2010FA 2011FA 2012FAAfrican American 53% 53% 54% 54% 60% 58%Asian 71% 75% 75% 74% 75% 79%Hispanic 67% 69% 69% 69% 72% 70%White 73% 75% 75% 74% 76% 75%Other/Undeclared 67% 65% 69% 70% 71% 68%African American 78% 77% 76% 75% 82% 80%Asian 84% 87% 85% 85% 87% 89%Hispanic 83% 85% 83% 83% 86% 85%White 86% 87% 85% 85% 87% 87%Other/Undeclared 82% 83% 83% 83% 85% 84%African American 3,662 4,583 4,984 4,512 4,062 3,895 Asian 2,563 2,866 2,997 2,845 2,547 2,544 Hispanic 6,333 7,299 7,927 7,813 7,346 7,830 White 8,210 8,615 8,930 8,123 6,993 6,597 Other/Undeclared 1,949 2,233 3,713 3,556 2,858 2,730 African American 1,951 2,451 2,713 2,445 2,438 2,246 Asian 1,807 2,139 2,234 2,112 1,903 2,013 Hispanic 4,252 5,017 5,444 5,376 5,283 5,475 White 5,998 6,489 6,660 6,022 5,339 4,964 Other/Undeclared 1,307 1,449 2,557 2,492 2,020 1,845 African American 2,848 3,532 3,781 3,388 3,338 3,130 Asian 2,142 2,506 2,545 2,422 2,224 2,274 Hispanic 5,281 6,169 6,607 6,495 6,284 6,669 White 7,049 7,501 7,606 6,867 6,086 5,725 Other/Undeclared 1,606 1,855 3,095 2,953 2,428 2,289
ALL COURSES BY RACE/ETHNICITY
Success Rate
Retention Rate
Number of Course Enrollments
Number Successful
Number Retained
See Addendum A for definitions.
Source: CCCCD Colleague. Run date 8/12/2013. JD25
Los Medanos College
Level 3 Accreditation Tables ‐ Aggregated by Course Type and Demographic Group
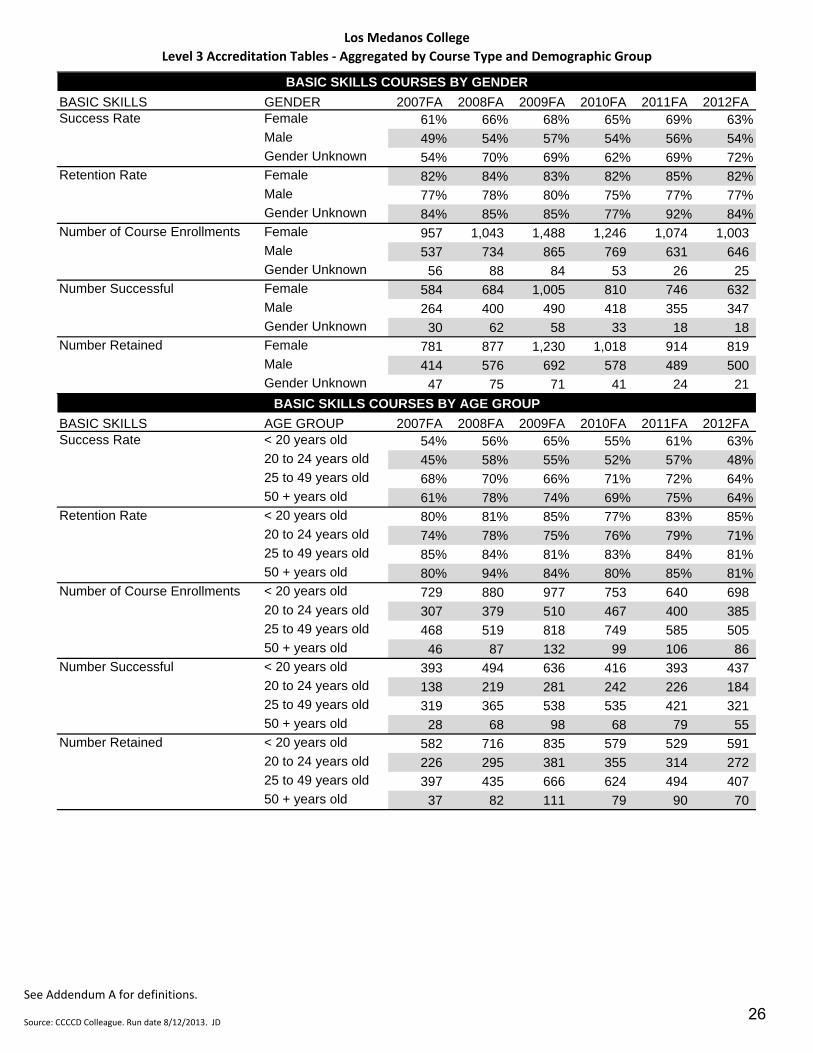
BASIC SKILLS GENDER 2007FA 2008FA 2009FA 2010FA 2011FA 2012FAFemale 61% 66% 68% 65% 69% 63%Male 49% 54% 57% 54% 56% 54%Gender Unknown 54% 70% 69% 62% 69% 72%Female 82% 84% 83% 82% 85% 82%Male 77% 78% 80% 75% 77% 77%Gender Unknown 84% 85% 85% 77% 92% 84%Female 957 1,043 1,488 1,246 1,074 1,003 Male 537 734 865 769 631 646 Gender Unknown 56 88 84 53 26 25 Female 584 684 1,005 810 746 632 Male 264 400 490 418 355 347 Gender Unknown 30 62 58 33 18 18 Female 781 877 1,230 1,018 914 819 Male 414 576 692 578 489 500 Gender Unknown 47 75 71 41 24 21
BASIC SKILLS AGE GROUP 2007FA 2008FA 2009FA 2010FA 2011FA 2012FA< 20 years old 54% 56% 65% 55% 61% 63%20 to 24 years old 45% 58% 55% 52% 57% 48%25 to 49 years old 68% 70% 66% 71% 72% 64%50 + years old 61% 78% 74% 69% 75% 64%< 20 years old 80% 81% 85% 77% 83% 85%20 to 24 years old 74% 78% 75% 76% 79% 71%25 to 49 years old 85% 84% 81% 83% 84% 81%50 + years old 80% 94% 84% 80% 85% 81%< 20 years old 729 880 977 753 640 698 20 to 24 years old 307 379 510 467 400 385 25 to 49 years old 468 519 818 749 585 505 50 + years old 46 87 132 99 106 86 < 20 years old 393 494 636 416 393 437 20 to 24 years old 138 219 281 242 226 184 25 to 49 years old 319 365 538 535 421 321 50 + years old 28 68 98 68 79 55 < 20 years old 582 716 835 579 529 591 20 to 24 years old 226 295 381 355 314 272 25 to 49 years old 397 435 666 624 494 407 50 + years old 37 82 111 79 90 70
Number Retained
BASIC SKILLS COURSES BY GENDER
Success Rate
Retention Rate
Number of Course Enrollments
Number Successful
BASIC SKILLS COURSES BY AGE GROUP
Success Rate
Retention Rate
Number of Course Enrollments
Number Successful
Number Retained
See Addendum A for definitions.
Source: CCCCD Colleague. Run date 8/12/2013. JD26

Los Medanos College
Level 3 Accreditation Tables ‐ Aggregated by Course Type and Demographic Group
BASIC SKILLS RACE/ETHNICITY 2007FA 2008FA 2009FA 2010FA 2011FA 2012FAAfrican American 38% 50% 52% 47% 48% 44%Asian 63% 69% 74% 67% 79% 79%Hispanic 63% 66% 66% 67% 70% 62%White 62% 64% 68% 68% 68% 66%Other/Undeclared 54% 59% 65% 54% 59% 51%African American 69% 72% 74% 68% 72% 68%Asian 81% 89% 85% 85% 92% 89%Hispanic 85% 86% 85% 84% 85% 82%White 80% 83% 82% 82% 85% 83%Other/Undeclared 82% 81% 84% 75% 83% 81%African American 336 448 551 496 420 361 Asian 155 159 224 203 212 196 Hispanic 644 719 916 801 661 688 White 279 379 427 369 296 280 Other/Undeclared 136 160 319 199 142 149 African American 128 222 286 232 201 159 Asian 98 110 166 136 168 154 Hispanic 407 477 606 534 466 424 White 172 242 289 252 200 184 Other/Undeclared 73 95 206 107 84 76 African American 233 324 407 338 304 247 Asian 125 142 191 172 194 175 Hispanic 549 618 778 674 560 566 White 224 314 350 304 251 231 Other/Undeclared 111 130 267 149 118 121
Number Retained
BASIC SKILLS COURSES BY RACE/ETHNICITY
Success Rate
Retention Rate
Number of Course Enrollments
Number Successful
See Addendum A for definitions.
Source: CCCCD Colleague. Run date 8/12/2013. JD27
Los Medanos College
Level 3 Accreditation Tables ‐ Aggregated by Course Type and Demographic Group
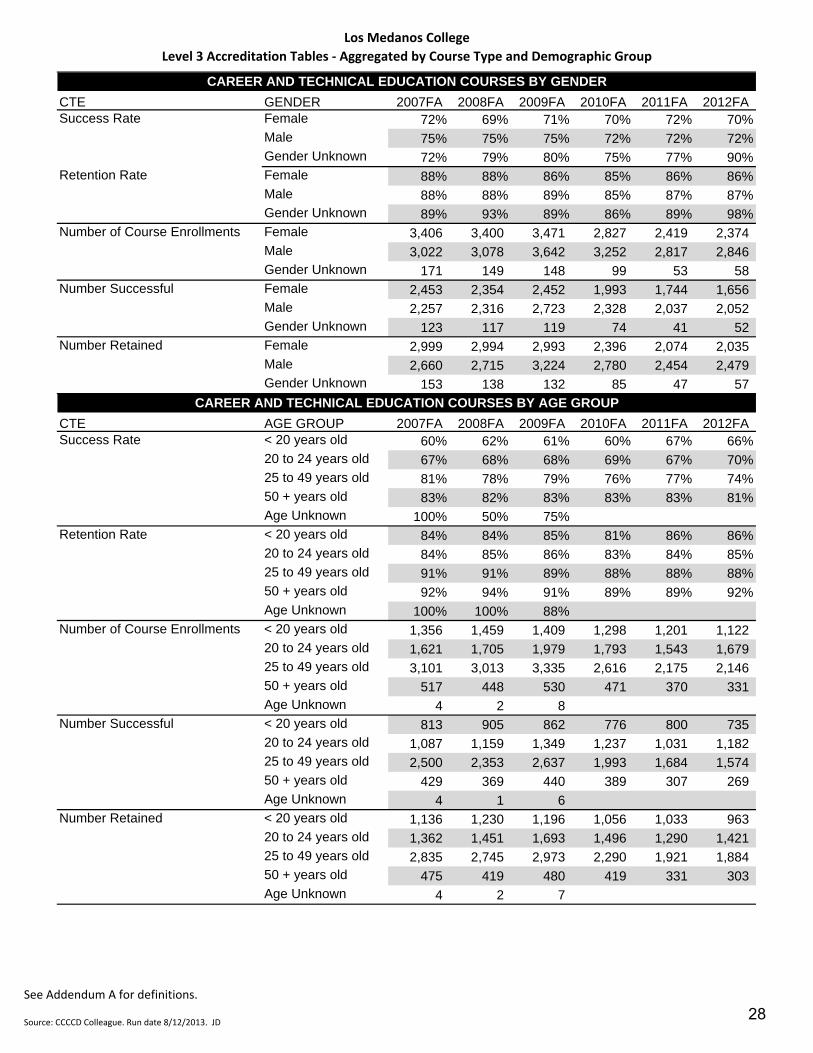
CTE GENDER 2007FA 2008FA 2009FA 2010FA 2011FA 2012FAFemale 72% 69% 71% 70% 72% 70%Male 75% 75% 75% 72% 72% 72%Gender Unknown 72% 79% 80% 75% 77% 90%Female 88% 88% 86% 85% 86% 86%Male 88% 88% 89% 85% 87% 87%Gender Unknown 89% 93% 89% 86% 89% 98%Female 3,406 3,400 3,471 2,827 2,419 2,374 Male 3,022 3,078 3,642 3,252 2,817 2,846 Gender Unknown 171 149 148 99 53 58 Female 2,453 2,354 2,452 1,993 1,744 1,656 Male 2,257 2,316 2,723 2,328 2,037 2,052 Gender Unknown 123 117 119 74 41 52 Female 2,999 2,994 2,993 2,396 2,074 2,035 Male 2,660 2,715 3,224 2,780 2,454 2,479 Gender Unknown 153 138 132 85 47 57
CTE AGE GROUP 2007FA 2008FA 2009FA 2010FA 2011FA 2012FA< 20 years old 60% 62% 61% 60% 67% 66%20 to 24 years old 67% 68% 68% 69% 67% 70%25 to 49 years old 81% 78% 79% 76% 77% 74%50 + years old 83% 82% 83% 83% 83% 81%Age Unknown 100% 50% 75%< 20 years old 84% 84% 85% 81% 86% 86%20 to 24 years old 84% 85% 86% 83% 84% 85%25 to 49 years old 91% 91% 89% 88% 88% 88%50 + years old 92% 94% 91% 89% 89% 92%Age Unknown 100% 100% 88%< 20 years old 1,356 1,459 1,409 1,298 1,201 1,122 20 to 24 years old 1,621 1,705 1,979 1,793 1,543 1,679 25 to 49 years old 3,101 3,013 3,335 2,616 2,175 2,146 50 + years old 517 448 530 471 370 331 Age Unknown 4 2 8 < 20 years old 813 905 862 776 800 735 20 to 24 years old 1,087 1,159 1,349 1,237 1,031 1,182 25 to 49 years old 2,500 2,353 2,637 1,993 1,684 1,574 50 + years old 429 369 440 389 307 269 Age Unknown 4 1 6 < 20 years old 1,136 1,230 1,196 1,056 1,033 963 20 to 24 years old 1,362 1,451 1,693 1,496 1,290 1,421 25 to 49 years old 2,835 2,745 2,973 2,290 1,921 1,884 50 + years old 475 419 480 419 331 303 Age Unknown 4 2 7
Number Retained
CAREER AND TECHNICAL EDUCATION COURSES BY GENDER
Success Rate
Retention Rate
Number of Course Enrollments
Number Successful
Number Retained
CAREER AND TECHNICAL EDUCATION COURSES BY AGE GROUP
Success Rate
Retention Rate
Number of Course Enrollments
Number Successful
See Addendum A for definitions.
Source: CCCCD Colleague. Run date 8/12/2013. JD28

Los Medanos College
Level 3 Accreditation Tables ‐ Aggregated by Course Type and Demographic Group
CTE RACE/ETHNICITY 2007FA 2008FA 2009FA 2010FA 2011FA 2012FAAfrican American 57% 53% 56% 51% 57% 51%Asian 79% 79% 80% 82% 74% 83%Hispanic 73% 72% 73% 71% 72% 72%White 79% 81% 80% 77% 79% 80%Other/Undeclared 72% 64% 70% 73% 71% 66%African American 82% 81% 80% 75% 80% 80%Asian 88% 89% 91% 90% 88% 92%Hispanic 88% 88% 88% 87% 86% 87%White 91% 92% 90% 87% 89% 90%Other/Undeclared 87% 85% 87% 85% 87% 83%African American 1,079 1,168 1,325 1,030 846 906 Asian 618 652 724 671 558 544 Hispanic 1,681 1,606 1,737 1,606 1,440 1,412 White 2,705 2,622 2,681 2,212 1,871 1,755 Other/Undeclared 516 579 794 659 574 661 African American 614 618 737 524 483 462 Asian 486 512 580 549 415 450 Hispanic 1,226 1,161 1,263 1,138 1,040 1,011 White 2,135 2,125 2,158 1,701 1,475 1,402 Other/Undeclared 372 371 556 483 409 435 African American 889 947 1,062 771 676 718 Asian 546 583 659 607 491 500 Hispanic 1,477 1,418 1,528 1,392 1,239 1,230 White 2,453 2,407 2,410 1,929 1,671 1,576 Other/Undeclared 447 492 690 562 498 547
CAREER AND TECHNICAL EDUCATION COURSES BY RACE/ETHNICITY
Success Rate
Retention Rate
Number of Course Enrollments
Number Successful
Number Retained
See Addendum A for definitions.
Source: CCCCD Colleague. Run date 8/12/2013. JD29
Los Medanos College
Level 3 Accreditation Tables ‐ Aggregated by Course Type and Demographic Group
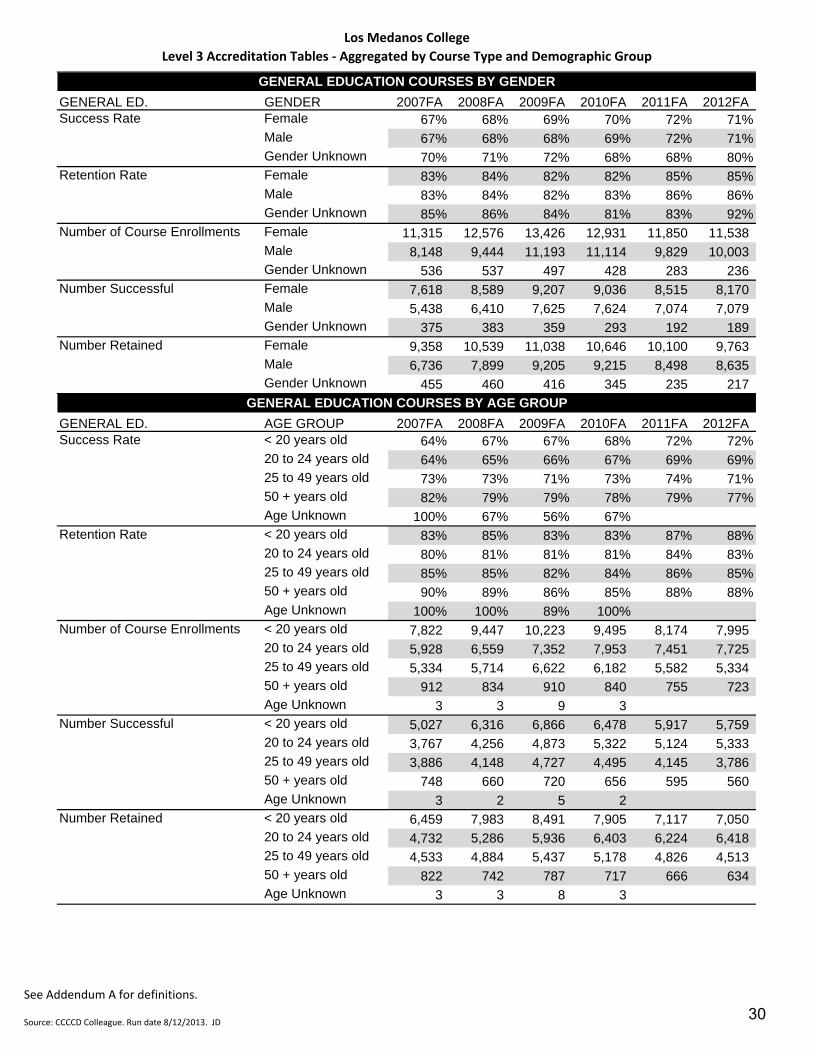
GENERAL ED. GENDER 2007FA 2008FA 2009FA 2010FA 2011FA 2012FAFemale 67% 68% 69% 70% 72% 71%Male 67% 68% 68% 69% 72% 71%Gender Unknown 70% 71% 72% 68% 68% 80%Female 83% 84% 82% 82% 85% 85%Male 83% 84% 82% 83% 86% 86%Gender Unknown 85% 86% 84% 81% 83% 92%Female 11,315 12,576 13,426 12,931 11,850 11,538 Male 8,148 9,444 11,193 11,114 9,829 10,003 Gender Unknown 536 537 497 428 283 236 Female 7,618 8,589 9,207 9,036 8,515 8,170 Male 5,438 6,410 7,625 7,624 7,074 7,079 Gender Unknown 375 383 359 293 192 189 Female 9,358 10,539 11,038 10,646 10,100 9,763 Male 6,736 7,899 9,205 9,215 8,498 8,635 Gender Unknown 455 460 416 345 235 217
GENERAL ED. AGE GROUP 2007FA 2008FA 2009FA 2010FA 2011FA 2012FA< 20 years old 64% 67% 67% 68% 72% 72%20 to 24 years old 64% 65% 66% 67% 69% 69%25 to 49 years old 73% 73% 71% 73% 74% 71%50 + years old 82% 79% 79% 78% 79% 77%Age Unknown 100% 67% 56% 67%< 20 years old 83% 85% 83% 83% 87% 88%20 to 24 years old 80% 81% 81% 81% 84% 83%25 to 49 years old 85% 85% 82% 84% 86% 85%50 + years old 90% 89% 86% 85% 88% 88%Age Unknown 100% 100% 89% 100%< 20 years old 7,822 9,447 10,223 9,495 8,174 7,995 20 to 24 years old 5,928 6,559 7,352 7,953 7,451 7,725 25 to 49 years old 5,334 5,714 6,622 6,182 5,582 5,334 50 + years old 912 834 910 840 755 723 Age Unknown 3 3 9 3 < 20 years old 5,027 6,316 6,866 6,478 5,917 5,759 20 to 24 years old 3,767 4,256 4,873 5,322 5,124 5,333 25 to 49 years old 3,886 4,148 4,727 4,495 4,145 3,786 50 + years old 748 660 720 656 595 560 Age Unknown 3 2 5 2 < 20 years old 6,459 7,983 8,491 7,905 7,117 7,050 20 to 24 years old 4,732 5,286 5,936 6,403 6,224 6,418 25 to 49 years old 4,533 4,884 5,437 5,178 4,826 4,513 50 + years old 822 742 787 717 666 634 Age Unknown 3 3 8 3
Number Retained
GENERAL EDUCATION COURSES BY GENDER
Success Rate
Retention Rate
Number of Course Enrollments
Number Successful
GENERAL EDUCATION COURSES BY AGE GROUP
Success Rate
Retention Rate
Number of Course Enrollments
Number Successful
Number Retained
See Addendum A for definitions.
Source: CCCCD Colleague. Run date 8/12/2013. JD30

Los Medanos College
Level 3 Accreditation Tables ‐ Aggregated by Course Type and Demographic Group
GENERAL ED. RACE/ETHNICITY 2007FA 2008FA 2009FA 2010FA 2011FA 2012FAAfrican American 54% 53% 54% 55% 61% 59%Asian 70% 75% 74% 75% 74% 79%Hispanic 67% 68% 69% 69% 72% 71%White 72% 75% 74% 74% 77% 76%Other/Undeclared 67% 65% 69% 71% 71% 68%African American 78% 77% 75% 76% 83% 82%Asian 83% 87% 84% 85% 87% 89%Hispanic 83% 84% 83% 83% 86% 85%White 85% 86% 85% 85% 87% 87%Other/Undeclared 81% 83% 83% 83% 85% 84%African American 3,187 3,996 4,304 3,937 3,620 3,500 Asian 2,304 2,628 2,659 2,617 2,326 2,337 Hispanic 5,437 6,305 6,806 6,900 6,631 7,082 White 7,358 7,656 8,061 7,689 6,675 6,291 Other/Undeclared 1,713 1,972 3,286 3,330 2,710 2,567 African American 1,718 2,121 2,344 2,160 2,223 2,069 Asian 1,615 1,959 1,963 1,958 1,729 1,851 Hispanic 3,632 4,313 4,665 4,752 4,773 5,002 White 5,316 5,715 5,966 5,720 5,124 4,759 Other/Undeclared 1,150 1,274 2,253 2,363 1,932 1,757 African American 2,488 3,076 3,248 2,979 3,016 2,853 Asian 1,913 2,289 2,242 2,226 2,021 2,089 Hispanic 4,487 5,289 5,626 5,719 5,675 6,048 White 6,265 6,614 6,820 6,504 5,817 5,470 Other/Undeclared 1,396 1,630 2,723 2,778 2,304 2,155
Number Retained
GENERAL EDUCATION COURSES BY RACE/ETHNICITY
Success Rate
Retention Rate
Number of Course Enrollments
Number Successful
See Addendum A for definitions.
Source: CCCCD Colleague. Run date 8/12/2013. JD31
Los Medanos College
Level 3 Accreditation Tables ‐ Aggregated by Course Type and Demographic Group
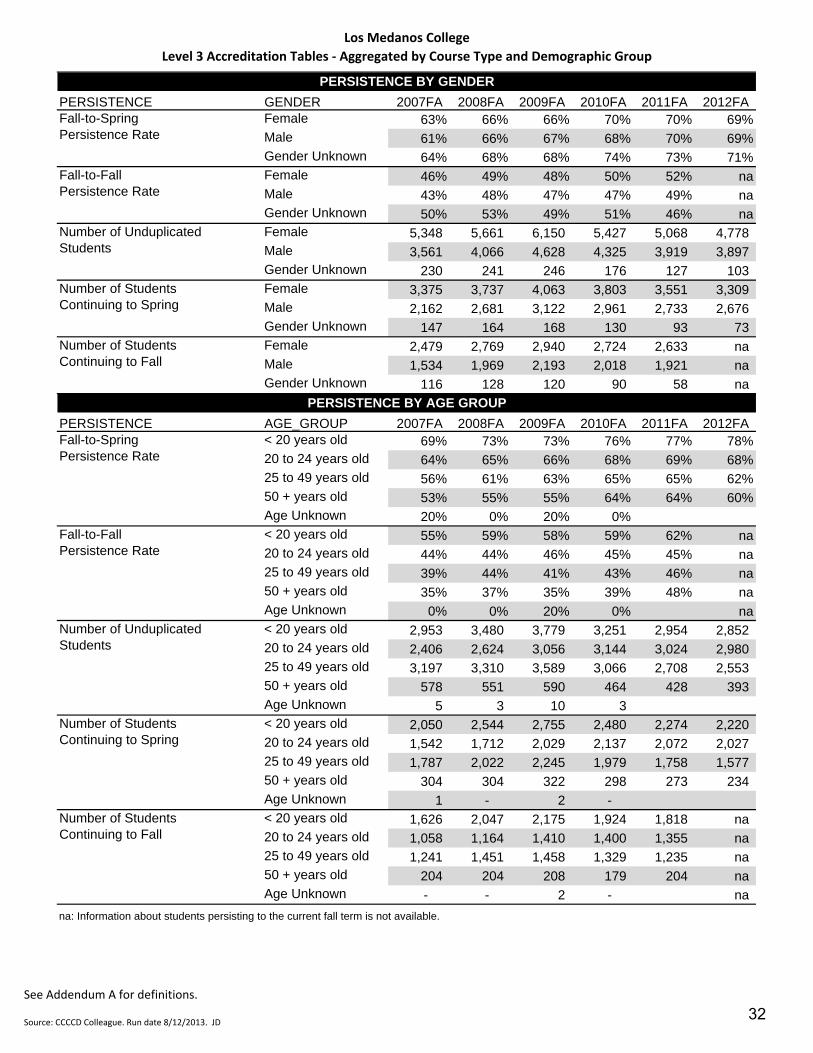
PERSISTENCE GENDER 2007FA 2008FA 2009FA 2010FA 2011FA 2012FAFemale 63% 66% 66% 70% 70% 69%Male 61% 66% 67% 68% 70% 69%Gender Unknown 64% 68% 68% 74% 73% 71%Female 46% 49% 48% 50% 52% naMale 43% 48% 47% 47% 49% naGender Unknown 50% 53% 49% 51% 46% naFemale 5,348 5,661 6,150 5,427 5,068 4,778 Male 3,561 4,066 4,628 4,325 3,919 3,897 Gender Unknown 230 241 246 176 127 103 Female 3,375 3,737 4,063 3,803 3,551 3,309 Male 2,162 2,681 3,122 2,961 2,733 2,676 Gender Unknown 147 164 168 130 93 73 Female 2,479 2,769 2,940 2,724 2,633 naMale 1,534 1,969 2,193 2,018 1,921 naGender Unknown 116 128 120 90 58 na
PERSISTENCE AGE_GROUP 2007FA 2008FA 2009FA 2010FA 2011FA 2012FA< 20 years old 69% 73% 73% 76% 77% 78%20 to 24 years old 64% 65% 66% 68% 69% 68%25 to 49 years old 56% 61% 63% 65% 65% 62%50 + years old 53% 55% 55% 64% 64% 60%Age Unknown 20% 0% 20% 0%< 20 years old 55% 59% 58% 59% 62% na20 to 24 years old 44% 44% 46% 45% 45% na25 to 49 years old 39% 44% 41% 43% 46% na50 + years old 35% 37% 35% 39% 48% naAge Unknown 0% 0% 20% 0% na< 20 years old 2,953 3,480 3,779 3,251 2,954 2,852 20 to 24 years old 2,406 2,624 3,056 3,144 3,024 2,980 25 to 49 years old 3,197 3,310 3,589 3,066 2,708 2,553 50 + years old 578 551 590 464 428 393 Age Unknown 5 3 10 3 < 20 years old 2,050 2,544 2,755 2,480 2,274 2,220 20 to 24 years old 1,542 1,712 2,029 2,137 2,072 2,027 25 to 49 years old 1,787 2,022 2,245 1,979 1,758 1,577 50 + years old 304 304 322 298 273 234 Age Unknown 1 - 2 - < 20 years old 1,626 2,047 2,175 1,924 1,818 na20 to 24 years old 1,058 1,164 1,410 1,400 1,355 na25 to 49 years old 1,241 1,451 1,458 1,329 1,235 na50 + years old 204 204 208 179 204 naAge Unknown - - 2 - na
na: Information about students persisting to the current fall term is not available.
Number of Students Continuing to Fall
PERSISTENCE BY GENDER
Fall-to-Spring Persistence Rate
Fall-to-Fall Persistence Rate
Number of Unduplicated Students
Number of Students Continuing to Spring
Number of Students Continuing to Fall
PERSISTENCE BY AGE GROUP
Fall-to-Spring Persistence Rate
Fall-to-Fall Persistence Rate
Number of Unduplicated Students
Number of Students Continuing to Spring
See Addendum A for definitions.
Source: CCCCD Colleague. Run date 8/12/2013. JD32

Los Medanos College
Level 3 Accreditation Tables ‐ Aggregated by Course Type and Demographic Group
PERSISTENCE RACE/ETHNICITY 2007FA 2008FA 2009FA 2010FA 2011FA 2012FAAfrican American 55% 59% 60% 60% 61% 62%Asian 66% 70% 72% 72% 73% 75%Hispanic 64% 68% 67% 71% 72% 71%White 62% 66% 67% 70% 70% 68%Other/Undeclared 63% 68% 69% 75% 74% 69%African American 41% 44% 41% 40% 42% naAsian 47% 52% 53% 54% 54% naHispanic 48% 51% 49% 51% 56% naWhite 44% 49% 47% 48% 49% naOther/Undeclared 45% 47% 51% 53% 50% naAfrican American 1,361 1,669 1,860 1,673 1,504 1,353 Asian 1,035 1,097 1,166 1,090 999 936 Hispanic 2,554 2,849 3,115 2,930 2,810 2,926 White 3,415 3,503 3,577 3,067 2,747 2,566 Other/Undeclared 774 850 1,306 1,168 1,054 997 African American 751 987 1,123 997 919 835 Asian 683 772 839 783 730 705 Hispanic 1,635 1,942 2,091 2,091 2,031 2,077 White 2,131 2,304 2,405 2,149 1,920 1,756 Other/Undeclared 484 577 895 874 777 685 African American 564 738 768 666 625 naAsian 489 568 615 584 542 naHispanic 1,233 1,448 1,522 1,489 1,560 naWhite 1,495 1,712 1,681 1,471 1,353 naOther/Undeclared 348 400 667 622 532 na
na: Information about students persisting to the current fall term is not available.
PERSISTENCE BY RACE/ETHNICITY
Fall-to-Spring Persistence Rate
Fall-to-Fall Persistence Rate
Number of Unduplicated Students
Number of Students Continuing to Spring
Number of Students Continuing to Fall
See Addendum A for definitions.
Source: CCCCD Colleague. Run date 8/12/2013. JD33
LEVEL4ACCREDITATIONTABLES–AGGREGATEDBYCOURSETYPE,INSTRUCTIONMETHOD,ANDDEMOGRAPHICGROUP
Information in this section:
Success Rate by Gender, Age Group, and Race/Ethnicity and by Traditional and Online
Instruction Methods for All Courses, Basic Skill Courses, CTE Courses and General Education
Courses
Retention Rate by Gender, Age Group, and Race/Ethnicity and by Traditional and Online
Instruction Methods for All Courses, Basic Skill Courses, CTE Courses and General Education
Courses
Number of Enrollments by Gender, Age Group, and Race/Ethnicity and by Traditional and Online
Instruction Methods for All Courses, Basic Skill Courses, CTE Courses and General Education
Courses
Number of Successful Course Completion Enrollments by Gender, Age Group, and
Race/Ethnicity and by Traditional and Online Instruction Methods for All Courses, Basic Skill
Courses, CTE Courses and General Education Courses
Number of Course Completion Enrollments by Gender, Age Group, and Race/Ethnicity and by
Traditional and Online Instruction Methods for All Courses, Basic Skill Courses, CTE Courses and
General Education Courses
Fall‐to‐Spring Persistence Rate by Gender, Age Group, and Race/Ethnicity and Traditional and
Online Instruction Methods
Fall‐to‐Fall Persistence Rate by Gender, Age Group, and Race/Ethnicity and Traditional and
Online Instruction Methods
Number of Unduplicated Students by Fall Term by Gender, Age Group, and Race/Ethnicity and
Traditional and Online Instruction Methods
Number of Unduplicated Students Continuing from Fall to Spring by Gender, Age Group, and
Race/Ethnicity and Traditional and Online Instruction Methods
Number of Unduplicated Students Continuing from Fall to the Following Fall by Gender, Age
Group, and Race/Ethnicity and Traditional and Online Instruction Methods
34
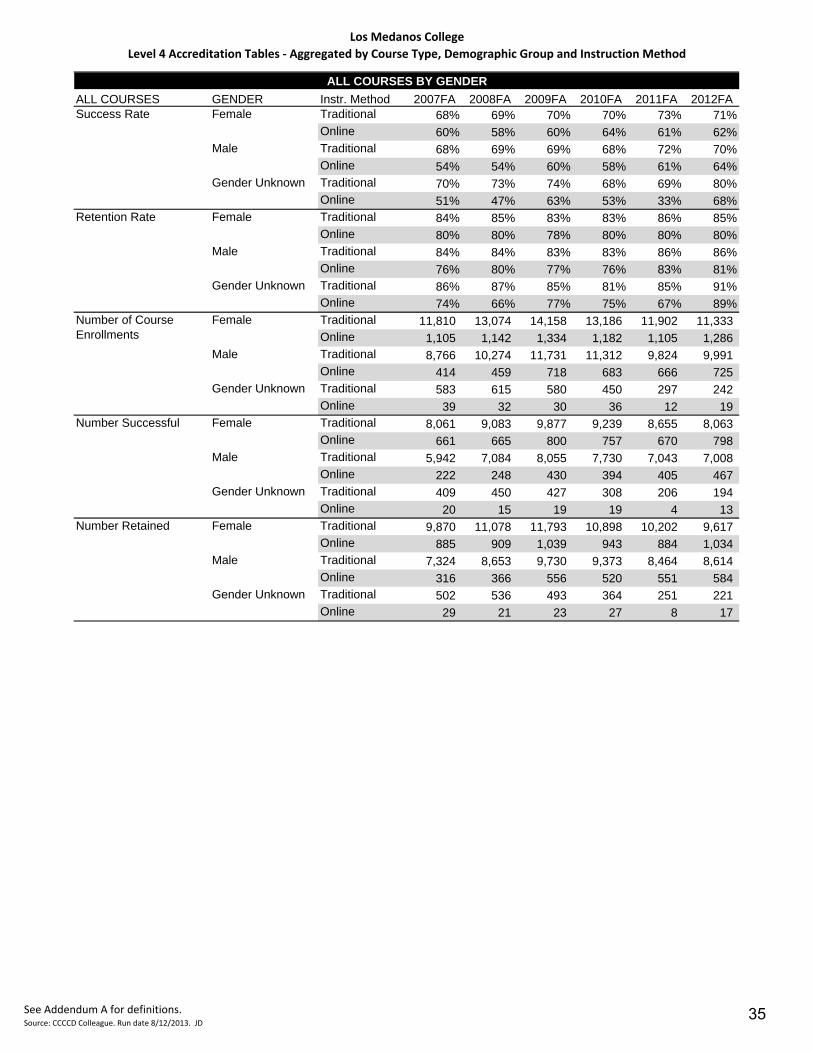
Los Medanos College
Level 4 Accreditation Tables ‐ Aggregated by Course Type, Demographic Group and Instruction Method
ALL COURSES GENDER Instr. Method 2007FA 2008FA 2009FA 2010FA 2011FA 2012FATraditional 68% 69% 70% 70% 73% 71%Online 60% 58% 60% 64% 61% 62%Traditional 68% 69% 69% 68% 72% 70%Online 54% 54% 60% 58% 61% 64%Traditional 70% 73% 74% 68% 69% 80%Online 51% 47% 63% 53% 33% 68%Traditional 84% 85% 83% 83% 86% 85%Online 80% 80% 78% 80% 80% 80%Traditional 84% 84% 83% 83% 86% 86%Online 76% 80% 77% 76% 83% 81%Traditional 86% 87% 85% 81% 85% 91%Online 74% 66% 77% 75% 67% 89%Traditional 11,810 13,074 14,158 13,186 11,902 11,333 Online 1,105 1,142 1,334 1,182 1,105 1,286 Traditional 8,766 10,274 11,731 11,312 9,824 9,991 Online 414 459 718 683 666 725 Traditional 583 615 580 450 297 242 Online 39 32 30 36 12 19 Traditional 8,061 9,083 9,877 9,239 8,655 8,063 Online 661 665 800 757 670 798 Traditional 5,942 7,084 8,055 7,730 7,043 7,008 Online 222 248 430 394 405 467 Traditional 409 450 427 308 206 194 Online 20 15 19 19 4 13 Traditional 9,870 11,078 11,793 10,898 10,202 9,617 Online 885 909 1,039 943 884 1,034 Traditional 7,324 8,653 9,730 9,373 8,464 8,614 Online 316 366 556 520 551 584 Traditional 502 536 493 364 251 221 Online 29 21 23 27 8 17
Number of Course Enrollments
Female
Male
Gender Unknown
Number Successful Female
Male
Gender Unknown
ALL COURSES BY GENDER
Success Rate Female
Male
Gender Unknown
Retention Rate Female
Male
Gender Unknown
Number Retained Female
Male
Gender Unknown
See Addendum A for definitions.Source: CCCCD Colleague. Run date 8/12/2013. JD
35
Los Medanos College
Level 4 Accreditation Tables ‐ Aggregated by Course Type, Demographic Group and Instruction Method
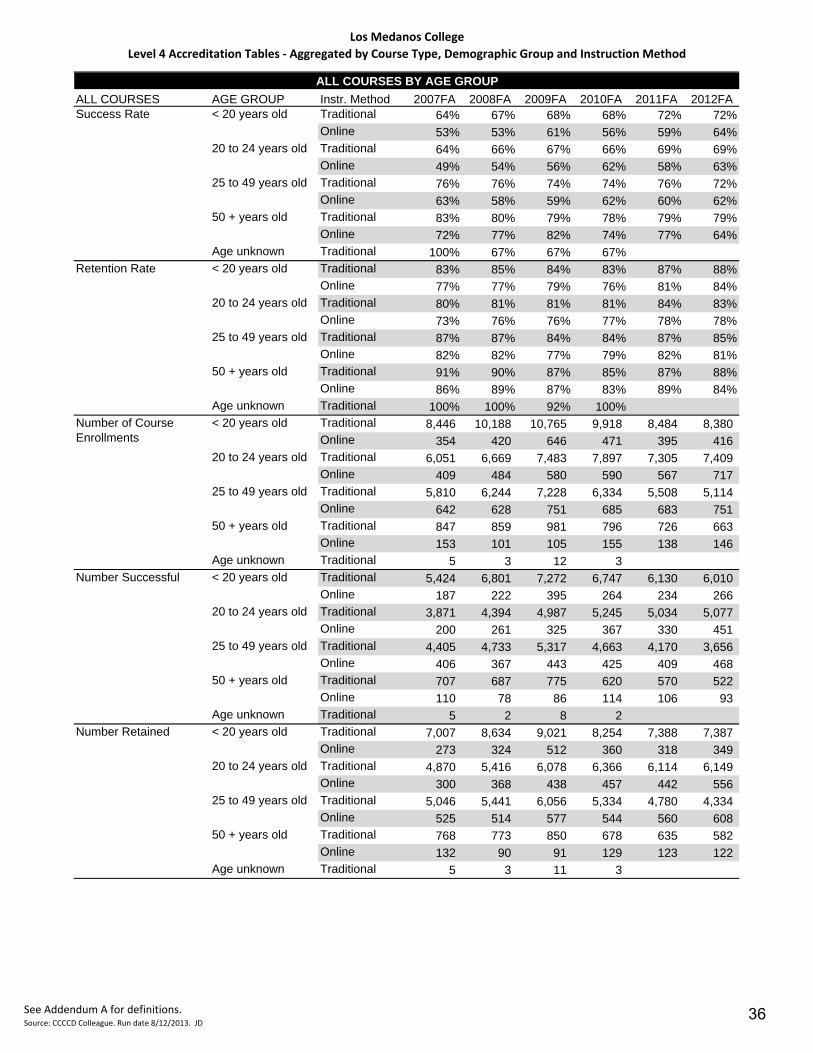
ALL COURSES AGE GROUP Instr. Method 2007FA 2008FA 2009FA 2010FA 2011FA 2012FATraditional 64% 67% 68% 68% 72% 72%Online 53% 53% 61% 56% 59% 64%Traditional 64% 66% 67% 66% 69% 69%Online 49% 54% 56% 62% 58% 63%Traditional 76% 76% 74% 74% 76% 72%Online 63% 58% 59% 62% 60% 62%Traditional 83% 80% 79% 78% 79% 79%Online 72% 77% 82% 74% 77% 64%
Age unknown Traditional 100% 67% 67% 67%Traditional 83% 85% 84% 83% 87% 88%Online 77% 77% 79% 76% 81% 84%Traditional 80% 81% 81% 81% 84% 83%Online 73% 76% 76% 77% 78% 78%Traditional 87% 87% 84% 84% 87% 85%Online 82% 82% 77% 79% 82% 81%Traditional 91% 90% 87% 85% 87% 88%Online 86% 89% 87% 83% 89% 84%
Age unknown Traditional 100% 100% 92% 100%Traditional 8,446 10,188 10,765 9,918 8,484 8,380 Online 354 420 646 471 395 416 Traditional 6,051 6,669 7,483 7,897 7,305 7,409 Online 409 484 580 590 567 717 Traditional 5,810 6,244 7,228 6,334 5,508 5,114 Online 642 628 751 685 683 751 Traditional 847 859 981 796 726 663 Online 153 101 105 155 138 146
Age unknown Traditional 5 3 12 3 Traditional 5,424 6,801 7,272 6,747 6,130 6,010 Online 187 222 395 264 234 266 Traditional 3,871 4,394 4,987 5,245 5,034 5,077 Online 200 261 325 367 330 451 Traditional 4,405 4,733 5,317 4,663 4,170 3,656 Online 406 367 443 425 409 468 Traditional 707 687 775 620 570 522 Online 110 78 86 114 106 93
Age unknown Traditional 5 2 8 2 Traditional 7,007 8,634 9,021 8,254 7,388 7,387 Online 273 324 512 360 318 349 Traditional 4,870 5,416 6,078 6,366 6,114 6,149 Online 300 368 438 457 442 556 Traditional 5,046 5,441 6,056 5,334 4,780 4,334 Online 525 514 577 544 560 608 Traditional 768 773 850 678 635 582 Online 132 90 91 129 123 122
Age unknown Traditional 5 3 11 3
ALL COURSES BY AGE GROUP
Success Rate < 20 years old
20 to 24 years old
25 to 49 years old
50 + years old
Retention Rate < 20 years old
20 to 24 years old
25 to 49 years old
50 + years old
Number of Course Enrollments
< 20 years old
20 to 24 years old
25 to 49 years old
50 + years old
Number Successful < 20 years old
20 to 24 years old
25 to 49 years old
50 + years old
Number Retained < 20 years old
20 to 24 years old
25 to 49 years old
50 + years old
See Addendum A for definitions.Source: CCCCD Colleague. Run date 8/12/2013. JD
36
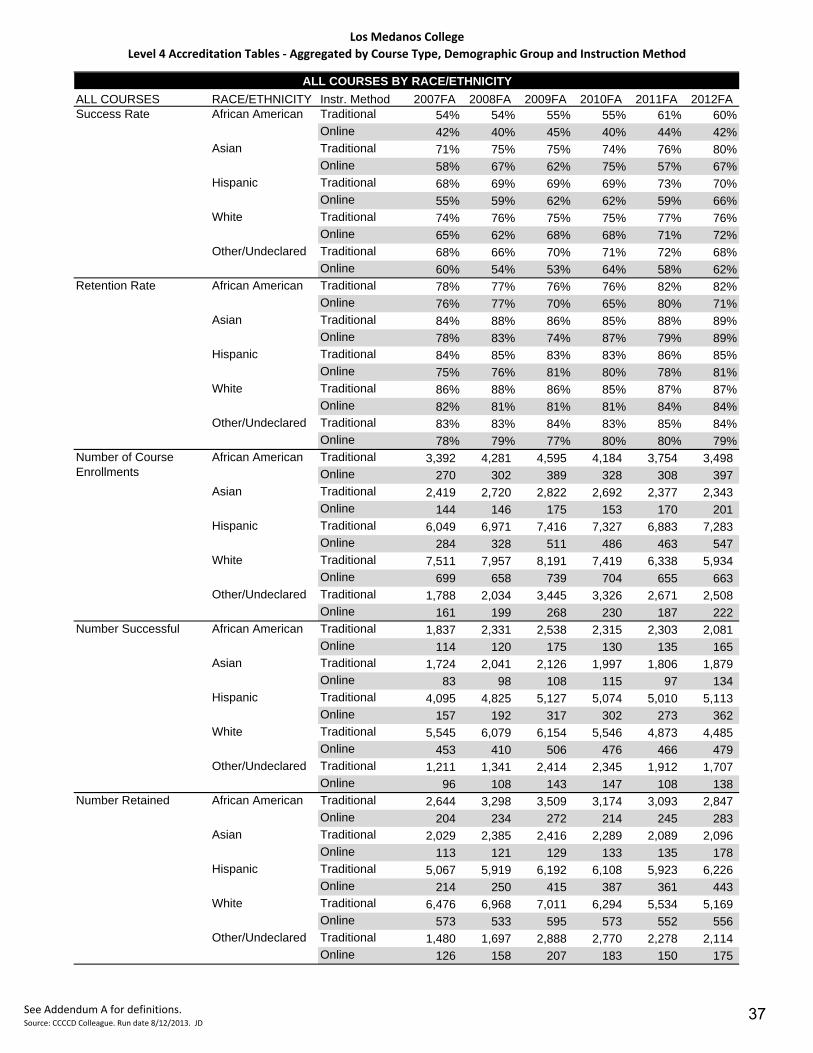
Los Medanos College
Level 4 Accreditation Tables ‐ Aggregated by Course Type, Demographic Group and Instruction Method
ALL COURSES RACE/ETHNICITY Instr. Method 2007FA 2008FA 2009FA 2010FA 2011FA 2012FATraditional 54% 54% 55% 55% 61% 60%Online 42% 40% 45% 40% 44% 42%Traditional 71% 75% 75% 74% 76% 80%Online 58% 67% 62% 75% 57% 67%Traditional 68% 69% 69% 69% 73% 70%Online 55% 59% 62% 62% 59% 66%Traditional 74% 76% 75% 75% 77% 76%Online 65% 62% 68% 68% 71% 72%Traditional 68% 66% 70% 71% 72% 68%Online 60% 54% 53% 64% 58% 62%Traditional 78% 77% 76% 76% 82% 82%Online 76% 77% 70% 65% 80% 71%Traditional 84% 88% 86% 85% 88% 89%Online 78% 83% 74% 87% 79% 89%Traditional 84% 85% 83% 83% 86% 85%Online 75% 76% 81% 80% 78% 81%Traditional 86% 88% 86% 85% 87% 87%Online 82% 81% 81% 81% 84% 84%Traditional 83% 83% 84% 83% 85% 84%Online 78% 79% 77% 80% 80% 79%Traditional 3,392 4,281 4,595 4,184 3,754 3,498 Online 270 302 389 328 308 397 Traditional 2,419 2,720 2,822 2,692 2,377 2,343 Online 144 146 175 153 170 201 Traditional 6,049 6,971 7,416 7,327 6,883 7,283 Online 284 328 511 486 463 547 Traditional 7,511 7,957 8,191 7,419 6,338 5,934 Online 699 658 739 704 655 663 Traditional 1,788 2,034 3,445 3,326 2,671 2,508 Online 161 199 268 230 187 222 Traditional 1,837 2,331 2,538 2,315 2,303 2,081 Online 114 120 175 130 135 165 Traditional 1,724 2,041 2,126 1,997 1,806 1,879 Online 83 98 108 115 97 134 Traditional 4,095 4,825 5,127 5,074 5,010 5,113 Online 157 192 317 302 273 362 Traditional 5,545 6,079 6,154 5,546 4,873 4,485 Online 453 410 506 476 466 479 Traditional 1,211 1,341 2,414 2,345 1,912 1,707 Online 96 108 143 147 108 138 Traditional 2,644 3,298 3,509 3,174 3,093 2,847 Online 204 234 272 214 245 283 Traditional 2,029 2,385 2,416 2,289 2,089 2,096 Online 113 121 129 133 135 178 Traditional 5,067 5,919 6,192 6,108 5,923 6,226 Online 214 250 415 387 361 443 Traditional 6,476 6,968 7,011 6,294 5,534 5,169 Online 573 533 595 573 552 556 Traditional 1,480 1,697 2,888 2,770 2,278 2,114 Online 126 158 207 183 150 175
ALL COURSES BY RACE/ETHNICITY
Success Rate African American
Asian
Hispanic
White
Other/Undeclared
Number of Course Enrollments
African American
Asian
Hispanic
White
Other/Undeclared
Retention Rate African American
Asian
Hispanic
White
Other/Undeclared
Number Retained African American
Asian
Hispanic
White
Other/Undeclared
Number Successful African American
Asian
Hispanic
White
Other/Undeclared
See Addendum A for definitions.Source: CCCCD Colleague. Run date 8/12/2013. JD
37
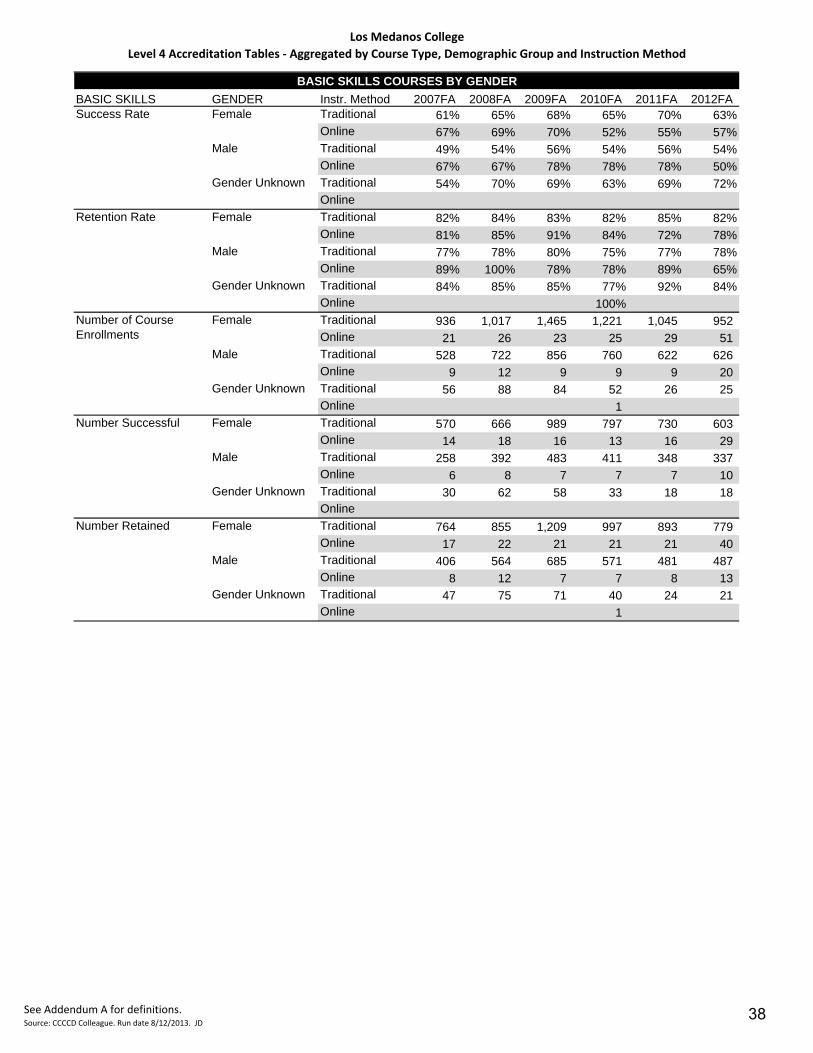
Los Medanos College
Level 4 Accreditation Tables ‐ Aggregated by Course Type, Demographic Group and Instruction Method
BASIC SKILLS GENDER Instr. Method 2007FA 2008FA 2009FA 2010FA 2011FA 2012FATraditional 61% 65% 68% 65% 70% 63%Online 67% 69% 70% 52% 55% 57%Traditional 49% 54% 56% 54% 56% 54%Online 67% 67% 78% 78% 78% 50%Traditional 54% 70% 69% 63% 69% 72%Online
Traditional 82% 84% 83% 82% 85% 82%Online 81% 85% 91% 84% 72% 78%Traditional 77% 78% 80% 75% 77% 78%Online 89% 100% 78% 78% 89% 65%Traditional 84% 85% 85% 77% 92% 84%Online 100%Traditional 936 1,017 1,465 1,221 1,045 952 Online 21 26 23 25 29 51 Traditional 528 722 856 760 622 626 Online 9 12 9 9 9 20 Traditional 56 88 84 52 26 25 Online 1 Traditional 570 666 989 797 730 603 Online 14 18 16 13 16 29 Traditional 258 392 483 411 348 337 Online 6 8 7 7 7 10 Traditional 30 62 58 33 18 18 Online
Traditional 764 855 1,209 997 893 779 Online 17 22 21 21 21 40 Traditional 406 564 685 571 481 487 Online 8 12 7 7 8 13 Traditional 47 75 71 40 24 21 Online 1
Number of Course Enrollments
Female
Male
Gender Unknown
Number Successful Female
Male
Gender Unknown
BASIC SKILLS COURSES BY GENDER
Success Rate Female
Male
Gender Unknown
Retention Rate Female
Male
Gender Unknown
Number Retained Female
Male
Gender Unknown
See Addendum A for definitions.Source: CCCCD Colleague. Run date 8/12/2013. JD
38
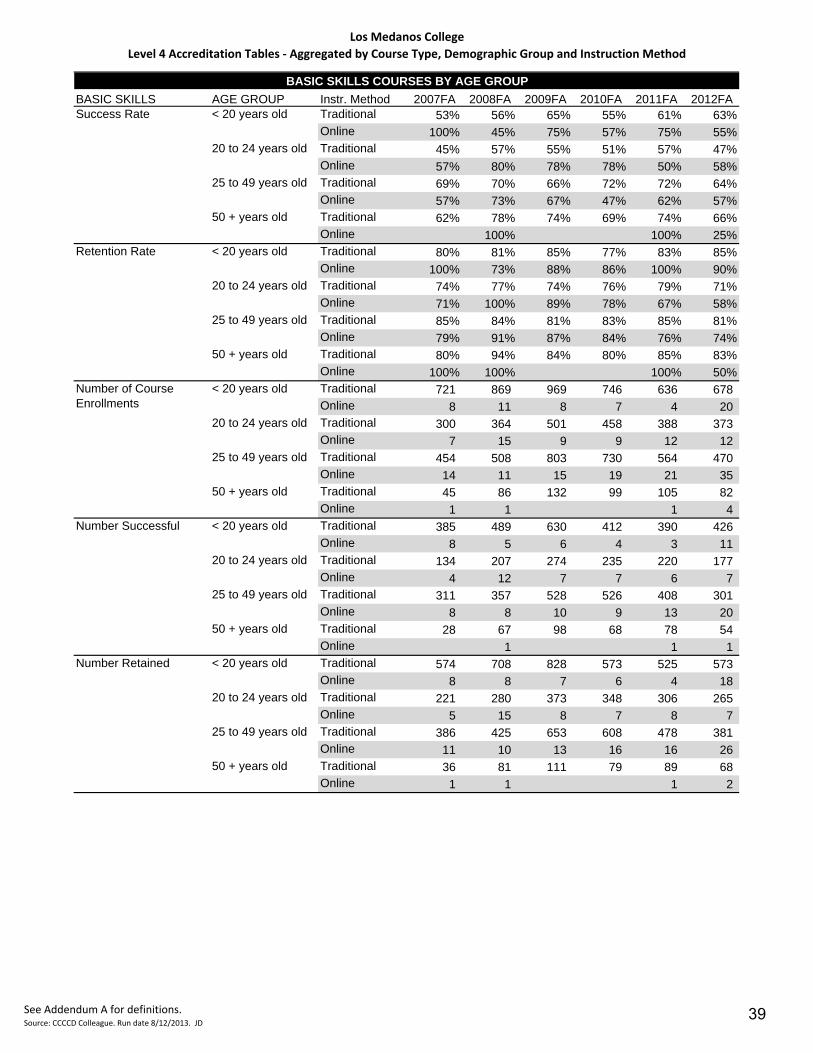
Los Medanos College
Level 4 Accreditation Tables ‐ Aggregated by Course Type, Demographic Group and Instruction Method
BASIC SKILLS AGE GROUP Instr. Method 2007FA 2008FA 2009FA 2010FA 2011FA 2012FATraditional 53% 56% 65% 55% 61% 63%Online 100% 45% 75% 57% 75% 55%Traditional 45% 57% 55% 51% 57% 47%Online 57% 80% 78% 78% 50% 58%Traditional 69% 70% 66% 72% 72% 64%Online 57% 73% 67% 47% 62% 57%Traditional 62% 78% 74% 69% 74% 66%Online 100% 100% 25%Traditional 80% 81% 85% 77% 83% 85%Online 100% 73% 88% 86% 100% 90%Traditional 74% 77% 74% 76% 79% 71%Online 71% 100% 89% 78% 67% 58%Traditional 85% 84% 81% 83% 85% 81%Online 79% 91% 87% 84% 76% 74%Traditional 80% 94% 84% 80% 85% 83%Online 100% 100% 100% 50%Traditional 721 869 969 746 636 678 Online 8 11 8 7 4 20 Traditional 300 364 501 458 388 373 Online 7 15 9 9 12 12 Traditional 454 508 803 730 564 470 Online 14 11 15 19 21 35 Traditional 45 86 132 99 105 82 Online 1 1 1 4 Traditional 385 489 630 412 390 426 Online 8 5 6 4 3 11 Traditional 134 207 274 235 220 177 Online 4 12 7 7 6 7 Traditional 311 357 528 526 408 301 Online 8 8 10 9 13 20 Traditional 28 67 98 68 78 54 Online 1 1 1 Traditional 574 708 828 573 525 573 Online 8 8 7 6 4 18 Traditional 221 280 373 348 306 265 Online 5 15 8 7 8 7 Traditional 386 425 653 608 478 381 Online 11 10 13 16 16 26 Traditional 36 81 111 79 89 68 Online 1 1 1 2
BASIC SKILLS COURSES BY AGE GROUP
Success Rate < 20 years old
20 to 24 years old
25 to 49 years old
50 + years old
Retention Rate < 20 years old
20 to 24 years old
25 to 49 years old
50 + years old
Number of Course Enrollments
< 20 years old
20 to 24 years old
25 to 49 years old
50 + years old
Number Successful < 20 years old
20 to 24 years old
25 to 49 years old
50 + years old
Number Retained < 20 years old
20 to 24 years old
25 to 49 years old
50 + years old
See Addendum A for definitions.Source: CCCCD Colleague. Run date 8/12/2013. JD
39
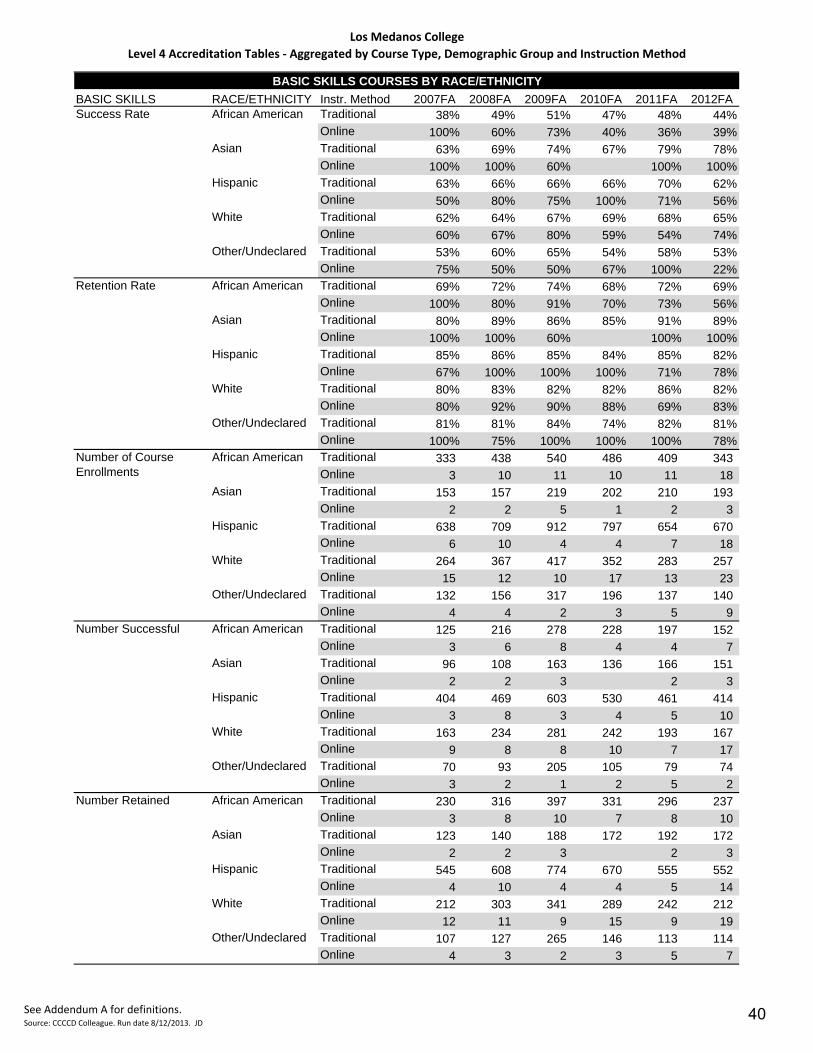
Los Medanos College
Level 4 Accreditation Tables ‐ Aggregated by Course Type, Demographic Group and Instruction Method
BASIC SKILLS RACE/ETHNICITY Instr. Method 2007FA 2008FA 2009FA 2010FA 2011FA 2012FATraditional 38% 49% 51% 47% 48% 44%Online 100% 60% 73% 40% 36% 39%Traditional 63% 69% 74% 67% 79% 78%Online 100% 100% 60% 100% 100%Traditional 63% 66% 66% 66% 70% 62%Online 50% 80% 75% 100% 71% 56%Traditional 62% 64% 67% 69% 68% 65%Online 60% 67% 80% 59% 54% 74%Traditional 53% 60% 65% 54% 58% 53%Online 75% 50% 50% 67% 100% 22%Traditional 69% 72% 74% 68% 72% 69%Online 100% 80% 91% 70% 73% 56%Traditional 80% 89% 86% 85% 91% 89%Online 100% 100% 60% 100% 100%Traditional 85% 86% 85% 84% 85% 82%Online 67% 100% 100% 100% 71% 78%Traditional 80% 83% 82% 82% 86% 82%Online 80% 92% 90% 88% 69% 83%Traditional 81% 81% 84% 74% 82% 81%Online 100% 75% 100% 100% 100% 78%Traditional 333 438 540 486 409 343 Online 3 10 11 10 11 18 Traditional 153 157 219 202 210 193 Online 2 2 5 1 2 3 Traditional 638 709 912 797 654 670 Online 6 10 4 4 7 18 Traditional 264 367 417 352 283 257 Online 15 12 10 17 13 23 Traditional 132 156 317 196 137 140 Online 4 4 2 3 5 9 Traditional 125 216 278 228 197 152 Online 3 6 8 4 4 7 Traditional 96 108 163 136 166 151 Online 2 2 3 2 3 Traditional 404 469 603 530 461 414 Online 3 8 3 4 5 10 Traditional 163 234 281 242 193 167 Online 9 8 8 10 7 17 Traditional 70 93 205 105 79 74 Online 3 2 1 2 5 2 Traditional 230 316 397 331 296 237 Online 3 8 10 7 8 10 Traditional 123 140 188 172 192 172 Online 2 2 3 2 3 Traditional 545 608 774 670 555 552 Online 4 10 4 4 5 14 Traditional 212 303 341 289 242 212 Online 12 11 9 15 9 19 Traditional 107 127 265 146 113 114 Online 4 3 2 3 5 7
BASIC SKILLS COURSES BY RACE/ETHNICITY
Success Rate African American
Asian
Hispanic
White
Other/Undeclared
Number of Course Enrollments
African American
Asian
Hispanic
White
Other/Undeclared
Retention Rate African American
Asian
Hispanic
White
Other/Undeclared
Number Retained African American
Asian
Hispanic
White
Other/Undeclared
Number Successful African American
Asian
Hispanic
White
Other/Undeclared
See Addendum A for definitions.Source: CCCCD Colleague. Run date 8/12/2013. JD
40

Los Medanos College
Level 4 Accreditation Tables ‐ Aggregated by Course Type, Demographic Group and Instruction Method
CTE GENDER Instr. Method 2007FA 2008FA 2009FA 2010FA 2011FA 2012FATraditional 74% 72% 72% 72% 74% 72%Online 61% 55% 58% 60% 60% 60%Traditional 76% 77% 76% 73% 74% 73%Online 47% 51% 53% 58% 58% 67%Traditional 78% 80% 83% 75% 77% 90%Online 35% 50% 44% 73% 88%Traditional 88% 89% 87% 85% 86% 87%Online 85% 81% 78% 81% 82% 81%Traditional 89% 88% 89% 86% 87% 88%Online 74% 84% 77% 76% 83% 85%Traditional 93% 94% 91% 86% 89% 98%Online 65% 75% 56% 82% 100%Traditional 2,933 2,920 3,027 2,400 2,035 1,865 Online 473 480 444 427 384 509 Traditional 2,840 2,902 3,442 3,042 2,597 2,566 Online 182 176 200 210 220 280 Traditional 148 141 139 88 53 50 Online 23 8 9 11 8 Traditional 2,164 2,088 2,193 1,736 1,515 1,349 Online 289 266 259 257 229 307 Traditional 2,172 2,226 2,617 2,206 1,909 1,865 Online 85 90 106 122 128 187 Traditional 115 113 115 66 41 45 Online 8 4 4 8 7 Traditional 2,595 2,603 2,645 2,051 1,759 1,624 Online 404 391 348 345 315 411 Traditional 2,526 2,567 3,071 2,620 2,272 2,241 Online 134 148 153 160 182 238 Traditional 138 132 127 76 47 49 Online 15 6 5 9 8
Number of Course Enrollments
Female
Male
Gender Unknown
Number Successful Female
Male
Gender Unknown
CAREER AND TECHNICAL EDUCATION COURSES BY GENDER
Success Rate Female
Male
Gender Unknown
Retention Rate Female
Male
Gender Unknown
Number Retained Female
Male
Gender Unknown
See Addendum A for definitions.Source: CCCCD Colleague. Run date 8/12/2013. JD
41

Los Medanos College
Level 4 Accreditation Tables ‐ Aggregated by Course Type, Demographic Group and Instruction Method
CTE AGE GROUP Instr. Method 2007FA 2008FA 2009FA 2010FA 2011FA 2012FATraditional 62% 63% 62% 62% 68% 65%Online 37% 46% 49% 34% 53% 69%Traditional 70% 70% 70% 70% 69% 72%Online 38% 48% 48% 61% 45% 63%Traditional 82% 81% 81% 78% 80% 76%Online 65% 55% 58% 60% 59% 61%Traditional 86% 83% 83% 83% 83% 88%Online 73% 77% 87% 81% 84% 65%
Age unknown Traditional 100% 50% 75%Traditional 85% 85% 86% 83% 87% 85%Online 75% 81% 76% 67% 78% 90%Traditional 85% 86% 86% 84% 84% 86%Online 70% 77% 75% 76% 76% 78%Traditional 92% 92% 91% 88% 89% 89%Online 86% 83% 76% 82% 83% 83%Traditional 93% 94% 90% 89% 88% 95%Online 88% 91% 92% 89% 94% 82%
Age unknown Traditional 100% 100% 88%Traditional 1,248 1,363 1,304 1,196 1,121 1,016 Online 108 96 105 102 80 106 Traditional 1,489 1,533 1,819 1,640 1,411 1,457 Online 132 172 160 153 132 222 Traditional 2,776 2,687 3,008 2,323 1,873 1,772 Online 325 326 327 293 302 374 Traditional 404 378 469 371 280 236 Online 113 70 61 100 90 95
Age unknown Traditional 4 2 8 Traditional 773 861 811 741 758 662 Online 40 44 51 35 42 73 Traditional 1,037 1,077 1,273 1,143 971 1,043 Online 50 82 76 94 60 139 Traditional 2,290 2,173 2,448 1,816 1,505 1,347 Online 210 180 189 177 179 227 Traditional 347 315 387 308 231 207 Online 82 54 53 81 76 62
Age unknown Traditional 4 1 6 Traditional 1,055 1,152 1,116 988 971 868 Online 81 78 80 68 62 95 Traditional 1,270 1,319 1,573 1,379 1,190 1,248 Online 92 132 120 117 100 173 Traditional 2,554 2,474 2,723 2,050 1,671 1,573 Online 281 271 250 240 250 311 Traditional 376 355 424 330 246 225 Online 99 64 56 89 85 78
Age unknown Traditional 4 2 7
CAREER AND TECHNICAL EDUCATION COURSES BY AGE GROUP
Success Rate < 20 years old
20 to 24 years old
25 to 49 years old
50 + years old
Retention Rate < 20 years old
20 to 24 years old
25 to 49 years old
50 + years old
Number of Course Enrollments
< 20 years old
20 to 24 years old
25 to 49 years old
50 + years old
Number Successful < 20 years old
20 to 24 years old
25 to 49 years old
50 + years old
Number Retained < 20 years old
20 to 24 years old
25 to 49 years old
50 + years old
See Addendum A for definitions.Source: CCCCD Colleague. Run date 8/12/2013. JD
42
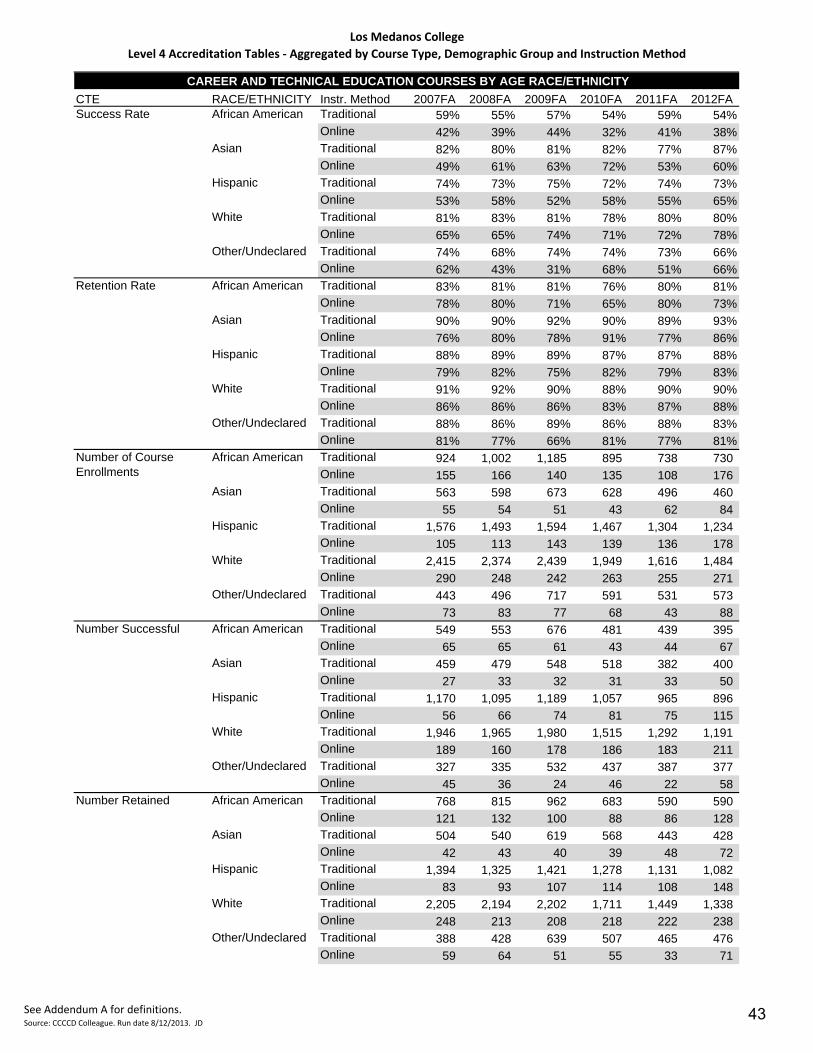
Los Medanos College
Level 4 Accreditation Tables ‐ Aggregated by Course Type, Demographic Group and Instruction Method
CTE RACE/ETHNICITY Instr. Method 2007FA 2008FA 2009FA 2010FA 2011FA 2012FATraditional 59% 55% 57% 54% 59% 54%Online 42% 39% 44% 32% 41% 38%Traditional 82% 80% 81% 82% 77% 87%Online 49% 61% 63% 72% 53% 60%Traditional 74% 73% 75% 72% 74% 73%Online 53% 58% 52% 58% 55% 65%Traditional 81% 83% 81% 78% 80% 80%Online 65% 65% 74% 71% 72% 78%Traditional 74% 68% 74% 74% 73% 66%Online 62% 43% 31% 68% 51% 66%Traditional 83% 81% 81% 76% 80% 81%Online 78% 80% 71% 65% 80% 73%Traditional 90% 90% 92% 90% 89% 93%Online 76% 80% 78% 91% 77% 86%Traditional 88% 89% 89% 87% 87% 88%Online 79% 82% 75% 82% 79% 83%Traditional 91% 92% 90% 88% 90% 90%Online 86% 86% 86% 83% 87% 88%Traditional 88% 86% 89% 86% 88% 83%Online 81% 77% 66% 81% 77% 81%Traditional 924 1,002 1,185 895 738 730 Online 155 166 140 135 108 176 Traditional 563 598 673 628 496 460 Online 55 54 51 43 62 84 Traditional 1,576 1,493 1,594 1,467 1,304 1,234 Online 105 113 143 139 136 178 Traditional 2,415 2,374 2,439 1,949 1,616 1,484 Online 290 248 242 263 255 271 Traditional 443 496 717 591 531 573 Online 73 83 77 68 43 88 Traditional 549 553 676 481 439 395 Online 65 65 61 43 44 67 Traditional 459 479 548 518 382 400 Online 27 33 32 31 33 50 Traditional 1,170 1,095 1,189 1,057 965 896 Online 56 66 74 81 75 115 Traditional 1,946 1,965 1,980 1,515 1,292 1,191 Online 189 160 178 186 183 211 Traditional 327 335 532 437 387 377 Online 45 36 24 46 22 58 Traditional 768 815 962 683 590 590 Online 121 132 100 88 86 128 Traditional 504 540 619 568 443 428 Online 42 43 40 39 48 72 Traditional 1,394 1,325 1,421 1,278 1,131 1,082 Online 83 93 107 114 108 148 Traditional 2,205 2,194 2,202 1,711 1,449 1,338 Online 248 213 208 218 222 238 Traditional 388 428 639 507 465 476 Online 59 64 51 55 33 71
CAREER AND TECHNICAL EDUCATION COURSES BY AGE RACE/ETHNICITY
Success Rate African American
Asian
Hispanic
White
Other/Undeclared
Number of Course Enrollments
African American
Asian
Hispanic
White
Other/Undeclared
Retention Rate African American
Asian
Hispanic
White
Other/Undeclared
Number Retained African American
Asian
Hispanic
White
Other/Undeclared
Number Successful African American
Asian
Hispanic
White
Other/Undeclared
See Addendum A for definitions.Source: CCCCD Colleague. Run date 8/12/2013. JD
43
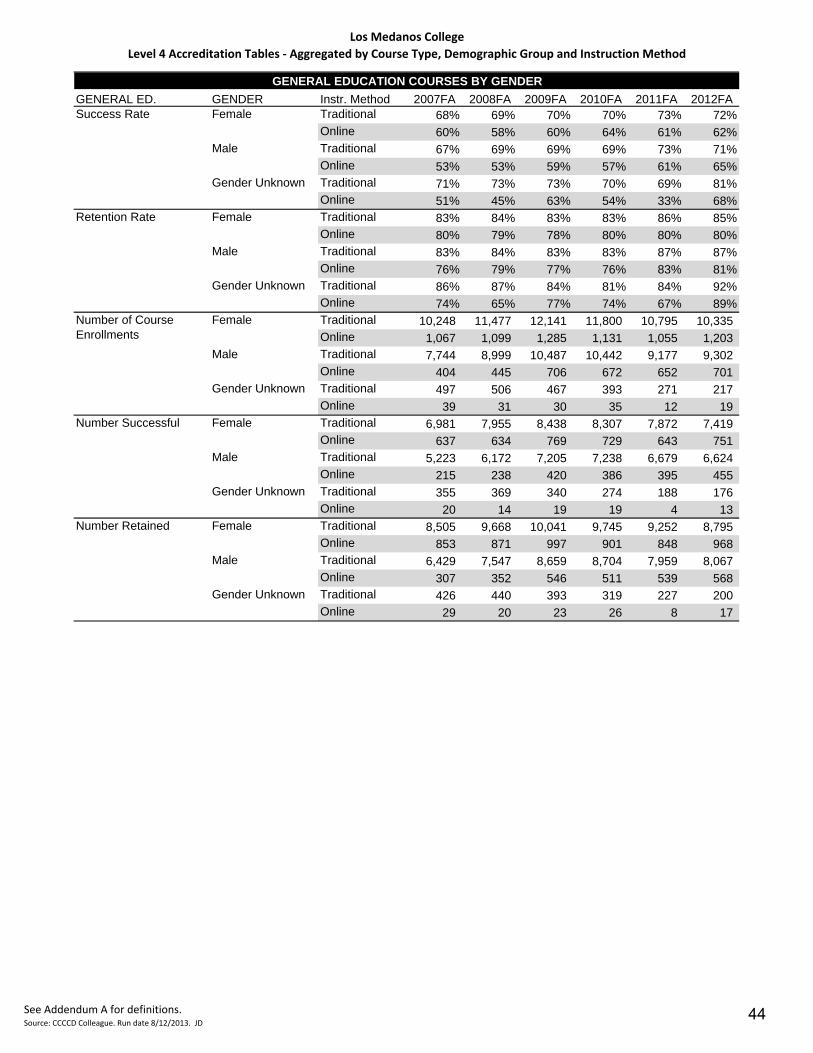
Los Medanos College
Level 4 Accreditation Tables ‐ Aggregated by Course Type, Demographic Group and Instruction Method
GENERAL ED. GENDER Instr. Method 2007FA 2008FA 2009FA 2010FA 2011FA 2012FATraditional 68% 69% 70% 70% 73% 72%Online 60% 58% 60% 64% 61% 62%Traditional 67% 69% 69% 69% 73% 71%Online 53% 53% 59% 57% 61% 65%Traditional 71% 73% 73% 70% 69% 81%Online 51% 45% 63% 54% 33% 68%Traditional 83% 84% 83% 83% 86% 85%Online 80% 79% 78% 80% 80% 80%Traditional 83% 84% 83% 83% 87% 87%Online 76% 79% 77% 76% 83% 81%Traditional 86% 87% 84% 81% 84% 92%Online 74% 65% 77% 74% 67% 89%Traditional 10,248 11,477 12,141 11,800 10,795 10,335 Online 1,067 1,099 1,285 1,131 1,055 1,203 Traditional 7,744 8,999 10,487 10,442 9,177 9,302 Online 404 445 706 672 652 701 Traditional 497 506 467 393 271 217 Online 39 31 30 35 12 19 Traditional 6,981 7,955 8,438 8,307 7,872 7,419 Online 637 634 769 729 643 751 Traditional 5,223 6,172 7,205 7,238 6,679 6,624 Online 215 238 420 386 395 455 Traditional 355 369 340 274 188 176 Online 20 14 19 19 4 13 Traditional 8,505 9,668 10,041 9,745 9,252 8,795 Online 853 871 997 901 848 968 Traditional 6,429 7,547 8,659 8,704 7,959 8,067 Online 307 352 546 511 539 568 Traditional 426 440 393 319 227 200 Online 29 20 23 26 8 17
Number of Course Enrollments
Female
Male
Gender Unknown
Number Successful Female
Male
Gender Unknown
GENERAL EDUCATION COURSES BY GENDER
Success Rate Female
Male
Gender Unknown
Retention Rate Female
Male
Gender Unknown
Number Retained Female
Male
Gender Unknown
See Addendum A for definitions.Source: CCCCD Colleague. Run date 8/12/2013. JD
44
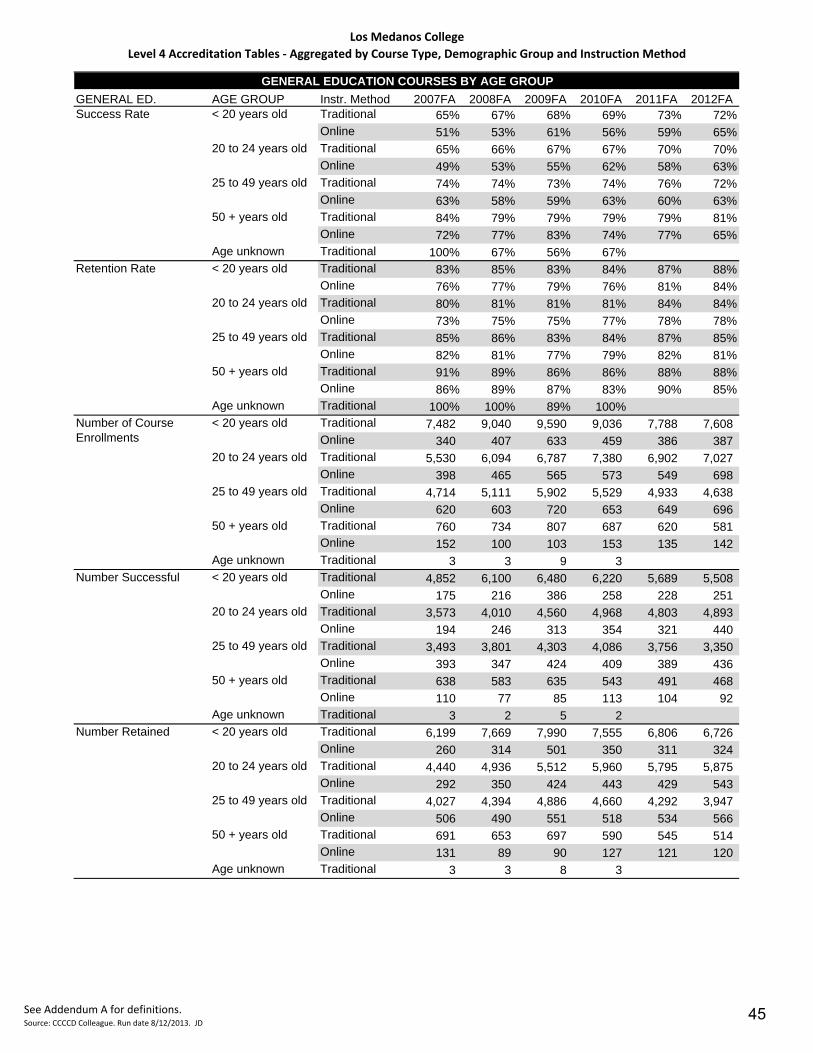
Los Medanos College
Level 4 Accreditation Tables ‐ Aggregated by Course Type, Demographic Group and Instruction Method
GENERAL ED. AGE GROUP Instr. Method 2007FA 2008FA 2009FA 2010FA 2011FA 2012FATraditional 65% 67% 68% 69% 73% 72%Online 51% 53% 61% 56% 59% 65%Traditional 65% 66% 67% 67% 70% 70%Online 49% 53% 55% 62% 58% 63%Traditional 74% 74% 73% 74% 76% 72%Online 63% 58% 59% 63% 60% 63%Traditional 84% 79% 79% 79% 79% 81%Online 72% 77% 83% 74% 77% 65%
Age unknown Traditional 100% 67% 56% 67%Traditional 83% 85% 83% 84% 87% 88%Online 76% 77% 79% 76% 81% 84%Traditional 80% 81% 81% 81% 84% 84%Online 73% 75% 75% 77% 78% 78%Traditional 85% 86% 83% 84% 87% 85%Online 82% 81% 77% 79% 82% 81%Traditional 91% 89% 86% 86% 88% 88%Online 86% 89% 87% 83% 90% 85%
Age unknown Traditional 100% 100% 89% 100%Traditional 7,482 9,040 9,590 9,036 7,788 7,608 Online 340 407 633 459 386 387 Traditional 5,530 6,094 6,787 7,380 6,902 7,027 Online 398 465 565 573 549 698 Traditional 4,714 5,111 5,902 5,529 4,933 4,638 Online 620 603 720 653 649 696 Traditional 760 734 807 687 620 581 Online 152 100 103 153 135 142
Age unknown Traditional 3 3 9 3 Traditional 4,852 6,100 6,480 6,220 5,689 5,508 Online 175 216 386 258 228 251 Traditional 3,573 4,010 4,560 4,968 4,803 4,893 Online 194 246 313 354 321 440 Traditional 3,493 3,801 4,303 4,086 3,756 3,350 Online 393 347 424 409 389 436 Traditional 638 583 635 543 491 468 Online 110 77 85 113 104 92
Age unknown Traditional 3 2 5 2 Traditional 6,199 7,669 7,990 7,555 6,806 6,726 Online 260 314 501 350 311 324 Traditional 4,440 4,936 5,512 5,960 5,795 5,875 Online 292 350 424 443 429 543 Traditional 4,027 4,394 4,886 4,660 4,292 3,947 Online 506 490 551 518 534 566 Traditional 691 653 697 590 545 514 Online 131 89 90 127 121 120
Age unknown Traditional 3 3 8 3
GENERAL EDUCATION COURSES BY AGE GROUP
Success Rate < 20 years old
20 to 24 years old
25 to 49 years old
50 + years old
Retention Rate < 20 years old
20 to 24 years old
25 to 49 years old
50 + years old
Number of Course Enrollments
< 20 years old
20 to 24 years old
25 to 49 years old
50 + years old
Number Successful < 20 years old
20 to 24 years old
25 to 49 years old
50 + years old
Number Retained < 20 years old
20 to 24 years old
25 to 49 years old
50 + years old
See Addendum A for definitions.Source: CCCCD Colleague. Run date 8/12/2013. JD
45

Los Medanos College
Level 4 Accreditation Tables ‐ Aggregated by Course Type, Demographic Group and Instruction Method
GENERAL ED. RACE/ETHNICITY Instr. Method 2007FA 2008FA 2009FA 2010FA 2011FA 2012FATraditional 55% 54% 55% 56% 63% 61%Online 41% 39% 44% 40% 44% 42%Traditional 71% 75% 75% 75% 76% 80%Online 57% 66% 62% 75% 57% 66%Traditional 67% 69% 69% 69% 73% 71%Online 55% 57% 62% 62% 59% 67%Traditional 73% 76% 75% 75% 77% 76%Online 65% 62% 68% 68% 72% 72%Traditional 68% 66% 70% 71% 72% 69%Online 59% 54% 54% 64% 56% 64%Traditional 78% 77% 76% 77% 84% 83%Online 75% 77% 69% 65% 80% 72%Traditional 83% 87% 85% 85% 88% 90%Online 78% 83% 74% 87% 79% 89%Traditional 83% 84% 83% 83% 86% 86%Online 75% 75% 81% 79% 78% 81%Traditional 85% 87% 85% 85% 87% 87%Online 82% 81% 80% 81% 85% 84%Traditional 82% 83% 83% 84% 85% 84%Online 77% 80% 78% 79% 80% 79%Traditional 2,923 3,708 3,933 3,626 3,326 3,132 Online 264 288 371 311 294 368 Traditional 2,163 2,485 2,491 2,466 2,161 2,144 Online 141 143 168 151 165 193 Traditional 5,161 5,994 6,306 6,427 6,184 6,560 Online 276 311 500 473 447 522 Traditional 6,684 7,015 7,343 7,010 6,043 5,661 Online 674 641 718 679 632 630 Traditional 1,558 1,780 3,022 3,106 2,529 2,357 Online 155 192 264 224 181 210 Traditional 1,609 2,010 2,181 2,035 2,093 1,915 Online 109 111 163 125 130 154 Traditional 1,535 1,864 1,859 1,844 1,635 1,724 Online 80 95 104 114 94 127 Traditional 3,480 4,135 4,355 4,460 4,510 4,654 Online 152 178 310 292 263 348 Traditional 4,876 5,317 5,477 5,260 4,671 4,303 Online 440 398 489 460 453 456 Traditional 1,059 1,170 2,111 2,220 1,830 1,623 Online 91 104 142 143 102 134 Traditional 2,290 2,854 2,992 2,777 2,780 2,589 Online 198 222 256 202 236 264 Traditional 1,803 2,171 2,117 2,094 1,891 1,918 Online 110 118 125 132 130 171 Traditional 4,279 5,056 5,222 5,343 5,325 5,625 Online 208 233 404 376 350 423 Traditional 5,712 6,097 6,244 5,953 5,282 4,941 Online 553 517 576 551 535 529 Traditional 1,276 1,477 2,518 2,601 2,160 1,989 Online 120 153 205 177 144 166
Retention Rate African American
Asian
Hispanic
White
Other/Undeclared
GENERAL EDUCATION COURSES BY RACE/ETHNICITY
Success Rate African American
Asian
Hispanic
White
Other/Undeclared
Number Successful African American
Asian
Hispanic
White
Other/Undeclared
Number of Course Enrollments
African American
Asian
Hispanic
White
Other/Undeclared
Number Retained African American
Asian
Hispanic
White
Other/Undeclared
See Addendum A for definitions.Source: CCCCD Colleague. Run date 8/12/2013. JD
46
MEASURESBYPLACEOFRESIDENCY
Information in this section:
Number of Students by Top 20 Cities in Service Area
Percentage of Students Receiving Financial Aid by Top 20 Cities in Service Area
College Success Rate by Top 20 Cities in Service Area
College Retention Rate by Top 20 Cities in Service Area
College Fall‐to‐Spring Persistence Rate by Top 20 Cities in Service Area
College Fall‐to‐Fall Persistence Rate by Top 20 Cities in Service Area
Number of Course Enrollments by Top 20 Cities in Service Area
Number of Successful Course Completions by Top 20 Cities in Service Area
Number of Course Completions by Top 20 Cities in Service Area
47

CITY (LMC) TERM2007FA 2008FA 2009FA 2010FA 2011FA 2012FAAntioch Number of Students (Head Count)Percent Receiving FinAidSuccess RateRetention RateFall-to-Spring Persistence RateFall-to-Fall Persistence RateNumber of Course EnrollmentsNumber SuccessfulNumber RetainedPittsburg Number of Students (Head Count)Percent Receiving FinAidSuccess RateRetention RateFall-to-Spring Persistence RateFall-to-Fall Persistence RateNumber of Course EnrollmentsNumber SuccessfulNumber RetainedBrentwood Number of Students (Head Count)Percent Receiving FinAidSuccess RateRetention RateFall-to-Spring Persistence RateFall-to-Fall Persistence RateNumber of Course EnrollmentsNumber SuccessfulNumber RetainedOakley Number of Students (Head Count)Percent Receiving FinAidSuccess RateRetention RateFall-to-Spring Persistence RateFall-to-Fall Persistence RateNumber of Course EnrollmentsNumber SuccessfulNumber RetainedConcord Number of Students (Head Count)Percent Receiving FinAidSuccess RateRetention RateFall-to-Spring Persistence RateFall-to-Fall Persistence RateNumber of Course EnrollmentsNumber Successful
7,3475,9818,7160%70%84%69%58%3,145
7,3436,0688,63452%70%85%70%55%3,225
8,0326,6319,77450%72%82%68%51%3,474
8,0736,5979,89850%67%82%67%46%3,670
7,4966,0038,92250%67%84%67%39%3,295
6,0474,7547,43846%63%81%64%32%2,810
3,7242,9634,4160%69%84%67%63%1,625
3,8673,1034,58852%72%84%68%62%1,715
3,8473,0904,80049%68%80%64%56%1,842
4,0513,2495,00749%67%81%65%52%1,928
3,9153,0604,70148%65%83%65%47%1,791
3,3112,5954,02248%64%82%65%41%1,585
3,2602,7983,7450%71%87%75%44%1,364
3,1412,6893,64052%71%86%74%43%1,386
3,3102,7983,92549%69%84%71%36%1,424
3,5002,9284,14348%68%84%71%31%1,573
3,0672,4983,63049%66%84%69%25%1,412
2,6782,1883,20745%62%84%68%21%1,280
2,4182,0312,8600%71%85%71%50%1,077
2,5622,2072,95151%71%87%75%46%1,134
2,7962,4213,34352%72%84%72%43%1,212
3,0252,5853,54851%69%85%73%37%1,318
2,5202,1322,98353%67%84%71%30%1,154
2,1951,8362,57649%67%85%71%26%998
7780%67%85%71%46%335
89347%69%86%73%46%394
1,01247%69%82%69%42%448
1,17246%67%87%75%34%528
1,17746%70%86%75%27%540
1,21845%63%85%70%25%557
Los Medanos CollegeMeasures by Place of Residence
48
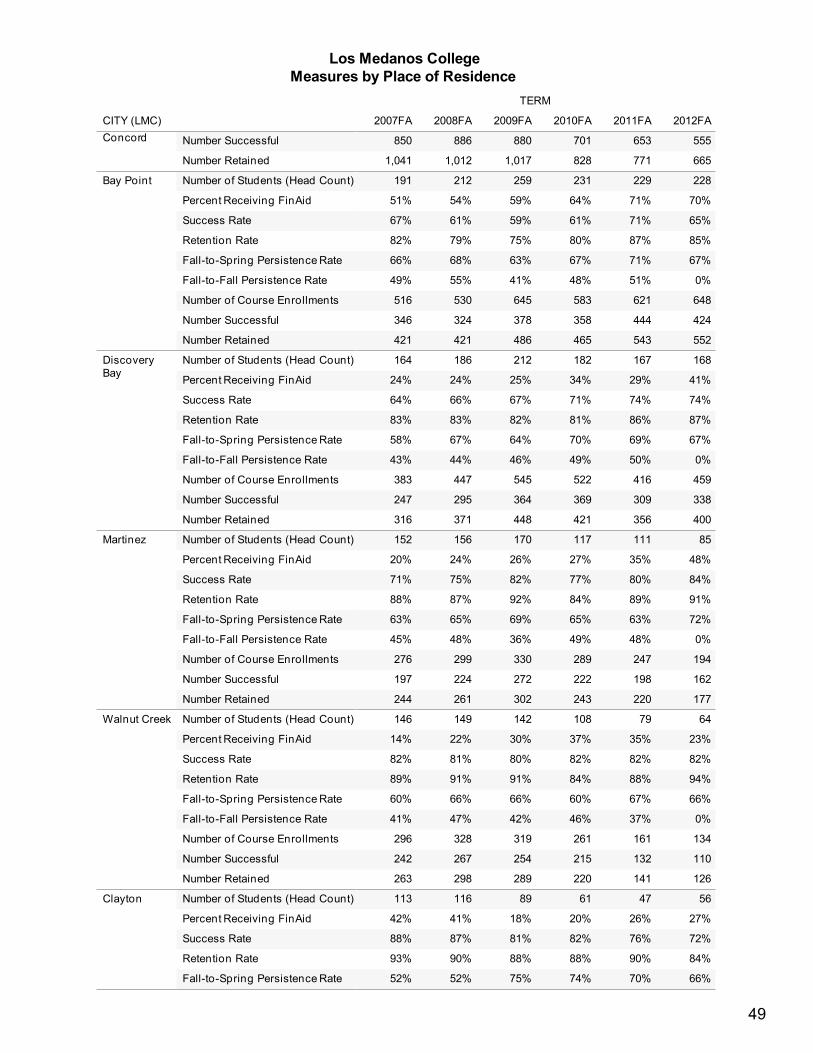
CITY (LMC) TERM2007FA 2008FA 2009FA 2010FA 2011FA 2012FAConcord Number of Course EnrollmentsNumber SuccessfulNumber RetainedBay Point Number of Students (Head Count)Percent Receiving FinAidSuccess RateRetention RateFall-to-Spring Persistence RateFall-to-Fall Persistence RateNumber of Course EnrollmentsNumber SuccessfulNumber RetainedDiscovery Bay Number of Students (Head Count)Percent Receiving FinAidSuccess RateRetention RateFall-to-Spring Persistence RateFall-to-Fall Persistence RateNumber of Course EnrollmentsNumber SuccessfulNumber RetainedMartinez Number of Students (Head Count)Percent Receiving FinAidSuccess RateRetention RateFall-to-Spring Persistence RateFall-to-Fall Persistence RateNumber of Course EnrollmentsNumber SuccessfulNumber RetainedWalnut Creek Number of Students (Head Count)Percent Receiving FinAidSuccess RateRetention RateFall-to-Spring Persistence RateFall-to-Fall Persistence RateNumber of Course EnrollmentsNumber SuccessfulNumber RetainedClayton Number of Students (Head Count)Percent Receiving FinAidSuccess RateRetention RateFall-to-Spring Persistence RateFall-to-Fall Persistence Rate
6655557716538287011,0178801,0128861,041850
5524246480%67%85%65%70%228
54344462151%71%87%71%71%229
46535858348%67%80%61%64%231
48637864541%63%75%59%59%259
42132453055%68%79%61%54%212
42134651649%66%82%67%51%191
4003384590%67%87%74%41%168
35630941650%69%86%74%29%167
42136952249%70%81%71%34%182
44836454546%64%82%67%25%212
37129544744%67%83%66%24%186
31624738343%58%83%64%24%164
1771621940%72%91%84%48%85
22019824748%63%89%80%35%111
24322228949%65%84%77%27%117
30227233036%69%92%82%26%170
26122429948%65%87%75%24%156
24419727645%63%88%71%20%152
1261101340%66%94%82%23%64
14113216137%67%88%82%35%79
22021526146%60%84%82%37%108
28925431942%66%91%80%30%142
29826732847%66%91%81%22%149
26324229641%60%89%82%14%146
66%84%72%27%56
70%90%76%26%47
74%88%82%20%61
75%88%81%18%89
52%90%87%41%116
52%93%88%42%113
Los Medanos CollegeMeasures by Place of Residence
49
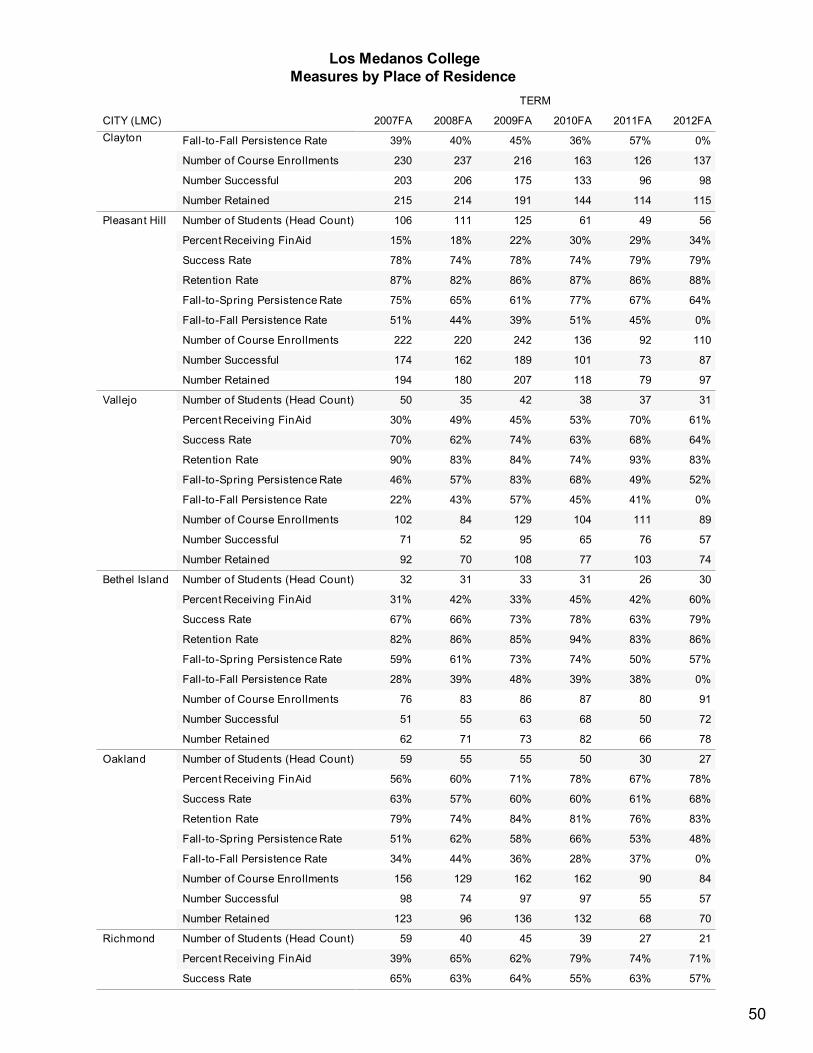
CITY (LMC) TERM2007FA 2008FA 2009FA 2010FA 2011FA 2012FAClayton Fall-to-Spring Persistence RateFall-to-Fall Persistence RateNumber of Course EnrollmentsNumber SuccessfulNumber RetainedPleasant Hill Number of Students (Head Count)Percent Receiving FinAidSuccess RateRetention RateFall-to-Spring Persistence RateFall-to-Fall Persistence RateNumber of Course EnrollmentsNumber SuccessfulNumber RetainedVallejo Number of Students (Head Count)Percent Receiving FinAidSuccess RateRetention RateFall-to-Spring Persistence RateFall-to-Fall Persistence RateNumber of Course EnrollmentsNumber SuccessfulNumber RetainedBethel Island Number of Students (Head Count)Percent Receiving FinAidSuccess RateRetention RateFall-to-Spring Persistence RateFall-to-Fall Persistence RateNumber of Course EnrollmentsNumber SuccessfulNumber RetainedOakland Number of Students (Head Count)Percent Receiving FinAidSuccess RateRetention RateFall-to-Spring Persistence RateFall-to-Fall Persistence RateNumber of Course EnrollmentsNumber SuccessfulNumber RetainedRichmond Number of Students (Head Count)Percent Receiving FinAidSuccess RateRetention Rate
115981370%
1149612657%
14413316336%
19117521645%
21420623740%
21520323039%
97871100%64%88%79%34%56
79739245%67%86%79%29%49
11810113651%77%87%74%30%61
20718924239%61%86%78%22%125
18016222044%65%82%74%18%111
19417422251%75%87%78%15%106
7457890%52%83%64%61%31
1037611141%49%93%68%70%37
776510445%68%74%63%53%38
1089512957%83%84%74%45%42
70528443%57%83%62%49%35
927110222%46%90%70%30%50
7872910%57%86%79%60%30
66508038%50%83%63%42%26
82688739%74%94%78%45%31
73638648%73%85%73%33%33
71558339%61%86%66%42%31
62517628%59%82%67%31%32
7057840%48%83%68%78%27
68559037%53%76%61%67%30
1329716228%66%81%60%78%50
1369716236%58%84%60%71%55
967412944%62%74%57%60%55
1239815634%51%79%63%56%59
57%71%21
63%74%27
55%79%39
64%62%45
63%65%40
65%39%59
Los Medanos CollegeMeasures by Place of Residence
50

CITY (LMC) TERM2007FA 2008FA 2009FA 2010FA 2011FA 2012FARichmond Success RateRetention RateFall-to-Spring Persistence RateFall-to-Fall Persistence RateNumber of Course EnrollmentsNumber SuccessfulNumber RetainedDanville Number of Students (Head Count)Percent Receiving FinAidSuccess RateRetention RateFall-to-Spring Persistence RateFall-to-Fall Persistence RateNumber of Course EnrollmentsNumber SuccessfulNumber RetainedFairfield Number of Students (Head Count)Percent Receiving FinAidSuccess RateRetention RateFall-to-Spring Persistence RateFall-to-Fall Persistence RateNumber of Course EnrollmentsNumber SuccessfulNumber RetainedByron Number of Students (Head Count)Percent Receiving FinAidSuccess RateRetention RateFall-to-Spring Persistence RateFall-to-Fall Persistence RateNumber of Course EnrollmentsNumber SuccessfulNumber RetainedStockton Number of Students (Head Count)Percent Receiving FinAidSuccess RateRetention RateFall-to-Spring Persistence RateFall-to-Fall Persistence RateNumber of Course EnrollmentsNumber SuccessfulNumber RetainedEl Sobrante Number of Students (Head Count)Percent Receiving FinAid
4129510%57%80%
55447041%63%79%
785810636%59%74%
876910840%60%81%
966911033%55%87%
1048112432%51%84%
2928290%45%100%97%30%20
18172042%75%90%85%8%12
33334061%72%83%83%11%18
67607817%60%86%77%14%35
43405020%50%86%80%20%30
85808840%58%97%91%10%50
5140600%50%85%67%50%20
30184244%44%71%43%44%18
24183143%64%77%58%50%14
41365622%56%73%64%19%27
25192738%85%93%70%31%13
29253127%40%94%81%7%15
4438520%68%85%73%58%19
43385242%58%83%73%50%24
48406045%68%80%67%36%22
54506652%61%82%76%35%31
48435940%50%81%73%33%30
998111631%53%85%70%16%51
4537560%63%80%66%58%19
37304350%63%86%70%63%16
43295350%63%81%55%69%16
27233747%59%73%62%47%17
52486032%59%87%80%36%22
29253155%55%94%81%73%11
161515191616
Los Medanos CollegeMeasures by Place of Residence
51
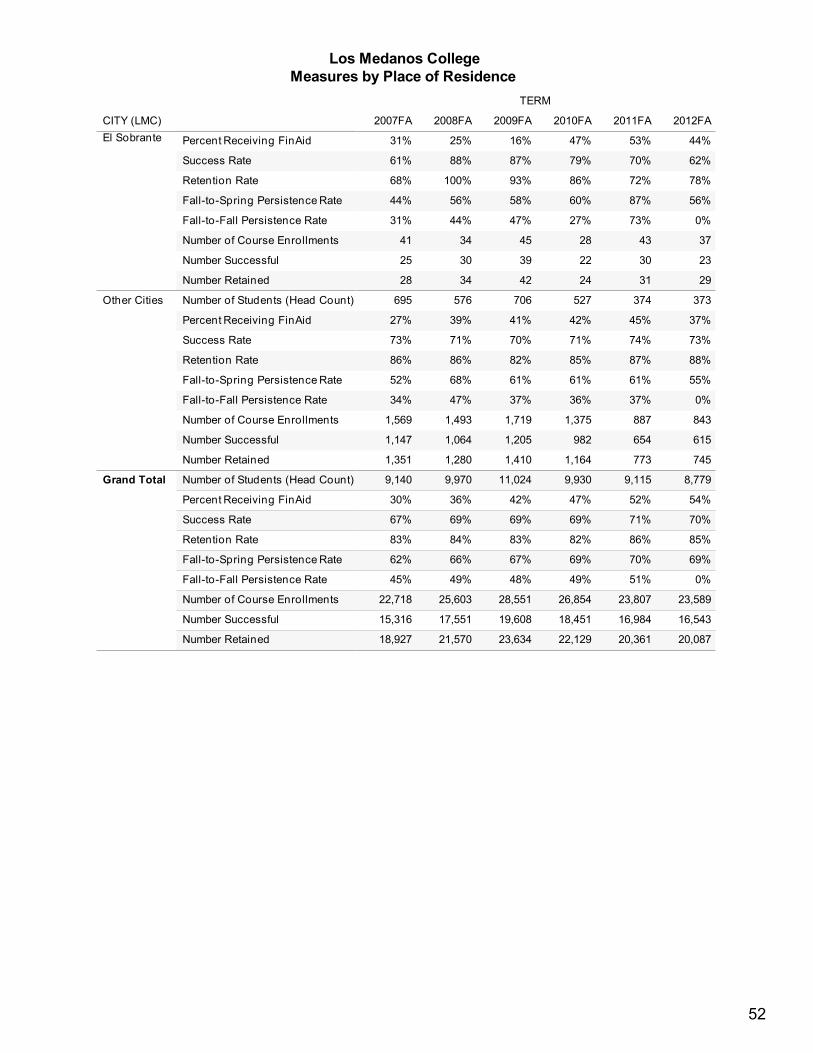
CITY (LMC) TERM2007FA 2008FA 2009FA 2010FA 2011FA 2012FAEl Sobrante Number of Students (Head Count)Percent Receiving FinAidSuccess RateRetention RateFall-to-Spring Persistence RateFall-to-Fall Persistence RateNumber of Course EnrollmentsNumber SuccessfulNumber RetainedOther Cities Number of Students (Head Count)Percent Receiving FinAidSuccess RateRetention RateFall-to-Spring Persistence RateFall-to-Fall Persistence RateNumber of Course EnrollmentsNumber SuccessfulNumber RetainedGrand Total Number of Students (Head Count)Percent Receiving FinAidSuccess RateRetention RateFall-to-Spring Persistence RateFall-to-Fall Persistence RateNumber of Course EnrollmentsNumber SuccessfulNumber Retained
2923370%56%78%62%44%
31304373%87%72%70%53%
24222827%60%86%79%47%
42394547%58%93%87%16%
34303444%56%100%88%25%
28254131%44%68%61%31%
7456158430%55%88%73%37%373
77365488737%61%87%74%45%374
1,1649821,37536%61%85%71%42%527
1,4101,2051,71937%61%82%70%41%706
1,2801,0641,49347%68%86%71%39%576
1,3511,1471,56934%52%86%73%27%695
20,08716,54323,5890%69%85%70%54%8,779
20,36116,98423,80751%70%86%71%52%9,115
22,12918,45126,85449%69%82%69%47%9,930
23,63419,60828,55148%67%83%69%42%11,024
21,57017,55125,60349%66%84%69%36%9,970
18,92715,31622,71845%62%83%67%30%9,140
Los Medanos CollegeMeasures by Place of Residence
52
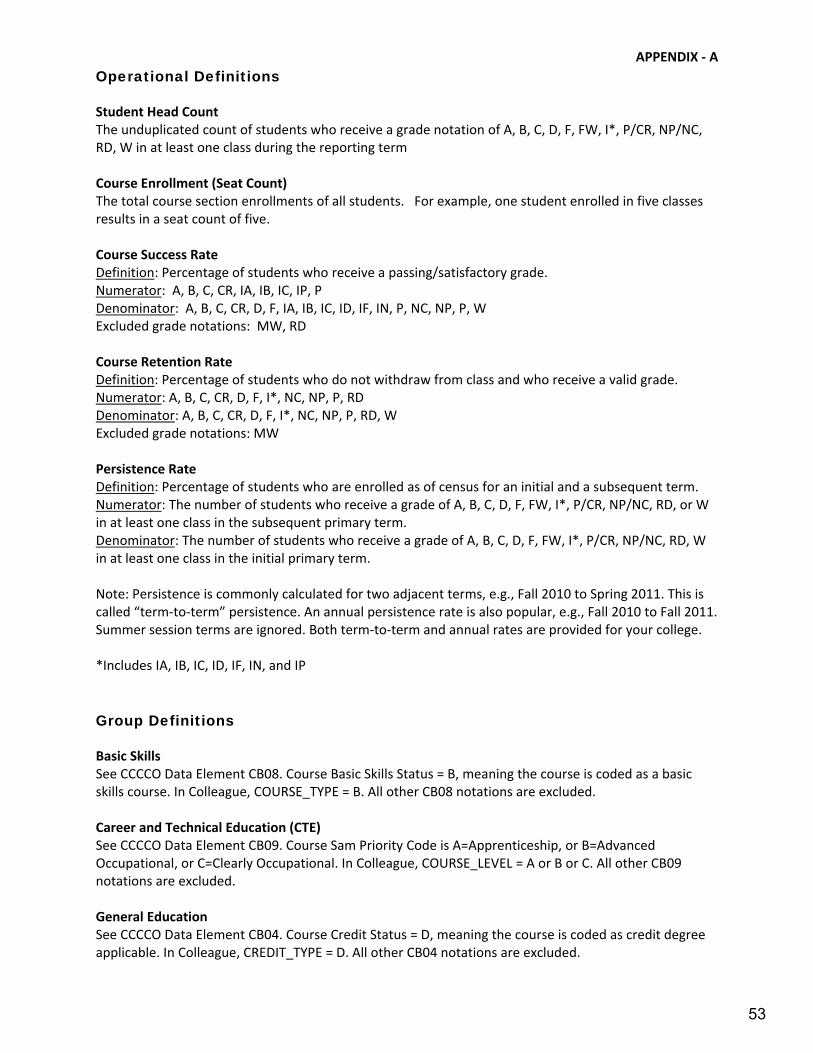
APPENDIX ‐ A
Operational Definitions
Student Head Count The unduplicated count of students who receive a grade notation of A, B, C, D, F, FW, I*, P/CR, NP/NC, RD, W in at least one class during the reporting term Course Enrollment (Seat Count) The total course section enrollments of all students. For example, one student enrolled in five classes results in a seat count of five. Course Success Rate Definition: Percentage of students who receive a passing/satisfactory grade. Numerator: A, B, C, CR, IA, IB, IC, IP, P Denominator: A, B, C, CR, D, F, IA, IB, IC, ID, IF, IN, P, NC, NP, P, W Excluded grade notations: MW, RD Course Retention Rate Definition: Percentage of students who do not withdraw from class and who receive a valid grade. Numerator: A, B, C, CR, D, F, I*, NC, NP, P, RD Denominator: A, B, C, CR, D, F, I*, NC, NP, P, RD, W Excluded grade notations: MW Persistence Rate Definition: Percentage of students who are enrolled as of census for an initial and a subsequent term. Numerator: The number of students who receive a grade of A, B, C, D, F, FW, I*, P/CR, NP/NC, RD, or W in at least one class in the subsequent primary term. Denominator: The number of students who receive a grade of A, B, C, D, F, FW, I*, P/CR, NP/NC, RD, W in at least one class in the initial primary term. Note: Persistence is commonly calculated for two adjacent terms, e.g., Fall 2010 to Spring 2011. This is called “term‐to‐term” persistence. An annual persistence rate is also popular, e.g., Fall 2010 to Fall 2011. Summer session terms are ignored. Both term‐to‐term and annual rates are provided for your college. *Includes IA, IB, IC, ID, IF, IN, and IP
Group Definitions
Basic Skills See CCCCO Data Element CB08. Course Basic Skills Status = B, meaning the course is coded as a basic skills course. In Colleague, COURSE_TYPE = B. All other CB08 notations are excluded. Career and Technical Education (CTE) See CCCCO Data Element CB09. Course Sam Priority Code is A=Apprenticeship, or B=Advanced Occupational, or C=Clearly Occupational. In Colleague, COURSE_LEVEL = A or B or C. All other CB09 notations are excluded. General Education See CCCCO Data Element CB04. Course Credit Status = D, meaning the course is coded as credit degree applicable. In Colleague, CREDIT_TYPE = D. All other CB04 notations are excluded.
53
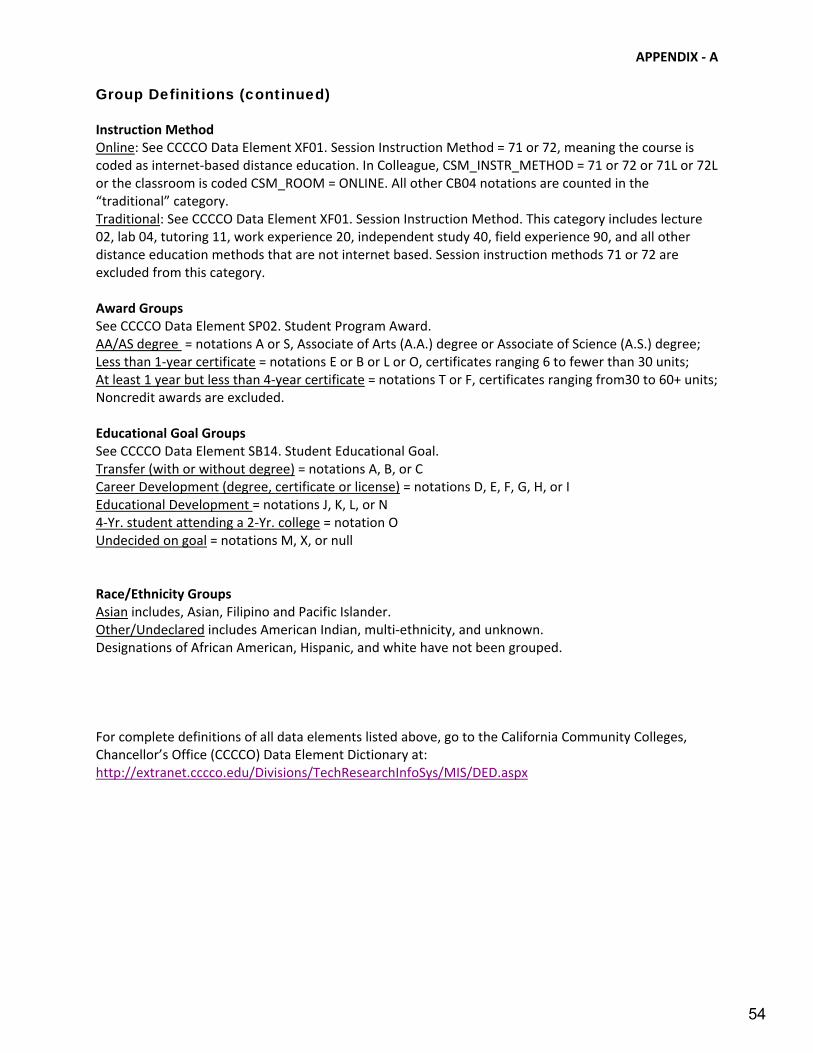
APPENDIX ‐ A
Group Definitions (continued)
Instruction Method Online: See CCCCO Data Element XF01. Session Instruction Method = 71 or 72, meaning the course is coded as internet‐based distance education. In Colleague, CSM_INSTR_METHOD = 71 or 72 or 71L or 72L or the classroom is coded CSM_ROOM = ONLINE. All other CB04 notations are counted in the “traditional” category. Traditional: See CCCCO Data Element XF01. Session Instruction Method. This category includes lecture 02, lab 04, tutoring 11, work experience 20, independent study 40, field experience 90, and all other distance education methods that are not internet based. Session instruction methods 71 or 72 are excluded from this category. Award Groups See CCCCO Data Element SP02. Student Program Award. AA/AS degree = notations A or S, Associate of Arts (A.A.) degree or Associate of Science (A.S.) degree; Less than 1‐year certificate = notations E or B or L or O, certificates ranging 6 to fewer than 30 units; At least 1 year but less than 4‐year certificate = notations T or F, certificates ranging from30 to 60+ units; Noncredit awards are excluded. Educational Goal Groups See CCCCO Data Element SB14. Student Educational Goal. Transfer (with or without degree) = notations A, B, or C Career Development (degree, certificate or license) = notations D, E, F, G, H, or I Educational Development = notations J, K, L, or N 4‐Yr. student attending a 2‐Yr. college = notation O Undecided on goal = notations M, X, or null Race/Ethnicity Groups Asian includes, Asian, Filipino and Pacific Islander. Other/Undeclared includes American Indian, multi‐ethnicity, and unknown. Designations of African American, Hispanic, and white have not been grouped. For complete definitions of all data elements listed above, go to the California Community Colleges, Chancellor’s Office (CCCCO) Data Element Dictionary at: http://extranet.cccco.edu/Divisions/TechResearchInfoSys/MIS/DED.aspx
54